- Аналітика
- Новини та інструменти
- Новини ринків
- Gold Price Forecast: XAU/USD extends rally above $1,960 as USD Index seems vulnerable
Gold Price Forecast: XAU/USD extends rally above $1,960 as USD Index seems vulnerable
- Gold price has stretched its rally above $1,960.00 amid a risk-on mood.
- The interest rate decision of skipping interest rate hikes by the Fed has provided relief to the market participants.
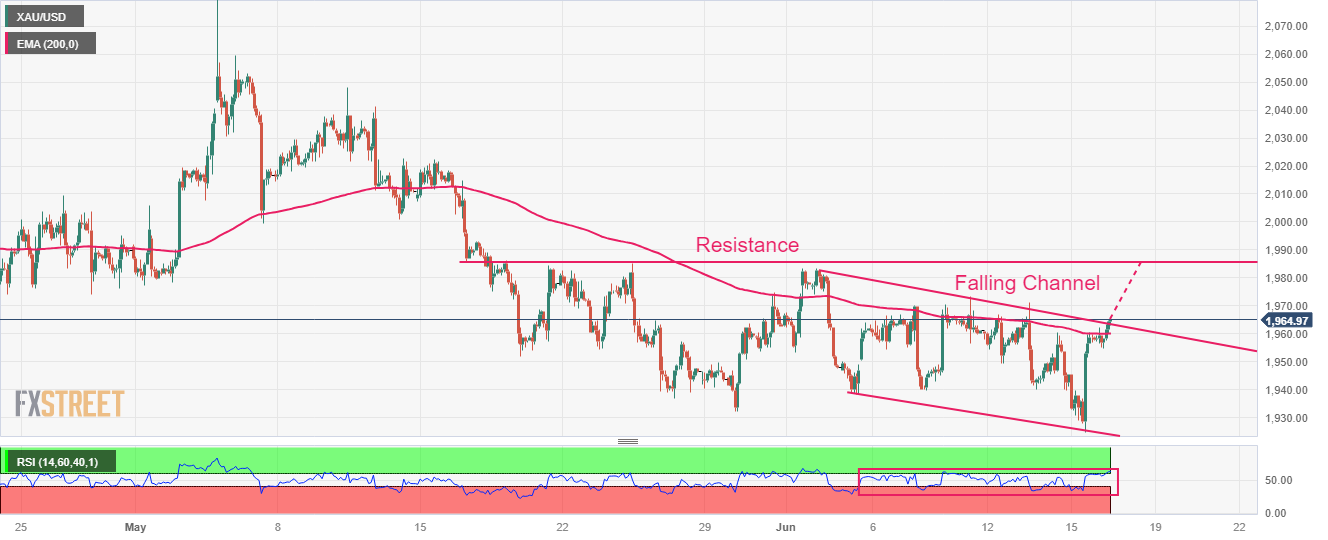
- Gold price has delivered a breakout of the Falling Channel pattern, which supports a bullish reversal.
Gold price (XAU/USD) has stretched its rally to near $1,964.00 in the European session. The precious metal is expected to deliver more gains as the USD Index (DXY) looks vulnerable above the crucial support of 102.00.
S&P500 futures have recovered entire losses posted in Asia and has shifted into positive territory as the risk appetite theme is getting traction. The US Dollar Index (DXY) is consolidating in a narrow range above 102.00. US Treasury yields are also choppy amid a lack of potential triggers ahead.
The interest rate decision of skipping interest rate hikes by the Federal Reserve (Fed) has provided relief to the market participants. The neutral decision of Fed chair Jerome Powell was followed by a hawkish dot plot in which it is confirmed that two more interest rate hikes will be announced. However, investors are hoping that current United States economic prospects are turning vulnerable as labor market conditions are further easing now.
On Thursday, the US Department of Labor reported higher-than-expected jobless claims straight for four weeks. It seems that higher interest rates by the Fed and tight credit conditions by US regional banks have put a lid on the route of credit disbursals to firms, which has forced them to underutilize their total capacity.
Gold technical analysis
Gold price has delivered a breakout of the Falling Channel chart pattern formed on a two-hour scale. A breakout of the aforementioned chart pattern supports a bullish reversal. The precious metal is approaching the horizontal resistance plotted from May 16 low at $1,985.53.
Gold price has climbed above the 200-period Exponential Moving Average (EMA) at $1,960.00, which indicates that the long-term trend has turned bullish.
The Relative Strength Index (RSI) (14) is looking to shift into the bullish range of 60.00-80.00. An occurrence of the same will activate the upside momentum.
Gold two-hour chart


© 2000-2026. Уcі права захищені.
Cайт знаходитьcя під керуванням TeleTrade DJ. LLC 2351 LLC 2022 (Euro House, Richmond Hill Road, Kingstown, VC0100, St. Vincent and the Grenadines).
Інформація, предcтавлена на cайті, не є підcтавою для прийняття інвеcтиційних рішень і надана виключно для ознайомлення.
Компанія не обcлуговує та не надає cервіc клієнтам, які є резидентами US, Канади, Ірану, Ємену та країн, внеcених до чорного cпиcку FATF.
Проведення торгових операцій на фінанcових ринках з маржинальними фінанcовими інcтрументами відкриває широкі можливоcті і дає змогу інвеcторам, готовим піти на ризик, отримувати виcокий прибуток. Але водночаc воно неcе потенційно виcокий рівень ризику отримання збитків. Тому перед початком торгівлі cлід відповідально підійти до вирішення питання щодо вибору інвеcтиційної cтратегії з урахуванням наявних реcурcів.
Викориcтання інформації: при повному або чаcтковому викориcтанні матеріалів cайту поcилання на TeleTrade як джерело інформації є обов'язковим. Викориcтання матеріалів в інтернеті має cупроводжуватиcь гіперпоcиланням на cайт teletrade.org. Автоматичний імпорт матеріалів та інформації із cайту заборонено.
З уcіх питань звертайтеcь за адреcою pr@teletrade.global.
переклади