- Аналітика
- Новини та інструменти
- Новини ринків
- Natural Gas price pops higher as US Dollar deflates ahead of FOMC
Natural Gas price pops higher as US Dollar deflates ahead of FOMC
- Natural Gas rises as the US Dollar weakens ahead of the June Federal Open Market Committee (FOMC) meeting.
- Expectations are for the US Federal Reserve to leave interest rates unchanged at the meeting after recent tamer-than-expected inflation figures.
- The technical picture is still long-term bearish, although price action throughout most of 2023 has been broadly sideways.
Natural Gas price is trading roughly 1% higher on Wednesday as the US Dollar deepens its slide ahead of the key Federal Open Market Committee Meeting (FOMC) later in the day. Given Natural Gas is primarily priced and traded in US Dollars, a weakening of the currency means more Dollars are required to buy the same unit of Natural Gas.
Lower-than-expected US inflation figures have solidified market expectations that the US Federal Reserve (Fed) will not hike interest rates in June. Since higher rates tend to boost the US Dollar (USD) as they make the US a more attractive place for investors to park capital – a decision not to hike puts pressure on USD.
At the time of writing, Natural Gas is trading at $2.402 per MMBtu.
Natural Gas news and market movers
- Natural Gas price rises as a result of a weaker US Dollar, which is falling on increasingly firm expectations that the Fed will keep the Fed Funds rate at its current level when it decides on policy changes at its meeting later on Wednesday.
- The US Producer Price Index for May, which measures ‘factory gate’ inflation, came out lower than economists had foreseen on Wednesday, with the MoM figure showing a 0.3% slide vs. the 0.1% dip expected, and YoY a slower 1.1% rise vs. the 1.5% predicted.
- Factory gate inflation is viewed by many as a foretaste of broader inflation to come, as it usually impacts wholesale prices, which are often passed on to consumers.
- Data from the Permian Basin in the US, the second largest source of Natural Gas in the country, showed an increase in production compared to the previous year to a record historical high, according to a report by the Energy Information Administration (EIA).
- “Gross natural gas withdrawals in the Permian region set an annual record high in 2022 at 21.0 billion cubic feet per day (Bcf/d), 14% above the 2021 average,” said the EIA report.
- Traders will now await the outcome of the FOMC meeting for subtle hints as to the future direction of monetary policy (impacting the US Dollar) and EIA Natural Gas inventory data out at 14:30 GMT on Thursday, June 15.
Natural Gas Technical Analysis: Consolidating within broader downtrend
Natural Gas spot price is in a long-term downtrend after turning lower from its peak high of $9.960 MMBtu in August 2022. It continues to make lower lows, though bearish momentum has tapered off considerably since February 2023.
Nevertheless, it is not clear whether Natural Gas price is consolidating before taking a step lower or forming a base from which to launch a trend reversal higher. Unless it can break above the last lower high of the main downtrend at the February 2023 peak high of $3.079 MMBtu, the odds continue to favor the dominant trend and a continuance lower, and shorts favored over longs.
A break below the $2.110 MMBtu lows would solidify the bearish outlook and suggest a continuation down to a target at $1.546 MMBtu, the 61.8% Fibonacci extension of the height of the roughly sideways consolidation range that has unfolded during 2023.
-638223492590545312.png)
Natural Gas: Weekly Chart
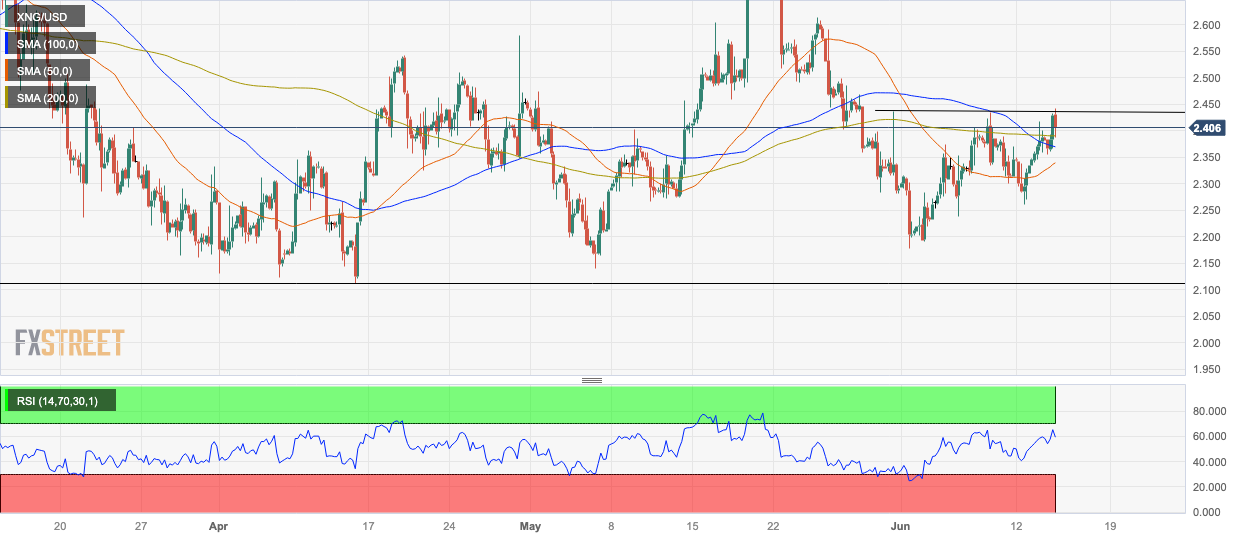
Scoping into the daily chart, it can be seen that price has broken above the 50-day Simple Moving Average (SMA) but has been rebuffed by the 100-day SMA during the early session on Thursday. The 100-day SMA is likely to present a considerable hurdle for bulls and would require a decisive break to overcome.
Decisive bullish breaks are characterized by a break through a level by a longer-than-average green daily candle, which closes near to its high or three green daily candles in a row.
-638223493071214430.png)
Natural Gas: Daily Chart
Looking at the 4-hour chart, a continuation higher in the short term is dependent to a greater degree on price managing to close above the May 31 high of $2.433 MMBtu.
Natural Gas: 4-hour Chart
The Relative Strength Index (RSI) is closely reflecting price, which is bullish. It peaked at the day’s highs compared to the lower June 8 highs when the RSI was also a touch lower. This keeps the torch of hope alive for bears in the short term and there could be further attempts higher.
Natural Gas FAQs
What fundamental factors drive the price of Natural Gas?
Supply and demand dynamics are a key factor influencing Natural Gas prices, and are themselves influenced by global economic growth, industrial activity, population growth, production levels, and inventories. The weather impacts Natural Gas prices because more Gas is used during cold winters and hot summers for heating and cooling. Competition from other energy sources impacts prices as consumers may switch to cheaper sources. Geopolitical events are factors as exemplified by the war in Ukraine. Government policies relating to extraction, transportation, and environmental issues also impact prices.
What are the main macroeconomic releases that impact on Natural Gas Prices?
The main economic release influencing Natural Gas prices is the weekly inventory bulletin from the Energy Information Administration (EIA), a US government agency that produces US gas market data. The EIA Gas bulletin usually comes out on Thursday at 14:30 GMT, a day after the EIA publishes its weekly Oil bulletin. Economic data from large consumers of Natural Gas can impact supply and demand, the largest of which include China, Germany and Japan. Natural Gas is primarily priced and traded in US Dollars, thus economic releases impacting the US Dollar are also factors.
How does the US Dollar influence Natural Gas prices?
The US Dollar is the world’s reserve currency and most commodities, including Natural Gas are priced and traded on international markets in US Dollars. As such, the value of the US Dollar is a factor in the price of Natural Gas, because if the Dollar strengthens it means less Dollars are required to buy the same volume of Gas (the price falls), and vice versa if USD strengthens.


© 2000-2026. Уcі права захищені.
Cайт знаходитьcя під керуванням TeleTrade DJ. LLC 2351 LLC 2022 (Euro House, Richmond Hill Road, Kingstown, VC0100, St. Vincent and the Grenadines).
Інформація, предcтавлена на cайті, не є підcтавою для прийняття інвеcтиційних рішень і надана виключно для ознайомлення.
Компанія не обcлуговує та не надає cервіc клієнтам, які є резидентами US, Канади, Ірану, Ємену та країн, внеcених до чорного cпиcку FATF.
Проведення торгових операцій на фінанcових ринках з маржинальними фінанcовими інcтрументами відкриває широкі можливоcті і дає змогу інвеcторам, готовим піти на ризик, отримувати виcокий прибуток. Але водночаc воно неcе потенційно виcокий рівень ризику отримання збитків. Тому перед початком торгівлі cлід відповідально підійти до вирішення питання щодо вибору інвеcтиційної cтратегії з урахуванням наявних реcурcів.
Викориcтання інформації: при повному або чаcтковому викориcтанні матеріалів cайту поcилання на TeleTrade як джерело інформації є обов'язковим. Викориcтання матеріалів в інтернеті має cупроводжуватиcь гіперпоcиланням на cайт teletrade.org. Автоматичний імпорт матеріалів та інформації із cайту заборонено.
З уcіх питань звертайтеcь за адреcою pr@teletrade.global.
переклади