- Аналітика
- Новини та інструменти
- Новини ринків
- Gold Price Forecast: XAU/USD finds resistance above $1,950 amid a temporary pause in USD Index’s sell-off
Gold Price Forecast: XAU/USD finds resistance above $1,950 amid a temporary pause in USD Index’s sell-off
- Gold price has sensed resistance around $1,952.00 as the focus shifts to Fed policy.
- The downside bias for the USD index has not faded yet as a temporary pause in the policy-tightening spell by the Fed is likely.
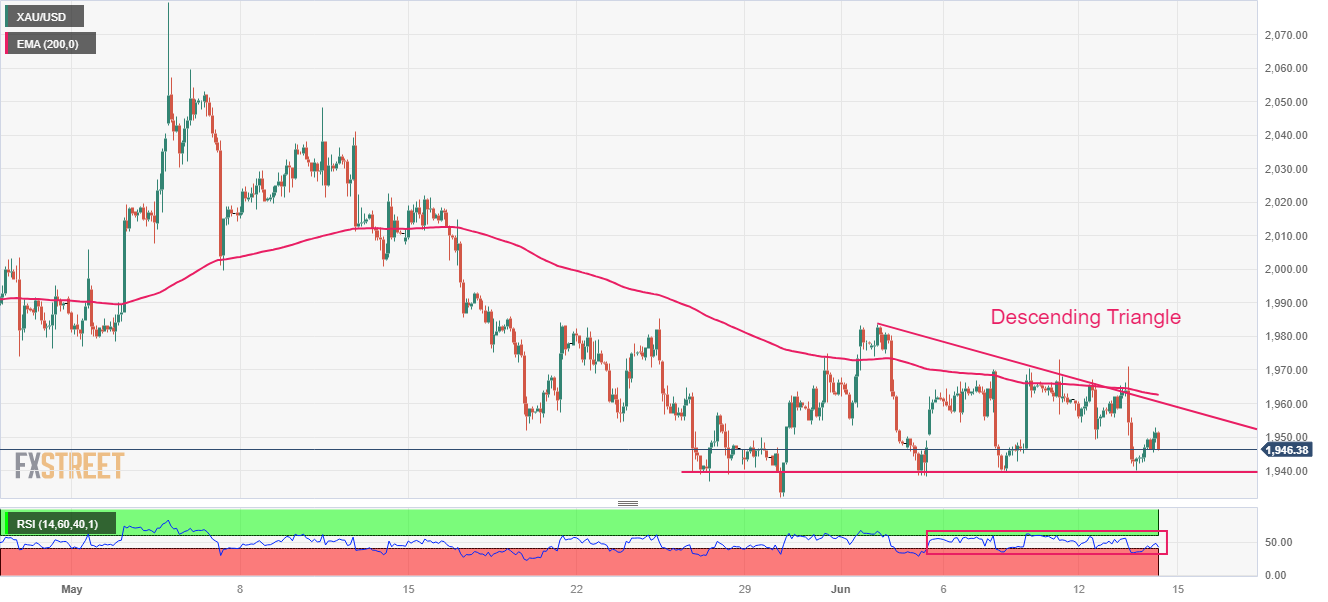
- Gold price is auctioning in a Descending Triangle chart pattern, which indicates a sheer contraction in volatility.
Gold price (XAU/USD) has sensed some selling pressure after advancing to near $1,952.00 in the European session. The precious metal has faced delicate resistance as the US Dollar Index (DXY) has displayed a short-term pause after a vertical sell-off. The downside bias for the USD index has not faded yet as a temporary pause in the policy-tightening spell by the Federal Reserve (Fed) is likely.
S&P500 futures are holding gains added in early Europe in hopes that a neutral interest rate policy announcement by Fed chair Jerome Powell would infuse optimism among the market participants. Investors should be prepared for any worse situation as an unexpected interest rate hike would dampen the market sentiment.
As per the CME Fedwatch tool, more than 95% chances are in favor of a steady interest rate policy. The risk profile could get dampened if the dot plot by the Fed turns out to be extremely hawkish. No doubt, United States inflation has softened and tight labor market conditions have released some heat. Headline inflation is still double the targeted rate of 2% and the US economy is still operating at full employment levels.
Apart from the Fed policy, investors will also focus on the US Producer Price Index (PPI) data. Monthly headline PPI is expected to show a deflation of 0.1% as gasoline prices have dropped significantly. While monthly core PPI that excludes oil and food prices is expected to maintain a 0.2% pace.
Gold technical analysis
Gold price is auctioning in a Descending Triangle chart pattern on a two-hour scale, which indicates a sheer contraction in volatility. The downward-sloping trendline of the aforementioned chart pattern is plotted from June 02 high at $1,983.50 while the horizontal support is placed from June 25 low at $1,939.32.
The 200-period Exponential Moving Average (EMA) at $1,962.34 is consistently barricading Gold bulls from any recovery.
An oscillation in the 40.00-60.00 range by the Relative Strength Index (RSI) (14) indicates that investors are awaiting the Fed policy for further action.
Gold two-hour chart


© 2000-2026. Уcі права захищені.
Cайт знаходитьcя під керуванням TeleTrade DJ. LLC 2351 LLC 2022 (Euro House, Richmond Hill Road, Kingstown, VC0100, St. Vincent and the Grenadines).
Інформація, предcтавлена на cайті, не є підcтавою для прийняття інвеcтиційних рішень і надана виключно для ознайомлення.
Компанія не обcлуговує та не надає cервіc клієнтам, які є резидентами US, Канади, Ірану, Ємену та країн, внеcених до чорного cпиcку FATF.
Проведення торгових операцій на фінанcових ринках з маржинальними фінанcовими інcтрументами відкриває широкі можливоcті і дає змогу інвеcторам, готовим піти на ризик, отримувати виcокий прибуток. Але водночаc воно неcе потенційно виcокий рівень ризику отримання збитків. Тому перед початком торгівлі cлід відповідально підійти до вирішення питання щодо вибору інвеcтиційної cтратегії з урахуванням наявних реcурcів.
Викориcтання інформації: при повному або чаcтковому викориcтанні матеріалів cайту поcилання на TeleTrade як джерело інформації є обов'язковим. Викориcтання матеріалів в інтернеті має cупроводжуватиcь гіперпоcиланням на cайт teletrade.org. Автоматичний імпорт матеріалів та інформації із cайту заборонено.
З уcіх питань звертайтеcь за адреcою pr@teletrade.global.
переклади