- Аналітика
- Новини та інструменти
- Новини ринків
- USD/INR Price Analysis: Lacks any firm direction, stuck in a range around 100-day SMA
USD/INR Price Analysis: Lacks any firm direction, stuck in a range around 100-day SMA
- USD/INR oscillates in a narrow trading band through the Asian session on Wednesday.
- Failure to find acceptance below the 100-day SMA warrants caution for bearish traders.
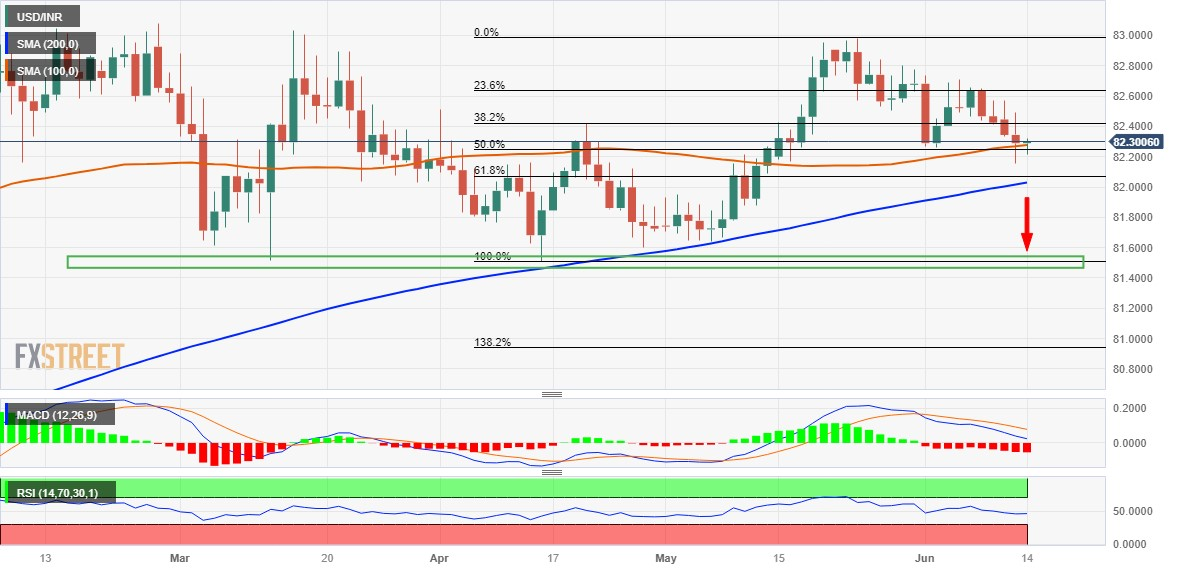
- A break below the 82.00 confluence is needed to support prospects for additional losses.
The USD/INR pair struggles to gain any meaningful traction on Wednesday and seesaws between tepid gains/minor losses through the Asian session. The pair currently trades around the 82.25-82.30 region, nearly unchanged for the day, and remains well within the striking distance of its lowest level since May 16 touched on Tuesday.
From a technical perspective, the USD/INR pair, so far, has been showing some resilience below the 100-day Simple Moving Average (SMA) and the 38.2% Fibonacci retracement level of the April-May rally. This makes it prudent to wait for some follow-through selling below the overnight swing low, around the 82.15 area, before placing fresh bearish bets. This is closely followed by the 82.00 confluence, comprising the very important 200-day SMA and the 61.8% Fibo. level.
A convincing break below the latter will mark a fresh breakdown and set the stage for an extension of the recent pullback from the vicinity of the 83.00 round figure. With oscillators on the daily chart just starting to gain negative traction, the USD/INR pair might then accelerate the downfall towards the 81.75 intermediate support en route to the March/April swing low, around 81.50 strong horizontal support.
On the flip side, the 38.2% Fibo. level, around the 82.40 region, now seems to act as an immediate hurdle. The next relevant resistance is pegged near the 82.60-82.65 zone, or the 23.6% Fibo. level, which if cleared might trigger a short-covering move. The USD/INR pair might then make a fresh attempt to conquer the 83.00 round-figure mark. Bulls might eventually aim to challenge the all-time high, around the 83.40-83.45 area touched in October 2022.
USD/INR daily chart
Key levels to watch


© 2000-2026. Уcі права захищені.
Cайт знаходитьcя під керуванням TeleTrade DJ. LLC 2351 LLC 2022 (Euro House, Richmond Hill Road, Kingstown, VC0100, St. Vincent and the Grenadines).
Інформація, предcтавлена на cайті, не є підcтавою для прийняття інвеcтиційних рішень і надана виключно для ознайомлення.
Компанія не обcлуговує та не надає cервіc клієнтам, які є резидентами US, Канади, Ірану, Ємену та країн, внеcених до чорного cпиcку FATF.
Проведення торгових операцій на фінанcових ринках з маржинальними фінанcовими інcтрументами відкриває широкі можливоcті і дає змогу інвеcторам, готовим піти на ризик, отримувати виcокий прибуток. Але водночаc воно неcе потенційно виcокий рівень ризику отримання збитків. Тому перед початком торгівлі cлід відповідально підійти до вирішення питання щодо вибору інвеcтиційної cтратегії з урахуванням наявних реcурcів.
Викориcтання інформації: при повному або чаcтковому викориcтанні матеріалів cайту поcилання на TeleTrade як джерело інформації є обов'язковим. Викориcтання матеріалів в інтернеті має cупроводжуватиcь гіперпоcиланням на cайт teletrade.org. Автоматичний імпорт матеріалів та інформації із cайту заборонено.
З уcіх питань звертайтеcь за адреcою pr@teletrade.global.
переклади