- Аналітика
- Новини та інструменти
- Новини ринків
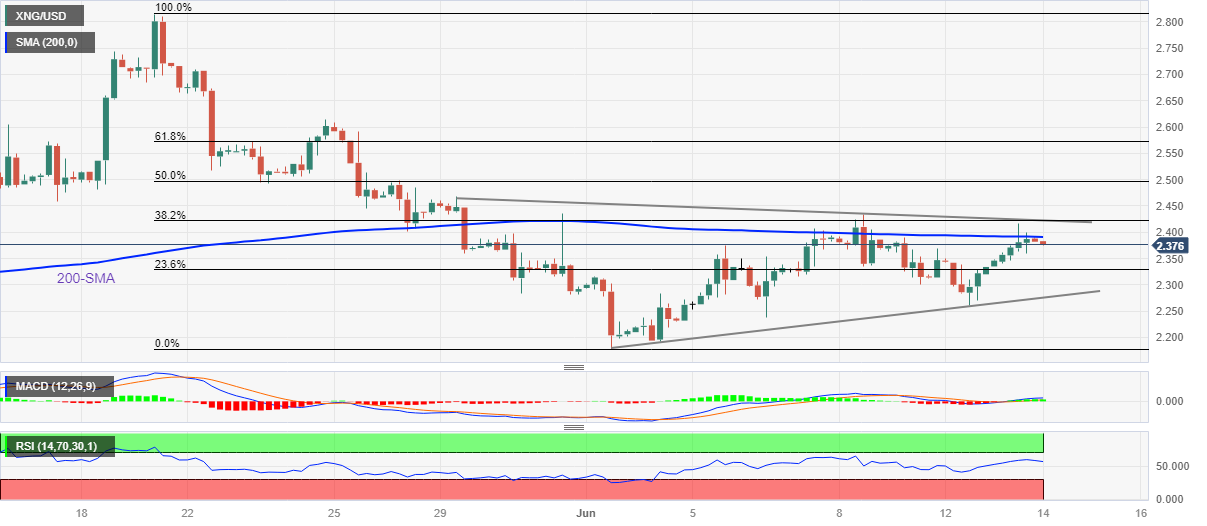
- Natural Gas Price Analysis: XNG/USD eases from 200-SMA within symmetrical triangle as Fed decision looms
Natural Gas Price Analysis: XNG/USD eases from 200-SMA within symmetrical triangle as Fed decision looms
- Natural Gas Price takes offers to refresh intraday low, prints the first daily loss in three.
- Failure to cross the key moving average joins RSI retreat, sluggish MACD to tease sellers.
- Two-week-old symmetrical triangle challenges XNG/USD bears beyond $2.27; bulls need validation from $2.42.
Natural Gas Price (XNG/USD) remains on the back foot around $2.37 as it snaps a two-day winning streak during early Wednesday. In doing so, the XNG/USD portrays the typical market consolidation ahead of the Federal Reserve’s (Fed) monetary policy announcements.
That said, the Natural Gas Price recently reversed from the 200-SMA while staying within a 12-day-long symmetrical triangle formation.
Apart from the chart pattern suggesting sideways of the energy instrument, the sluggish MACD signals and the RSI (14) line’s retreat from the above-50.0 area also challenge the XNG/USD traders.
However, the commodity’s U-turn from the key moving average suggests an intraday decline in the price. The same highlights the 23.6% Fibonacci retracement of the XNG/USD’s fall from May 19 to June 01, close to $2.33 at the latest.
Following that, the stated triangle’s bottom line of around $2.27 will be in the spotlight as a break of which could quickly drag the Natural Gas Price towards refreshing the yearly low, currently around $2.11. It should be noted that May’s bottom of near $2.17 can act as an intermediate halt during the anticipated fall.
Alternatively, XNG/USD recovery needs validation from the 200-SMA hurdle of around $2.39, closely followed by the $2.40 round figure.
Also acting as the short-term key upside barrier for the Natural Gas price is the stated triangle’s upper line, close to $2.42 at the latest, a break of which can refresh the monthly high of around $2.43 by approaching the 50.0% and 61.8% Fibonacci retracements levels, near $2.50 and $2.57 in that order.
Natural Gas Price: Four-hour chart
Trend: Limited downside expected


© 2000-2026. Уcі права захищені.
Cайт знаходитьcя під керуванням TeleTrade DJ. LLC 2351 LLC 2022 (Euro House, Richmond Hill Road, Kingstown, VC0100, St. Vincent and the Grenadines).
Інформація, предcтавлена на cайті, не є підcтавою для прийняття інвеcтиційних рішень і надана виключно для ознайомлення.
Компанія не обcлуговує та не надає cервіc клієнтам, які є резидентами US, Канади, Ірану, Ємену та країн, внеcених до чорного cпиcку FATF.
Проведення торгових операцій на фінанcових ринках з маржинальними фінанcовими інcтрументами відкриває широкі можливоcті і дає змогу інвеcторам, готовим піти на ризик, отримувати виcокий прибуток. Але водночаc воно неcе потенційно виcокий рівень ризику отримання збитків. Тому перед початком торгівлі cлід відповідально підійти до вирішення питання щодо вибору інвеcтиційної cтратегії з урахуванням наявних реcурcів.
Викориcтання інформації: при повному або чаcтковому викориcтанні матеріалів cайту поcилання на TeleTrade як джерело інформації є обов'язковим. Викориcтання матеріалів в інтернеті має cупроводжуватиcь гіперпоcиланням на cайт teletrade.org. Автоматичний імпорт матеріалів та інформації із cайту заборонено.
З уcіх питань звертайтеcь за адреcою pr@teletrade.global.
переклади