- Аналітика
- Новини та інструменти
- Новини ринків
- Gold Price Analysis: XAU/USD turns topsy-turvy above $1,960 amid mixed responses for Fed policy stance
Gold Price Analysis: XAU/USD turns topsy-turvy above $1,960 amid mixed responses for Fed policy stance
- Gold price is showing back-and-forth action above $1,960.00 as investors are mixed about Fed policy.
- Investors are worried that US CPI could turn out more persistent.
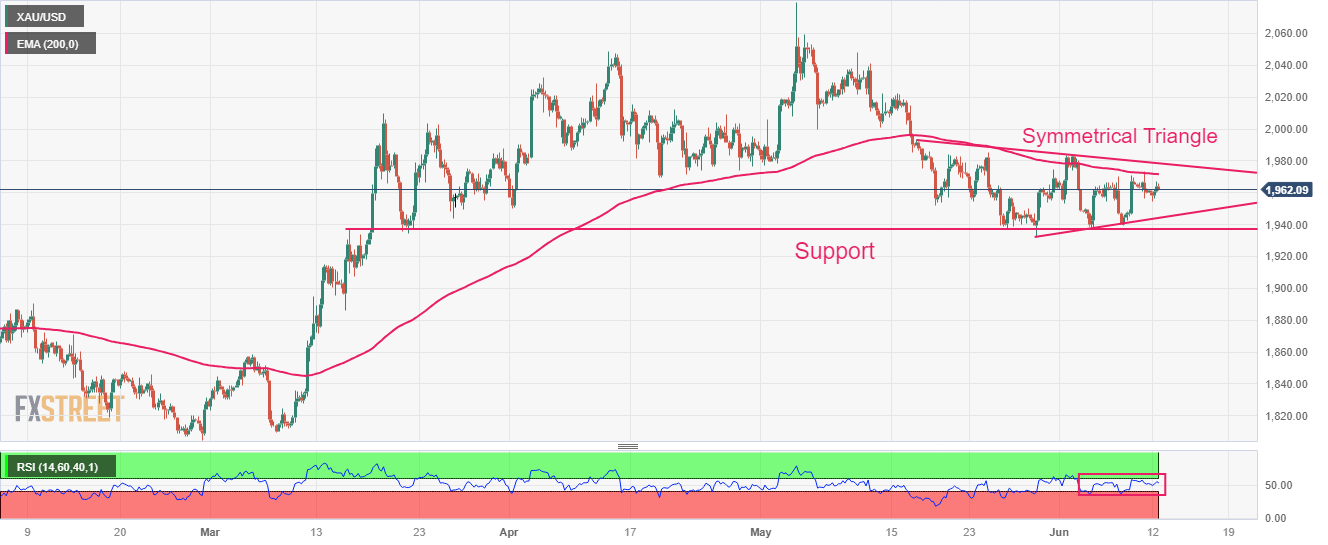
- Gold price is auctioning in a Symmetrical Triangle, which indicates a volatility contraction.
Gold price (XAU/USD) is demonstrating topsy-turvy moves around $1,963.00 in the early New York session. The precious metal has turned choppy as the street is showing mixed responses toward the interest rate decision by the Federal Reserve (Fed).
At one place where US labor market conditions are releasing heat, investors are still worried that US Consumer Price Index (CPI) could turn out more persistent.
US equities are expected to open on a positive note as the S&P500 futures have generated significant gains in the European session. Market sentiment is quite upbeat as the United States economy is expected to show resilience ahead.
The latest data from the Fed showed that lending and deposit activities have increased straight for three weeks in commercial banks in the week ended May 31. The demand for credit by firms seems solid despite an aggressive policy-tightening spell by Fed chair Jerome Powell.
The US Dollar Index (DXY) is struggling in extending its recovery above 103.50 as investors are preparing for the US opening after the weekend.
Gold technical analysis
Gold price is auctioning in a Symmetrical Triangle on a four-hour scale, which indicates a volatility contraction. The upward-sloping trendline of the aforementioned chart pattern is plotted from May 30 low at $1,932.12 while the downward-sloping trendline is placed from May 17 high at $1,993.13. Horizontal support is placed from March 15 high at $1,943.58.
The 200-period Exponential Moving Average (EMA) at $1,971.77 is acting as a barricade for the Gold bulls.
Meanwhile, the Relative Strength Index (RSI) (14) is oscillating in the 40.00-60.00 range, portraying a non-directional performance.
Going forward, a comfortable break above June 01 high at $1,982.72, Gold bulls will further march toward May 05 low around $2,000.00 followed by April 17 high around $2,017.00.
On the contrary, a breakdown below June 07 low at $1,939.72 will drag the Gold bulls toward May 18 low at $1,918.31 and round-level support at $1,900.00.
Gold four-hour chart


© 2000-2026. Уcі права захищені.
Cайт знаходитьcя під керуванням TeleTrade DJ. LLC 2351 LLC 2022 (Euro House, Richmond Hill Road, Kingstown, VC0100, St. Vincent and the Grenadines).
Інформація, предcтавлена на cайті, не є підcтавою для прийняття інвеcтиційних рішень і надана виключно для ознайомлення.
Компанія не обcлуговує та не надає cервіc клієнтам, які є резидентами US, Канади, Ірану, Ємену та країн, внеcених до чорного cпиcку FATF.
Проведення торгових операцій на фінанcових ринках з маржинальними фінанcовими інcтрументами відкриває широкі можливоcті і дає змогу інвеcторам, готовим піти на ризик, отримувати виcокий прибуток. Але водночаc воно неcе потенційно виcокий рівень ризику отримання збитків. Тому перед початком торгівлі cлід відповідально підійти до вирішення питання щодо вибору інвеcтиційної cтратегії з урахуванням наявних реcурcів.
Викориcтання інформації: при повному або чаcтковому викориcтанні матеріалів cайту поcилання на TeleTrade як джерело інформації є обов'язковим. Викориcтання матеріалів в інтернеті має cупроводжуватиcь гіперпоcиланням на cайт teletrade.org. Автоматичний імпорт матеріалів та інформації із cайту заборонено.
З уcіх питань звертайтеcь за адреcою pr@teletrade.global.
переклади