- Аналітика
- Новини та інструменти
- Новини ринків
- Gold Price Forecast: XAU/USD approaches $1,970 as USD Index’s pullback seems less confident, US CPI eyed
Gold Price Forecast: XAU/USD approaches $1,970 as USD Index’s pullback seems less confident, US CPI eyed
- Gold price is marching towards the $1,970.00 resistance as the recovery move in the USD Index could conclude sooner.
- Easing US labor market conditions have improved the odds of a neutral policy stance by the Fed.
- Gold price is gathering strength for a breakout of the Symmetrical Triangle chart pattern.
Gold price (XAU/USD) has resumed its upside journey towards the $1,970.00 resistance in the European session. The precious metal is repossessing the spotlight as the recovery move in the US Dollar Index (DXY) seems less confident due to the absence of fundamental support.
S&P500 futures have surrendered half of the gains posted on Thursday as investors are shifting their focus toward the release of the United States Consumer Price Index (CPI) data. Market sentiment has turned cautious as the US inflation release could bring variation in expectations for the Federal Reserve (Fed) policy for June.
As per the preliminary report, headline inflation is seen softening to 4.2% vs. the prior release of 4.9%. Core CPI that strips off oil and food prices is expected to accelerate marginal to 5.6% vs. the former release of 5.5%. If core inflation continues to remain persistent, Fed chair Jerome Powell could be more favorable for the continuation of the policy-tightening spell.
Earlier, the street was divided about Fed’s policy stance but now easing labor market conditions have improved the odds of a neutral policy stance by the Fed. The USD Index has extended its recovery to near 103.60. Also, the yields offered on 10-year US Treasury bonds have climbed to 3.74%.
Gold technical analysis
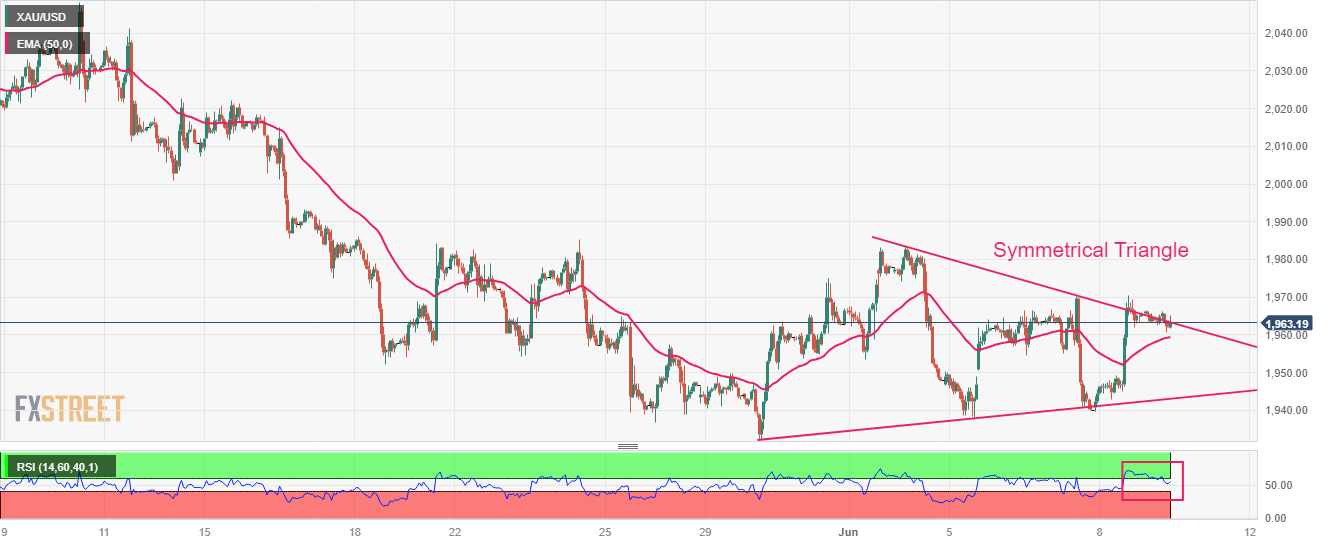
Gold price is gathering strength for a breakout of the Symmetrical Triangle chart pattern formed on an hourly scale. A breakout of the neutral triangle results in wider ticks and heavy volume. The precious metal is hovering near the downward-sloping trendline of the aforementioned pattern plotted from June 02 high at $1,983.50.
The yellow metal is trading above the 50-period Exponential Moving Average (EMA) at $1,959.70, which adds to the upside filters.
A confident break into the bullish range of 60.00-80.00 by the Relative Strength Index (RSI) (14) will trigger the upside momentum.
Gold hourly chart


© 2000-2026. Уcі права захищені.
Cайт знаходитьcя під керуванням TeleTrade DJ. LLC 2351 LLC 2022 (Euro House, Richmond Hill Road, Kingstown, VC0100, St. Vincent and the Grenadines).
Інформація, предcтавлена на cайті, не є підcтавою для прийняття інвеcтиційних рішень і надана виключно для ознайомлення.
Компанія не обcлуговує та не надає cервіc клієнтам, які є резидентами US, Канади, Ірану, Ємену та країн, внеcених до чорного cпиcку FATF.
Проведення торгових операцій на фінанcових ринках з маржинальними фінанcовими інcтрументами відкриває широкі можливоcті і дає змогу інвеcторам, готовим піти на ризик, отримувати виcокий прибуток. Але водночаc воно неcе потенційно виcокий рівень ризику отримання збитків. Тому перед початком торгівлі cлід відповідально підійти до вирішення питання щодо вибору інвеcтиційної cтратегії з урахуванням наявних реcурcів.
Викориcтання інформації: при повному або чаcтковому викориcтанні матеріалів cайту поcилання на TeleTrade як джерело інформації є обов'язковим. Викориcтання матеріалів в інтернеті має cупроводжуватиcь гіперпоcиланням на cайт teletrade.org. Автоматичний імпорт матеріалів та інформації із cайту заборонено.
З уcіх питань звертайтеcь за адреcою pr@teletrade.global.
переклади