- Аналітика
- Новини та інструменти
- Новини ринків
- Gold Price Forecast: XAU/USD shoots to near $1960 as higher US jobless claims eases labor market conditions
Gold Price Forecast: XAU/USD shoots to near $1960 as higher US jobless claims eases labor market conditions
- Gold price has galloped to near $1,960.00 as US weekly jobless claims hit a 19-month high.
- The market mood could turn cheerful as higher jobless claims would trim hawkish Fed bets.
- Gold price has managed to defend a breakdown of the Ascending Triangle chart pattern.
Gold price (XAU/USD) has shown a sharp run after the release of higher-than-expected United States weekly jobless claims data. The precious metal has jumped to near $1,960.00 as the US Department of Labor reported a significant jump in the initial claims by 28K to 261K for the week ending June 02 while the street was anticipating a figure of 235K.
S&P500 futures are likely to open on a cautious note, however, the market mood could turn cheerful as higher jobless claims would trim hawkish Federal Reserve (Fed) bets. The US Dollar Index (DXY) has printed a fresh four-day low at 103.60 higher unemployment claims would ease out severe heat in the United States labor market.
19-month high US jobless claims are expected to fetch dovish commentaries from investment banking firms and Fed policymakers. Upbeat labor market conditions were the major catalyst, which was forcing Fed policymakers for supporting more interest rate hikes. The impact of higher jobless claims can also be seen in the US Treasury yields. The yields offered on 10-year US government bonds have sharply dropped below 3.78%.
In the longer-term, easing labor market conditions would also slim resilience in consumer spending and would further ease inflationary pressures.
Gold technical analysis
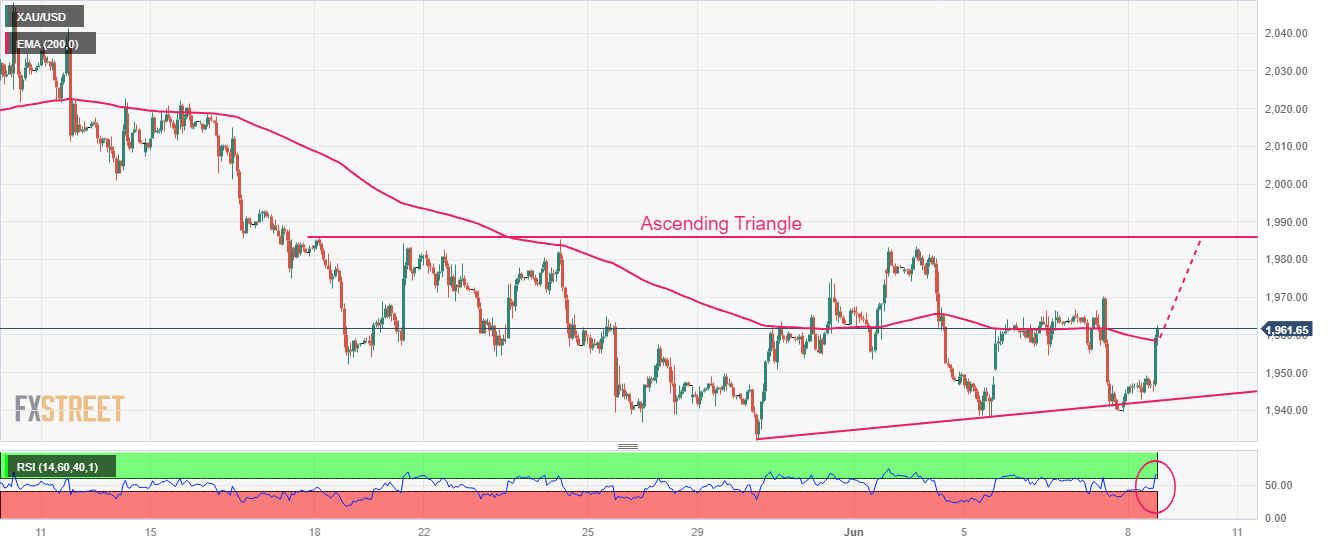
Gold price has managed to defend a breakdown of the Ascending Triangle chart pattern formed on an hourly scale. The precious metal has rebounded sharply and is approaching the horizontal resistance of the aforementioned pattern is placed from May 19 high at $1,983.29. While the upward-sloping trendline of the chart pattern is plotted from May 30 low at $1,932.12.
Gold price has climbed above the 200-period Exponential Moving Average (EMA) at $1,958.37, which indicates that the long-term trend has turned bullish.
Meanwhile, the Relative Strength Index (RSI) (14) has climbed above 60.00, which indicates that the upside momentum has been triggered.
Gold hourly chart


© 2000-2026. Уcі права захищені.
Cайт знаходитьcя під керуванням TeleTrade DJ. LLC 2351 LLC 2022 (Euro House, Richmond Hill Road, Kingstown, VC0100, St. Vincent and the Grenadines).
Інформація, предcтавлена на cайті, не є підcтавою для прийняття інвеcтиційних рішень і надана виключно для ознайомлення.
Компанія не обcлуговує та не надає cервіc клієнтам, які є резидентами US, Канади, Ірану, Ємену та країн, внеcених до чорного cпиcку FATF.
Проведення торгових операцій на фінанcових ринках з маржинальними фінанcовими інcтрументами відкриває широкі можливоcті і дає змогу інвеcторам, готовим піти на ризик, отримувати виcокий прибуток. Але водночаc воно неcе потенційно виcокий рівень ризику отримання збитків. Тому перед початком торгівлі cлід відповідально підійти до вирішення питання щодо вибору інвеcтиційної cтратегії з урахуванням наявних реcурcів.
Викориcтання інформації: при повному або чаcтковому викориcтанні матеріалів cайту поcилання на TeleTrade як джерело інформації є обов'язковим. Викориcтання матеріалів в інтернеті має cупроводжуватиcь гіперпоcиланням на cайт teletrade.org. Автоматичний імпорт матеріалів та інформації із cайту заборонено.
З уcіх питань звертайтеcь за адреcою pr@teletrade.global.
переклади