- Аналітика
- Новини та інструменти
- Новини ринків
- NZD/USD Price Analysis: Volatility squeezes broadly amid a light economic calendar
NZD/USD Price Analysis: Volatility squeezes broadly amid a light economic calendar
- NZD/USD has turned sideways broadly amid an absence of a potential trigger.
- The US Dollar Index has resumed its downside journey after a less-confident pullback move to near 104.00.
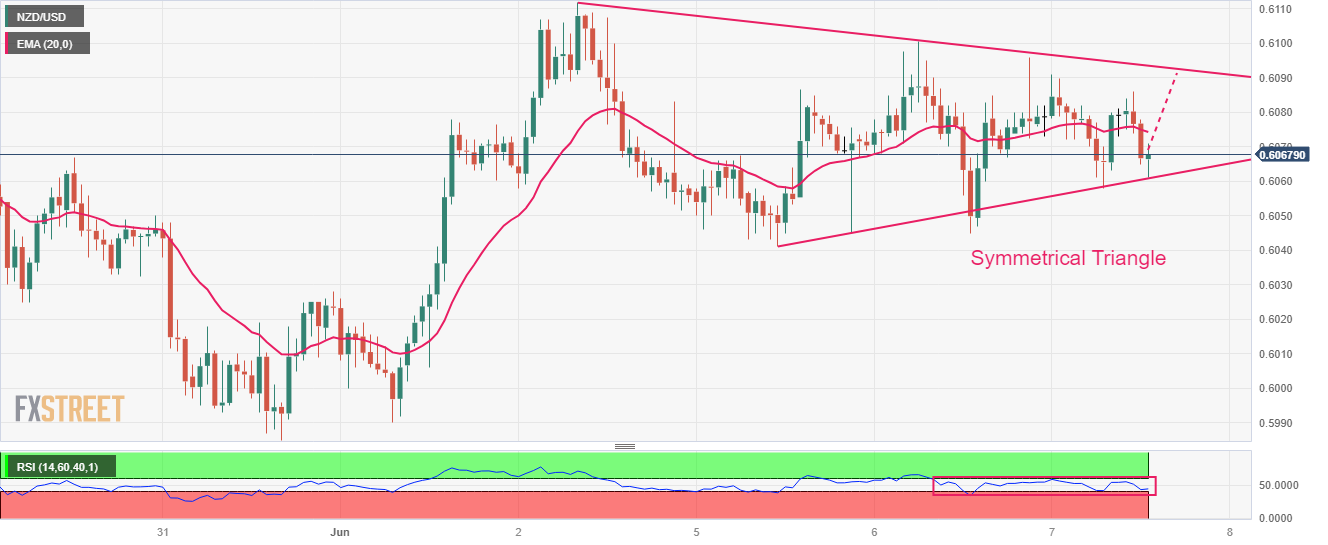
- NZD/USD is auctioning in a Symmetrical Triangle that indicates a contraction in volatility.
The NZD/USD pair is demonstrating topsy-turvy moves in the early New York session. The Kiwi asset is auctioning in a tight range as investors are divided about the Federal Reserve (Fed)’s interest rate policy for June.
While the United States' solid labor market conditions are propelling the continuation of the rate-hiking spell by the Fed, deteriorating economic activities are telling a different story. The US Dollar Index (DXY) has resumed its downside journey after a less-confident pullback move to near 104.00.
The risk-on market mood has improved the appeal of the risk-perceived assets.
NZD/USD is auctioning in a Symmetrical Triangle chart pattern that indicates a contraction in volatility, which is followed by wider ticks and heavy volume after an explosion. The upward-sloping trendline of the aforementioned chart pattern is plotted from June 05 low at 0.6041 while the downward-sloping trendline is placed from June 02 high at 0.6112.
The 20-period Exponential Moving Average (EMA) at 0.6075 seems sticky to the asset, indicating a sideways performance.
Also, the Relative Strength Index (RSI) (14) has been confined into the 40.00-60.00 range, which signals that investors are awaiting a fresh trigger for a decisive move.
A confident break above May 25 high at 0.6110 will drive the Kiwi asset toward May 01 low at 0.6160 followed by the round-level resistance at 0.6200.
Alternatively, a downside move below the intraday low at 0.6015 will expose the asset for a fresh six-month low toward 11 November 2022 low at 0.5984. A slippage below the latter would expose the asset toward 02 November 2022 high at 0.5941.
NZD/USD hourly chart


© 2000-2026. Уcі права захищені.
Cайт знаходитьcя під керуванням TeleTrade DJ. LLC 2351 LLC 2022 (Euro House, Richmond Hill Road, Kingstown, VC0100, St. Vincent and the Grenadines).
Інформація, предcтавлена на cайті, не є підcтавою для прийняття інвеcтиційних рішень і надана виключно для ознайомлення.
Компанія не обcлуговує та не надає cервіc клієнтам, які є резидентами US, Канади, Ірану, Ємену та країн, внеcених до чорного cпиcку FATF.
Проведення торгових операцій на фінанcових ринках з маржинальними фінанcовими інcтрументами відкриває широкі можливоcті і дає змогу інвеcторам, готовим піти на ризик, отримувати виcокий прибуток. Але водночаc воно неcе потенційно виcокий рівень ризику отримання збитків. Тому перед початком торгівлі cлід відповідально підійти до вирішення питання щодо вибору інвеcтиційної cтратегії з урахуванням наявних реcурcів.
Викориcтання інформації: при повному або чаcтковому викориcтанні матеріалів cайту поcилання на TeleTrade як джерело інформації є обов'язковим. Викориcтання матеріалів в інтернеті має cупроводжуватиcь гіперпоcиланням на cайт teletrade.org. Автоматичний імпорт матеріалів та інформації із cайту заборонено.
З уcіх питань звертайтеcь за адреcою pr@teletrade.global.
переклади