- Аналітика
- Новини та інструменти
- Новини ринків
- AUD/USD Price Analysis: Retreats from golden Fibonacci ratio on China data, 0.6640-35 eyed
AUD/USD Price Analysis: Retreats from golden Fibonacci ratio on China data, 0.6640-35 eyed
- AUD/USD fades upside momentum at the highest levels in three weeks, prods intraday low of late.
- China trade surplus eases, imports increase but exports drop in May.
- 61.8% Fibonacci retracement prods Aussie buyers amid overbought RSI conditions.
- Sellers need validation from convergence of 200-SMA, 50% Fibonacci retracement level.
AUD/USD bulls struggle to keep the reins as China trade numbers join downbeat Australia’s first quarter (Q1) Gross Domestic Product (GDP) to prod the upside momentum at the highest levels in three weeks. That said, the Aussie pair retreats towards the intraday low surrounding 0.6670 heading into Wednesday’s European session.
China’s headline Trade Balance deteriorates to $65.81 billion versus the $92.0 billion expected and $90.21 billion previous readings. That said, the Exports and Imports came in mixed with the former falling past -0.4% expected and 8.5% previous readings to -7.5% YoY whereas the latter improves to 2.3% from -0.8% market forecasts and 4.2% prior.
On the other hand, Aussie Q1 GDP rose 0.2% QoQ compared to 0.5% previous readings and 0.3% market forecasts. On the same line, the yearly GDP came in as 2.3% versus the analysts’ estimation of 2.4% YoY and 2.7% previous readings.
Technically, the Aussie pair portrays a rising wedge bearish chart pattern on the four-hour play while recently reversing from the 61.8% Fibonacci retracement of its May 10-31 downturn, also known as the golden Fibonacci ratio.
That said, the risk-barometer pair’s reversal from the key Fibonacci ratio also justifies the overbought RSI (14) line to tease the sellers.
However, a clear downside break of the stated wedge’s bottom line, close to 0.6650 at the latest, becomes necessary for the AUD/USD bears to retake control.
Even so, a convergence of the 200-SMA and 50% Fibonacci retracement level of around 0.6640-35, appears a tough nut to crack for the AUD/USD sellers.
On the flip side, a successful break of the 61.8% Fibonacci retracement level of 0.6680 needs validation from the stated wedge’s top line, close to the 0.6700 round figure by the press time, to recall the AUD/USD buyers.
Also acting as an upside filter is the mid-May swing high around 0.6710.
AUD/USD: Four-hour chart
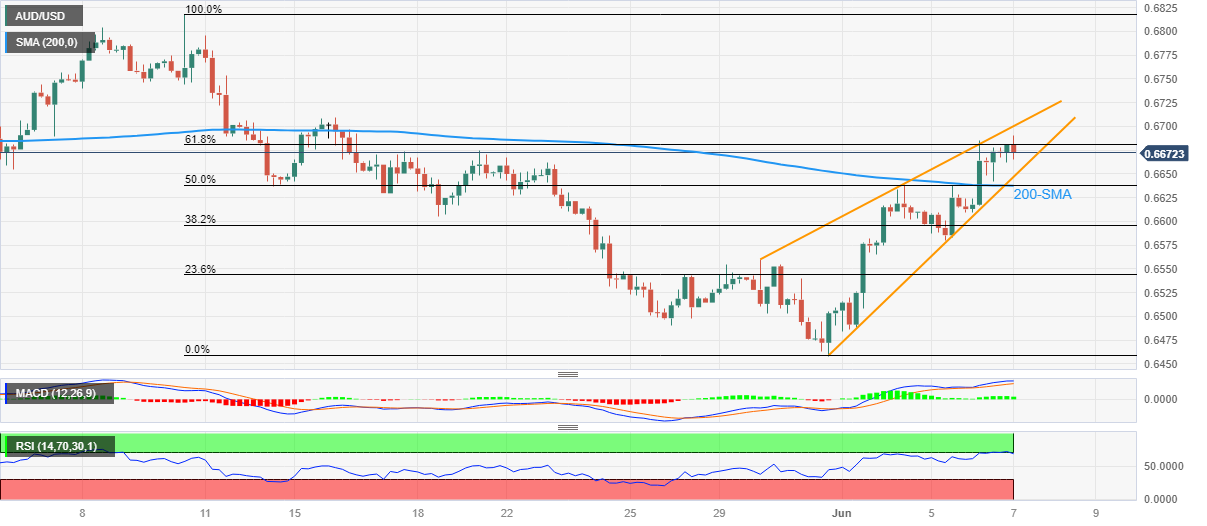
Trend: Further downside expected


© 2000-2026. Уcі права захищені.
Cайт знаходитьcя під керуванням TeleTrade DJ. LLC 2351 LLC 2022 (Euro House, Richmond Hill Road, Kingstown, VC0100, St. Vincent and the Grenadines).
Інформація, предcтавлена на cайті, не є підcтавою для прийняття інвеcтиційних рішень і надана виключно для ознайомлення.
Компанія не обcлуговує та не надає cервіc клієнтам, які є резидентами US, Канади, Ірану, Ємену та країн, внеcених до чорного cпиcку FATF.
Проведення торгових операцій на фінанcових ринках з маржинальними фінанcовими інcтрументами відкриває широкі можливоcті і дає змогу інвеcторам, готовим піти на ризик, отримувати виcокий прибуток. Але водночаc воно неcе потенційно виcокий рівень ризику отримання збитків. Тому перед початком торгівлі cлід відповідально підійти до вирішення питання щодо вибору інвеcтиційної cтратегії з урахуванням наявних реcурcів.
Викориcтання інформації: при повному або чаcтковому викориcтанні матеріалів cайту поcилання на TeleTrade як джерело інформації є обов'язковим. Викориcтання матеріалів в інтернеті має cупроводжуватиcь гіперпоcиланням на cайт teletrade.org. Автоматичний імпорт матеріалів та інформації із cайту заборонено.
З уcіх питань звертайтеcь за адреcою pr@teletrade.global.
переклади