- Аналітика
- Новини та інструменти
- Новини ринків
- Gold Price Forecast: XAU/USD defends $1950 as US yields drop ahead of US job data and Fed’s Beige Book
Gold Price Forecast: XAU/USD defends $1950 as US yields drop ahead of US job data and Fed’s Beige Book
- Gold price has defended its crucial support around $1,950.00, supported by weak US Treasury yields.
- The USD Index has delivered a V-shape recovery after defending the crucial support of 104.00 amid hawkish Fed bets.
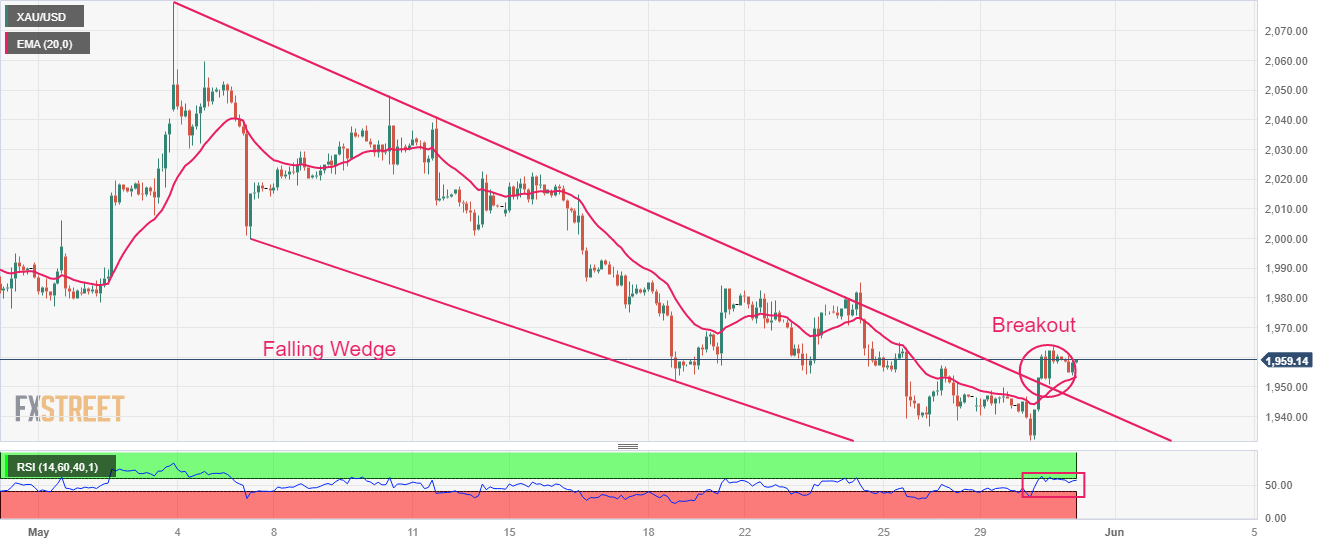
- Gold price has turned sideways around $1,960.00 after delivering a breakout of the Falling Wedge pattern.
Gold price (XAU/USD) has shown some recovery after defending its close support of $1,950.00 in the Tokyo session. Broadly, the precious metal is consolidating in a range of $1,953-1,960 as investors are awaiting the release of the United States Employment data.
S&P500 futures have added more losses in Asia, portraying a decline in the risk appetite of the market participants. The US Dollar Index (DXY) has delivered a V-shape recovery after defending the crucial support of 104.00.
Investors should note that Gold price has managed to defend the downside despite extreme strength in the US Dollar bulls. The Gold price is being supported by falling US Treasury yields. Growing optimism about a clear passage for the novel US debt-ceiling proposal in Congress has weighed heavily on the US Treasury yields. The yields offered on 10-year US government bonds have dropped 3.68%.
A conservative approach should be taken as the Gold price could face pressure considering the strength of the US Dollar and deepening expectations of one more interest rate hike by the Federal Reserve (Fed).
Going forward, US JOTLS Job Openings data and the release of Fed’s Beige Book will be keenly watched. According to the estimates, total job openings have dropped to 9.375M vs. the former release of 9.59M.
Gold technical analysis
Gold price has turned sideways around $1,960.00 after delivering a breakout of the Falling Wedge chart pattern formed on a two-hour scale. A breakout of the aforementioned pattern indicates a bullish reversal. The 20-period Exponential Moving Average (EMA) at $1,953.36 is providing a cushion to the Gold bulls.
The Relative Strength Index (RSI) (14) is making efforts for shifting into the bullish range of 60.00-80.00. An occurrence of the same will be followed by activation of the bullish momentum.
Gold two-hour chart


© 2000-2026. Уcі права захищені.
Cайт знаходитьcя під керуванням TeleTrade DJ. LLC 2351 LLC 2022 (Euro House, Richmond Hill Road, Kingstown, VC0100, St. Vincent and the Grenadines).
Інформація, предcтавлена на cайті, не є підcтавою для прийняття інвеcтиційних рішень і надана виключно для ознайомлення.
Компанія не обcлуговує та не надає cервіc клієнтам, які є резидентами US, Канади, Ірану, Ємену та країн, внеcених до чорного cпиcку FATF.
Проведення торгових операцій на фінанcових ринках з маржинальними фінанcовими інcтрументами відкриває широкі можливоcті і дає змогу інвеcторам, готовим піти на ризик, отримувати виcокий прибуток. Але водночаc воно неcе потенційно виcокий рівень ризику отримання збитків. Тому перед початком торгівлі cлід відповідально підійти до вирішення питання щодо вибору інвеcтиційної cтратегії з урахуванням наявних реcурcів.
Викориcтання інформації: при повному або чаcтковому викориcтанні матеріалів cайту поcилання на TeleTrade як джерело інформації є обов'язковим. Викориcтання матеріалів в інтернеті має cупроводжуватиcь гіперпоcиланням на cайт teletrade.org. Автоматичний імпорт матеріалів та інформації із cайту заборонено.
З уcіх питань звертайтеcь за адреcою pr@teletrade.global.
переклади