- Аналітика
- Новини та інструменти
- Новини ринків
- Gold Price Forecast: XAU/USD retreats from $1,950 as USD Index rebounds firmly, US Employment in focus
Gold Price Forecast: XAU/USD retreats from $1,950 as USD Index rebounds firmly, US Employment in focus
- Gold price has extended its downside to near $1,940.00 amid a solid recovery in the USD Index.
- The overall market mood has turned cautious as investors are anticipating one more interest rate hike from the Fed.
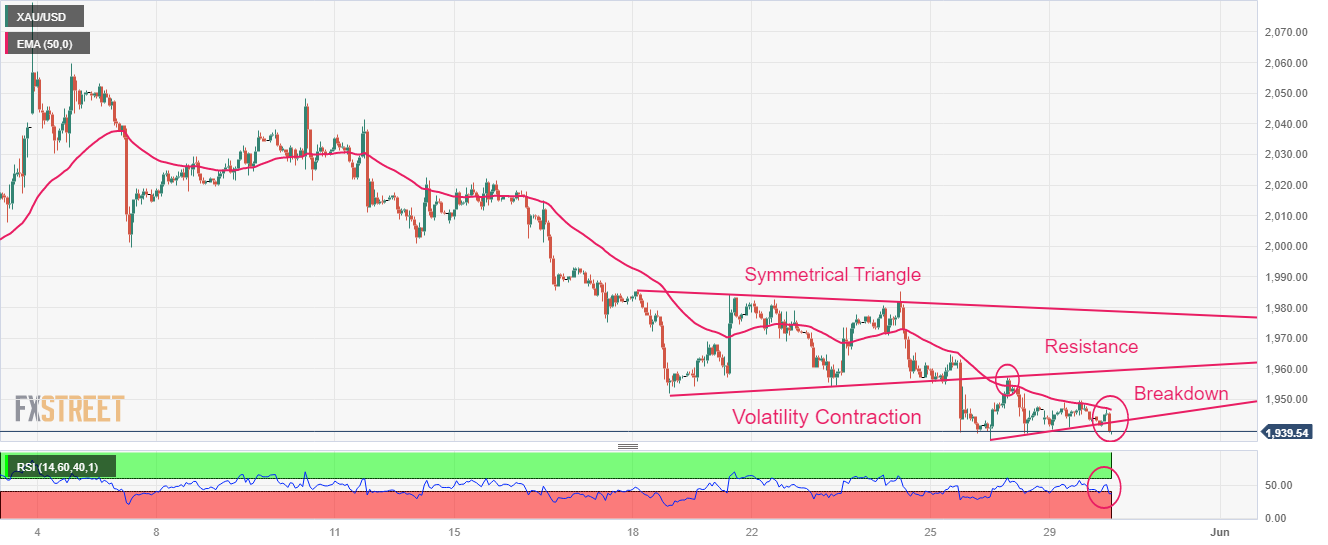
- Gold price has delivered a breakdown of the volatility contraction pattern and is anticipated to deliver a vertical fall
Gold price (XAU/USD) witnessed extreme selling pressure after a short-lived pullback move to near $1,946.70 in the Asian session. The precious metal has extended its downside journey to near $1,940.00 as the US Dollar Index (DXY) has recovered its entire losses and is aiming to print afresh day high above 104.34.
S&P500 futures are continuously easing gains generated on Monday as investors are worried that Tuesday’s trading session could be extremely volatile after an extended weekend. The overall market mood has turned cautious as investors are anticipating one more interest rate elevation from the Federal Reserve (Fed).
Earlier, Fed chair Jerome Powell cited that tight credit conditions by US regional banks are doing the job for the central bank as liquidity disbursement in the economy has dropped. Firms are facing barriers in augmenting working capital requirements and are satisfied with operating at less capacity.
However, fresh incoming data showed that consumer spending is sky-rocketing in the US economy, and labor market conditions have not eased as expected, which is forcing the Fed to continue its policy-tightening spell.
This week, the release of the US Employment data will provide more clarity about interest rate guidance. As per the consensus, Thursday’s Automatic Data Processing (ADP) Employment Change is expected to land at 170K lower than the former release of 296K.
Gold technical analysis
Gold price has delivered a breakdown of the volatility contraction and is anticipated to deliver a vertical fall. Earlier, the precious metal displayed a downside move after a breakdown of the Symmetrical Triangle chart pattern on an hourly scale.
The 50-period Exponential Moving Average (EMA) at $1,948.00 has acted as a barricade for the Gold price.
Meanwhile, the Relative Strength Index (RSI) (14) has slipped below 40.00, which indicates that the downside momentum has been triggered.
Gold hourly chart


© 2000-2026. Уcі права захищені.
Cайт знаходитьcя під керуванням TeleTrade DJ. LLC 2351 LLC 2022 (Euro House, Richmond Hill Road, Kingstown, VC0100, St. Vincent and the Grenadines).
Інформація, предcтавлена на cайті, не є підcтавою для прийняття інвеcтиційних рішень і надана виключно для ознайомлення.
Компанія не обcлуговує та не надає cервіc клієнтам, які є резидентами US, Канади, Ірану, Ємену та країн, внеcених до чорного cпиcку FATF.
Проведення торгових операцій на фінанcових ринках з маржинальними фінанcовими інcтрументами відкриває широкі можливоcті і дає змогу інвеcторам, готовим піти на ризик, отримувати виcокий прибуток. Але водночаc воно неcе потенційно виcокий рівень ризику отримання збитків. Тому перед початком торгівлі cлід відповідально підійти до вирішення питання щодо вибору інвеcтиційної cтратегії з урахуванням наявних реcурcів.
Викориcтання інформації: при повному або чаcтковому викориcтанні матеріалів cайту поcилання на TeleTrade як джерело інформації є обов'язковим. Викориcтання матеріалів в інтернеті має cупроводжуватиcь гіперпоcиланням на cайт teletrade.org. Автоматичний імпорт матеріалів та інформації із cайту заборонено.
З уcіх питань звертайтеcь за адреcою pr@teletrade.global.
переклади