- Аналітика
- Новини та інструменти
- Новини ринків
- Gold Price Forecast: XAU/USD struggles to surpass $1,950, upside seems favored as US debt dynamics modify
Gold Price Forecast: XAU/USD struggles to surpass $1,950, upside seems favored as US debt dynamics modify
- Gold price is facing delicate hurdles around $1,945.00 despite the USD Index has retreated from 104.20.
- A downgrade in the US long-term credibility would have a negative impact on the USD Index and US equities.
- Gold price is defending its cushion near horizontal support plotted from $1.937.39.
Gold price (XAU/USD) is facing fragile barricades around $1,945.00 in the Asian session. The precious metal is expected to move higher as the US Dollar Index (DXY) has retreated after a pullback move to near 104.20. The approval of a raise in the US debt-ceiling has pushed the USD index under pressure.
There is no denying the fact that the United States economy will attract a downgrade in its long-term credibility by credit rating agencies as higher debt increases the default chances of a nation. This would have a negative impact on the US Dollar Index and US equities, however, Gold would be considered a safe-haven. Therefore, the upside bias for the Gold price looks extremely solid.
S&P500 futures have surrendered the majority of gains added in early Asia. Investors should note that US markets are closed on Monday on account of Memorial Day, therefore, investors could remain risk-averse ahead.
Meanwhile, fears of more interest rate hikes by the Federal Reserve (Fed) could put some pressure on the Gold price. Rising consumer spending is advocating persistence in the US inflation, which could force the Fed not to halt its policy-tightening spell. This week, the US Employment data will keep investors’ busy as it will provide a base for June’s monetary policy meeting.
Gold technical analysis
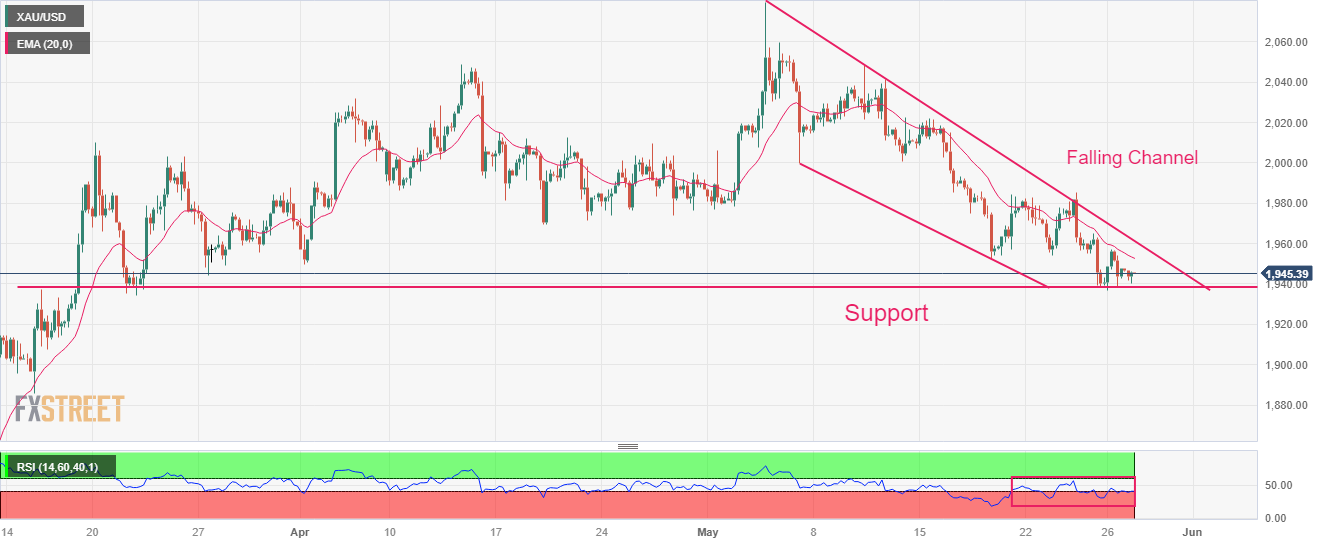
Gold price is defending its cushion near horizontal support plotted from March 15 high at $1.937.39 on a four-hour scale. The precious metal is auctioning in a Falling Channel in which each pullback is considered a selling opportunity by market participants.
The 20-period Exponential Moving Average (EMA) at $1,952.38 is consistently barricading the Gold bulls from making any recovery.
Meanwhile, the Relative Strength Index (RSI) (14) is looking to shift its oscillation in the 40.00-60.00 range from the bearish range of 20.00-40.00, which indicates that the downside momentum has faded.
Gold four-hour chart


© 2000-2026. Уcі права захищені.
Cайт знаходитьcя під керуванням TeleTrade DJ. LLC 2351 LLC 2022 (Euro House, Richmond Hill Road, Kingstown, VC0100, St. Vincent and the Grenadines).
Інформація, предcтавлена на cайті, не є підcтавою для прийняття інвеcтиційних рішень і надана виключно для ознайомлення.
Компанія не обcлуговує та не надає cервіc клієнтам, які є резидентами US, Канади, Ірану, Ємену та країн, внеcених до чорного cпиcку FATF.
Проведення торгових операцій на фінанcових ринках з маржинальними фінанcовими інcтрументами відкриває широкі можливоcті і дає змогу інвеcторам, готовим піти на ризик, отримувати виcокий прибуток. Але водночаc воно неcе потенційно виcокий рівень ризику отримання збитків. Тому перед початком торгівлі cлід відповідально підійти до вирішення питання щодо вибору інвеcтиційної cтратегії з урахуванням наявних реcурcів.
Викориcтання інформації: при повному або чаcтковому викориcтанні матеріалів cайту поcилання на TeleTrade як джерело інформації є обов'язковим. Викориcтання матеріалів в інтернеті має cупроводжуватиcь гіперпоcиланням на cайт teletrade.org. Автоматичний імпорт матеріалів та інформації із cайту заборонено.
З уcіх питань звертайтеcь за адреcою pr@teletrade.global.
переклади