- Аналітика
- Новини та інструменти
- Новини ринків
- US Dollar Index: Extends four-day rally, bulls' eye the 105.000 mark
US Dollar Index: Extends four-day rally, bulls' eye the 105.000 mark
- The US Dollar Index continues its climb, currently trading above 104.000, driven by robust US Treasury bond yields.
- A third consecutive daily close above the 200-day EMA could solidify a bullish outlook, putting 105.000 within reach.
- Downside risks persist, with a potential fall towards 103.000 if the DXY drops below the 200-day EMA.
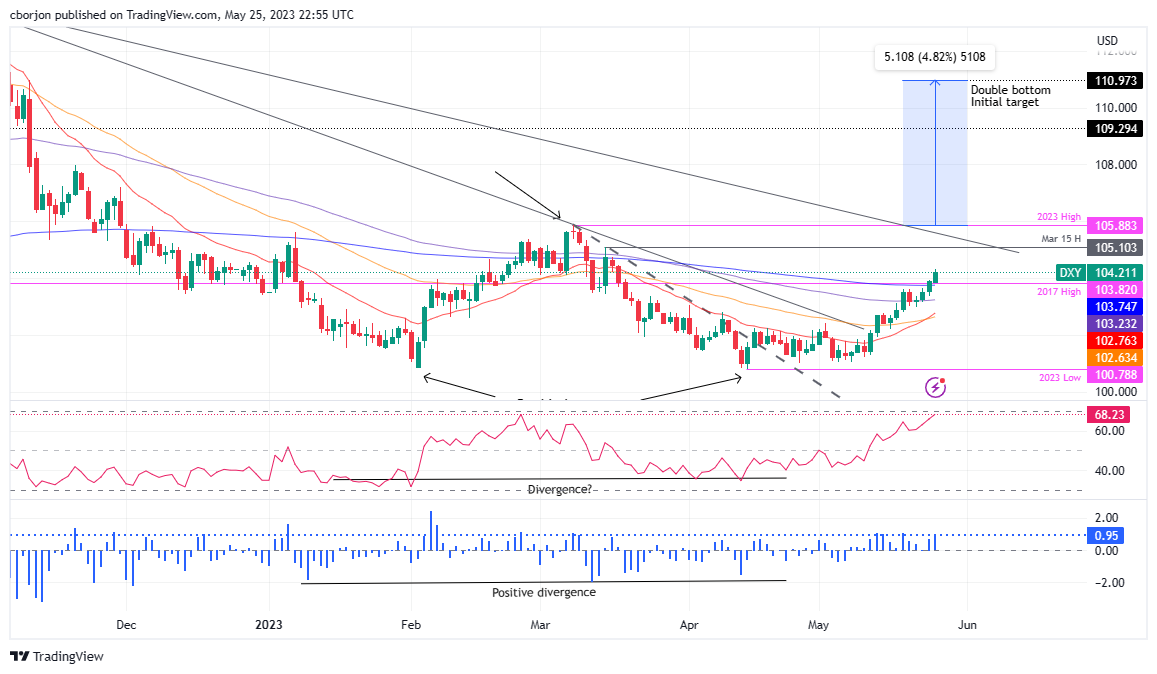
The US Dollar Index (DXY), which measures a basket of six currencies against the US Dollar (USD), extended its rally to four consecutive days, distances from the 200-day Exponential Moving Average (EMA) at 103.743, claimed on May 24, underpinned by high US Treasury bond yields. At the time of writing, the DXY is trading hands at 104.211, gaining 0.31%, with bulls eyeing the 105.000 mark.
US Dollar Index Price Analysis: Technical outlook
On Wednesday, I wrote, “The US Dollar Index is neutral to bullish biased, but it could cement its bias as bullish once the DXY achieves a decisive break above the 200-day EMA.” For two consecutive days, the DXY stays above the latter suggesting that bulls are gathering momentum. Nevertheless, a third daily close above the 200-day EMA could cement the bias as bullish, and with the double-bottom in play, the 105.000 is up for grabs.
Must read:
- US Dollar Index: Could a double bottom at the weekly chart drive the DXY to 111.000?
- US Dollar Index: Reclaims 200-day EMA, surpasses 2017 yearly high, as bulls stepped in eyeing 104.000
If the US Dollar Index claims the year-to-date (YTD) high of 105.883, that will validate the double-bottom chart pattern, but the buck must surpass crucial resistance levels on its uptrend. Meanwhile, the Relative Strength Index (RSI) indicator is in bullish territory, with some room before hitting overbought levels, while the 3-day Rate of Change (RoC) suggests that buyers are in charge.
If the DXY reclaims 104.000, the next resistance level to test would be the March 15 daily high of 105.103. Break above, and the DXY will have a clear run toward testing an eight-month-old resistance trendline around the 105.300-600 area, ahead of piercing the YTD high at 105.883
Downside risks for the DXY remain below the 200-day EMA, which could send the greenback sliding towards the 100-day EMA at 103.212. A clear break will send the DXY toward the May 22 swing low of 102.964, slightly below the 103.000 mark.
US Dollar Index Price Action – Daily chart


© 2000-2026. Уcі права захищені.
Cайт знаходитьcя під керуванням TeleTrade DJ. LLC 2351 LLC 2022 (Euro House, Richmond Hill Road, Kingstown, VC0100, St. Vincent and the Grenadines).
Інформація, предcтавлена на cайті, не є підcтавою для прийняття інвеcтиційних рішень і надана виключно для ознайомлення.
Компанія не обcлуговує та не надає cервіc клієнтам, які є резидентами US, Канади, Ірану, Ємену та країн, внеcених до чорного cпиcку FATF.
Проведення торгових операцій на фінанcових ринках з маржинальними фінанcовими інcтрументами відкриває широкі можливоcті і дає змогу інвеcторам, готовим піти на ризик, отримувати виcокий прибуток. Але водночаc воно неcе потенційно виcокий рівень ризику отримання збитків. Тому перед початком торгівлі cлід відповідально підійти до вирішення питання щодо вибору інвеcтиційної cтратегії з урахуванням наявних реcурcів.
Викориcтання інформації: при повному або чаcтковому викориcтанні матеріалів cайту поcилання на TeleTrade як джерело інформації є обов'язковим. Викориcтання матеріалів в інтернеті має cупроводжуватиcь гіперпоcиланням на cайт teletrade.org. Автоматичний імпорт матеріалів та інформації із cайту заборонено.
З уcіх питань звертайтеcь за адреcою pr@teletrade.global.
переклади