- Аналітика
- Новини та інструменти
- Новини ринків
- USD/CAD Price Analysis: Shifts auction below 1.3500 as oil rebounds and USD Index retreats
USD/CAD Price Analysis: Shifts auction below 1.3500 as oil rebounds and USD Index retreats
- USD/CAD has slipped sharply below 1.3500 amid a sharp recovery in the oil price upside exhaustion in the USD Index.
- Monthly Canadian Retail Sales data is seen contracting by 1.4% vs. a contraction of 0.2% recorded earlier.
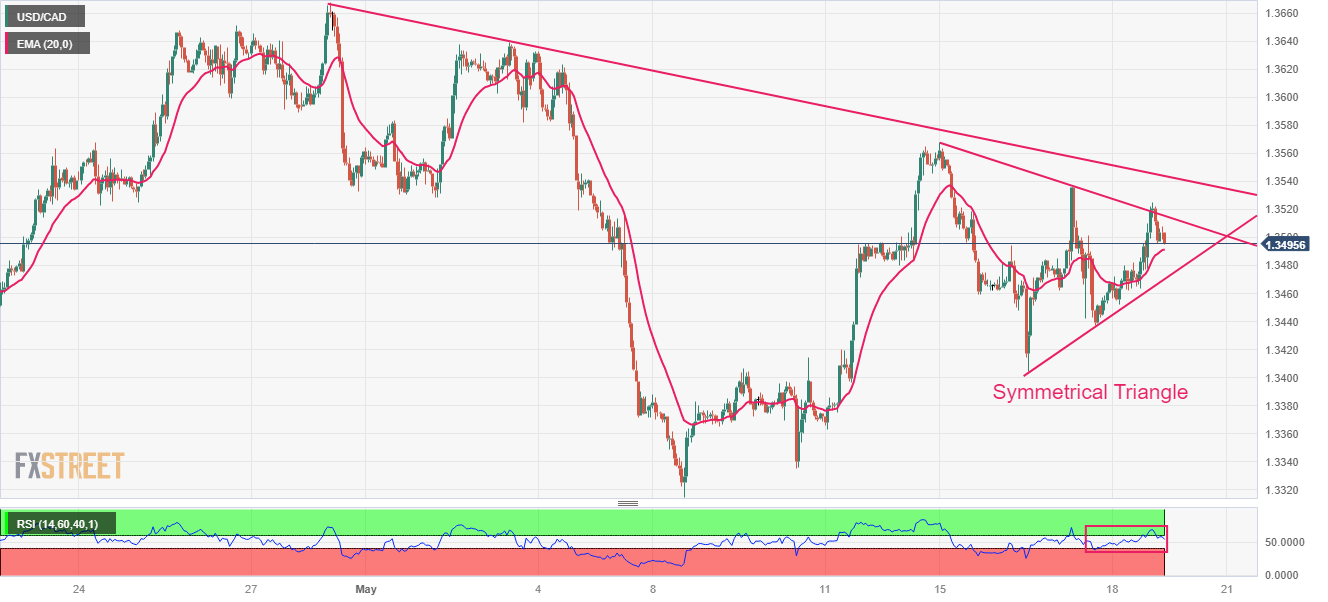
- USD/CAD is auctioning in a Symmetrical Triangle chart pattern, which indicates a volatility contraction.
The USD/CAD pair has dropped below the psychological support of 1.3500 in the early Tokyo session. The Loonie asset has sensed selling pressure as the oil price has rebounded sharply above $72.00 amid optimism over the US borrowing cap raise and the US Dollar Index (DXY) has retreated after a less-confident pullback.
Investors should note that Canada is the leading exporter of oil to the United States and a recovery in the oil price supports the Canadian Dollar.
Going forward, investors will keep an eye on monthly Canadian Retail Sales data (March). Monthly Retail Sales data is seen contracting by 1.4% vs. a contraction of 0.2% recorded earlier. A decline in househoulds’ demand would allow the Bank of Canada (BoC) to keep its interest rate policy steady further.
USD/CAD is auctioning in a Symmetrical Triangle chart pattern on an hourly scale, which indicates a volatility contraction. The Loonie asset sensed selling pressure while attempting a breakout of the neutral triangle. The downward-sloping trendline from April 28 high at 1.3668 is acting as a major barricade for the US Dollar bulls.
The 20-period Exponential Moving Average (EMA) at 1.3492 is close to the asset price, indicating a lackluster performance.
Also, the Relative Strength Index (RSI) (14) has slipped back into the 40.00-60.00 range, which signals that investors await a potential trigger for a decisive move.
The upside bias will get strengthened if the Loonie asset manages to surpass the round-level resistance of 1.3600. This will expose the asset to May 21 low at 1.3644 followed by the round-level resistance at 1.3700.
On the flip side, a break below May 18 low at 1.3452 will fade the upside bias and will drag the asset toward April 04 low at 1.3406 and May 08 low at 1.3315.
USD/CAD hourly chart


© 2000-2026. Уcі права захищені.
Cайт знаходитьcя під керуванням TeleTrade DJ. LLC 2351 LLC 2022 (Euro House, Richmond Hill Road, Kingstown, VC0100, St. Vincent and the Grenadines).
Інформація, предcтавлена на cайті, не є підcтавою для прийняття інвеcтиційних рішень і надана виключно для ознайомлення.
Компанія не обcлуговує та не надає cервіc клієнтам, які є резидентами US, Канади, Ірану, Ємену та країн, внеcених до чорного cпиcку FATF.
Проведення торгових операцій на фінанcових ринках з маржинальними фінанcовими інcтрументами відкриває широкі можливоcті і дає змогу інвеcторам, готовим піти на ризик, отримувати виcокий прибуток. Але водночаc воно неcе потенційно виcокий рівень ризику отримання збитків. Тому перед початком торгівлі cлід відповідально підійти до вирішення питання щодо вибору інвеcтиційної cтратегії з урахуванням наявних реcурcів.
Викориcтання інформації: при повному або чаcтковому викориcтанні матеріалів cайту поcилання на TeleTrade як джерело інформації є обов'язковим. Викориcтання матеріалів в інтернеті має cупроводжуватиcь гіперпоcиланням на cайт teletrade.org. Автоматичний імпорт матеріалів та інформації із cайту заборонено.
З уcіх питань звертайтеcь за адреcою pr@teletrade.global.
переклади