- Аналітика
- Новини та інструменти
- Новини ринків
- USD/JPY Price Analysis: Surges to new YTD high, bolstered by US data, high bond yields
USD/JPY Price Analysis: Surges to new YTD high, bolstered by US data, high bond yields
- USD/JPY rally driven by positive sentiment around US debt ceiling talks, solid US job data, and upbeat retail and industrial figures.
- Despite breaching the resistance at 138.00, potential resistance levels at 139.00 and 139.89 might cap gains, with the psychological 140.00 mark as the next target.
- While signs of overbought conditions emerge, suggesting potential for a downward correction, the overall bullish trend remains solid.
USD/JPY climbs to new year-to-date (YTD) highs of 138.67, bolstered by higher US Treasury bond yields, amidst an upbeat sentiment sponsored by improvement in the US debt ceiling talks. In addition, solid US jobs data, alongside strong Retail Sales, Industrial Production, and a surprising hawkish comment by Dallas Fed President Lorie Logan, propelled the USD/JPY. At the time of writing, the USD/JPY is trading at 138.57 after hitting a low of 137.28.
USD/JPY Price Analysis: Technical outlook
The USD/JPY daily chart shows the pair remains in a solid uptrend after breaking a resistance trendline alongside the 138.00 figure. On the upside, the USD/JPY will clash with solid resistance levels like the 139.00 figure, followed by the November 30 daily high of 139.89. A decisive break will expose the 140.00 psychological figure. On the other hand, if USD/JPY drops below 138.00, it will exacerbate a correction toward the 20-day Exponential Moving Average (EMA) at 135.52.
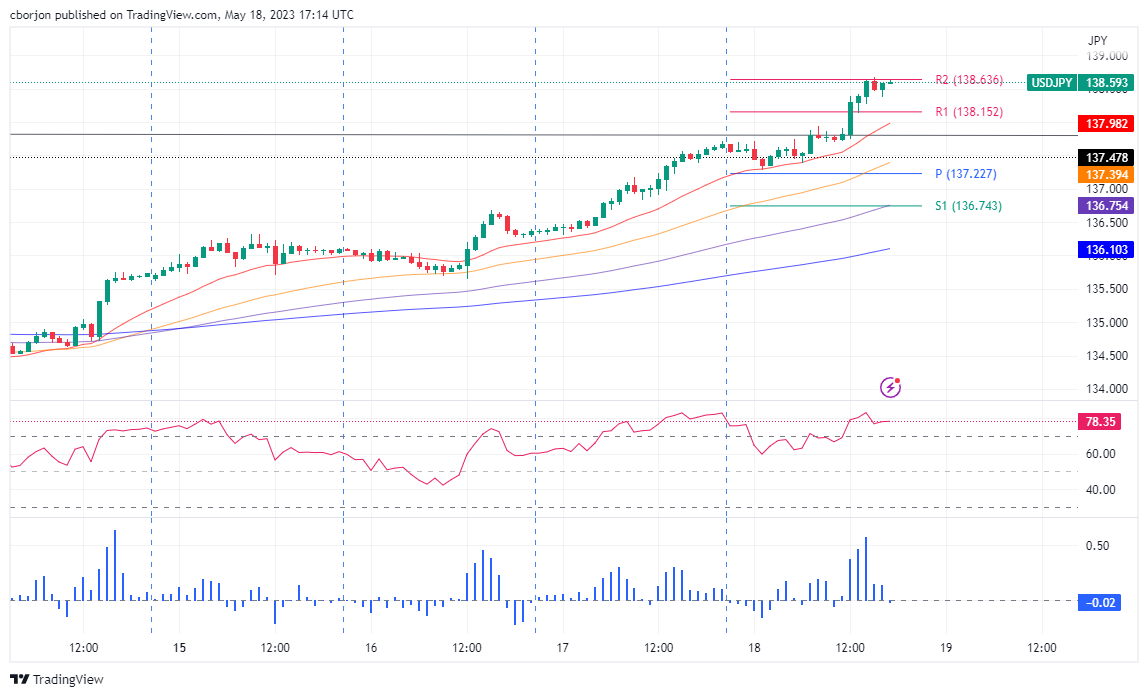
In the short term, the USD/JPY 1-hour chart, the pair peaked around the R2 daily pivot, with two subsequent attempts to clear the latter, as buyers are eyeing the 139.00 figure. If USD/JPY fails to crack the R2 daily pivot level, a pullback toward the R1 pivot at 138.15 is on the cards before reaching the 20-EMA at 137.98.
The Relative Strength Index (RSI) indicators at overbought territory register lower peaks as price action reaches higher highs. That means negative divergence forms, opening the door for a downward correction. In addition, the 3-period Rate of Change (RoC) shows buyers losing momentum.
USD/JPY Price Action – 1-Hour chart


© 2000-2026. Уcі права захищені.
Cайт знаходитьcя під керуванням TeleTrade DJ. LLC 2351 LLC 2022 (Euro House, Richmond Hill Road, Kingstown, VC0100, St. Vincent and the Grenadines).
Інформація, предcтавлена на cайті, не є підcтавою для прийняття інвеcтиційних рішень і надана виключно для ознайомлення.
Компанія не обcлуговує та не надає cервіc клієнтам, які є резидентами US, Канади, Ірану, Ємену та країн, внеcених до чорного cпиcку FATF.
Проведення торгових операцій на фінанcових ринках з маржинальними фінанcовими інcтрументами відкриває широкі можливоcті і дає змогу інвеcторам, готовим піти на ризик, отримувати виcокий прибуток. Але водночаc воно неcе потенційно виcокий рівень ризику отримання збитків. Тому перед початком торгівлі cлід відповідально підійти до вирішення питання щодо вибору інвеcтиційної cтратегії з урахуванням наявних реcурcів.
Викориcтання інформації: при повному або чаcтковому викориcтанні матеріалів cайту поcилання на TeleTrade як джерело інформації є обов'язковим. Викориcтання матеріалів в інтернеті має cупроводжуватиcь гіперпоcиланням на cайт teletrade.org. Автоматичний імпорт матеріалів та інформації із cайту заборонено.
З уcіх питань звертайтеcь за адреcою pr@teletrade.global.
переклади