- Аналітика
- Новини та інструменти
- Новини ринків
- Gold Price Forecast: XAU/USD eyes more weakness below $1,970 amid optimism for US debt-ceiling raise
Gold Price Forecast: XAU/USD eyes more weakness below $1,970 amid optimism for US debt-ceiling raise
- Gold price has shown a perpendicular downfall after retreating from $1,985.00 amid a solid recovery in the USD index.
- Plenty of US economic indicators are strengthening the need of pausing interest rates by the Fed.
- Gold price has shown a vertical fall after delivering a breakdown of the Rising Channel pattern.
Gold price (XAU/USD) has witnessed immense selling pressure after retreating from $1,985.00 in the early European session. The precious metal is expected to deliver more weakness on a slippage below the immediate support of $1,970.00 as soaring optimism for the US debt-ceiling raise approval is weighing heavily on bullions.
S&P500 futures have also sensed selling pressure after some recovery, portraying a rebound in the risk-aversion theme. The US Dollar Index (DXY) is all set to recapture the critical resistance of 103.00 on expectations that the US debt-ceiling raise proposal would get approval by compromising President’s spending initiatives.
House of Representatives Speaker Joseph McCarthy has got ready to hike the US borrowing cap over the compromise of further budget deficit as the duo could be a disaster for the US economy.
The US Dollar Index is managing to defend its downside despite higher anticipation for a pause in the policy-tightening spell by the Federal Reserve (Fed). According to a poll by Reuters current interest rate at 5.00-5.25% will stay by the end of 2023.
Right from consistent decline in United States inflation, easing labor market conditions to contracting retail demand and deepening fears of economic recession, plenty of economic indicators are strengthening the need of pausing interest rates.
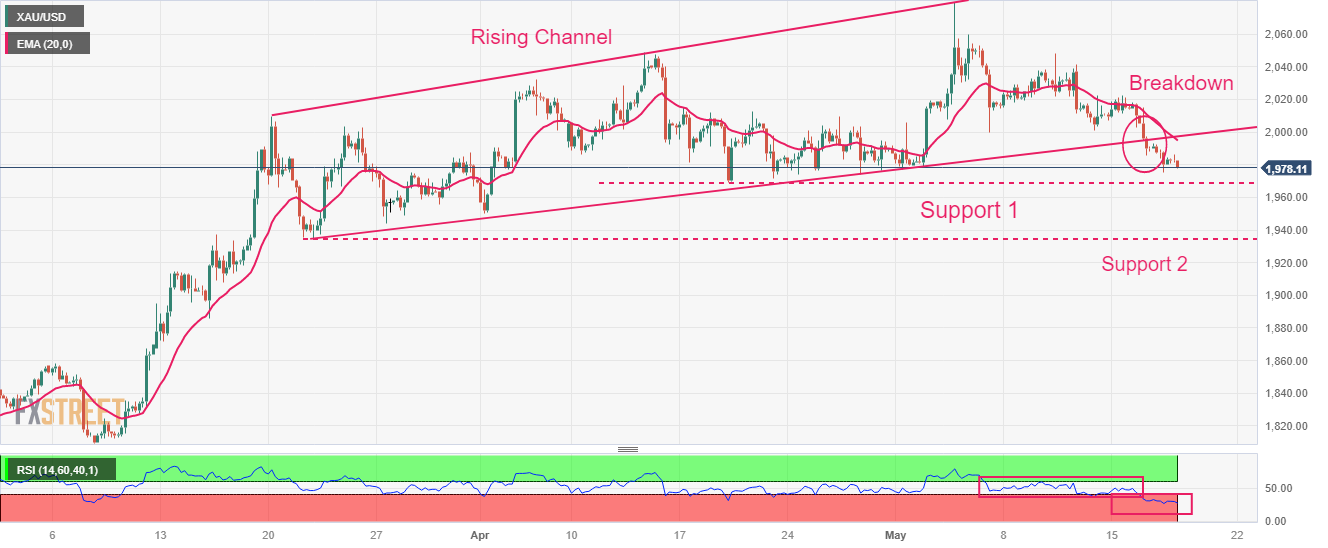
Gold technical analysis
Gold price has shown a perpendicular fall after delivering a breakdown of the Rising Channel chart pattern formed on a four-hour scale. Potential supports are placed from April 19 and March 21 low at $1,969.26 and $1,935.68 respectively. Downward-sloping 20-period Exponential Moving Average (EMA) at $1,994.56 is barricading the Gold bulls.
The Relative Strength Index (RSI) (14) has slipped into the bearish range of 20.00-40.00, which indicates more downside ahead.
Gold four-hour chart


© 2000-2026. Уcі права захищені.
Cайт знаходитьcя під керуванням TeleTrade DJ. LLC 2351 LLC 2022 (Euro House, Richmond Hill Road, Kingstown, VC0100, St. Vincent and the Grenadines).
Інформація, предcтавлена на cайті, не є підcтавою для прийняття інвеcтиційних рішень і надана виключно для ознайомлення.
Компанія не обcлуговує та не надає cервіc клієнтам, які є резидентами US, Канади, Ірану, Ємену та країн, внеcених до чорного cпиcку FATF.
Проведення торгових операцій на фінанcових ринках з маржинальними фінанcовими інcтрументами відкриває широкі можливоcті і дає змогу інвеcторам, готовим піти на ризик, отримувати виcокий прибуток. Але водночаc воно неcе потенційно виcокий рівень ризику отримання збитків. Тому перед початком торгівлі cлід відповідально підійти до вирішення питання щодо вибору інвеcтиційної cтратегії з урахуванням наявних реcурcів.
Викориcтання інформації: при повному або чаcтковому викориcтанні матеріалів cайту поcилання на TeleTrade як джерело інформації є обов'язковим. Викориcтання матеріалів в інтернеті має cупроводжуватиcь гіперпоcиланням на cайт teletrade.org. Автоматичний імпорт матеріалів та інформації із cайту заборонено.
З уcіх питань звертайтеcь за адреcою pr@teletrade.global.
переклади