- Аналітика
- Новини та інструменти
- Новини ринків
- Gold Price Forecast: XAU/USD remains lackluster below $2,020 with eyes on US debt-ceiling issues
Gold Price Forecast: XAU/USD remains lackluster below $2,020 with eyes on US debt-ceiling issues
- Gold price is sideways below $2020.00 as investors await the US debt-ceiling talks’ outcome for further action.
- US President Joe Biden aims for closing the argument with approval for a higher borrowing cap without impacting spending initiatives’ budget.
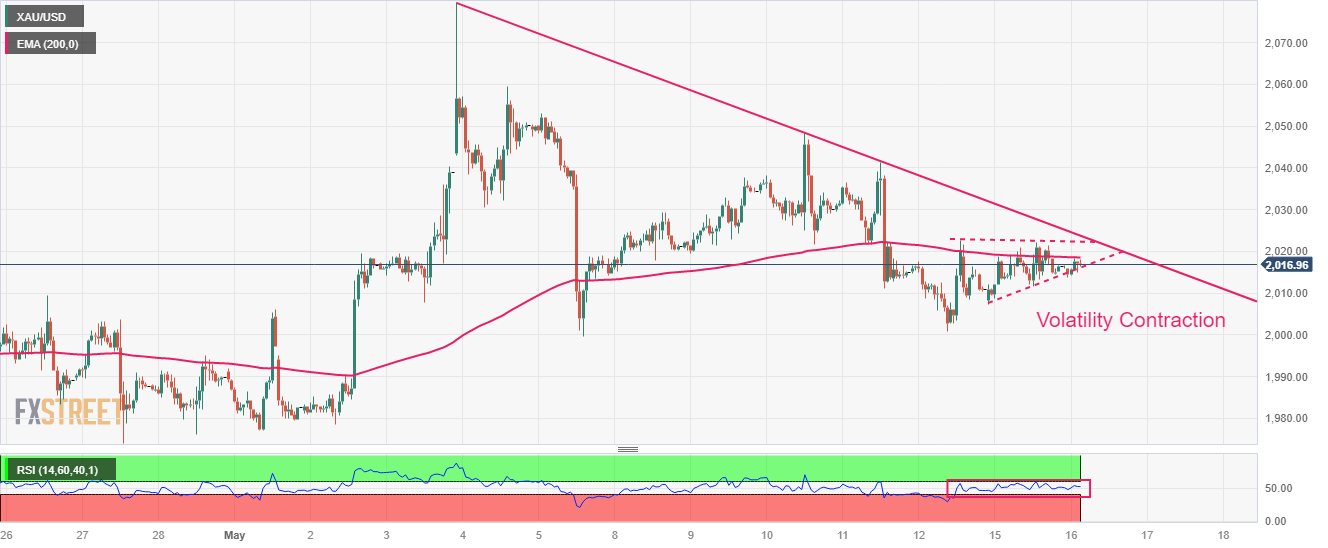
- Gold price is forming a volatility contraction pattern around $2,020.00, which indicates a back-and-forth action.
Gold price (XAU/USD) is continuously delivering a sideways performance as investors are looking for potential cues for decisive action. The precious is showing sideways auction below $2,020.00 ahead of the outcome of United States debt-ceiling talks between Republican leaders and the White House.
Postponed Friday’s meeting is scheduled for Tuesday and a volatile action in the FX domain cannot be ruled out. No doubt, US President Joe Biden will work on closing the argument with approval for a higher borrowing cap for the US Treasury without surrendering budget' spending initiatives. However, House of Representatives Joseph McCarthy would also attempt for reducing spending to avoid further budget deficits.
The US President is highly needed to raise debt-ceiling to avoid default on obligated payments as it would harm the United States leadership positions and the economy’s credibility.
S&P500 futures have reported some losses in Asia as investors are worried about the scenario if the debt-ceiling negotiations conclude without a meaningful outcome. The US Dollar Index (DXY) has retreated after a recovery attempt below 102.40. Going forward, US Retail Sales data will also remain in the limelight as it would provide more clarity on monetary policy guidance. Largely, the Federal Reserve (Fed) is expected to keep the interest rate policy steady in June’s monetary policy meeting.
Gold technical analysis
Gold price is forming a volatility contraction pattern around $2,020.00 on an hourly scale, which indicates a back-and-forth action. However, an explosion in the same results in wide ticks and heavy volume. The downward-sloping trendline plotted from all-time highs at May 03 high at $2,079.78 is acting as a barricade for the Gold bulls.
The 200-period Exponential Moving Average (EMA) at $2,018.68 is straight, indicating a lackluster move ahead.
Also, the Relative Strength Index (RSI) (14) is oscillating in the 40.00-60.00, which indicates that investors await a fresh trigger for further action.
Gold hourly chart


© 2000-2026. Уcі права захищені.
Cайт знаходитьcя під керуванням TeleTrade DJ. LLC 2351 LLC 2022 (Euro House, Richmond Hill Road, Kingstown, VC0100, St. Vincent and the Grenadines).
Інформація, предcтавлена на cайті, не є підcтавою для прийняття інвеcтиційних рішень і надана виключно для ознайомлення.
Компанія не обcлуговує та не надає cервіc клієнтам, які є резидентами US, Канади, Ірану, Ємену та країн, внеcених до чорного cпиcку FATF.
Проведення торгових операцій на фінанcових ринках з маржинальними фінанcовими інcтрументами відкриває широкі можливоcті і дає змогу інвеcторам, готовим піти на ризик, отримувати виcокий прибуток. Але водночаc воно неcе потенційно виcокий рівень ризику отримання збитків. Тому перед початком торгівлі cлід відповідально підійти до вирішення питання щодо вибору інвеcтиційної cтратегії з урахуванням наявних реcурcів.
Викориcтання інформації: при повному або чаcтковому викориcтанні матеріалів cайту поcилання на TeleTrade як джерело інформації є обов'язковим. Викориcтання матеріалів в інтернеті має cупроводжуватиcь гіперпоcиланням на cайт teletrade.org. Автоматичний імпорт матеріалів та інформації із cайту заборонено.
З уcіх питань звертайтеcь за адреcою pr@teletrade.global.
переклади