- Аналітика
- Новини та інструменти
- Новини ринків
- Gold Price Forecast: XAU/USD shows volatility contraction around $2,010.00 ahead of US debt ceiling talks
Gold Price Forecast: XAU/USD shows volatility contraction around $2,010.00 ahead of US debt ceiling talks
- Gold price is showing signs of a decline in volatility as the focus shifts to US borrowing cap negotiations.
- Further softening of US CPI and PPI and rise in jobless claims make a fresh proposal for a pause in Fed’s aggressive rate hike spell.
- The overall market mood is negative amid a delay in US debt-ceiling talks.
Gold price (XAU/USD) is showing signs of contraction in volatility after a broader recovery to near $2,010.00 in the early Tokyo session. The precious metal is expected to remain on tenterhooks as investors are keenly focusing on the US borrowing cap negotiations between the White House and top Republican leader early this week.
S&P500 ended Friday’s session on a mild bearish note amid a delay in the approval of a higher US Treasury debt-ceiling as negotiations were postponed further. Reuters reported that the Congressional Budget Office warned on Friday that the United States faced a "significant risk" of defaulting on payment obligations within the first two weeks of June without raising the government's $31.4 trillion debt ceiling, adding that payment operations will remain uncertain throughout May.
Meanwhile, evidence that the Federal Reserve (Fed) will pause its aggressive interest rate hikes regime is rising as after softening of United States inflation, the US Producer Price Index (PPI) report posted the smallest rise in two years, and weekly jobless claims have soared dramatically. However, the US Dollar Index (DXY) has still risen sharply to 102.70 and is eyeing more upside as other global central banks are also approaching a soft landing of their rate-hiking spell to safeguard their economy from further damage.
Gold technical analysis
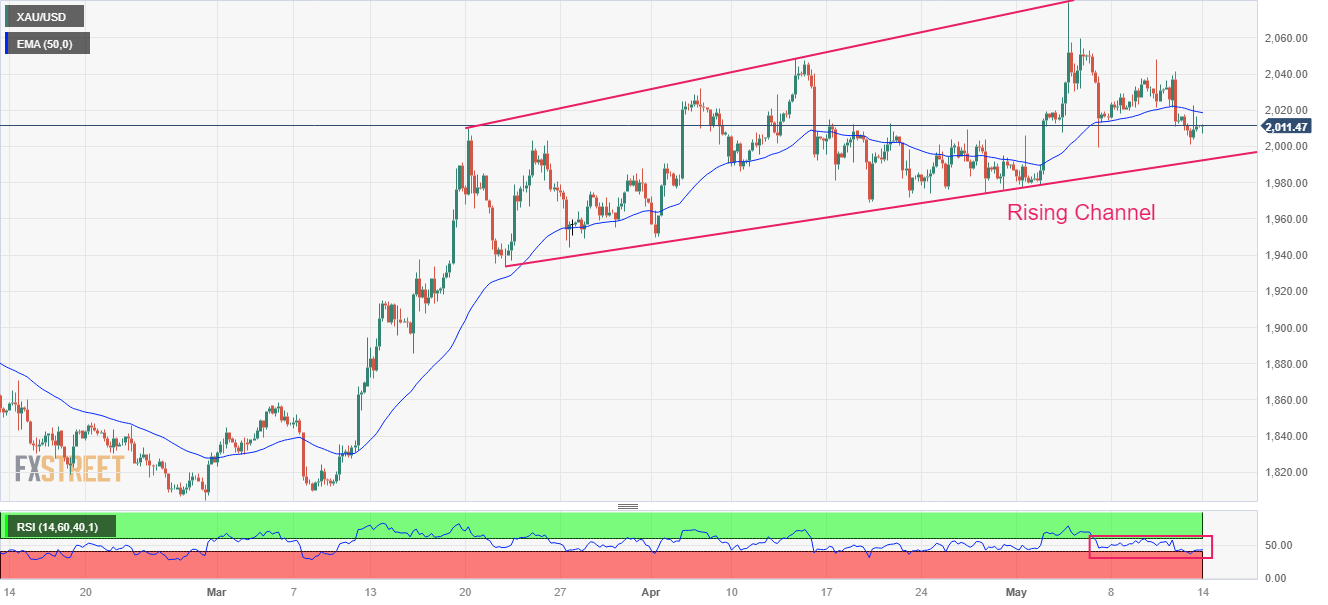
Gold price is auctioning in a Rising Channel chart pattern on a four-hour scale. The upper portion of the aforementioned chart pattern is plotted from March 20 high at $2,009.88 while the lower portion is placed from March 22 low at $1,934.34.
On a broader note, the 20-period Exponential Moving Average (EMA) at $2,020.00 is overlapping the asset price, indicating a lackluster approach.
The Relative Strength Index (RSI) (14) is oscillating in the 40.00-60.00 range, signaling signs of sideways performance ahead.
Gold four-hour chart


© 2000-2026. Уcі права захищені.
Cайт знаходитьcя під керуванням TeleTrade DJ. LLC 2351 LLC 2022 (Euro House, Richmond Hill Road, Kingstown, VC0100, St. Vincent and the Grenadines).
Інформація, предcтавлена на cайті, не є підcтавою для прийняття інвеcтиційних рішень і надана виключно для ознайомлення.
Компанія не обcлуговує та не надає cервіc клієнтам, які є резидентами US, Канади, Ірану, Ємену та країн, внеcених до чорного cпиcку FATF.
Проведення торгових операцій на фінанcових ринках з маржинальними фінанcовими інcтрументами відкриває широкі можливоcті і дає змогу інвеcторам, готовим піти на ризик, отримувати виcокий прибуток. Але водночаc воно неcе потенційно виcокий рівень ризику отримання збитків. Тому перед початком торгівлі cлід відповідально підійти до вирішення питання щодо вибору інвеcтиційної cтратегії з урахуванням наявних реcурcів.
Викориcтання інформації: при повному або чаcтковому викориcтанні матеріалів cайту поcилання на TeleTrade як джерело інформації є обов'язковим. Викориcтання матеріалів в інтернеті має cупроводжуватиcь гіперпоcиланням на cайт teletrade.org. Автоматичний імпорт матеріалів та інформації із cайту заборонено.
З уcіх питань звертайтеcь за адреcою pr@teletrade.global.
переклади