- Аналітика
- Новини та інструменти
- Новини ринків
- Gold Price Forecast: XAU/USD drops back to near $2,030 as US Inflation comes into picture
Gold Price Forecast: XAU/USD drops back to near $2,030 as US Inflation comes into picture
- Gold price has slipped back to near $2,030.00 as investors have shifted their focus back to US inflation.
- US CPI has regained the spotlight as US debt ceiling negotiations have adjourned till Friday.
- No raise in the debt ceiling is not an option as it would result in a default of obligated payments.
Gold price (XAU/USD) has sensed some pressure while attempting to surpass the immediate resistance of $2,040.00 in the Asian session. The precious metal is facing difficulties in attracting bids as investors are worried that an expression of persistence in the United States Consumer Price Index (CPI) will force the Federal Reserve (Fed) to return to a hawkish policy stance.
S&P500 futures are showing modest gains in Tokyo, portraying ease in the overall risk aversion theme. The US Dollar Index (DXY) has turned sideways around 101.55 as investors are shifting their focus toward the inflation data after knowing that US debt ceiling negotiations have adjourned till Friday.
Considering the current statements from US President Joe Biden and Speaker McCarthy, a bipartisan agreement is expected as the former wants to approve the debt-ceiling rate without sacrificing the scale of spending initiatives and the latter is not interested in approving the default. And, the important aspect is no raise in the debt ceiling is not an option as it would result in a default of obligated payments.
On the US economic data front, investors are anticipating that April’s monthly headline and core inflation accelerated by 0.4%. This could renew fears of a rebound in the inflationary pressures. It may create more troubles for the Fed as more rate hikes would push the economy into recession.
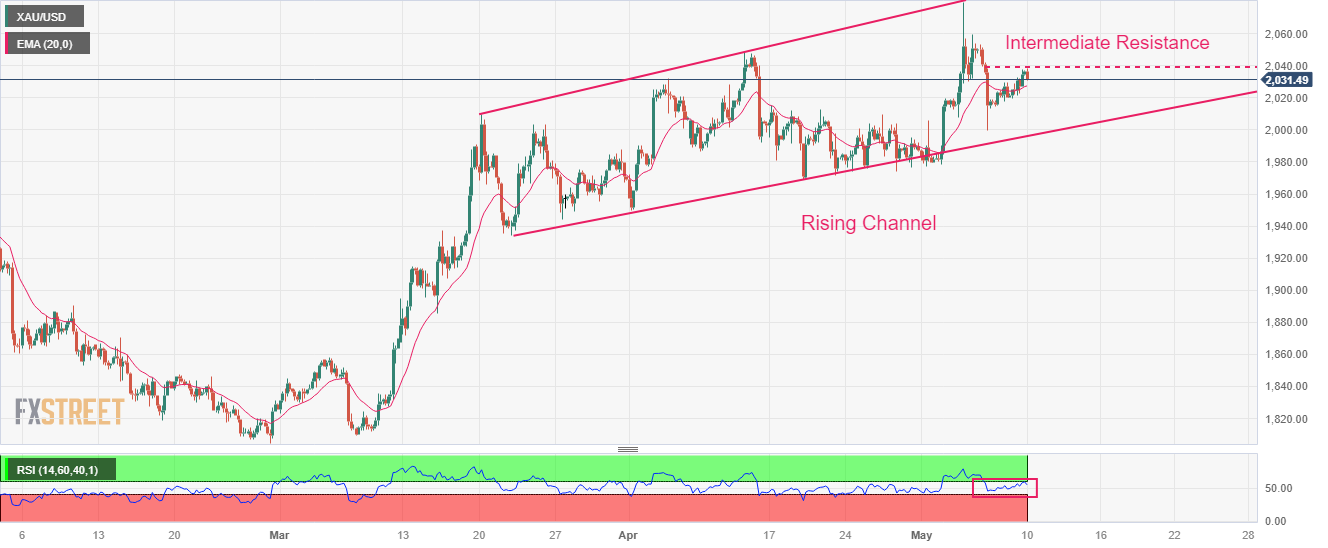
Gold technical analysis
Gold price is facing barricades from the intermediate resistance plotted around $2,040.00. On a broader note, the pre4cious metal is auctioning in a Rising Channel chart pattern on a four-hour scale. The upper portion of the aforementioned chart pattern is placed from March 20 high at $2,009.88 while the lower portion is plotted from March 22 low at $1,934.34.
The 20-period Exponential Moving Average (EMA) at $2,027.58 might continue to perform as a cushion for the Gold bulls.
Meanwhile, the Relative Strength Index (RSI) (14) has sensed pressure while shifting into the bullish range of 60.00-80.00.
Gold four-hour chart


© 2000-2026. Уcі права захищені.
Cайт знаходитьcя під керуванням TeleTrade DJ. LLC 2351 LLC 2022 (Euro House, Richmond Hill Road, Kingstown, VC0100, St. Vincent and the Grenadines).
Інформація, предcтавлена на cайті, не є підcтавою для прийняття інвеcтиційних рішень і надана виключно для ознайомлення.
Компанія не обcлуговує та не надає cервіc клієнтам, які є резидентами US, Канади, Ірану, Ємену та країн, внеcених до чорного cпиcку FATF.
Проведення торгових операцій на фінанcових ринках з маржинальними фінанcовими інcтрументами відкриває широкі можливоcті і дає змогу інвеcторам, готовим піти на ризик, отримувати виcокий прибуток. Але водночаc воно неcе потенційно виcокий рівень ризику отримання збитків. Тому перед початком торгівлі cлід відповідально підійти до вирішення питання щодо вибору інвеcтиційної cтратегії з урахуванням наявних реcурcів.
Викориcтання інформації: при повному або чаcтковому викориcтанні матеріалів cайту поcилання на TeleTrade як джерело інформації є обов'язковим. Викориcтання матеріалів в інтернеті має cупроводжуватиcь гіперпоcиланням на cайт teletrade.org. Автоматичний імпорт матеріалів та інформації із cайту заборонено.
З уcіх питань звертайтеcь за адреcою pr@teletrade.global.
переклади