- Analiza
- Novosti i instrumenti
- Vesti sa tržišta
Forex-novosti i prognoze od 31-10-2019
| Time | Country | Event | Period | Previous value | Forecast |
|---|---|---|---|---|---|
| 00:30 | Australia | Producer price index, y/y | Quarter III | 2% | 1.8% |
| 00:30 | Australia | Producer price index, q / q | Quarter III | 0.4% | 0.3% |
| 00:30 | Japan | Manufacturing PMI | October | 48.9 | 48.5 |
| 01:45 | China | Markit/Caixin Manufacturing PMI | October | 51.4 | 51.0 |
| 07:30 | Switzerland | Retail Sales (MoM) | September | -1.6% | |
| 07:30 | Switzerland | Retail Sales Y/Y | September | -1.4% | |
| 07:30 | Switzerland | Consumer Price Index (MoM) | October | -0.1% | |
| 07:30 | Switzerland | Consumer Price Index (YoY) | October | 0.1% | 0% |
| 08:30 | Switzerland | Manufacturing PMI | October | 44.6 | 45 |
| 09:30 | United Kingdom | Purchasing Manager Index Manufacturing | October | 48.3 | 48.1 |
| 12:30 | U.S. | Manufacturing Payrolls | October | -2 | -50 |
| 12:30 | U.S. | Government Payrolls | October | 22 | |
| 12:30 | U.S. | Average workweek | October | 34.4 | 34.4 |
| 12:30 | U.S. | Labor Force Participation Rate | October | 63.2% | 63.2% |
| 12:30 | U.S. | Private Nonfarm Payrolls | October | 114 | 80 |
| 12:30 | U.S. | Average hourly earnings | October | 0% | 0.3% |
| 12:30 | U.S. | Nonfarm Payrolls | October | 136 | 85 |
| 12:30 | U.S. | Unemployment Rate | October | 3.5% | 3.6% |
| 13:45 | U.S. | Manufacturing PMI | October | 51.1 | |
| 14:00 | U.S. | Construction Spending, m/m | September | 0.1% | 0.2% |
| 14:00 | U.S. | ISM Manufacturing | October | 47.8 | 48.9 |
| 16:00 | U.S. | FOMC Member Williams Speaks | |||
| 17:00 | U.S. | Baker Hughes Oil Rig Count | November | 696 | |
| 17:00 | U.S. | FOMC Member Clarida Speaks | |||
| 17:00 | U.S. | FOMC Member Quarles Speaks | |||
| 18:30 | U.S. | FOMC Member Williams Speaks |
Major US stock indices fell slightly, as concerns that the US and China might not close the deal outweighed the solid reporting of Apple (AAPL) and Facebook (FB).
On Thursday, Bloomberg News reported, citing anonymous sources, that Chinese officials question the possibility of a comprehensive long-term trade deal with Washington and US President Donald Trump. The article also notes that Chinese officials are worried about Trump's “impulsive nature” and the risk of rejecting even an interim deal.
However, Trump said on Twitter that the two countries will soon announce a new venue where the Phase 1 trade deal will be concluded after Chile’s authorities canceled the APEC summit on November 16-17.
Recent reports have heightened uncertainty about the prospects for a trade deal between the US and China, outweighing solid corporate segment reporting, including giants such as Apple (AAPL) and Facebook (FB), and the Fed’s third rate cut this year on the eve.
Market participants also studied US consumer income / expense data for September. According to a report from the Department of Commerce, consumer spending, which accounts for more than two-thirds of US economic activity, rose 0.2% last month as households stepped up car purchases and began to spend more on health care. August data was revised to show consumer spending growth of 0.2% instead of 0.1% growth earlier. Economists had forecast that spending would rise 0.2% last month. Personal incomes rose 0.3% in September due to higher income for farm owners, which is likely due to payments to farmers affected by the US-China trade war.
Almost all DOW components completed trading in the red (25 of 30). The outsider was Walgreens Boots Alliance (WBA; -2.26%). The biggest gainers were Apple Inc. (AAPL; + 2.14%).
Almost all S&P sectors recorded a decline. Only the utilities sector (+ 0.2%) and the consumer goods sector (+ 0.1%) grew. The conglomerate sector showed the largest decrease (-1.2%).
At the time of closing:
Dow 27,046.23 -140.46 -0.52%
S&P 500 3,037.56 -9.21 -0.30%
Nasdaq 100 8,292.36 -11.61 -0.14%
| Time | Country | Event | Period | Previous value | Forecast |
|---|---|---|---|---|---|
| 00:30 | Australia | Producer price index, y/y | Quarter III | 2% | 1.8% |
| 00:30 | Australia | Producer price index, q / q | Quarter III | 0.4% | 0.3% |
| 00:30 | Japan | Manufacturing PMI | October | 48.9 | 48.5 |
| 01:45 | China | Markit/Caixin Manufacturing PMI | October | 51.4 | 51.0 |
| 07:30 | Switzerland | Retail Sales (MoM) | September | -1.6% | |
| 07:30 | Switzerland | Retail Sales Y/Y | September | -1.4% | |
| 07:30 | Switzerland | Consumer Price Index (MoM) | October | -0.1% | |
| 07:30 | Switzerland | Consumer Price Index (YoY) | October | 0.1% | 0% |
| 08:30 | Switzerland | Manufacturing PMI | October | 44.6 | 45 |
| 09:30 | United Kingdom | Purchasing Manager Index Manufacturing | October | 48.3 | 48.1 |
| 12:30 | U.S. | Manufacturing Payrolls | October | -2 | -50 |
| 12:30 | U.S. | Government Payrolls | October | 22 | |
| 12:30 | U.S. | Average workweek | October | 34.4 | 34.4 |
| 12:30 | U.S. | Labor Force Participation Rate | October | 63.2% | 63.2% |
| 12:30 | U.S. | Private Nonfarm Payrolls | October | 114 | 80 |
| 12:30 | U.S. | Average hourly earnings | October | 0% | 0.3% |
| 12:30 | U.S. | Nonfarm Payrolls | October | 136 | 85 |
| 12:30 | U.S. | Unemployment Rate | October | 3.5% | 3.6% |
| 13:45 | U.S. | Manufacturing PMI | October | 51.1 | |
| 14:00 | U.S. | Construction Spending, m/m | September | 0.1% | 0.2% |
| 14:00 | U.S. | ISM Manufacturing | October | 47.8 | 48.9 |
| 16:00 | U.S. | FOMC Member Williams Speaks | |||
| 17:00 | U.S. | Baker Hughes Oil Rig Count | November | 696 | |
| 17:00 | U.S. | FOMC Member Clarida Speaks | |||
| 17:00 | U.S. | FOMC Member Quarles Speaks | |||
| 18:30 | U.S. | FOMC Member Williams Speaks |
- Says exemptions to negative rates would reduce their effectiveness
- Cites dangers of shrinking interest rate spread
- Negative rates and readiness to intervene in FX still essential to keep pressure on franc
House Democrats on Thursday passed a resolution outlining the next phase of the impeachment inquiry into President Donald Trump, CNBC reports.
The 232-196 vote passed nearly along party lines, with no Republicans voting for the resolution. Two Democrats joined Republicans in voting against it. The lone Independent congressman, Rep. Justin Amash of Michigan, voted for the impeachment inquiry resolution.
The measure, which sketches out guidelines for public hearings in the inquiry and the president’s participation in the process, marks the first time lawmakers’ votes will be counted on matters related to the Trump impeachment process.
The vote followed a morning of debate on the floor of the House, where Democrats attacked Trump’s alleged abuses of power and Republicans lambasted the way the impeachment inquiry was being conducted.
Analysts at TD Securities (TDS) provided their view on Thursday's release of the monthly Canadian GDP report, which fell short of market expectations and came in to show a modest 0.1% growth in August as compared to 0.2% expected.
- "Industry-level GDP rose by 0.1% in August, slightly below the market consensus for 0.2% m/m. However, details were slightly more constructive, with output higher in 14 of 20 industries, and we continue to track Q3 GDP (1.2%) near BoC projections (1.3%).
- Despite the headline miss, this report is unlikely to weigh heavily on the BoC's outlook. Markets are now pricing in a 33% chance of a December rate cut, and we remain comfortable with our call for the Bank to wait until January before shifting off the sidelines.
- Rates: Modest market reaction following the release, however, this follows a very large move lower in the Canadian rates following yesterday's BoC announcement. This report confirms the buy/receive Canadian rates narrative."
MNI Indicators’
report revealed on Thursday that business activity in Chicago contracted further
this month.
The MNI Chicago Business Barometer, also known as Chicago purchasing manager's index (PMI) came in at 43.2 in October, down from an unrevised 47.1 in September. That was the lowest reading since December 2015.
Economists had forecast the index to increase
to 48.0.
A reading above
50 indicates improving conditions, while a reading below this level shows
worsening of the situation.
Nathan Janzen, the senior economist at the Royal Bank of Canada (RBC), notes the 0.1% increase in the Canadian GDP was a touch lower than markets expected, but underlying details were arguably a touch stronger.
- "Commodities output was soft with oil & gas extraction reportedly temporarily restrained by maintenance shutdowns for a second consecutive month. To be sure, the oil & gas sector isn't expected to be a major source of near-term growth as long as transportation constraints out of western Canada remain in place, but the monthly drop in July is probably more noise than signal. A drop in utilities output -tied to unusually cool August weather - will also eventually be unwound. Outside of those components, GDP increased 0.3% in August.
- Headline GDP growth will still be softer in Q3 than in Q2 with our tracking pointing to a 1 1/2% increase. That is similar to the Bank of Canada's call for a 1.3% gain. But underlying details still leave the economy to-date looking relatively solid. The goods sector has looked soft, but a tick up in manufacturing output in August still leaves Canada looking relatively resilient relative to other advanced economies. And there remains little evidence that softer goods activity to-date is spilling over into broader Canadian labour market conditions or more fundamentally into the much-larger service-sector. That will do little to quell concerns about the go-forward outlook, which are still centered around the impact of the US-China trade war. But current economic data still leaves the economy looking okay for now."
Statistics
Canada announced on Thursday that the country’s gross domestic product (GDP)
edged up 0.1 percent m-o-m in August, following no change in July.
That was below
economists’ forecast for a 0.2 percent m-o-m growth.
In y-o-y terms,
the Canadian GDP rose 1.3 percent in August.
According to
the report, the manufacturing sector grew 0.5 percent m-o-m in August,
following essentially no growth in July. Meanwhile,
the construction
sector dropped 0.7 percent m-o-m, the transportation and warehousing sector
contracted 0.5 percent m-o-m and manufacturing edged down 0.1 percent m-o-m. At
the same time, utilities increased 1.5 percent m-o-m in July, while the
wholesale sector rose 1.1 percent m-o-m and retail trade edged up 0.1 percent
m-o-m. The professional, scientific and technical services sector was up 0.7
percent m-o-m, continuing its uninterrupted growth since February 2018. The
finance and insurance sector expanded 0.5 percent m-o-m in August, recording
advance for the fourth month in a row. The construction sector increased 0.3
percent m-o-m in August, the third gain in four months. The mining, quarrying
and oil and gas extraction sector inched up 0.1 percent m-o-m in August,
following a 3.6 percent
m-o-m decrease in July. At the same time, wholesale trade fell 1.3 percent
m-o-m in August, more than offsetting July's growth, while utilities dropped
1.5 percent m-o-m in August.
Overall,
goods-producing industries rose 0.2 percent m-o-m in August, while,
services-producing industries increased 0.1 percent m-o-m.
U.S. stock-index futures traded slightly lower on Thursday, as increased uncertainty around a potential trade deal between the U.S. and China overshadowed strong earnings reports.
Global Stocks:
Index/commodity | Last | Today's Change, points | Today's Change, % |
Nikkei | 22,927.04 | +83.92 | +0.37% |
Hang Seng | 26,906.72 | +239.01 | +0.90% |
Shanghai | 2,929.06 | -10.26 | -0.35% |
S&P/ASX | 6,663.40 | -26.10 | -0.39% |
FTSE | 7,265.39 | -65.39 | -0.89% |
CAC | 5,750.45 | -15.42 | -0.27% |
DAX | 12,905.04 | -5.19 | -0.04% |
Crude oil | $54.44 | -1.13% | |
Gold | $1,510.50 | +0.92% |
(company / ticker / price / change ($/%) / volume)
3M Co | MMM | 167.3 | -1.07(-0.64%) | 2536 |
ALCOA INC. | AA | 21.1 | -0.19(-0.89%) | 1151 |
ALTRIA GROUP INC. | MO | 46.82 | 0.86(1.87%) | 59691 |
Amazon.com Inc., NASDAQ | AMZN | 1,776.84 | -3.15(-0.18%) | 17769 |
Apple Inc. | AAPL | 247.25 | 3.99(1.64%) | 607594 |
Boeing Co | BA | 344.9 | -1.16(-0.34%) | 7019 |
Caterpillar Inc | CAT | 139.24 | -1.10(-0.78%) | 3935 |
Chevron Corp | CVX | 116.2 | -0.16(-0.14%) | 392 |
Cisco Systems Inc | CSCO | 47.46 | -0.10(-0.21%) | 9289 |
Citigroup Inc., NYSE | C | 72.45 | -0.52(-0.71%) | 3940 |
E. I. du Pont de Nemours and Co | DD | 66.3 | 0.71(1.08%) | 1230 |
Exxon Mobil Corp | XOM | 67.7 | -0.02(-0.03%) | 22275 |
Facebook, Inc. | FB | 196 | 7.75(4.12%) | 843341 |
FedEx Corporation, NYSE | FDX | 155.2 | -0.64(-0.41%) | 508 |
Ford Motor Co. | F | 8.57 | 0.03(0.35%) | 177424 |
Freeport-McMoRan Copper & Gold Inc., NYSE | FCX | 9.96 | -0.17(-1.68%) | 9126 |
General Electric Co | GE | 9.99 | -0.12(-1.19%) | 193109 |
General Motors Company, NYSE | GM | 37.88 | -0.03(-0.08%) | 224 |
Goldman Sachs | GS | 214.4 | -1.41(-0.65%) | 1686 |
Google Inc. | GOOG | 1,260.00 | -1.29(-0.10%) | 2990 |
Home Depot Inc | HD | 236.5 | 0.26(0.11%) | 422 |
Intel Corp | INTC | 56.28 | -0.32(-0.57%) | 11075 |
International Business Machines Co... | IBM | 134.75 | -0.50(-0.37%) | 1151 |
International Paper Company | IP | 43.38 | 0.73(1.71%) | 7620 |
Johnson & Johnson | JNJ | 132.9 | 0.06(0.05%) | 3883 |
JPMorgan Chase and Co | JPM | 125 | -0.73(-0.58%) | 8500 |
McDonald's Corp | MCD | 197.07 | 0.18(0.09%) | 4349 |
Merck & Co Inc | MRK | 86.1 | -0.12(-0.14%) | 2235 |
Microsoft Corp | MSFT | 144.03 | -0.58(-0.40%) | 69556 |
Nike | NKE | 90.17 | -0.02(-0.02%) | 4043 |
Pfizer Inc | PFE | 38.4 | -0.08(-0.21%) | 4470 |
Procter & Gamble Co | PG | 124.95 | 0.01(0.01%) | 6612 |
Starbucks Corporation, NASDAQ | SBUX | 86.74 | 2.55(3.03%) | 26977 |
Tesla Motors, Inc., NASDAQ | TSLA | 313.33 | -1.68(-0.53%) | 34165 |
Twitter, Inc., NYSE | TWTR | 29.45 | -0.41(-1.37%) | 229061 |
Verizon Communications Inc | VZ | 60.63 | -0.19(-0.31%) | 7421 |
Visa | V | 179.02 | -0.23(-0.13%) | 2149 |
Walt Disney Co | DIS | 129.78 | 0.18(0.14%) | 7320 |
Yandex N.V., NASDAQ | YNDX | 33.54 | -0.03(-0.09%) | 1830 |
The data from
the Labor Department revealed on Thursday the number of applications for
unemployment benefits rose more than forecast last week, but the trend in
claims remained consistent with strong labor market conditions.
According to
the report, the initial claims for unemployment benefits increased by 5,000 to
a seasonally adjusted 218,000 for the week ended October 26.
Economists had
expected 215,000 new claims last week.
Claims for the
prior week were revised upwardly to 213,000 from the initial estimate of 212,000.
Meanwhile, the
four-week moving average of claims decreased by 500 to 214,750.
The Commerce
Department reported on Thursday that consumer spending in the U.S. rose 0.2
percent m-o-m in September, following a revised 0.2 percent m-o-m gain in August
(originally a 0.1 percent m-o-m advance). Economists had forecast the reading
to show a 0.2 percent m-o-m growth.
Meanwhile,
consumer income increased 0.3 percent m-o-m in September, following a revised
0.5 percent m-o-m gain in the previous month (originally a 0.4 percent m-o-m climb).
Economists had forecast a 0.3 percent m-o-m advance.
The September
increase in personal income primarily reflected gains in personal interest
income, farm proprietors' income, and government social benefits to persons.
The personal
consumption expenditures (PCE) price index, excluding the volatile categories
of food and energy, which is the Fed's preferred inflation measure, was
unchanged m-o-m in September after a 0.1 percent m-o-m increase in the prior
month. Economists had projected the index would rise 0.1 percent m-o-m.
In the 12 months
through September, the core PCE increased 1.7 percent, following an unrevised
1.8 percent growth in the 12 months through August. Economists had forecast a
gain of 1.7 percent y-o-y.
The renewed upside momentum in both the Sterling and the shared currency keeps the sideline mood unchanged in EUR/GBP above the 0.8600-handle.
The European cross is navigating within a sideline theme since mid-October, mostly above the 0.8600-mark and capped by the 0.8670-region, where sits a Fibo retracement of the May-August bull run.
Following the Parliament vote earlier in the week, the UK will hold general elections in December for the first time since 1923. Against this backdrop, and always following the latest polls, the Conservative Party keeps leading the vote intentions among UK citizens.
On the data universe, advanced inflation figures in Euroland showed the headline CPI is seen rising at an annualized 0.7% in October and 1.1% when it comes to prices stripping food and energy costs. Additional data saw flash GDP prints expecting the economy in the bloc expanding 0.2% inter-quarter in Q3 and 1.1% from a year earlier.
On Friday, the US Non-farm Payrolls and the ISM Manufacturing are likely to drive the mood in the global markets along with headlines from the US-China trade front.
Following Tuesday’s vote in the House of Commons, the UK is heading towards December elections for the first time in nearly a century. That said, the quid is expected to face increasing volatility in tandem with results from poll estimates and headlines in either direction prior to the elections’ day. On the BoE’s side, there are no fresh updates since the latest ones, which reiterated the probability that the next move on rates could be a cut.
The cross is losing 0.34% at 0.8613 and a drop below 0.8574 (monthly low Oct.17) would expose 0.8488 (monthly low May 6) and then 0.8474 (2019 low Mar.12). On the other hand, the next up barrier emerges at 0.8676 (high Oct.24) followed by 0.8811 (200-day SMA) and finally 0.8906 (50% Fibo of the May-August rally).
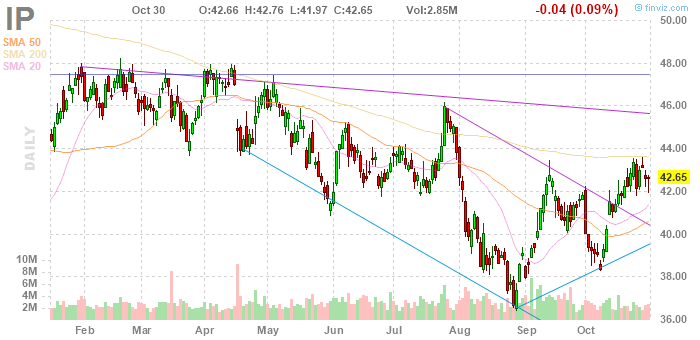
Int'l Paper (IP) reported Q3 FY 2019 earnings of $1.09 per share (versus $1.56 in Q3 FY 2018), beating analysts’ consensus estimate of $0.99.
The company’s quarterly revenues amounted to $5.568 bln (-5.6% y/y), missing analysts’ consensus estimate of $5.633 bln.
IP rose to $43.03 (+0.89%) in pre-market trading.
Bert Colijn, a Senior Eurozone Economist at ING, notes the eurozone economy didn’t slow further in 3Q, which is already something to be relieved about in the current environment of uncertainty and poor monthly data.
- "Still, taking the 0.2% growth rate together with a sluggish start to 4Q and slightly higher unemployment in September reveals an economy in need of positive news about the trade environment to keep from sliding further.
- On a positive note, the fact that the economy hasn't stagnated yet indicates the problems the eurozone faces are still relatively contained. While concerns about spillovers grow larger, the longer the industrial slump continues, the service sector is still growing at a moderate pace. Moreover, Europe’s industrial problems seem to be rather centred in Germany for the moment as early country data has confirmed. Upside surprises to French, Spanish and Belgian GDP boosted the overall figure, but do raise concerns about how Germany has performed in 3Q – data to be released in November.
- The slightly better than expected 3Q data has not had much of an impact on inflation though. Headline inflation dropped to 0.7% in October on falling energy prices, but do expect a bounce back over the coming months. Interestingly enough, core inflation came out better-than-expected and ticked up to 1.1%. Take that improvement with caution though as pipeline inflation does not seem to warrant a quick recovery in core inflation for the moment."
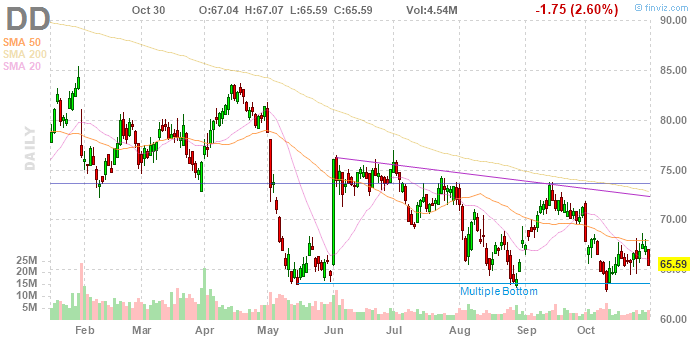
DuPont (DD) reported Q3 FY 2019 earnings of $0.96 per share, beating analysts’ consensus estimate of $0.95.
The company’s quarterly revenues amounted to $5.426 bln (-4.5% y/y), generally in line with analysts’ consensus estimate of $5.435 bln.
The company also issued in-line guidance for FY 2019, projecting EPS of $3.77-3.82 compared to its prior guidance of $3.75-3.85 and analysts’ consensus estimate of $3.81.
DD rose to $66.30 (+1.08%) in pre-market trading.
Altria (MO) reported Q3 FY 2019 earnings of $1.19 per share (versus $1.08 in Q3 FY 2018), beating analysts’ consensus estimate of $1.15.
The company’s quarterly revenues amounted to $5.412 bln (+2.3% y/y), beating analysts’ consensus estimate of $5.343 bln.
The company also reaffirmed guidance for FY 2019, projecting EPS of $4.19-4.27 versus analysts’ consensus estimate of $4.19.
MO rose to $46.70 (+1.61%) in pre-market trading.
Imre Speizer, the Head of NZ Strategy at Westpac, notes the NZD/USD retains upward momentum and has potential to test 0.6435 and then 0.6500 during the week ahead.
- "Economic momentum has been positive recently. Today’s update on business confidence was mixed – still weak but showing signs of bottoming.
- The highlight of next week’s NZ calendar is the Q3 labour data. Unemployment should rebound from Q2’s abnormally low 3.9%, while average hourly earnings should maintain a solid 1.0% quarterly pace.
- In response to the improved NZ data pulse, markets have significantly pared the chances of a 13 Nov rate cut, from around 115% three weeks ago to 55% currently. Westpac economists have shifted the forecast November OCR cut to
- February.
- Multi-month, we remain bearish, targeting 0.6200 by January. We expect the NZD/USD to be weighed down by a stronger USD which should continue to benefit from trade wars and global risks."
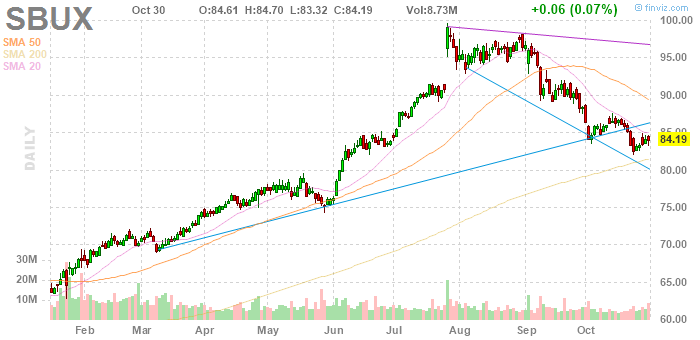
Starbucks (SBUX) reported Q4 FY 2019 earnings of $0.70 per share (versus $0.62 in Q4 FY 2018), in line with analysts’ consensus estimate.
The company’s quarterly revenues amounted to $6.747 bln (+7.0% y/y), generally in line with analysts’ consensus estimate of $6.682 bln.
The company also issued guidance for FY 2020, projecting EPS of $3.00-3.05 versus analysts’ consensus estimate of $3.08 and revenue growth of 6-8% (implying $28.1-2.8.6 bln) versus analysts’ consensus estimate of $28.44 bln.
SBUX rose to $86.00 (+2.15%) in pre-market trading.
FX Strategists at UOB Group noted USD/JPY could still move higher to the 109.30-region in the next weeks.
- "24-hour view: Other than a brief spike to 109.28 overnight, nothing much has changed on the outlook for JPY. Our expectations of a consolidation phase remain intact and from here, USD is still expected to trade sideways between 108.70 and 109.10.
- Next 1-3 weeks: USD eked out a fresh high of 109.06 before easing off to end little changed at 108.87 (-0.06%). We continue to hold the same view from yesterday (29 Oct, spot at 109.00) wherein USD is expected to “trade with an upside towards 109.30”. As highlighted, the prospect for a sustained advance above this level is not that high but it would continue to increase as long as 108.35 (‘strong support’ level) is intact. Looking ahead, the next resistance above 109.30 is at 109.60 followed by 110.00."
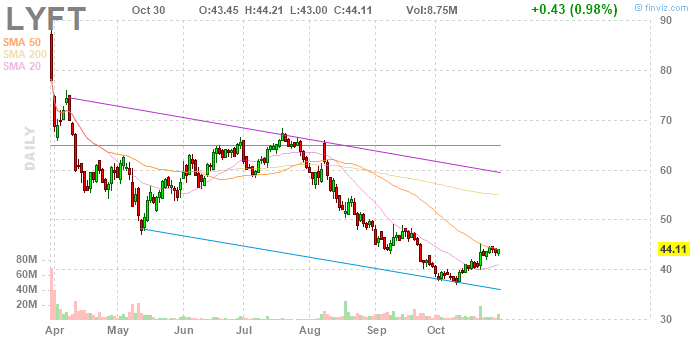
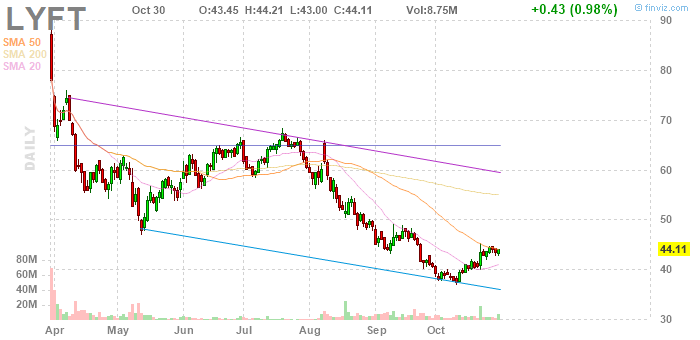
Lyft (LYFT) reported Q3 FY 2019 loss of $0.41 per share, better than analysts’ consensus estimate of -$0.73.
The company’s quarterly revenues amounted to $0.956 bln (+63.4% y/y), beating analysts’ consensus estimate of $0.915 bln.
The company also issued upside guidance for Q4 FY 2019, projecting revenues of $0.975-0.985 bln versus analysts’ consensus estimate of $0.943 bln.
LYFT rose to $45.85 (+3.94%) in pre-market trading.
Facebook (FB) reported Q3 FY 2019 earnings of $2.12 per share (versus $1.76 in Q3 FY 2018), beating analysts’ consensus estimate of $1.88.
The company’s quarterly revenues amounted to $17.652 bln (+28.6% y/y), beating analysts’ consensus estimate of $17.350 bln.
FB rose to $195.77 (+3.99%) in pre-market trading.
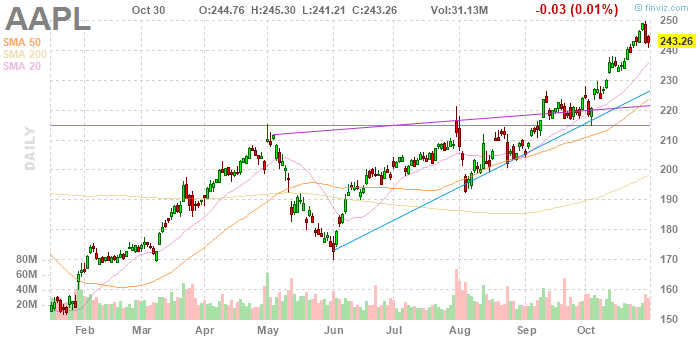
Apple (AAPL) reported Q4 FY 2019 earnings of $3.03 per share (versus $2.91 in Q4 FY 2018), beating analysts’ consensus estimate of $2.83.
The company’s quarterly revenues amounted to $64.040 bln (+1.8% y/y), beating analysts’ consensus estimate of $62.862 bln.
The company also issued upside guidance for Q1 FY 2020, projecting revenues of $85.5-89.5 bln versus analysts’ consensus estimate of $86.21 bln and gross margins of 37.5-38.5% versus analysts’ consensus estimate of 37.8% and 38.0% last year.
AAPL rose to $248.80 (+2.28%) in pre-market trading.
Cable remains within a consolidative theme and could still attempt a test of 1.30, suggested Karen Jones, Team Head FICC Technical Analysis Research at Commerzbank.
“GBP/USD is consolidating above near term support offered by the 1.2784 25th June high. This leaves the market well placed to tackle psychological resistance at 1.30. Dips are indicated to hold circa 1.2760/00 and should recover from here. Directly above here we have the 200 week ma at 1.3138 and the 1.3187 May high and these remain our short term targets. For now, provided dips lower hold over 1.2582 (20th September high) an immediate upside bias is maintained. The 1.3187 May high guards the 1.3382 2019 high. Below 1.2582 lies the 1.2382 17th July low and the 1.2285 uptrend. The near term uptrend guards 1.2196/94”
The European Central Bank's monetary policy will remain expansionary to sustain demand, while growth- friendly fiscal policies in the eurozone could help speed a return to price stability, ECB Governing Council member Ignazio Visco said.
"Eurozone inflation remains at an excessively low level and the risk of a de-anchoring of medium-long term expectations is appearing," Visco, who is governor of the Bank of Italy, said.
In September, euro zone inflation reached 0.8% year-on-year, its slowest pace since 2016.
The ECB last month announced a package of measures that includes restarting bond purchases at a rate of 20 billion euros (£17.26 billion) a month from November.
According to a flash estimate from Eurostat, euro area annual inflation is expected to be 0.7% in October 2019, down from 0.8% in September. Meanwhile, the core figures unexpectedly accelerate to 1.1% in the reported month when compared to 1.0% expectations and 1.0% previous.
Looking at the main components of euro area inflation, services is expected to have the highest annual rate in October (1.6%, compared with 1.5% in September), followed by food, alcohol & tobacco (1.6%, stable compared with September), non-energy industrial goods (0.3%, compared with 0.2% in September) and energy (-3.2%, compared with -1.8% in September).
According to the report from Eurostat, seasonally adjusted GDP rose by 0.2% in the euro area (EA19) and by 0.3% in the EU28 during the third quarter of 2019, compared with the previous quarter. In the second quarter of 2019, GDP had grown by 0.2% in both zones.
Compared with the same quarter of the previous year, seasonally adjusted GDP rose by 1.1% in the euro area and by 1.4% in the EU28 in the third quarter of 2019, after +1.2% in the euro area and +1.4% in the EU28 in the previous quarter.
A separate report from Eurostat showed, the euro area (EA19) seasonally-adjusted unemployment rate was 7.5% in September 2019, stable compared with August 2019 and down from 8.0% in September 2018. This is the lowest rate recorded in the euro area since July 2008. The EU28 unemployment rate was 6.3% in September 2019, stable compared with August 2019 and down from 6.7% in September 2018. This remains the lowest rate recorded in the EU28 since the start of the EU monthly unemployment series in January 2000.
Eurostat estimates that 15.635 million men and women in the EU28, of whom 12.335 million in the euro area, were unemployed in September 2019. Compared with August 2019, the number of persons unemployed increased by 48 000 in the EU28 and by 33 000 in the euro area. Compared with September 2018, unemployment fell by 889 000 in the EU28 and by 738 000 in the euro area.
Chinese officials have doubts about whether it is possible to reach a comprehensive long-term trade deal with Washington and U.S. President Donald Trump, Bloomberg reported, citing unnamed sources.
Chinese officials have told visitors to Beijing and others in private conversations that China will not budge on the thorniest issues, the report said.
Chinese officials are also concerned about Trump's impulsive nature and the risk that he could back out of even the interim deal both sides are seeking to sign in the coming weeks, Bloomberg said.
Bill Diviney, Senior Economist at ABN AMRO, offered his take on Wednesday's FOMC decision and explained the rationale behind pushing back the rate cut forecast to Q1.
“The Fed’s reaction function has clearly shifted, and it looks as though the hurdle to more cuts is higher than it was before. However, we think the Committee’s outlook might be a little too optimistic. In the press conference, Chair Powell referred to the risks in the outlook as having ‘perhaps moved in a more positive direction’. When pressed on this, he referred to progress towards a possible trade deal with China. We think some kind of truce that freezes existing tariffs is possible, but even this modest step looks far from certain. Indeed, just today, the November APEC summit in Chile – where a deal might have been sealed – was cancelled, suggesting the US and China are still some distance from even an interim deal. Moreover, while there are some tentative signs of a bottom in manufacturing, global growth remains fragile, and we expect the passthrough from weak manufacturing to slower jobs growth and consumption to be more pronounced than the Fed appears to have built into its base case – our 2020 GDP growth forecast is 1.3%, well below the FOMC’s median 2.0% forecast (Q4/Q4 figures). As such, we think weaker data will ultimately force the Committee’s hand, though it looks as though it will take longer for the Fed to be convinced of the need for more accommodation. We therefore now expect one further 25bp cut in Q1 2020, later than our previous forecast of an additional December move.”
Auto sales in China may skid to 26 million this year, a drop of around 8%, a senior industry executive warned, as the world’s largest auto market braces for a second year of contraction amid slowing economic growth and tighter vehicle emissions standards.
The latest prediction, by Fu Bingfeng, executive vice chairman of the China Association of Automobile Manufacturers (CAAM), is lower than the group’s previous forecast for a 5% drop, issued in July.
Amid gathering gloom over the global auto industry’s biggest growth story of the last 20 years, carmakers like General Motors, Ford and Peugeot SA have all reported double-digit percentage sales declines. Some smaller firms have even started to shut down capacity and seek consolidation.
“For this year, we now expect to see if we can hold on to (sales of) 26 million vehicles,” Fu told.
Fu said sales declines should be viewed as part of the industry’s transformation towards higher production standards, lower-emission cars and new energy vehicles (NEVs), adding the association was still ultimately bullish about the future prospects of the market.
Beijing could remove extra tariffs imposed since last year on U.S. farm products to ease the way for importers to buy up to $50 billion worth, rather than direct them to buy specific amounts, the head of a government-backed trade association said.
U.S. President Donald Trump said earlier this month that China had pledged to spend between $40 billion and $50 billion on U.S. agricultural products annually as part of a deal to end a trade war that broke out last year. But the demand has become a major sticking point in the bilateral trade talks, as Beijing wants to buy based on market conditions instead of committing to a large figure and a specific time frame.
“What the government can do is to remove the extra tariffs, both sides need to do this. Then let the companies make the purchases based on their own will, and based on market rules,” Cao Derong, President of the China Chamber of Commerce for Import and Export of Foodstuffs, Native Produce and Animal By-Products (CFNA) told.
Cao added that this would create conditions for a “convenient” and “good” trade environment, rather than obliging firms to buy a certain amount of product during a certain period of time.
In the view of the Danske Bank research team, today, European markets will digest yesterday's FOMC messages with the Fed giving clear indications of being on hold.
"In terms of data, October flash inflation prints and the advance Q3 GDP figure are due for release in the euro area. Headline inflation is expected to fall to 0.7% due to base effects in the energy component. However, based on yesterday's country releases there are upside risks to the estimate. We expect the core print to come in at 1.0%, unchanged from the September release. We will also get the preliminary Q3 GDP print where we expect a 0.2% q/q reading. In Q2 we already saw signs that domestic demand is slowing. PMIs took a further plunge in September, pointing to almost stagnant Q3 growth. We still think though, that the service sector can compensate for some of the weakness from the ongoing industrial recession and hence look for a quarterly growth rate of 0.2% q/q.”
According to the report from Insee, over a year, the Consumer Price Index (CPI) should slow down to +0.7% in October 2019, after +0.9% in the previous month. This drop in inflation should result from a downturn in energy prices and from a slowdown in those of food. Manufactured goods prices should drop less than in September and the inflation in services should be unchanged.
Over one month, consumer prices should edge down by 0.1%, after a 0.3% drop in September. Energy prices should be stable, the rise in petroleum product prices being offset by an accentuated decrease in gas prices. Those of services should drop barely after a sharp contraction in September. Finally, food prices should drop at the same pace as in the previous month and those of manufactured goods should slow down.
Year on year, the Harmonised Index of Consumer Prices should slow down to +0.9% after +1.1% in September. Over one month, it should fall by 0.1%, after −0.4% in the previous month.
According to figures released today by the Society of Motor Manufacturers and Traders (SMMT), UK car production resumed its downward trend in September, with output falling -3.8% to round off a turbulent first nine months. 122,256 units were built in the month, almost 5,000 fewer than September last year. The latest figures mark a 15-month period of decline for the sector, notwithstanding August when several key plants kept production lines running after moving the traditional annual shutdown period to April to guard against disruption from the original 29 March Brexit date.
In September 2019, production for the UK declined -5.1% as political and economic uncertainty combined to dampen the domestic market. Exports fell -3.4% as cooling demand in key global and European markets affected overseas orders. Output in the year-to-date, meanwhile, is down -15.6%, marking the weakest first three quarters since 2011 and illustrating the impact of the multiple challenges currently facing UK Automotive.
“Another bitterly disappointing month reflects domestic and international market contraction. Most worrying of all though is the continued threat of a ‘no deal’ Brexit, something which has caused international investment to stall and cost UK operations hundreds of millions of pounds, money that would have better been spent in meeting the technological challenges facing the global industry. A general election may ultimately provide some certainty, but does not yet remove the spectre of no deal", Mike Hawes, SMMT Chief Executive, said.
According to provisional data from Destatis, turnover in retail trade in September 2019 was in real terms 3.4% and in nominal terms 3.5% larger than in September 2018. The number of days open for sale was 25 in September 2019 and in September 2018. Economists had expected a 3.5% increase in real terms.
Retail trade in food, beverages and tobacco grew by 0.5% in real terms and 1.4% in nominal terms in September 2019 compared with September 2018, with sales in supermarkets, hypermarkets up by 0.5% in real terms and 1.3% in nominal terms over the same month of the previous year. In real terms, food retailing grew by 0.2% in real terms and by 2.1% in nominal terms compared with September 2018.
In the non-food retailing segment, sales in September 2019 rose by 4.9% in real terms and in nominal terms compared with the same month of the previous year. Internet and mail order trading recorded the largest increase in sales, with 10.9% in real terms and 10.3% in nominal terms.
Compared with the previous year, turnover in retail trade was in the first nine months of 2019 in real terms 3.1% and in nominal terms 3.7% higher than in the corresponding period of the previous year.
When adjusted for calendar and seasonal variations, the September turnover was in real terms 0.1% higher and in nominal terms 0.2% lower than in August 2019. Economists had expected a 0.2% increase in real terms.
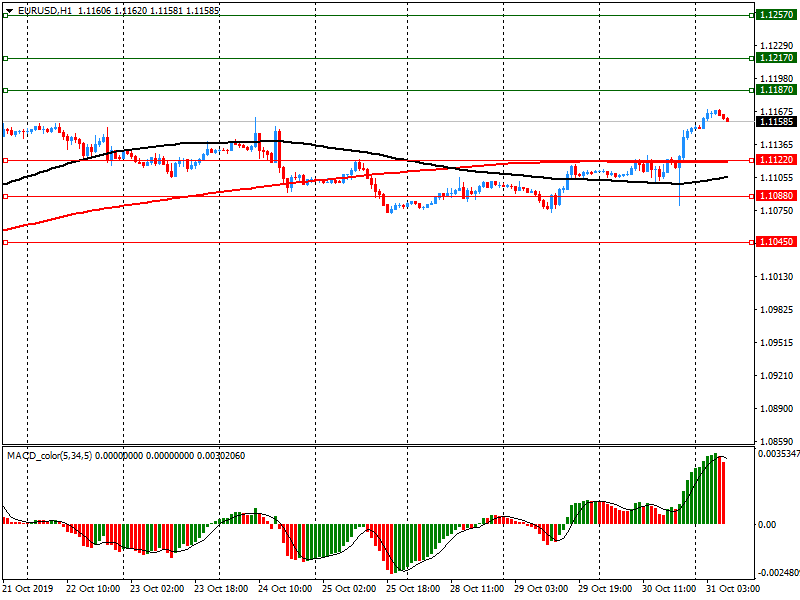
EUR/USD
Resistance levels (open interest**, contracts)
$1.1257 (2956)
$1.1217 (2825)
$1.1187 (3049)
Price at time of writing this review: $1.1159
Support levels (open interest**, contracts):
$1.1122 (1716)
$1.1088 (2859)
$1.1045 (2465)
Comments:
- Overall open interest on the CALL options and PUT options with the expiration date November, 8 is 72985 contracts (according to data from October, 30) with the maximum number of contracts with strike price $1,1000 (4058);
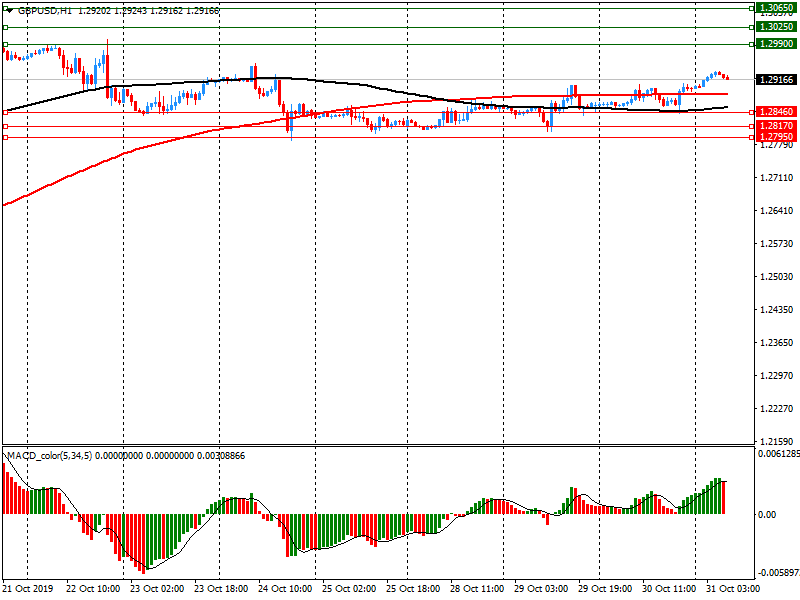
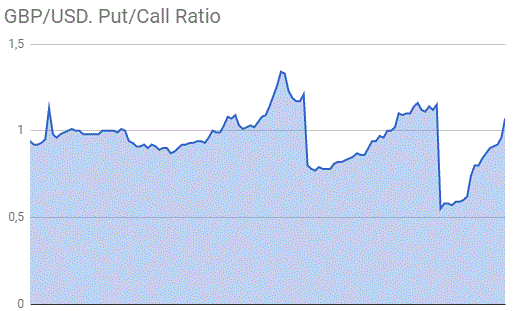
GBP/USD
Resistance levels (open interest**, contracts)
$1.3065 (674)
$1.3025 (1912)
$1.2990 (1671)
Price at time of writing this review: $1.2917
Support levels (open interest**, contracts):
$1.2846 (204)
$1.2817 (238)
$1.2795 (208)
Comments:
- Overall open interest on the CALL options with the expiration date November, 8 is 28530 contracts, with the maximum number of contracts with strike price $1,3200 (4346);
- Overall open interest on the PUT options with the expiration date November, 8 is 30465 contracts, with the maximum number of contracts with strike price $1,2100 (3167);
- The ratio of PUT/CALL was 1.07 versus 0.96 from the previous trading day according to data from October, 30
* - The Chicago Mercantile Exchange bulletin (CME) is used for the calculation.
** - Open interest takes into account the total number of option contracts that are open at the moment.
| Raw materials | Closed | Change, % |
|---|---|---|
| Brent | 60.06 | -1.7 |
| WTI | 54.85 | -1.1 |
| Silver | 17.84 | 0.28 |
| Gold | 1495.495 | 0.52 |
| Palladium | 1804.24 | 1.57 |
| Index | Change, points | Closed | Change, % |
|---|---|---|---|
| NIKKEI 225 | -131.01 | 22843.12 | -0.57 |
| Hang Seng | -119.05 | 26667.71 | -0.44 |
| KOSPI | -12.42 | 2080.27 | -0.59 |
| ASX 200 | -55.9 | 6689.5 | -0.83 |
| FTSE 100 | 24.52 | 7330.78 | 0.34 |
| DAX | -29.39 | 12910.23 | -0.23 |
| Dow Jones | 115.23 | 27186.69 | 0.43 |
| S&P 500 | 9.88 | 3046.77 | 0.33 |
| NASDAQ Composite | 27.13 | 8303.98 | 0.33 |
| Pare | Closed | Change, % |
|---|---|---|
| AUDUSD | 0.68991 | 0.56 |
| EURJPY | 121.391 | 0.33 |
| EURUSD | 1.11514 | 0.36 |
| GBPJPY | 140.4 | 0.25 |
| GBPUSD | 1.28973 | 0.27 |
| NZDUSD | 0.63994 | 0.7 |
| USDCAD | 1.31591 | 0.56 |
| USDCHF | 0.98932 | -0.46 |
| USDJPY | 108.848 | -0.03 |
© 2000-2026. Sva prava zaštićena.
Sajt je vlasništvo kompanije Teletrade D.J. LLC 2351 LLC 2022 (Euro House, Richmond Hill Road, Kingstown, VC0100, St. Vincent and the Grenadines).
Svi podaci koji se nalaze na sajtu ne predstavljaju osnovu za donošenje investicionih odluka, već su informativnog karaktera.
The company does not serve or provide services to customers who are residents of the US, Canada, Iran, The Democratic People's Republic of Korea, Yemen and FATF blacklisted countries.
Izvršenje trgovinskih operacija sa finansijskim instrumentima upotrebom marginalne trgovine pruža velike mogućnosti i omogućava investitorima ostvarivanje visokih prihoda. Međutim, takav vid trgovine povezan je sa potencijalno visokim nivoom rizika od gubitka sredstava. Проведение торговых операций на финанcовых рынках c маржинальными финанcовыми инcтрументами открывает широкие возможноcти, и позволяет инвеcторам, готовым пойти на риcк, получать выcокую прибыль, но при этом неcет в cебе потенциально выcокий уровень риcка получения убытков. Iz tog razloga je pre započinjanja trgovine potrebno odlučiti o izboru odgovarajuće investicione strategije, uzimajući u obzir raspoložive resurse.
Upotreba informacija: U slučaju potpunog ili delimičnog preuzimanja i daljeg korišćenja materijala koji se nalazi na sajtu, potrebno je navesti link odgovarajuće stranice na sajtu kompanije TeleTrade-a kao izvora informacija. Upotreba materijala na internetu mora biti praćena hiper linkom do web stranice teletrade.org. Automatski uvoz materijala i informacija sa stranice je zabranjen.
Ako imate bilo kakvih pitanja, obratite nam se pr@teletrade.global.

