- Analiza
- Novosti i instrumenti
- Vesti sa tržišta
Forex-novosti i prognoze od 31-07-2024
- EUR/USD spun in place on Wednesday after Fed met expectations.
- The Fed continues to wait for signs of easing inflation, but looking hopeful.
- Friday’s US NFP to have extra weight after Fed flags labor data as key to rate cuts.
EUR/USD churned near key technical levels on Wednesday after the Federal Reserve (Fed) held rates steady for one last meeting as markets had broadly anticipated. The slow race to September’s Fed rate call kicks off on Friday with the latest print of US Nonfarm Payrolls (NFP) for July.
Read more: Jerome Powell speaks on rate outlook after keeping policy settings unchanged
EU data remains limited for the back half of the trading week, leaving investors to focus squarely on upcoming US NFP figures. Median market forecasts are hoping for a continued easing in the US jobs market, calling for net job additions of 175K in July, down from the previous print of 206K.
Federal Reserve Chairman Jerome Powell outlined the specific conditions required for the Fed to implement a rate cut in September. These include ongoing improvements in inflation trends and the US labor market remaining stable or showing further weakening. This provides the markets with a clear benchmark for the upcoming important US economic data releases. The upcoming US Nonfarm Payrolls report, expected to be released on Friday, is anticipated to meet at least one of the Fed's criteria, as it is projected to show a further decrease in job additions for July.
EUR/USD technical outlook
Fiber bids are hung up on the 50-day Exponential Moving Average (EMA) at 1.0818, and middling price action has EUR/USD grinding into a fresh technical middle just north of the 200-day EMA at 1.0796.
The pair is still down from the last swing high that fell just short of 1.0950, but downside momentum is getting squeezed out by a price floor from long-term technical averages. Bidders are set for another attempt to push Fiber back into the high end as a choppy descending channel keeps bullish momentum crimped.
EUR/USD daily chart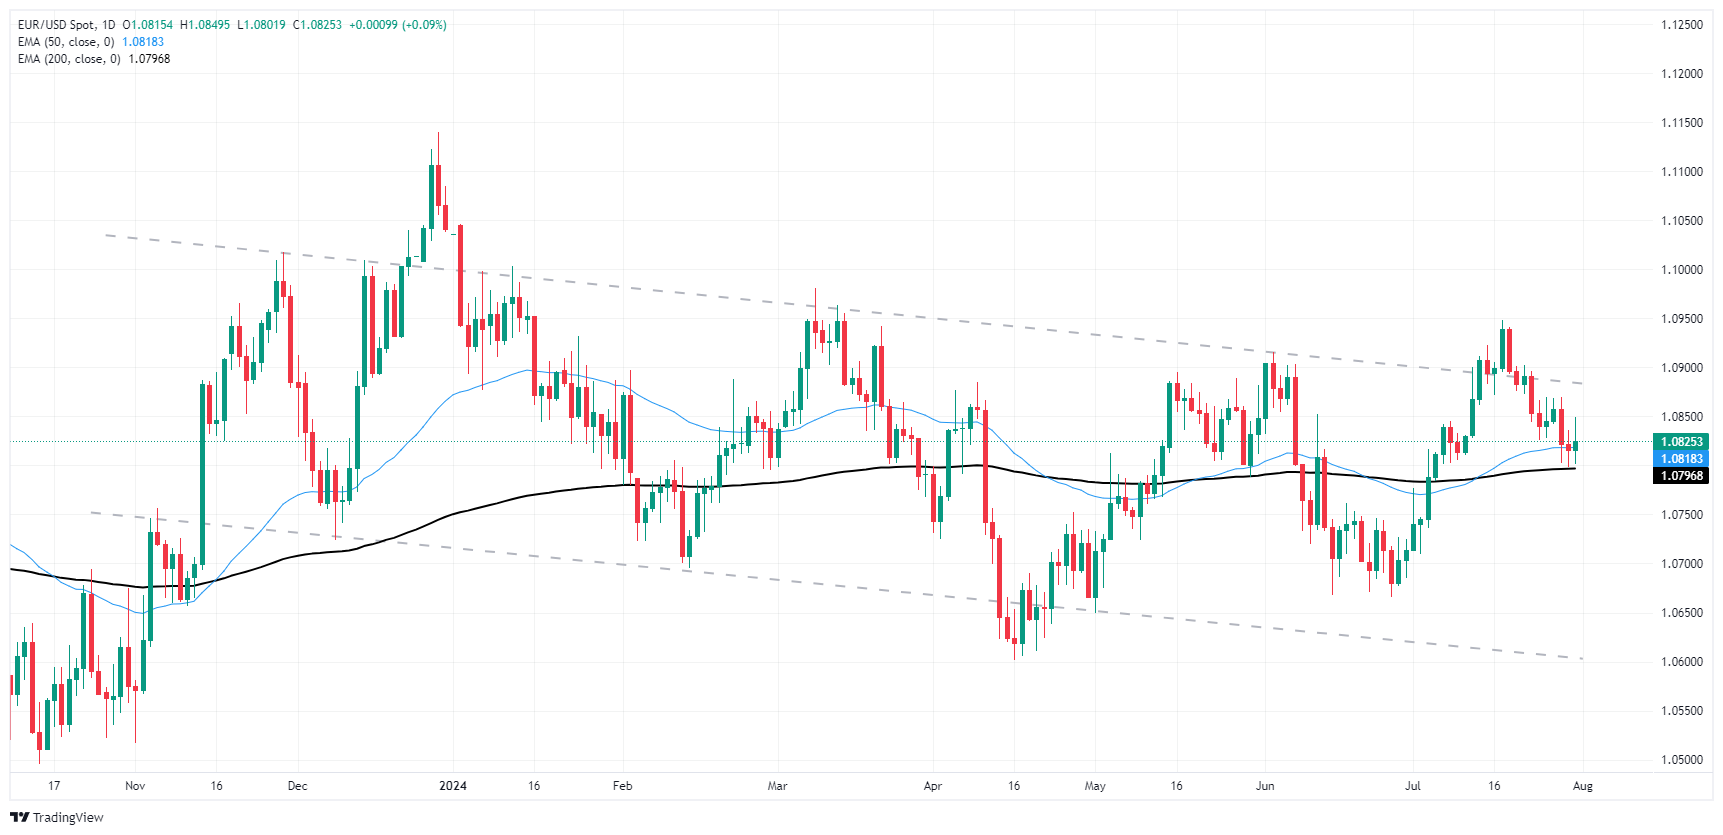
Nonfarm Payrolls FAQs
Nonfarm Payrolls (NFP) are part of the US Bureau of Labor Statistics monthly jobs report. The Nonfarm Payrolls component specifically measures the change in the number of people employed in the US during the previous month, excluding the farming industry.
The Nonfarm Payrolls figure can influence the decisions of the Federal Reserve by providing a measure of how successfully the Fed is meeting its mandate of fostering full employment and 2% inflation. A relatively high NFP figure means more people are in employment, earning more money and therefore probably spending more. A relatively low Nonfarm Payrolls’ result, on the either hand, could mean people are struggling to find work. The Fed will typically raise interest rates to combat high inflation triggered by low unemployment, and lower them to stimulate a stagnant labor market.
Nonfarm Payrolls generally have a positive correlation with the US Dollar. This means when payrolls’ figures come out higher-than-expected the USD tends to rally and vice versa when they are lower. NFPs influence the US Dollar by virtue of their impact on inflation, monetary policy expectations and interest rates. A higher NFP usually means the Federal Reserve will be more tight in its monetary policy, supporting the USD.
Nonfarm Payrolls are generally negatively-correlated with the price of Gold. This means a higher-than-expected payrolls’ figure will have a depressing effect on the Gold price and vice versa. Higher NFP generally has a positive effect on the value of the USD, and like most major commodities Gold is priced in US Dollars. If the USD gains in value, therefore, it requires less Dollars to buy an ounce of Gold. Also, higher interest rates (typically helped higher NFPs) also lessen the attractiveness of Gold as an investment compared to staying in cash, where the money will at least earn interest.
Nonfarm Payrolls is only one component within a bigger jobs report and it can be overshadowed by the other components. At times, when NFP come out higher-than-forecast, but the Average Weekly Earnings is lower than expected, the market has ignored the potentially inflationary effect of the headline result and interpreted the fall in earnings as deflationary. The Participation Rate and the Average Weekly Hours components can also influence the market reaction, but only in seldom events like the “Great Resignation” or the Global Financial Crisis.
- USD/CAD weakens near 1.3805 in Thursday’s early Asian session.
- The Fed kept its key interest rate at 5.25% to 5.5% at its July meeting on Wednesday.
- Higher crude oil prices amid Middle East geopolitical risks support the commodity-linked Loonie.
The USD/CAD pair trades on a softer note near 1.3805 during the early Asian session on Thursday. The further downside of the US Dollar (USD) after the Federal Reserve (Fed) decided to hold rates unchanged, drags the pair to the weekly lows. Investors will take more cues from the US ISM Manufacturing PMI, weekly Initial Jobless Claims, and the final S&P Global Manufacturing PMI, which are due later on Thursday.
As widely expected by market players, the US Fed left the policy rate, federal funds rate, unchanged at the range of 5.25%-5.50% at its July meeting on Wednesday. Fed Chair Jerome Powell said during the press conference that a rate cut in September is “on the table. Powell added that the central bank will closely monitor the labor market and stay vigilant for signs of a potentially sharp downturn.
Dovish comments from the Fed and rising expectations for rate cuts in September exert some selling pressure on the Greenback. According to the CME FedWatch tool, traders are now pricing in a 100% chance that the central bank will cut interest rates by 25 basis points (bps) in its September meeting.
On the Loonie front, the recovery of crude oil prices amid escalating geopolitical tensions in the Middle East and a decline in weekly US crude oil inventories help limit the Canadian Dollar’s (CAD) losses. It's worth noting that higher oil prices generally support the CAD lower as Canada is the leading exporter of Oil to the United States (US).
On the other hand, the rising bets that the Bank of Canada (BoC) will continue to ease policy after its latest interest rate cut last week might cap the CAD’s upside. Traders expect one more 25 bps rate cut this year, with nearly 60% odds that the BoC will cut rates again in its September meeting.
Canadian Dollar FAQs
The key factors driving the Canadian Dollar (CAD) are the level of interest rates set by the Bank of Canada (BoC), the price of Oil, Canada’s largest export, the health of its economy, inflation and the Trade Balance, which is the difference between the value of Canada’s exports versus its imports. Other factors include market sentiment – whether investors are taking on more risky assets (risk-on) or seeking safe-havens (risk-off) – with risk-on being CAD-positive. As its largest trading partner, the health of the US economy is also a key factor influencing the Canadian Dollar.
The Bank of Canada (BoC) has a significant influence on the Canadian Dollar by setting the level of interest rates that banks can lend to one another. This influences the level of interest rates for everyone. The main goal of the BoC is to maintain inflation at 1-3% by adjusting interest rates up or down. Relatively higher interest rates tend to be positive for the CAD. The Bank of Canada can also use quantitative easing and tightening to influence credit conditions, with the former CAD-negative and the latter CAD-positive.
The price of Oil is a key factor impacting the value of the Canadian Dollar. Petroleum is Canada’s biggest export, so Oil price tends to have an immediate impact on the CAD value. Generally, if Oil price rises CAD also goes up, as aggregate demand for the currency increases. The opposite is the case if the price of Oil falls. Higher Oil prices also tend to result in a greater likelihood of a positive Trade Balance, which is also supportive of the CAD.
While inflation had always traditionally been thought of as a negative factor for a currency since it lowers the value of money, the opposite has actually been the case in modern times with the relaxation of cross-border capital controls. Higher inflation tends to lead central banks to put up interest rates which attracts more capital inflows from global investors seeking a lucrative place to keep their money. This increases demand for the local currency, which in Canada’s case is the Canadian Dollar.
Macroeconomic data releases gauge the health of the economy and can have an impact on the Canadian Dollar. Indicators such as GDP, Manufacturing and Services PMIs, employment, and consumer sentiment surveys can all influence the direction of the CAD. A strong economy is good for the Canadian Dollar. Not only does it attract more foreign investment but it may encourage the Bank of Canada to put up interest rates, leading to a stronger currency. If economic data is weak, however, the CAD is likely to fall.
- GBP/USD is cycling chart paper just south of 1.2900.
- Fed rate call in the books, expected BoE rate cut on the cards.
- BoE expected to vote 5-to-4 in favor of a quarter-point rate cut.
GBP/USD waffled in a near-term range on Wednesday after the Federal Reserve (Fed) hit wide market expectations of one last rate hold for July, with expectations of a September Fed rate cut fully priced in, key data pending. The Bank of England (BoE) is expected to deliver a rate cut for the first time since March of 2020, but odds-makers are expecting a close 5-to-4 vote from the BoE’s Monetary Policy Committee (MPC).
Forex Today: Will the BoE dare?
Fed Chairman Jerome Powell laid out exactly what the Fed needs to see in order to deliver a rate cut in September, namely continued easing in inflation figures and US labor markets to either remain where they are or soften further, giving markets a hard target on upcoming key US data releases. US Nonfarm Payrolls looms ahead on Friday, and is expected to deliver on at least one item on the Fed’s wishlist as net job additions in July are expected to ease further.
The BoE is broadly expected to deliver a quarter-point rate trim on Thursday, but there’s still plenty of room for disappointment as median market forecasts expect the MPC to vote in favor of a rate cut 5-to-4. The MPC’s previous rate vote saw the UK’s policymakers agree to hold rates steady in a 7-to-2 split.
GBP/USD technical outlook
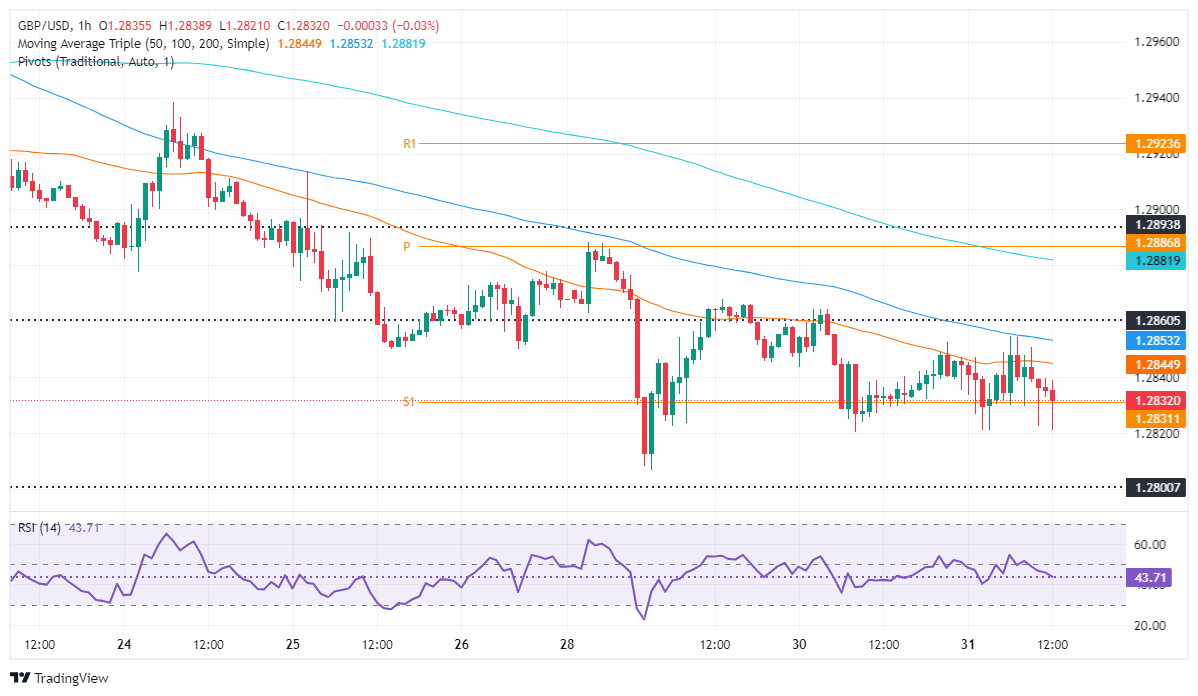
GBP/USD is struggling to find bullish momentum after the pair eased back below the 1.2900 handle after an extended backslide from 12-month highs near 1.3045 in recent weeks. Cable is still trading north of the 50-day Exponential Moving Average (EMA) at 1.2791.
The long-term trend in daily candlesticks is notably bullish with GBP/USD grinding out chart paper north of the 200-day EMA at 1.2642, and bidders will be looking for a pattern of higher lows help to bolster Cable back into a leg higher as long as the most recent pullback doesn’t drop below the last swing low just north of 1.2600.
GBP/USD daily chart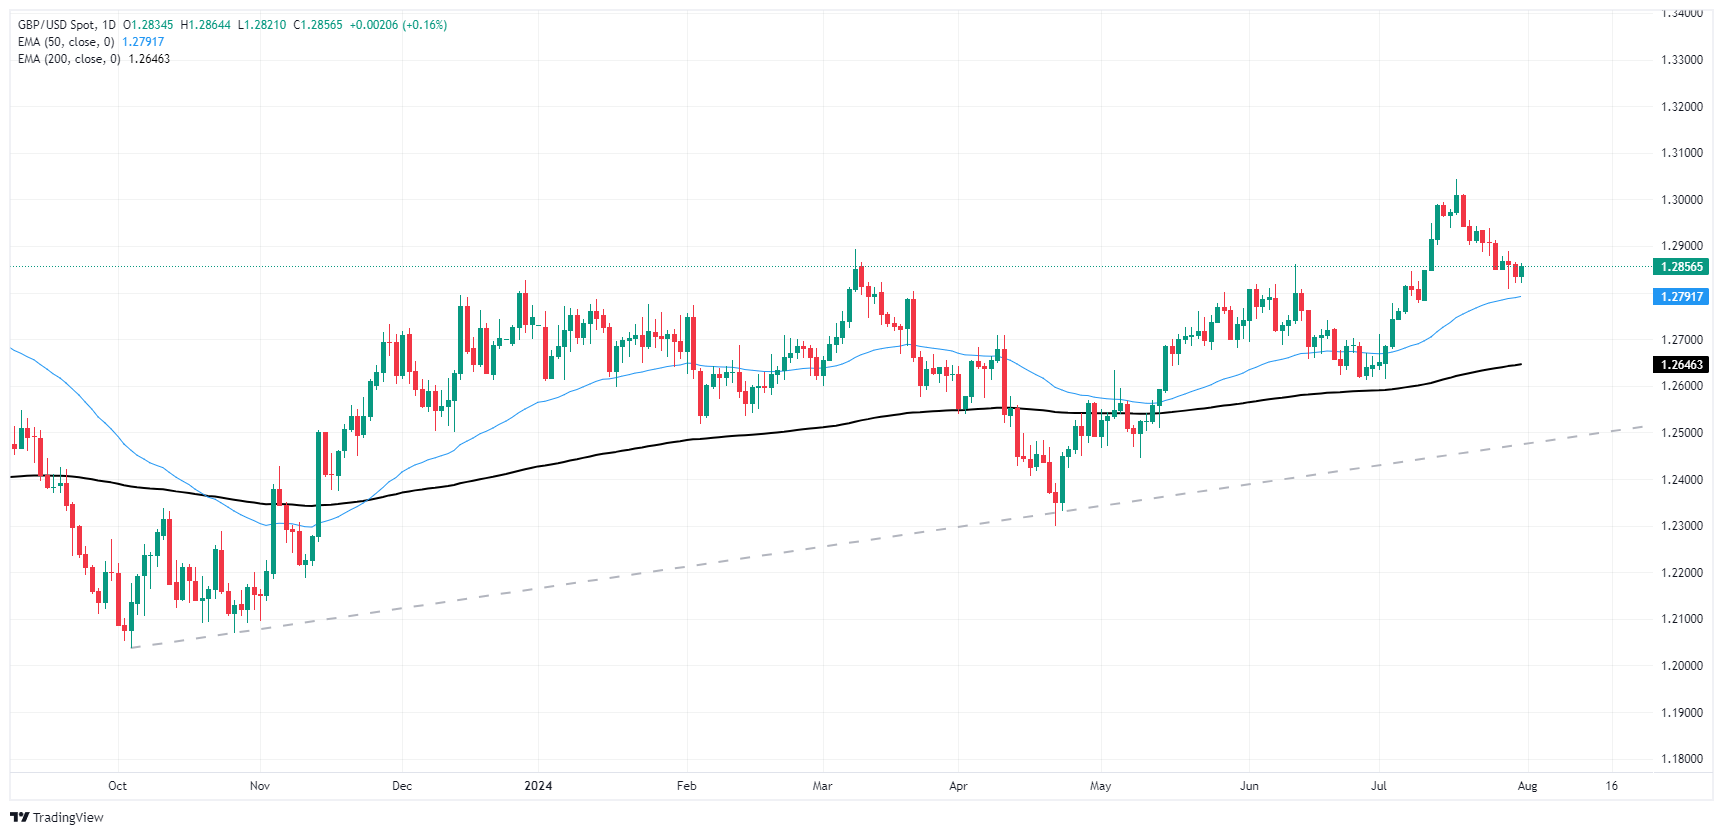
BoE FAQs
The Bank of England (BoE) decides monetary policy for the United Kingdom. Its primary goal is to achieve ‘price stability’, or a steady inflation rate of 2%. Its tool for achieving this is via the adjustment of base lending rates. The BoE sets the rate at which it lends to commercial banks and banks lend to each other, determining the level of interest rates in the economy overall. This also impacts the value of the Pound Sterling (GBP).
When inflation is above the Bank of England’s target it responds by raising interest rates, making it more expensive for people and businesses to access credit. This is positive for the Pound Sterling because higher interest rates make the UK a more attractive place for global investors to park their money. When inflation falls below target, it is a sign economic growth is slowing, and the BoE will consider lowering interest rates to cheapen credit in the hope businesses will borrow to invest in growth-generating projects – a negative for the Pound Sterling.
In extreme situations, the Bank of England can enact a policy called Quantitative Easing (QE). QE is the process by which the BoE substantially increases the flow of credit in a stuck financial system. QE is a last resort policy when lowering interest rates will not achieve the necessary result. The process of QE involves the BoE printing money to buy assets – usually government or AAA-rated corporate bonds – from banks and other financial institutions. QE usually results in a weaker Pound Sterling.
Quantitative tightening (QT) is the reverse of QE, enacted when the economy is strengthening and inflation starts rising. Whilst in QE the Bank of England (BoE) purchases government and corporate bonds from financial institutions to encourage them to lend; in QT, the BoE stops buying more bonds, and stops reinvesting the principal maturing on the bonds it already holds. It is usually positive for the Pound Sterling.
- Silver price jumps over 2%, trading at $28.99 after bouncing from daily lows of $28.25.
- XAG/USD clears the 100-DMA at $28.58; key resistance at $29.00 in focus.
- RSI indicates strengthening bullish momentum; next targets include $29.44 and $30.00, with support at $27.31 if bearish reversal occurs.
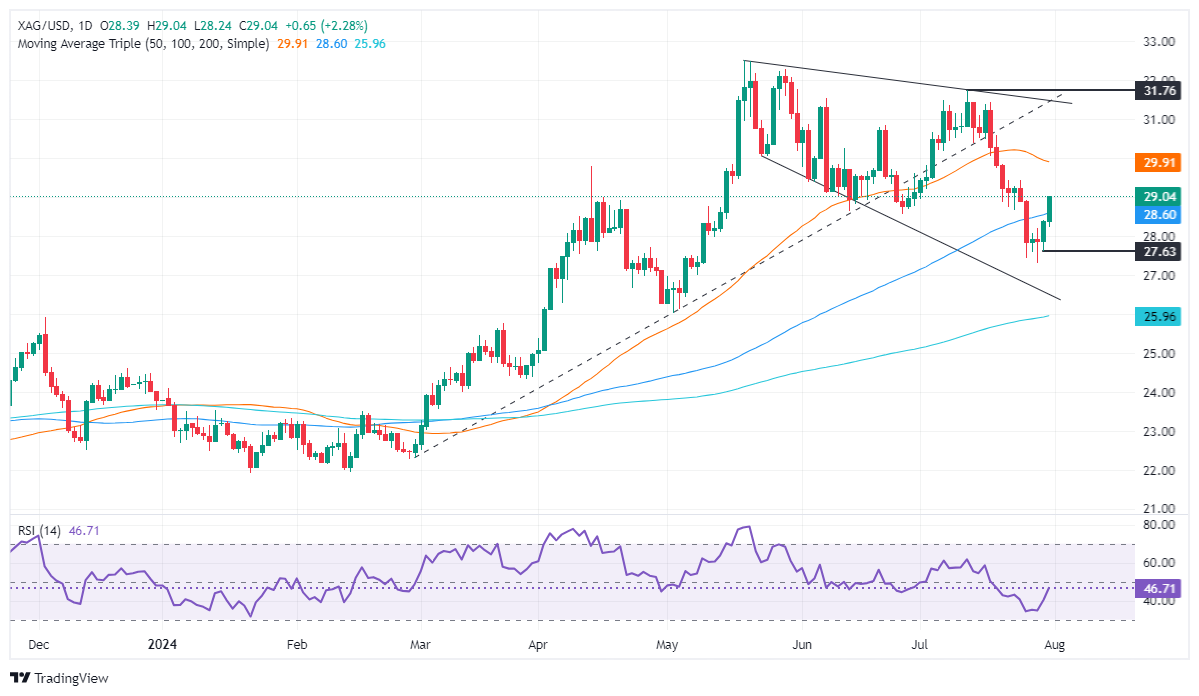
Silver price resumed its uptrend and surged over 2% on Wednesday, clearing the 100-day moving average (DMA) at $28.58, a key resistance level that capped the grey’s metal advance toward $29.00. The XAG/USD trades at $28.99 after bouncing off daily lows of $28.25.
XAG/USD Price Analysis: Technical outlook
The grey metal uptrend remains in play, though buyers' lack of strength to achieve a daily close above $29.00 could expose the precious metal to selling pressure.
Buyers gathered some steam as shown by the Relative Strength Index (RSI), which, despite being below the neutral line, the steepest advance, hints that it would turn bullish and confirm price action.
If XAG/USD reclaims $29.00, the next stop would be the July 24 peak of $29.44, followed by the 50-day moving average (DMA) at $29.89. Further gains are seen once Silver tops $30.00. Conversely, if XAG/USD slumps below the 100-DMA at $28.58, the next support would be the July 29 bottom of $27.31, followed by the $27.00 figure.
XAG/USD Price Action – Daily Chart
Silver FAQs
Silver is a precious metal highly traded among investors. It has been historically used as a store of value and a medium of exchange. Although less popular than Gold, traders may turn to Silver to diversify their investment portfolio, for its intrinsic value or as a potential hedge during high-inflation periods. Investors can buy physical Silver, in coins or in bars, or trade it through vehicles such as Exchange Traded Funds, which track its price on international markets.
Silver prices can move due to a wide range of factors. Geopolitical instability or fears of a deep recession can make Silver price escalate due to its safe-haven status, although to a lesser extent than Gold's. As a yieldless asset, Silver tends to rise with lower interest rates. Its moves also depend on how the US Dollar (USD) behaves as the asset is priced in dollars (XAG/USD). A strong Dollar tends to keep the price of Silver at bay, whereas a weaker Dollar is likely to propel prices up. Other factors such as investment demand, mining supply – Silver is much more abundant than Gold – and recycling rates can also affect prices.
Silver is widely used in industry, particularly in sectors such as electronics or solar energy, as it has one of the highest electric conductivity of all metals – more than Copper and Gold. A surge in demand can increase prices, while a decline tends to lower them. Dynamics in the US, Chinese and Indian economies can also contribute to price swings: for the US and particularly China, their big industrial sectors use Silver in various processes; in India, consumers’ demand for the precious metal for jewellery also plays a key role in setting prices.
Silver prices tend to follow Gold's moves. When Gold prices rise, Silver typically follows suit, as their status as safe-haven assets is similar. The Gold/Silver ratio, which shows the number of ounces of Silver needed to equal the value of one ounce of Gold, may help to determine the relative valuation between both metals. Some investors may consider a high ratio as an indicator that Silver is undervalued, or Gold is overvalued. On the contrary, a low ratio might suggest that Gold is undervalued relative to Silver.
- NZD/JPY sharply declined below 90.
- Resistance is seen at 90.50, while key support is at 88.70.
- RSI indicates oversold conditions, and MACD shows persistent bearish momentum.
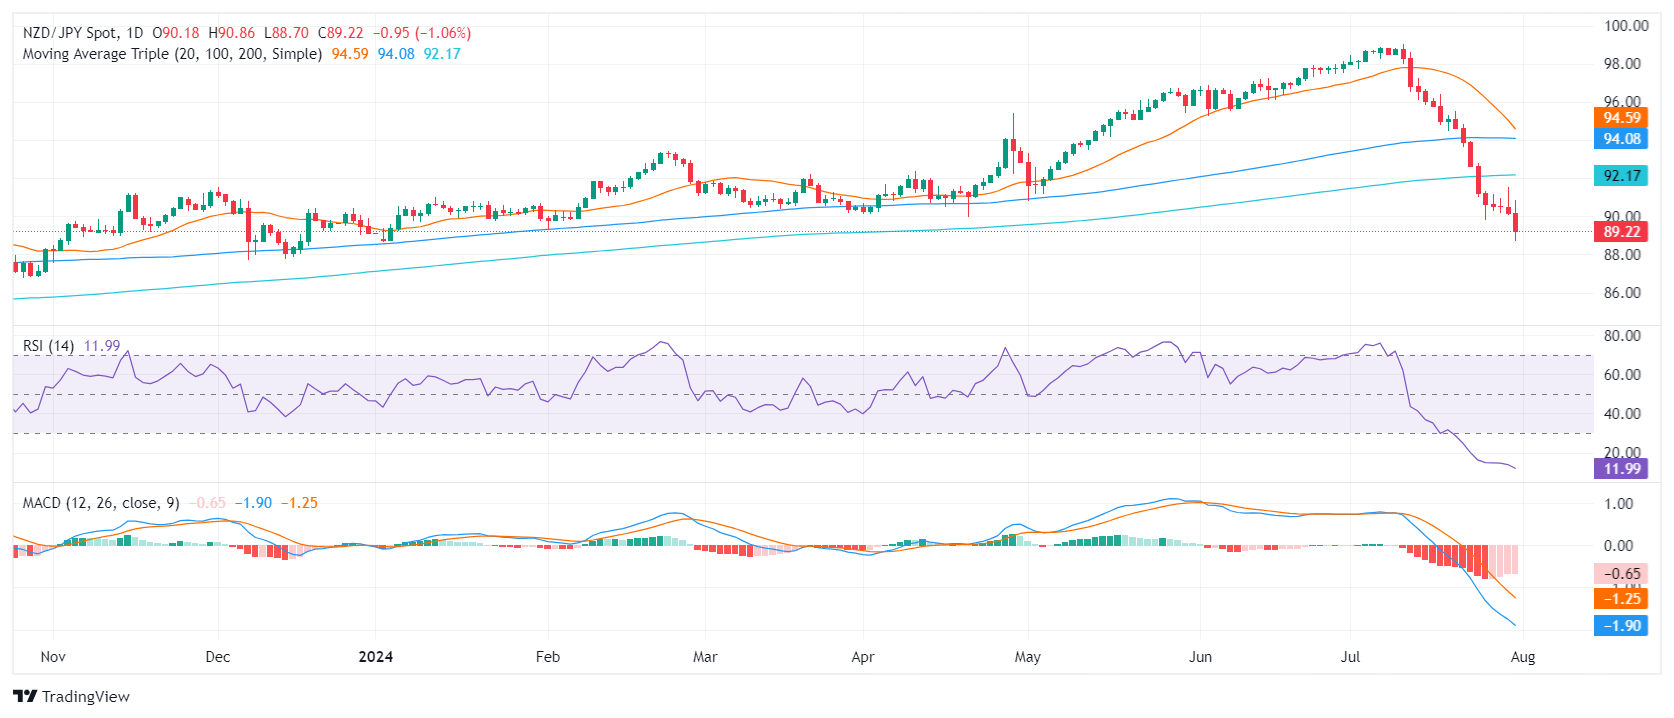
In Wednesday's session, the NZD/JPY declined by more than 1% to 89.20, its lowest level since January. This drop reflects increased selling pressure as the pair continues to struggle below key resistance levels.
The pair encountered resistance at 90.50, a level it has failed to breach in recent sessions. If the downward trend continues, immediate support is expected around 88.70, a crucial level to watch for any potential rebounds. Technical indicators suggest a bearish outlook. The Relative Strength Index (RSI), currently at 15, signals oversold conditions, hinting at possible corrective bounces. However, the Moving Average Convergence Divergence (MACD) flat red bars indicate ongoing bearish momentum. Volume trends reinforce this sentiment, suggesting sustained selling pressure without significant buying interest to counteract it.
However, the deep oversold conditions of the RSI might prompt an upward correction.
NZD/JPY daily chart
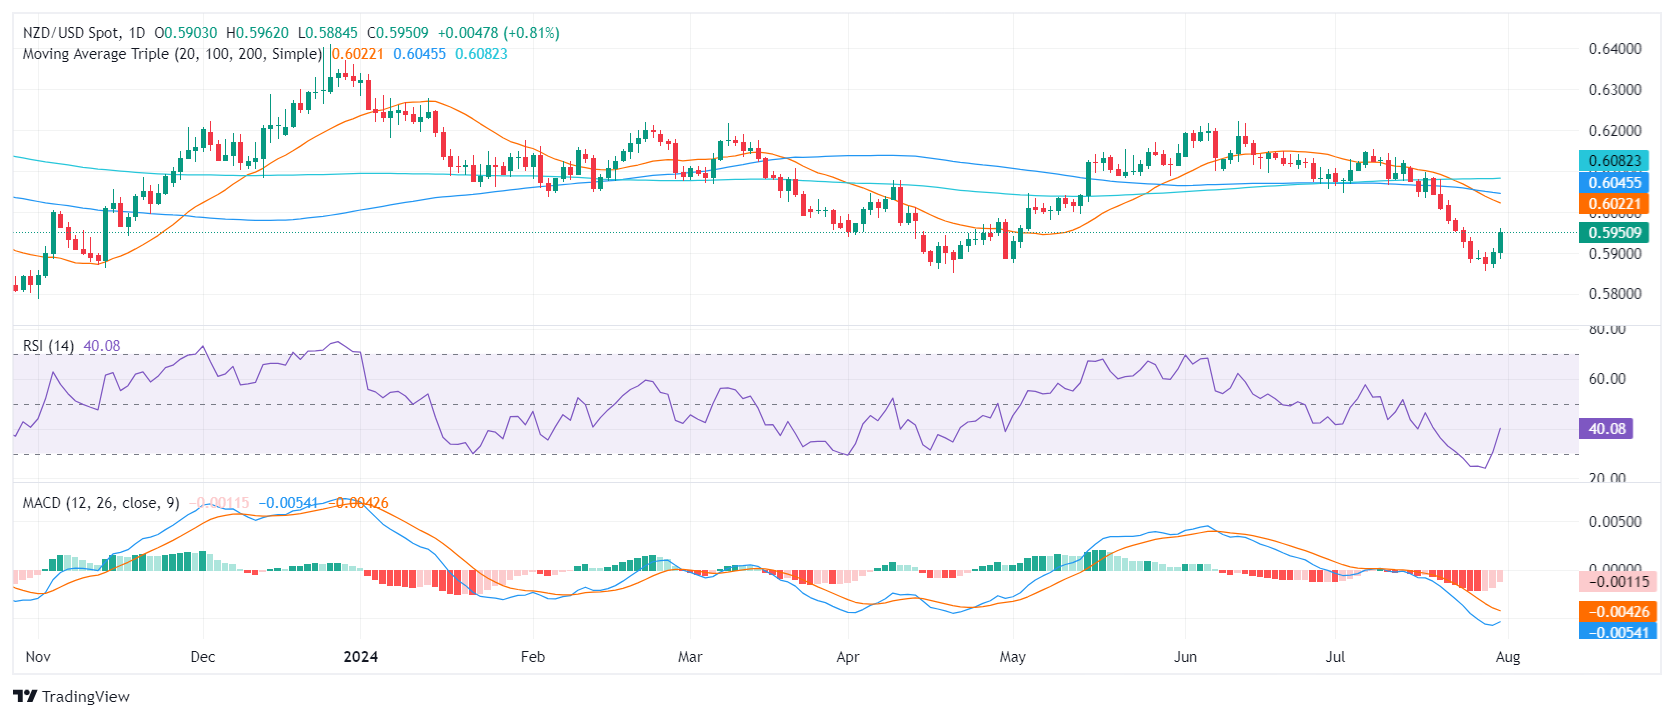
- NZD/USD rose by 0.80% in Wednesday's session, to land at 0.5950.
- The pair faces strong resistance at 0.5960, with support seen at 0.5880.
- RSI indicates oversold conditions, while MACD shows a steady bearish momentum.
In Wednesday's session, the NZD/USD rose by 0.80% to 0.5950. This surge comes as the pair attempts to recover from recent lows, buoyed by increased demand for riskier assets following the weakness seen in the USD following the Federal Reserve (Fed) decision.
The pair's upward movement brought it close to the resistance level at 0.5960, a key hurdle that has held in the past sessions. Should this level be breached, the next target would be the psychological 0.6000 mark. On the downside, support is solid around 0.5880, providing a safety net for bullish traders.
Technical indicators present a mixed outlook. The RSI, currently at 30, suggests the pair is emerging from oversold territory, potentially signaling further gains. However, the MACD prints flat red bars, indicating persistent bearish momentum. This divergence highlights no clear direction and as volume remains moderate a consolidation looms before a decisive move.
NZD/USD daily chart
- WTI rallied into $78.00 per barrel on Wednesday.
- EIA reported another drawdown in US Crude Oil inventories.
- Markets further bolstered by a potential Fed rate cut in September.
West Texas Intermediate (WTI) US Crude Oil jumped back into $78.00 per barrel on Wednesday after the Energy Information Administration (EIA) reported another steeper-than-expected decline in US Crude Oil Stocks Change, adding to a recent downswing in US barrel counts. The Federal Reserve (Fed) held rates steady as markets broadly expected, with a path forward for a September rate cut, helping to bolster commodity risk sentiment.
According to the EIA, US Curde Oil Stocks Change for the week ended July 26 contracted another -3.436 million barrels, far below the forecast -1.6 million barrel decline and piling onto the previous week’s -3.471 million contraction in US Crude Oil supplies. The EIA noted that US Crude Oil output fell in May for the first time since January, but also highlighted that US supplied products of fossil fuel and petroleum products hit its highest levels since August of 2023.
The Fed stood pat on interest rates for the July rate call as markets had broadly forecast, and cautiously-optimistic statements from Fed Chairman Jerome Powell helped keep broad-market risk appetite bid into the high side after the Fed head laid out the blueprint for what the Fed would like to see in key data prints ahead of the September 18 rate call. The Fed is hoping for one last round of inflation data to confirm that price growth is headed for the 2% annual target, and continued easing in US labor figures.
Elsewhere, Crude Oil risk aversion took a step higher on Wednesday following confirmation that the leader of Iranian Hezbollah’s air force was assassinated this week. According to unconfirmed reports, Iranian officials are calling for military action against Israel in retaliation, a move that would see Iran step fully into the Israel-Palestine conflict. An escalation of involvement in the Gaza conflict would see shockwaves through global Crude Oil markets.
WTI technical outlook
WTI US Crude Oil recovered significant ground on Wednesday, rallying 5% from Tuesday’s eight-week low of $74.24. In a steep, one-sided recovery rally, WTI topped $78.00.
US Crude Oil remains notably on the soft side despite Wednesday’s recovery bid, trading on the low end of the 200-day Exponential Moving Average (EMA) just above $79.00, and price action is swamped out on the bearish side of a downside run that saw WTI close in the red for all but four of the last 18 consecutive trading days.
WTI hourly chart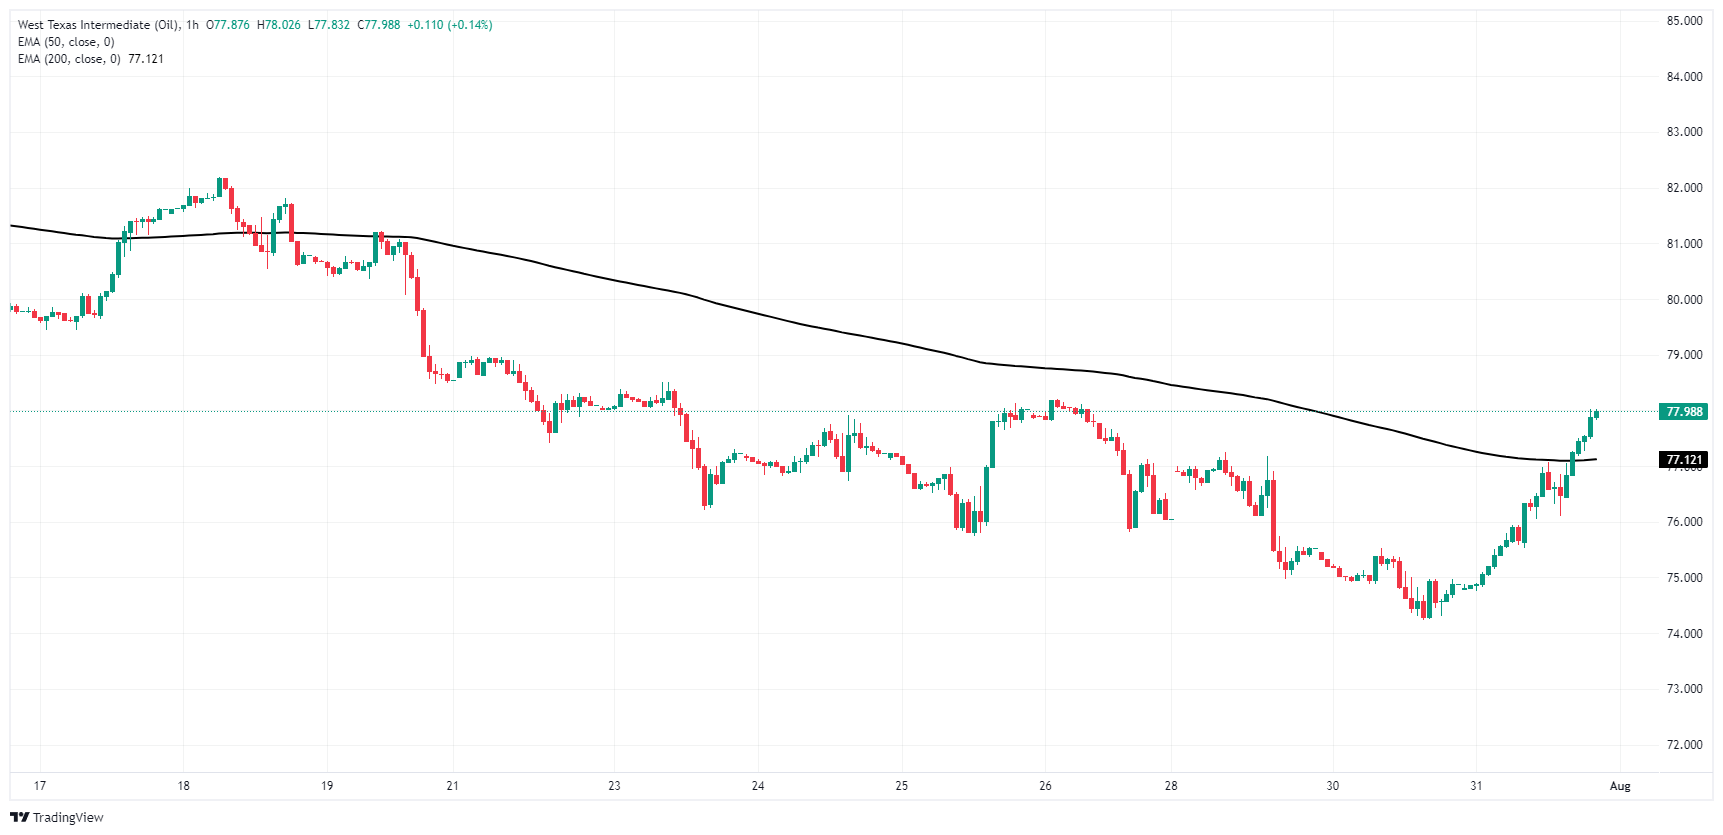
WTI daily chart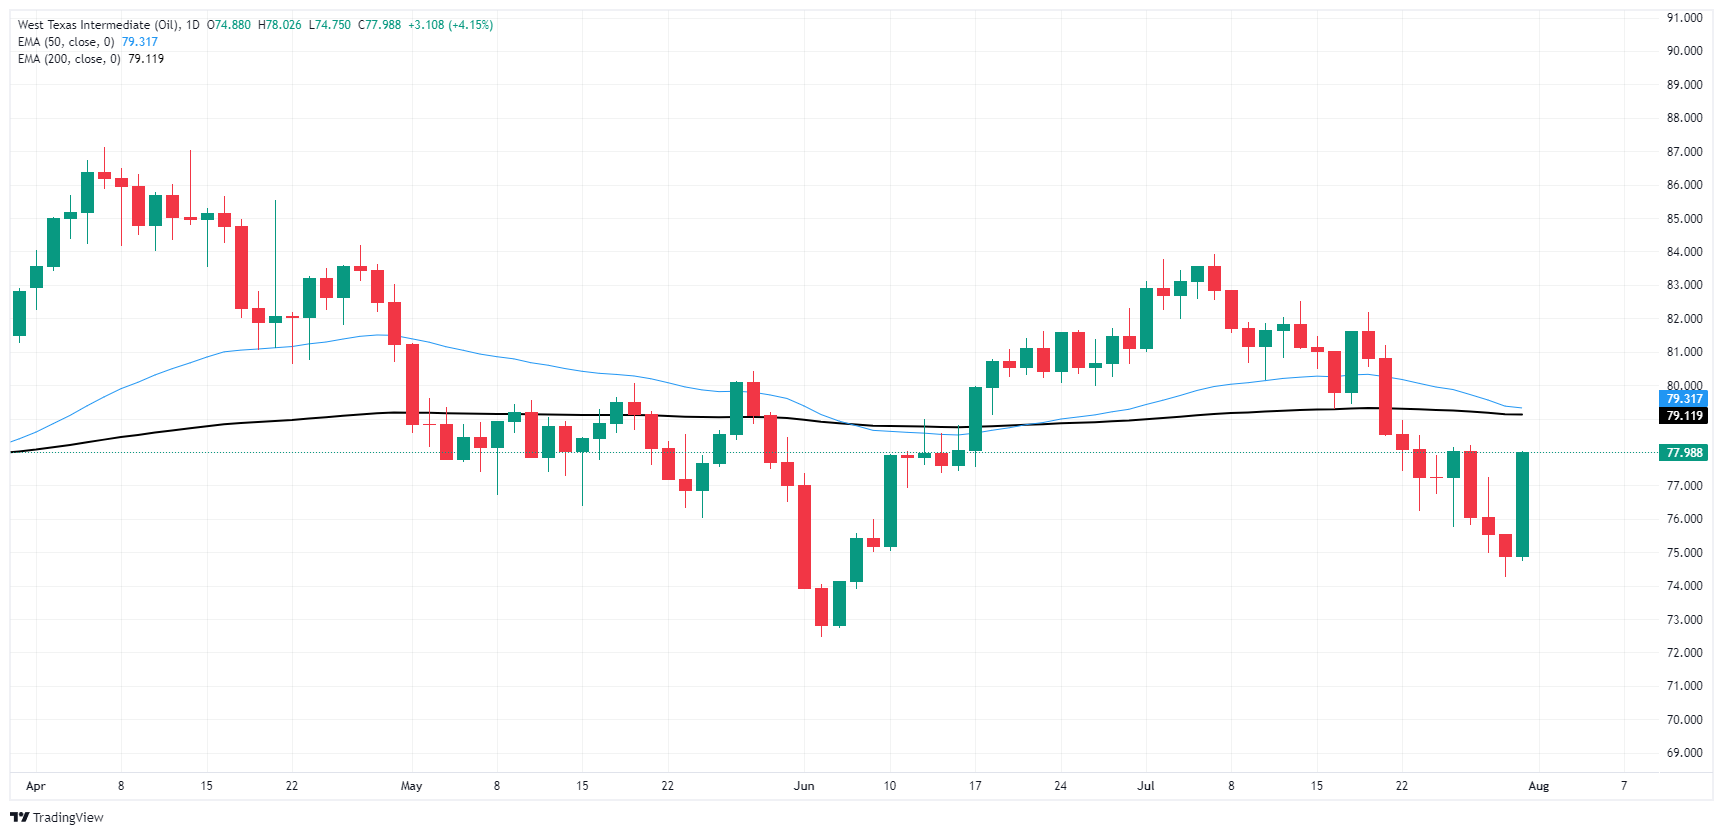
WTI Oil FAQs
WTI Oil is a type of Crude Oil sold on international markets. The WTI stands for West Texas Intermediate, one of three major types including Brent and Dubai Crude. WTI is also referred to as “light” and “sweet” because of its relatively low gravity and sulfur content respectively. It is considered a high quality Oil that is easily refined. It is sourced in the United States and distributed via the Cushing hub, which is considered “The Pipeline Crossroads of the World”. It is a benchmark for the Oil market and WTI price is frequently quoted in the media.
Like all assets, supply and demand are the key drivers of WTI Oil price. As such, global growth can be a driver of increased demand and vice versa for weak global growth. Political instability, wars, and sanctions can disrupt supply and impact prices. The decisions of OPEC, a group of major Oil-producing countries, is another key driver of price. The value of the US Dollar influences the price of WTI Crude Oil, since Oil is predominantly traded in US Dollars, thus a weaker US Dollar can make Oil more affordable and vice versa.
The weekly Oil inventory reports published by the American Petroleum Institute (API) and the Energy Information Agency (EIA) impact the price of WTI Oil. Changes in inventories reflect fluctuating supply and demand. If the data shows a drop in inventories it can indicate increased demand, pushing up Oil price. Higher inventories can reflect increased supply, pushing down prices. API’s report is published every Tuesday and EIA’s the day after. Their results are usually similar, falling within 1% of each other 75% of the time. The EIA data is considered more reliable, since it is a government agency.
OPEC (Organization of the Petroleum Exporting Countries) is a group of 13 Oil-producing nations who collectively decide production quotas for member countries at twice-yearly meetings. Their decisions often impact WTI Oil prices. When OPEC decides to lower quotas, it can tighten supply, pushing up Oil prices. When OPEC increases production, it has the opposite effect. OPEC+ refers to an expanded group that includes ten extra non-OPEC members, the most notable of which is Russia.
- US Treasury yields drop following Fed’s decision to keep rates unchanged; 10-year note falls to 4.04%.
- Powell emphasizes job market importance, with July Nonfarm Payrolls report pivotal for future rate decisions.
- Market participants price in three rate cuts by year-end, as indicated by CME FedWatch Tool.
US Treasury yields along the short and long end of the curve plummeted late on Wednesday following the Federal Reserve’s decision to hold rates unchanged, as expected. The US 10-year benchmark note coupon sank nine and a half basis points to 4.04% following Fed Chair Jerome Powell’s remarks.
US 10-year benchmark note falls 9.5 basis points to 4.04% as market anticipates potential rate cuts
Yields advanced on the release of the monetary policy statement, which was widely perceived as slightly “hawkish.” Nevertheless, all changed once Powell hit the stands.
Powell said that the disinflation process “broadened” and acknowledged that the jobs market would be a crucial piece of the puzzle to reduce borrowing costs, not just inflation.
Following these remarks, Friday’s July Nonfarm Payrolls report will be a crucial piece of the puzzle as the Fed pivots towards becoming more concerned about employment.
When asked about discussions of lowering rates in the July meeting, Powell commented that officials discussed a July rate cut, but the majority opted to keep the federal fund's rates (FFR) unchanged at current rates.
Data-wise, US private hiring decelerated in July, according to the Automatic Data Processing (ADP) Employment Change report. Additionally, Building Permits improved following May’s plunge. Meanwhile, the Employment Cost Index (ECI), monitored by the Fed as a measure of inflationary pressures in wages, dipped in the second quarter of 2024.
Following the Fed’s decision, market participants had priced in three rate cuts toward the end of the year, according to the CME FedWatch Tool.
Fed FAQs
Monetary policy in the US is shaped by the Federal Reserve (Fed). The Fed has two mandates: to achieve price stability and foster full employment. Its primary tool to achieve these goals is by adjusting interest rates. When prices are rising too quickly and inflation is above the Fed’s 2% target, it raises interest rates, increasing borrowing costs throughout the economy. This results in a stronger US Dollar (USD) as it makes the US a more attractive place for international investors to park their money. When inflation falls below 2% or the Unemployment Rate is too high, the Fed may lower interest rates to encourage borrowing, which weighs on the Greenback.
The Federal Reserve (Fed) holds eight policy meetings a year, where the Federal Open Market Committee (FOMC) assesses economic conditions and makes monetary policy decisions. The FOMC is attended by twelve Fed officials – the seven members of the Board of Governors, the president of the Federal Reserve Bank of New York, and four of the remaining eleven regional Reserve Bank presidents, who serve one-year terms on a rotating basis.
In extreme situations, the Federal Reserve may resort to a policy named Quantitative Easing (QE). QE is the process by which the Fed substantially increases the flow of credit in a stuck financial system. It is a non-standard policy measure used during crises or when inflation is extremely low. It was the Fed’s weapon of choice during the Great Financial Crisis in 2008. It involves the Fed printing more Dollars and using them to buy high grade bonds from financial institutions. QE usually weakens the US Dollar.
Quantitative tightening (QT) is the reverse process of QE, whereby the Federal Reserve stops buying bonds from financial institutions and does not reinvest the principal from the bonds it holds maturing, to purchase new bonds. It is usually positive for the value of the US Dollar.
The unexpected rate hike by the BoJ surprised the FX world on Wednesday, while the Fed left its policy rate unchanged, although it signaled a potential rate cut in September. Next on tap comes the BoE, with odds split regarding a probable rate reduction.
Here is what you need to know on Thursday, August 1:
The USD Index (DXY) suffered the BoJ-driven strength in the Japanese yen and the somewhat dovish message from Chief Powell after the Fed left rates unchanged, as anticipated. On August 1, the ISM Manufacturing PMI takes centre stage along with usual Initial Jobless Claims, Construction Spending and the final S&P Global Manufacturing PMI.
EUR/USD reversed part of the weekly retracement, revisiting once again the 1.0850 region. The final HCOB Manufacturing PMI in Germany and the EMU are due on August 1 seconded by the ECB Economic Bulletin and the Unemployment Rate in the euro bloc.
GBP/USD printed modest gains around 1.2850 amidst steady prudence pre-BoE and the weaker Dollar. On August 1, the BoE will decide on its policy rate. Additionally on the UK calendar, Nationwide Housing Prices are due followed by the final S&P Global Manufacturing PMI.
The surprising rate hike by the BoJ prompted USD/JPY to retreat sharply and breach the key 150.00 support, printing fresh four-month lows. On August 1, the only release of note in Japan will be the weekly Foreign Bond Investment figures.
AUD/USD lost further ground and broke below the 0.6500 support, opening the door to further losses in the very near term. The final Judo Bank Manufacturing PMI is expected on August 1 along with the Balance of Trade figures.
Finally, some respite for WTI prices came on the back of rising geopolitical concerns and another drop in weekly US crude oil inventories, all lifting prices back to the vicinity of the $78.00 mark per barrel.
Prices of Gold added to Tuesday’s advance and retested the $2,440 region per ounce troy. Silver followed suit, posting gains for the second straight session and approaching the $29.00 mark per ounce.
Federal Reserve Chair Jerome Powell explains the decision to leave the policy rate, the federal funds rate, unchanged at the range of 5.25%-5.5% and responds to questions in the post-meeting press conference.
Key takeaways
"Some people examined the case today for moving at this meeting."
"But overwhelmingly the sense of Committee was not at this meeting, but at next meeting if data supports it."
"No question that is now our base case."
"The time is approaching for a rate cut."
"Chances of hard landing are low."
"It's neither overheating or [a] sharply weakening economy."
Fed FAQs
Monetary policy in the US is shaped by the Federal Reserve (Fed). The Fed has two mandates: to achieve price stability and foster full employment. Its primary tool to achieve these goals is by adjusting interest rates. When prices are rising too quickly and inflation is above the Fed’s 2% target, it raises interest rates, increasing borrowing costs throughout the economy. This results in a stronger US Dollar (USD) as it makes the US a more attractive place for international investors to park their money. When inflation falls below 2% or the Unemployment Rate is too high, the Fed may lower interest rates to encourage borrowing, which weighs on the Greenback.
The Federal Reserve (Fed) holds eight policy meetings a year, where the Federal Open Market Committee (FOMC) assesses economic conditions and makes monetary policy decisions. The FOMC is attended by twelve Fed officials – the seven members of the Board of Governors, the president of the Federal Reserve Bank of New York, and four of the remaining eleven regional Reserve Bank presidents, who serve one-year terms on a rotating basis.
In extreme situations, the Federal Reserve may resort to a policy named Quantitative Easing (QE). QE is the process by which the Fed substantially increases the flow of credit in a stuck financial system. It is a non-standard policy measure used during crises or when inflation is extremely low. It was the Fed’s weapon of choice during the Great Financial Crisis in 2008. It involves the Fed printing more Dollars and using them to buy high grade bonds from financial institutions. QE usually weakens the US Dollar.
Quantitative tightening (QT) is the reverse process of QE, whereby the Federal Reserve stops buying bonds from financial institutions and does not reinvest the principal from the bonds it holds maturing, to purchase new bonds. It is usually positive for the value of the US Dollar.
Federal Reserve Chairman Jerome Powell explains the decision to leave the policy rate, federal funds rate, unchanged at the range of 5.25%-5.5% and responds to questions in the post-meeting press conference.
Key takeaways
"Total scope of data suggest normalizing labor market."
"Job vacancies are still high by historical standards."
"Can't look to history as a guide to future."
"The picture is not one of a really bad economy, just spots of weakness."
"We don't change our approach according to political calendar."
"We never use our tools to support or oppose a politician or party."
"If we stick to our part, it benefits all Americans."
"That's what we believe and is how we always operate."
"Anything we do before, during or after election will be based on data, outlook and risks."
"We are a non political agency."
"We would never try to make policy decisions based on the outcome of an election that hasn't happened yet."
"There are always meaningful differences of views on FOMC."
Inflation FAQs
Inflation measures the rise in the price of a representative basket of goods and services. Headline inflation is usually expressed as a percentage change on a month-on-month (MoM) and year-on-year (YoY) basis. Core inflation excludes more volatile elements such as food and fuel which can fluctuate because of geopolitical and seasonal factors. Core inflation is the figure economists focus on and is the level targeted by central banks, which are mandated to keep inflation at a manageable level, usually around 2%.
The Consumer Price Index (CPI) measures the change in prices of a basket of goods and services over a period of time. It is usually expressed as a percentage change on a month-on-month (MoM) and year-on-year (YoY) basis. Core CPI is the figure targeted by central banks as it excludes volatile food and fuel inputs. When Core CPI rises above 2% it usually results in higher interest rates and vice versa when it falls below 2%. Since higher interest rates are positive for a currency, higher inflation usually results in a stronger currency. The opposite is true when inflation falls.
Although it may seem counter-intuitive, high inflation in a country pushes up the value of its currency and vice versa for lower inflation. This is because the central bank will normally raise interest rates to combat the higher inflation, which attract more global capital inflows from investors looking for a lucrative place to park their money.
Formerly, Gold was the asset investors turned to in times of high inflation because it preserved its value, and whilst investors will often still buy Gold for its safe-haven properties in times of extreme market turmoil, this is not the case most of the time. This is because when inflation is high, central banks will put up interest rates to combat it. Higher interest rates are negative for Gold because they increase the opportunity-cost of holding Gold vis-a-vis an interest-bearing asset or placing the money in a cash deposit account. On the flipside, lower inflation tends to be positive for Gold as it brings interest rates down, making the bright metal a more viable investment alternative.
Federal Reserve Chairman Jerome Powell explains the decision to leave the policy rate, federal funds rate, unchanged at the range of 5.25%-5.5% and responds to questions in the post-meeting press conference.
Key takeaways
"We have a very difficult judgment call on rates."
"All 19 participants supported decision today."
"There was a real discussion about the case for reducing rates at this meeting."
"Strong majority supported not moving rates at this meeting."
"Policy lags beginning to show up in economy over last 6 months."
"I feel good about where we are."
"We are well positioned to respond to any weakness in the economy, not what we are seeing though."
"We have a lot of room to respond if we saw weakness."
"Wage gains are still at a high level."
"Total scope of data suggest normalizing labor market."
Fed FAQs
Monetary policy in the US is shaped by the Federal Reserve (Fed). The Fed has two mandates: to achieve price stability and foster full employment. Its primary tool to achieve these goals is by adjusting interest rates. When prices are rising too quickly and inflation is above the Fed’s 2% target, it raises interest rates, increasing borrowing costs throughout the economy. This results in a stronger US Dollar (USD) as it makes the US a more attractive place for international investors to park their money. When inflation falls below 2% or the Unemployment Rate is too high, the Fed may lower interest rates to encourage borrowing, which weighs on the Greenback.
The Federal Reserve (Fed) holds eight policy meetings a year, where the Federal Open Market Committee (FOMC) assesses economic conditions and makes monetary policy decisions. The FOMC is attended by twelve Fed officials – the seven members of the Board of Governors, the president of the Federal Reserve Bank of New York, and four of the remaining eleven regional Reserve Bank presidents, who serve one-year terms on a rotating basis.
In extreme situations, the Federal Reserve may resort to a policy named Quantitative Easing (QE). QE is the process by which the Fed substantially increases the flow of credit in a stuck financial system. It is a non-standard policy measure used during crises or when inflation is extremely low. It was the Fed’s weapon of choice during the Great Financial Crisis in 2008. It involves the Fed printing more Dollars and using them to buy high grade bonds from financial institutions. QE usually weakens the US Dollar.
Quantitative tightening (QT) is the reverse process of QE, whereby the Federal Reserve stops buying bonds from financial institutions and does not reinvest the principal from the bonds it holds maturing, to purchase new bonds. It is usually positive for the value of the US Dollar.
Federal Reserve Chairman Jerome Powell explains the decision to leave the policy rate, federal funds rate, unchanged at the range of 5.25%-5.5% and responds to questions in the post-meeting press conference.
Key takeaways
"Upside risks to inflation have decreased."
"Downside risks to employment mandate are real now."
"Policy rate is clearly restrictive."
"Time is coming when it will begin to be appropriate to dial back restriction."
"We'll get a lot of data between now and September."
"We've seen some tendency to have a narrowing base of job creation some months, but not in others."
"We do look at private demand extra carefully."
US Dollar FAQs
The US Dollar (USD) is the official currency of the United States of America, and the ‘de facto’ currency of a significant number of other countries where it is found in circulation alongside local notes. It is the most heavily traded currency in the world, accounting for over 88% of all global foreign exchange turnover, or an average of $6.6 trillion in transactions per day, according to data from 2022. Following the second world war, the USD took over from the British Pound as the world’s reserve currency. For most of its history, the US Dollar was backed by Gold, until the Bretton Woods Agreement in 1971 when the Gold Standard went away.
The most important single factor impacting on the value of the US Dollar is monetary policy, which is shaped by the Federal Reserve (Fed). The Fed has two mandates: to achieve price stability (control inflation) and foster full employment. Its primary tool to achieve these two goals is by adjusting interest rates. When prices are rising too quickly and inflation is above the Fed’s 2% target, the Fed will raise rates, which helps the USD value. When inflation falls below 2% or the Unemployment Rate is too high, the Fed may lower interest rates, which weighs on the Greenback.
In extreme situations, the Federal Reserve can also print more Dollars and enact quantitative easing (QE). QE is the process by which the Fed substantially increases the flow of credit in a stuck financial system. It is a non-standard policy measure used when credit has dried up because banks will not lend to each other (out of the fear of counterparty default). It is a last resort when simply lowering interest rates is unlikely to achieve the necessary result. It was the Fed’s weapon of choice to combat the credit crunch that occurred during the Great Financial Crisis in 2008. It involves the Fed printing more Dollars and using them to buy US government bonds predominantly from financial institutions. QE usually leads to a weaker US Dollar.
Quantitative tightening (QT) is the reverse process whereby the Federal Reserve stops buying bonds from financial institutions and does not reinvest the principal from the bonds it holds maturing in new purchases. It is usually positive for the US Dollar.
Federal Reserve Chairman Jerome Powell explains the decision to leave the policy rate, federal funds rate, unchanged at the range of 5.25%-5.5% and responds to questions in the post-meeting press conference.
Key takeaways
"Path ahead is going to depend on the economy."
"I can imagine a scenario of zero cuts to several cuts this year, depending on how the economy evolves."
"Data in labor market shows gradual normalization."
"We are back to closer to even focus on two mandates."
"We don't think of labor market as it is currently as a likely source of inflation pressures."
"That's why I don't want to see excess cooling in the labor market."
"We have made real progress on inflation, growing confidence on a path to 2%."
"If we see something that looks like a significant downturn in labor market, we would respond."
"Data we have been seeing in labor market has been consistent with normalization process."
Inflation FAQs
Inflation measures the rise in the price of a representative basket of goods and services. Headline inflation is usually expressed as a percentage change on a month-on-month (MoM) and year-on-year (YoY) basis. Core inflation excludes more volatile elements such as food and fuel which can fluctuate because of geopolitical and seasonal factors. Core inflation is the figure economists focus on and is the level targeted by central banks, which are mandated to keep inflation at a manageable level, usually around 2%.
The Consumer Price Index (CPI) measures the change in prices of a basket of goods and services over a period of time. It is usually expressed as a percentage change on a month-on-month (MoM) and year-on-year (YoY) basis. Core CPI is the figure targeted by central banks as it excludes volatile food and fuel inputs. When Core CPI rises above 2% it usually results in higher interest rates and vice versa when it falls below 2%. Since higher interest rates are positive for a currency, higher inflation usually results in a stronger currency. The opposite is true when inflation falls.
Although it may seem counter-intuitive, high inflation in a country pushes up the value of its currency and vice versa for lower inflation. This is because the central bank will normally raise interest rates to combat the higher inflation, which attract more global capital inflows from investors looking for a lucrative place to park their money.
Formerly, Gold was the asset investors turned to in times of high inflation because it preserved its value, and whilst investors will often still buy Gold for its safe-haven properties in times of extreme market turmoil, this is not the case most of the time. This is because when inflation is high, central banks will put up interest rates to combat it. Higher interest rates are negative for Gold because they increase the opportunity-cost of holding Gold vis-a-vis an interest-bearing asset or placing the money in a cash deposit account. On the flipside, lower inflation tends to be positive for Gold as it brings interest rates down, making the bright metal a more viable investment alternative.
Federal Reserve Chairman Jerome Powell explains the decision to leave the policy rate, federal funds rate, unchanged at the range of 5.25%-5.5% and responds to questions in the post-meeting press conference.
Key takeaways
"We have made no decisions about future meetings."
"Broad sense at FOMC is we are moving closer."
"We are data dependent but not data point dependent."
"The Question will be if the totality of data is consistent with rising confidence on inflation and jobs."
"Rate cut could be on the table in September."
"We are getting closer to being at point to reduce rates."
"Not quite at that point yet."
"If we see inflation moving down quickly or in line with expectations, growth reasonably strong and labor market remains consistent with current conditions, a rate cut could be on the table in September."
"If inflation disappoints, we would weight that."
"There is not going to be any one thing that makes us decide."
"Last couple of inflation readings have added to confidence."
"We want to see more good data to gain more confidence."
US Dollar FAQs
The US Dollar (USD) is the official currency of the United States of America, and the ‘de facto’ currency of a significant number of other countries where it is found in circulation alongside local notes. It is the most heavily traded currency in the world, accounting for over 88% of all global foreign exchange turnover, or an average of $6.6 trillion in transactions per day, according to data from 2022. Following the second world war, the USD took over from the British Pound as the world’s reserve currency. For most of its history, the US Dollar was backed by Gold, until the Bretton Woods Agreement in 1971 when the Gold Standard went away.
The most important single factor impacting on the value of the US Dollar is monetary policy, which is shaped by the Federal Reserve (Fed). The Fed has two mandates: to achieve price stability (control inflation) and foster full employment. Its primary tool to achieve these two goals is by adjusting interest rates. When prices are rising too quickly and inflation is above the Fed’s 2% target, the Fed will raise rates, which helps the USD value. When inflation falls below 2% or the Unemployment Rate is too high, the Fed may lower interest rates, which weighs on the Greenback.
In extreme situations, the Federal Reserve can also print more Dollars and enact quantitative easing (QE). QE is the process by which the Fed substantially increases the flow of credit in a stuck financial system. It is a non-standard policy measure used when credit has dried up because banks will not lend to each other (out of the fear of counterparty default). It is a last resort when simply lowering interest rates is unlikely to achieve the necessary result. It was the Fed’s weapon of choice to combat the credit crunch that occurred during the Great Financial Crisis in 2008. It involves the Fed printing more Dollars and using them to buy US government bonds predominantly from financial institutions. QE usually leads to a weaker US Dollar.
Quantitative tightening (QT) is the reverse process whereby the Federal Reserve stops buying bonds from financial institutions and does not reinvest the principal from the bonds it holds maturing in new purchases. It is usually positive for the US Dollar.
Federal Reserve Chairman Jerome Powell explains the decision to leave the policy rate, federal funds rate, unchanged at the range of 5.25%-5.5% and responds to questions in the post-meeting press conference.
Key takeaways
"Longer-term inflation expectations appear well anchored."
"As labor market has cooled, inflation has declined and risks have continued to move into better balance."
"We need greater confidence on inflation."
"Second quarter inflation readings have added to confidence our confidence."
"We will carefully assess incoming data for future decisions."
""We will take actions that promote our dual goals."
"The policy is well positioned to deal with dual mandate risks."
Interest rates FAQs
Interest rates are charged by financial institutions on loans to borrowers and are paid as interest to savers and depositors. They are influenced by base lending rates, which are set by central banks in response to changes in the economy. Central banks normally have a mandate to ensure price stability, which in most cases means targeting a core inflation rate of around 2%. If inflation falls below target the central bank may cut base lending rates, with a view to stimulating lending and boosting the economy. If inflation rises substantially above 2% it normally results in the central bank raising base lending rates in an attempt to lower inflation.
Higher interest rates generally help strengthen a country’s currency as they make it a more attractive place for global investors to park their money.
Higher interest rates overall weigh on the price of Gold because they increase the opportunity cost of holding Gold instead of investing in an interest-bearing asset or placing cash in the bank. If interest rates are high that usually pushes up the price of the US Dollar (USD), and since Gold is priced in Dollars, this has the effect of lowering the price of Gold.
The Fed funds rate is the overnight rate at which US banks lend to each other. It is the oft-quoted headline rate set by the Federal Reserve at its FOMC meetings. It is set as a range, for example 4.75%-5.00%, though the upper limit (in that case 5.00%) is the quoted figure. Market expectations for future Fed funds rate are tracked by the CME FedWatch tool, which shapes how many financial markets behave in anticipation of future Federal Reserve monetary policy decisions.
Federal Reserve Chairman Jerome Powell explains the decision to leave the policy rate, federal funds rate, unchanged at the range of 5.25%-5.5% and responds to questions in the post-meeting press conference.
Key takeaways
"The labor market has come into better balance."
"We are maintaining our restrictive stance."
"We are attentive to risks on both sides of the dual mandate."
"Growth of consumer spending remains solid but has slowed."
"Investment in the housing sector stalled in the second quarter."
"The unemployment rate remains low."
"Data suggests the labor market has returned to where it was on the eve of the pandemic."
"A broad set of labor market indicators show it is strong but not overheated."
"Inflation remains somewhat above 2% goal."
Fed FAQs
Monetary policy in the US is shaped by the Federal Reserve (Fed). The Fed has two mandates: to achieve price stability and foster full employment. Its primary tool to achieve these goals is by adjusting interest rates. When prices are rising too quickly and inflation is above the Fed’s 2% target, it raises interest rates, increasing borrowing costs throughout the economy. This results in a stronger US Dollar (USD) as it makes the US a more attractive place for international investors to park their money. When inflation falls below 2% or the Unemployment Rate is too high, the Fed may lower interest rates to encourage borrowing, which weighs on the Greenback.
The Federal Reserve (Fed) holds eight policy meetings a year, where the Federal Open Market Committee (FOMC) assesses economic conditions and makes monetary policy decisions. The FOMC is attended by twelve Fed officials – the seven members of the Board of Governors, the president of the Federal Reserve Bank of New York, and four of the remaining eleven regional Reserve Bank presidents, who serve one-year terms on a rotating basis.
In extreme situations, the Federal Reserve may resort to a policy named Quantitative Easing (QE). QE is the process by which the Fed substantially increases the flow of credit in a stuck financial system. It is a non-standard policy measure used during crises or when inflation is extremely low. It was the Fed’s weapon of choice during the Great Financial Crisis in 2008. It involves the Fed printing more Dollars and using them to buy high grade bonds from financial institutions. QE usually weakens the US Dollar.
Quantitative tightening (QT) is the reverse process of QE, whereby the Federal Reserve stops buying bonds from financial institutions and does not reinvest the principal from the bonds it holds maturing, to purchase new bonds. It is usually positive for the value of the US Dollar.
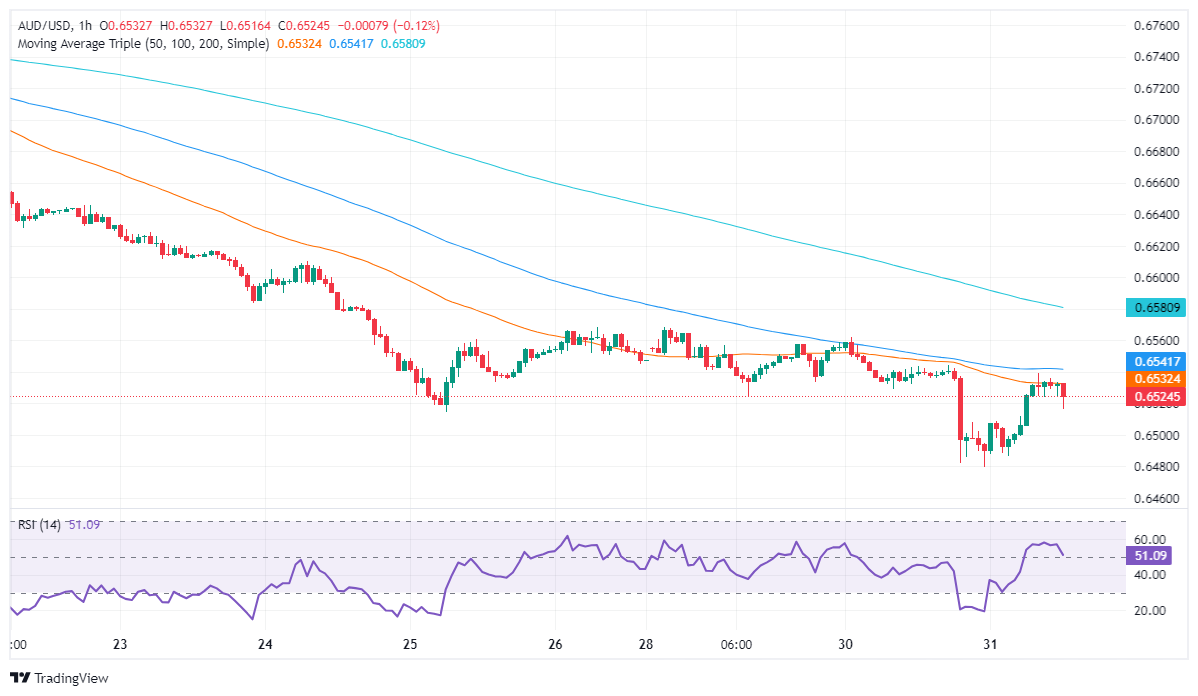
- AUD/USD drops to 0.6516 before recovering, trading around 0.6500-0.6540 after Fed's "hawkish" hold.
- Fed acknowledges inflation progress but remains cautious, strengthening the US Dollar.
- Key resistance at 0.6524, 0.6532, and 0.6541 (50, 100, 200-hour SMAs); support below 0.6500 with potential to test 0.6479 and 0.6450 levels.
The AUD/USD extended its losses and tumbled after the Federal Reserve, despite holding rates unchanged, resisted lowering borrowing costs. Officials recognized the progress on inflation but are not fully confident in beginning the easing policy. The pair trades at around 0.6500-0.6540 down ahead of Fed Chair Powell's press conference.
AUD/USD pressures to 0.6500; will Powell push prices lower?
Powell and Co. delivered a “hawkish” hold, even though they made some changes to the monetary policy statement. Nevertheless, stating that “The Committee does not expect it will be appropriate to reduce the target range until it has gained greater confidence that inflation is moving sustainably toward 2 percent” strengthened the US Dollar, which has trimmed some of its losses.
The Federal Reserve acknowledged that inflation has eased somewhat over the year but “remains somewhat elevated.” Policymakers noted that the dual mandate risks have become more balanced and that “the Committee is attentive to the risks to both sides of its dual mandate.”
Regarding its balance sheet reduction, the Committee stated it “will continue reducing its holdings of Treasury securities and agency debt and agency mortgage‑backed securities.” The Fed reinforced its commitment to returning inflation to its 2% objective.
AUD/USD Reaction to Federal Reserve’s decision
The AUD/USD trades volatile and fell to 0.6516 on the Fed’s policy statement release, yet has recovered some ground, yet faces key resistance levels at the 50, 100, and 200-hour SMAs, each at 0.6524, 0.6532, and 0.6541.
If Powell turns dovish, those levels could be cleared and will expose the 0.6600 figure. Otherwise, further AUD/USD weakness could cause the pair to fall beneath 0.6500 and test today’s low of 0.6479, followed by the 0.6450 psychological level.
Australian Dollar PRICE Today
The table below shows the percentage change of Australian Dollar (AUD) against listed major currencies today. Australian Dollar was the strongest against the Euro.
| USD | EUR | GBP | JPY | CAD | AUD | NZD | CHF | |
|---|---|---|---|---|---|---|---|---|
| USD | 0.06% | 0.02% | -1.22% | -0.27% | 0.19% | -0.60% | -0.17% | |
| EUR | -0.06% | -0.02% | -1.24% | -0.34% | 0.14% | -0.64% | -0.22% | |
| GBP | -0.02% | 0.02% | -1.26% | -0.32% | 0.14% | -0.62% | -0.21% | |
| JPY | 1.22% | 1.24% | 1.26% | 1.02% | 1.43% | 0.63% | 1.10% | |
| CAD | 0.27% | 0.34% | 0.32% | -1.02% | 0.44% | -0.33% | 0.09% | |
| AUD | -0.19% | -0.14% | -0.14% | -1.43% | -0.44% | -0.78% | -0.36% | |
| NZD | 0.60% | 0.64% | 0.62% | -0.63% | 0.33% | 0.78% | 0.43% | |
| CHF | 0.17% | 0.22% | 0.21% | -1.10% | -0.09% | 0.36% | -0.43% |
The heat map shows percentage changes of major currencies against each other. The base currency is picked from the left column, while the quote currency is picked from the top row. For example, if you pick the Australian Dollar from the left column and move along the horizontal line to the US Dollar, the percentage change displayed in the box will represent AUD (base)/USD (quote).
- US Dollar exhibited strength after market participants took in the Fed's decision.
- Despite showing signs of disinflation, the US economy remains resilient, which keeps the Fed data-dependent.
- The odds of a cut in September declined after the decision but remain high.
The US Dollar, tracked by the DXY index, lost ground on Wednesday before the Federal Reserve’s meeting but managed to clear losses after the announcement. Even though markets are strongly hinting at a rate cut in September, the robust disposition of the US economy may encourage Jerome Powell to request additional data before reducing rates, which could stimulate further demand for the USD.
Signs of disinflation are beginning to permeate the US economic landscape, affirming the market's belief in a forthcoming rate cut in September. However, the larger economy continues to depict strength, as underscored by last week's data surprises like the Q2 Gross Domestic Product (GDP) and July S&P Global PMIs.
Daily digest market movers: USD gains after FOMC's decision, Powell’s presser
- The Federal Reserve has decided to hold the target range for the federal funds rate at 5.25% to 5.5%.
- The statement mentioned that economic activity continues to expand albeit with moderated job gains and a slight increase in unemployment.
- The bank stated that inflation has eased, but that it remains elevated.
- Markets await Powell’s presser for further guidance
- The odds of a September cut remain high, but they will depend on incoming data. Hence Weekly Jobless Claims and Nonfarm Payrolls at the end of the week will be closely relied on for direction.
DXY technical outlook: Neutral to bearish positioning forms as index drops below key SMAs
Despite a promising weekly start, the DXY index is experiencing a downturn, falling below both the 20-day and 200-day Simple Moving Averages (SMA). These two indicators seem to be converging toward a bearish crossover at around 104.00, which could add more selling pressure.
The Relative Strength Index (RSI) and Moving Average Convergence Divergence (MACD), although not fully recovered, demonstrate a gradual return to neutral territory, but if they jump to positive terrain, the DXY is poised for further downside. The index continues to find support at the 104.15 and 104.00 levels, while resistance is observed at the 104.50 and 105.00 levels.
Fed FAQs
Monetary policy in the US is shaped by the Federal Reserve (Fed). The Fed has two mandates: to achieve price stability and foster full employment. Its primary tool to achieve these goals is by adjusting interest rates. When prices are rising too quickly and inflation is above the Fed’s 2% target, it raises interest rates, increasing borrowing costs throughout the economy. This results in a stronger US Dollar (USD) as it makes the US a more attractive place for international investors to park their money. When inflation falls below 2% or the Unemployment Rate is too high, the Fed may lower interest rates to encourage borrowing, which weighs on the Greenback.
The Federal Reserve (Fed) holds eight policy meetings a year, where the Federal Open Market Committee (FOMC) assesses economic conditions and makes monetary policy decisions. The FOMC is attended by twelve Fed officials – the seven members of the Board of Governors, the president of the Federal Reserve Bank of New York, and four of the remaining eleven regional Reserve Bank presidents, who serve one-year terms on a rotating basis.
In extreme situations, the Federal Reserve may resort to a policy named Quantitative Easing (QE). QE is the process by which the Fed substantially increases the flow of credit in a stuck financial system. It is a non-standard policy measure used during crises or when inflation is extremely low. It was the Fed’s weapon of choice during the Great Financial Crisis in 2008. It involves the Fed printing more Dollars and using them to buy high grade bonds from financial institutions. QE usually weakens the US Dollar.
Quantitative tightening (QT) is the reverse process of QE, whereby the Federal Reserve stops buying bonds from financial institutions and does not reinvest the principal from the bonds it holds maturing, to purchase new bonds. It is usually positive for the value of the US Dollar.
- EUR/USD tilted toward the downside after a cautious Fed statement.
- All eyes on Fed Chair Powell’s upcoming press conference.
- Fed language cooled rate cut bets in September, but only slightly.
EUR/USD is churning chart paper near 1.0800 after the Federal Reserve (Fed) struck a notably measured tone regarding interest rates on Wednesday. Shifts in Monetary Policy Report language were much less confident on rate cut expectations than many market participants had been hoping for, with cautious tones about inflation and upbeat employment expectations miring odds of a quarter-point trim in September.
Breaking: Fed leaves interest rate unchanged at 5.25%-5.5% as forecast
Still, markets are pricing in 100% odds of a rate cut when the Federal Open Market Committee (FOMC) convenes in September, but added emphasis on key US data in the weeks ahead will spark more volatility as investors hope, counterintuitively, for a continued softening in headline US economic data to keep the Fed on the rails to a rate cut on September 18.
US Nonfarm Payrolls (NFP) clouds the scope for Friday, with forecasts calling for another downturn in overall US hiring while Average Hourly Earnings are expected to hold steady month-on-month.
EUR/USD technical outlook
Fiber remains mired in intraday technical congestion near the 1.0800 handle as bulls fail repeatedly to push near-term bidding back above the 200-hour Exponential Moving Average (EMA) near 1.0844. Price action is grinding into the midrange as daily candlesticks find technical support from the 200-day EMA at 1.0798, but momentum remains bearish as EUR/USD grinds down from the last swing high just above 1.0940.
EUR/USD hourly chart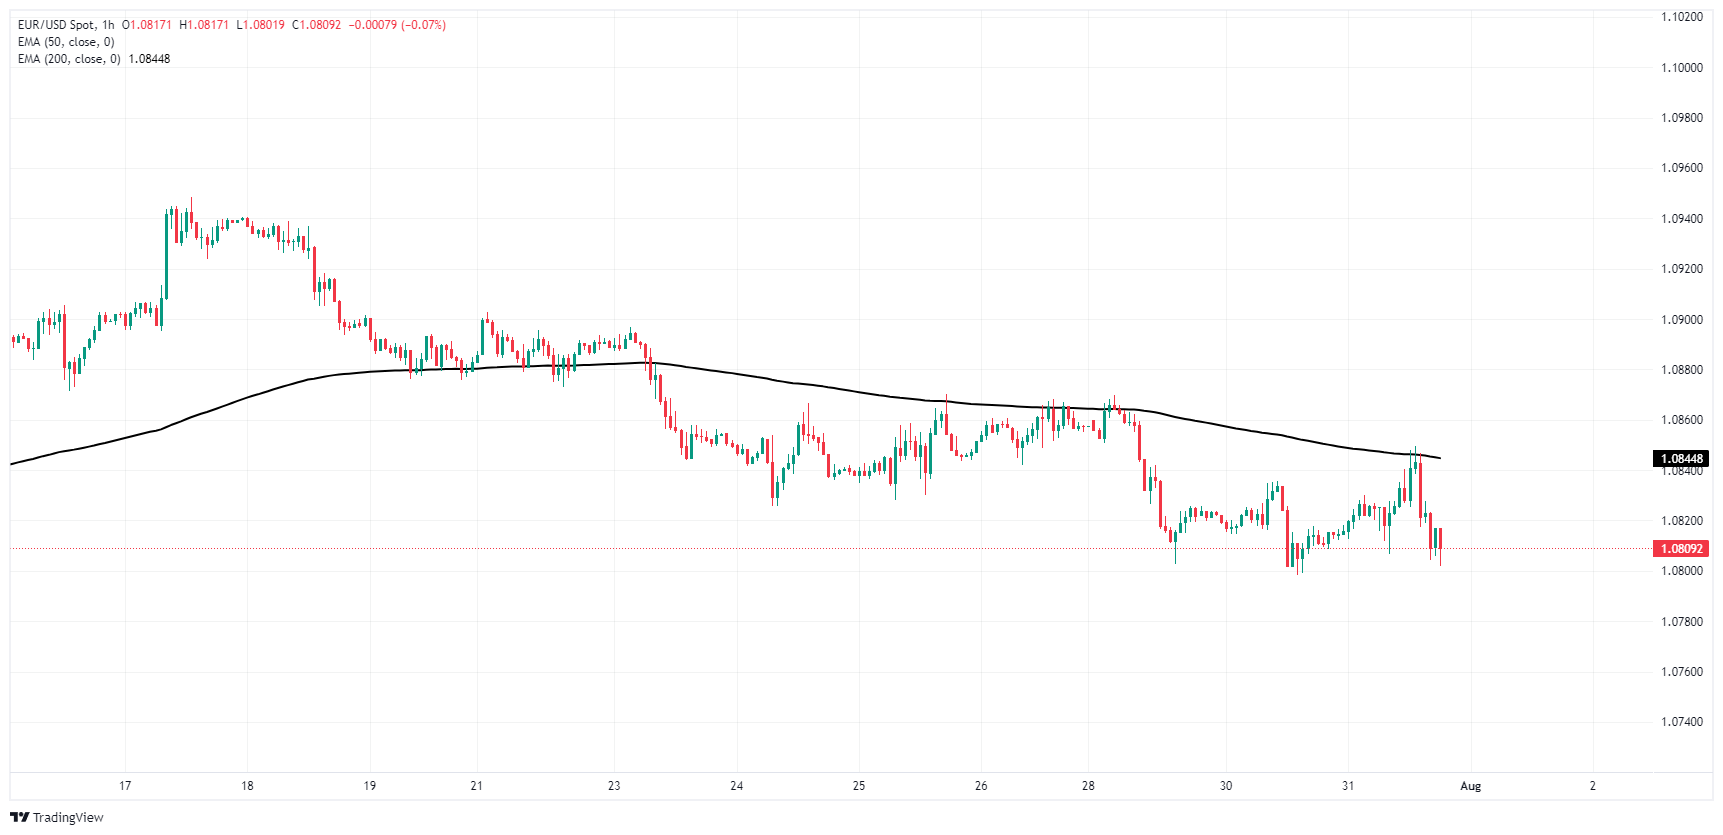
EUR/USD daily chart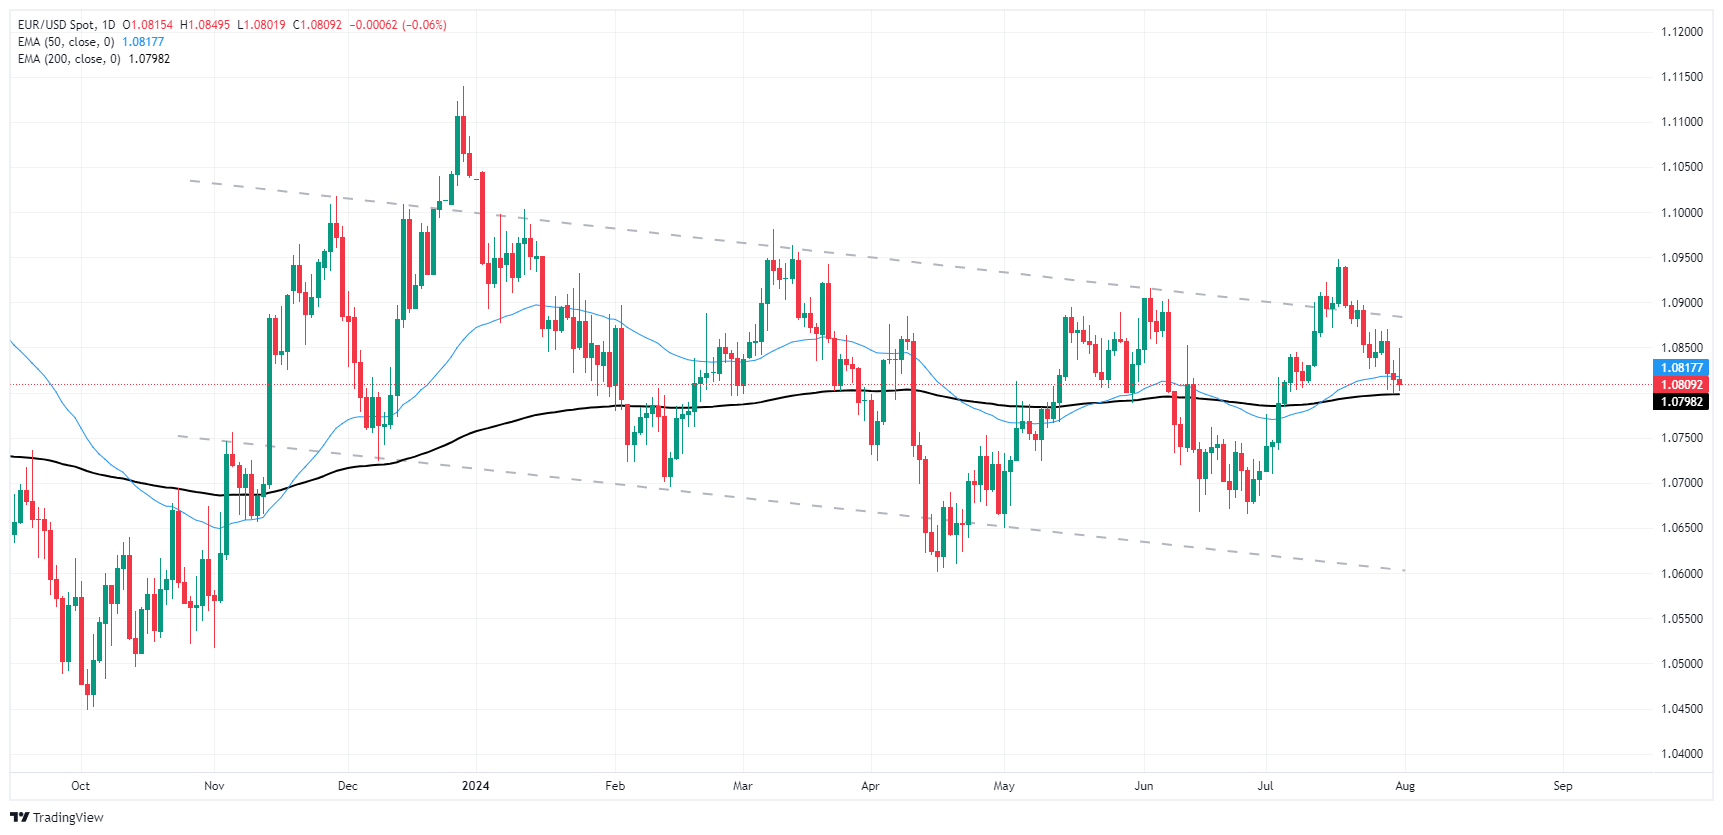
Fed FAQs
Monetary policy in the US is shaped by the Federal Reserve (Fed). The Fed has two mandates: to achieve price stability and foster full employment. Its primary tool to achieve these goals is by adjusting interest rates. When prices are rising too quickly and inflation is above the Fed’s 2% target, it raises interest rates, increasing borrowing costs throughout the economy. This results in a stronger US Dollar (USD) as it makes the US a more attractive place for international investors to park their money. When inflation falls below 2% or the Unemployment Rate is too high, the Fed may lower interest rates to encourage borrowing, which weighs on the Greenback.
The Federal Reserve (Fed) holds eight policy meetings a year, where the Federal Open Market Committee (FOMC) assesses economic conditions and makes monetary policy decisions. The FOMC is attended by twelve Fed officials – the seven members of the Board of Governors, the president of the Federal Reserve Bank of New York, and four of the remaining eleven regional Reserve Bank presidents, who serve one-year terms on a rotating basis.
In extreme situations, the Federal Reserve may resort to a policy named Quantitative Easing (QE). QE is the process by which the Fed substantially increases the flow of credit in a stuck financial system. It is a non-standard policy measure used during crises or when inflation is extremely low. It was the Fed’s weapon of choice during the Great Financial Crisis in 2008. It involves the Fed printing more Dollars and using them to buy high grade bonds from financial institutions. QE usually weakens the US Dollar.
Quantitative tightening (QT) is the reverse process of QE, whereby the Federal Reserve stops buying bonds from financial institutions and does not reinvest the principal from the bonds it holds maturing, to purchase new bonds. It is usually positive for the value of the US Dollar.
- GBP/USD fluctuates, registering modest losses after Fed's decision to hold rates steady.
- Fed emphasizes no rate cuts until inflation sustainably nears 2%, maintaining balance sheet reduction.
- Key resistance at 1.2843 (50-hour SMA), 1.2855 (100-hour SMA), and 1.2873 (200-hour SMA); support at 1.2800, 1.2778, and 1.2750.
The GBP/USD whipsawed during the North American session after the Federal Reserve (Fed) decided to keep rates unchanged yet pushed back against easing policy, noting, “The Committee does not expect it will be appropriate to reduce the target range until it has gained greater confidence that inflation is moving sustainably toward 2 percent.” The major trades are volatile, around 1.2800-1.2850, and register modest losses.
GBP/USD dips slightly on Fed’s hawkish hold
The Federal Reserve acknowledged that inflation has eased somewhat over the year yet “remains somewhat elevated.” Policymakers noted that the dual mandate risks became more balanced, and “the Committee is attentive to the risks to both sides of its dual mandate.”
Regarding its balance sheet reduction, “the Committee will continue reducing its holdings of Treasury securities and agency debt and agency mortgage‑backed securities” and the Fed reinforced its commitment to returning inflation to its 2% objective.
GBP/USD Reaction to Federal Reserve’s decision
The 1-hour chart witnessed the GBP/USD diving to a new day low of 1.2819 yet has recovered some as market participants await Powell’s press conference, for any hints to ease policy.
Key resistance lies at the 50-hour SMA at 1.2843, the 100-hour SMA at 1.2855 and further resistance at the 200-hour SMA at 1.2873. Once cleared the next resistance would be 1.2900.
On further weakness, the GBP/USD could test 1.2800, followed by the the July 9 low at 1.2778 and the psychological 1.2750. A further downside is seen at the 100-day moving average (DMA) at 1.2682.
British Pound PRICE Today
The table below shows the percentage change of British Pound (GBP) against listed major currencies today. British Pound was the strongest against the Australian Dollar.
| USD | EUR | GBP | JPY | CAD | AUD | NZD | CHF | |
|---|---|---|---|---|---|---|---|---|
| USD | 0.05% | 0.02% | -1.09% | -0.27% | 0.22% | -0.58% | -0.16% | |
| EUR | -0.05% | -0.01% | -1.16% | -0.33% | 0.16% | -0.62% | -0.22% | |
| GBP | -0.02% | 0.00% | -1.18% | -0.32% | 0.15% | -0.61% | -0.20% | |
| JPY | 1.09% | 1.16% | 1.18% | 0.93% | 1.35% | 0.55% | 1.01% | |
| CAD | 0.27% | 0.33% | 0.32% | -0.93% | 0.46% | -0.32% | 0.10% | |
| AUD | -0.22% | -0.16% | -0.15% | -1.35% | -0.46% | -0.78% | -0.38% | |
| NZD | 0.58% | 0.62% | 0.61% | -0.55% | 0.32% | 0.78% | 0.41% | |
| CHF | 0.16% | 0.22% | 0.20% | -1.01% | -0.10% | 0.38% | -0.41% |
The heat map shows percentage changes of major currencies against each other. The base currency is picked from the left column, while the quote currency is picked from the top row. For example, if you pick the British Pound from the left column and move along the horizontal line to the US Dollar, the percentage change displayed in the box will represent GBP (base)/USD (quote).
- Fed Held rates steady at 5.25%-5.5% as expected.
- Markets await Powell's presser for further insights.
- The 2,5 and 10-year yields remain down, favoring the non-yielding yellow metal.
On Wednesday, the XAU/USD rose to $2,440 and held its ground after the widely anticipated Federal Reserve (Fed) decision.
The US Federal Reserve has again decided to keep the policy rate unchanged at 5.25%-5.5%, marking the eighth consecutive meeting without a rate adjustment. Following the decision the 2, 5, and 10-year Treasury yields remain stable at 4.36%, 4.02%, and 4.11% respectively with investors keenly anticipating Federal Reserve Chair Jerome Powell's press conference for further insights.
Regarding the statement, there weren’t major language changes and the bank still considers that the inflation is somewhat elevated. There was no clear guidance regarding the September meeting which could be considered hawkish. As such the bank hints that it remains data-dependant.
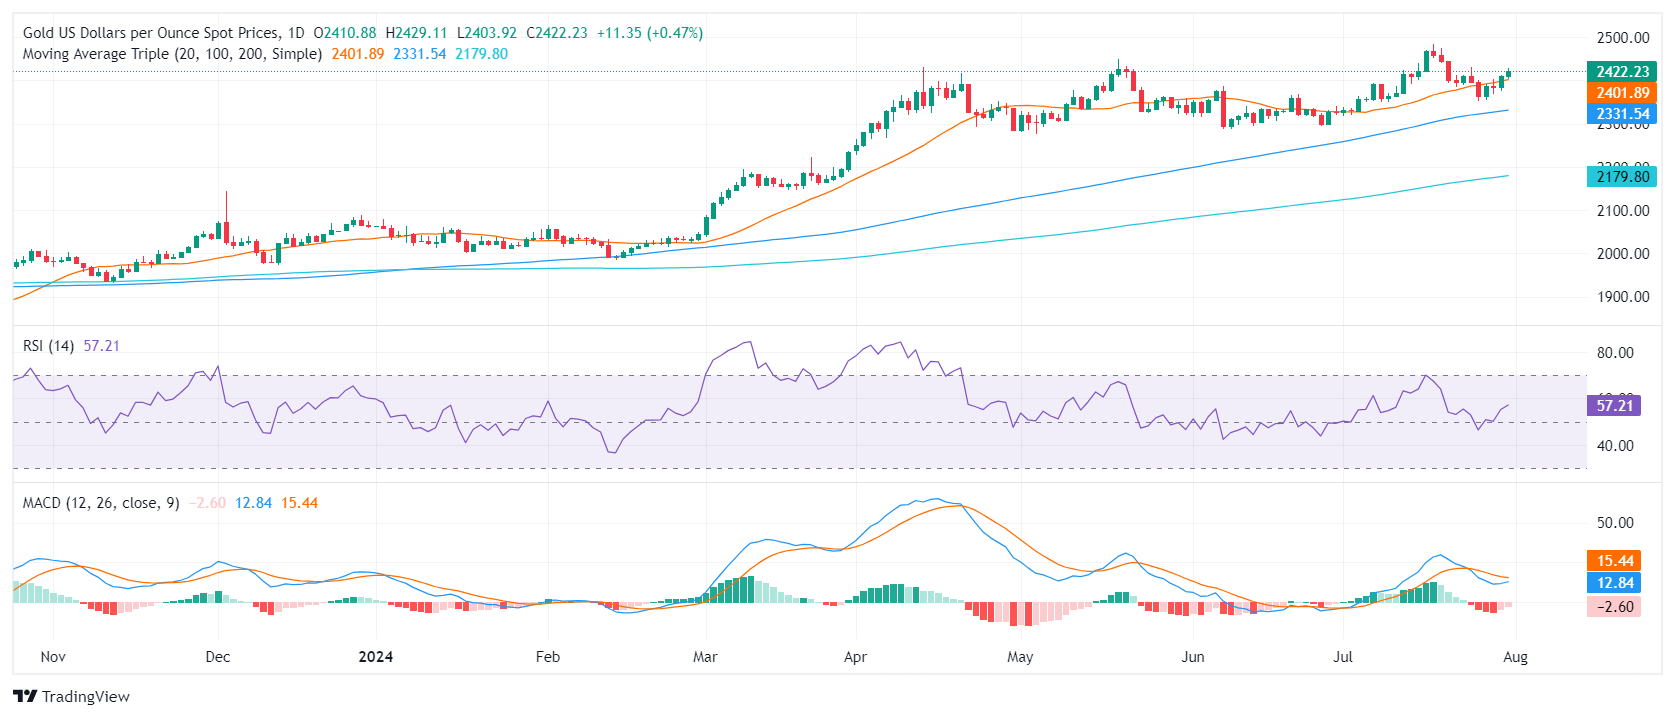
XAU/USD Technical analysis
The overall outlook is positive with the price above the 20,100 and 200-day Simple Moving Averages (SMA). Indicators also remain in positive terrain which indicates steady buying pressure. For the next sessions, markets should eye the $2,400 - $2,490 (cycle high) range for movements.
XAU/USD Daily chart
- Aussie remains weak after CPI data from Australia.
- Markets await the Fed’s decision later in the session.
- Divergences between the RBA and Fed might bail out the Aussie.
The Aussie continues to underperform on Wednesday as markets digest mixed inflation data from Australia. A slightly softer outlook from China continues to fuel concerns about the Australian economy. However, the Reserve Bank of Australia's (RBA) reluctance to introduce rate cuts due to high inflation could provide a safety net for the Aussie.
The continued high inflation pressure on the Australian economy is leading the RBA to hold off on rate cuts. Predictions suggest that the RBA will be among the last of the G10 countries to initiate a rate cut, a move that could limit further downside pressure on the Aussie.
Daily digest market movers: Aussie weakness remains after CPI data from Australia
- The prevalent 'risk-off' sentiment continues due to worries about a slowdown in the Chinese economy, significantly impacting Australia's economic stance. Attention is now focusing on the June and Q2 Consumer Price Index (CPI) figures released on Wednesday.
- The Australian Bureau of Statistics (ABS) reports that Australia's Q2 headline CPI saw an increase of 1.0% QoQ, with an acceleration to 3.8% YoY from the previous 3.6%. At the same time, June's headline CPI is projected to have fallen to 3.8% YoY.
- Considering the inflation rate considerably exceeds the 2-3% target range, the RBA is expected to remain patient with its policy changes. This cautious approach means that the swaps market predicts the first 25 bps cut coming only next summer.
- For the rest of the session, investors will eye the Federal Reserve (Fed) decision that will set the pair’s pace.
AUD/USD technical analysis: Bearish position, bullish traction is not enough to trigger a reaction
The AUD/USD's sustained trade below the 20, 100 and 200-day Simple Moving Average (SMA) confirms an overall bearish outlook. Despite indicator readings remaining firmly in negative territory, the oversold condition might prompt a correction. However, weak bullish momentum could lead to a period of sideways trading unless a major fundamental development occurs.
The key support levels have been adjusted to 0.6530 and 0.6500, with resistance levels at 0.6600 (200-day SMA), 0.6610 and 0.6630.
Australian Dollar FAQs
One of the most significant factors for the Australian Dollar (AUD) is the level of interest rates set by the Reserve Bank of Australia (RBA). Because Australia is a resource-rich country another key driver is the price of its biggest export, Iron Ore. The health of the Chinese economy, its largest trading partner, is a factor, as well as inflation in Australia, its growth rate and Trade Balance. Market sentiment – whether investors are taking on more risky assets (risk-on) or seeking safe-havens (risk-off) – is also a factor, with risk-on positive for AUD.
The Reserve Bank of Australia (RBA) influences the Australian Dollar (AUD) by setting the level of interest rates that Australian banks can lend to each other. This influences the level of interest rates in the economy as a whole. The main goal of the RBA is to maintain a stable inflation rate of 2-3% by adjusting interest rates up or down. Relatively high interest rates compared to other major central banks support the AUD, and the opposite for relatively low. The RBA can also use quantitative easing and tightening to influence credit conditions, with the former AUD-negative and the latter AUD-positive.
China is Australia’s largest trading partner so the health of the Chinese economy is a major influence on the value of the Australian Dollar (AUD). When the Chinese economy is doing well it purchases more raw materials, goods and services from Australia, lifting demand for the AUD, and pushing up its value. The opposite is the case when the Chinese economy is not growing as fast as expected. Positive or negative surprises in Chinese growth data, therefore, often have a direct impact on the Australian Dollar and its pairs.
Iron Ore is Australia’s largest export, accounting for $118 billion a year according to data from 2021, with China as its primary destination. The price of Iron Ore, therefore, can be a driver of the Australian Dollar. Generally, if the price of Iron Ore rises, AUD also goes up, as aggregate demand for the currency increases. The opposite is the case if the price of Iron Ore falls. Higher Iron Ore prices also tend to result in a greater likelihood of a positive Trade Balance for Australia, which is also positive of the AUD.
The Trade Balance, which is the difference between what a country earns from its exports versus what it pays for its imports, is another factor that can influence the value of the Australian Dollar. If Australia produces highly sought after exports, then its currency will gain in value purely from the surplus demand created from foreign buyers seeking to purchase its exports versus what it spends to purchase imports. Therefore, a positive net Trade Balance strengthens the AUD, with the opposite effect if the Trade Balance is negative.
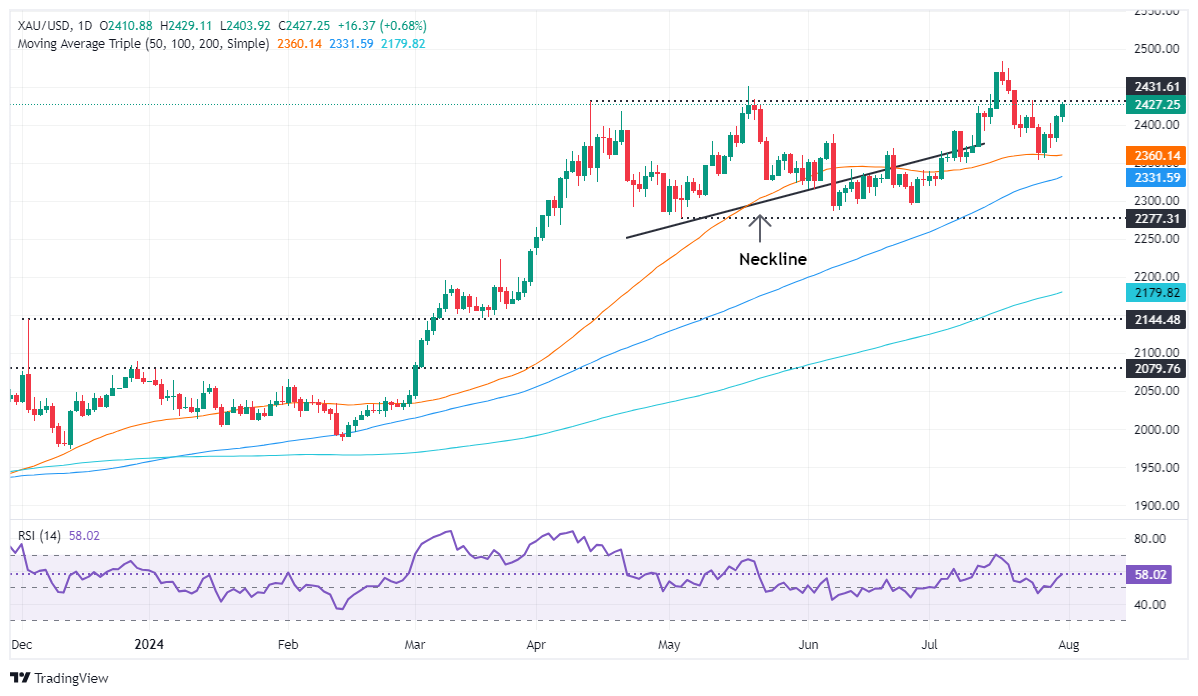
- Gold registers gains of 0.73% as markets anticipate Fed holding rates steady.
- US Dollar Index drops 0.20% to 104.24, undermined by lower Treasury yields.
- Geopolitical risks in the Middle East and safe-haven demand drive bullion prices higher.
Gold price edged higher during the North American session as traders estimate the Federal Reserve (Fed) will hold rates steady, but it would lay the ground for lower rates that were originally set higher due to an inflationary jump after the Covid-19 reopening. The XAU/USD trades at $2,427 and gains 0.73%.
The market mood remains upbeat ahead of the Fed’s decision at around 19:00 GMT. US Treasury bond yields along the belly and the end of the curve fall, undermining the Greenback. The US Dollar Index (DXY), which tracks the buck’s performance against six other currencies, drops 0.20% to 104.24.
Bullion prices witnessed a jump due to rising geopolitical risks following Hezbollah’s weekend attack on Israel, which retaliated this week and killed Hamas leader Ismail Haniyeh in Iran. According to Kyle Rodda, Capital.com market analyst, there has been safe-haven demand for Gold due to Middle East developments.
Meanwhile, the Fed’s two-day meeting ends with the Fed’s decision on interest rates, which is expected to remain unchanged at the 5.25%—5.50% range. Market participants are eyeing hints that the US central bank could begin lowering borrowing costs at the September meeting.
The US economic schedule revealed that private hiring decelerated in July, according to the Automatic Data Procession (ADP) Employment Change report. Aside from this, Building Permits improved following May’s plunge, while the Employment Cost Index (ECI), sought by the Fed as a measure of inflationary pressures in wages, dipped in the second quarter of 2024.
Daily digest market movers: Gold price as data justifies Fed rate cut
- The US ADP Employment Change in July showed that private hiring rose by 122K, below the estimated 150K and missing the 155K created in June.
- The Employment Cost Index (ECI) decelerated from 1.2% to 0.9% QoQ, below the forecast of 1%.
- Pending Home Sales in the US increased by 4.8% MoM in June, exceeding estimates of 1.5% growth following May’s -1.9% decline.
- The CME FedWatch tool shows that the central bank will reduce interest rates by 25 basis points (bps) from their current levels in the September meeting.
- Traders are also eyeing the release of the July ISM Manufacturing Purchasing Managers’ Index (PMI) and Nonfarm Payrolls (NFP), which will be published on Thursday and Friday, respectively.
Technical analysis: Gold price consolidates above $2,400
According to XAU/USD’s daily chart, the uptrend remains intact, though buyers are taking a respite as the non-yielding metal trades sideways at around $2,400. As measured by the Relatives Strength Index (RSI), momentum favors buyers, though economic news and geopolitical risks could move Gold prices.
If XAU/USD climbs past $2,450, the next resistance would be the all-time high at $2,483 ahead of the $2,500 figure. On the other hand, if Gold dips beneath $2,400, key support levels emerge.
The first support would be the July 30 low of $2,376, followed by the 50-day Simple Moving Average (SMA) at $2,359. Further losses lie underneath at the 100-day SMA at $2,331
Gold FAQs
Gold has played a key role in human’s history as it has been widely used as a store of value and medium of exchange. Currently, apart from its shine and usage for jewelry, the precious metal is widely seen as a safe-haven asset, meaning that it is considered a good investment during turbulent times. Gold is also widely seen as a hedge against inflation and against depreciating currencies as it doesn’t rely on any specific issuer or government.
Central banks are the biggest Gold holders. In their aim to support their currencies in turbulent times, central banks tend to diversify their reserves and buy Gold to improve the perceived strength of the economy and the currency. High Gold reserves can be a source of trust for a country’s solvency. Central banks added 1,136 tonnes of Gold worth around $70 billion to their reserves in 2022, according to data from the World Gold Council. This is the highest yearly purchase since records began. Central banks from emerging economies such as China, India and Turkey are quickly increasing their Gold reserves.
Gold has an inverse correlation with the US Dollar and US Treasuries, which are both major reserve and safe-haven assets. When the Dollar depreciates, Gold tends to rise, enabling investors and central banks to diversify their assets in turbulent times. Gold is also inversely correlated with risk assets. A rally in the stock market tends to weaken Gold price, while sell-offs in riskier markets tend to favor the precious metal.
The price can move due to a wide range of factors. Geopolitical instability or fears of a deep recession can quickly make Gold price escalate due to its safe-haven status. As a yield-less asset, Gold tends to rise with lower interest rates, while higher cost of money usually weighs down on the yellow metal. Still, most moves depend on how the US Dollar (USD) behaves as the asset is priced in dollars (XAU/USD). A strong Dollar tends to keep the price of Gold controlled, whereas a weaker Dollar is likely to push Gold prices up.
- USD/JPY backslid 1.5% after the BoJ snuck in a quarter-point rate hike.
- The BoJ has chalked in its second rate hike since 2007.
- The US Fed’s latest rate call looms large as markets look for shifts in guidance.
USD/JPY tumbled 1.5% on Wednesday, extending a recent bearish downturn after the Bank of Japan (BoJ) delivered a surprise rate hike in the early hours of the Wednesday market session. It’s the second rate hike from the BoJ since 2007, and Japanese interest rates are above zero for the first time since September of 2010.
The Federal Reserve’s (Fed) latest rate call is expected to keep rates steady for the time being, but markets have widely forecast a first quarter-point rate trim when the Federal Open Market Committee (FOMC) convenes in September.
Daily digest market movers: USD/JPY grinds lower ahead of Fed rate call
- The BoJ surprised markets with a second quarter-point rate hike for the year, lifting interest rates above zero to 0.25%.
- The Fed’s July rate call is broadly expected to keep rates standing pat.
- Markets will be looking for any adjustments to forward guidance, looking for hints about the Fed’s plans for September.
- Rate markets have fully pinned September rate cut forecasts to the ceiling, 100% odds of at least a quarter-point rate trim on September 18.
- Despite the rate hike from the BoJ, the Japanese central bank also trimmed its asset purchasing program less than expected, limiting upside potential from the rate hike.
- US Interest Rate Decision: Federal Reserve expected to hold the horses until September
Japanese Yen PRICE Today
The table below shows the percentage change of Japanese Yen (JPY) against listed major currencies today. Japanese Yen was the strongest against the Australian Dollar.
| USD | EUR | GBP | JPY | CAD | AUD | NZD | CHF | |
|---|---|---|---|---|---|---|---|---|
| USD | 0.06% | -0.03% | -1.39% | -0.27% | 0.13% | -0.68% | -0.23% | |
| EUR | -0.06% | -0.07% | -1.43% | -0.33% | 0.06% | -0.73% | -0.28% | |
| GBP | 0.03% | 0.07% | -1.39% | -0.25% | 0.12% | -0.65% | -0.21% | |
| JPY | 1.39% | 1.43% | 1.39% | 1.20% | 1.52% | 0.71% | 1.20% | |
| CAD | 0.27% | 0.33% | 0.25% | -1.20% | 0.36% | -0.42% | 0.02% | |
| AUD | -0.13% | -0.06% | -0.12% | -1.52% | -0.36% | -0.79% | -0.36% | |
| NZD | 0.68% | 0.73% | 0.65% | -0.71% | 0.42% | 0.79% | 0.45% | |
| CHF | 0.23% | 0.28% | 0.21% | -1.20% | -0.02% | 0.36% | -0.45% |
The heat map shows percentage changes of major currencies against each other. The base currency is picked from the left column, while the quote currency is picked from the top row. For example, if you pick the Japanese Yen from the left column and move along the horizontal line to the US Dollar, the percentage change displayed in the box will represent JPY (base)/USD (quote).
Technical analysis: USD/JPY continues to ease for now
USD/JPY tumbled back to the 150.00 major price handle for the first time since March, shedding 1.5% on Wednesday and diving below the 200-day Exponential Moving Average (EMA) after a steady drift into the bullish side since January. The pair is down 7.6% peak-to-trough after hitting multi-decade highs earlier this month, driven lower by a series of suspected “Yenterventions” from the BoJ and the Japanese Ministry of Finance.
Markets will be waiting to sniff out the lay of the land moving forward, but it won’t take much buying pressure for markets to push USD/JPY back into the north side of the 200-day EMA at 152.40. A technical floor is priced in near 147.50 at March’s swing low, with 2024’s early low bids just north of 140.00 waiting further below.
USD/JPY daily chart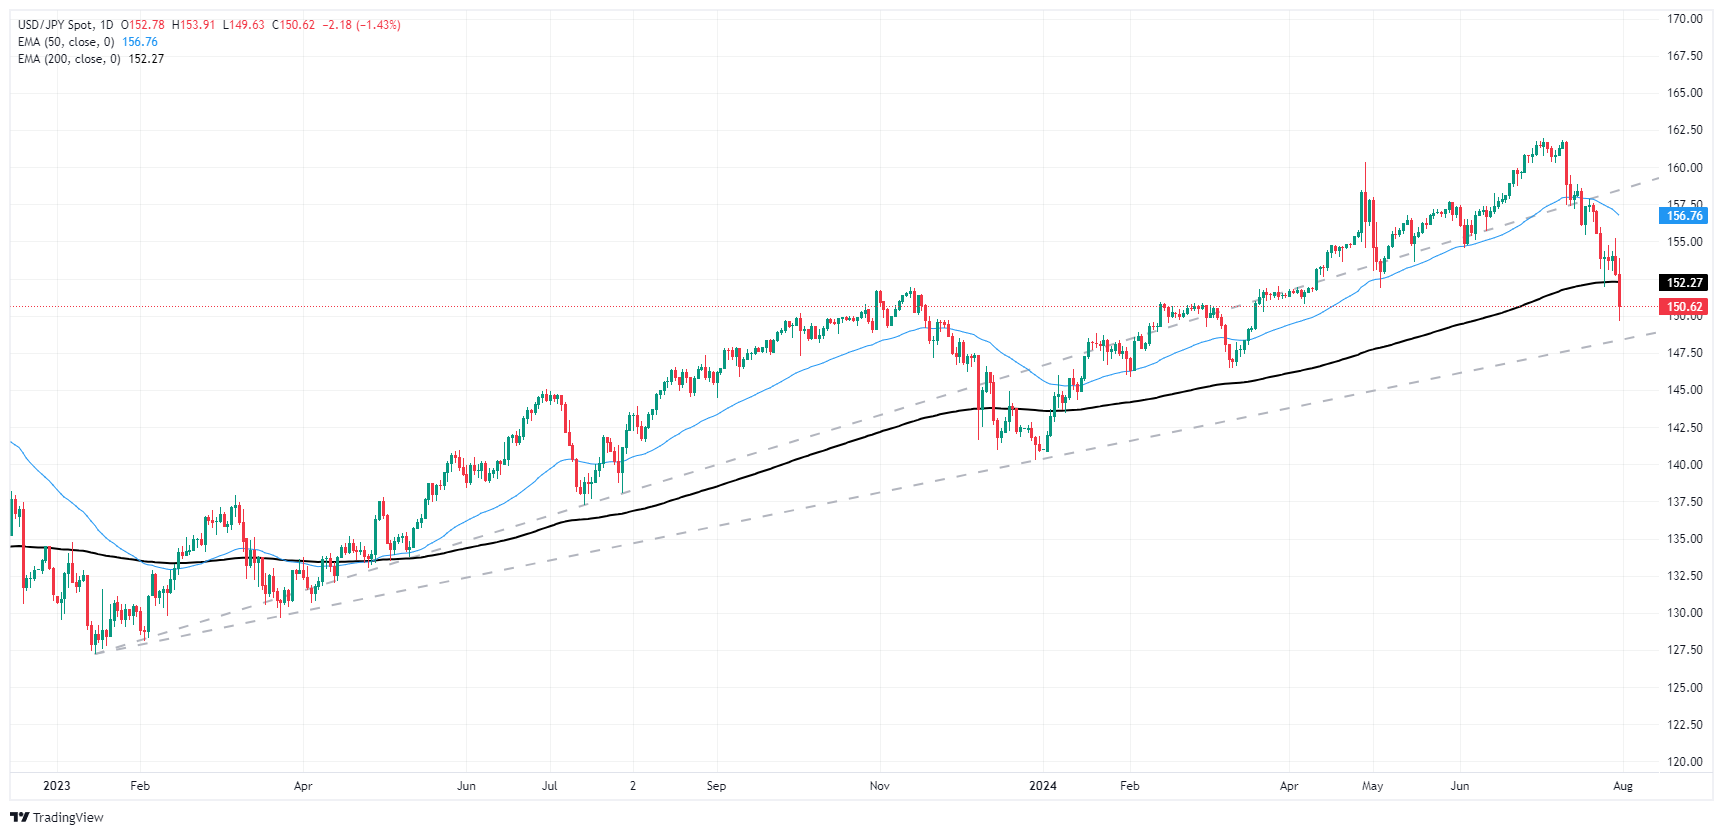
Japanese Yen FAQs
The Japanese Yen (JPY) is one of the world’s most traded currencies. Its value is broadly determined by the performance of the Japanese economy, but more specifically by the Bank of Japan’s policy, the differential between Japanese and US bond yields, or risk sentiment among traders, among other factors.
One of the Bank of Japan’s mandates is currency control, so its moves are key for the Yen. The BoJ has directly intervened in currency markets sometimes, generally to lower the value of the Yen, although it refrains from doing it often due to political concerns of its main trading partners. The current BoJ ultra-loose monetary policy, based on massive stimulus to the economy, has caused the Yen to depreciate against its main currency peers. This process has exacerbated more recently due to an increasing policy divergence between the Bank of Japan and other main central banks, which have opted to increase interest rates sharply to fight decades-high levels of inflation.
The BoJ’s stance of sticking to ultra-loose monetary policy has led to a widening policy divergence with other central banks, particularly with the US Federal Reserve. This supports a widening of the differential between the 10-year US and Japanese bonds, which favors the US Dollar against the Japanese Yen.
The Japanese Yen is often seen as a safe-haven investment. This means that in times of market stress, investors are more likely to put their money in the Japanese currency due to its supposed reliability and stability. Turbulent times are likely to strengthen the Yen’s value against other currencies seen as more risky to invest in.
- Mexican Peso gains 0.88% against the USD as USD/MXN trades at 18.59.
- Weaker-than-expected US labor data heightens expectations for a Fed rate cut in September.
- Banxico's Deputy Governor suggests gradual rate cuts amid Mexico's slowing economic growth.
The Mexican Peso regains some composure and rallies against the Greenback as market participants await the US Federal Reserve’s (Fed) monetary policy decision. A softer-than-expected labor market report in the US weighed on the US Dollar as market participants expect the first rate cut by the Fed in September. The USD/MXN trades at 18.59, down 0.88%.
On Wednesday, the Mexican economic docket was empty, yet traders shrugged off Tuesday’s data that showed the economy is decelerating. The Gross Domestic Product (GDP) for Q2 rose 0.2% QoQ, below estimates of 0.4% and a 0.3% increase in Q1. This justified comments by Omar Mejia Castelazo, a Deputy Governor at the Bank of Mexico (Banxico), who favors lowering rates gradually and emphasized that this would not mean the bank will embark on an easing cycle.
Across the border, US economic data showed that private hiring increased less than expected, according to Automatic Data Processing (ADP) Employment Change data for July.
Other data showed the Employment Cost Index (ECI) dipped three-tenths in Q2 2024, while Pending Home Sales bounced off record lows not reached since 2001.
In the meantime, traders are awaiting the US central bank decision, which is expected to keep rates unchanged for the eighth consecutive meeting, though they will be looking for signals that could reassure the market that the Fed will begin its easing cycle at the September meeting.
The CME FedWatch Tool shows odds for a 25-basis-point rate cut in September at 100%. Data from the Chicago Board of Trade (CBOT) shows that the December 2024 fed funds rates futures contract suggests that policymakers will ease policy at least 55 basis points.
Daily digest market movers: Mexican Peso appreciates as economy cools down
- Mexico’s National Statistics Agency revealed that GDP for Q2 2024 grew 2.2% YoY on its preliminary reading, above estimates of 2% and the previous quarter's 1.6% expansion.
- Mexico’s Deputy Finance Minister Gabriel Yorio said that public debt is expected at a level of 48.6% of GDP at the end of President Andres Manuel Lopez Obrador’s term.
- Last week, Mexico’s June Balance of Trade was $-1.073 billion, missing the consensus of $1 billion.
- US ADP Employment Change in July showed that private hiring rose by 122K, below the estimated 150K and missing the 155K created in June.
- The Employment Cost Index (ECI) decelerated from 1.2% to 0.9% QoQ, below forecasts of 1%.
- Pending Home Sales in the US increased 4.8% MoM in June, exceeding estimates of 1.5% growth following May’s -1.9% plunge.
Technical analysis: Mexican Peso recovers as USD/MXN drops beneath 18.60
The USD/MXN is forming a “bearish engulfing” candlestick pattern amid growing expectations that Fed Chair Jerome Powell and company will hint at the first interest rate cut at the September meeting.
The Relative Strength Index (RSI) shows momentum falling steeply, meaning sellers are moving in anticipation of the Fed’s decision. This and the USD/MXN clearing the June 28 peak at 18.59 could pave the way for a deeper pullback.
That said, USD/MXN's first support would be the 18.50 level. Once surpassed, the next stop would be the psychological 18.00 mark, followed by the 50-day Simple Moving Average (SMA) at 17.97.
On the flip side, if buyers lift the exotic pair above 18.60, that could sponsor a leg up toward the year-to-date (YTD) peak of 18.99 ahead of 19.00 per US Dollar. Further upside is seen at the March 20, 2023, high of 19.23, ahead of 19.50.
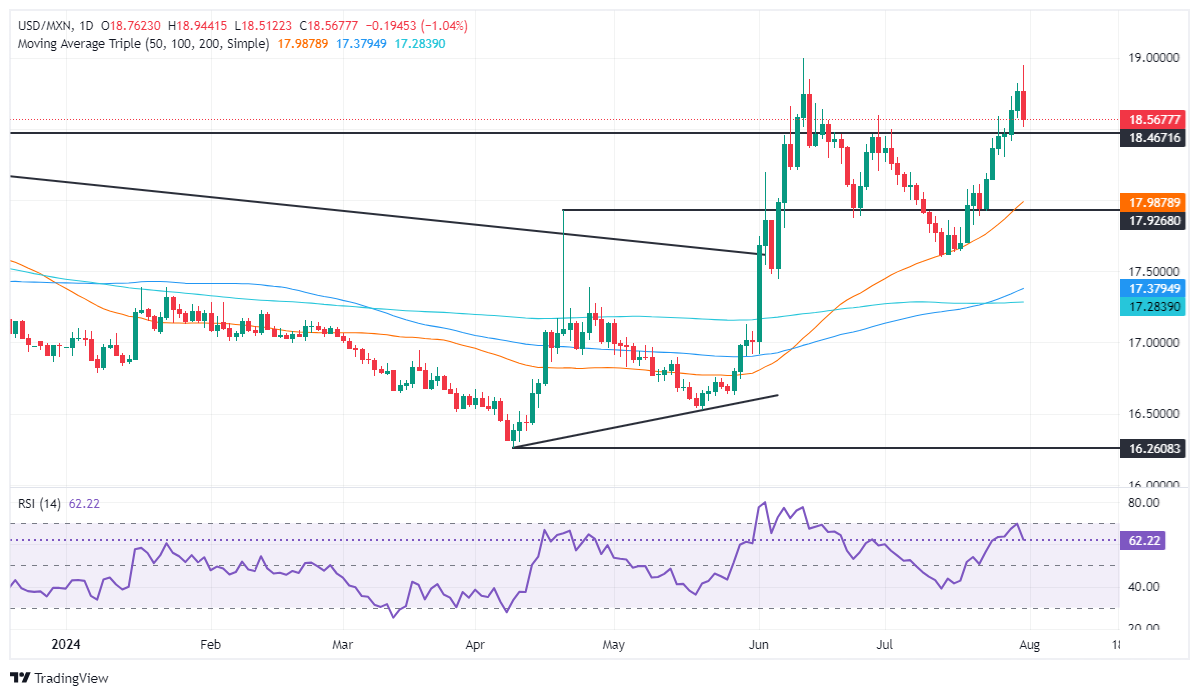
Mexican Peso FAQs
The Mexican Peso (MXN) is the most traded currency among its Latin American peers. Its value is broadly determined by the performance of the Mexican economy, the country’s central bank’s policy, the amount of foreign investment in the country and even the levels of remittances sent by Mexicans who live abroad, particularly in the United States. Geopolitical trends can also move MXN: for example, the process of nearshoring – or the decision by some firms to relocate manufacturing capacity and supply chains closer to their home countries – is also seen as a catalyst for the Mexican currency as the country is considered a key manufacturing hub in the American continent. Another catalyst for MXN is Oil prices as Mexico is a key exporter of the commodity.
The main objective of Mexico’s central bank, also known as Banxico, is to maintain inflation at low and stable levels (at or close to its target of 3%, the midpoint in a tolerance band of between 2% and 4%). To this end, the bank sets an appropriate level of interest rates. When inflation is too high, Banxico will attempt to tame it by raising interest rates, making it more expensive for households and businesses to borrow money, thus cooling demand and the overall economy. Higher interest rates are generally positive for the Mexican Peso (MXN) as they lead to higher yields, making the country a more attractive place for investors. On the contrary, lower interest rates tend to weaken MXN.
Macroeconomic data releases are key to assess the state of the economy and can have an impact on the Mexican Peso (MXN) valuation. A strong Mexican economy, based on high economic growth, low unemployment and high confidence is good for MXN. Not only does it attract more foreign investment but it may encourage the Bank of Mexico (Banxico) to increase interest rates, particularly if this strength comes together with elevated inflation. However, if economic data is weak, MXN is likely to depreciate.
As an emerging-market currency, the Mexican Peso (MXN) tends to strive during risk-on periods, or when investors perceive that broader market risks are low and thus are eager to engage with investments that carry a higher risk. Conversely, MXN tends to weaken at times of market turbulence or economic uncertainty as investors tend to sell higher-risk assets and flee to the more-stable safe havens.
- The Canadian Dollar stepped higher after Canadian GDP beat.
- Canada remains underrepresented on the economic calendar this week.
- Wednesday’s Fed rate call still weighs on markets.
The Canadian Dollar (CAD) found a brief reprieve on Wednesday from steady selling pressure against the Greenback after Canadian Gross Domestic Product (GDP) beat forecasts, but gains remain limited as the figure still eased from the previous print. The US Federal Reserve’s (Fed) latest rate decision is still weighing on market flows as investors brace for signs of a September cut.
Canada has limited data prints left this week, with only S&P Global Manufacturing Purchasing Managers Index (PMI) figures slated for Thursday as investors focus squarely on central bank actions in the third quarter. The Fed is broadly expected to deliver a first quarter-point rate cut on September 18, and Canadian money markets see better-than-even odds of a third rate trim from the Bank of Canada (BoC), also in September.
Daily digest market movers: CAD finds a foothold as markets hunker down ahead of Fed
- Canadian GDP growth in May clocked in at 0.2% MoM, ticking down from the previous 0.3% but still eking out a gain against the forecast of 0.1%.
- The Fed is widely expected to stand pat on interest rates for one more meeting, but investors will be eyeballing Fed Chairman Jerome Powell’s press conference for any shifts in policy guidance.
- Rate traders are still pricing in 100% odds of at least a quarter-point rate trim from the Fed on September 18.
- July’s miss in ADP Employment Change figures helped to bolster broad-market hopes for a September rate cut as economic data continues to soften.
- ADP reported a net addition of 122K jobs MoM, below the previous month’s revised 150K and missing the forecast of 150K.
Canadian Dollar PRICE Today
The table below shows the percentage change of Canadian Dollar (CAD) against listed major currencies today. Canadian Dollar was the strongest against the Euro.
| USD | EUR | GBP | JPY | CAD | AUD | NZD | CHF | |
|---|---|---|---|---|---|---|---|---|
| USD | 0.07% | 0.02% | -1.42% | -0.31% | 0.09% | -0.67% | -0.23% | |
| EUR | -0.07% | -0.02% | -1.47% | -0.38% | 0.02% | -0.71% | -0.29% | |
| GBP | -0.02% | 0.02% | -1.47% | -0.36% | 0.03% | -0.69% | -0.26% | |
| JPY | 1.42% | 1.47% | 1.47% | 1.16% | 1.50% | 0.74% | 1.22% | |
| CAD | 0.31% | 0.38% | 0.36% | -1.16% | 0.38% | -0.36% | 0.08% | |
| AUD | -0.09% | -0.02% | -0.03% | -1.50% | -0.38% | -0.74% | -0.31% | |
| NZD | 0.67% | 0.71% | 0.69% | -0.74% | 0.36% | 0.74% | 0.44% | |
| CHF | 0.23% | 0.29% | 0.26% | -1.22% | -0.08% | 0.31% | -0.44% |
The heat map shows percentage changes of major currencies against each other. The base currency is picked from the left column, while the quote currency is picked from the top row. For example, if you pick the Canadian Dollar from the left column and move along the horizontal line to the US Dollar, the percentage change displayed in the box will represent CAD (base)/USD (quote).
Technical analysis: CAD catches a break from steady Greenback pressure
The Canadian Dollar (CAD) is mixed on Wednesday, tumbling over one percent against the recovering Japanese Yen (JPY) and shedding one-third of one percent against the New Zealand Dollar (NZD). However, the Canadian Dollar was still able to squeeze at least one-third of one percent higher against the USD, the Euro (EUR), and the Pound Sterling (GBP).
USD/CAD priced in a firmly downside candlestick for the first time in almost 20 trading days, falling back into the 1.3800 handle as the US Dollar snaps a bullish streak against the Canadian Dollar that dragged the pair up a full two percent bottom-to-top. The Greenback’s rally against the CAD dragged the pair into fresh highs for 2024, testing price levels last seen in November of last year.
Bullish momentum is set to run out of steam after a near-term bounce from the 200-day Exponential Moving Average (EMA) in mid-July. The long-term average is now rising into 1.3620, and immediate technical support will provide a floor for any extended bearish slides from the 50-day EMA just north of the 1.3700 handle.
USD/CAD hourly chart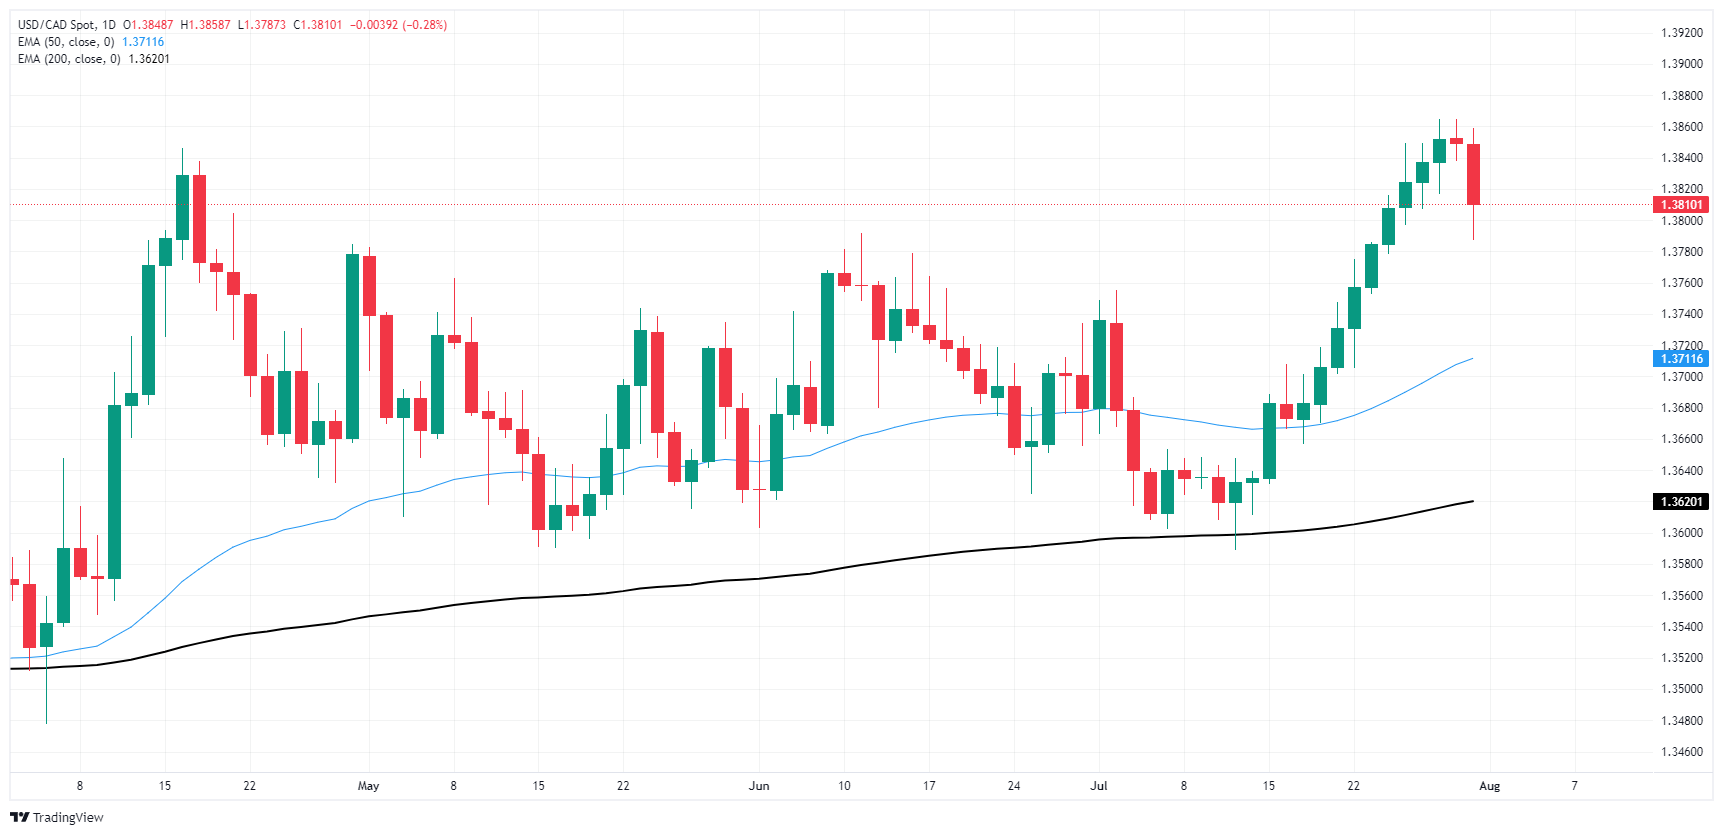
Canadian Dollar FAQs
The key factors driving the Canadian Dollar (CAD) are the level of interest rates set by the Bank of Canada (BoC), the price of Oil, Canada’s largest export, the health of its economy, inflation and the Trade Balance, which is the difference between the value of Canada’s exports versus its imports. Other factors include market sentiment – whether investors are taking on more risky assets (risk-on) or seeking safe-havens (risk-off) – with risk-on being CAD-positive. As its largest trading partner, the health of the US economy is also a key factor influencing the Canadian Dollar.
The Bank of Canada (BoC) has a significant influence on the Canadian Dollar by setting the level of interest rates that banks can lend to one another. This influences the level of interest rates for everyone. The main goal of the BoC is to maintain inflation at 1-3% by adjusting interest rates up or down. Relatively higher interest rates tend to be positive for the CAD. The Bank of Canada can also use quantitative easing and tightening to influence credit conditions, with the former CAD-negative and the latter CAD-positive.
The price of Oil is a key factor impacting the value of the Canadian Dollar. Petroleum is Canada’s biggest export, so Oil price tends to have an immediate impact on the CAD value. Generally, if Oil price rises CAD also goes up, as aggregate demand for the currency increases. The opposite is the case if the price of Oil falls. Higher Oil prices also tend to result in a greater likelihood of a positive Trade Balance, which is also supportive of the CAD.
While inflation had always traditionally been thought of as a negative factor for a currency since it lowers the value of money, the opposite has actually been the case in modern times with the relaxation of cross-border capital controls. Higher inflation tends to lead central banks to put up interest rates which attracts more capital inflows from global investors seeking a lucrative place to keep their money. This increases demand for the local currency, which in Canada’s case is the Canadian Dollar.
Macroeconomic data releases gauge the health of the economy and can have an impact on the Canadian Dollar. Indicators such as GDP, Manufacturing and Services PMIs, employment, and consumer sentiment surveys can all influence the direction of the CAD. A strong economy is good for the Canadian Dollar. Not only does it attract more foreign investment but it may encourage the Bank of Canada to put up interest rates, leading to a stronger currency. If economic data is weak, however, the CAD is likely to fall.
Silver is playing catch-up, but is still more likely to be weighed down by CTA selling activity over the coming week, TDS senior commodity strategist Daniel Ghali notes.
Silver fundamentals remain strong
“Our simulations of future prices continue to point to negative asymmetries in positioning risks over the coming week, with a big uptape required to prevent CTAs from returning to the offer.”
“Under the hood, this suggests that uptrend signals are naturally deteriorating, and in contrast to gold, Shanghai traders are now adding to their shorts following significant long liquidations that have greatly reduced the top traders' net position.”
“Silver fundamentals remain strong with solar capacity still beating expectations, and sentiment surrounding industrial demand may be overly pessimistic, but the scope for a significant reversal in sentiment to drive prices higher is mitigated by the recent rise in the free float and the pessimistic outlook for algo flows for the time being.”
This is not the same Gold market as just a few short months ago, TDS senior commodity strategist Daniel Ghali notes.
Scope for further gains is limited
“Discretionary traders continue to hold a larger position than warranted by the rates market outlook for Fed cuts, which are arguably somewhat rich. CTAs now effectively hold a 'max long' position size, suggesting little scope to add without a re-leveraging process.”
“While we expect central bank buying activity to persist, Asia remains on a buyer's strike with only nascent signs of a bid over the last sessions. After all, price action in Asian currencies has diminished the appetite for precious metals as a currency depreciation hedge.”
“A safe-haven bid associated with Middle Eastern geopolitical risks may be supporting prices, but the scope for further gains is limited by positioning dynamics for the time being without a more significant escalation or a deepening outlook for Federal Reserve cuts.”
The Dollar Index (DXY) was barely changed at 104.07 before today’s FOMC meeting, DBS FX analyst Philip Wee notes.
The anticipation is almost killing
“During the overnight session, the DXY briefly hit 104.80, near the level it fell on July 11 due to the softer US CPI inflation.”
“The Federal Reserve (Fed) should leave the door ajar to lower interest rates without endorsing the futures market’s aggressive bet (110% probability) on a September cut until it sees the US unemployment rate data on August 2 and the CPI inflation data on August 14.”
“Suppose the Fed gains more confidence about inflation resuming its decline towards its 2% target or worries more about rising joblessness, it will likely provide the timing guidance at the Kansas City Fed’s Jackson Hole Symposium on August 24-26.”
The flash estimate for HICP inflation showed an unexpected but marginal rise in headline inflation in July, to 2.6% from 2.5% in June. Core inflation held steady at 2.9%, against our expectations for a fall to 2.7%, ABN AMRO senior economist Bill Diviney notes.
Inflation disappoints in July, but silver linings below the surface
“Looking at the main drivers, energy came in stronger, rising 1.3% y/y (June: 0.2%), with the recent rise in petrol prices and higher administrative gas tariffs in France offset to a lesser degree than expected by the continued falls in wholesale energy prices (as indicated by the energy PPI). Services inflation fell marginally to 4% from 4.1%; we had expected a bigger drop to 3.8%.”
“News reports suggest that hoteliers and airlines are having to lower prices with travelers clearly becoming more price-sensitive. This kind of pushback bodes well for the medium-term inflation outlook. Food inflation also edged further lower, to a new 2 & 1/2 year low of 2.3. Goods inflation was broadly steady at a subdued 0.8% y/y, having hovered in a 0.7-0.9% range for the past 5 months.”
“The data is likely broadly consistent with the ECB’s expectation for July, based on its quarterly projection for Q3 and the strong downward base effects which will push inflation lower in August and September. Following today’s figure, we expect inflation to fall to 2.2% in August and be back at the 2% target in September. We continue to expect the ECB to resume rate cuts in September.”
- GBP/USD consolidates between 1.2800 and 1.2890 amid uncertain Fed and BoE decisions.
- RSI remains flat, indicating a balanced market with no clear trend.
- Key support levels are at 1.2778 and 1.2750, with resistance at 1.2888 and 1.2900.
The Pound Sterling registers minuscule gains during the North American session as traders brace for the US Federal Reserve’s decision, which is expected to hold rates unchanged but to prepare the ground to ease policy. The GBP/USD trades at 1.2845, virtually unchanged.
GBP/USD Price Analysis: Technical outlook
The GBP/USD has consolidated at around 1.2800-1.2890 during the last four days, with neither buyers nor sellers committing to a position amid risks on both sides of the Atlantic, with the Fed and the Bank of England’s decisions.
Consequently, the Relative Strength Index (RSI) is flat at its neutral line, underscoring the abovementioned, but the GBP/USD fall from yearly highs to current spot prices hints that bears are lurking.
If GBP/USD drops below 1.2800, it would expose key support levels like the July 9 low at 1.2778 and the psychological 1.2750. A further downside is seen at the 100-day moving average (DMA) at 1.2682.
On the other hand, key resistance lies at the July 29 peak at 1.2888, followed by 1.2900.
GBP/USD Price Action – Daily Chart
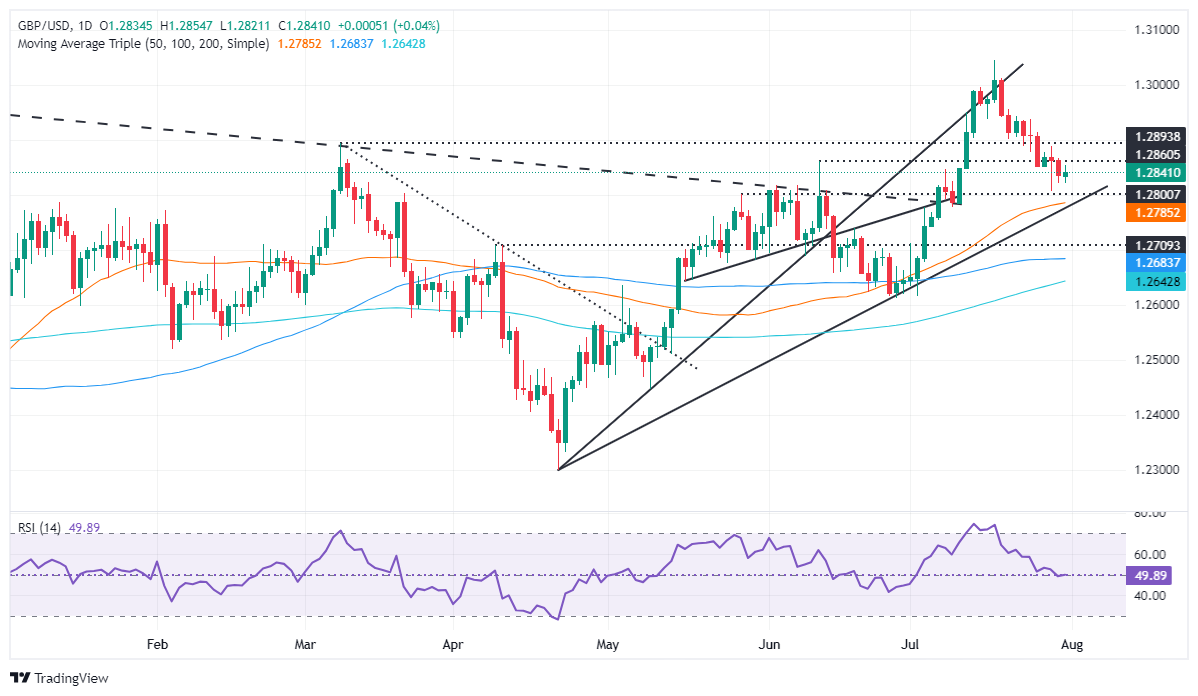
British Pound PRICE Today
The table below shows the percentage change of British Pound (GBP) against listed major currencies today. British Pound was the strongest against the Australian Dollar.
| USD | EUR | GBP | JPY | CAD | AUD | NZD | CHF | |
|---|---|---|---|---|---|---|---|---|
| USD | -0.16% | -0.05% | -1.70% | -0.34% | 0.06% | -0.64% | -0.33% | |
| EUR | 0.16% | 0.13% | -1.51% | -0.16% | 0.21% | -0.46% | -0.15% | |
| GBP | 0.05% | -0.13% | -1.66% | -0.28% | 0.07% | -0.58% | -0.28% | |
| JPY | 1.70% | 1.51% | 1.66% | 1.44% | 1.78% | 1.08% | 1.44% | |
| CAD | 0.34% | 0.16% | 0.28% | -1.44% | 0.37% | -0.30% | 0.01% | |
| AUD | -0.06% | -0.21% | -0.07% | -1.78% | -0.37% | -0.68% | -0.38% | |
| NZD | 0.64% | 0.46% | 0.58% | -1.08% | 0.30% | 0.68% | 0.32% | |
| CHF | 0.33% | 0.15% | 0.28% | -1.44% | -0.01% | 0.38% | -0.32% |
The heat map shows percentage changes of major currencies against each other. The base currency is picked from the left column, while the quote currency is picked from the top row. For example, if you pick the British Pound from the left column and move along the horizontal line to the US Dollar, the percentage change displayed in the box will represent GBP (base)/USD (quote).
A word on the Australian dollar (AUD), which came under significant pressure this morning, losing about 0.7% against the US Dollar (USD), Commerzbank’s FX analyst Volkmar Baur notes
AUD might be effected by China
“This was probably due to the fact that inflation was slightly lower than expected. There had been speculation that the Reserve Bank of Australia would have to raise interest rates again because of the recent rise in inflation. These expectations have now been priced out.”
“However, the AUD's strong reaction also seems to have something to do with the ongoing economic weakness in China. More than two-thirds of all Australian exports are commodities – with China the biggest buyer. If the economy, and in particular the housing market, remains weak in China, it will have an effect Australian exports and thus the currency.”
The Chinese economy remains weak, according to the PMIs released this morning. The manufacturing index fell slightly, remaining below 50 for the third consecutive month, while the non-manufacturing index (services and construction) fell to 50.2, the lowest level ever recorded (except for 4 months when acute coronavirus outbreaks led to lockdowns) , Commerzbank’s FX analyst Volkmar Baur notes
Dovish Fed can provide significant relief for the CNY
“Hopes for a quick stimulus from the government were also dashed yesterday after the Politburo meeting ended without any significant signs of action. The further decline in the construction sub-index suggests that China's real estate crisis is not over and will continue to weigh on the economy.”
“This will also have an impact on price developments. The price components of the PMI suggest that producer prices fell again in July compared with the previous month. As a result, the annual rate, which had battled its way out of negative territory toward zero in recent months, is likely to fall back into negative territory.”
“However, the CNY was unperturbed this morning and rose slightly against the US Dollar. While it is important not to over-interpret every move in a managed currency, the exchange rate is likely to be more influenced by the USD in the coming days anyway. A dovish Fed could provide significant relief for the CNY.”
- Silver price climbs to near $28.80 on multiple tailwinds.
- Widening Middle East conflicts have improved the Silver price’s safe-haven appeal.
- Investors see the Fed delivering hawkish guidance on interest rates.
Silver price (XAG/USD) jumps to near a weekly high around $28.80 in Wednesday’s North American session. The precious metal strengthens on growing fears of widening Middle East conflicts and firm speculation that the Federal Reserve (Fed) will deliver dovish guidance on interest rates after leaving them unchanged in the range of 5.25%-5.50%.
Israeli air strike on Tehran in which Hamas leader Ismail Haniyeh was killed has prompted fears of an all-out war between Israel and Iran. Historically, escalating geopolitical tensions improve the safe-haven appeal of precious metals.
Meanwhile, investors await the Fed’s monetary policy, which will be announced at 18:00 GMT. Market experts see the Fed endorsing rate cuts in September as inflation has returned on the path that leads to the bank’s target of 2%. Also, increasing cracks in the United States (US) labor market strength would be a tailwind for rate cuts.
In the early American session, the US ADP released a weaker-than-expected Employment report for July. The report showed a weak labor demand in the private sector as payrolls were lower at 122K than estimates of 150K and the prior release of 155K. Weak employment data has weighed heavily on the US Dollar and bond yields.
The US Dollar Index (DXY), which tracks the Greenback’s value against six major currencies, dips below 104.00. 10-year US Treasury yields slide below 4.10%. Lower yields on interest-bearing assets reduce the opportunity cost of investment in non-yielding assets, such as Silver.
Silver technical analysis
Silver price attempts to extend its recovery above the crucial resistance plotted from July 13 low at $28.66 in a four-hour timeframe. The white metal moves higher and aims to stabilize above the 50-period Exponential Moving Average (EMA), which trades around $28.60.
The 14-period Relative Strength Index (RSI) jumps above 60.00. A bullish momentum would trigger if it sustains above the same.
Silver four-hour chart
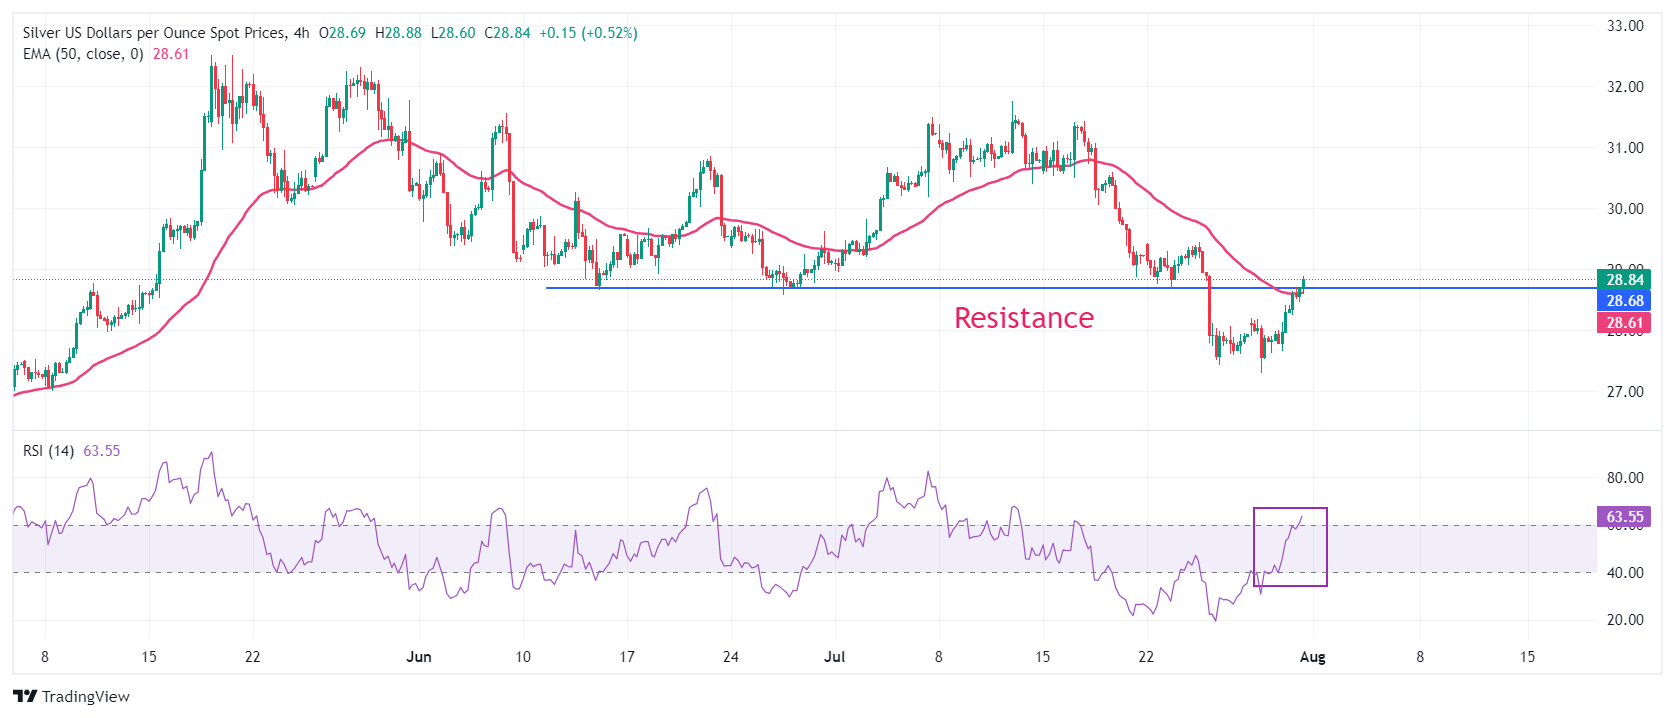
Silver FAQs
Silver is a precious metal highly traded among investors. It has been historically used as a store of value and a medium of exchange. Although less popular than Gold, traders may turn to Silver to diversify their investment portfolio, for its intrinsic value or as a potential hedge during high-inflation periods. Investors can buy physical Silver, in coins or in bars, or trade it through vehicles such as Exchange Traded Funds, which track its price on international markets.
Silver prices can move due to a wide range of factors. Geopolitical instability or fears of a deep recession can make Silver price escalate due to its safe-haven status, although to a lesser extent than Gold's. As a yieldless asset, Silver tends to rise with lower interest rates. Its moves also depend on how the US Dollar (USD) behaves as the asset is priced in dollars (XAG/USD). A strong Dollar tends to keep the price of Silver at bay, whereas a weaker Dollar is likely to propel prices up. Other factors such as investment demand, mining supply – Silver is much more abundant than Gold – and recycling rates can also affect prices.
Silver is widely used in industry, particularly in sectors such as electronics or solar energy, as it has one of the highest electric conductivity of all metals – more than Copper and Gold. A surge in demand can increase prices, while a decline tends to lower them. Dynamics in the US, Chinese and Indian economies can also contribute to price swings: for the US and particularly China, their big industrial sectors use Silver in various processes; in India, consumers’ demand for the precious metal for jewellery also plays a key role in setting prices.
Silver prices tend to follow Gold's moves. When Gold prices rise, Silver typically follows suit, as their status as safe-haven assets is similar. The Gold/Silver ratio, which shows the number of ounces of Silver needed to equal the value of one ounce of Gold, may help to determine the relative valuation between both metals. Some investors may consider a high ratio as an indicator that Silver is undervalued, or Gold is overvalued. On the contrary, a low ratio might suggest that Gold is undervalued relative to Silver.
The BoJ raised its key interest rate, but the JPY seems to have taken little notice. At the time of writing, USD/JPY is little changed, which is not what you would expect in response to a rate hike, especially one that was larger than expected. But let's take things one step at a time, Commerzbank’s FX analyst Volkmar Baur notes
BoJ raises its key interest rate to 0.25%
“The BoJ raised its key interest rate to 0.25% from 0-0.1%. In addition, it was announced that the volume of bond purchases, which was recently JPY 5.7 trillion per month, will be reduced by JPY 0.4 trillion per quarter until it reaches JPY 3 trillion per month at the beginning of 2026. As a reminder, these are gross purchases.”
“Since a larger volume of bonds is currently maturing each month, this reduces the amount on the BoJ's books. This brings us back to the assessment of a reactive central bank.”
“Even though the economy and inflation have recently come in below expectations, and even though the BoJ has lowered its own forecasts for growth and inflation, the move was justified by the fact that the economy and prices are evolving more or less as expected. In particular, the reference to the alleged virtuous cycle between prices and wages raises more questions than answers for many analysts.”
There was a lot of data released on Tuesday, but it did not seem to have much of an impact on the EUR/USD exchange rate, Commerzbank’s FX analyst Volkmar Baur notes
All eye on the Federal Reserve meeting
“Although the euro zone economy grew slightly more than expected in the second quarter and inflation in Spain was lower than expected, the picture in the euro area's largest economy was just the opposite. Growth was weaker and inflation was slightly higher than expected. In the end, after more US job openings were reported, the US-dollar managed to gain some ground against the Euro (EUR).”
“All in all, though, this was just the prelude to tonight. At 7:00 p.m. (GMT+1), the Fed will announce its interest rate decision, and that is where the focus of forex traders will be. The market is pricing in only a minimal chance of a rate cut today, but is absolutely certain of a rate cut in September. A little more than two and a half rate cuts are expected by the end of the year, which seems quite realistic.”
“So, while we are all waiting for the Fed tonight, it could be that in the end not much will change. I expect rates to remain unchanged, but that a first cut (in September) will be verbally prepared. In that case, the market's assessment is unlikely to change much, which is why attention will turn to the labor market on Friday.”
- USD/CAD slides to near 1.3800 after weak US ADP Employment and better-than-expected Canada monthly GDP for May.
- Weak US ADP Employment suggests that some cracks have appeared in the resilient US labor market.
- Investors await the Fed policy announcement.
The USD/CAD pair declines to near the round-level support of 1.3800 in Wednesday’s New York session. The Loonie asset faces a sharp sell-off after the release of the weak United States (US) ADP Employment Change data for July and better-than-expected Canada’s monthly Gross Domestic Product (GDP) data for May.
The ADP Employment report showed that fresh payrolls in the private sector were lower at 122K than estimates of 150K and the former release of 155K, upwardly revised from 150K. This has points to slowdown in the labor demand, which appears to be consequences of interest rates remaining restrictive for a longer period by the Federal Reserve (Fed). Soft Employment data would solidify market expectations of Fed’s early rate cuts.
Weak Employment data has weighed heavily on the US Dollar (USD). The US Dollar Index (DXY), which tracks the Greenback’s value against six major currencies, tumbles below the crucial support of 104.00.
Meanwhile, more volatility is anticipated in the US Dollar as investors await the outcome of the Fed’s monetary policy. The Fed is expected to leave interest rates unchanged in the range of 5.25%-5.50%, with a dovish guidance.
In the neighboring nation, the economy expanded at a better-than-expected pace of 0.2% from the estimates of 0.1% but was lower than the prior release of 0.3%. The overall data suggests that the economy is going through a rough phase. However, back-to-back rate cuts by the Bank of Canada (BoC) would uplift economic prospects.
Canadian Dollar FAQs
The key factors driving the Canadian Dollar (CAD) are the level of interest rates set by the Bank of Canada (BoC), the price of Oil, Canada’s largest export, the health of its economy, inflation and the Trade Balance, which is the difference between the value of Canada’s exports versus its imports. Other factors include market sentiment – whether investors are taking on more risky assets (risk-on) or seeking safe-havens (risk-off) – with risk-on being CAD-positive. As its largest trading partner, the health of the US economy is also a key factor influencing the Canadian Dollar.
The Bank of Canada (BoC) has a significant influence on the Canadian Dollar by setting the level of interest rates that banks can lend to one another. This influences the level of interest rates for everyone. The main goal of the BoC is to maintain inflation at 1-3% by adjusting interest rates up or down. Relatively higher interest rates tend to be positive for the CAD. The Bank of Canada can also use quantitative easing and tightening to influence credit conditions, with the former CAD-negative and the latter CAD-positive.
The price of Oil is a key factor impacting the value of the Canadian Dollar. Petroleum is Canada’s biggest export, so Oil price tends to have an immediate impact on the CAD value. Generally, if Oil price rises CAD also goes up, as aggregate demand for the currency increases. The opposite is the case if the price of Oil falls. Higher Oil prices also tend to result in a greater likelihood of a positive Trade Balance, which is also supportive of the CAD.
While inflation had always traditionally been thought of as a negative factor for a currency since it lowers the value of money, the opposite has actually been the case in modern times with the relaxation of cross-border capital controls. Higher inflation tends to lead central banks to put up interest rates which attracts more capital inflows from global investors seeking a lucrative place to keep their money. This increases demand for the local currency, which in Canada’s case is the Canadian Dollar.
Macroeconomic data releases gauge the health of the economy and can have an impact on the Canadian Dollar. Indicators such as GDP, Manufacturing and Services PMIs, employment, and consumer sentiment surveys can all influence the direction of the CAD. A strong economy is good for the Canadian Dollar. Not only does it attract more foreign investment but it may encourage the Bank of Canada to put up interest rates, leading to a stronger currency. If economic data is weak, however, the CAD is likely to fall.
- Private sector employment in the US rose less than expected in July.
- US Dollar Index stays in negative territory near 104.00.
Private sector employment in the US rose 122,000 in July and annual pay was up 4.8% year-over-year, the Automatic Data Processing (ADP) reported on Wednesday. This reading followed the 155,000 increase (revised from 150,000) recorded in June and came in below the market expectation of 150,000.
Commenting on the survey's findings, "with wage growth abating, the labor market is playing along with the Federal Reserve's effort to slow inflation," said Nela Richardson, chief economist, ADP. “If inflation goes back up, it won't be because of labor.”
Market reaction
The US Dollar Index edged slightly lower with the immediate reaction and was last seen losing 0.37% on the day at 104.06.
The Bank of Japan raised interest rates to 0.25% today, in line with our call but against consensus and market pricing. The BoJ also announced bond purchases will be nearly halved to around JPY 3tn by 1Q26, ING’s FX analyst Francesco Pesole notes.
JPY isn’t rallying for some reason
“The statement also stressed the inflationary risks of higher import prices, where the impact of a weak currency is greater. This surprise hike does fall into a generalized effort to stabilize the yen, in our view. USD/JPY swung after the release, and an attempted break lower was halted around the 151.6 (200-DMA support). The pair quickly bounced back and currently trades at 153.0, marginally above the pre-announcement levels.
“The lack of a post-announcement JPY rally must be associated with some lingering structural positioning in the yen, as speculators might have seen the rate hike as a near-term peak for the yen, and as an opportunity to re-enter carry-attractive trades below 152. Incidentally, consensus was probably in favor of a larger decrease in bond purchases, which have a bigger say on how far JGB yields can rise.
“Beyond the short-term, JPY looks on more solid ground, although watch for some JPY selling later today once FX intervention figures are released by the Ministry of Finance: an elevated figure could ignite speculation that the intervention strategy is unsustainable. The US events should determine the direction for USD/JPY near term, and we think that a retest of sub-152 levels remains possible.”
China’s official PMIs eased further in July. Demand has remained weak, while adverse weather conditions have also weighed on activity. To support growth, the July Politburo meeting signaled a shift in short-term policy focus towards consumption and vowed to roll out more stimulus, Commerzbank’s Senior Economist Tommy Wu notes.
Official PMIs fall further
“China’s official manufacturing PMI remained in contraction territory (i.e. below 50) at 49.4 in July. By subcomponents, while production remained above 50, new orders and new export orders stayed below 50 for the third straight month, pointing to a softening in both domestic and external demand. This also suggests that industrial production, which grew 5.3% yoy in June, will likely soften in the near term.
“The official non-manufacturing PMI eased further to 50.2 in July. In particular, the construction subindex fell to 51.2, the lowest in a year. Adverse weather conditions over the past month or so have affected construction activity. Meanwhile, the services subindex fell to 50.0, the lowest in seven months. The soft July official PMIs and the slower-than-expected Q2 GDP growth of 4.7% yoy call for the need for faster implementation of policy stimulus.”
“The statement from the Politburo meeting acknowledged that the external environment is unfavorable and that domestic demand remains insufficient. It said ‘the focus of economic policies needs to shift toward benefiting people’s livelihood and promoting spending’. This means that while Beijing’s long-term policy focus is on the supply side, the short-term goal is shifting towards supporting demand.”
- The Pound Sterling declines to near 1.2825 against the US Dollar ahead of the Fed, BoE policy decisions outcome.
- Firm speculation for BoE rate cuts on Wednesday has weighed heavily on the Pound Sterling.
- The US Dollar slumps as the Fed is expected to deliver a dovish guidance on interest rates.
The Pound Sterling (GBP) weakens in Wednesday’s London session amid caution ahead of the Bank of England’s (BoE) interest rate decision, which will be announced on Thursday. The British currency declines against its major peers, except the Australian Dollar (AUD), as investors see the BoE reducing interest rates in the August meeting for the first time since March 2020. The BoE has been maintaining a restrictive monetary policy stance since December 2021 in an attempt to bring inflation down, which was driven by pandemic-led stimulus.
Market experts see the BoE cutting rates by 25 basis points (bps) a tough call as policymakers have hesitated to endorse rate cuts due to high inflation in the service sector. United Kingdom’s (UK) annual service inflation grew steadily by 5.7% in June, higher than the bank’s forecast of 5.1% and roughly double the level needed to boost confidence for rate cuts.
While expectations of BoE rate cuts have risen significantly, the central bank is less likely to commit to a specific policy expansion path amid firm wage growth momentum.
Daily digest market movers: Pound Sterling drops on firm BoE rate-cut bets
- The Pound Sterling edges lower to near 1.2825 against the US Dollar (USD) in Wednesday’s European session. The GBP/USD falls despite weakness in the US Dollar, suggesting the British currency is facing severe selling pressure. The US Dollar Index (DXY), which tracks the Greenback’s value against six major currencies, falls by 0.2% to 104.20 on the day, with investors focusing on the Federal Reserve’s (Fed) monetary policy, which will be announced on Wednesday at 18:00 GMT.
- The Fed is widely anticipated to leave interest rates unchanged in the range of 5.25%-5.50%. This would be the eighth consecutive decision to keep key borrowing rates steady at their current levels since July 2023. In spite of expectations of a steady interest rate decision, investors will remain on their toes as the Fed is expected to communicate a clear signal that rate cuts are around the corner.
- According to the CME FedWatch Tool, 30-day Federal Fund Futures pricing data shows that the central bank reducing interest rates by 25 basis points (bps) in the September meeting is already priced in.
- Expectations for the Fed to begin reducing interest rates have been prompted by improved confidence that inflation will return to the bank’s target of 2%. The confidence was fueled by lower-than-expected readings in the United States (US) Consumer Price Index (CPI) data for May and June and a sharp deceleration in the Q2 Gross Domestic Product (GDP) Price Index. Also, moderating labor market conditions have strengthened speculation for rate cuts in September.
- In Wednesday’s session, investors will also focus on the ADP Employment Change data for July, which will be published at 12:15 GMT. The report is expected to show that labor demand in the private sector was steady as fresh payrolls were 150K, in line with June’s reading.
Technical Analysis: Pound Sterling falls below 20-day EMA
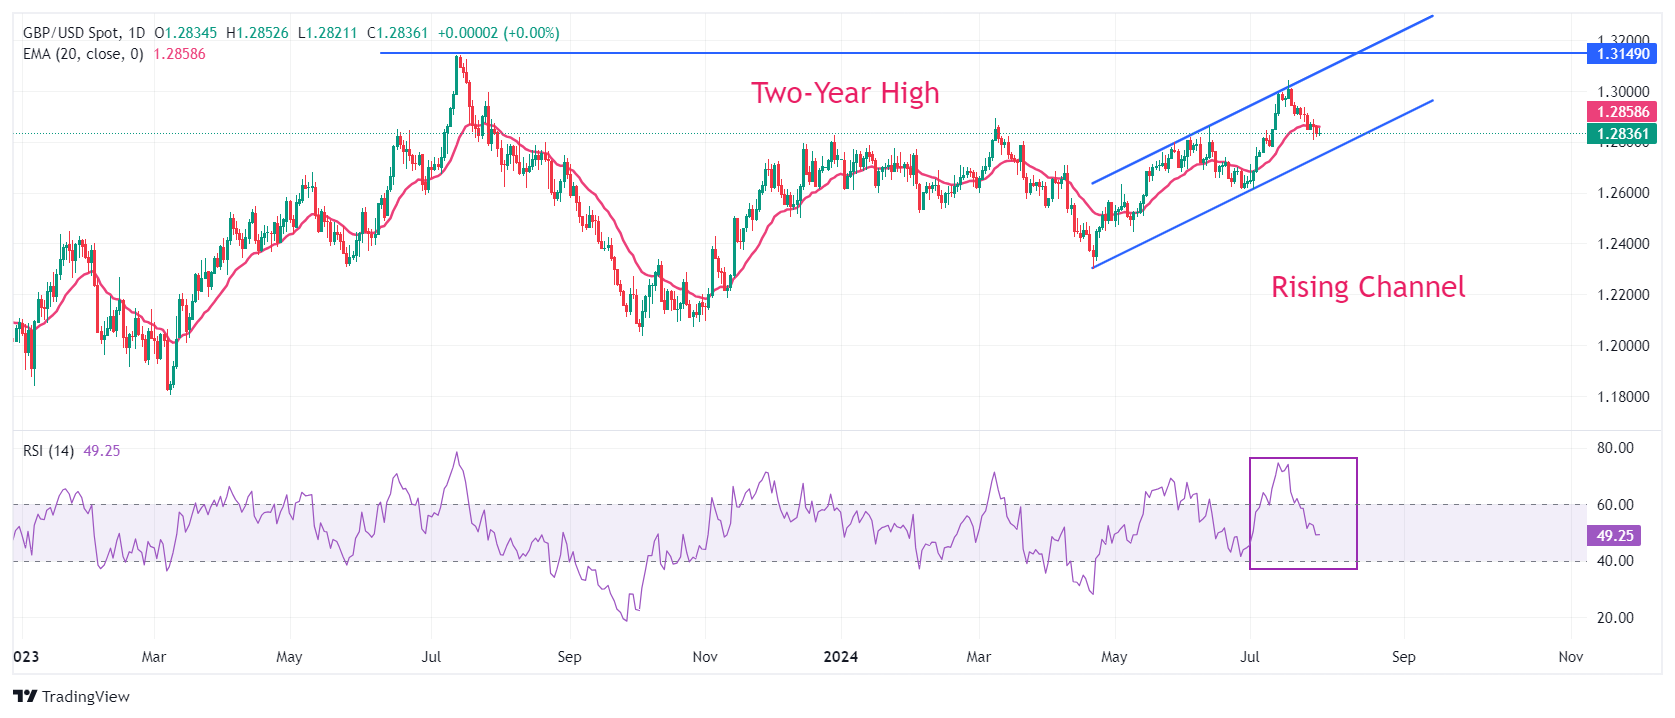
The Pound Sterling declines gradually toward the lower boundary of a rising channel chart formation on a daily timeframe. The GBP/USD pair accelerated lower after breaking below the crucial support of 1.2900. The Cable dropping below the 20-day Exponential Moving Average (EMA) near 1.2860 suggests uncertainty in the near-term trend.
The 14-day Relative Strength Index (RSI) declines toward 40.00, which would a be cushion for the momentum oscillator.
On the downside, the round-level support of 1.2800 will be a crucial support zone for the Pound Sterling bulls. Meanwhile, the two-year high near 1.3140 will be a key resistance zone for the Cable.
Pound Sterling FAQs
The Pound Sterling (GBP) is the oldest currency in the world (886 AD) and the official currency of the United Kingdom. It is the fourth most traded unit for foreign exchange (FX) in the world, accounting for 12% of all transactions, averaging $630 billion a day, according to 2022 data. Its key trading pairs are GBP/USD, aka ‘Cable’, which accounts for 11% of FX, GBP/JPY, or the ‘Dragon’ as it is known by traders (3%), and EUR/GBP (2%). The Pound Sterling is issued by the Bank of England (BoE).
The single most important factor influencing the value of the Pound Sterling is monetary policy decided by the Bank of England. The BoE bases its decisions on whether it has achieved its primary goal of “price stability” – a steady inflation rate of around 2%. Its primary tool for achieving this is the adjustment of interest rates. When inflation is too high, the BoE will try to rein it in by raising interest rates, making it more expensive for people and businesses to access credit. This is generally positive for GBP, as higher interest rates make the UK a more attractive place for global investors to park their money. When inflation falls too low it is a sign economic growth is slowing. In this scenario, the BoE will consider lowering interest rates to cheapen credit so businesses will borrow more to invest in growth-generating projects.
Data releases gauge the health of the economy and can impact the value of the Pound Sterling. Indicators such as GDP, Manufacturing and Services PMIs, and employment can all influence the direction of the GBP. A strong economy is good for Sterling. Not only does it attract more foreign investment but it may encourage the BoE to put up interest rates, which will directly strengthen GBP. Otherwise, if economic data is weak, the Pound Sterling is likely to fall.
Another significant data release for the Pound Sterling is the Trade Balance. This indicator measures the difference between what a country earns from its exports and what it spends on imports over a given period. If a country produces highly sought-after exports, its currency will benefit purely from the extra demand created from foreign buyers seeking to purchase these goods. Therefore, a positive net Trade Balance strengthens a currency and vice versa for a negative balance.
- EUR/USD jumps to near 1.0830 as Eurozone inflation grew more than expected in July and the US Dollar slumps.
- Eurozone annual headline HICP surprisingly accelerated while the core figure grew steadily.
- The US Dollar weakens on expectations that the Fed will deliver a dovish guidance on interest rates.
The EUR/USD pair moves higher to near 1.0830 in Wednesday’s European session. The major currency pair rises as price pressures in Eurozone grew at a faster-than-expected pace in July. This has raised doubts about whether the European Central Bank (ECB) will resume its policy easing cycle in the September meeting.
Preliminary Eurozone Harmonized Index of Consumer Prices (HICP) report for July showed that annual headline and core inflation, which strips off volatile items such as: food, energy, alcohol, and tobacco, surprisingly accelerated. The headline HICP unexpectedly rose to 2.6%, while economists expected the inflation figure to decelerate to 2.4% from June’s reading of 2.5%. The core HICP grew steadily 2.9% against expectations of 2.8%.
Investors were expecting the ECB to cut interest rates two more times this year. However, stubborn inflation data suggests that price pressures will face several bumps in their sustainable return towards 2%, which is expected in 2025.
Meanwhile, a sharp decline in the US Dollar (USD) ahead of the Federal Reserve (Fed) policy announcement at 18:00 GMT has also strengthened the shared currency pair. The US Dollar Index (DXY), which tracks the Greenback’s value against six major currencies, slumps to near 104.00.
The US Dollar is under pressure on expectations that the Fed will deliver dovish guidance on interest rates after leaving them unchanged for the eighth time in the range of 5.25%-5.50%.
Before that, investors will focus on the ADP Employment Change data, which will be published at 12:15 GMT. According to estimates, the United States (US) private sector hired 150K new employees in July, which was similar to June’s reading.
Euro FAQs
The Euro is the currency for the 20 European Union countries that belong to the Eurozone. It is the second most heavily traded currency in the world behind the US Dollar. In 2022, it accounted for 31% of all foreign exchange transactions, with an average daily turnover of over $2.2 trillion a day. EUR/USD is the most heavily traded currency pair in the world, accounting for an estimated 30% off all transactions, followed by EUR/JPY (4%), EUR/GBP (3%) and EUR/AUD (2%).
The European Central Bank (ECB) in Frankfurt, Germany, is the reserve bank for the Eurozone. The ECB sets interest rates and manages monetary policy. The ECB’s primary mandate is to maintain price stability, which means either controlling inflation or stimulating growth. Its primary tool is the raising or lowering of interest rates. Relatively high interest rates – or the expectation of higher rates – will usually benefit the Euro and vice versa. The ECB Governing Council makes monetary policy decisions at meetings held eight times a year. Decisions are made by heads of the Eurozone national banks and six permanent members, including the President of the ECB, Christine Lagarde.
Eurozone inflation data, measured by the Harmonized Index of Consumer Prices (HICP), is an important econometric for the Euro. If inflation rises more than expected, especially if above the ECB’s 2% target, it obliges the ECB to raise interest rates to bring it back under control. Relatively high interest rates compared to its counterparts will usually benefit the Euro, as it makes the region more attractive as a place for global investors to park their money.
Data releases gauge the health of the economy and can impact on the Euro. Indicators such as GDP, Manufacturing and Services PMIs, employment, and consumer sentiment surveys can all influence the direction of the single currency. A strong economy is good for the Euro. Not only does it attract more foreign investment but it may encourage the ECB to put up interest rates, which will directly strengthen the Euro. Otherwise, if economic data is weak, the Euro is likely to fall. Economic data for the four largest economies in the euro area (Germany, France, Italy and Spain) are especially significant, as they account for 75% of the Eurozone’s economy.
Another significant data release for the Euro is the Trade Balance. This indicator measures the difference between what a country earns from its exports and what it spends on imports over a given period. If a country produces highly sought after exports then its currency will gain in value purely from the extra demand created from foreign buyers seeking to purchase these goods. Therefore, a positive net Trade Balance strengthens a currency and vice versa for a negative balance.
The impact of the Bank of Japan surprise hike was very short-lived in the FX market. We still have to hear from the BoJ governor and see the amount of Japan’s FX intervention before we can turn our focus on the Federal reserve (FOMC) announcement this evening (1900 BST), ING’s FX analyst Francesco Pesole notes.
Fed meeting is nigh
“Rates will be kept on hold today, but there isn’t a clear consensus view on how much Chair Jerome Powell will give away in terms of guidance. Surely, Powell will reiterate a cautious tone on inflation this time, but he has often been the voice of a more dovish faction of the FOMC and the press conference could generate some USD-negative headlines.”
“Our view is that the Fed wants to avoid an unnecessary economic hit, and the loosening jobs market paired with positive disinflation news should be enough for a September cut. The question is whether the Fed will want to use this meeting to prepare markets for a move at the next meeting. Our base case is that they probably won’t offer the kind of clear guidance that would cause a big dollar drop.”
“At the same time, we would not be interpreting slightly more hawkish than expected language today as a clear sign that September should be ruled out: we believe markets will also be reluctant to price that out. The greenback is looking at some downside risks today, but Friday’s payrolls release could be a bigger event for the FX market.”
Silver prices (XAG/USD) rose on Wednesday, according to FXStreet data. Silver trades at $28.58 per troy ounce, up 0.69% from the $28.39 it cost on Tuesday.
Silver prices have increased by 20.12% since the beginning of the year.
| Unit measure | Silver Price Today in USD |
|---|---|
| Troy Ounce | 28.58 |
| 1 Gram | 0.92 |
The Gold/Silver ratio, which shows the number of ounces of Silver needed to equal the value of one ounce of Gold, stood at 84.68 on Wednesday, down from 84.93 on Tuesday.
Silver FAQs
Silver is a precious metal highly traded among investors. It has been historically used as a store of value and a medium of exchange. Although less popular than Gold, traders may turn to Silver to diversify their investment portfolio, for its intrinsic value or as a potential hedge during high-inflation periods. Investors can buy physical Silver, in coins or in bars, or trade it through vehicles such as Exchange Traded Funds, which track its price on international markets.
Silver prices can move due to a wide range of factors. Geopolitical instability or fears of a deep recession can make Silver price escalate due to its safe-haven status, although to a lesser extent than Gold's. As a yieldless asset, Silver tends to rise with lower interest rates. Its moves also depend on how the US Dollar (USD) behaves as the asset is priced in dollars (XAG/USD). A strong Dollar tends to keep the price of Silver at bay, whereas a weaker Dollar is likely to propel prices up. Other factors such as investment demand, mining supply – Silver is much more abundant than Gold – and recycling rates can also affect prices.
Silver is widely used in industry, particularly in sectors such as electronics or solar energy, as it has one of the highest electric conductivity of all metals – more than Copper and Gold. A surge in demand can increase prices, while a decline tends to lower them. Dynamics in the US, Chinese and Indian economies can also contribute to price swings: for the US and particularly China, their big industrial sectors use Silver in various processes; in India, consumers’ demand for the precious metal for jewellery also plays a key role in setting prices.
Silver prices tend to follow Gold's moves. When Gold prices rise, Silver typically follows suit, as their status as safe-haven assets is similar. The Gold/Silver ratio, which shows the number of ounces of Silver needed to equal the value of one ounce of Gold, may help to determine the relative valuation between both metals. Some investors may consider a high ratio as an indicator that Silver is undervalued, or Gold is overvalued. On the contrary, a low ratio might suggest that Gold is undervalued relative to Silver.
(An automation tool was used in creating this post.)
The Australian Dollar (AUD) underperformed and Australian bonds surged on cooler Australia underlying inflation. The policy-relevant trimmed mean CPI rose 0.2pts less than expected by 0.8% q/q (consensus: 1.0%, prior: 1%) to be 3.9% y/y (consensus: 4.0%, prior: 4.0%), BBH FX analysts note.
Softer Australia inflation pushes USD downwards
“Australia headline CPI matched consensus. Headline CPI rose 1% q/q (consensus: 1.0%, prior: 1.0%) driven by Housing and Non-alcoholic beverages. Annually, the CPI inflation quickened to 3.8% from 3.6% in Q1. The monthly CPI indicator was also in line with expectations. In June, headline inflation eased 0.2pts to 3.8% y/y while the trimmed mean inflation slowed 0.3pts to 4.1%.”
“Meanwhile, Australia households continue to curb spending. In volume terms, retail turnover fell more than expected in Q2 by -0.3% q/q (consensus: -0.2%) following a -0.4% q/q decline in Q1. In nominal terms, retail sales growth overshot expectation rising 0.5% m/m in June (consensus: +0.2, prior: +0.6%) as mid-year sales boosted spending on discretionary items.”
“Softer Australia underlying inflation and poor retail sales activity mean RBA rate hikes are off the table. Cash rate futures went from pricing a small probability of an RBA rate hike by year-end to 70% odds of a 25bps rate cut after today’s data. We expect the RBA to stay on hold the rest of this year because inflation remains above the RBA’s 2-3% target.”
BoJ’s July 31st meeting pushed USDJPY back to the low 150, Citi’s FX analysts note.
A rally to 157.75 to provide attractive levels
“The BoJ’s July 31st meeting may be seen as ‘live’ for a rate hike and cut in monthly bond purchases. A double hit may well take USDJPY back to the low 150s in very quick time.”
“However, stronger USD GDP and Core PCE figures – along with Citi Analysts’ expectation of no hike from the BoJ in July, this could see USDJPY bounce short-term.”
“At an extreme, a rally to the 55dma (157.75) would provide attractive levels to sell.”
Counter to the view of the majority of BoJ watchers, the central bank this morning announced a 15-bps rate hike which was decided by a 7-2 majority. It also announced that its bond buying programme will be reduced by about JPY400 bln each quarter, so that it will be about JPY3 trn in Q1 2026, from around twice that size recently, Rabobank’s senior FX strategist Jane Foley notes.
Yen strengthens against the US Dollar
“The BoJ’s policy statement includes a fairly optimistic assessment of the Japanese economic outlook stating that fixed investment is ‘on a moderate increasing trend’ and corporate profits are ‘improving’. It states that wage rises ‘have been spreading across regions, industries, and firm sizes.’ This leaves the door open for further rate hikes potentially in late 2024 or early 2025.”
“While USD/JPY softened on today’s policy announcement, it had rallied earlier in the session on local press reports that a rate hike was being discussed by the BoJ. While USD/JPY is off the day’s lows, it is still holding below yesterday’s opening levels. We have brought forward our previous year end USD/JPY forecast of 152.00 to a 3-month view and have adjusted lower our 1 month forecast.”
“The next key focus for USD/JPY is this evening’s Federal Reserve policy announcement. The USD has been on the back foot through much of July as the market priced in a Fed rate cut in July. This helped to accentuate the impact of suspected MoF intervention starting on July 11. The USD may soften a touch more, though we wouldn’t expect a big USD move following the Fed today.”
- The Federal Reserve is widely anticipated to keep interest rates unchanged.
- Fed Chairman Powell’s remarks could provide important clues about the policy-easing strategy for the rest of the year.
- Markets see a strong chance of the Fed lowering policy rate multiple times starting in September.
The US Federal Reserve (Fed) will announce monetary policy decisions following the July 30 - 31 policy meeting on Wednesday. Market participants widely anticipate that the US central bank will leave the policy rate unchanged at 5.25%-5.5% for the eighth consecutive meeting.
The CME FedWatch Tool shows that markets see little to no chance of a rate cut in July but suggests that a September rate reduction is fully priced in. Hence, investors will scrutinize the changes in the statement language and comments from Fed Chairman Jerome Powell to figure out the policy-easing strategy for the rest of the year. According to the FedWatch Tool, there is a nearly 70% probability that the US central bank will cut the policy rate by a total of 75 basis points in 2024.
Growing optimism about disinflation progress resuming in the second half of the year – following the soft inflation prints seen in the second quarter – became apparent in Fed policymakers’ comments before the blackout period.
Richmond Federal Reserve President Thomas Barkin said that policymakers will debate at the July policy meeting whether it is still appropriate to describe inflation as elevated. In an interview with Yahoo Finance, Chicago Fed President Austan Goolsbee acknowledged that they have had multiple months of better inflation data, noting that he feels “a lot better on inflation.” Additionally, San Francisco Fed President Mary Daly said that there was significant progress on inflation and that she saw growing confidence in nearing the 2% target.
Previewing the Fed’s July policy meeting, “the FOMC is widely expected to keep the Fed funds target range unchanged for an eighth consecutive meeting next week, with the Committee's forward guidance proving key for setting up the stage for the start of the easing cycle,” said TD Securities analysts in a weekly report and added: “While Powell is likely to fall short from fully committing to a rate cut in September, he is likely to hint that the Fed's almost there.”
Economic Indicator
Fed Interest Rate Decision
The Federal Reserve (Fed) deliberates on monetary policy and makes a decision on interest rates at eight pre-scheduled meetings per year. It has two mandates: to keep inflation at 2%, and to maintain full employment. Its main tool for achieving this is by setting interest rates – both at which it lends to banks and banks lend to each other. If it decides to hike rates, the US Dollar (USD) tends to strengthen as it attracts more foreign capital inflows. If it cuts rates, it tends to weaken the USD as capital drains out to countries offering higher returns. If rates are left unchanged, attention turns to the tone of the Federal Open Market Committee (FOMC) statement, and whether it is hawkish (expectant of higher future interest rates), or dovish (expectant of lower future rates).
Read more.Next release: Wed Jul 31, 2024 18:00
Frequency: Irregular
Consensus: 5.5%
Previous: 5.5%
Source: Federal Reserve
When will the Fed announce its interest rate decision and how could it affect EUR/USD?
The US Federal Reserve is scheduled to announce its interest rate decision and publish the monetary policy statement at 18:00 GMT on July 31. This will be followed by Chairman Powell's press conference starting at 18:30 GMT.
In his last public appearance, Chairman Powell commented on the inflation outlook and said: “In the second quarter, actually, we did make some more progress on taming inflation,” and further elaborated: “We've had three better readings, and if you average them, that's a pretty good place.”
Powell might not outright confirm a rate cut in September but he is unlikely to push back against this expectation. Investors will be more curious about whether the Fed, or Powell, will leave the door open to multiple rate cuts in the last quarter of the year.
In case Powell hints that they might opt for additional policy easing toward the end of the year, the immediate market reaction could provide a boost to risk sentiment. In this scenario, the US Dollar (USD) is likely to come under renewed selling pressure. However, the fact that markets have already priced in a strong possibility of a 75 bps total rate reduction this year suggests that the USD doesn’t have a lot of room left on the downside.
If Powell reiterates the data-dependent approach and suggests that they will take their time to assess the impact of the first rate cut on the economy before deciding whether another rate reduction will follow, the USD could stage a rebound, given the market positioning.
“The 'Goldilocks' US economic backdrop of solid growth and modest disinflation suggests the Fed is unlikely to cut the funds rate as much as is currently priced in. Fed funds futures are pricing almost three cuts by December 2024 and a total of roughly 150 bps of easing over the next 12 months,” BBH analysts said in assessment of the Fed’s policy outlook and further commented on the USD’s potential performance:
“Moreover, rising US productivity can lead to low inflationary economic growth, higher real interest rates and an appreciation in the currency over the longer term.”
Meanwhile, Eren Sengezer, European Session Lead Analyst at FXStreet, provides a short-term technical outlook for EUR/USD:
“1.0790-1.0810, where the 200-day, 50-day and 100-day Simple Moving Averages are located, aligns as a key pivot area for EUR/USD. As long as this area stays intact as support, technical buyers could remain interested. On the upside, the 20-day SMA aligns as interim resistance at 1.0860 before 1.0950 (July 17 high). In case EUR/USD falls below 1.0790-1.0810 and starts using this region as resistance, 1.0700 (psychological level, static level) could be set as the next bearish target before 1.0665 (June 26 low).”
Interest rates FAQs
Interest rates are charged by financial institutions on loans to borrowers and are paid as interest to savers and depositors. They are influenced by base lending rates, which are set by central banks in response to changes in the economy. Central banks normally have a mandate to ensure price stability, which in most cases means targeting a core inflation rate of around 2%. If inflation falls below target the central bank may cut base lending rates, with a view to stimulating lending and boosting the economy. If inflation rises substantially above 2% it normally results in the central bank raising base lending rates in an attempt to lower inflation.
Higher interest rates generally help strengthen a country’s currency as they make it a more attractive place for global investors to park their money.
Higher interest rates overall weigh on the price of Gold because they increase the opportunity cost of holding Gold instead of investing in an interest-bearing asset or placing cash in the bank. If interest rates are high that usually pushes up the price of the US Dollar (USD), and since Gold is priced in Dollars, this has the effect of lowering the price of Gold.
The Fed funds rate is the overnight rate at which US banks lend to each other. It is the oft-quoted headline rate set by the Federal Reserve at its FOMC meetings. It is set as a range, for example 4.75%-5.00%, though the upper limit (in that case 5.00%) is the quoted figure. Market expectations for future Fed funds rate are tracked by the CME FedWatch tool, which shapes how many financial markets behave in anticipation of future Federal Reserve monetary policy decisions.
- EUR/JPY stays under heavy bearish pressure and trades below 163.00 on Wednesday.
- The Bank of Japan unexpectedly raised its policy rate by 15 basis points.
- Core HICP inflation in the Eurozone held steady at 2.9% on a yearly basis in July.
EUR/JPY came under heavy bearish pressure on Wednesday and dropped to its weakest level since mid-April at 162.20. At the time of press, the pair was trading at 162.90, losing 1.4% on a daily basis.
Japanese Yen PRICE Today
The table below shows the percentage change of Japanese Yen (JPY) against listed major currencies today. Japanese Yen was the strongest against the Australian Dollar.
| USD | EUR | GBP | JPY | CAD | AUD | NZD | CHF | |
|---|---|---|---|---|---|---|---|---|
| USD | -0.10% | 0.01% | -1.52% | -0.05% | 0.61% | -0.26% | -0.18% | |
| EUR | 0.10% | 0.13% | -1.40% | 0.04% | 0.71% | -0.13% | -0.08% | |
| GBP | -0.01% | -0.13% | -1.54% | -0.09% | 0.57% | -0.27% | -0.20% | |
| JPY | 1.52% | 1.40% | 1.54% | 1.54% | 2.15% | 1.27% | 1.39% | |
| CAD | 0.05% | -0.04% | 0.09% | -1.54% | 0.64% | -0.20% | -0.13% | |
| AUD | -0.61% | -0.71% | -0.57% | -2.15% | -0.64% | -0.85% | -0.78% | |
| NZD | 0.26% | 0.13% | 0.27% | -1.27% | 0.20% | 0.85% | 0.08% | |
| CHF | 0.18% | 0.08% | 0.20% | -1.39% | 0.13% | 0.78% | -0.08% |
The heat map shows percentage changes of major currencies against each other. The base currency is picked from the left column, while the quote currency is picked from the top row. For example, if you pick the Japanese Yen from the left column and move along the horizontal line to the US Dollar, the percentage change displayed in the box will represent JPY (base)/USD (quote).
BoJ raises policy rate by 15 bps
The broad-based Japanese Yen (JPY) strength forces EUR/JPY to push lower midweek. Following its July policy meeting, the Bank of Japan (BoJ) announced that it raised the policy rate by 15 basis points (bps) to the range of 0.15%-0.25%. Additionally, the BoJ said that it will taper Japanese government bond (JGB) purchases to JPY3 trillion per month as of the first quarter of 2026.
In the post-meeting press conference, Governor Kazuo Ueda said that they will keep raising rates and adjust the degree of easing if the current economic and price outlook is realized, providing an additional boost to the JPY.
Reflecting the JPY strength, USD/JPY is down 1.% on the day below 150.50.
Meanwhile, Eurostat reported on Wednesday that the core Harmonized Index of Consumer Prices (HICP) rose 2.9% on a yearly basis in July. This reading matched June's increase and came in above the market expectation of 2.8%.
Japanese Yen FAQs
The Japanese Yen (JPY) is one of the world’s most traded currencies. Its value is broadly determined by the performance of the Japanese economy, but more specifically by the Bank of Japan’s policy, the differential between Japanese and US bond yields, or risk sentiment among traders, among other factors.
One of the Bank of Japan’s mandates is currency control, so its moves are key for the Yen. The BoJ has directly intervened in currency markets sometimes, generally to lower the value of the Yen, although it refrains from doing it often due to political concerns of its main trading partners. The current BoJ ultra-loose monetary policy, based on massive stimulus to the economy, has caused the Yen to depreciate against its main currency peers. This process has exacerbated more recently due to an increasing policy divergence between the Bank of Japan and other main central banks, which have opted to increase interest rates sharply to fight decades-high levels of inflation.
The BoJ’s stance of sticking to ultra-loose monetary policy has led to a widening policy divergence with other central banks, particularly with the US Federal Reserve. This supports a widening of the differential between the 10-year US and Japanese bonds, which favors the US Dollar against the Japanese Yen.
The Japanese Yen is often seen as a safe-haven investment. This means that in times of market stress, investors are more likely to put their money in the Japanese currency due to its supposed reliability and stability. Turbulent times are likely to strengthen the Yen’s value against other currencies seen as more risky to invest in.
- NZD/USD advances due to dovish sentiment surrounding the Fed’s interest rates trajectory.
- The US Dollar extends its decline due to growing anticipation of a Fed rate cut in September.
- The Kiwi Dollar may struggle due to rising odds of an early rate cut by the RBNZ.
NZD/USD trades around 0.5910 during the European session on Wednesday, extending its gains for the second consecutive session after hitting a three-month low at 0.5857 on Monday. This upside of the NZD/USD could be attributed to the dovish sentiment surrounding the Federal Reserve’s (Fed) interest rates trajectory.
The Fed is expected to keep rates unchanged at its policy meeting scheduled for Wednesday. However, there is growing anticipation of a rate cut in September. Additionally, signs of cooling inflation and easing labor market conditions in the United States are further fueling expectations of multiple rate cuts by the Fed this year, potentially totaling three cuts. These speculations are putting pressure on the US Dollar.
In New Zealand, Building Permits dropped by 13.8% month-on-month in June, following an upwardly revised 1.9% decrease in the previous month. This marks the steepest decline since February 2021. Additionally, the ANZ Business Confidence index surged to 27.1 in July from 6.1 in June, marking the first rise in six months and reaching its highest level since February.
Speculation about an early interest rate cut by the Reserve Bank of New Zealand (RBNZ) might limit the upside potential of the NZD/USD pair. Investors are expecting potential rate cuts from the RBNZ, with traders currently indicating a 44% probability of such a move due to recent weak inflation and labor data.
The New Zealand Dollar (NZD) received support after the release of the Chinese Manufacturing Purchasing Managers' Index (PMI) data for July, considering China is a major trading partner of New Zealand.
China’s NBS Manufacturing PMI posted a reading of 49.4 for July, slightly above the expected 49.3 but below the prior 49.5. Meanwhile, the Non-Manufacturing PMI came in at 50.2 as expected. Since changes in the Chinese economy can significantly impact the New Zealand market, these PMI readings are particularly relevant.
New Zealand Dollar FAQs
The New Zealand Dollar (NZD), also known as the Kiwi, is a well-known traded currency among investors. Its value is broadly determined by the health of the New Zealand economy and the country’s central bank policy. Still, there are some unique particularities that also can make NZD move. The performance of the Chinese economy tends to move the Kiwi because China is New Zealand’s biggest trading partner. Bad news for the Chinese economy likely means less New Zealand exports to the country, hitting the economy and thus its currency. Another factor moving NZD is dairy prices as the dairy industry is New Zealand’s main export. High dairy prices boost export income, contributing positively to the economy and thus to the NZD.
The Reserve Bank of New Zealand (RBNZ) aims to achieve and maintain an inflation rate between 1% and 3% over the medium term, with a focus to keep it near the 2% mid-point. To this end, the bank sets an appropriate level of interest rates. When inflation is too high, the RBNZ will increase interest rates to cool the economy, but the move will also make bond yields higher, increasing investors’ appeal to invest in the country and thus boosting NZD. On the contrary, lower interest rates tend to weaken NZD. The so-called rate differential, or how rates in New Zealand are or are expected to be compared to the ones set by the US Federal Reserve, can also play a key role in moving the NZD/USD pair.
Macroeconomic data releases in New Zealand are key to assess the state of the economy and can impact the New Zealand Dollar’s (NZD) valuation. A strong economy, based on high economic growth, low unemployment and high confidence is good for NZD. High economic growth attracts foreign investment and may encourage the Reserve Bank of New Zealand to increase interest rates, if this economic strength comes together with elevated inflation. Conversely, if economic data is weak, NZD is likely to depreciate.
The New Zealand Dollar (NZD) tends to strengthen during risk-on periods, or when investors perceive that broader market risks are low and are optimistic about growth. This tends to lead to a more favorable outlook for commodities and so-called ‘commodity currencies’ such as the Kiwi. Conversely, NZD tends to weaken at times of market turbulence or economic uncertainty as investors tend to sell higher-risk assets and flee to the more-stable safe havens.
The Eurozone Harmonized Index of Consumer Prices (HICP) rose at an annual rate of 2.6% in July after recording a 2.5% growth in June, the official data released by Eurostat showed Wednesday. The market forecast was for a 2.4% increase in the reported period.
The Core HICP climbed 2.9% YoY in July, at the same pace as seen in June while coming in above the estimated 2.8% print.
On a monthly basis, the bloc’s HICP showed no growth in July vs. June’s 0.2% acceleration. The core HICP inflation came in at -0.2% MoM in the same period, compared with a 0.4% growth seen previously.
The European Central Bank’s (ECB) inflation target is 2.0%. The old continent’s HICP inflation data have a significant impact on the market’s pricing of the ECB's second interest rate cut.
Key details from the Eurozone inflation report (via Eurostat)
“Looking at the main components of euro area inflation, services is expected to have the highest annual rate in July (4.0%, compared with 4.1% in June), followed by food, alcohol & tobacco (2.3%, compared with 2.4% in June), energy (1.3%, compared with 0.2% in June) and non-energy industrial goods (0.8%, compared with 0.7% in June).”
EUR/USD reaction to the Eurozone inflation report
The Euro pays little heed to the mixed Eurozone inflation data. EUR/USD is trading 0.7% higher on the day at 1.0822, as of writing.
Euro PRICE Today
The table below shows the percentage change of Euro (EUR) against listed major currencies today. Euro was the strongest against the Australian Dollar.
| USD | EUR | GBP | JPY | CAD | AUD | NZD | CHF | |
|---|---|---|---|---|---|---|---|---|
| USD | -0.07% | 0.07% | -1.30% | -0.02% | 0.76% | -0.15% | -0.16% | |
| EUR | 0.07% | 0.15% | -1.22% | 0.04% | 0.83% | -0.06% | -0.08% | |
| GBP | -0.07% | -0.15% | -1.39% | -0.11% | 0.67% | -0.21% | -0.23% | |
| JPY | 1.30% | 1.22% | 1.39% | 1.35% | 2.09% | 1.18% | 1.20% | |
| CAD | 0.02% | -0.04% | 0.11% | -1.35% | 0.76% | -0.12% | -0.14% | |
| AUD | -0.76% | -0.83% | -0.67% | -2.09% | -0.76% | -0.89% | -0.92% | |
| NZD | 0.15% | 0.06% | 0.21% | -1.18% | 0.12% | 0.89% | -0.02% | |
| CHF | 0.16% | 0.08% | 0.23% | -1.20% | 0.14% | 0.92% | 0.02% |
The heat map shows percentage changes of major currencies against each other. The base currency is picked from the left column, while the quote currency is picked from the top row. For example, if you pick the Euro from the left column and move along the horizontal line to the US Dollar, the percentage change displayed in the box will represent EUR (base)/USD (quote).
The next support at 7.2220 is unlikely to come under threat. The US Dollar (USD) must break and remain below the 7.2037 low before further weakness can be expected, UOB Group FX analysts Quek Ser Leang and Lee Sue Ann note.
The price is to touch 7.2220 in short term
24-HOUR VIEW: “The sharp drop in USD that sent it plummeting to 7.2354 was surprising. While the weakness is oversold, it has not stabilised. Today, as long as 7.2600 (minor resistance is at 7.2540) is not breached, USD could drop below 7.2350. The next support at 7.2200 is unlikely to come under threat.”
1-3 WEEKS VIEW: “Last Thursday, USD plunged to a low of 7.2037 before rebounding. On Friday (26 Jul, spot at 7.2470), we highlighted that ‘while further USD weakness is not ruled out, it must break and remain below the 7.2037 low before further decline can be expected.’ We added, ‘the likelihood of USD breaking clearly below the low will be intact provided that 7.2800 is not breached.’ We continue to hold the same view.”
Sharp drop in USD has scope to extend. Any decline is likely part of a lower trading range of 150.50/155.00, UOB Group FX analysts Quek Ser Leang and Lee Sue Ann note.
Bears to break below 150.50
24-HOUR VIEW: “Our view for USD to trade in a range was incorrect. USD traded in a volatile manner, rising to 155.21 before plunging to a low of 152.64. The sharp drop from the high has scope to extend, but given that conditions are approaching oversold levels, it is yet to be determined if any further decline can reach the major support at 151.30 (there is another support level at 151.90). Resistance levels are at 153.20 and 153.80.”
1-3 WEEKS VIEW: “We have expected USD to weaken since the middle of the month. In our most recent narrative from last Friday (26 Jul, spot at 153.50), we highlighted that ‘the weakness in USD appears to be stabilising.’ We added, ‘a breach of 155.00 would indicate USD is not declining further.’ Yesterday, USD rose briefly to 155.21 and then plummeted. Downward momentum is building again, albeit not significantly. From here, while there is room for USD to weaken, we held the view that any decline is likely part of a lower trading range of 150.50/155.00. In other words, a sustained drop below 150.50 seems unlikely for now.”
The bias for the New Zealand Dollar (NZD) is tilted to the upside; it remains to be seen if any advance can break the strong resistance level at 0.5930, UOB Group FX analysts Quek Ser Leang and Lee Sue Ann note, UOB Group FX analysts Quek Ser Leang and Lee Sue Ann note.
The 0.5930 resistance is next to watch
24-HOUR VIEW: “After NZD dropped to 0.5859 two days ago and then rebounded, we indicated yesterday that ‘despite the decline, downward momentum has not increased much, and NZD is unlikely to weaken much further.’ We expected NZD to trade sideways between 0.5860 and 0.5900. NZD subsequently traded in a higher range of 0.5869/0.5905, closing on a firm note at 0.5903 (+0.47%). NZD is facing mild upward pressure, and the bias for today is tilted to the upside. However, it remains to be seen if any advance can break the strong resistance level at 0.5930 (there is another resistance at 0.5915). To keep the mild momentum going, NZD must not break below 0.5875 with minor support at 0.5885.”
1-3 WEEKS VIEW: “We turned negative in NZD two weeks ago. As we tracked the decline in NZD, in our most recent narrative from last Friday (26 Jul, spot at 0.5890), we indicated that ‘while further NZD weakness is not ruled out, severely oversold conditions suggest limited downside potential.’ We also indicated that ‘the next level to monitor is 0.5850.’ Two days ago, NZD dipped to 0.5859 and then rebounded. Downward momentum is slowing, this, combined with the still oversold conditions, suggests that the weakness in NZD is close to an end. However, only a breach of 0.5930 (no change in ‘strong resistance’ level) would indicate that NZD is not declining further.”
As long as 0.6540 is not breached, the Australian Dollar (AUD) could break the major support at 0.6480. It is unclear whether it can maintain a foothold below this level, ant it is uncertain if 0.6425 will come into view, UOB Group FX analysts Quek Ser Leang and Lee Sue Ann note.
Below 0.6480 the next level to watch is 0.6425
24-HOUR VIEW: “AUD closed at 0.6539 (-0.16%) in NY but in early Asian trade today, it plunged. The sharp decline appears to be a tad overdone. However, as long as 0.6540 is not breached, AUD could break below the major support at 0.6480. At this time, it is unclear whether it can maintain a foothold below this level (next support is at 0.6450).”
1-3 WEEKS VIEW: “Our most recent narrative was from last Friday (26 Jul, spot at 0.6545) wherein the weakness in AUD that started two weeks ago seems to be overextended, both time- and price-wise. However, we pointed out that ‘only a breach of 0.6615 will indicate that the weakness has stabilised,’ and that ‘there is still a chance, albeit a low one, for AUD to decline further to 0.6480.’ After trading in a quiet manner for a couple of days, AUD plunged in early Asian trade today. While the price action suggests further AUD weakness, the decline still seems to be overextended, and it is uncertain if the next support at 0.6425 will come into view (there is a minor support at 0.6450). On the upside, the ‘strong resistance’ level has moved lower to 0.6565 from 0.6615.”
The Pound Sterling (GBP) is likely to trade in a range, probably between 1.2815 and 1.2870, UOB Group FX analysts Quek Ser Leang and Lee Sue Ann note.
GBP is likely to trade towards 1.2780
24-HOUR VIEW: “We expected GBP to trade in a range between 1.2810 and 1.2890 yesterday. GBP subsequently traded in a relatively quiet manner between 1.2821 and 1.2866, closing at 1.2837 (-0.18%). Further range trading seems likely, probably in a range of 1.2815/1.2870.”
1-3 WEEKS VIEW: “Our update from last Friday (26 Jul, spot at 1.2855) is still valid. As highlighted, ‘downward momentum is building, but at this time, it is premature to expect a significant decline.’ Overall, provided that 1.2895 (‘strong resistance’ level previously at 1.2910) is not breached, GBP is likely to trade with a downward bias towards 1.2780.”
- The US Dollar falls slightly on expectations that the Fed will deliver a dovish guidance.
- Investors see the Fed acknowledging progress in inflation and growing risks to labor market strength.
- After the Fed policy, the US NFP report for July will be the key trigger for the US Dollar.
The US Dollar (USD) exhibits a subdued performance in Wednesday’s European session ahead of the monetary policy announcement by the Federal Reserve (Fed) at 18:00 GMT. The US Dollar Index (DXY), which tracks the Greenback’s value against six major currencies, edges lower to near 104.40. 10-year US Treasury yields remain flat near more than four-month low around 4.14% on expectations that the outcome of the Fed policy will not be favorable for the consistency of the restrictive interest rate framework.
Investors see the Fed leaving interest rates unchanged in the range of 5.25%-5.50% consecutively for the eighth meeting. However, the communication on the interest rate guidance is expected to be dovish due to cooling United States (US) inflationary pressures and moderating labor market strength.
Unicredit Research said in a note, The Fed will likely leave rates unchanged but send a clear signal that it's getting closer to cutting rates and could do so as soon as September.”
Daily digest market movers: US Dollar underperforms ahead of Fed policy
- The US Dollar underperforms its major peers, except the Australian Dollar (AUD), on Wednesday. The Greenback weakens on expectations that the Fed will turn dovish this time. Investors await the monetary policy statement and the Fed Chair Jerome Powell’s conference to know how soon and how much the central bank will reduce interest rates this year. The Aussie weakens after expected decline in annual Q2 Consumer Price index (CPI) print.
- According to the CME FedWatch tool, 30-day Federal Fund Futures pricing data shows that the central bank will reduce interest rates by 25 basis points (bps) from their current levels in the September meeting. The data also shows that there will be two rate cuts instead of one as projected by policymakers in the latest Fed dot plot.
- The expectations for the Fed to deliver dovish guidance have been prompted by downside risks to inflation remaining persistent and easing labor market strength. US CPI slowed more than expected in May and June, suggesting that the disinflation process has resumed, which reversed in the first quarter of the year. Meanwhile, moderating job demand and a more than two-year high Unemployment Rate have indicated that the labor market has ceased to be resilient.
- Before the Fed’s decision, the US ADP Employment Change for July will be under the spotlight. The report is estimated to show that private payrolls rose steadily by 150K.
- Volatility in the FX domain will last the entire week as the US ISM Manufacturing Purchasing Managers’ Index (PMI) and the Nonfarm Payrolls (NFP) for July are lined up for release, which will be published on Thursday and Friday, respectively.
- Meanwhile, the market sentiment remains firm despite deepening fears of widening Middle East conflict. The killing of Hamas leader Ismail Haniyeh in an Israeli air strike on Tehran has prompted risks of a potential escalation in the Israel-Iran war. Historically, geopolitical tensions turn investors risk-averse but investors have already priced in Middle East woes.
US Dollar Price Today:
US Dollar PRICE Today
The table below shows the percentage change of US Dollar (USD) against listed major currencies today. US Dollar was the strongest against the Australian Dollar.
| USD | EUR | GBP | JPY | CAD | AUD | NZD | CHF | |
|---|---|---|---|---|---|---|---|---|
| USD | -0.01% | 0.07% | -1.56% | -0.03% | 0.74% | -0.16% | -0.13% | |
| EUR | 0.01% | 0.10% | -1.48% | -0.02% | 0.74% | -0.13% | -0.12% | |
| GBP | -0.07% | -0.10% | -1.60% | -0.12% | 0.63% | -0.23% | -0.20% | |
| JPY | 1.56% | 1.48% | 1.60% | 1.58% | 2.29% | 1.38% | 1.46% | |
| CAD | 0.03% | 0.02% | 0.12% | -1.58% | 0.74% | -0.14% | -0.10% | |
| AUD | -0.74% | -0.74% | -0.63% | -2.29% | -0.74% | -0.87% | -0.85% | |
| NZD | 0.16% | 0.13% | 0.23% | -1.38% | 0.14% | 0.87% | 0.03% | |
| CHF | 0.13% | 0.12% | 0.20% | -1.46% | 0.10% | 0.85% | -0.03% |
The heat map shows percentage changes of major currencies against each other. The base currency is picked from the left column, while the quote currency is picked from the top row. For example, if you pick the US Dollar from the left column and move along the horizontal line to the Japanese Yen, the percentage change displayed in the box will represent USD (base)/JPY (quote).
Technical Analysis: US Dollar faces resistance near 50-day EMA
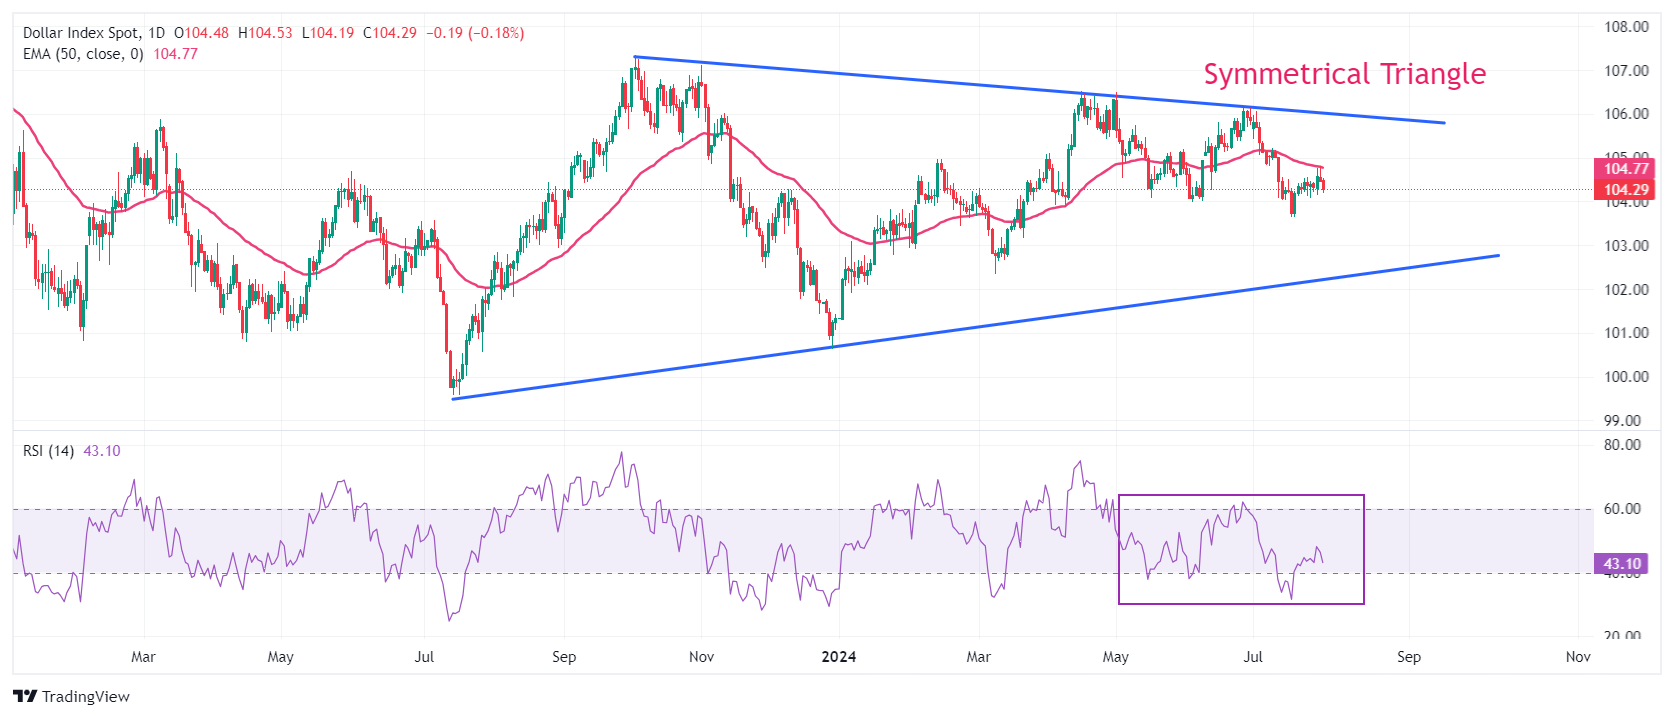
The USD Index trades in a Symmetrical Triangle formation, on a daily timeframe, which exhibits a sharp volatility contraction. The above-mentioned chart pattern results in a sideways trend with lower volume and smaller ticks. The near-term trend remains bearish as the 50-day Exponential Moving Average (EMA) around 104.77 is acting as major barricade for the US Dollar bulls.
The 14-day Relative Strength Index (RSI) oscillates in the 20.00-60.00 range, suggesting that the overall trend is bearish. While the bearish momentum is inactive.
On the upside, July 9 high at 105.20 and three-month high near 106.00 will be key resistances for the US Dollar. While July 17 low at 103.65 and March 8 low at 102.35 will be key support areas.
US Dollar FAQs
The US Dollar (USD) is the official currency of the United States of America, and the ‘de facto’ currency of a significant number of other countries where it is found in circulation alongside local notes. It is the most heavily traded currency in the world, accounting for over 88% of all global foreign exchange turnover, or an average of $6.6 trillion in transactions per day, according to data from 2022. Following the second world war, the USD took over from the British Pound as the world’s reserve currency. For most of its history, the US Dollar was backed by Gold, until the Bretton Woods Agreement in 1971 when the Gold Standard went away.
The most important single factor impacting on the value of the US Dollar is monetary policy, which is shaped by the Federal Reserve (Fed). The Fed has two mandates: to achieve price stability (control inflation) and foster full employment. Its primary tool to achieve these two goals is by adjusting interest rates. When prices are rising too quickly and inflation is above the Fed’s 2% target, the Fed will raise rates, which helps the USD value. When inflation falls below 2% or the Unemployment Rate is too high, the Fed may lower interest rates, which weighs on the Greenback.
In extreme situations, the Federal Reserve can also print more Dollars and enact quantitative easing (QE). QE is the process by which the Fed substantially increases the flow of credit in a stuck financial system. It is a non-standard policy measure used when credit has dried up because banks will not lend to each other (out of the fear of counterparty default). It is a last resort when simply lowering interest rates is unlikely to achieve the necessary result. It was the Fed’s weapon of choice to combat the credit crunch that occurred during the Great Financial Crisis in 2008. It involves the Fed printing more Dollars and using them to buy US government bonds predominantly from financial institutions. QE usually leads to a weaker US Dollar.
Quantitative tightening (QT) is the reverse process whereby the Federal Reserve stops buying bonds from financial institutions and does not reinvest the principal from the bonds it holds maturing in new purchases. It is usually positive for the US Dollar.
There is a chance for the Euro (EUR) to dip to 1.0790 before the risk of a more sustained rebound increases. The major support at 1.0760 is unlikely to come under threat, UOB Group FX analysts Quek Ser Leang and Lee Sue Ann note.
EUR may dip towards 1.0790 in short term
24-HOUR VIEW: “When EUR was trading at 1.0820 yesterday, we highlighted yesterday that ‘provided that EUR remains below 1.0845 (minor resistance is at 1.0835), it could drop below 1.0800.’ We added, ‘the major support at 1.0760 is unlikely to come under threat.’ Our view was not wrong, as EUR remained below 1.0845 (high of 1.0835) and dropped below 1.0800 (low of 1.0795). EUR closed largely unchanged at 1.0815 (-0.14%). Downward momentum is slowing, but there is still a chance for EUR to dip to 1.0790 before the risk of a more sustained rebound increases. The major support at 1.0760 is still unlikely to come under threat. Resistance levels are at 1.0830 and 1.0845.”
1-3 WEEKS VIEW: “We highlighted yesterday (30 Jul, spot at 1.0820) that we continue to hold a negative EUR view, and the next level to focus on is 1.0760. There is no change in our stand. Overall, only a breach of 1.0870 (no change in ‘strong resistance’ level) would mean that the EUR weakness that started in the middle of last week has ended.”
- WTI rebounds from an eight-week low of $74.24 recorded on Tuesday.
- Oil prices gain ground as Middle East tensions pose risks to Oil supply.
- The prices of crude Oil may receive support from the increasing odds of a Fed rate cut in September.
West Texas Intermediate (WTI) crude Oil price trades around $75.70 per barrel by the press time. WTI rebounded from an eight-week low of $74.24 recorded on Tuesday, attributed to rising geopolitical tensions in the Middle East that pose risks to Oil supply.
The Israeli government claims it killed Hezbollah's most senior commander in an airstrike on Beirut on Tuesday, in retaliation for Saturday's cross-border rocket attack on Israel. This escalation occurred despite diplomatic efforts by US and UN officials to prevent a major conflict that could inflame the wider Middle East, according to Reuters.
The Federal Reserve (Fed) is anticipated to maintain current interest rates on Wednesday. However, there is increasing speculation about a potential rate cut in September. This expectation could bolster economic activity in the United States, the world's largest consumer of crude Oil, thereby supporting the demand for the liquid Gold.
However, a sluggish economic outlook in China, the world's largest crude importer, is limiting the upside of Oil prices. China's manufacturing activity in July contracted for the third consecutive month, according to an official factory survey released on Wednesday.
The Organization of the Petroleum Exporting Countries and allies led by Russia (OPEC+) will hold an online Joint Ministerial Monitoring Committee (JMMC) meeting on Thursday. According to Reuters, the group is unlikely to make any changes to its current agreement to cut production and plans to begin unwinding some of these cuts starting in October.
The US Energy Information Administration (EIA) will report the Crude Oil Stocks Change later in the North American session. The market anticipates a decline of 1.60 million barrels for the week ending July 26, following the previous week’s decline of 3.741 million barrels.
WTI Oil FAQs
WTI Oil is a type of Crude Oil sold on international markets. The WTI stands for West Texas Intermediate, one of three major types including Brent and Dubai Crude. WTI is also referred to as “light” and “sweet” because of its relatively low gravity and sulfur content respectively. It is considered a high quality Oil that is easily refined. It is sourced in the United States and distributed via the Cushing hub, which is considered “The Pipeline Crossroads of the World”. It is a benchmark for the Oil market and WTI price is frequently quoted in the media.
Like all assets, supply and demand are the key drivers of WTI Oil price. As such, global growth can be a driver of increased demand and vice versa for weak global growth. Political instability, wars, and sanctions can disrupt supply and impact prices. The decisions of OPEC, a group of major Oil-producing countries, is another key driver of price. The value of the US Dollar influences the price of WTI Crude Oil, since Oil is predominantly traded in US Dollars, thus a weaker US Dollar can make Oil more affordable and vice versa.
The weekly Oil inventory reports published by the American Petroleum Institute (API) and the Energy Information Agency (EIA) impact the price of WTI Oil. Changes in inventories reflect fluctuating supply and demand. If the data shows a drop in inventories it can indicate increased demand, pushing up Oil price. Higher inventories can reflect increased supply, pushing down prices. API’s report is published every Tuesday and EIA’s the day after. Their results are usually similar, falling within 1% of each other 75% of the time. The EIA data is considered more reliable, since it is a government agency.
OPEC (Organization of the Petroleum Exporting Countries) is a group of 13 Oil-producing nations who collectively decide production quotas for member countries at twice-yearly meetings. Their decisions often impact WTI Oil prices. When OPEC decides to lower quotas, it can tighten supply, pushing up Oil prices. When OPEC increases production, it has the opposite effect. OPEC+ refers to an expanded group that includes ten extra non-OPEC members, the most notable of which is Russia.
Here is what you need to know on Wednesday, July 31:
After a volatile Asian session that featured inflation data from Australia and the Bank of Japan's (BoJ) policy decisions, investors gear up for further action on the last trading day of July. Harmonized Index of Consumer Prices (HICP) data for July stands out in the European economic docket. Later in the day, ADP Employment Change data from the US will be watched closely by market participants before the Federal Reserve's (Fed) monetary policy announcements.
The BoJ unexpectedly raised its policy rate by 15 basis points (bps) to the range of 0.15%-0.25% from 0%-0.1%. Additionally, the Japanese central bank decided to taper Japanese government bond (JGB) buying to JPY3 trillion per month as of the first quarter of 2026. In the post meeting press conference, BoJ Governor Kazuo Ueda said that they will keep raising rates and adjust the degree of monetary easing if current economic, price outlook is realized. USD/JPY rose sharply toward 154.00 following a dip to the 151.50 area with the immediate reaction to the BoJ's rate hike but failed to gather further bullish momentum. At the time of press, the pair was trading slightly above 152.50.
Japanese Yen PRICE This week
The table below shows the percentage change of Japanese Yen (JPY) against listed major currencies this week. Japanese Yen was the weakest against the New Zealand Dollar.
| USD | EUR | GBP | JPY | CAD | AUD | NZD | CHF | |
|---|---|---|---|---|---|---|---|---|
| USD | 0.38% | 0.30% | -0.97% | 0.05% | 0.68% | -0.48% | -0.11% | |
| EUR | -0.38% | -0.12% | -1.37% | -0.30% | 0.34% | -0.88% | -0.47% | |
| GBP | -0.30% | 0.12% | -1.31% | -0.20% | 0.47% | -0.74% | -0.35% | |
| JPY | 0.97% | 1.37% | 1.31% | 1.02% | 1.70% | 0.51% | 0.95% | |
| CAD | -0.05% | 0.30% | 0.20% | -1.02% | 0.66% | -0.57% | -0.15% | |
| AUD | -0.68% | -0.34% | -0.47% | -1.70% | -0.66% | -1.19% | -0.82% | |
| NZD | 0.48% | 0.88% | 0.74% | -0.51% | 0.57% | 1.19% | 0.39% | |
| CHF | 0.11% | 0.47% | 0.35% | -0.95% | 0.15% | 0.82% | -0.39% |
The heat map shows percentage changes of major currencies against each other. The base currency is picked from the left column, while the quote currency is picked from the top row. For example, if you pick the Japanese Yen from the left column and move along the horizontal line to the US Dollar, the percentage change displayed in the box will represent JPY (base)/USD (quote).
During the Asian trading hours, the data from Australia showed that the Consumer Price Index (CPI) rose 1% on a quarterly basis in the second quarter. On a yearly basis, the CPI increased 3.8% as forecast. The Reserve Bank of Australia's mean CPI rose 3.9% in the second quarter (YoY) following the 4% increase recorded in the first quarter. Finally, Retail Sales in Australia rose 0.5% in June, surpassing the market expectation of 0.2%. AUD/USD came under bearish pressure and was last seen trading at its lowest level since early May near 0.6500, losing 0.5% on a daily basis.
Meanwhile, NBS Manufacturing PMI in China arrived at 49.4 in July and NBS-Non Manufacturing PMI edged slightly lower to 50.2 from 50.5 in June.
The Fed is widely expected to leave its policy setting unchanged following the July policy meeting. Investors will scrutinize changes in the policy statement and Fed Chairman Jerome Powell's comments in the post-meeting press conference to see whether the US central bank intends to lower the policy rate several times before the end of the year. The US Dollar (USD) Index moves up and down in a tight range below 104.50 and the benchmark 10-year US Treasury bond yield holds steady at around 4.15%. In the meantime, US stock index futures trade in positive territory, with S&P 500 Futures and Nasdaq Futures gaining 0.75% and 1.35%, respectively.
EUR/USD registered losses for the second consecutive day on Tuesday but managed to hold above 1.0800. The pair trades in a tight channel near 1.0820 in the European morning on Wednesday.
GBP/USD struggled to gather recovery momentum after moving sideways near 1.2850 in the European session on Tuesday and closed the day in negative territory. The pair stays in a consolidation phase at around 1.2830 early Wednesday.
Following a quiet European session, Gold turned bullish in the American session on Tuesday and closed above $2,400, gaining over 1% on a daily basis. XAU/USD continues to stretch higher on Wednesday toward $2,420.
Fed FAQs
Monetary policy in the US is shaped by the Federal Reserve (Fed). The Fed has two mandates: to achieve price stability and foster full employment. Its primary tool to achieve these goals is by adjusting interest rates. When prices are rising too quickly and inflation is above the Fed’s 2% target, it raises interest rates, increasing borrowing costs throughout the economy. This results in a stronger US Dollar (USD) as it makes the US a more attractive place for international investors to park their money. When inflation falls below 2% or the Unemployment Rate is too high, the Fed may lower interest rates to encourage borrowing, which weighs on the Greenback.
The Federal Reserve (Fed) holds eight policy meetings a year, where the Federal Open Market Committee (FOMC) assesses economic conditions and makes monetary policy decisions. The FOMC is attended by twelve Fed officials – the seven members of the Board of Governors, the president of the Federal Reserve Bank of New York, and four of the remaining eleven regional Reserve Bank presidents, who serve one-year terms on a rotating basis.
In extreme situations, the Federal Reserve may resort to a policy named Quantitative Easing (QE). QE is the process by which the Fed substantially increases the flow of credit in a stuck financial system. It is a non-standard policy measure used during crises or when inflation is extremely low. It was the Fed’s weapon of choice during the Great Financial Crisis in 2008. It involves the Fed printing more Dollars and using them to buy high grade bonds from financial institutions. QE usually weakens the US Dollar.
Quantitative tightening (QT) is the reverse process of QE, whereby the Federal Reserve stops buying bonds from financial institutions and does not reinvest the principal from the bonds it holds maturing, to purchase new bonds. It is usually positive for the value of the US Dollar.
- Gold price rises to near $2,420 as upside risks to Middle East tensions have improved its safe-haven appeal.
- The major trigger for the Gold price will be the Fed’s guidance on interest rates.
- Investors see the Fed leaving interest rates unchanged with a dovish guidance.
Gold price (XAU/USD) exhibits a strong performance in Wednesday’s European session, with investors focusing on the Federal Reserve’s (Fed) monetary policy outcome later the day. The precious metal climbs to near $2,420 as its safe-haven appeal improves amid fears that Middle East tensions would widen further. Historically, investors find investment in precious metals as safe bet amid geopolitical tensions.
Fears of an all-out war between Israel and Iran deepened after reports showed that Hamas leader Ismail Haniyeh was killed in an Israeli air strike on Tehran. This has prompted fears of a retaliation move by Iran, which would diminish hopes of a ceasefire significantly.
Meanwhile, the US Dollar remains in a tight range amid uncertainty over Fed policy outcome. The US Dollar Index (DXY), which tracks the Greenback’s value against six major currencies, hovers above 104.00. 10-year US Treasury yields remain on the backfoot near 4.14%.
Daily digest market movers: Gold price strengthens while US Dollar consolidates
- Gold price gains further above $2,400 ahead of the Fed policy meeting, in which the central bank is expected to leave interest rates unchanged in the range of 5.25%-5.50% for the eighth time in a row. As the CME FedWatch tool shows that the decision to maintain a status quo is widely anticipated, investors will keenly focus on the Fed’s guidance on interest rates.
- In the monetary policy statement and the press conference, Fed Chair Jerome Powell is expected to reiterate that inflation has returned to a path that leads to the bank’s target of 2%. Jerome Powell may also highlight rising risks to the labor market. It would be a tough call for Powell to provide a timeline for rate cuts as the battle against inflation is far from over and the United States (US) economy is growing at a robust pace.
- The US labor market strength appears to be moderating due to the long-term maintenance of a restrictive policy framework. The Unemployment Rate in June, at 4.1%, was recorded as the highest in more than two years. Also, JOLTS Job Openings data grew almost steadily in June. Job vacancies in June came in at 8.18 million against expectations of 8.03 million but were lower than the prior release of 8.23 million, suggesting that job demand has moderated.
- According to the CME FedWatch tool, 30-day Federal Funds Futures pricing data shows that the central bank will reduce interest rates by 25 basis points (bps) from their current levels in the September meeting. The data also shows that there will be two rate cuts instead of one, as policymakers projected in the latest Fed dot plot.
- Before the Fed policy announcement, investors will focus on the ADP Employment Change data for July, which will be published at 12:15 GMT. The report is estimated to show that private payrolls rose steadily by 150K.
- The entire week is expected to remain volatile for the FX domain as two more crucial US data are lined up for release this week. These are the ISM Manufacturing Purchasing Managers’ Index (PMI) and the Nonfarm Payrolls (NFP) for July, which will be published on Thursday and Friday, respectively.
Technical Analysis: Gold price jumps above $2,400
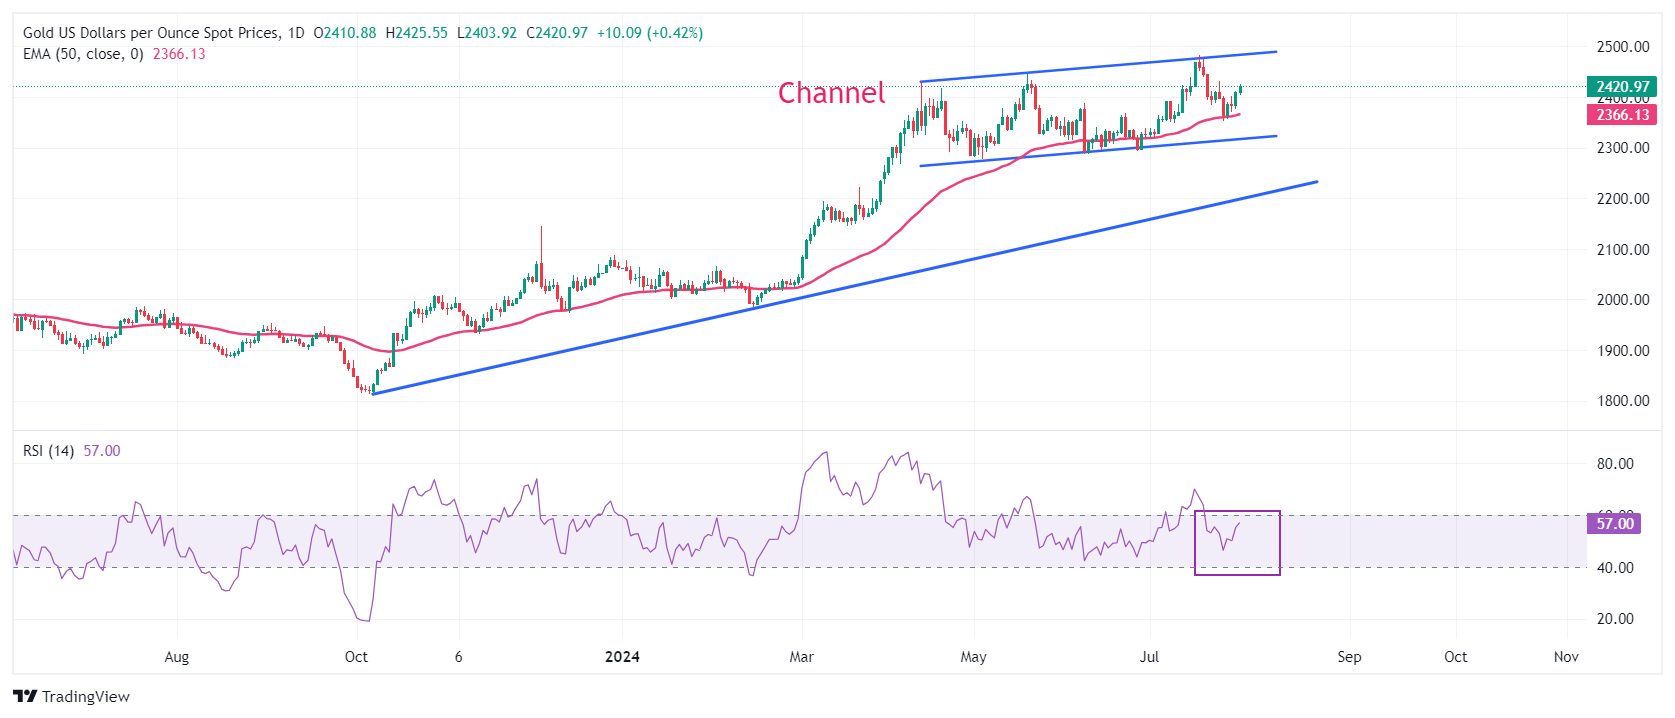
Gold price trades in a channel formation on a daily timeframe, which is slightly rising but has been broadly exhibiting a sideways performance for more than three months. The 50-day Exponential Moving Average (EMA) near $2,366 continues to provide support to the Gold price bulls.
The 14-day Exponential Moving Average (EMA) oscillates in the 40.00-60.00 range, suggesting indecisiveness among market participants.
Fresh upside would appear if the Gold price breaks above its all-time high of $2,483.75, which will send it into unchartered territory.
On the downside, the Gold price will find support near the upward-sloping trendline around $2,225, plotted from October 6 low near $1,810.50.
Gold FAQs
Gold has played a key role in human’s history as it has been widely used as a store of value and medium of exchange. Currently, apart from its shine and usage for jewelry, the precious metal is widely seen as a safe-haven asset, meaning that it is considered a good investment during turbulent times. Gold is also widely seen as a hedge against inflation and against depreciating currencies as it doesn’t rely on any specific issuer or government.
Central banks are the biggest Gold holders. In their aim to support their currencies in turbulent times, central banks tend to diversify their reserves and buy Gold to improve the perceived strength of the economy and the currency. High Gold reserves can be a source of trust for a country’s solvency. Central banks added 1,136 tonnes of Gold worth around $70 billion to their reserves in 2022, according to data from the World Gold Council. This is the highest yearly purchase since records began. Central banks from emerging economies such as China, India and Turkey are quickly increasing their Gold reserves.
Gold has an inverse correlation with the US Dollar and US Treasuries, which are both major reserve and safe-haven assets. When the Dollar depreciates, Gold tends to rise, enabling investors and central banks to diversify their assets in turbulent times. Gold is also inversely correlated with risk assets. A rally in the stock market tends to weaken Gold price, while sell-offs in riskier markets tend to favor the precious metal.
The price can move due to a wide range of factors. Geopolitical instability or fears of a deep recession can quickly make Gold price escalate due to its safe-haven status. As a yield-less asset, Gold tends to rise with lower interest rates, while higher cost of money usually weighs down on the yellow metal. Still, most moves depend on how the US Dollar (USD) behaves as the asset is priced in dollars (XAU/USD). A strong Dollar tends to keep the price of Gold controlled, whereas a weaker Dollar is likely to push Gold prices up.
- USD/CHF loses traction around 0.8820 in Wednesday’s early European session.
- Markets expect the Fed to keep the benchmark rates at 5.25%- 5.50% on Wednesday.
- The uncertainty and ongoing Middle East geopolitical tensions might lift the Swiss Franc, creating a headwind for USD/CHF.
The USD/CHF pair edges lower to near 0.8820 amid the decline of US Dollar (USD) during the early European session on Wednesday. The safe-haven flows and Federal Reserve (Fed) rate cuts expectation in September are like to drag the pair lower. Investors await Fed interest rate decision on Wednesday for fresh catalysts.
The Fed's benchmark rate is anticipated to hold interest rates steady at a 23-year high of 5.25% to 5.5% at its upcoming meeting on Wednesday. ‘’Market focus is on the upcoming Fed policy meeting on Wednesday, July 31, 2024. No changes are expected, but the view of a potential rate cut in September increases the probability of dollar weakness,'' said Jateen Trivedi, VP Research Analyst, Commodity and Currency, LKP Securities.
The Fed Chair Jerome Powell’s remarks from the press conference might offer some hints about rate cut bets in September. Dovish comments from Powell might continue to undermine the Greenback broadly.
On the other hand, the Swiss Franc (CHF) might benefit from the safe-haven flows amid economic uncertainty and further Middle East geopolitical tensions. The Washington Post reported that Israel carried out an airstrike on a densely populated neighborhood on the outskirts of the Lebanese capital on Tuesday, claiming that it killed a top Hezbollah commander responsible for the deaths of 12 children over the weekend in the Israeli-occupied Golan Heights.
Swiss Franc FAQs
The Swiss Franc (CHF) is Switzerland’s official currency. It is among the top ten most traded currencies globally, reaching volumes that well exceed the size of the Swiss economy. Its value is determined by the broad market sentiment, the country’s economic health or action taken by the Swiss National Bank (SNB), among other factors. Between 2011 and 2015, the Swiss Franc was pegged to the Euro (EUR). The peg was abruptly removed, resulting in a more than 20% increase in the Franc’s value, causing a turmoil in markets. Even though the peg isn’t in force anymore, CHF fortunes tend to be highly correlated with the Euro ones due to the high dependency of the Swiss economy on the neighboring Eurozone.
The Swiss Franc (CHF) is considered a safe-haven asset, or a currency that investors tend to buy in times of market stress. This is due to the perceived status of Switzerland in the world: a stable economy, a strong export sector, big central bank reserves or a longstanding political stance towards neutrality in global conflicts make the country’s currency a good choice for investors fleeing from risks. Turbulent times are likely to strengthen CHF value against other currencies that are seen as more risky to invest in.
The Swiss National Bank (SNB) meets four times a year – once every quarter, less than other major central banks – to decide on monetary policy. The bank aims for an annual inflation rate of less than 2%. When inflation is above target or forecasted to be above target in the foreseeable future, the bank will attempt to tame price growth by raising its policy rate. Higher interest rates are generally positive for the Swiss Franc (CHF) as they lead to higher yields, making the country a more attractive place for investors. On the contrary, lower interest rates tend to weaken CHF.
Macroeconomic data releases in Switzerland are key to assessing the state of the economy and can impact the Swiss Franc’s (CHF) valuation. The Swiss economy is broadly stable, but any sudden change in economic growth, inflation, current account or the central bank’s currency reserves have the potential to trigger moves in CHF. Generally, high economic growth, low unemployment and high confidence are good for CHF. Conversely, if economic data points to weakening momentum, CHF is likely to depreciate.
As a small and open economy, Switzerland is heavily dependent on the health of the neighboring Eurozone economies. The broader European Union is Switzerland’s main economic partner and a key political ally, so macroeconomic and monetary policy stability in the Eurozone is essential for Switzerland and, thus, for the Swiss Franc (CHF). With such dependency, some models suggest that the correlation between the fortunes of the Euro (EUR) and the CHF is more than 90%, or close to perfect.
Speaking at the post-policy meeting press conference on Wednesday, Bank of Japan (BoJ) Governor Kazuo Ueda said that the Bank “judged appropriate to adjust the degree of easing from the perspective of sustainable, stable achievement of 2% inflation.”
The BoJ raised the benchmark interest rate by 15 bps to 0.15%-0.25% after holding rates for two consecutive meetings.
Additional quotes
Japan's economy is recovering moderately.
Must pay due attention to financial, FX markets, impact on Japan's economy, prices.
Upside risks to prices require attention.
Long-term yields should be formed in financial markets in principle.
Appropriate to taper JGB buying in predictable manner while ensuring market stability by allowing flexibility.
Will respond nimbly if there's sharp rise in long-term yields by increasing purchases, conducting fixed-rate operations.
Will keep raising rates, adjust degree of easing if current economic, price outlook will be realized.
Views received at bond market group meeting reflected in our tapering plans.
Private consumption remains solid despite inflation impacts seen.
Confirmed that wage hikes becoming widespread.
Rising wages, income will continue to support private consumption.
Some market participants at July meeting expressed concerns about outlook.
Momentum for wage growth is spreading at small and medium companies.
Import prices starting to pick up gain, attention needs to be paid.
Prices are getting to be more affected by foreign exchange swings compared to the past.
Although not especially strong, private consumption is deemed solid.
Judged spring pay negotiations' result firmly reflected, looking at april-may wages data.
Don't believe this rate hike will have significant negative impact on economy.
Will closely share basic view on economy, prices with govt.
Don't have 0.5% policy rate in mind.
In our estimate, size of BoJ balance sheet will be 7-8% smaller in about two years but still bigger than desirable levels in long-term.
Will check impact of rate hikes up until this point when considering additional rate hike.
Don't believe economy, prices will slow down due to additional rate hike.
There are positive aspects of raising rates now to avoid sudden hikes in future.
No change to our view that neutral rate of interest has large uncertainties.
But as of now Japan's rates are far below the uncertain levels of neutral rate.
We have just shifted our stance to use short-term rates as main policy tool as we no longer need massive easing.
Market reaction
USD/JPY is little changed following these comments. The pair was last seen trading flat on the day at 152.75.
Bank of Japan FAQs
The Bank of Japan (BoJ) is the Japanese central bank, which sets monetary policy in the country. Its mandate is to issue banknotes and carry out currency and monetary control to ensure price stability, which means an inflation target of around 2%.
The Bank of Japan has embarked in an ultra-loose monetary policy since 2013 in order to stimulate the economy and fuel inflation amid a low-inflationary environment. The bank’s policy is based on Quantitative and Qualitative Easing (QQE), or printing notes to buy assets such as government or corporate bonds to provide liquidity. In 2016, the bank doubled down on its strategy and further loosened policy by first introducing negative interest rates and then directly controlling the yield of its 10-year government bonds.
The Bank’s massive stimulus has caused the Yen to depreciate against its main currency peers. This process has exacerbated more recently due to an increasing policy divergence between the Bank of Japan and other main central banks, which have opted to increase interest rates sharply to fight decades-high levels of inflation. The BoJ’s policy of holding down rates has led to a widening differential with other currencies, dragging down the value of the Yen.
A weaker Yen and the spike in global energy prices have led to an increase in Japanese inflation, which has exceeded the BoJ’s 2% target. With wage inflation becoming a cause of concern, the BoJ looks to move away from ultra loose policy, while trying to avoid slowing the activity too much.
FX option expiries for July 31 NY cut at 10:00 Eastern Time, via DTCC, can be found below.
EUR/USD: EUR amounts
- 1.0700 514m
- 1.0730 1.2b
- 1.0750 925m
- 1.0800 685m
- 1.0900 874m
- 1.0920 487m
USD/JPY: USD amounts
- 152.25 675m
- 152.50 1b
- 152.60 650m
- 154.50 570m
- 155.00 2.4b
- 155.25 803m
USD/CHF: USD amounts
- 0.8800 525m
AUD/USD: AUD amounts
- 0.6550 702m
- 0.6630 957m
- 0.6650 641m
USD/CAD: USD amounts
- 1.3625 620m
- 1.3630 720m
- 1.3850 650m
NZD/USD: NZD amounts
- 0.6070 594m
EUR/GBP: EUR amounts
- 0.8420 779m
- GBP/USD could test the upper boundary at the 1.2850 level, followed by the nine-day EMA at the 1.2869 level.
- The technical analysis suggests a consolidation phase or a potential reversal for the pair.
- A break below the descending channel could lead the pair navigating the region to the throwback support level of 1.2615.
GBP/USD retraces its recent losses, trading around 1.2840 during the Asian hours on Wednesday. The analysis of the daily chart indicates that the pair is positioned in the narrow section of a descending channel, suggesting a consolidation phase or a potential reversal.
The Moving Average Convergence Divergence (MACD), a momentum indicator, shows a weakening of bullish momentum as the MACD line is below the signal line but above the centreline. Additionally, the 14-day Relative Strength Index (RSI) sits slightly below the 50 level, suggesting a bearish bias.
Regarding resistance, the immediate barrier appears around the upper boundary at the 1.2850 level, followed by the nine-day Exponential Moving Average (EMA) at the 1.2869 level. A breakout above this level could lead the GBP/USD pair to explore the area around the yearly peak of 1.3044 level reached on July 17.
On the downside, immediate support seems to be around the lower edge of the descending channel at the 1.2525 level. A break below this level could exert downward pressure on the GBP/USD pair to navigate the region around the throwback support level of 1.2615.
GBP/USD: Daily Chart
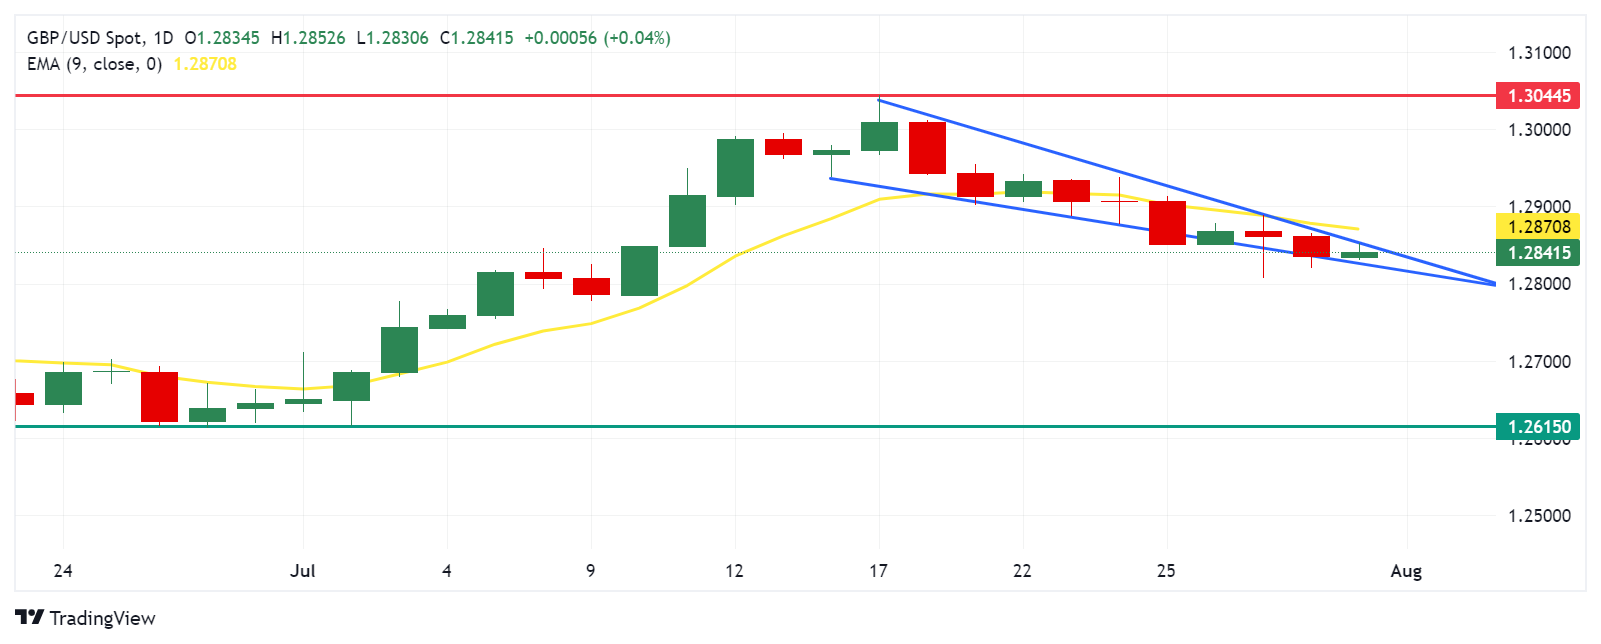
British Pound PRICE Today
The table below shows the percentage change of British Pound (GBP) against listed major currencies today. British Pound was the strongest against the Australian Dollar.
| USD | EUR | GBP | JPY | CAD | AUD | NZD | CHF | |
|---|---|---|---|---|---|---|---|---|
| USD | -0.09% | -0.07% | 0.12% | -0.05% | 0.72% | 0.00% | -0.04% | |
| EUR | 0.09% | 0.04% | 0.23% | 0.03% | 0.80% | 0.11% | 0.07% | |
| GBP | 0.07% | -0.04% | 0.18% | -0.01% | 0.75% | 0.07% | 0.02% | |
| JPY | -0.12% | -0.23% | -0.18% | -0.12% | 0.59% | -0.13% | -0.13% | |
| CAD | 0.05% | -0.03% | 0.00% | 0.12% | 0.74% | 0.05% | 0.00% | |
| AUD | -0.72% | -0.80% | -0.75% | -0.59% | -0.74% | -0.70% | -0.75% | |
| NZD | 0.00% | -0.11% | -0.07% | 0.13% | -0.05% | 0.70% | -0.05% | |
| CHF | 0.04% | -0.07% | -0.02% | 0.13% | -0.00% | 0.75% | 0.05% |
The heat map shows percentage changes of major currencies against each other. The base currency is picked from the left column, while the quote currency is picked from the top row. For example, if you pick the British Pound from the left column and move along the horizontal line to the US Dollar, the percentage change displayed in the box will represent GBP (base)/USD (quote).
Gold prices rose in India on Wednesday, according to data compiled by FXStreet.
The price for Gold stood at 6,516.25 Indian Rupees (INR) per gram, up compared with the INR 6,490.43 it cost on Tuesday.
The price for Gold increased to INR 76,004.53 per tola from INR 75,703.09 per tola a day earlier.
| Unit measure | Gold Price in INR |
|---|---|
| 1 Gram | 6,516.25 |
| 10 Grams | 65,162.73 |
| Tola | 76,004.53 |
| Troy Ounce | 202,678.00 |
FXStreet calculates Gold prices in India by adapting international prices (USD/INR) to the local currency and measurement units. Prices are updated daily based on the market rates taken at the time of publication. Prices are just for reference and local rates could diverge slightly.
Gold FAQs
Gold has played a key role in human’s history as it has been widely used as a store of value and medium of exchange. Currently, apart from its shine and usage for jewelry, the precious metal is widely seen as a safe-haven asset, meaning that it is considered a good investment during turbulent times. Gold is also widely seen as a hedge against inflation and against depreciating currencies as it doesn’t rely on any specific issuer or government.
Central banks are the biggest Gold holders. In their aim to support their currencies in turbulent times, central banks tend to diversify their reserves and buy Gold to improve the perceived strength of the economy and the currency. High Gold reserves can be a source of trust for a country’s solvency. Central banks added 1,136 tonnes of Gold worth around $70 billion to their reserves in 2022, according to data from the World Gold Council. This is the highest yearly purchase since records began. Central banks from emerging economies such as China, India and Turkey are quickly increasing their Gold reserves.
Gold has an inverse correlation with the US Dollar and US Treasuries, which are both major reserve and safe-haven assets. When the Dollar depreciates, Gold tends to rise, enabling investors and central banks to diversify their assets in turbulent times. Gold is also inversely correlated with risk assets. A rally in the stock market tends to weaken Gold price, while sell-offs in riskier markets tend to favor the precious metal.
The price can move due to a wide range of factors. Geopolitical instability or fears of a deep recession can quickly make Gold price escalate due to its safe-haven status. As a yield-less asset, Gold tends to rise with lower interest rates, while higher cost of money usually weighs down on the yellow metal. Still, most moves depend on how the US Dollar (USD) behaves as the asset is priced in dollars (XAU/USD). A strong Dollar tends to keep the price of Gold controlled, whereas a weaker Dollar is likely to push Gold prices up.
(An automation tool was used in creating this post.)
- GBP/JPY trims its daily losses after the interest rate decision by the BoJ.
- BoJ raised the short-term rate target by 15 basis points to the range of 0.15%-0.25%, from 0%-0.1%.
- The Pound Sterling could struggle due to a potential BoE rate cut on Thursday.
GBP/JPY pares its intraday losses after the release of the Bank of Japan’s (BoJ) interest rate decision on Wednesday. The GBP/JPY cross trades around 196.20 during the Asian hours, with the Japanese Yen (JPY) loses ground despite the BoJ board members deciding to raise the short-term rate target by 15 basis points (bps) from the range of 0%-0.1% to 0.15%-0.25%.
Additionally, the BoJ decided to taper Japanese government bonds (JGB) buying to ¥3 trillion ($19.07 billion) per month from ¥6 trillion as of the first quarter of 2026. BoJ Press Conference will be eyed to gain more impetus on the Japanese policy trajectory.
Japan’s Chief Cabinet Secretary Yoshimasa Hayashi stated on Tuesday that the Bank of Japan and the government will closely coordinate. Hayashi emphasized that the BoJ will work closely with the government to implement appropriate monetary policies aimed at achieving the inflation target.
On the GBP front, traders continue to price in a potential rate cut by the Bank of England (BoE) on Thursday, which puts downward pressure on the Pound Sterling (GBP) and limits the upside of the GBP/JPY cross. Reuters reported nearly 58% odds that the BoE will lower its borrowing costs by 25 basis points (bps) to 5.0%.
Additionally, the US Federal Reserve (Fed) is expected to keep rates unchanged in July, with the decision due on Wednesday. However, there is growing anticipation of a rate cut in September, which is putting pressure on the USD and providing support for other riskier currencies like the British Pound.
Interest rates FAQs
Interest rates are charged by financial institutions on loans to borrowers and are paid as interest to savers and depositors. They are influenced by base lending rates, which are set by central banks in response to changes in the economy. Central banks normally have a mandate to ensure price stability, which in most cases means targeting a core inflation rate of around 2%. If inflation falls below target the central bank may cut base lending rates, with a view to stimulating lending and boosting the economy. If inflation rises substantially above 2% it normally results in the central bank raising base lending rates in an attempt to lower inflation.
Higher interest rates generally help strengthen a country’s currency as they make it a more attractive place for global investors to park their money.
Higher interest rates overall weigh on the price of Gold because they increase the opportunity cost of holding Gold instead of investing in an interest-bearing asset or placing cash in the bank. If interest rates are high that usually pushes up the price of the US Dollar (USD), and since Gold is priced in Dollars, this has the effect of lowering the price of Gold.
The Fed funds rate is the overnight rate at which US banks lend to each other. It is the oft-quoted headline rate set by the Federal Reserve at its FOMC meetings. It is set as a range, for example 4.75%-5.00%, though the upper limit (in that case 5.00%) is the quoted figure. Market expectations for future Fed funds rate are tracked by the CME FedWatch tool, which shapes how many financial markets behave in anticipation of future Federal Reserve monetary policy decisions.
- Silver attracts some follow-through buying for the second straight day on Wednesday.
- The mixed technical indicators on hourly/daily charts warrant some caution for bulls.
- A break below the $28.00 mark is needed to negate any near-term positive outlook.
Silver (XAG/USD) scales higher for the second straight day on Wednesday and climbs to a multi-day peak during the Asian session on Wednesday. The white metal is currently trading around the $28.60 region, with bulls now looking to build on the momentum beyond the 100-day Simple Moving Average (SMA) support breakpoint-turned-resistance.
An intraday move beyond the 23.6% Fibonacci retracement level of the recent corrective decline from the $31.75 region, or the July monthly swing high, could be seen as a trigger for bullish traders. Moreover, oscillators on the 4-hour chart have been gaining positive traction and support prospects for a further intraday appreciating move. That said, technical indicators on the daily chart – though have recovered from lower levels – are still far away from confirming a positive outlook.
Hence, any subsequent move up is more likely to confront stiff resistance and remain capped near the $29.00 round-figure mark, which coincides with the 38.2% Fibo. level and should act as a key pivotal point. A sustained strength beyond, meanwhile, will suggest that the recent downfall witnessed over the past two weeks or so has run its course and lift the XAG/USD towards the next relevant hurdle near the $29.45-$29.50 supply zone, or last week's swing high and the 50% Fibo. level.
Some follow-through buying should pave the way for a move back towards reclaiming the $30.00 psychological mark, or the 61.8% Fibo. level. The momentum could extend further towards the 78.6% Fibo. level, around the $30.75-$30.80 region, before the XAG/USD eventually aims to retake the $31.00 round figure and test the monthly swing high, around the $31.75 zone.
On the flip side, the $28.30-$28.25 region, or the 23.6% Fibo. level now seems to protect the immediate downside ahead of the $28.00 mark. A convincing break below the latter will expose the $27.40-$27.30 zone, or the lowest level since May 9 touched on Monday. The next relevant support is pegged near the $27.00 mark, below which the XAG/USD could accelerate the fall to the $26.60-$26.55 support en route to the 200-day SMA, just below the $26.00 mark.
Silver 4-hour chart
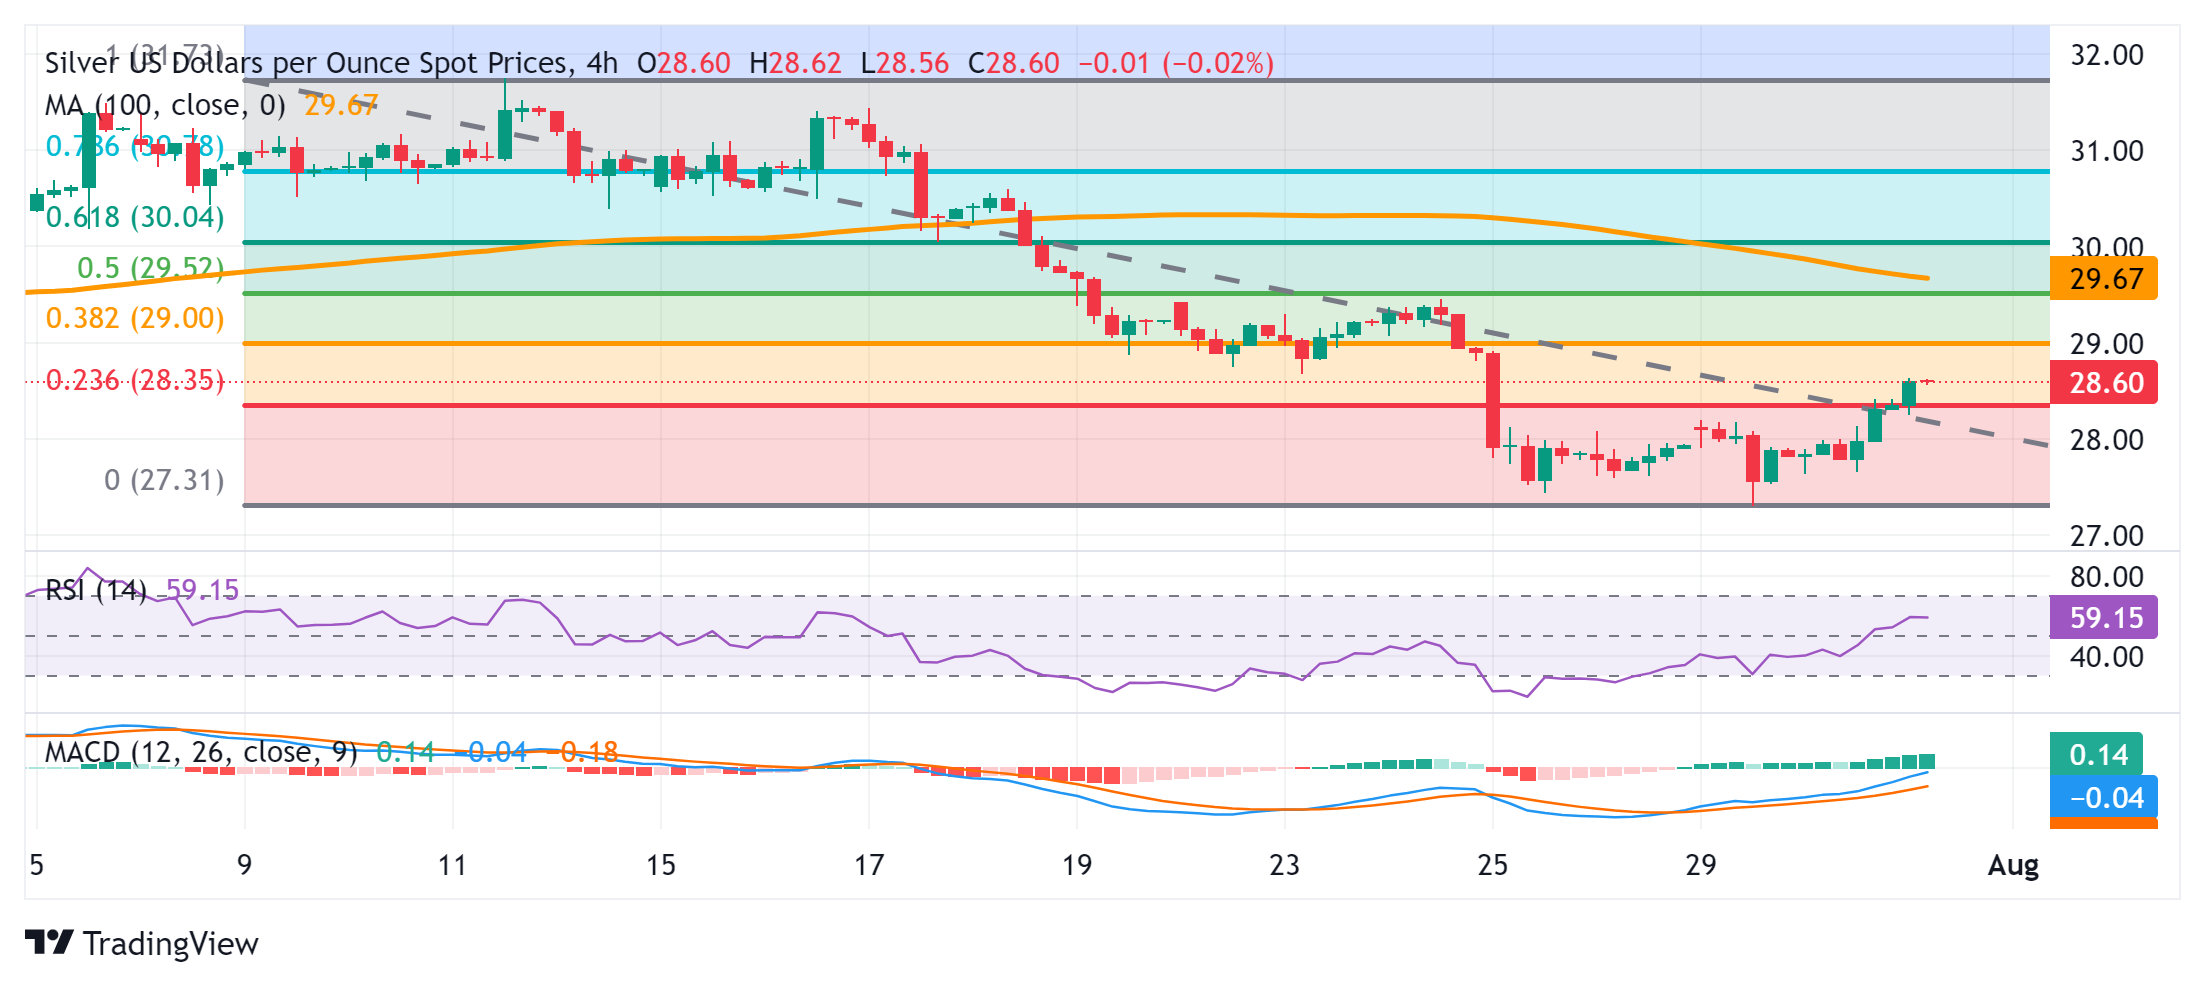
Silver FAQs
Silver is a precious metal highly traded among investors. It has been historically used as a store of value and a medium of exchange. Although less popular than Gold, traders may turn to Silver to diversify their investment portfolio, for its intrinsic value or as a potential hedge during high-inflation periods. Investors can buy physical Silver, in coins or in bars, or trade it through vehicles such as Exchange Traded Funds, which track its price on international markets.
Silver prices can move due to a wide range of factors. Geopolitical instability or fears of a deep recession can make Silver price escalate due to its safe-haven status, although to a lesser extent than Gold's. As a yieldless asset, Silver tends to rise with lower interest rates. Its moves also depend on how the US Dollar (USD) behaves as the asset is priced in dollars (XAG/USD). A strong Dollar tends to keep the price of Silver at bay, whereas a weaker Dollar is likely to propel prices up. Other factors such as investment demand, mining supply – Silver is much more abundant than Gold – and recycling rates can also affect prices.
Silver is widely used in industry, particularly in sectors such as electronics or solar energy, as it has one of the highest electric conductivity of all metals – more than Copper and Gold. A surge in demand can increase prices, while a decline tends to lower them. Dynamics in the US, Chinese and Indian economies can also contribute to price swings: for the US and particularly China, their big industrial sectors use Silver in various processes; in India, consumers’ demand for the precious metal for jewellery also plays a key role in setting prices.
Silver prices tend to follow Gold's moves. When Gold prices rise, Silver typically follows suit, as their status as safe-haven assets is similar. The Gold/Silver ratio, which shows the number of ounces of Silver needed to equal the value of one ounce of Gold, may help to determine the relative valuation between both metals. Some investors may consider a high ratio as an indicator that Silver is undervalued, or Gold is overvalued. On the contrary, a low ratio might suggest that Gold is undervalued relative to Silver.
- EUR/USD holds positive ground near 1.0825 in Wednesday’s Asian session.
- The negative stance of the pair remains intact below the 100-period EMA and bearish RSI indicator.
- The first upside target to watch is 1.0845; the key support level is seen in the 1.0795-1.0805 zone.
The EUR/USD pair trades on a stronger note around 1.0825, snapping the two-day losing streak during the Asian session on Wednesday. However, the upside of the major pair might be capped amid the uncertainty surrounding further rate cuts in September by the European Central Bank (ECB) after disappointing economic growth data from Germany. Later on Wednesday, the Federal Reserve’s (Fed) interest rate decision will be in the spotlight.
Technically, the bearish outlook for EUR/USD remains in play as the major pair holds below the key 100-period Exponential Moving Average (EMA) on the 4-hour chart. The downward momentum is supported by the Relative Strength Index (RSI), which stands below the midline around 43.90. This suggests that the path of least resistance is to the downside.
The potential upside target will emerge at 1.0845, the 100-period EMA. Any follow-through buying above this level, the pair would resume its upside. The next hurdle is located at 1.0870, portraying the confluence of the upper boundary of the Bollinger Band and a high of July 29. Further north, the additional upside filter to watch is the 1.0900 psychological mark.
On the other hand, the crucial support level is seen at the 1.0795-1.0805 region, representing the lower limit of the Bollinger Band, a round figure, and a low of July 30. A breach of the mentioned level will see a drop to 1.0776, a high of July 1. The next contention level is located at 1.0709, a low of July 2.
EUR/USD 4-hour chart
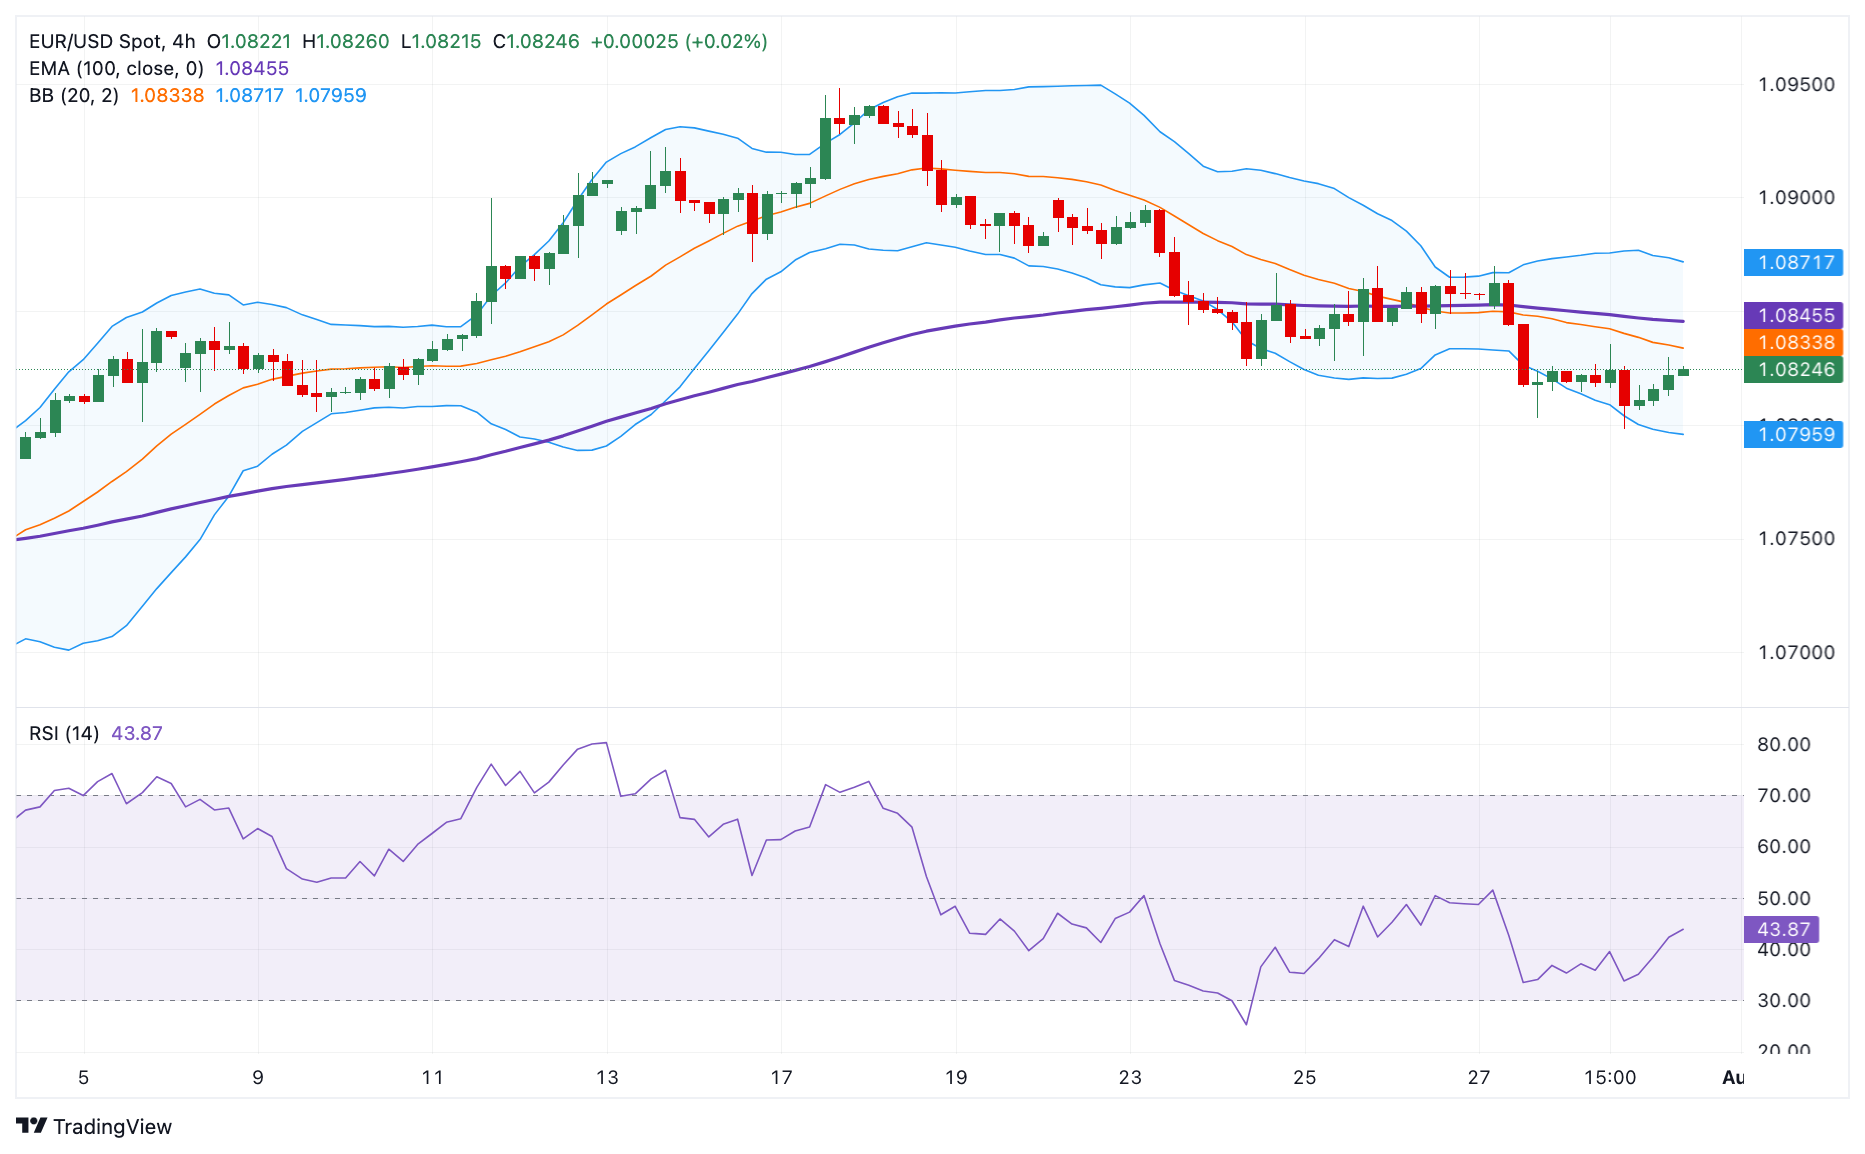
Euro FAQs
The Euro is the currency for the 20 European Union countries that belong to the Eurozone. It is the second most heavily traded currency in the world behind the US Dollar. In 2022, it accounted for 31% of all foreign exchange transactions, with an average daily turnover of over $2.2 trillion a day. EUR/USD is the most heavily traded currency pair in the world, accounting for an estimated 30% off all transactions, followed by EUR/JPY (4%), EUR/GBP (3%) and EUR/AUD (2%).
The European Central Bank (ECB) in Frankfurt, Germany, is the reserve bank for the Eurozone. The ECB sets interest rates and manages monetary policy. The ECB’s primary mandate is to maintain price stability, which means either controlling inflation or stimulating growth. Its primary tool is the raising or lowering of interest rates. Relatively high interest rates – or the expectation of higher rates – will usually benefit the Euro and vice versa. The ECB Governing Council makes monetary policy decisions at meetings held eight times a year. Decisions are made by heads of the Eurozone national banks and six permanent members, including the President of the ECB, Christine Lagarde.
Eurozone inflation data, measured by the Harmonized Index of Consumer Prices (HICP), is an important econometric for the Euro. If inflation rises more than expected, especially if above the ECB’s 2% target, it obliges the ECB to raise interest rates to bring it back under control. Relatively high interest rates compared to its counterparts will usually benefit the Euro, as it makes the region more attractive as a place for global investors to park their money.
Data releases gauge the health of the economy and can impact on the Euro. Indicators such as GDP, Manufacturing and Services PMIs, employment, and consumer sentiment surveys can all influence the direction of the single currency. A strong economy is good for the Euro. Not only does it attract more foreign investment but it may encourage the ECB to put up interest rates, which will directly strengthen the Euro. Otherwise, if economic data is weak, the Euro is likely to fall. Economic data for the four largest economies in the euro area (Germany, France, Italy and Spain) are especially significant, as they account for 75% of the Eurozone’s economy.
Another significant data release for the Euro is the Trade Balance. This indicator measures the difference between what a country earns from its exports and what it spends on imports over a given period. If a country produces highly sought after exports then its currency will gain in value purely from the extra demand created from foreign buyers seeking to purchase these goods. Therefore, a positive net Trade Balance strengthens a currency and vice versa for a negative balance.
- EUR/JPY gains ground around 165.75 in Wednesday’s Asian session, up 0.33% on the day.
- The BoJ surprised the markets by raising interest rates by 15 bps and trimming bond buying.
- German GDP numbers and inflation data add to the ECB's challenges with cutting interest rates.
The EUR/JPY cross trades on a stronger note near 165.75 during the Asian session on Wednesday. The Japanese Yen (JPY) edges lower after the Bank of Japan (BoJ) decided to raise the interest rate at its July meeting on Wednesday.
Following the two-day monetary policy review meeting on Wednesday, the BoJ surprised the markets by raising its short-term rate target by 15 basis points (bps) from the range of 0%-0.1% to 0.15%-0.25%. Additionally, the Japanese central bank decided to taper Japanese government bonds (JGB) buying to 3 trillion per month as of the first quarter of 2026. The Japanese Yen (JPY) loses ground despite the BoJ hiking its short-term rate.
Disappointing economic growth and a surprising acceleration in German inflation add to the European Central Bank’s uncertainty about further interest-rate cuts in September. The German Harmonized Index of Consumer Prices (HICP) rose 2.6% YoY in July, compared to 2.5% in June, above the consensus of 2.4%. This figure triggered the prospect that Germany’s prolonged stagflation will continue in the coming quarters.
Meanwhile, the German economy shrank by 0.1% QoQ after growing 0.2% in Q1, the first estimate data published by Destatis showed on Tuesday. This figure came in weaker than the expected 0.1% increase. The Eurozone economy expanded by 0.3% in the three months to the end of June, above the market consensus of a 0.2% increase on a quarterly basis. Traders will take more cues from the preliminary Eurozone CPI data and Germany’s Retail Sales, which are due later on Wednesday.
Bank of Japan FAQs
The Bank of Japan (BoJ) is the Japanese central bank, which sets monetary policy in the country. Its mandate is to issue banknotes and carry out currency and monetary control to ensure price stability, which means an inflation target of around 2%.
The Bank of Japan has embarked in an ultra-loose monetary policy since 2013 in order to stimulate the economy and fuel inflation amid a low-inflationary environment. The bank’s policy is based on Quantitative and Qualitative Easing (QQE), or printing notes to buy assets such as government or corporate bonds to provide liquidity. In 2016, the bank doubled down on its strategy and further loosened policy by first introducing negative interest rates and then directly controlling the yield of its 10-year government bonds.
The Bank’s massive stimulus has caused the Yen to depreciate against its main currency peers. This process has exacerbated more recently due to an increasing policy divergence between the Bank of Japan and other main central banks, which have opted to increase interest rates sharply to fight decades-high levels of inflation. The BoJ’s policy of holding down rates has led to a widening differential with other currencies, dragging down the value of the Yen.
A weaker Yen and the spike in global energy prices have led to an increase in Japanese inflation, which has exceeded the BoJ’s 2% target. With wage inflation becoming a cause of concern, the BoJ looks to move away from ultra loose policy, while trying to avoid slowing the activity too much.
- A combination of factors drags AUD/JPY to a multi-month low on Wednesday.
- The mixed Australian macro data and dismal Chinese PMIs weigh on the Aussie.
- The JPY gets a strong boost after the BoJ’s 15 bps rate hike and hawkish outlook.
The AUD/JPY cross plummets to its lowest level since April 19 after the Bank of Japan (BoJ) announced its policy decision on Wednesday, validating the Asian session breakdown through the 200-day Simple Moving Average (SMA). Spot prices, however, managed to rebound over 100 pips in the last hour, albeit lack follow-through and remain below the 100.00 psychological mark.
The Japanese Yen (JPY) strengthens across the board following the BoJ's surprise 15 basis points (bps) rate hike at the end of a two-day policy meeting on Wednesday. The Australian Dollar (AUD), on the other hand, is undermined by the mixed domestic data and contributed to the AUD/JPY pair's sharp intraday downfall. In fact, the Australian Bureau of Statistics (ABS) reported that the headline Consumer Price Index (CPI) rose 1.0% in the second quarter of 2024 and the yearly rate accelerated to 3.8%, both matching consensus estimates.
That said, the Reserve Bank of Australia's (RBA) Trimmed Mean CPI came in at 0.8% and 3.9% on a quarterly and annual basis, respectively, missing market expectations. Nevertheless, the readings forced investors to scale back bets for further interest rate hikes by the RBA, which, along with rather unimpressive Chinese macro data, weighed heavily on the Australian Dollar (AUD). Other data published on Wednesday showed that Australia’s Retail Sales increased by 0.5% MoM in June as compared to the 0.6% rise in May and 0.2% expected.
Meanwhile, China’s official Manufacturing PMI remained in contraction territory for the third straight month and edged a tad lower from 49.5 to 49.4 in July. Furthermore, the National Bureau of Statistics (NBS) Non-Manufacturing PMI declined from 50.5 in June to 50.2, as expected. The data does little to ease concerns about a slowdown in the world's second-largest economy or provide any impetus to the China-proxy Aussie. That said, the emergence of some selling around the Japanese Yen (JPY) helps limit any further downside for the AUD/JPY cross.
The BoJ's hawkish outlook, however, favors the JPY bulls and suggests that the path of least resistance for spot prices remains to the downside. In its monetary policy statement, the Japanese central bank noted that the underlying inflation is expected to increase gradually and that the economy is recovering moderately. The BoJ added that if the outlook for economic activity and prices is realised, it will continue to raise policy rates and adjust the degree of monetary accommodation accordingly. This warrants caution before confirming a bottom for the AUD/JPY cross.
Bank of Japan FAQs
The Bank of Japan (BoJ) is the Japanese central bank, which sets monetary policy in the country. Its mandate is to issue banknotes and carry out currency and monetary control to ensure price stability, which means an inflation target of around 2%.
The Bank of Japan has embarked in an ultra-loose monetary policy since 2013 in order to stimulate the economy and fuel inflation amid a low-inflationary environment. The bank’s policy is based on Quantitative and Qualitative Easing (QQE), or printing notes to buy assets such as government or corporate bonds to provide liquidity. In 2016, the bank doubled down on its strategy and further loosened policy by first introducing negative interest rates and then directly controlling the yield of its 10-year government bonds.
The Bank’s massive stimulus has caused the Yen to depreciate against its main currency peers. This process has exacerbated more recently due to an increasing policy divergence between the Bank of Japan and other main central banks, which have opted to increase interest rates sharply to fight decades-high levels of inflation. The BoJ’s policy of holding down rates has led to a widening differential with other currencies, dragging down the value of the Yen.
A weaker Yen and the spike in global energy prices have led to an increase in Japanese inflation, which has exceeded the BoJ’s 2% target. With wage inflation becoming a cause of concern, the BoJ looks to move away from ultra loose policy, while trying to avoid slowing the activity too much.
- USD/CAD loses further as higher Oil prices support the commodity-linked Canadian Dollar.
- WTI rebounded from an eight-week low of $74.24 due to rising geopolitical tensions in the Middle East.
- The Fed is expected to keep rates unchanged at its July meeting.
USD/CAD extends its losses after retreating from an eight-month high of 1.3865 on Monday, trading around 1.3840 during the Asian session on Wednesday. The recovery in crude Oil prices is supporting the commodity-linked Canadian Dollar (CAD) against the US Dollar (USD), as Canada is the largest crude exporter to the United States.
West Texas Intermediate (WTI) crude Oil price trades around $75.40 per barrel by the press time. WTI rebounded from an eight-week low of $74.24 recorded on Tuesday, attributed to rising geopolitical tensions in the Middle East.
The Israeli government claims it killed Hezbollah's most senior commander in an airstrike on Beirut on Tuesday, in retaliation for Saturday's cross-border rocket attack on Israel. This escalation occurred despite diplomatic efforts by US and UN officials to prevent a major conflict that could inflame the wider Middle East, according to Reuters.
Scotiabank’s Chief FX Strategist, Shaun Osborne, noted that the CAD is contending with a significant wave of negative sentiment. “The latest CFTC data showed a substantial buildup of bearish CAD positioning. While positioning appears excessive, the weak sentiment is largely a reflection of the Bank of Canada’s easing bias.”
Read the full article: Bears can break below 1.3835 in short term – Scotiabank
On data front, Canadian Gross Domestic Product (MoM) data for May is scheduled to be released on Wednesday. On the USD front, the Federal Reserve is expected to keep rates unchanged in the upcoming meeting later in the North American session.
However, there is growing anticipation of a rate cut in September, putting downward pressure on the US Dollar. Additionally, signs of cooling inflation and easing labor market conditions in the United States are further fueling expectations of multiple rate cuts by the Fed this year, potentially totaling three cuts. CME FedWatch Tool indicates a 100% probability of at least a quarter percentage point cut in September.
Canadian Dollar FAQs
The key factors driving the Canadian Dollar (CAD) are the level of interest rates set by the Bank of Canada (BoC), the price of Oil, Canada’s largest export, the health of its economy, inflation and the Trade Balance, which is the difference between the value of Canada’s exports versus its imports. Other factors include market sentiment – whether investors are taking on more risky assets (risk-on) or seeking safe-havens (risk-off) – with risk-on being CAD-positive. As its largest trading partner, the health of the US economy is also a key factor influencing the Canadian Dollar.
The Bank of Canada (BoC) has a significant influence on the Canadian Dollar by setting the level of interest rates that banks can lend to one another. This influences the level of interest rates for everyone. The main goal of the BoC is to maintain inflation at 1-3% by adjusting interest rates up or down. Relatively higher interest rates tend to be positive for the CAD. The Bank of Canada can also use quantitative easing and tightening to influence credit conditions, with the former CAD-negative and the latter CAD-positive.
The price of Oil is a key factor impacting the value of the Canadian Dollar. Petroleum is Canada’s biggest export, so Oil price tends to have an immediate impact on the CAD value. Generally, if Oil price rises CAD also goes up, as aggregate demand for the currency increases. The opposite is the case if the price of Oil falls. Higher Oil prices also tend to result in a greater likelihood of a positive Trade Balance, which is also supportive of the CAD.
While inflation had always traditionally been thought of as a negative factor for a currency since it lowers the value of money, the opposite has actually been the case in modern times with the relaxation of cross-border capital controls. Higher inflation tends to lead central banks to put up interest rates which attracts more capital inflows from global investors seeking a lucrative place to keep their money. This increases demand for the local currency, which in Canada’s case is the Canadian Dollar.
Macroeconomic data releases gauge the health of the economy and can have an impact on the Canadian Dollar. Indicators such as GDP, Manufacturing and Services PMIs, employment, and consumer sentiment surveys can all influence the direction of the CAD. A strong economy is good for the Canadian Dollar. Not only does it attract more foreign investment but it may encourage the Bank of Canada to put up interest rates, leading to a stronger currency. If economic data is weak, however, the CAD is likely to fall.
- WTI gains some positive traction amid rising geopolitical tensions in the Middle East.
- A fall in US crude inventories and some follow-through USD lends additional support.
- China’s economic woes to cap gains ahead of the key FOMC monetary policy decision.
West Texas Intermediate (WTI) US crude Oil prices tick higher during the Asian session on Wednesday and moves away from the lowest level since June 6, around the $74.25 area touched the previous day. The commodity, for now, seems to have snapped a three-day losing streak and currently trades around the $75.25 mark, though any meaningful appreciating move seems elusive.
Israel's retaliation against Iran-backed Lebanese group Hezbollah, in response to the Golan Heights attack on Saturday, raised the risk of a wider conflict in the Middle East. This, in turn, fuels worry about supply disruptions from the key Oil producing region, which, along with data showing strong draws in US Crude inventories for the fifth straight week, lend some support to the black liquid.
The American Petroleum Institute (API) reported on Tuesday that US crude oil inventories fell by 4.495 million barrels for the week ending July 26, indicating tight conditions in the world’s largest fuel consumer. Meanwhile, the US Dollar (USD) extends the overnight pullback from a three-week peak amid dovish Federal Reserve (Fed) expectations and further benefits Crude Oil prices.
Traders, however, seem reluctant and prefer to wait for more cues about the Fed’s policy path before positioning for any further USD depreciating move. Meanwhile, concerns about slowing demand in the world’s top oil importer resurfaced following the release of rather unimpressive official Chinese PMI prints for July. This, in turn, might keep a lid on any further gains for Crude Oil prices.
WTI Oil FAQs
WTI Oil is a type of Crude Oil sold on international markets. The WTI stands for West Texas Intermediate, one of three major types including Brent and Dubai Crude. WTI is also referred to as “light” and “sweet” because of its relatively low gravity and sulfur content respectively. It is considered a high quality Oil that is easily refined. It is sourced in the United States and distributed via the Cushing hub, which is considered “The Pipeline Crossroads of the World”. It is a benchmark for the Oil market and WTI price is frequently quoted in the media.
Like all assets, supply and demand are the key drivers of WTI Oil price. As such, global growth can be a driver of increased demand and vice versa for weak global growth. Political instability, wars, and sanctions can disrupt supply and impact prices. The decisions of OPEC, a group of major Oil-producing countries, is another key driver of price. The value of the US Dollar influences the price of WTI Crude Oil, since Oil is predominantly traded in US Dollars, thus a weaker US Dollar can make Oil more affordable and vice versa.
The weekly Oil inventory reports published by the American Petroleum Institute (API) and the Energy Information Agency (EIA) impact the price of WTI Oil. Changes in inventories reflect fluctuating supply and demand. If the data shows a drop in inventories it can indicate increased demand, pushing up Oil price. Higher inventories can reflect increased supply, pushing down prices. API’s report is published every Tuesday and EIA’s the day after. Their results are usually similar, falling within 1% of each other 75% of the time. The EIA data is considered more reliable, since it is a government agency.
OPEC (Organization of the Petroleum Exporting Countries) is a group of 13 Oil-producing nations who collectively decide production quotas for member countries at twice-yearly meetings. Their decisions often impact WTI Oil prices. When OPEC decides to lower quotas, it can tighten supply, pushing up Oil prices. When OPEC increases production, it has the opposite effect. OPEC+ refers to an expanded group that includes ten extra non-OPEC members, the most notable of which is Russia.
- The Japanese Yen trims intraday gains as traders expect the BoJ to maintain its short-term rate.
- The Bank of Japan may debate over raising rates at its meeting next week and tapering bond purchases.
- The US Dollar faces challenges ahead of the Fed rate decision scheduled for Wednesday.
The Japanese Yen (JPY) trims its daily gains against the US Dollar (USD) as traders anticipate the Bank of Japan’s (BoJ) monetary policy decision on Wednesday. Investors are speculating that the central bank is likely to maintain its short-term rate target between 0% and 0.1% for the third consecutive meeting, following the end of eight years of negative rates in March.
The Bank of Japan is likely to debate whether to raise interest rates at its meeting next week. On Friday, Reuters cited sources familiar with the central bank, noting that "the decision will be a close call and a hard one to make," given the uncertainty over the consumption outlook. Another source mentioned, "It's a judgment call, in terms of whether to act now or later this year."
Additionally, the BoJ is expected to scale back its massive ¥6 trillion ($38.14 billion) monthly Japanese government bonds (JGB) purchase program, as indicated during its June policy meeting.
The US Dollar (USD) faces challenges ahead of the Federal Reserve’s (Fed) upcoming interest rate decision scheduled for Wednesday. While the central bank is expected to keep rates unchanged in July, there is growing anticipation of a rate cut in September. This speculation is putting pressure on the USD.
Daily Digest Market Movers: Japanese Yen trims gains ahead of BoJ decision
- Japan’s Chief Cabinet Secretary Yoshimasa Hayashi stated on Tuesday that the Bank of Japan and the government will closely coordinate, but the specifics of monetary policy remain the BoJ's prerogative. Hayashi emphasized that the BoJ will work closely with the government to implement appropriate monetary policies aimed at achieving the inflation target.
- Japan’s Retail Sales rose by 3.7% year-on-year in June, surpassing the forecasted 3.3% gain and reaching the highest level in four months. Meanwhile, on a monthly basis, Retail Sales increased by 0.6%, a slowdown compared to the previous 1.7% rise.
- Japan's Unemployment Rate was 2.5% in June, slightly lower than market forecasts of 2.6% and the rate observed over the previous four months. This marks the lowest jobless rate since January.
- Atsushi Mimura, Japan’s newly appointed Vice Finance Minister for International Affairs and top foreign exchange official stated in a Bloomberg interview on Monday that “while the recent depreciation of the Yen has both advantages and disadvantages, the demerits are becoming more noticeable.” Mimura mentioned that intervention is among the measures available to counter excessive speculation affecting the currency.
- Japan's top council has urged the government and the Bank of Japan to be mindful of the weak JPY when formulating policy. The council emphasized that the impact of a weak Yen and rising prices on consumption cannot be simply overlooked.
- Reuters has published an extensive article on the Bank of Japan (BoJ) review of past policy, highlighting a significant shift in the central bank's approach to inflation. The key message from the review is that Japan is "ready for higher rates." However, the review will not result in changes to the price goal or policy framework.
- Bank of America indicates that strong economic growth in the United States allows the Federal Open Market Committee (FOMC) to "afford to wait" before making any changes. The bank states that the economy "remains on robust footing" and continues to expect the Fed to start cutting rates in December.
Technical Analysis: USD/JPY moves below 153.00
USD/JPY trades around 152.80 on Wednesday. The daily chart analysis shows that the pair is testing the lower boundary of a descending channel. Additionally, the 14-day Relative Strength Index (RSI) is positioned slightly below 30, suggesting an oversold currency asset situation and a potential short-term rebound.
Immediate support is located near the lower boundary of the descending channel around the 152.60 level. A drop below this level could reinforce the bearish bias and push the USD/JPY pair lower, possibly revisiting May's low of 151.86. Additional support may emerge at the psychological level of 151.00.
On the upside, the pair tests the nine-day Exponential Moving Average (EMA) of 154.47 level, aligned with the "throwback support turned resistance" at the level of 154.50. Further resistance is anticipated near the upper boundary of the descending channel around 155.80.
USD/JPY: Daily Chart
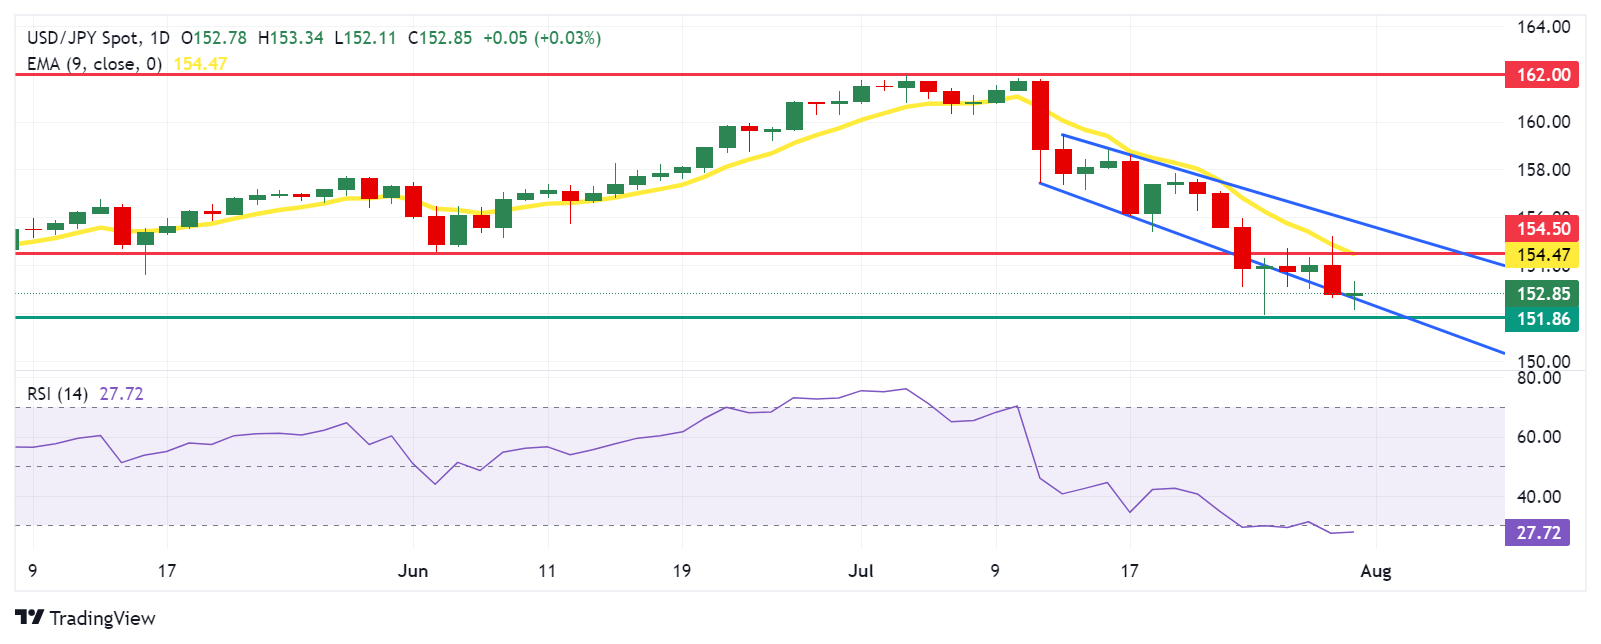
Japanese Yen PRICE Today
The table below shows the percentage change of Japanese Yen (JPY) against listed major currencies today. Japanese Yen was the weakest against the Euro.
| USD | EUR | GBP | JPY | CAD | AUD | NZD | CHF | |
|---|---|---|---|---|---|---|---|---|
| USD | -0.11% | -0.10% | 0.03% | -0.03% | 0.67% | -0.04% | -0.01% | |
| EUR | 0.11% | 0.03% | 0.15% | 0.07% | 0.77% | 0.08% | 0.10% | |
| GBP | 0.10% | -0.03% | 0.08% | 0.04% | 0.72% | 0.05% | 0.08% | |
| JPY | -0.03% | -0.15% | -0.08% | -0.01% | 0.63% | -0.07% | -0.00% | |
| CAD | 0.03% | -0.07% | -0.04% | 0.00% | 0.68% | -0.01% | 0.02% | |
| AUD | -0.67% | -0.77% | -0.72% | -0.63% | -0.68% | -0.69% | -0.67% | |
| NZD | 0.04% | -0.08% | -0.05% | 0.07% | 0.01% | 0.69% | 0.03% | |
| CHF | 0.00% | -0.10% | -0.08% | 0.00% | -0.02% | 0.67% | -0.03% |
The heat map shows percentage changes of major currencies against each other. The base currency is picked from the left column, while the quote currency is picked from the top row. For example, if you pick the Japanese Yen from the left column and move along the horizontal line to the US Dollar, the percentage change displayed in the box will represent JPY (base)/USD (quote).
Interest rates FAQs
Interest rates are charged by financial institutions on loans to borrowers and are paid as interest to savers and depositors. They are influenced by base lending rates, which are set by central banks in response to changes in the economy. Central banks normally have a mandate to ensure price stability, which in most cases means targeting a core inflation rate of around 2%. If inflation falls below target the central bank may cut base lending rates, with a view to stimulating lending and boosting the economy. If inflation rises substantially above 2% it normally results in the central bank raising base lending rates in an attempt to lower inflation.
Higher interest rates generally help strengthen a country’s currency as they make it a more attractive place for global investors to park their money.
Higher interest rates overall weigh on the price of Gold because they increase the opportunity cost of holding Gold instead of investing in an interest-bearing asset or placing cash in the bank. If interest rates are high that usually pushes up the price of the US Dollar (USD), and since Gold is priced in Dollars, this has the effect of lowering the price of Gold.
The Fed funds rate is the overnight rate at which US banks lend to each other. It is the oft-quoted headline rate set by the Federal Reserve at its FOMC meetings. It is set as a range, for example 4.75%-5.00%, though the upper limit (in that case 5.00%) is the quoted figure. Market expectations for future Fed funds rate are tracked by the CME FedWatch tool, which shapes how many financial markets behave in anticipation of future Federal Reserve monetary policy decisions.
- NZD/USD trades on a stronger note around 0.5915 in Wednesday’s Asian session, up 0.17% on the day.
- China's NBS Manufacturing PMI for July came in better than expected; Non-Manufacturing PMI was in line with the consensus.
- US Fed is widely expected to hold rate in the range of 5.25%-5.50% at its July meeting on Wednesday.
The NZD/USD pair extends recovery near 0.5915 Asian trading hours on Wednesday. The pair edges higher after the stronger-than-expected Chinese Manufacturing Purchasing Managers' Index (PMI) data for July. Investors will shift their attention to the Federal Reserve’s (Fed) interest rate decision, which is scheduled for Wednesday.
Data released by the National Bureau of Statistics (NBS) on Wednesday showed that the country’s Manufacturing PMI declined to 49.4 in July from 49.5 in June, beating the expectations of 49.3. Meanwhile, the NBS Non-Manufacturing PMI dropped to 50.2 in July versus 50.5 prior, which is in line with the market consensus of 50.2. The better-than-expected Chinese PMI readings provide some support to the New Zealand Dollar (NZD) as China is a major trading partner of New Zealand.
However, the growing speculation for an early interest rate cut by the Reserve Bank of New Zealand (RBNZ) might cap the pair’s upside in the near term. Investors expect the RBNZ rate cuts, with traders pricing 14 basis points (bps) of cuts in August, indicating a 55% chance of a rate cut soon.
On the USD’s front, the Fed will announce its interest rate decision later in the day, with no change in rate expected. Traders will closely watch Fed Chair Jerome Powell's remarks from the press conference as Fed officials might set the stage for an easing policy at its September meeting. Any dovish comments from Fed’s Powell might exert some selling pressure on the Greenback and create a tailwind for NZD/USD. Traders are now pricing in a 100% possibility of a Fed rate cut by at least a quarter percentage point in September, according to data from CME FedWatch Tool.
New Zealand Dollar FAQs
The New Zealand Dollar (NZD), also known as the Kiwi, is a well-known traded currency among investors. Its value is broadly determined by the health of the New Zealand economy and the country’s central bank policy. Still, there are some unique particularities that also can make NZD move. The performance of the Chinese economy tends to move the Kiwi because China is New Zealand’s biggest trading partner. Bad news for the Chinese economy likely means less New Zealand exports to the country, hitting the economy and thus its currency. Another factor moving NZD is dairy prices as the dairy industry is New Zealand’s main export. High dairy prices boost export income, contributing positively to the economy and thus to the NZD.
The Reserve Bank of New Zealand (RBNZ) aims to achieve and maintain an inflation rate between 1% and 3% over the medium term, with a focus to keep it near the 2% mid-point. To this end, the bank sets an appropriate level of interest rates. When inflation is too high, the RBNZ will increase interest rates to cool the economy, but the move will also make bond yields higher, increasing investors’ appeal to invest in the country and thus boosting NZD. On the contrary, lower interest rates tend to weaken NZD. The so-called rate differential, or how rates in New Zealand are or are expected to be compared to the ones set by the US Federal Reserve, can also play a key role in moving the NZD/USD pair.
Macroeconomic data releases in New Zealand are key to assess the state of the economy and can impact the New Zealand Dollar’s (NZD) valuation. A strong economy, based on high economic growth, low unemployment and high confidence is good for NZD. High economic growth attracts foreign investment and may encourage the Reserve Bank of New Zealand to increase interest rates, if this economic strength comes together with elevated inflation. Conversely, if economic data is weak, NZD is likely to depreciate.
The New Zealand Dollar (NZD) tends to strengthen during risk-on periods, or when investors perceive that broader market risks are low and are optimistic about growth. This tends to lead to a more favorable outlook for commodities and so-called ‘commodity currencies’ such as the Kiwi. Conversely, NZD tends to weaken at times of market turbulence or economic uncertainty as investors tend to sell higher-risk assets and flee to the more-stable safe havens.
| Raw materials | Closed | Change, % |
|---|---|---|
| Silver | 28.376 | 1.9 |
| Gold | 241.055 | 1.18 |
| Palladium | 890.13 | -1.54 |
- Gold price struggles to capitalize on the previous day’s breakout momentum beyond $2,400.
- Geopolitical risks, modest USD downtick and global economic woes lend support to the metal.
- Traders keenly await the BoJ decision for a short-term impetus ahead of the Fed policy update.
Gold price (XAU/USD) shot to a multi-day peak around the $2,412-2,413 resistance zone on Tuesday and drew support from various factors. The Israeli attack on the Lebanon capital as retaliation for a rocket strike in the Golan Heights on Saturday raised the risk of a further escalation of geopolitical tensions in the Middle East. Furthermore, the dismal German GDP print dashed hopes for a recovery in the Eurozone's largest economy. This comes on top of persistent worries about a slowdown in China – the world's second-largest economy – and benefitted the safe-haven precious metal.
Apart from this, a modest US Dollar (USD) pullback from a nearly three-week high provided an additional boost to the Gold price. The USD remained depressed during the Asian session on Wednesday amid firming expectations that the Federal Reserve (Fed) will start cutting interest rates in September. The XAU/USD, however, struggles to gain any follow-through traction as traders prefer to wait for the outcome of a two-day Federal Open Market Committee (FOMC) meeting. In the meantime, the Bank of Japan (BoJ) policy decision might provide some impetus to the non-yielding yellow metal.
Daily Digest Market Movers: Gold price bulls turn cautious ahead of the key central bank event risks
- Geopolitical risks stemming from the ongoing conflicts in the Middle East, along with worries about an economic slowdown and a modest US Dollar pullback, pushed the Gold price to a multi-day top on Tuesday.
- The Israeli military attacked Lebanon’s capital Beirut and targeted the Hezbollah commander who was responsible for the strike in Golan Heights on Saturday, fueling worries about an all-out war in the region.
- According to the preliminary estimates published by federal statistical office Destatis, the German economy unexpectedly shrank by 0.1% in Q2 as compared to the 0.2% growth in the previous three months.
- The US Job Openings and Labor Turnover Survey (JOLTS) revealed that the number of job openings fell to 8.18M in June from 8.23M in the previous month, though was above market expectation of 8.03 million.
- The Conference Board's Consumer Confidence Index rose slightly to 100.3 in July from the previous month's downwardly revised reading of 97.8 as consumers remain relatively positive about the labor market.
- The USD did get a minor lift in reaction to the upbeat US macro data, though the momentum faded rather quickly amid bets for an imminent start of the Federal Reserve's rate-cutting cycle in September.
- The National Bureau of Statistics (NBS) reported this Wednesday that business activity in China's manufacturing sector contracted for the third straight month in July and the growth in the services sector remained tepid.
- Investors now look to the highly anticipated Bank of Japan policy decision for short-term impetus, though the focus remains glued to the Fed policy update, which, in turn, will influence the non-yielding yellow metal.
Technical Analysis: Gold price finds acceptance above $2,400, seems poised to appreciate further
From a technical perspective, the recent bounce from the vicinity of the $2,350 area, or 50-day Simple Moving Average (SMA) support zone, and the subsequent move beyond the $2,400 mark favors bullish traders. Moreover, oscillators on the daily chart have again started gaining positive traction and support prospects for additional gains. Some follow-through buying beyond the $2,412-2,413 region will reaffirm the positive outlook and lift the Gold price to last week's swing high, around the $2,432 zone. A sustained strength beyond the latter will suggest that the corrective decline from the all-time peak touched earlier this month has run its course and set the stage for additional gains. The XAU/USD might then climb to an intermediate hurdle near the $2,469-2,470 region and aim to challenge the record peak, around the $2,483-2,484 zone.
On the flip side, the $2,400 mark now seems to protect the immediate downside ahead of the $2,383-2,382 region, below which the Gold price could slide back to the 50-day SMA, currently pegged near the $2,359 area. A convincing break through the latter, leading to a subsequent fall below last week's swing low, around the $2,353 area, will be seen as a fresh trigger for bearish traders and make the XAU/USD vulnerable. The downward trajectory could extend further towards testing the next relevant support near the $2,325 area en route to the $2,300 round-figure mark.
Gold FAQs
Gold has played a key role in human’s history as it has been widely used as a store of value and medium of exchange. Currently, apart from its shine and usage for jewelry, the precious metal is widely seen as a safe-haven asset, meaning that it is considered a good investment during turbulent times. Gold is also widely seen as a hedge against inflation and against depreciating currencies as it doesn’t rely on any specific issuer or government.
Central banks are the biggest Gold holders. In their aim to support their currencies in turbulent times, central banks tend to diversify their reserves and buy Gold to improve the perceived strength of the economy and the currency. High Gold reserves can be a source of trust for a country’s solvency. Central banks added 1,136 tonnes of Gold worth around $70 billion to their reserves in 2022, according to data from the World Gold Council. This is the highest yearly purchase since records began. Central banks from emerging economies such as China, India and Turkey are quickly increasing their Gold reserves.
Gold has an inverse correlation with the US Dollar and US Treasuries, which are both major reserve and safe-haven assets. When the Dollar depreciates, Gold tends to rise, enabling investors and central banks to diversify their assets in turbulent times. Gold is also inversely correlated with risk assets. A rally in the stock market tends to weaken Gold price, while sell-offs in riskier markets tend to favor the precious metal.
The price can move due to a wide range of factors. Geopolitical instability or fears of a deep recession can quickly make Gold price escalate due to its safe-haven status. As a yield-less asset, Gold tends to rise with lower interest rates, while higher cost of money usually weighs down on the yellow metal. Still, most moves depend on how the US Dollar (USD) behaves as the asset is priced in dollars (XAU/USD). A strong Dollar tends to keep the price of Gold controlled, whereas a weaker Dollar is likely to push Gold prices up.
- The Australian Dollar declines after the release of CPI data.
- Australia's Monthly CPI rose by 3.8% YoY, easing from the 4.0% posted in May.
- The US Dollar extends losses ahead of the Fed interest rate decision scheduled for Wednesday.
The Australian Dollar (AUD) falls against the US Dollar (USD) after the release of mixed Consumer Price Index (CPI) data released on Wednesday, offering potential insights into the future direction of the Reserve Bank of Australia’s (RBA) monetary policy.
This inflation report has raised expectations that the Reserve Bank of Australia (RBA) may choose to keep interest rates unchanged at its policy meeting next week. However, economists have cautioned that further interest rate hikes could jeopardize Australia’s economic recovery.
Additionally, the NBS Manufacturing PMI posted a reading of 49.4 for July, slightly above the expected 49.3 but below the prior 49.5. Meanwhile, the Non-Manufacturing PMI came in at 50.2 as expected. Since changes in the Chinese economy can significantly impact the Australian market, these PMI readings are particularly relevant.
The downside of the AUD/USD pair might be limited as the US Dollar (USD) faces challenges ahead of the Federal Reserve’s (Fed) upcoming interest rate decision scheduled for Wednesday. The central bank is expected to keep rates unchanged in July, but there is growing anticipation of a rate cut in September. This speculation is putting pressure on the USD. Additionally, signs of cooling inflation and easing labor market conditions in the United States are further fueling expectations of multiple rate cuts by the Fed this year, potentially totaling three cuts.
Daily Digest Market Movers: Australian Dollar declines due to risk aversion
- The Australian Bureau of Statistics (ABS) reported that the Monthly CPI rose by 3.8% in the year to June, easing from the 4% posted in May. The quarterly CPI rose 1% QoQ and up 3.8% YoY in the second quarter of the year. The RBA Trimmed Mean CPI, the central bank’s preferred gauge, rose by 3.9% YoY in Q2, against the expected and previous reading of 4.0%.
- Australia's Building Permits (MoM) fell by 6.5% in June, exceeding market expectations of a 3.0% decline. This follows a 5.7% increase in May. On a year-over-year basis, Building Permits declined by 3.7%, compared to the previous year's decline of 8.5%.
- National Australia Bank (NAB) anticipates that the Reserve Bank of Australia's (RBA) cash rate will remain stable at 4.35% until May 2025, according to a recent NAB Economics outlook. Looking ahead, the NAB Economics team predicts a decline to 3.6% by December 2025, with further decreases expected in 2026.
- In a media release on Monday, the Australian Prudential Regulation Authority (APRA) warned that arrears rates are increasing slowly. Following their latest quarterly assessment of domestic and international economic conditions, APRA announced that they will keep macroprudential policy settings on hold. These comments reflect their ongoing evaluation of both domestic and global economic environments.
- Bank of America suggests that robust economic growth in the United States enables the Federal Open Market Committee (FOMC) to "afford to wait" before implementing any adjustments. The BofA notes that the economy "remains strong" and expects the Fed to begin rate cuts in December.
Technical Analysis: Australian Dollar falls to near 0.6500
The Australian Dollar trades around 0.6500 on Wednesday. The daily chart analysis shows that the AUD/USD pair is breaking below a descending channel. The 14-day Relative Strength Index (RSI) is hovering near the oversold 30 level, indicating a potential upward correction soon.
Immediate support for the AUD/USD pair is around the throwback support around the 0.6470 level.
On the upside, key resistance is around the “throwback support turned resistance” at 0.6575, aligned with the nine-day Exponential Moving Average (EMA) at 0.6581. A break above this level could lead the AUD/USD pair to test the psychological level of 0.6600, with a potential aim for a six-month high of 0.6798.
AUD/USD: Daily Chart
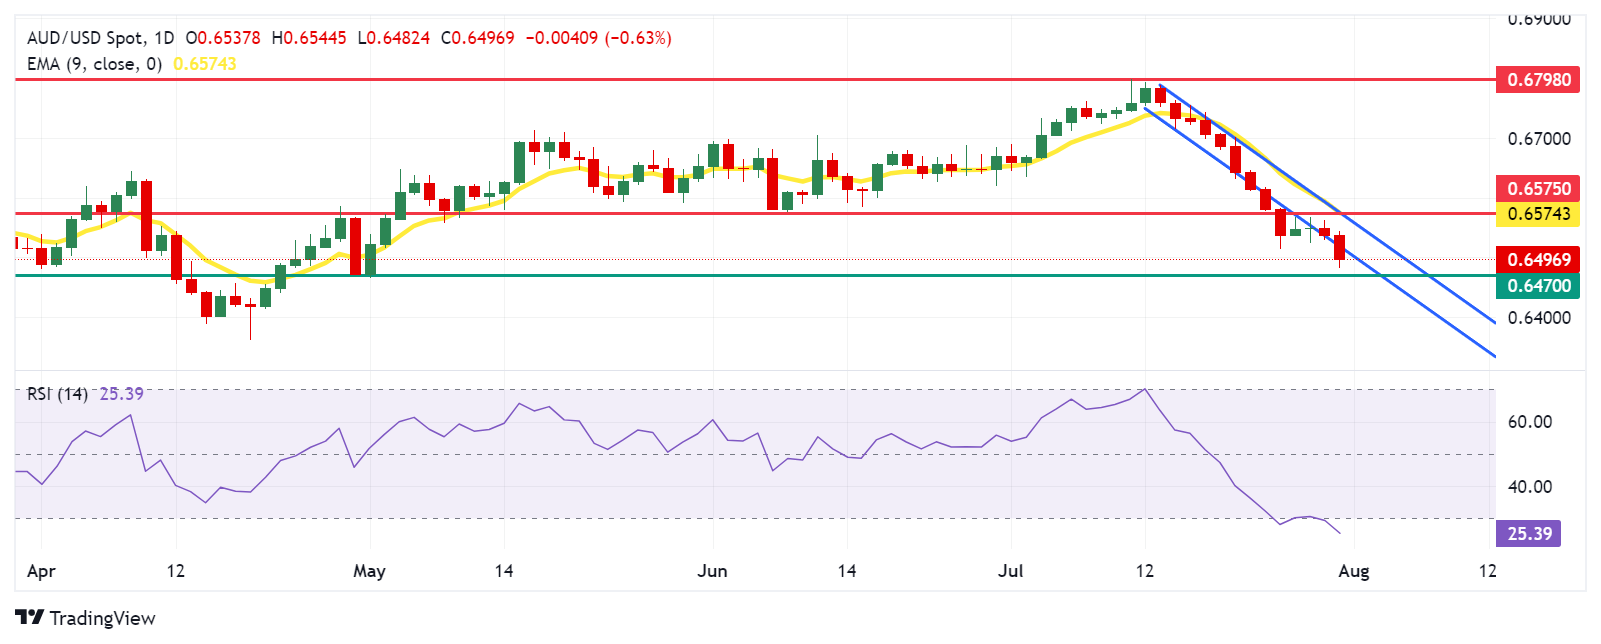
Australian Dollar PRICE Today
The table below shows the percentage change of Australian Dollar (AUD) against listed major currencies today. Australian Dollar was the weakest against the Japanese Yen.
| USD | EUR | GBP | JPY | CAD | AUD | NZD | CHF | |
|---|---|---|---|---|---|---|---|---|
| USD | -0.07% | -0.06% | -0.23% | -0.03% | 0.59% | -0.13% | -0.10% | |
| EUR | 0.07% | 0.04% | -0.13% | 0.04% | 0.66% | -0.04% | -0.02% | |
| GBP | 0.06% | -0.04% | -0.20% | 0.00% | 0.61% | -0.08% | -0.05% | |
| JPY | 0.23% | 0.13% | 0.20% | 0.25% | 0.81% | 0.09% | 0.16% | |
| CAD | 0.03% | -0.04% | -0.00% | -0.25% | 0.60% | -0.11% | -0.08% | |
| AUD | -0.59% | -0.66% | -0.61% | -0.81% | -0.60% | -0.70% | -0.68% | |
| NZD | 0.13% | 0.04% | 0.08% | -0.09% | 0.11% | 0.70% | 0.03% | |
| CHF | 0.10% | 0.02% | 0.05% | -0.16% | 0.08% | 0.68% | -0.03% |
The heat map shows percentage changes of major currencies against each other. The base currency is picked from the left column, while the quote currency is picked from the top row. For example, if you pick the Australian Dollar from the left column and move along the horizontal line to the US Dollar, the percentage change displayed in the box will represent AUD (base)/USD (quote).
Inflation FAQs
Inflation measures the rise in the price of a representative basket of goods and services. Headline inflation is usually expressed as a percentage change on a month-on-month (MoM) and year-on-year (YoY) basis. Core inflation excludes more volatile elements such as food and fuel which can fluctuate because of geopolitical and seasonal factors. Core inflation is the figure economists focus on and is the level targeted by central banks, which are mandated to keep inflation at a manageable level, usually around 2%.
The Consumer Price Index (CPI) measures the change in prices of a basket of goods and services over a period of time. It is usually expressed as a percentage change on a month-on-month (MoM) and year-on-year (YoY) basis. Core CPI is the figure targeted by central banks as it excludes volatile food and fuel inputs. When Core CPI rises above 2% it usually results in higher interest rates and vice versa when it falls below 2%. Since higher interest rates are positive for a currency, higher inflation usually results in a stronger currency. The opposite is true when inflation falls.
Although it may seem counter-intuitive, high inflation in a country pushes up the value of its currency and vice versa for lower inflation. This is because the central bank will normally raise interest rates to combat the higher inflation, which attract more global capital inflows from investors looking for a lucrative place to park their money.
Formerly, Gold was the asset investors turned to in times of high inflation because it preserved its value, and whilst investors will often still buy Gold for its safe-haven properties in times of extreme market turmoil, this is not the case most of the time. This is because when inflation is high, central banks will put up interest rates to combat it. Higher interest rates are negative for Gold because they increase the opportunity-cost of holding Gold vis-a-vis an interest-bearing asset or placing the money in a cash deposit account. On the flipside, lower inflation tends to be positive for Gold as it brings interest rates down, making the bright metal a more viable investment alternative.
China’s official Manufacturing Purchasing Managers' Index (PMI) edged a tad lower from 49.5 in June to 49.4 in July, the data published by the National Bureau of Statistics (NBS) showed Wednesday. The market consensus was 49.3 in the reported month.
The index remained below the 50 mark, which separates expansion from contraction.
The NBS Non-Manufacturing PMI declined to 50.2 in July versus June’s 50.5 figure, matching the estimated 50.2 print.
AUD/USD reaction to China's PMI data
The upbeat Chinese PMIs fail to impress the Australian Dollar, as AUD/USD sheds 0.64% on the day to trade near 0.6485, as of writing. The Aussie lost ground following soft Australian inflation data.
Australian Dollar FAQs
One of the most significant factors for the Australian Dollar (AUD) is the level of interest rates set by the Reserve Bank of Australia (RBA). Because Australia is a resource-rich country another key driver is the price of its biggest export, Iron Ore. The health of the Chinese economy, its largest trading partner, is a factor, as well as inflation in Australia, its growth rate and Trade Balance. Market sentiment – whether investors are taking on more risky assets (risk-on) or seeking safe-havens (risk-off) – is also a factor, with risk-on positive for AUD.
The Reserve Bank of Australia (RBA) influences the Australian Dollar (AUD) by setting the level of interest rates that Australian banks can lend to each other. This influences the level of interest rates in the economy as a whole. The main goal of the RBA is to maintain a stable inflation rate of 2-3% by adjusting interest rates up or down. Relatively high interest rates compared to other major central banks support the AUD, and the opposite for relatively low. The RBA can also use quantitative easing and tightening to influence credit conditions, with the former AUD-negative and the latter AUD-positive.
China is Australia’s largest trading partner so the health of the Chinese economy is a major influence on the value of the Australian Dollar (AUD). When the Chinese economy is doing well it purchases more raw materials, goods and services from Australia, lifting demand for the AUD, and pushing up its value. The opposite is the case when the Chinese economy is not growing as fast as expected. Positive or negative surprises in Chinese growth data, therefore, often have a direct impact on the Australian Dollar and its pairs.
Iron Ore is Australia’s largest export, accounting for $118 billion a year according to data from 2021, with China as its primary destination. The price of Iron Ore, therefore, can be a driver of the Australian Dollar. Generally, if the price of Iron Ore rises, AUD also goes up, as aggregate demand for the currency increases. The opposite is the case if the price of Iron Ore falls. Higher Iron Ore prices also tend to result in a greater likelihood of a positive Trade Balance for Australia, which is also positive of the AUD.
The Trade Balance, which is the difference between what a country earns from its exports versus what it pays for its imports, is another factor that can influence the value of the Australian Dollar. If Australia produces highly sought after exports, then its currency will gain in value purely from the surplus demand created from foreign buyers seeking to purchase its exports versus what it spends to purchase imports. Therefore, a positive net Trade Balance strengthens the AUD, with the opposite effect if the Trade Balance is negative.
Australia’s Retail Sales, a measure of the country’s consumer spending, rose 0.5% MoM in June after increasing by 0.6% in May, the official data published by the Australian Bureau of Statistics (ABS) showed on Wednesday.
The reading came in above the market expectations of a 0.2% growth.
Market reaction to Australia’s Retail Sales data
At the time of writing, the AUD/USD pair is down 0.74% on the day at 0.6485, mainly dragged by softer-than-expected RBA Trimmed Mean Consumer Price Index (CPI) data.
Australian Dollar PRICE Today
The table below shows the percentage change of Australian Dollar (AUD) against listed major currencies today. Australian Dollar was the weakest against the Japanese Yen.
| USD | EUR | GBP | JPY | CAD | AUD | NZD | CHF | |
|---|---|---|---|---|---|---|---|---|
| USD | -0.05% | -0.04% | -0.30% | 0.02% | 0.63% | -0.11% | -0.14% | |
| EUR | 0.05% | 0.03% | -0.25% | 0.06% | 0.67% | -0.04% | -0.08% | |
| GBP | 0.04% | -0.03% | -0.29% | 0.04% | 0.63% | -0.07% | -0.10% | |
| JPY | 0.30% | 0.25% | 0.29% | 0.39% | 0.93% | 0.20% | 0.22% | |
| CAD | -0.02% | -0.06% | -0.04% | -0.39% | 0.58% | -0.13% | -0.16% | |
| AUD | -0.63% | -0.67% | -0.63% | -0.93% | -0.58% | -0.71% | -0.74% | |
| NZD | 0.11% | 0.04% | 0.07% | -0.20% | 0.13% | 0.71% | -0.03% | |
| CHF | 0.14% | 0.08% | 0.10% | -0.22% | 0.16% | 0.74% | 0.03% |
The heat map shows percentage changes of major currencies against each other. The base currency is picked from the left column, while the quote currency is picked from the top row. For example, if you pick the Australian Dollar from the left column and move along the horizontal line to the US Dollar, the percentage change displayed in the box will represent AUD (base)/USD (quote).
On Wednesday, the People’s Bank of China (PBOC) set the USD/CNY central rate for the trading session ahead at 7.1346, as against the previous day's fix of 7.1364 and 7.2419 Reuters estimates.
Atsushi Mimura, Japan’s newly appointed Vice Finance Minister For International Affairs and top foreign exchange official, said in a Bloomberg interview Monday that “while the recent depreciation of the yen has both advantages and disadvantages, the demerits are becoming more noticeable.”
Additional comments
Intervention among the measures available to counter speculation that weighs excessively on the currency.
The impact of rising energy and food prices on consumers and importers among the drawbacks of the feeble Yen.
Intervention a necessary measure to counter speculation.
Market reaction
The Japanese Yen remains on the bids near 152.25 against the US Dollar, as of writing, up 0.32% on the day. The USD/JPY pair awaits the Bank of Japan (BoJ) interest rate decision due later this session.
- GBP/USD trims losses around 1.2840 in Wednesday’s early Asian session.
- The Fed is anticipated to leave interest rates unchanged at its July monetary policy meeting on Wednesday.
- The GBP weakens amid the speculation that the BoE would begin cutting rates from the August meeting.
The GBP/USD pair remains on the defensive near 1.2840 during the early Asian trading hours on Wednesday. The markets might turn cautious ahead of the Federal Reserve (Fed) Interest Rate Decision on Wednesday, followed by the Bank of England (BoE) policy meeting on Thursday.
The Fed is expected to hold interest rates steady at its July monetary policy meeting on Wednesday. The US central bank has been holding its benchmark funds rate in a range of 5.25-%-5.50% since July 2023, making the longest period of restrictive monetary policy in decades.
Market players will keep an eye on remarks from Chair Jerome Powell for more cues on the future path of policy rates. The markets expect the Fed to start easing its policy as soon as September as inflation edged nearer to the Fed’s 2% target.
Data released on Tuesday showed that US JOLTS Job Openings declined to 8.184 million in June, compared to May’s revised figure of 8.23 million, above the market expectation of 8.03 million. Meanwhile, US Consumer Confidence rose to 100.3 in July from the revised figure of 97.8 in June. This figure came in above the market consensus of 99.7, according to the Conference Board.
On the GBP’s front, investors continued to price in a potential rate cut by the BoE on Thursday, which dragged the Pound Sterling (GBP) lower against the USD. Trades see nearly 58% odds that the BoE will lower its borrowing costs by 25 basis points (bps) to 5%, Reuters reported.
Fed FAQs
Monetary policy in the US is shaped by the Federal Reserve (Fed). The Fed has two mandates: to achieve price stability and foster full employment. Its primary tool to achieve these goals is by adjusting interest rates. When prices are rising too quickly and inflation is above the Fed’s 2% target, it raises interest rates, increasing borrowing costs throughout the economy. This results in a stronger US Dollar (USD) as it makes the US a more attractive place for international investors to park their money. When inflation falls below 2% or the Unemployment Rate is too high, the Fed may lower interest rates to encourage borrowing, which weighs on the Greenback.
The Federal Reserve (Fed) holds eight policy meetings a year, where the Federal Open Market Committee (FOMC) assesses economic conditions and makes monetary policy decisions. The FOMC is attended by twelve Fed officials – the seven members of the Board of Governors, the president of the Federal Reserve Bank of New York, and four of the remaining eleven regional Reserve Bank presidents, who serve one-year terms on a rotating basis.
In extreme situations, the Federal Reserve may resort to a policy named Quantitative Easing (QE). QE is the process by which the Fed substantially increases the flow of credit in a stuck financial system. It is a non-standard policy measure used during crises or when inflation is extremely low. It was the Fed’s weapon of choice during the Great Financial Crisis in 2008. It involves the Fed printing more Dollars and using them to buy high grade bonds from financial institutions. QE usually weakens the US Dollar.
Quantitative tightening (QT) is the reverse process of QE, whereby the Federal Reserve stops buying bonds from financial institutions and does not reinvest the principal from the bonds it holds maturing, to purchase new bonds. It is usually positive for the value of the US Dollar.
- The Indian Rupee weakens in Wednesday’s early Asian session.
- USD demand and cautious mood might undermine the INR, while lower crude oil prices and RBI intervention could limit losses.
- Investors will closely monitor the Federal Reserve’s (Fed) interest rate decision on Wednesday.
The Indian Rupee (INR) edges lower on Wednesday. The weakness of local currency is largely driven by persistent US Dollar (USD) high demand for month-end payments, dragging the INR lower near record lows over the last few trading sessions. The cautious mood and escalating geopolitical tensions in the Middle East could weigh on the INR.
However, a further decline in crude oil prices could support the Indian Rupee as India is the third largest consumer of oil behind the US and China. The volatility might be limited as the Reserve Bank of India (RBI) is expected to continue intervening to limit sudden depreciation.
The US Federal Reserve (Fed) is widely anticipated to hold the interest rate in the range of 5.25%-5.50% at its two-day FOMC meeting that concludes on Wednesday. Traders will keep an eye on Fed Chair Jerome Powell’s press conference, which might offer some hints about the Fed’s potential rate cut plans. On the Indian docket, the final reading of HSBC Manufacturing PMI will be published on Thursday, which is projected to improve to 58.5 in July from the previous reading of 58.3.
Daily Digest Market Movers: Indian Rupee remains vulnerable near record lows
- Foreign investors invested in Indian shares for about $509.9 million on July 26, while withdrawing from Indian bonds the same day for around $78.7 million.
- The RBI has implemented additional restrictions on foreign ownership of newly issued bonds. The focus is on the billions of dollars flowing into the local market due to the inclusion of Indian bonds in JPMorgan's emerging market index, per Bloomberg.
- The US Job Openings and Labor Turnover Survey (JOLTS) reported 8.184 million job openings in June, above the market expectation of 8.03 million but lower than May’s revised figure of 8.23 million.
- US Consumer Confidence rose to 100.3 in July from the revised figure of 97.8 in June. This figure came in above the market consensus of 99.7, according to the Conference Board on Tuesday.
- With inflation easing faster than estimated in June, the markets have priced in nearly a 64% chance that the Fed will cut rates three times this year — September, November and December, according to the CME FedWatch.
Technical analysis: USD/INR’s positive outlook remains in play
Indian Rupee trades softer on the day. The outlook for the USD/INR pair appears to be bullish on the daily timeframe, as the pair has held above the key 100-day Exponential Moving Average (EMA) and is depicted by an uptrend line since June 3. Additionally, the 14-day Relative Strength Index (RSI) points higher above the midline near 60.25, showing signs of bullish momentum.
The crucial resistance level will emerge at the all-time high of 83.85. A decisive break above this level could pave the way to the 84.00 psychological level.
Sustained trading below the uptrend line around 83.72 could see further downside towards 83.51, a low of July 12. Any follow-through selling will expose 83.44, the 100-day EMA.
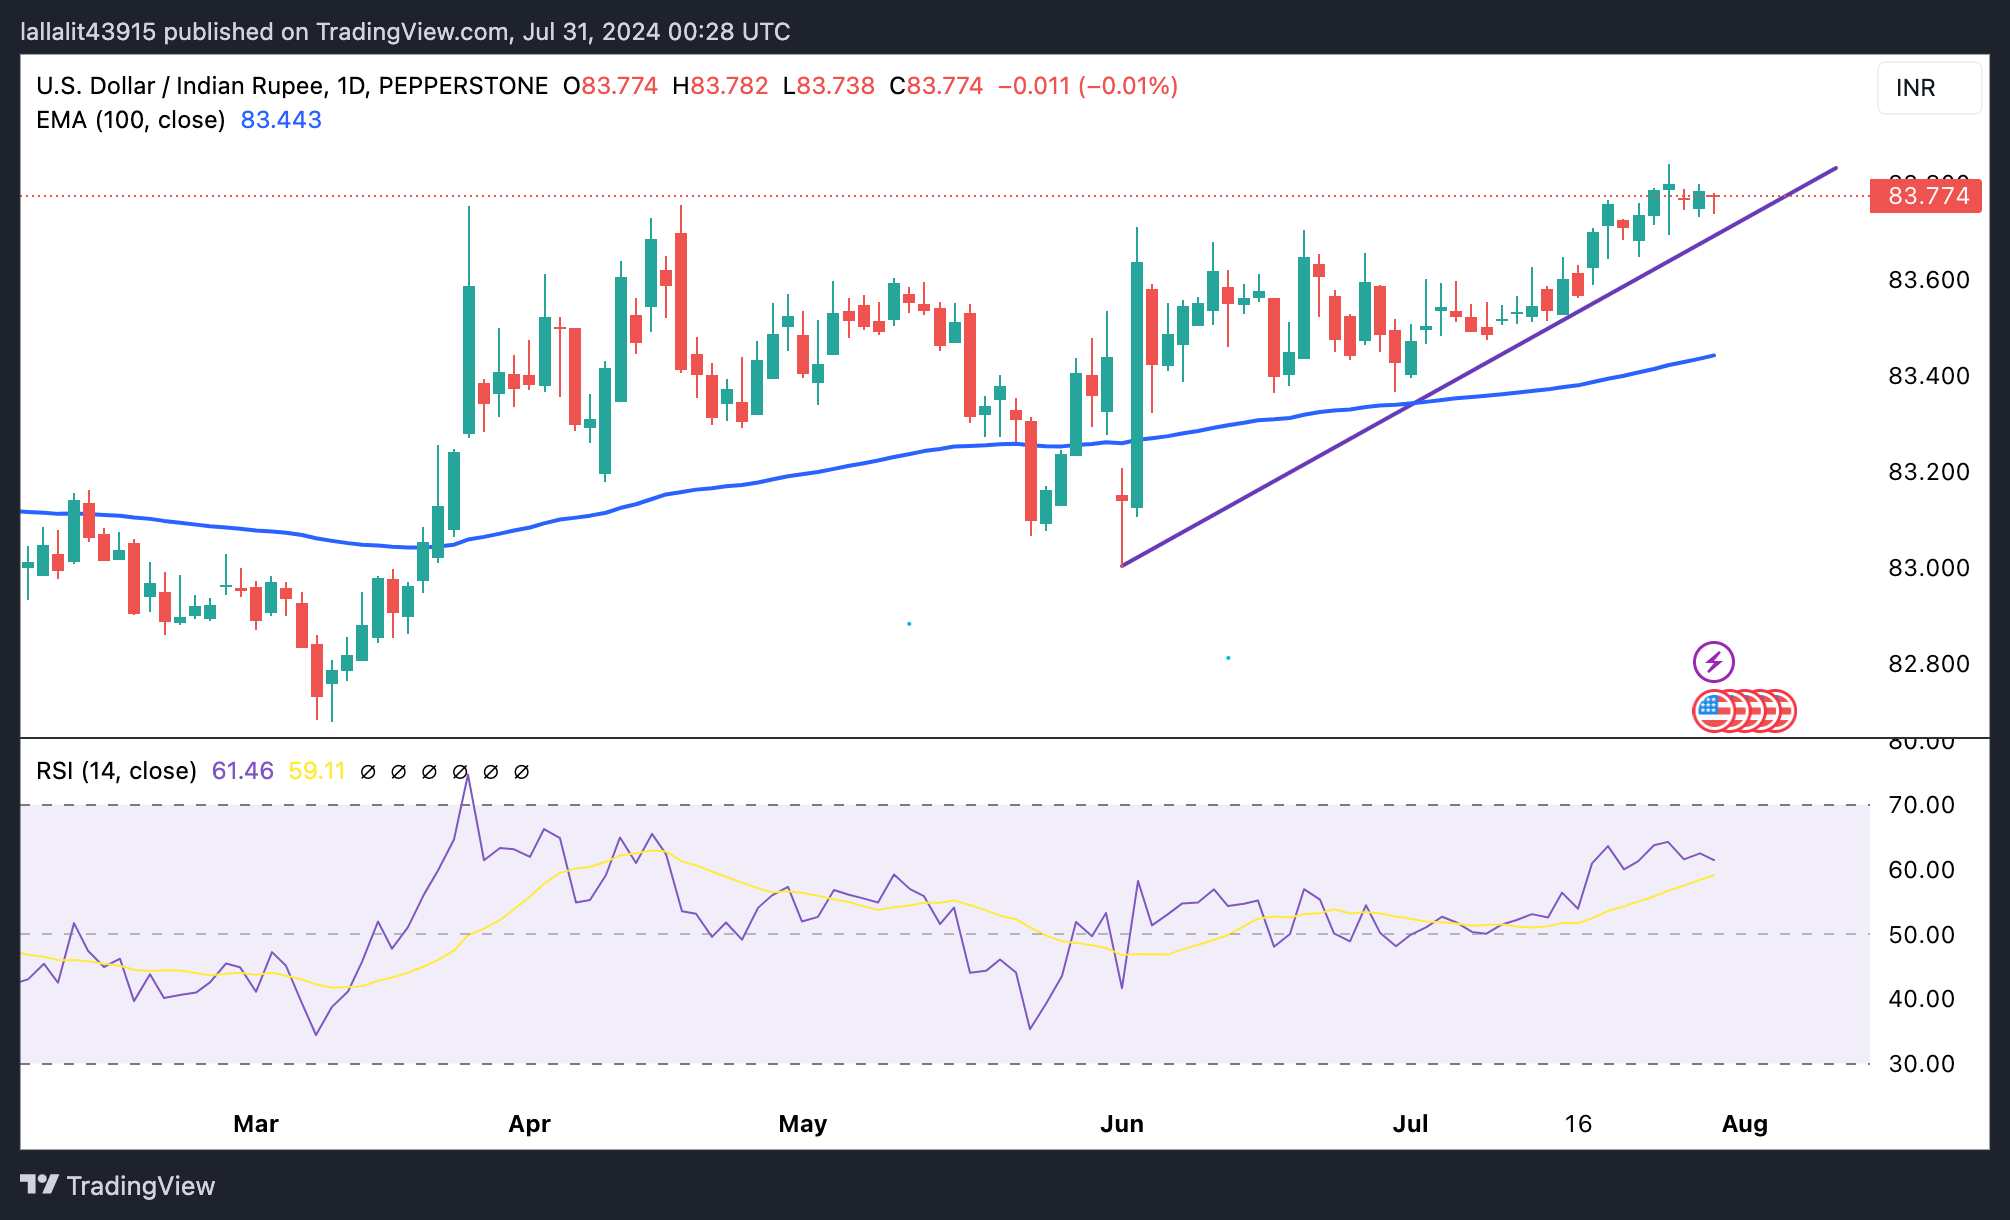
US Dollar price today
The table below shows the percentage change of US Dollar (USD) against listed major currencies today. US Dollar was the strongest against the Australian Dollar.
| USD | EUR | GBP | CAD | AUD | JPY | NZD | CHF | |
| USD | -0.02% | -0.04% | -0.03% | 0.01% | -0.21% | -0.10% | -0.03% | |
| EUR | 0.01% | -0.01% | 0.00% | 0.03% | -0.18% | -0.05% | -0.01% | |
| GBP | 0.03% | 0.00% | 0.00% | 0.03% | -0.17% | -0.05% | -0.01% | |
| CAD | 0.02% | 0.00% | 0.00% | 0.02% | -0.18% | -0.05% | 0.02% | |
| AUD | -0.02% | -0.04% | -0.03% | -0.04% | -0.22% | -0.09% | -0.02% | |
| JPY | 0.19% | 0.18% | 0.20% | 0.17% | 0.25% | 0.16% | 0.20% | |
| NZD | 0.08% | 0.05% | 0.05% | 0.04% | 0.10% | -0.12% | 0.11% | |
| CHF | 0.01% | -0.02% | -0.03% | -0.02% | 0.00% | -0.15% | -0.06% |
The heat map shows percentage changes of major currencies against each other. The base currency is picked from the left column, while the quote currency is picked from the top row. For example, if you pick the Euro from the left column and move along the horizontal line to the Japanese Yen, the percentage change displayed in the box will represent EUR (base)/JPY (quote).
Indian Rupee FAQs
The Indian Rupee (INR) is one of the most sensitive currencies to external factors. The price of Crude Oil (the country is highly dependent on imported Oil), the value of the US Dollar – most trade is conducted in USD – and the level of foreign investment, are all influential. Direct intervention by the Reserve Bank of India (RBI) in FX markets to keep the exchange rate stable, as well as the level of interest rates set by the RBI, are further major influencing factors on the Rupee.
The Reserve Bank of India (RBI) actively intervenes in forex markets to maintain a stable exchange rate, to help facilitate trade. In addition, the RBI tries to maintain the inflation rate at its 4% target by adjusting interest rates. Higher interest rates usually strengthen the Rupee. This is due to the role of the ‘carry trade’ in which investors borrow in countries with lower interest rates so as to place their money in countries’ offering relatively higher interest rates and profit from the difference.
Macroeconomic factors that influence the value of the Rupee include inflation, interest rates, the economic growth rate (GDP), the balance of trade, and inflows from foreign investment. A higher growth rate can lead to more overseas investment, pushing up demand for the Rupee. A less negative balance of trade will eventually lead to a stronger Rupee. Higher interest rates, especially real rates (interest rates less inflation) are also positive for the Rupee. A risk-on environment can lead to greater inflows of Foreign Direct and Indirect Investment (FDI and FII), which also benefit the Rupee.
Higher inflation, particularly, if it is comparatively higher than India’s peers, is generally negative for the currency as it reflects devaluation through oversupply. Inflation also increases the cost of exports, leading to more Rupees being sold to purchase foreign imports, which is Rupee-negative. At the same time, higher inflation usually leads to the Reserve Bank of India (RBI) raising interest rates and this can be positive for the Rupee, due to increased demand from international investors. The opposite effect is true of lower inflation.
| Index | Change, points | Closed | Change, % |
|---|---|---|---|
| NIKKEI 225 | 57.32 | 38525.95 | 0.15 |
| Hang Seng | -235.43 | 17002.91 | -1.37 |
| KOSPI | -27.34 | 2738.19 | -0.99 |
| ASX 200 | -36.4 | 7953.2 | -0.46 |
| DAX | 90.51 | 18411.18 | 0.49 |
| CAC 40 | 31.1 | 7474.94 | 0.42 |
| Dow Jones | 203.4 | 40743.33 | 0.5 |
| S&P 500 | -27.1 | 5436.44 | -0.5 |
| NASDAQ Composite | -222.78 | 17147.42 | -1.28 |
| Pare | Closed | Change, % |
|---|---|---|
| AUDUSD | 0.65375 | -0.2 |
| EURJPY | 165.195 | -0.9 |
| EURUSD | 1.08133 | -0.08 |
| GBPJPY | 196.045 | -1.04 |
| GBPUSD | 1.28321 | -0.22 |
| NZDUSD | 0.59013 | 0.4 |
| USDCAD | 1.3846 | -0.04 |
| USDCHF | 0.88255 | -0.37 |
| USDJPY | 152.76 | -0.82 |


© 2000-2026. Sva prava zaštićena.
Sajt je vlasništvo kompanije Teletrade D.J. LLC 2351 LLC 2022 (Euro House, Richmond Hill Road, Kingstown, VC0100, St. Vincent and the Grenadines).
Svi podaci koji se nalaze na sajtu ne predstavljaju osnovu za donošenje investicionih odluka, već su informativnog karaktera.
The company does not serve or provide services to customers who are residents of the US, Canada, Iran, The Democratic People's Republic of Korea, Yemen and FATF blacklisted countries.
Izvršenje trgovinskih operacija sa finansijskim instrumentima upotrebom marginalne trgovine pruža velike mogućnosti i omogućava investitorima ostvarivanje visokih prihoda. Međutim, takav vid trgovine povezan je sa potencijalno visokim nivoom rizika od gubitka sredstava. Проведение торговых операций на финанcовых рынках c маржинальными финанcовыми инcтрументами открывает широкие возможноcти, и позволяет инвеcторам, готовым пойти на риcк, получать выcокую прибыль, но при этом неcет в cебе потенциально выcокий уровень риcка получения убытков. Iz tog razloga je pre započinjanja trgovine potrebno odlučiti o izboru odgovarajuće investicione strategije, uzimajući u obzir raspoložive resurse.
Upotreba informacija: U slučaju potpunog ili delimičnog preuzimanja i daljeg korišćenja materijala koji se nalazi na sajtu, potrebno je navesti link odgovarajuće stranice na sajtu kompanije TeleTrade-a kao izvora informacija. Upotreba materijala na internetu mora biti praćena hiper linkom do web stranice teletrade.org. Automatski uvoz materijala i informacija sa stranice je zabranjen.
Ako imate bilo kakvih pitanja, obratite nam se pr@teletrade.global.
транcфери