- Analiza
- Novosti i instrumenti
- Vesti sa tržišta
Forex-novosti i prognoze od 31-05-2024
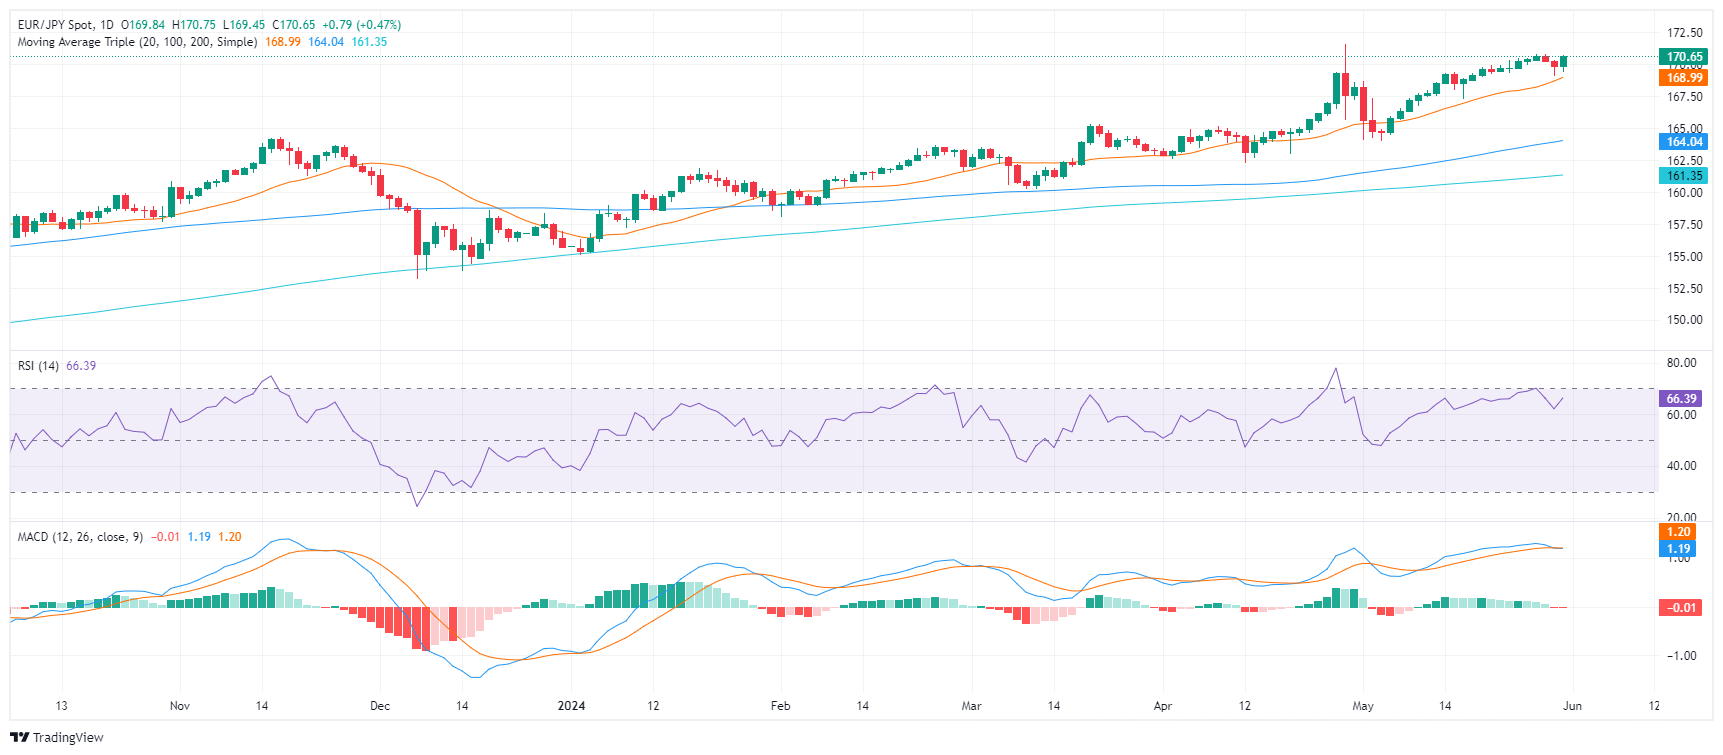
- The daily RSI is pointing upwards, hovering around 70, but continuing red bars in the MACD show a trailing consolidation.
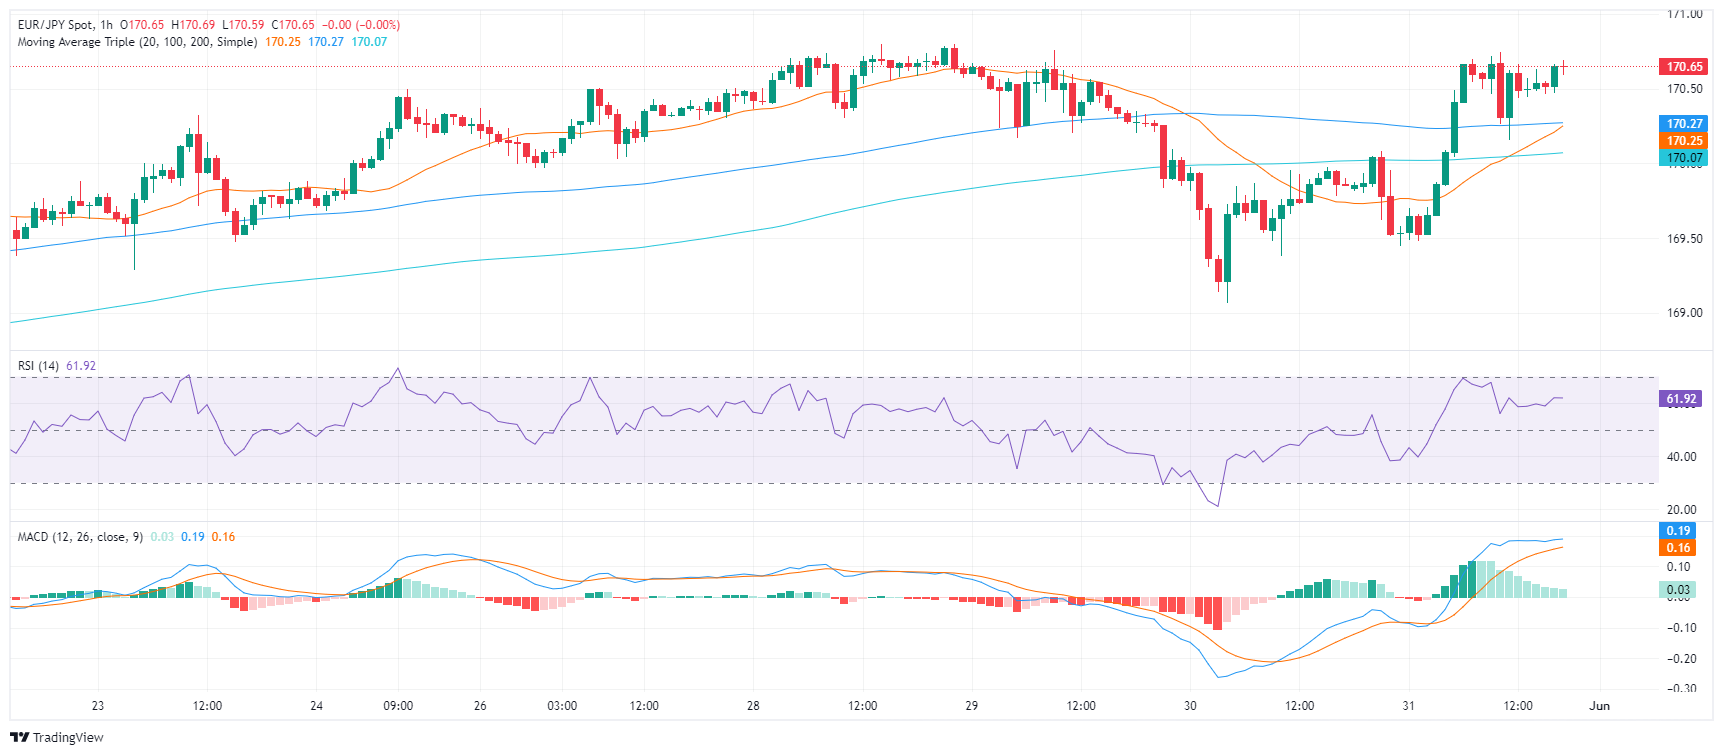
- On the hourly chart, indicators are neutral and reside in the positive terrain.
- The 20-day SMA at 169.00 serves as an important threshold for sellers.
On Friday's trading session, despite recent downside corrections, the EUR/JPY pair managed to reclaim its stance above 170.00. This indicates a shifting of the bearish momentum observed on Thursday when the pair marked a daily low at 169.00.
The daily Relative Strength Index (RSI) has pivoted, now pointing upwards near 70, suggesting a possible reversal. However, the MACD is still printing red bars, confirming that the pair is in a consolidation phase with limited upside. These mixed signals necessitate following the pair closely to determine if this marks a fresh bullish momentum or merely a pause in a more pronounced downward correction.
EUR/JPY daily chart
On the hourly chart, indicators are maintaining their neutrality, inhabiting the positive territory. This could potentially point to a subtle strengthening of bullish sentiment despite the ongoing consolidation phase.
EUR/JPY hourly chart
Critically, the position of the EUR/JPY pair continues to hover above the significant SMAs. The 20-day SMA at 169.00 in particular stands out as a crucial threshold and sellers must conquer this level to flip the near-term bullish outlook. Should the position fall below this key support level, the 100 and 200-day SMAs provide further safety barriers for potential sellers.
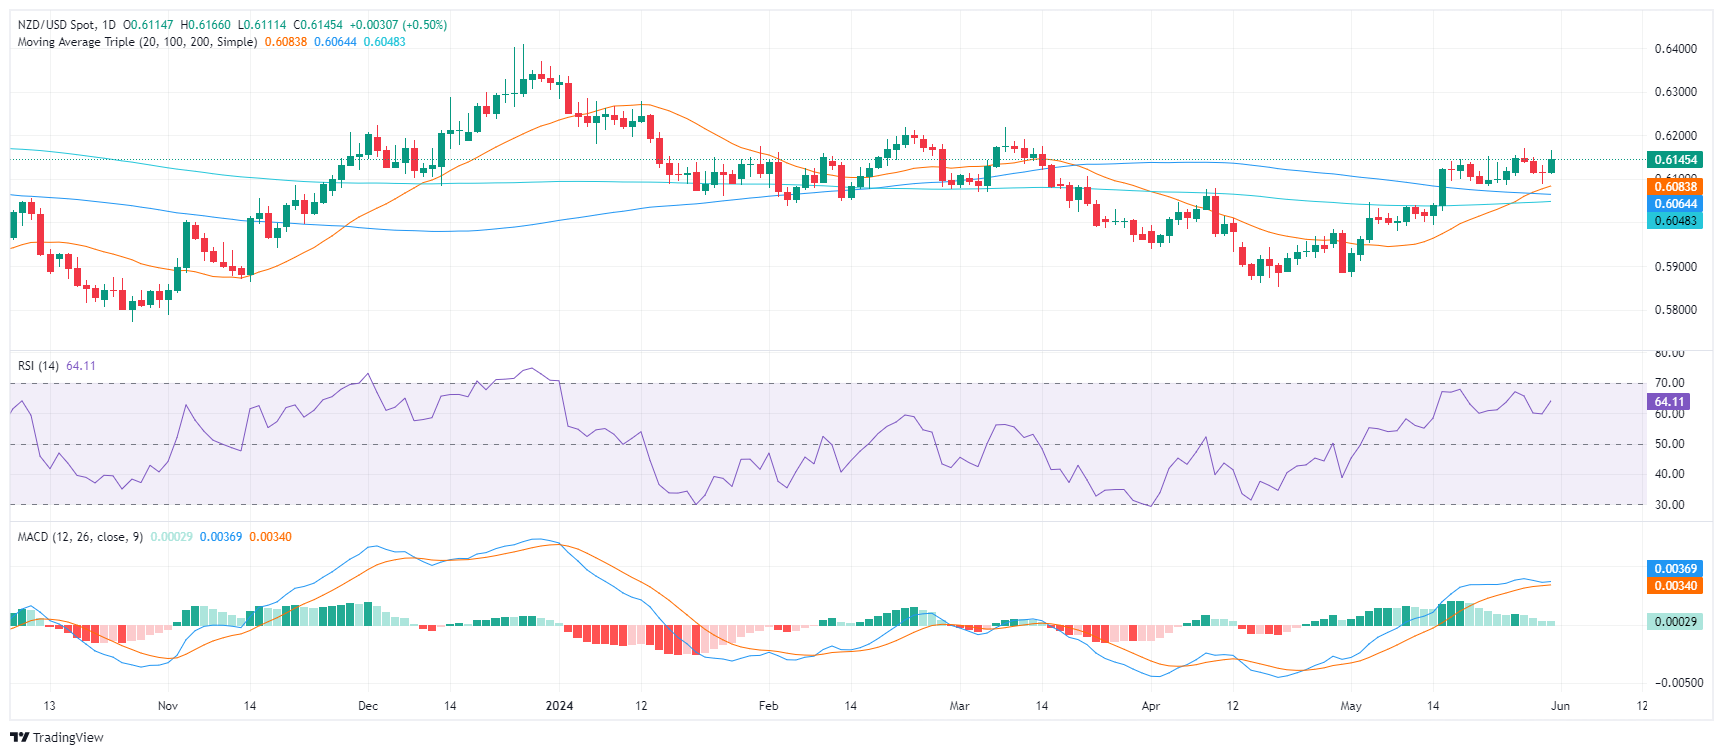
- The NZD/USD is currently in a consolidation phase following last week's rally.
- The pair is building support around the 0.6050-0.6100 area.
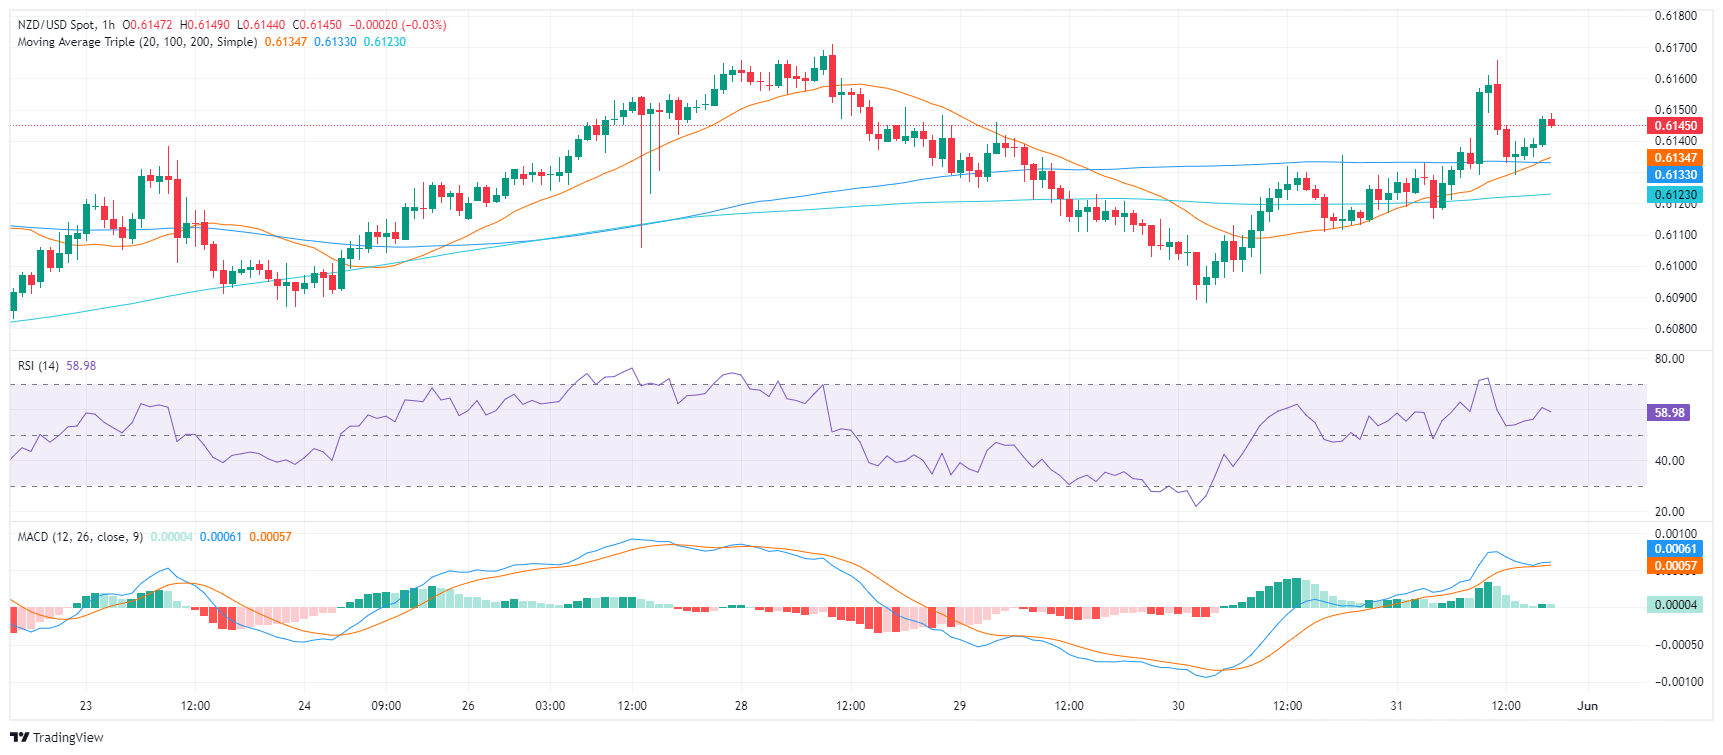
- Indicators are deep in the positive area on the daily chart and hourly indicators decelerated.
The NZD/USD pair witnessed a rise, trading at a high of 0.6160 before stabilizing at 0.6145 as the pair entered a consolidation phase.
In the daily chart, the Relative Strength Index (RSI) improved with the latest readings at 64, suggesting increased buying pressure. This rise in the RSI matches with the steady presence of green bars on the Moving Average Convergence Divergence (MACD), hinting at an ongoing upward trend.
NZD/USD daily chart
Zooming in, hourly indicators remain in positive area but somewhat flattened with the RSI at 58 and the MACD printing flat green bars.
NZD/USD hourly chart
Additionally, the NZD/USD continues its strong upward trend, with the convergence of its 20, 100, and 200-day Simple Moving Averages (SMAs) in the 0.6050-0.6100 region providing strong support for the pair. Despite any data that may indicate a stabilizing NZD, the technical indicators reflect ongoing bullish activity. Any movements below this convergence could be considered a sell signal.
- EUR/USD rose to 1.08800 after better-than-expected EU HICP inflation.
- Pair falls back to the week’s opening bids heading into the close.
- Coming up next week: EU & US PMIs, ECB rate call, US NFP.
EUR/USD struggled to make headway on Friday, splashing around near 1.0850 as the major pair heads into the close within reach of the week’s opening bids on Monday. European Harmonized Index of Consumer Prices (HICP) inflation rose faster than expected in May, while US Personal Consumption Expenditures (PCE) Price Index inflation cooled faster than expected in April. Next week brings a heavy data docket, with Purchasing Managers Index (PMI) figures on both sides of the Atlantic followed by an anticipated rate call from the European Central Bank (ECB) and another print of US Nonfarm Payrolls (NFP) next Friday.
Pan-European Core HICP inflation rose 2.9% MoM in May, above the 2.8% median market forecast and stretching from the previous month’s 2.7%. A sharp downside miss in German Retail Sales in April limited gains for the Euro after consumer activity declined -1.2% MoM versus the expected -0.1%. However, the previous period saw a sharp upside revision to 2.6% from the initial print of 1.8%.
EUR/USD rallied to an intraday high above 1.0880 in European markets, but backslid during the US market session after US PCE Price Index inflation cooled to 0.2% MoM in April. The figure comes in below the expected hold at 0.3%, driven by a sharp easing in US Personal Spending figures, which fell to 0.2% compared to the forecast 0.3% and falling even further from the previous revised print of 0.7%.
The ECB meets next week for another rate call, and markets are increasingly expecting a first quarter-point rate trim from EU central planners after the ECB steadily raised its Main Refinancing Operations Rate from 0.0% in June 2022 to 4.5% in September of 2023.
May’s US ISM PMI figures next Monday are expected to recover to 49.8 from 49.2. Next Friday’s US NFP labor figures loom ahead, and median market forecasts are currently expecting 180K net job additions to the US jobs market in May.
EUR/USD technical outlook
EUR/USD spent the week consolidating around a midrange near 1.0850 as the pair churns just north of the 200-day Exponential Moving Average(EMA) at 1.0793. Daily candlesticks are showing sign of bullish exhaustion and the pair could be due for a bearish breakdown towards the 1.0600 handle. Despite a 2.8% recovery from the last swing low, EUR/USD remains down -1.6% from 2024’s opening bids near 1.1035.
EUR/USD daily chart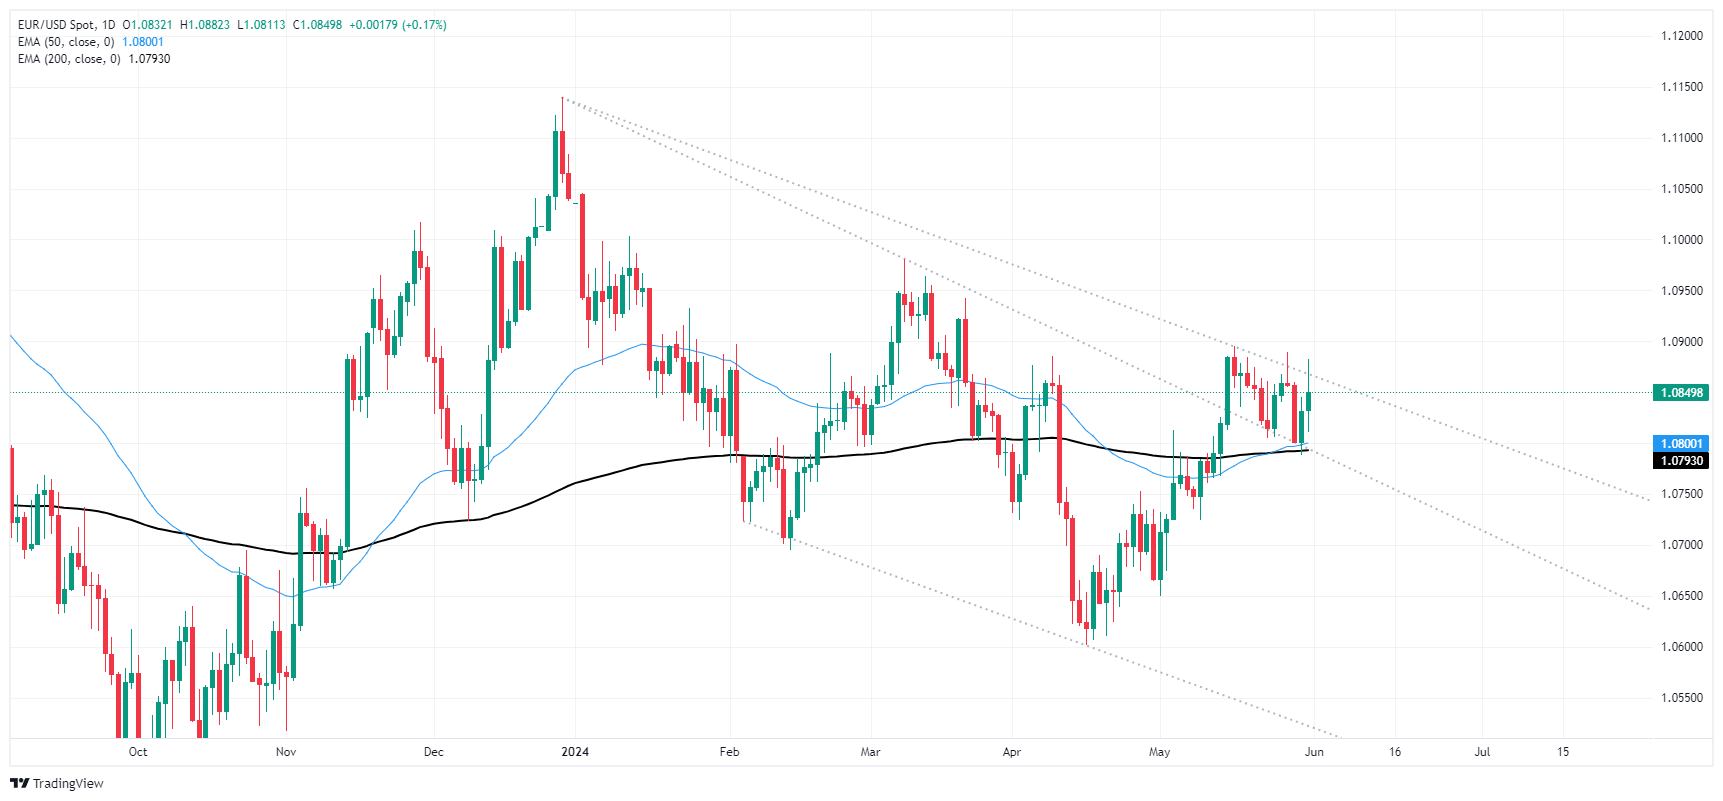
- WTI fell into the red for the week, etching in a second month of declines.
- US Crude Oil production remains a concern despite downturn in supplies.
- OPEC+ broadly expected to maintain voluntary production cuts.
West Texas Intermediate (WTI) US Crude Oil backslid in fresh lows for the week, going into the red from Monday and testing below $77.00 per barrel. WTI is set to end a second straight down month as energy traders remain concerned that global demand will be unable to avoid getting swamped out by US Crude Oil production.
According to the American Petroleum Institute (API) and the Energy Information Administration (EIA), US Crude Oil supplies contracted sharply week-over-week, however rising inventories in refineries pushed barrel bids lower this week. A disappointing run-up to the Memorial Day driving season has left refined petroleum product producers holding more supply than they intended, combined with a warmer-than-expected winter that saw declines in demand for heating oil.
OPEC+ plans to extend current output caps, but no new restrictions on the table
The Organization of the Petroleum Exporting Countries (OPEC) and its extended network of non-member ally states, OPEC+, are due to meet on Sunday to discuss the oil cartel’s voluntary output restrictions put in place in 2023 to support global Crude Oil prices. OPEC+ is broadly expected to maintain current pumping quotas, with unnamed sources reporting that the conglomerate is likely to extend production caps through 2025. However, energy traders are increasingly skeptical that current production limits will be enough as US Crude Oil production continues to climb.
US President Joe Biden announced on Friday that a possible ceasefire deal is close to being reached between Israel and Palestinian Hamas, which could see the two sides of the conflict agreeing to a multi-month ceasefire. The possibility of easing tensions in the Middle East is further crimping barrel demand after Crude Oil markets spent months driving up barrel bids on concerns the Israel-Hamas conflict could spill over into neighboring nations critical to global Crude Oil production.
US Personal Consumption Expenditures (PCE) Price Index inflation eased unexpectedly MoM in April, falling to 0.2% MoM versus the forecast hold at 0.3%. Increased market bets of a September rate cut from the Federal Reserve (Fed) were unable to spark a meaningful spike in Crude Oil markets as a sharp decline in US Personal Spending growth bodes poorly for WTI demand. Personal Spending grew by a slim 0.2% in April, less than the forecast 0.3% and even further down from the previous print of 0.7%.
WTI technical outlook
WTI fell to a fresh weekly low of 76.50 on Friday, sending barrels into the red for the week and securing a second month of declines in US Crude Oil. WTI rose to an intraday high near $78.40 on Friday, but tumbled after knocking on the 200-hour Exponential Moving Average (EMA) which is descending into $78.30.
WTI continues to consolidate near familiar technical levels as US Crude Oil remains unable to decisively crack through the 200-day EMA at $79.00. WTI remains up nearly 8% in 2024, but still remains down nearly 12% from the year’s peaks set in April just above $87.00.
WTI hourly chart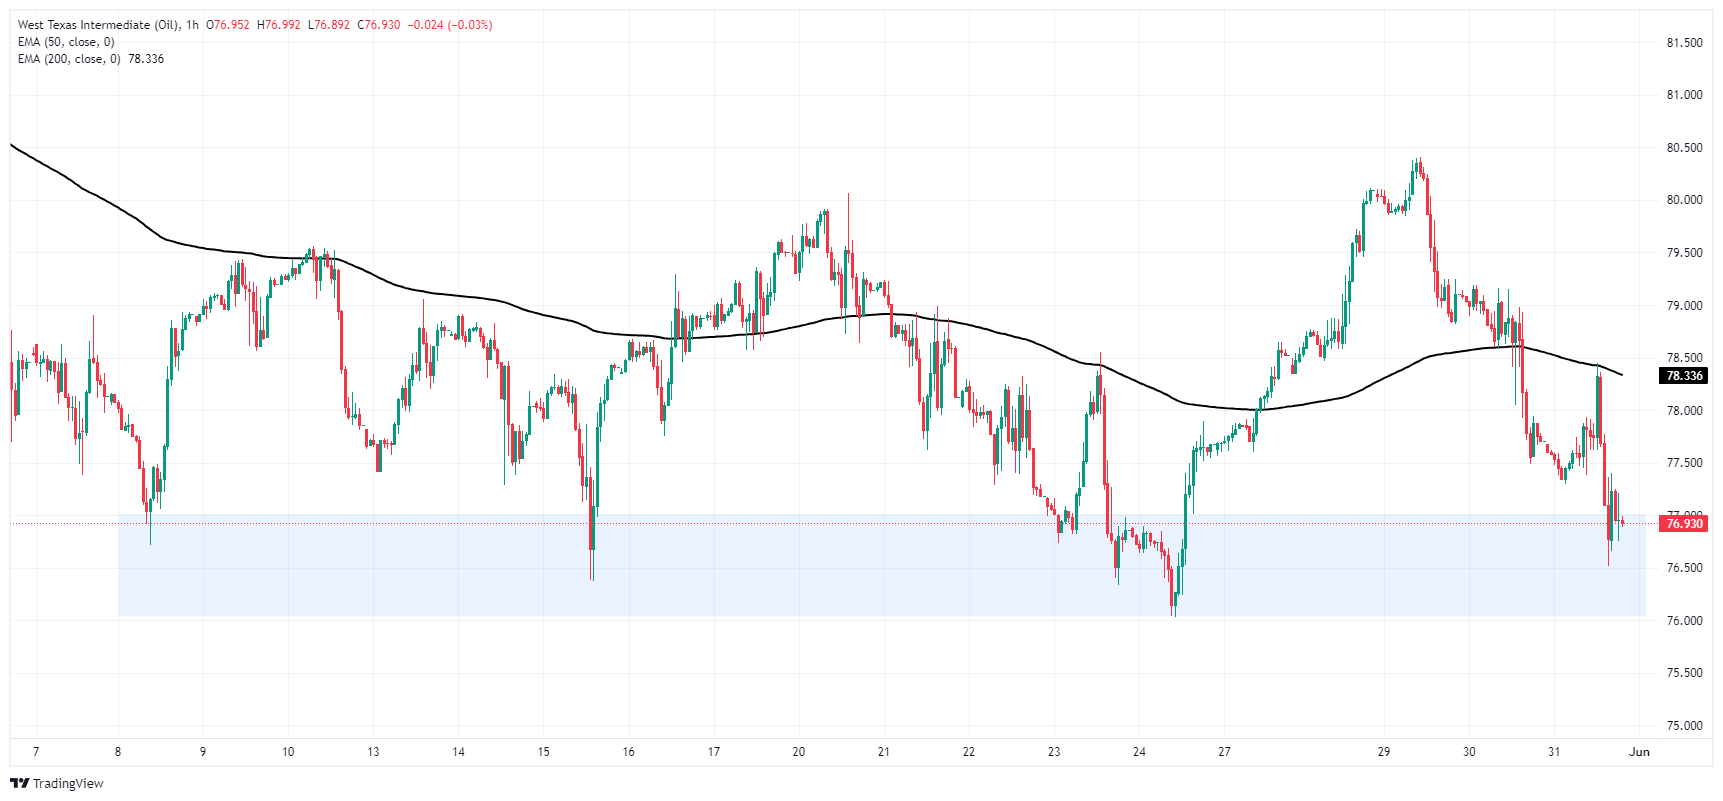
WTI daily chart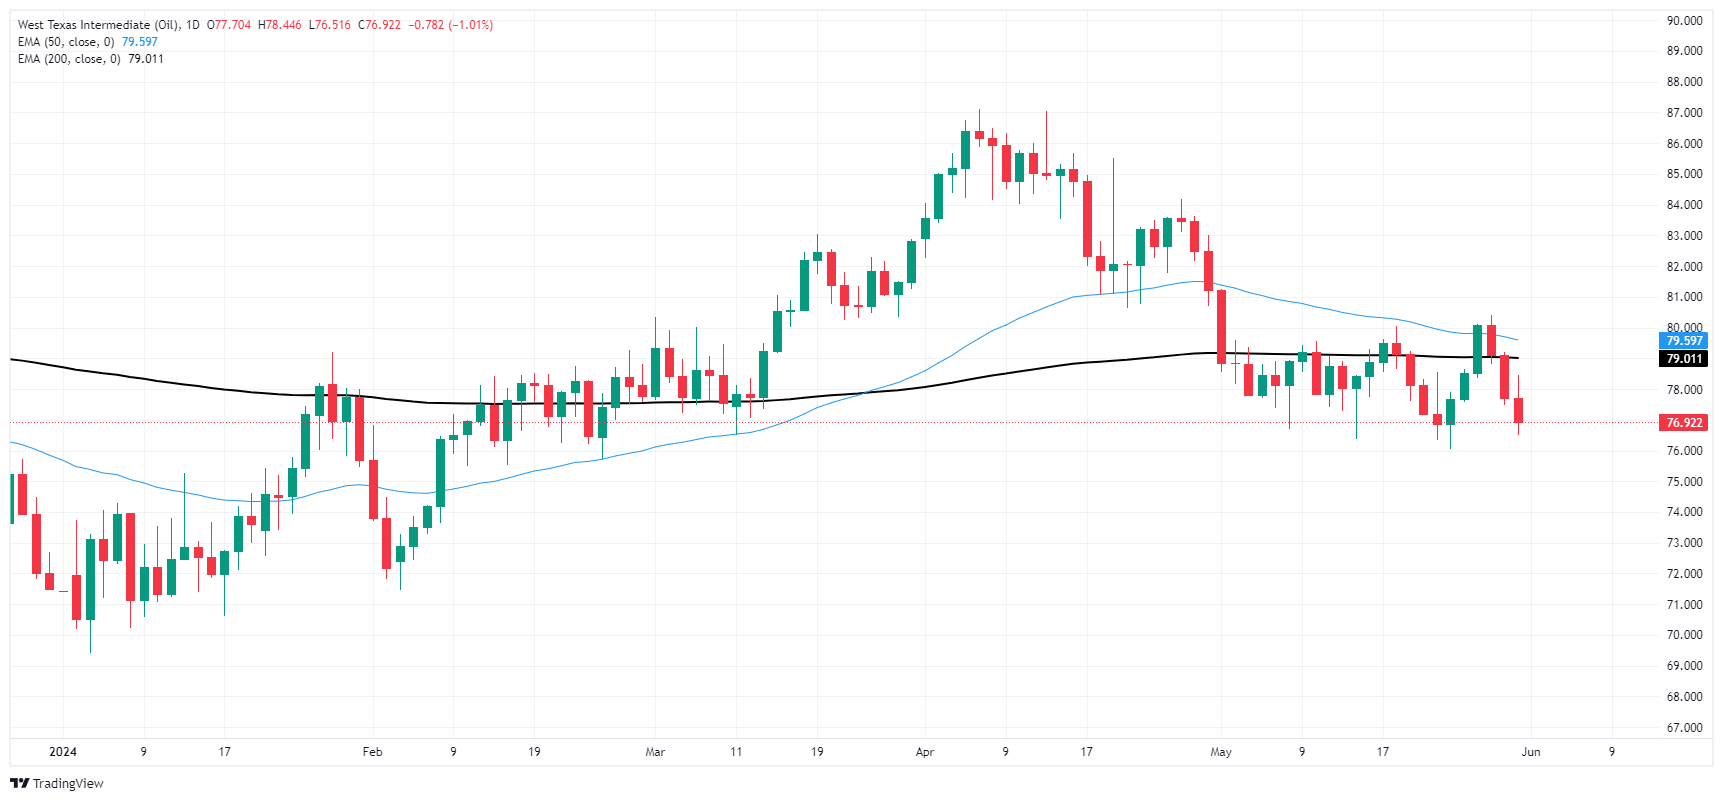
- Dow Jones rebounds from lows near 38,000.00 after heavy backslide.
- Market sentiment recovering as rate cut hopes rise once again.
- US PCE Price Index inflation cools faster than expected.
The Dow Jones Industrial Average (DJIA) rebounded over 250 points on Friday as investor sentiment turned higher after US Personal Consumption Expenditures (PCE) Price Index inflation eased faster than expected. Rate markets are once again pricing in better-than-even odds of a September rate cut from the Federal Reserve (Fed). The Dow Jones is also getting bolstered by a strong rebound in Salesforces Inc. (CRM) after the management company missed revenue expectations for the first time since 2006, sparking a steep 20%+ decline in the stock.
US PCE Price Index inflation eased to 0.2% MoM in April, coming in below the forecast steady hold at 0.3%. US Personal Spending also declined more than expected in April, falling to just 0.2% MoM versus the forecast 0.3% and further down from the previous month’s revised 0.7%.
With inflation pressures showing further signs of cooling, investors are once again pivoting to hopes for a September rate cut from the Fed’s Federal Open Market Committee (FOMC). According to the CME’s FedWatch Tool, rate markets are pricing in only a 48% chance of no rate change in September.
Dow Jones news
The Dow Jones is broadly higher on Friday, with over two-thirds of the index’s constituent securities in the green for the day. Amazon Inc. (AMZN) slid -2.5% to $174.77 per share despite announcing progress on Amazon’s planned drone delivery services as investors remain skeptical the delivery company will be able to see returns on its automated delivery plans.
Salesforce Inc. (CRM) is up 5.5% on Friday, trading above $230.00 per share as the stock slowly recovers from a harsh selloff earlier in the week. CRM backslid over -20% this week after the management software company missed earnings expectations by $40 million dollars. CRM reported Q1 revenues of $9.133 billion, an 11% increase YoY, while median analyst estimates expected revenue of $9.145 billion. CRM also issued lowered forward guidance for growth and earnings as the long-standing company struggles to find new customer markets to break into.
Dow Jones technical outlook
The Dow Jones is rebounding from steep near-term declines, testing into 38,380.00 after hitting a fresh May low near 38,000.00 this week. The major equity index has declined in all but three of the last ten consecutive trading days, and the DJIA is still down -4.2% from record highs set just above 40,000.00 on May 20.
The Dow Jones is still trading north of the 200-day Exponential Moving Average (EMA) at 37,220.72, but sharp near-term declines leave the index far below all-time highs and grappling with short pressure.
Dow Jones five minute chart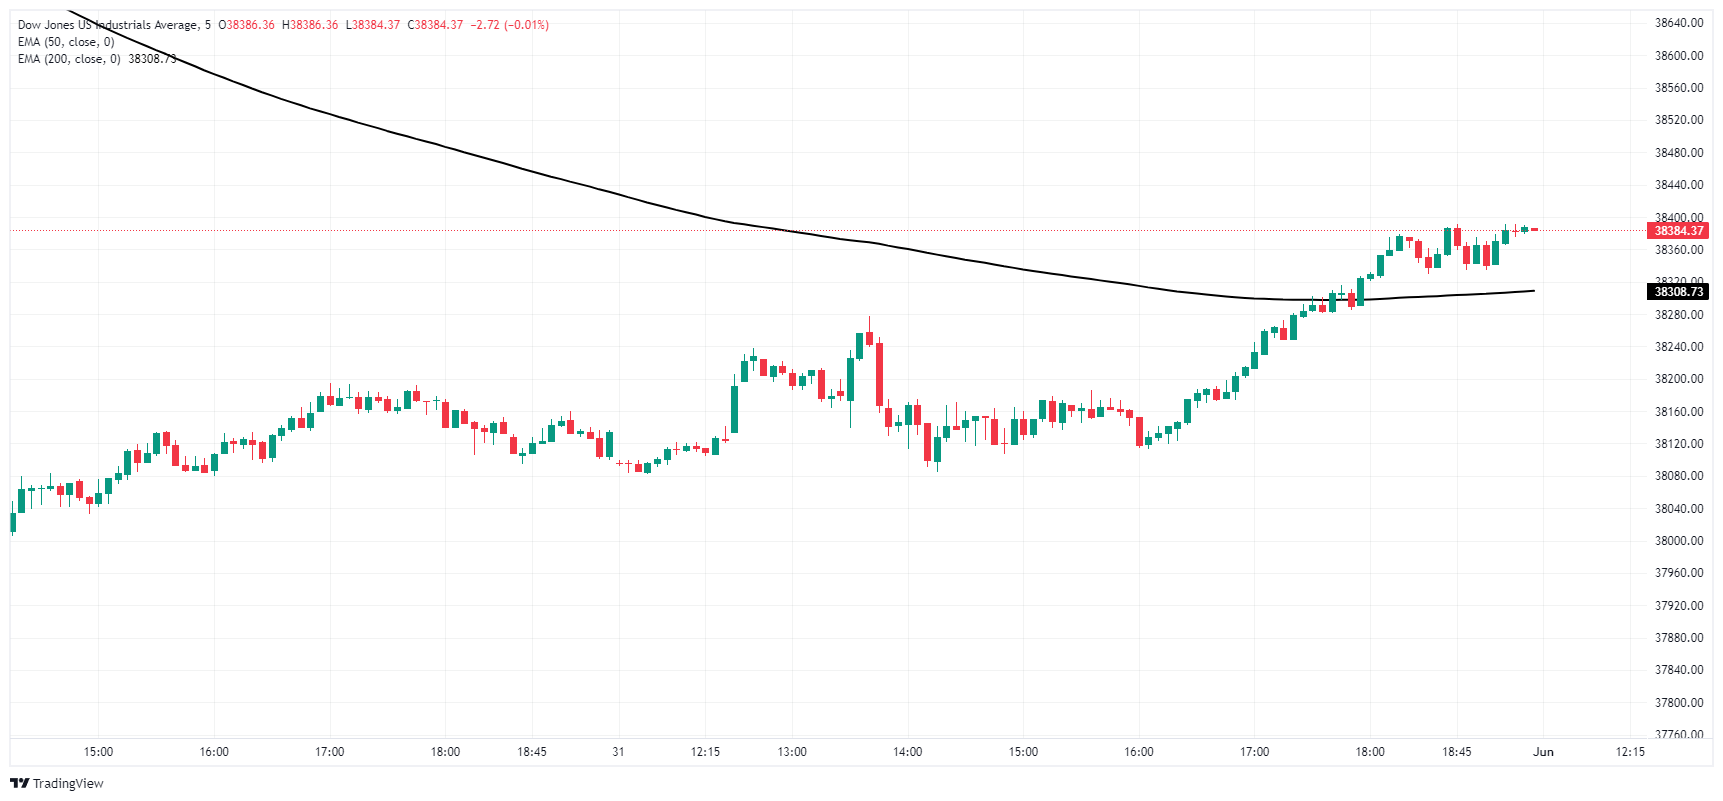
Dow Jones daily chart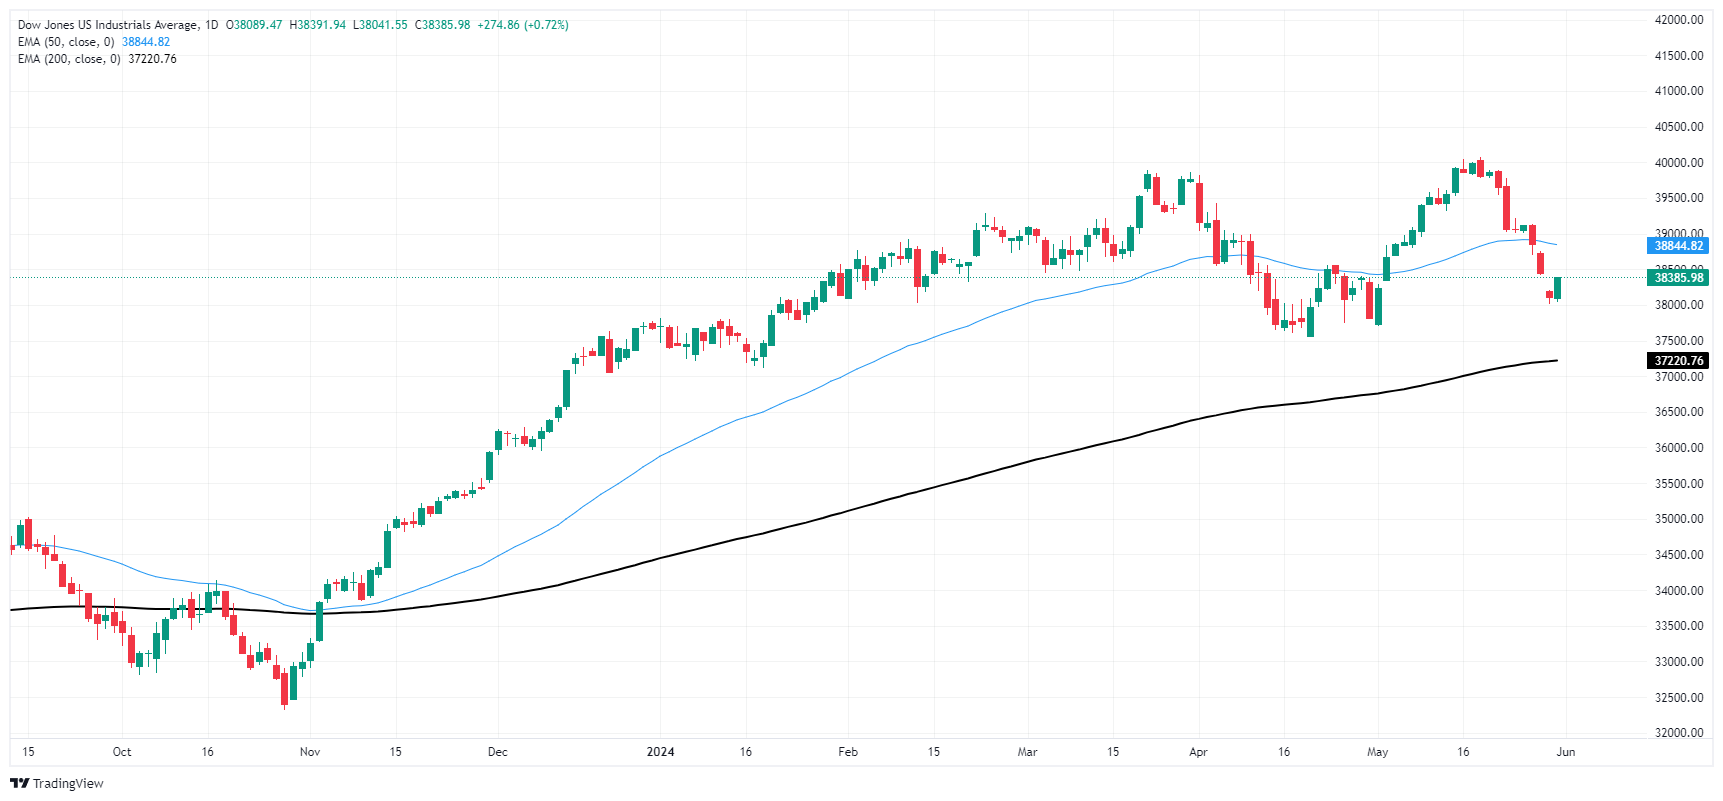
Dow Jones FAQs
The Dow Jones Industrial Average, one of the oldest stock market indices in the world, is compiled of the 30 most traded stocks in the US. The index is price-weighted rather than weighted by capitalization. It is calculated by summing the prices of the constituent stocks and dividing them by a factor, currently 0.152. The index was founded by Charles Dow, who also founded the Wall Street Journal. In later years it has been criticized for not being broadly representative enough because it only tracks 30 conglomerates, unlike broader indices such as the S&P 500.
Many different factors drive the Dow Jones Industrial Average (DJIA). The aggregate performance of the component companies revealed in quarterly company earnings reports is the main one. US and global macroeconomic data also contributes as it impacts on investor sentiment. The level of interest rates, set by the Federal Reserve (Fed), also influences the DJIA as it affects the cost of credit, on which many corporations are heavily reliant. Therefore, inflation can be a major driver as well as other metrics which impact the Fed decisions.
Dow Theory is a method for identifying the primary trend of the stock market developed by Charles Dow. A key step is to compare the direction of the Dow Jones Industrial Average (DJIA) and the Dow Jones Transportation Average (DJTA) and only follow trends where both are moving in the same direction. Volume is a confirmatory criteria. The theory uses elements of peak and trough analysis. Dow’s theory posits three trend phases: accumulation, when smart money starts buying or selling; public participation, when the wider public joins in; and distribution, when the smart money exits.
There are a number of ways to trade the DJIA. One is to use ETFs which allow investors to trade the DJIA as a single security, rather than having to buy shares in all 30 constituent companies. A leading example is the SPDR Dow Jones Industrial Average ETF (DIA). DJIA futures contracts enable traders to speculate on the future value of the index and Options provide the right, but not the obligation, to buy or sell the index at a predetermined price in the future. Mutual funds enable investors to buy a share of a diversified portfolio of DJIA stocks thus providing exposure to the overall index.
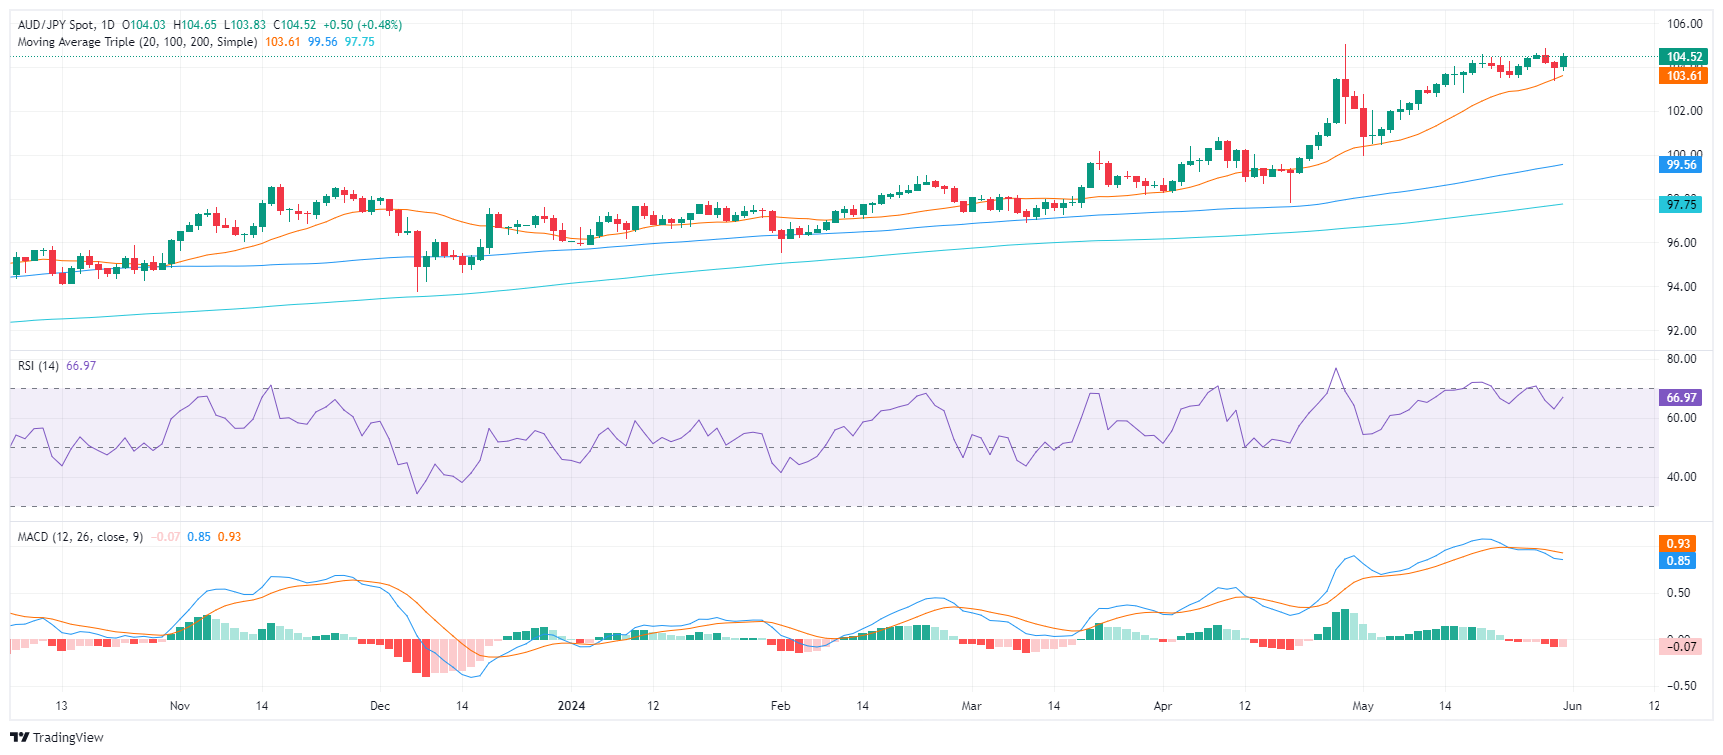
- Daily chart indicators suggest a positive incline; RSI climbs up.
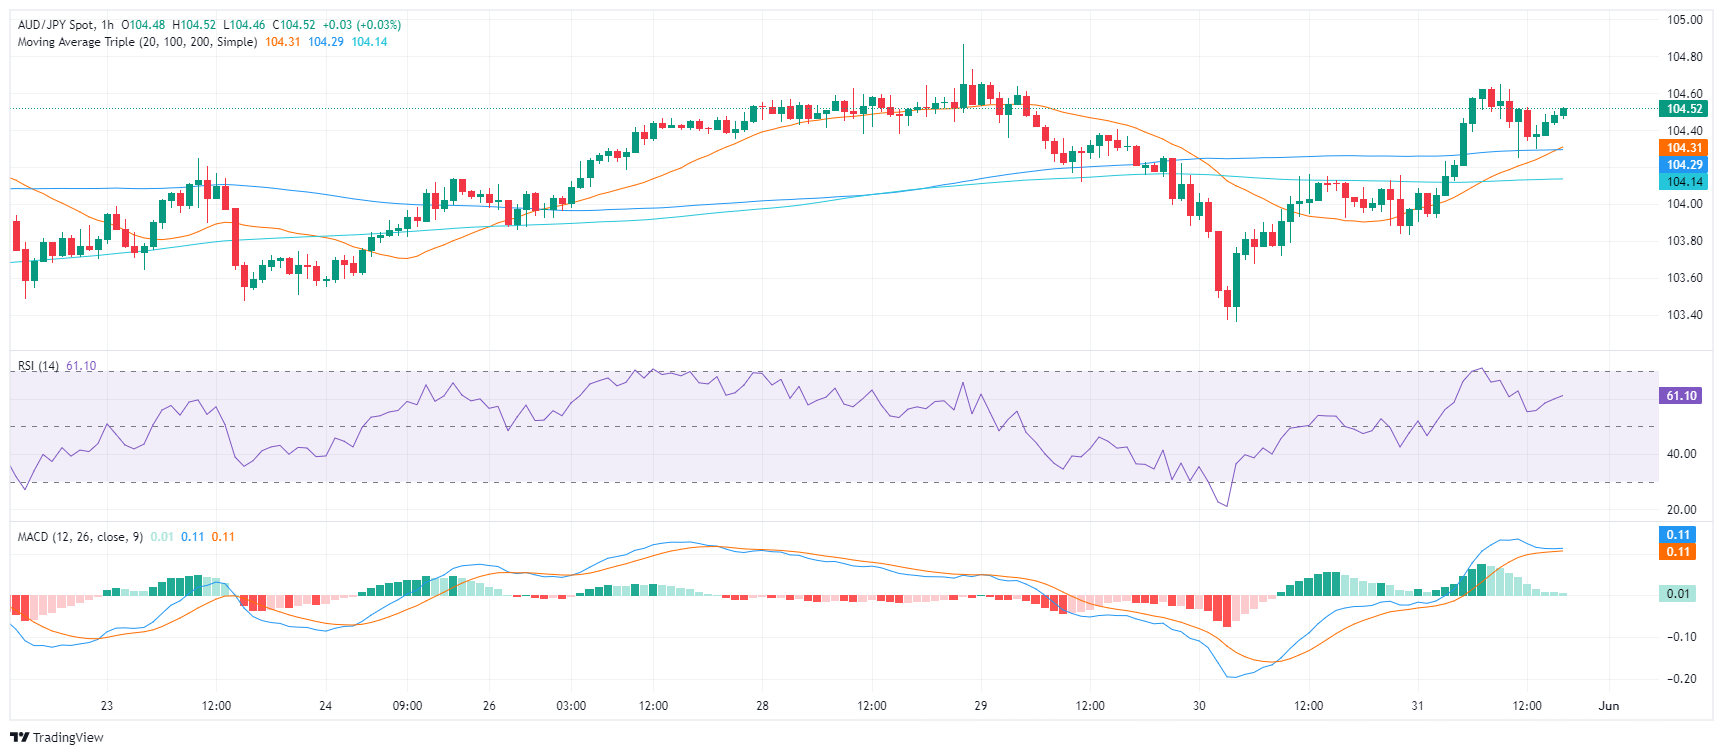
- Hourly chart indicators flatten out in positive territory, indicating consolidation after recent gains.
- The pair is seeing signs of bullish exhaustion after recent gains, with eyes set on support around the 103.60-103.80 area.
In Friday's trading session, the AUD/JPY pair soared to the 104.50 region owing to positive momentum, reinforcing expectations of an overall bullish landscape. However, the market's upward trajectory is showing signs of fatigue, and the pair has entered in a consolidation phase.
As per the daily chart, the RSI has ascended near to the 70 region, presenting a slight recovery from Wednesday's drop to 67, suggesting a potential halt to the previous downtrend. Corresponding with this, the MACD prints flat red bars, indicating a possible pause in the market's selling traction.
AUD/JPY daily chart
Confirming these dynamics is the hourly chart. The RSI and MACD are greener and have flattened, indicating a potential period of consolidation following the recent rally.
AUD/JPY hourly chart
In retrospect to the session on Thursday, sellers were repelled at the 20-day SMA mark of 103.60 and again on Friday at 103.80. These developments have set a formidable support base around that region, which appears could be leveraged to stabilize the recent gains. Any downturn below the 20-day SMA may risk undermining the short-term bullish atmosphere.
- Broad-market risk appetite recovers on Friday as US PCE inflation eases.
- Canada saw a weaker-than-expected rebound in GDP.
- US PCE inflation cooled further, fueling rate cut hopes.
The Canadian Dollar (CAD) is broadly higher on Friday, but gains are capped after softer-than-expected prints in Canadian economic data. Investor hopes for a September rate cut are riding higher after US Personal Consumption Expenditures (PCE) Price Index inflation eased faster than expected, and rate markets are once again pricing in better-than-even odds of a rate trim from the Federal Reserve (Fed).
Canada saw a slimmer rebound in quarterly Gross Domestic Product (GDP) growth than markets had anticipated, limiting overall gains for the CAD. With US inflation headlines driving broader markets, risk sentiment is on the high side to wrap up the week and investors will be pivoting to next week’s Bank of Canada (BoC) rate call, as well as a batch of US Purchasing Managers Index (PMI) prints and another Nonfarm Payrolls in the pipe for next Friday.
Daily digest market movers: Canadian Dollar bolstered by rising risk appetite tide
- Canadian Q1 GDP rebounded to its highest growth in a year, climbing 1.7% QoQ, despite missing market forecasts of 2.2%.
- The previous quarter’s GDP was also revised sharply lower to just 0.1% versus the initial print of 1.0%.
- US Core PCE Price Index inflation rose 0.2% MoM in April, below the forecast hold at 0.3%.
- US Personal Spending was sharply lower in April, printing at 0.2% versus the forecast 0.3% and even further back from the previous 0.7% (revised from 0.8%).
- According to the CME’s FedWatch Tool, rate markets are now pricing in 56% odds of at least a quarter-point rate cut from the Fed in September.
Canadian Dollar PRICE Today
The table below shows the percentage change of Canadian Dollar (CAD) against listed major currencies today. Canadian Dollar was the strongest against the Japanese Yen.
| USD | EUR | GBP | JPY | CAD | AUD | NZD | CHF | |
|---|---|---|---|---|---|---|---|---|
| USD | -0.13% | 0.02% | 0.25% | -0.38% | -0.15% | -0.36% | -0.00% | |
| EUR | 0.13% | 0.17% | 0.38% | -0.24% | -0.05% | -0.24% | 0.12% | |
| GBP | -0.02% | -0.17% | 0.22% | -0.40% | -0.21% | -0.40% | -0.05% | |
| JPY | -0.25% | -0.38% | -0.22% | -0.61% | -0.40% | -0.64% | -0.27% | |
| CAD | 0.38% | 0.24% | 0.40% | 0.61% | 0.21% | 0.01% | 0.36% | |
| AUD | 0.15% | 0.05% | 0.21% | 0.40% | -0.21% | -0.21% | 0.13% | |
| NZD | 0.36% | 0.24% | 0.40% | 0.64% | -0.01% | 0.21% | 0.35% | |
| CHF | 0.00% | -0.12% | 0.05% | 0.27% | -0.36% | -0.13% | -0.35% |
The heat map shows percentage changes of major currencies against each other. The base currency is picked from the left column, while the quote currency is picked from the top row. For example, if you pick the Canadian Dollar from the left column and move along the horizontal line to the US Dollar, the percentage change displayed in the box will represent CAD (base)/USD (quote).
Technical analysis: Canadian Dollar broadly higher but remains mired in technical congestion
The Canadian Dollar (CAD) has gained ground across the board on Friday, climbing half a percent against the Japanese Yen (JPY). The CAD is also up over a third of a percent against both the Pound Sterling (GBP) and US Dollar (USD) for the day.
USD/CAD has fallen back into the 1.3630 region as the pair hangs on the low end of a near-term congestion pattern. Shortside momentum continues to struggle to find territory near 1.3600, but bidders have been unable to drag prices back above 1.3750.
USD/CAD hourly chart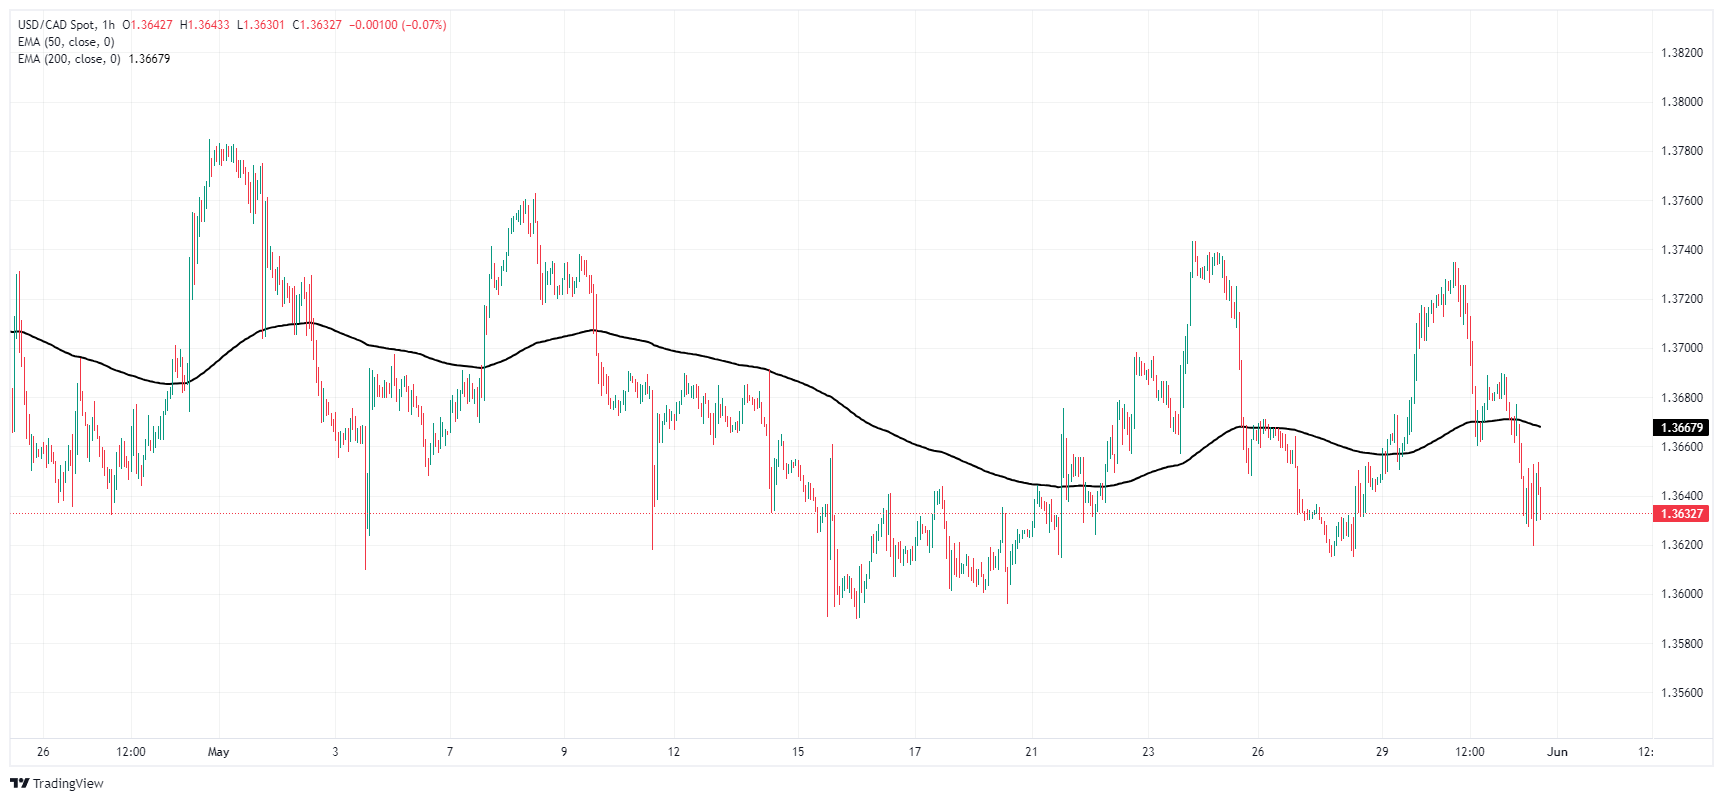
USD/CAD daily chart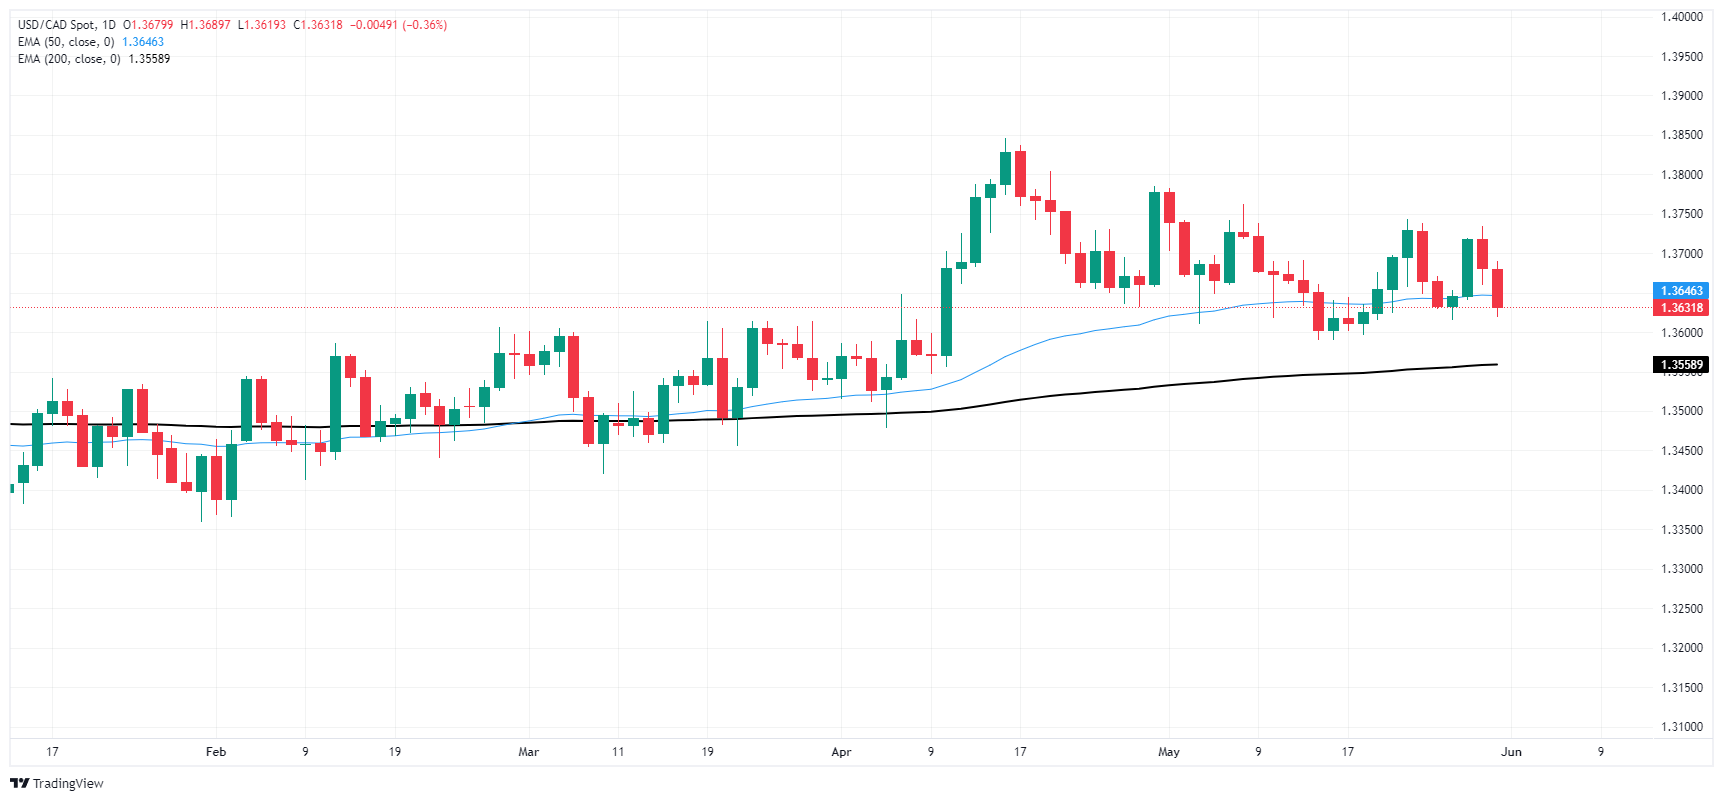
Canadian Dollar FAQs
The key factors driving the Canadian Dollar (CAD) are the level of interest rates set by the Bank of Canada (BoC), the price of Oil, Canada’s largest export, the health of its economy, inflation and the Trade Balance, which is the difference between the value of Canada’s exports versus its imports. Other factors include market sentiment – whether investors are taking on more risky assets (risk-on) or seeking safe-havens (risk-off) – with risk-on being CAD-positive. As its largest trading partner, the health of the US economy is also a key factor influencing the Canadian Dollar.
The Bank of Canada (BoC) has a significant influence on the Canadian Dollar by setting the level of interest rates that banks can lend to one another. This influences the level of interest rates for everyone. The main goal of the BoC is to maintain inflation at 1-3% by adjusting interest rates up or down. Relatively higher interest rates tend to be positive for the CAD. The Bank of Canada can also use quantitative easing and tightening to influence credit conditions, with the former CAD-negative and the latter CAD-positive.
The price of Oil is a key factor impacting the value of the Canadian Dollar. Petroleum is Canada’s biggest export, so Oil price tends to have an immediate impact on the CAD value. Generally, if Oil price rises CAD also goes up, as aggregate demand for the currency increases. The opposite is the case if the price of Oil falls. Higher Oil prices also tend to result in a greater likelihood of a positive Trade Balance, which is also supportive of the CAD.
While inflation had always traditionally been thought of as a negative factor for a currency since it lowers the value of money, the opposite has actually been the case in modern times with the relaxation of cross-border capital controls. Higher inflation tends to lead central banks to put up interest rates which attracts more capital inflows from global investors seeking a lucrative place to keep their money. This increases demand for the local currency, which in Canada’s case is the Canadian Dollar.
Macroeconomic data releases gauge the health of the economy and can have an impact on the Canadian Dollar. Indicators such as GDP, Manufacturing and Services PMIs, employment, and consumer sentiment surveys can all influence the direction of the CAD. A strong economy is good for the Canadian Dollar. Not only does it attract more foreign investment but it may encourage the Bank of Canada to put up interest rates, leading to a stronger currency. If economic data is weak, however, the CAD is likely to fall.
The Greenback traded on the back foot this week, managing to reclaim the 105.00 barrier and above when measured by the USD Index (DXY), although eventually giving away all those gains in response to the lack of any surprise from PCE data.
The US Dollar seems to have now entered a consolidative phase, always amidst alternating speculation regarding the timing of the interest rate cut by the Fed, somewhat rising yields and persevering prudence from Fed officials. A very interesting week in the US should have the labour market at the centre of the debate. That said, the final S&P Global Manufacturing PMI, Construction Spending and the ISM Manufacturing are coming on June 3. Factory Orders, the RCM/TIPP Economic Optimism Index, and JOLTs Job Openings are due on June 4. The ADP Employment Change report is due on June 5 along with the final S&P Global Services PMI and the ISM Services PMI. On June 6, the usual weekly Initial Jobless Claims and Balance of Trade results will be published, while the Nonfarm Payrolls, Unemployment Rate and Wholesale Inventories are all due on June 7.
EUR/USD traded in a volatile fashion throughout the week, although a test or surpass of the 1.0900 barrier remained elusive. On June 3, the final HCOB Manufacturing PMI is due in Germany and the broader euro bloc. June 4 will see the release of Germany’s labour market report, while the final HCOB Services PMI in Germany and the euro area are expected on June 5. On June 6 comes the salient event in the region with the ECB interest rate decision, followed by President Lagarde’s press conference and Retail Sales in the region. Germany’s Balance of Trade and another revision of Q1 GDP Growth Rate in the Euroland will close the week on June 7.
GBP/USD could not extend its recovery past the 1.2800 hurdle, ending the week with marginal losses in the low 1.2700s. The final S&P Global Manufacturing PMI is due on June 3 seconded by the BRC Retail Sales Monitor on June 4. On June 5, the final S&P Global Services PMI is due, while the S&P Global Construction PMI will be unveiled on June 6.
USD/JPY managed to maintain the bullish bias for the second week in a row after reclaiming the area beyond the 157.00 barrier. On the Japanese docket, Capital Spending is due on June 3. The usual weekly Foreign Bond Investment figures are expected on June 6, while Household Spending and the preliminary Coincident Index and Leading Economic Index are due on June7.
A volatile price action in AUD/USD left it marginally up on the weekly chart, always below the 0.6700 yardstick for the time being. The final Judo Bank Manufacturing PMI comes on June 3. The Ai group Industry Index, the final Judo Bank Services PMI, and Q1 GDP Growth Rate are all expected on June 5. On June 6 comes the Balance of Trade results seconded by Home Loans and Investment Lending for Homes.
Anticipating Economic Perspectives: Voices on the Horizon
- RBA Hauser and ECB’s Nagel speak on June 7.
Central Banks: Upcoming Meetings to Shape Monetary Policies
- The BoC and the NBP will decide on rates on June 5.
- The ECB is expected to cut its rates on June 6.
- The RBI meets on June 7.
- NZD/USD advances strongly to 0.6160 as the US Dollar slumps after US PCE Inflation grew as expected in April.
- Stubbornly elevated US inflation would dent Fed rate-cut bets for September.
- Investors shift focus to US ISM PMI and Employment data.
The NZD/USD pair soars to 0.6160 in Friday’s New York session. The Kiwi asset witnesses significant buying interest as the US Dollar weakens after the United States (US) Personal Consumption Expenditure Price Index (PCE) report for April showed that price pressures grew in-line with estimates.
Monthly and annual headline inflation grew expectedly by 0.3% and 2.7%, respectively. The core PCE inflation, which is Federal Reserve’s (Fed) preferred inflation gauge as it strips off volatile food and energy prices, rose by 0.2%, slower than the estimates and the former release of 0.3% on a month-on-month basis. However, annual core PCE Inflation rose expectedly by 2.8%.
Stubbornly elevated PCE inflation make unlikely for the Fed to start reducing interest rates from the September meeting. The scenario is generally favorable for the US Dollar, however, it is weak due to downwardly revised US Q1 Gross Domestic Product (GDP) data. Revised estimate for Q1 GDP shows that the economy expanded at a slower pace of 1.3% from the preliminary estimate of 1.6%.
The US Dollar Index (DXY), which tracks the Greenback’s value against six major currencies, is down more than 0.3% around 104.40.
Next week, investors will focus on the Manufacturing and the Services PMI, which will be published by the Institute of Supply Management (ISM) and the Nonfarm Payrolls (NFP) for May.
The New Zealand Dollar remains firm even though China’s National Bureau of Statistics (NBS) reported that the Manufacturing and Non-Manufacturing PMI for May missed estimates. In this situation, the New Zealand Dollar faces pressure, being a proxy for China’s economic prospects.
- AUD/USD is unfolding an up leg within a range which is approaching the range highs.
- If it reaches the highs the pair could reverse and begin a move south, extending the sideways trend.
- A clear breakout above the range highs or lows would be required to give the pair directionality again.
AUD/USD trades about a half of a percent higher in the 0.6660s on Friday as the pair continues rising following a bounce from the May 24 swing lows.
The pair has probably entered a sideways trend and since “the trend is your friend” this range-bound market mode is likely to extend. The range the Aussie finds itself trading in appears to have a high at the May 26 high of 0.6680 and a floor at 0.6591 (May 30 low).
AUD/USD 4-hour Chart
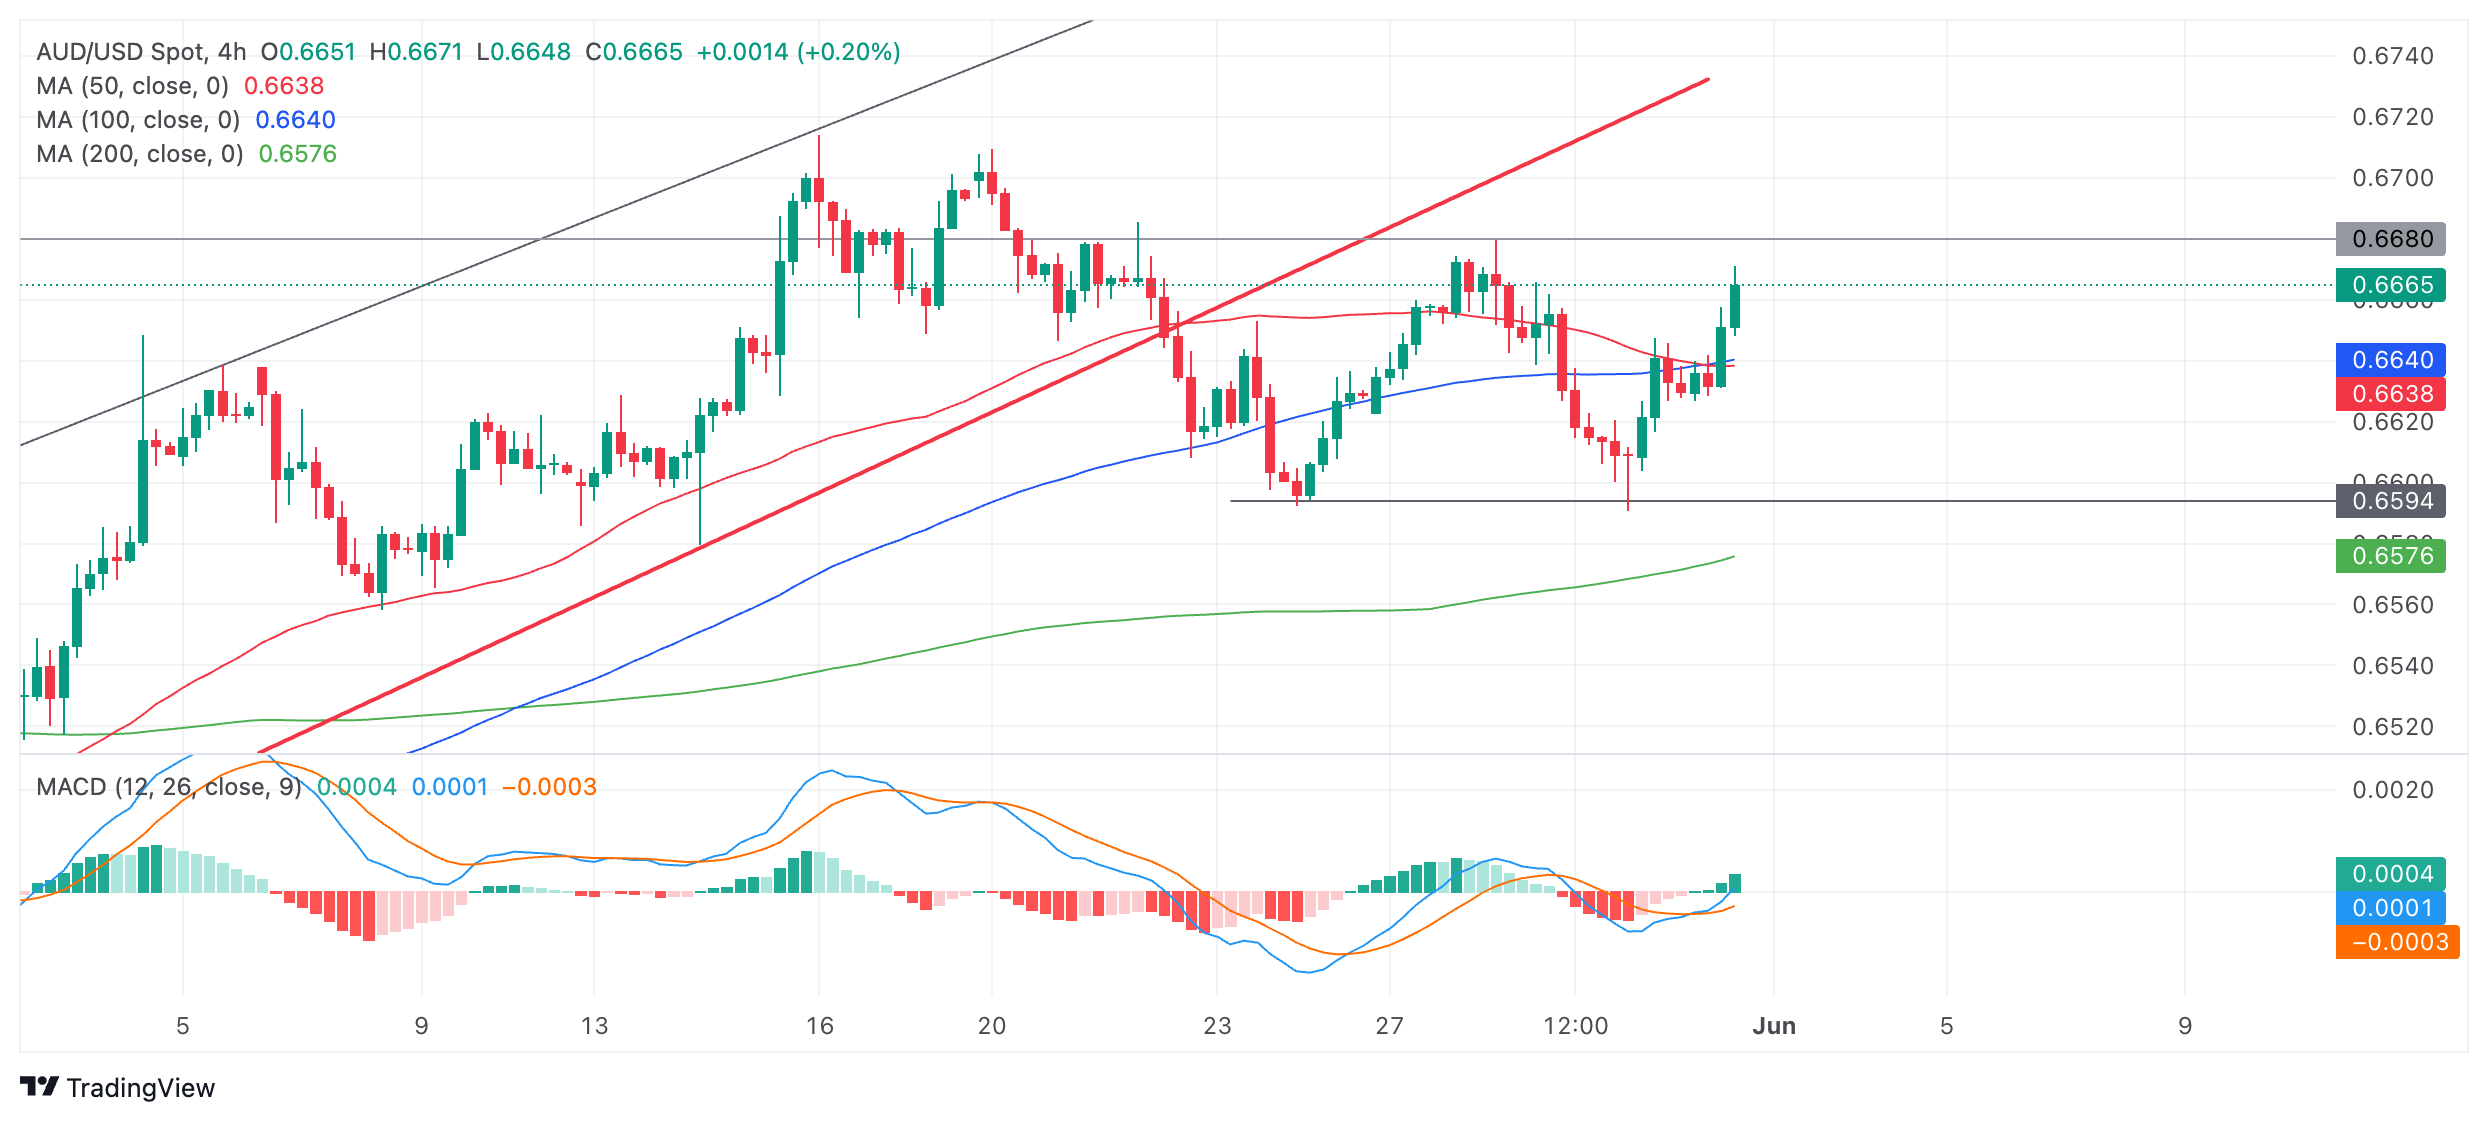
The current leg up within the range could reach the range ceiling at 0.6680 before reversing and starting a down leg to the range floor.
The Moving Average Convergence Divergence (MACD) momentum indicator has crossed above its red signal line, giving a buy signal and supporting the move higher.
If AUD/USD reaches the range highs or close to them and then rolls over and forms a Japanese candlestick reversal pattern it could be a sign the pair is extending its sideways trend and a leg down is about to begin.
A MACD cross back below the signal line – especially if in positive territory – would add further evidence to suggest a move down within the narrow range was evolving.
Failed breakdown
AUD/USD broke down from its rising channel on May 22, bringing the established uptrend into doubt. Follow-through lower was weak, however, and the pair soon found its feet. There is no clear short-term directional trend suggesting the trend may actually be sideways.
It would require a decisive break below 0.6591 to confirm more downside, with the next target probably at 0.6560 where the 100 and 50-day SMAs are located (not shown).
Alternatively, a decisive break above the range ceiling would reassert the bullish bias and probably lead to 0.6714 (May 14 high).
Decisive breaks are accompanied by long candles that break through the level and close near their high or low or three consecutive candles that pierce the level in question and are all of the same color (red for a bearish decisive break and green for bullish).
- USD/CHF took a downturn in Friday’s session, plummeting to 0.9016, after slightly rising to 0.9070 earlier in the session.
- Following US inflation figures coming in line with market expectations, markets may be anticipating a less aggressive Fed stance.
- The potential for rate cuts in September has increased slightly.
The USD/CHF pair is trading lower following the release of the latest US inflation data on Friday. This change came in despite inflation figures, signaled by the Personal Consumption Expenditures (PCE) Price Index, holding steady at 2.7% YoY in April which matched market expectations.
On the other hand, the Core PCE Price Index, excluding volatile food and energy prices, observed a 2.8% YoY rise, consistent with the analyst's estimate. What seems to be weakening the USD is the lower-than-expected monthly variation of 0.2% which was below the 0.3% expected. The odds for easing by the Federal Reserve (Fed), however, remained mostly unchanged, except for a slight increase in the likelihood of the first-rate cut occurring in September. Those probabilities remain low for June and July.
USD/CHF technical analysis
In the daily analysis, the Relative Strength Index (RSI) has plunged into negative territory, indicating a momentum shift that favors sellers for the time being. Simultaneously, the Moving Average Convergence Divergence (MACD) displays red bars, pointing toward a growing bearish momentum.
USD/CHF daily chart
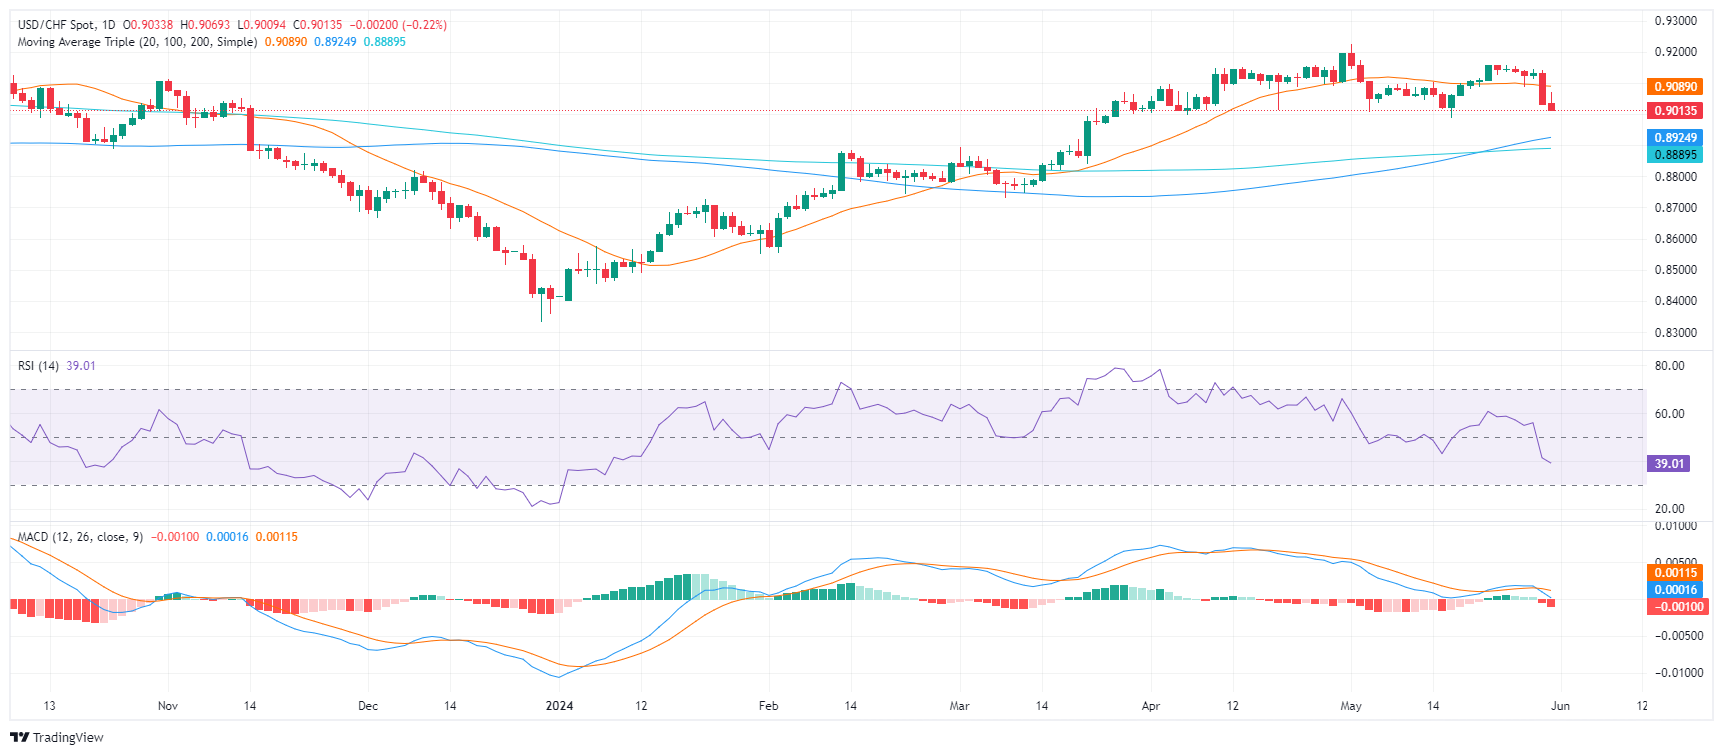
The USD/CHF seems to have lost some of its sheen from earlier in the week, when it stayed above the 20, 100, and 200-day Simple Moving Averages (SMAs). This previous positioning was a strong indicator of a bullish trend, with market dominance leaning towards buyers. However, following the recent downturn, the pair has lost its position above the 20-day SMA at 0.9095, indicating a less positive short-term outlook.
- USD/JPY is likely to remain underpinned as the Bank of Japan has few options for sustainably strengthening the Yen.
- Direct intervention is only a quick fix and needs support from higher interest rates to work sustainably.
- The pair is likely to be a Dollar-affair with any declines resulting more from USD weakness rather than JPY strength.
USD/JPY is likely to be a one-sided marriage with the US Dollar (USD) dominating the partnership, according to analysts. Any declines are likely to result from USD weakness rather than JPY strength
The Japanese authorities are being forced to take drastic measures to prop up their currency due to concerns about the negative impact of a too-weak Yen on Japanese businesses. The little strength the Yen has mustered in April and May has been due to direct intervention in the FX markets by the Bank of Japan (BoJ).
Record interventions
Data released by the BoJ this week shows it bought a record ¥9.8 trillion between April 29 and May 29 and intervened twice during this period – on April 29 and again on May 2.
USD/JPY Daily Chart
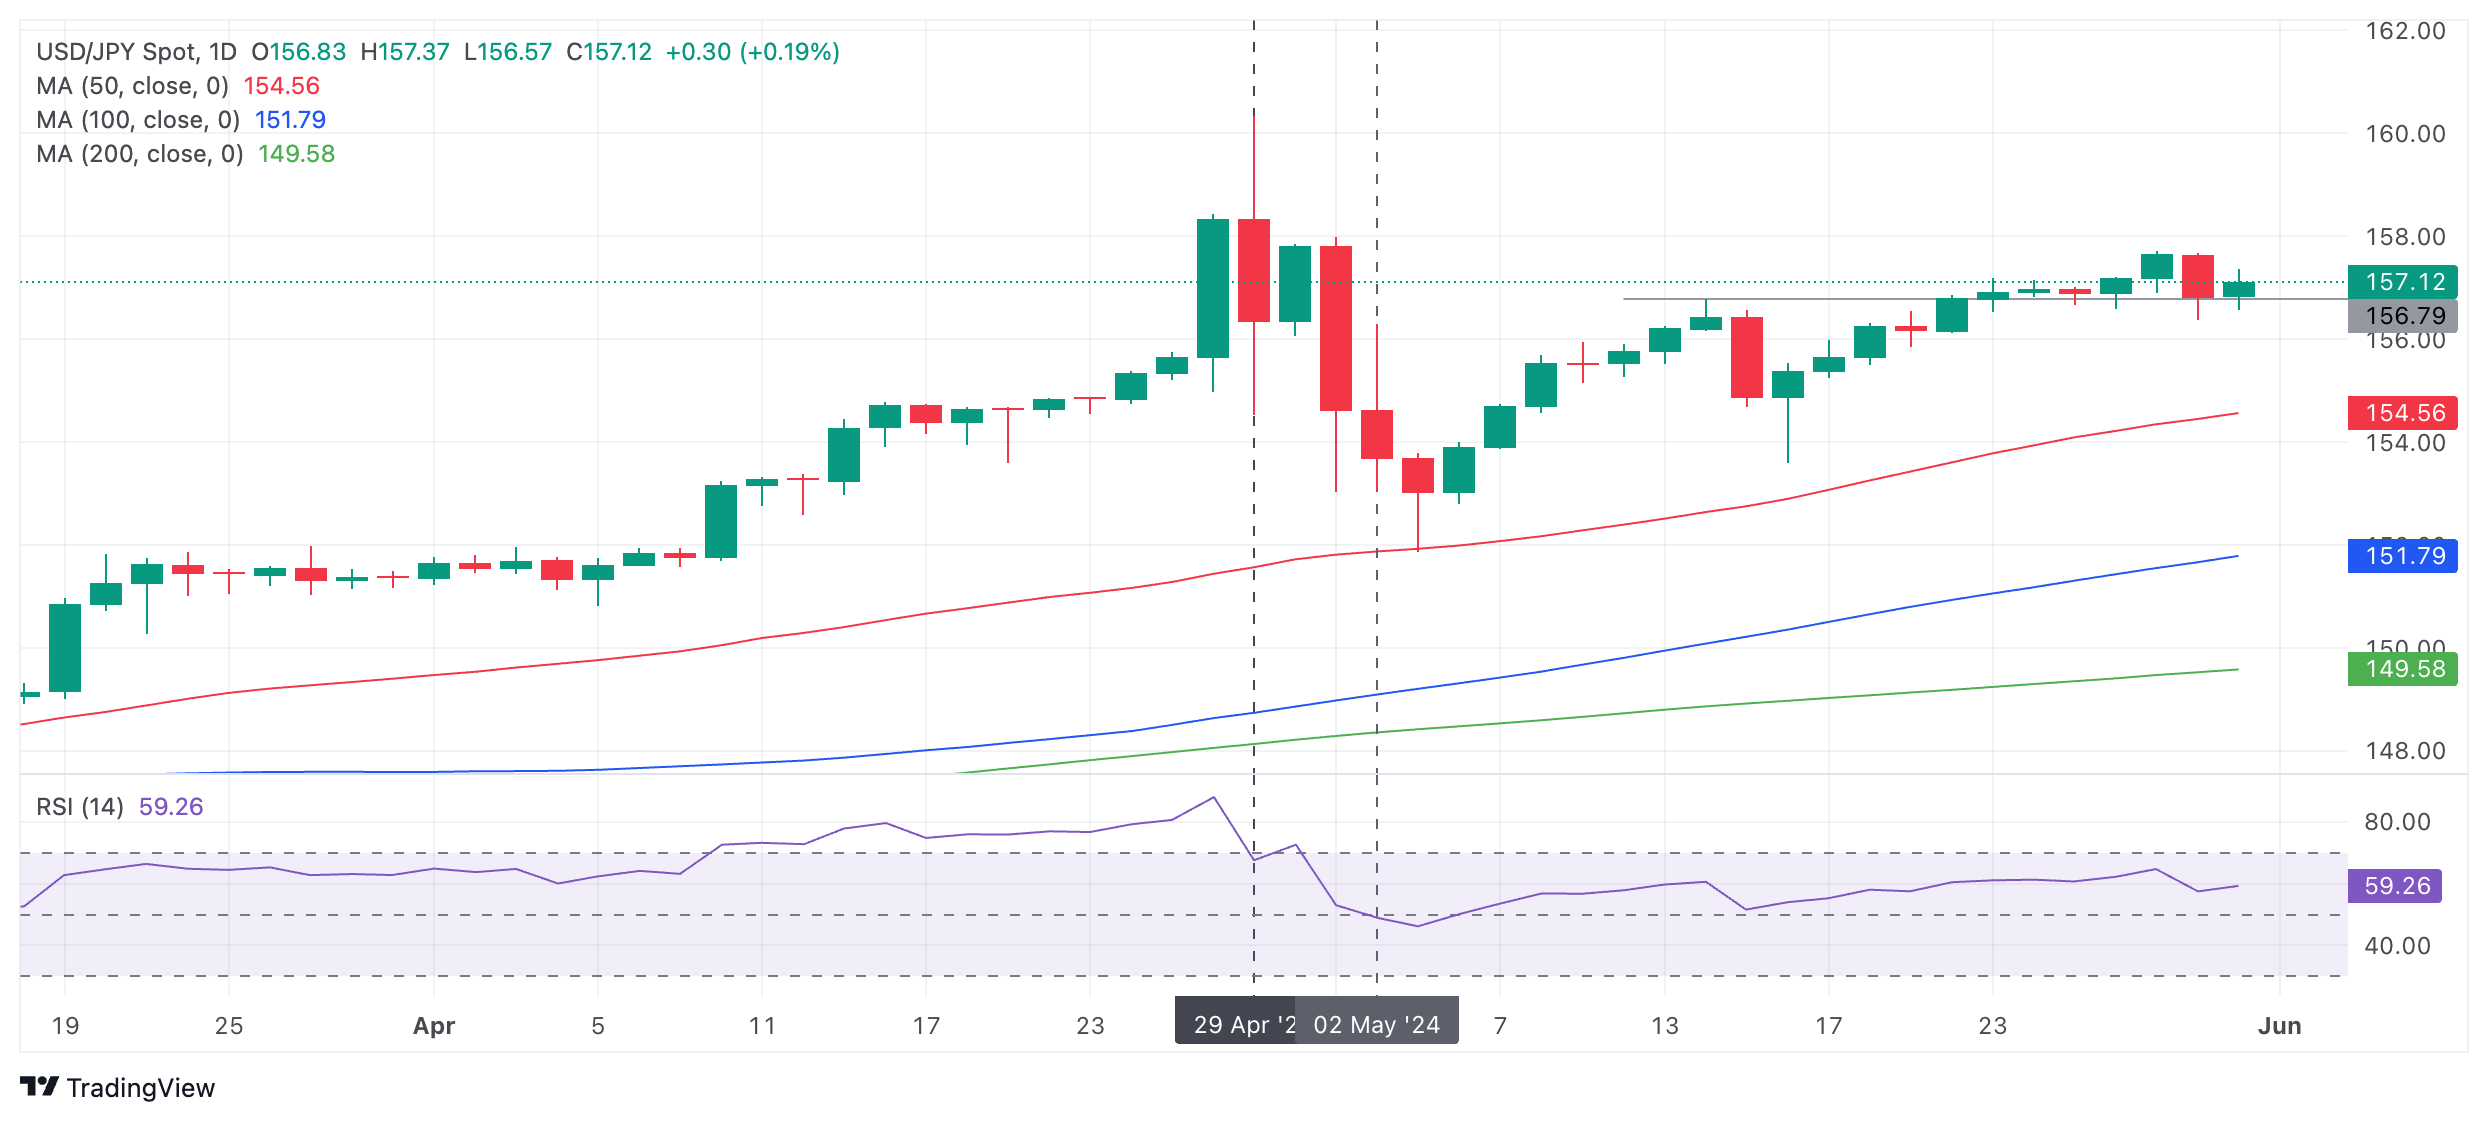
USD/JPY has steadily drifted higher since the May 3 low of 151.86 just after the BoJ’s second intervention, proving intervention only had a short-lived effect.
To be truly longlasting direct intervention would need to be coupled with tighter BoJ policy, or higher interest rates. Higher interest rates make a currency more attractive to foreign investors as a place to park their capital, attracting greater inflows.
“The second intervention drove USD/JPY from 158 down to 153, but the pair has since rebounded to trade near 157.30 currently. Until the BOJ outlines a more hawkish tightening cycle, the Yen is likely to remain weak. That said, the interventions have stabilized the yen in a 155-160 range, at least for now,” say analysts at Brown Brothers Harriman (BBH) in a note on Friday.
At between 0.0 - 0.1%, the base interest rate in Japan, set by the BoJ, is one of the lowest in the world. This explains the Yen’s persistent depreciation. Whilst inflation has risen sharply in most of the rest of the world post-Covid – resulting in most central banks putting up interest rates – in Japan this has not been the case. The result is the country’s currency has fallen like a stone.
Bank of Japan board member Adachi Seiji said this week that the BoJ could raise interest rates purely to strengthen the Yen, however, analysts say this would be a mistake.
“The rate hike could be seen as a mistake if it comes at a time when inflationary pressures are lacking and the economy is weak. The markets are already showing signs of nervousness — the implied volatility in options for the next two weeks has risen significantly as the period now includes the next Bank of Japan meeting,” says Volkmar Baur, FX Analyst at Commerzbank.
Raising interest rates too quickly could backfire on the BoJ, pushing inflation even lower and forcing them to retrace their steps, only delaying inevitable Yen weakness for later.
BoJ is running out of options
The Japanese Yen (JPY) is limited in how much it can appreciate because the economic conditions in Japan do not warrant the Bank of Japan (BoJ) raising its policy rate. The BoJ is “running out of arguments” according to Baur.
“The Bank of Japan has a problem. It continues to signal that it wants another rate hike. However, it also seems to be running low on convincing arguments. Although inflation in the Tokyo area rose in May, data released this morning showed that the increase was mainly due to higher energy prices..” says Baur in a recent note.
Although headline inflation in the Tokyo area rose in May suggesting the same for the rest of the country, core inflation in the capital (ex food and energy) actually cooled from 1.4% to 1.3%, keeping it well below the BoJ’s 2.0% inflation target.
Nor are the results of Shunto (translated as “spring wage offensive”) wage negotiations between unions and employers, scheduled for release in the Monthly Labor Survey for April next week, likely to impress markets that earnings are increasing sufficiently to drive up inflation.
“Our Chief Japan economist estimates that only around half of companies should have incorporated the Shunto revisions into actual wages as of April,” says Galina Pozdnyakova, Research Analyst at Deutsche Bank.
All-in-all the future looks bleak for the Yen and it may be that Japanese currency officials will have to rely on serendipity and the US Dollar to relieve the pressure, rather than the Japanese economy.
- USD/CAD is under pressure after US PCE Inflation and Canadian GDP report.
- Apart from soft monthly US core PCE inflation reading, other elements matched estimates.
- Canada’s Q1 GDP grew at a slower pace of 1.7% on an annualized basis.
The USD/CAD pair remains vulnerable near 1.3630 as the United States Bureau of Economic Analysis (BEA) has reported that the Personal Consumption Expenditure Price Index (PCE) report for April was broadly in line with market expectations.
The report shows that the core PCE Inflation, which is Federal Reserve’s (Fed) preferred inflation gauge, grew parallel with the estimates and the prior reading of 2.8%. On a monthly basis, the underlying inflation data rose moderately by 0.2%, from the consensus and the former release of 0.3%. A 0.2% increase in Federal Reserve’s (Fed) preferred inflation gauge is consistent with the pace required to bring inflation down to the 2% target.
However, it is unlikely to boost expectations for the Fed to begin reducing interest rates from the September meeting. The scenario is historically favorable for the US Dollar. However, the US Dollar Index (DXY), which tracks the Greenback’s value against six major currencies, fell to 104.40. The US Dollar’s appeal is already uncertain due to downwardly revised Q1 Gross Domestic Product (GDP) data.
On Thursday, the US BEA reported that the economy expanded at a slower pace of 1.3% from preliminary estimates of 1.6%.
Meanwhile, the Canadian Dollar performs relatively stronger against the US Dollar but has weakened against other major currencies due to weak GDP figures for different timeframes. Statistics Canada reported that the economy grew by 1.7% on an annualized basis, missed the estimates of 2.2% and Bank of Canada’s (BoC) forecast of 2.8%. On a monthly basis, the economy remained stagnant as expected in March.
Weak economic growth exhibits demand of more stimulus that is fulfilled by adaptation of expansionary policy stance by the central bank. This would deepen hopes of BoC initiating the policy normalization process from the June meeting.
- EUR/GBP rose sharply on Friday at 0.8531, notching a 0.26% gain.
- Inflation data from the Eurozone, both headline and core HICP, exceeded the forecasts.
- A cut in June by the ECB seems already priced in, but hot inflation figures may impact the timing of the rest of the easing cycle.
The EUR/GBP pair is riding high on robust European Union (EU) inflation data, surpassing expectations and shifting market expectations away from the dovish view of the European Central Bank (ECB).
The inflation trend witnessed in the Eurozone is a critical driver currently dominating the FX markets, overriding the ECB's dovish undertone. Spain's HICP data further influenced the pair's gains, coming in a tick higher than expected at 3.8% YoY against the previous 3.4%. Germany's Harmonised rate, too, picked up to 2.8% YoY, outpacing April's 2.4%. Similarly, the EU’s block figures rose by 2.6% YoY for headline and 2.9% for the core measure both beating expectations.
These figures indicate unanticipated inflation pressures, potentially nudging the ECB to reconsider its dovish stance. In that sense, the talk in the next sessions will be on how aggressively the bank will take the easing cycle following a 25 bps cut already priced in June.
EUR/GBP technical analysis
In the daily analysis, the Relative Strength Index (RSI) hovers in negative territory, signifying considerable seller dominance over the past sessions. Furthermore, despite a slight rise from its near-oversold condition, the RSI still lingers below 50, indicating a possible continuing downward trend. The Moving Average Convergence Divergence (MACD) histogram reveals a series of decreasing red bars, implying a consistent negative momentum and validating the current bearish market sentiment.
EUR/GBP daily chart
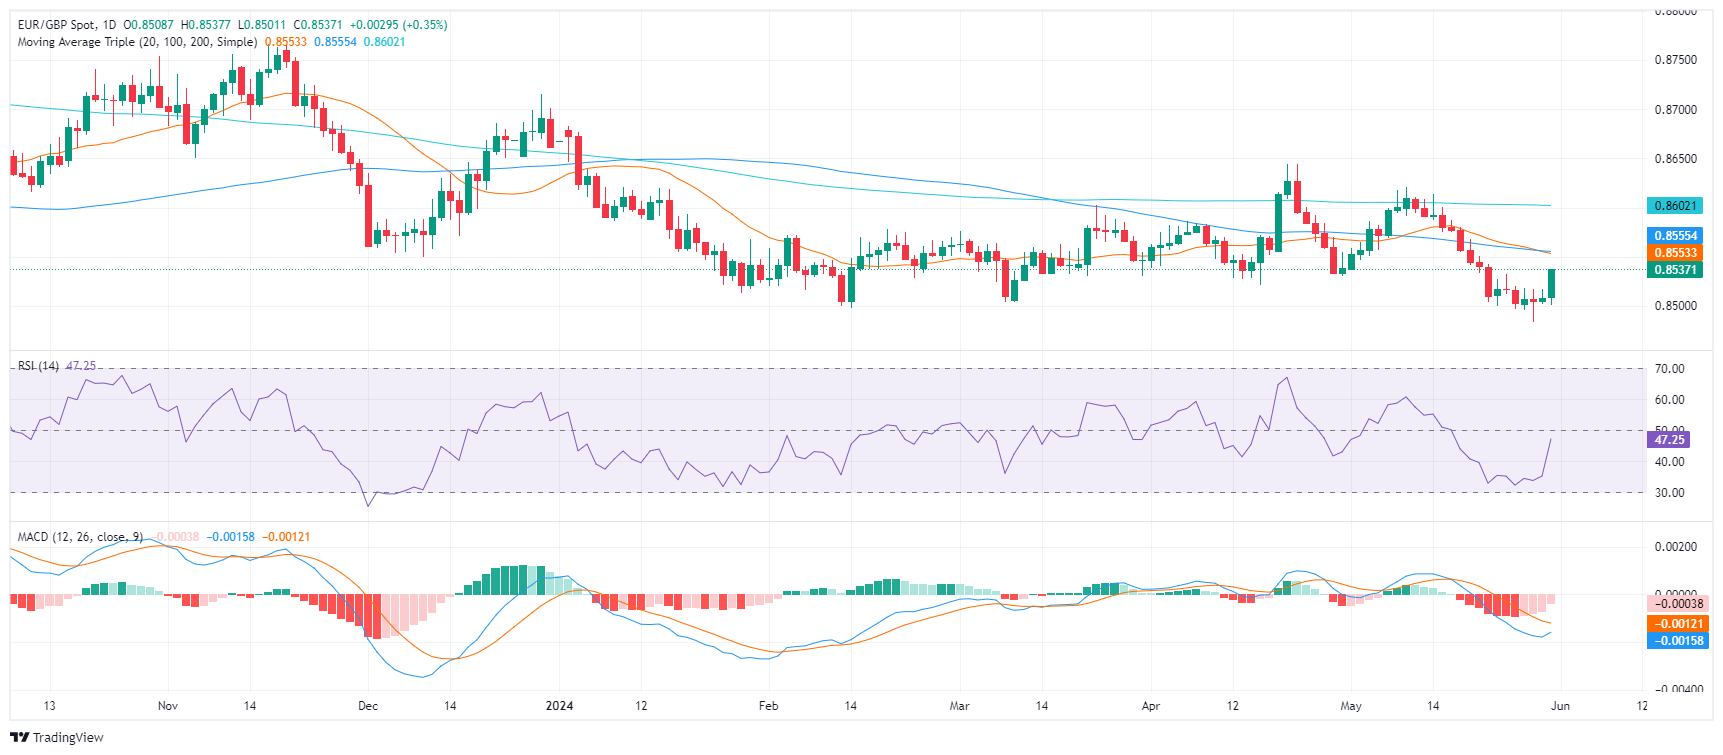
Adding to this bearish sentiment, the EUR/GBP is trading beneath three crucial Simple Moving Average (SMA) of the 20, 100, and 200-day. This positioning typically signals a bearish market condition, with further downward trends and potential additional price drops on the horizon.
- The US Dollar trades roughly flat ahead of the US session.
- Markets are digesting the conviction of former President Donald Trump.
- The US Dollar Index trades in the higher 104.00 level with 105.00 in reach.
The US Dollar (USD) trades broadly flat on Friday after it got put back to square one on Thursday amid another round of weak economic data Another red housing data point together with a softer reading on nearly all fronts in the second US Gross Domestic Product reading for the first quarter was enough to weaken the Greenback back to levels seen at the start of the week. Meanwhile, overnight former US President Donald Trump got convicted on all charges and will hear his sentence on July 11, just a few days ahead of the GOP presidential candidate nomination.
On the economic data front, all eyes are on the Personal Consumption Expenditures (PCE) Price Index numbers, which is the Federal Reserve’s (Fed) preferred inflation gauge. Markets will be able to see if the Fed is right to raise concerns or if the disinflation process is still intact towards a September initial rate cut. Besides that, there is the Chicago Purchasing Managers Index (PMI) to give further clues about the health of the economy.
Daily digest market movers: PCE make or break
- The Personal Consumption Expenditures Price Index for April is to be released at 12:30 GMT:
- The monthly Headline PCE expected to come in at 0.3%, unchanged, while the yearly headline PCE is expected to remain unchanged as well at 2.7%.
- The monthly core PCE was at 0.3% in March and is expected to come in at 0.3% as well for April. Yearly core PCE should remain unchanged at 2.8%.
- Personal Income is expected to increase 0.3%, slowing from the 0.5% a month earlier.
- Personal Spending is forecasted to slow sharply to 0.3% from 0.8%.
- The Chicago PMI for May is expected to come in at 41, still in contraction territory, though a bit better compared with the previous 37.9.
- Federal Reserve Bank of Atlanta President Raphael Bostic will close off this Friday by delivering a speech at the Augusta Technical College's spring commencement ceremony near 22:15 GMT.
- Asian equities are rallying this Friday, with the Japanese Topix leading the charge by gaining 1.7%. European equities are taking over the positive tone, though less clear, with some mild gains. US futures are lagging, though with minor losses.
- According to the CME Fedwatch Tool, Fed Fund futures pricing data suggests a 49.0% chance for keeping rates unchanged in September, against 45.1% chance for a 25 basis points (bps) rate cut and a 5.4% chance for an even 50 bps rate cut. A marginal 0.5% price in an interest rate hike.
- The benchmark 10-year US Treasury Note trades around 4.56%, and is nearly flatlining since the US session from Thursday.
US Dollar Index Technical Analysis: Going out with a bang
The US Dollar Index (DXY) is tossing a coin this Friday on which way it will go. Tensions are high with a big army of Fed officials constantly coming out, warning markets that rates will need to stay higher for longer, might even hike once more and that an initial rate cut might not even be for 2024. Meanwhile, the prepositioning patience of traders in risk-on assets is starting to run out and might spiral into equities over the summer if no clear time frame is starting to get formed on the Fed’s monetary path ahead.
On the upside, the DXY index reclaimed the key levels: the 55-day Simple Moving Average (SMA), currently at 104.98, and the 105.00 big round level. It will be important to see if these levels hold support should the US data weaken. Once that is proven, look for 105.52 and 105.88.
On the downside, the 200-day SMA at 104.43 and the 100-day SMA around 104.40 are the last line of defence. Once that level snaps, an air pocket is placed between 104.30 and 103.00. Should the US Dollar decline persist, the low of March at 102.35 and the low from December at 100.62 are levels to consider.
Inflation FAQs
Inflation measures the rise in the price of a representative basket of goods and services. Headline inflation is usually expressed as a percentage change on a month-on-month (MoM) and year-on-year (YoY) basis. Core inflation excludes more volatile elements such as food and fuel which can fluctuate because of geopolitical and seasonal factors. Core inflation is the figure economists focus on and is the level targeted by central banks, which are mandated to keep inflation at a manageable level, usually around 2%.
The Consumer Price Index (CPI) measures the change in prices of a basket of goods and services over a period of time. It is usually expressed as a percentage change on a month-on-month (MoM) and year-on-year (YoY) basis. Core CPI is the figure targeted by central banks as it excludes volatile food and fuel inputs. When Core CPI rises above 2% it usually results in higher interest rates and vice versa when it falls below 2%. Since higher interest rates are positive for a currency, higher inflation usually results in a stronger currency. The opposite is true when inflation falls.
Although it may seem counter-intuitive, high inflation in a country pushes up the value of its currency and vice versa for lower inflation. This is because the central bank will normally raise interest rates to combat the higher inflation, which attract more global capital inflows from investors looking for a lucrative place to park their money.
Formerly, Gold was the asset investors turned to in times of high inflation because it preserved its value, and whilst investors will often still buy Gold for its safe-haven properties in times of extreme market turmoil, this is not the case most of the time. This is because when inflation is high, central banks will put up interest rates to combat it. Higher interest rates are negative for Gold because they increase the opportunity-cost of holding Gold vis-a-vis an interest-bearing asset or placing the money in a cash deposit account. On the flipside, lower inflation tends to be positive for Gold as it brings interest rates down, making the bright metal a more viable investment alternative.
- Silver is consolidating within a short-term uptrend.
- The odds favor an eventual resumption of the bullish trend to the next upside target.
- Heavy-duty support at around $30.00 could provide a springboard for reversal higher.
Silver (XAG/USD) is consolidating within a short-term uptrend. Although it is currently pulling back it will probably find support and eventually resume its uptrend.
Silver 4-hour Chart
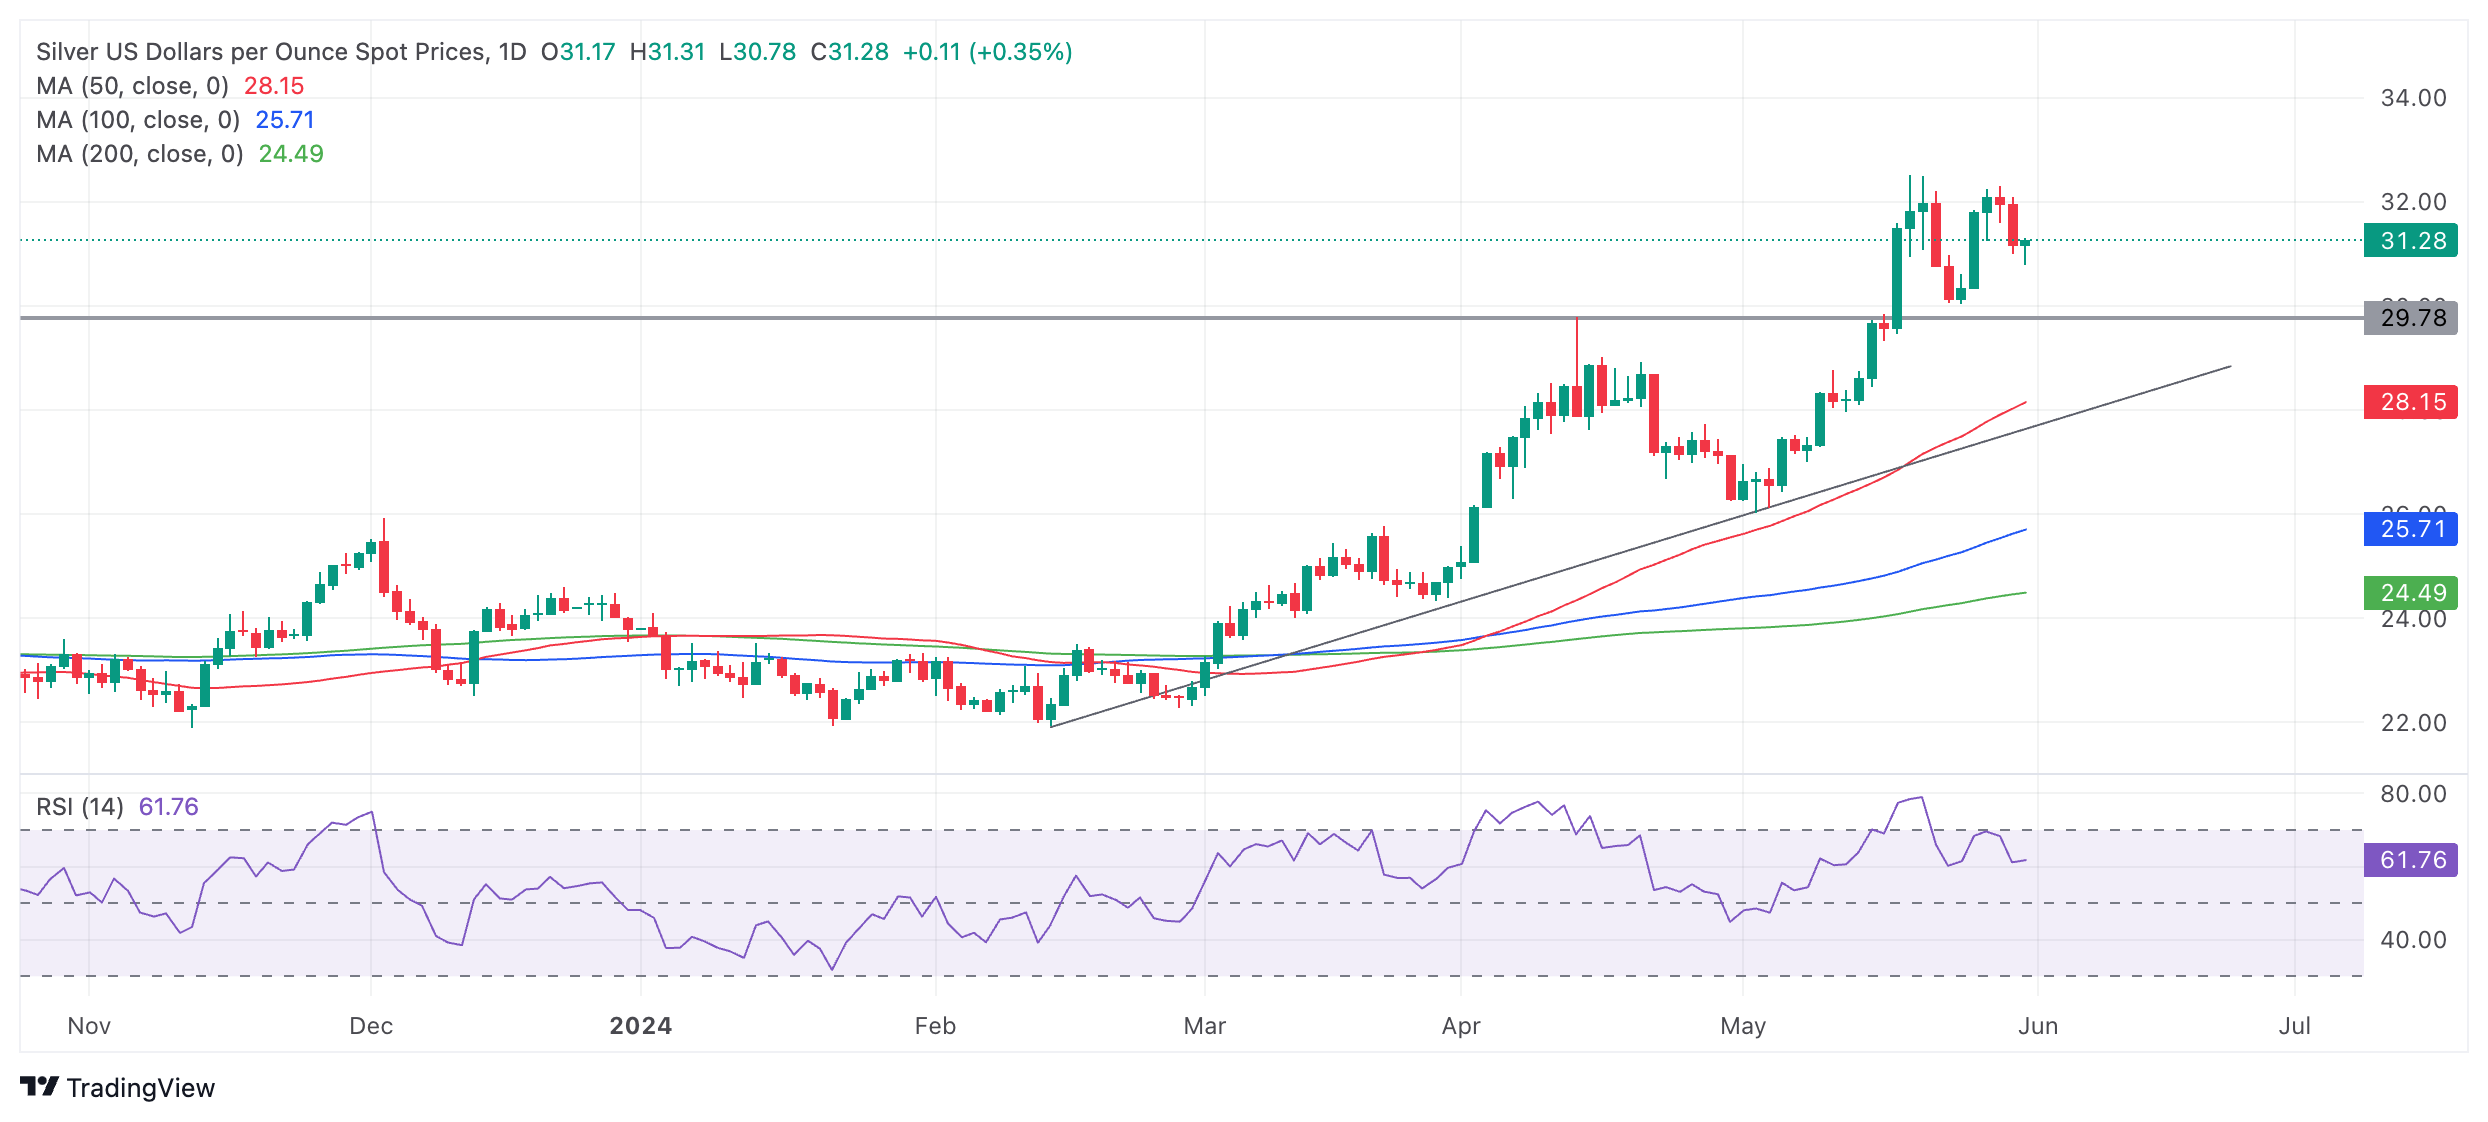
Despite recent oscillations between the $32s and $30s Silver’s overall short-term bias is bullish and given the saying “the trend is your friend” this favors long positions over shorts.
That said, in the very near term Silver could pull back down to support at around the $30.00 level – the highs of a four-year-long consolidation range.
Silver will probably recover eventually and climb back up to retouch the $32.51 high. If it surpasses that, it is likely to stretch up to the next target at $35.30 (October 2012 high).
It would require a decisive break below the $30.00 level to bring into doubt the dominant uptrend.
A decisive break would be one accompanied by a long red candlestick that closed near its lows or three red candlesticks in a row.
- The Mexican Peso is trading little changed on Friday as investors await key event risk on the horizon.
- Friday sees the release of US PCE inflation data, and Mexico will vote for a new President on Sunday.
- USD/MXN pulls back within a strong short-term uptrend.
The Mexican Peso (MXN) trades mixed in its most heavily traded pairs on Friday as market sentiment stabilizes ahead of key event risk. In the US, the release of Core Personal Consumption Expenditure (PCE) data for April could give clues about the future path of US interest rates and impact the US Dollar (USD). In Mexico, voters await the outcome of the next Mexican presidential elections on Sunday.
USD/MXN is exchanging hands at 17.02 at the time of writing, EUR/MXN is trading at 18.46 and GBP/MXN at 21.64.
Mexican Peso steady ahead of key event risk
The Mexican Peso seesaws between tepid losses ahead of the US PCE data for April set to be released on Friday. The data could impact interest-rate expectations in the US and, given that the difference between interest rates in Mexico and the US is a key driver of USD/MXN, the outcome could impact the Peso.
Core PCE is the Federal Reserve’s (Fed) preferred gauge of inflation so it tends to carry more heft in terms of influencing its policy direction. A higher-than-expected result could see planned interest-rate cuts further delayed, supporting the USD, whilst the opposite for a lower-than-forecast reading.
The chance of a surprise result is low, according to analysts who point out that the release is quite predictable, as it comes after the CPI and PPI releases for the same month. That said, small deviations from expectations could still generate volatility.
Interest-rate differential to narrow
The Mexican Peso’s long-term uptrend has been driven by the higher interest rates (11.0%) in Mexico compared to its major counterparts.
Although the Bank of Mexico (Banxico) lowered interest rates by 0.25% in March, stubbornly high inflation prevented it from doing the same in May. According to analysts at Rabobank, however, interest rates in Mexico are set to fall, narrowing the gap between with other countries. This, in turn, is likely to have a depreciating effect on the Mexican Peso because demand from foreign investors seeking a lucrative place to park their capital will fall.
“We maintain the view that we are at the peak of MXN strength and will see a move back above 16.8 in the coming months as the rate differential converges,” Rabobank said in a note on May 28.
Mexican presidential election
The Mexican presidential election on Sunday is likely to see Claudia Shienbaum, the candidate for the Morena party, replace Andres Manuel Lopez Obrador (AMLO) as president of Mexico. Shienbaum leads the next most popular candidate by 20% in the polls.
Her tenure is likely to see an extension of Obrador’s generous welfare programme, and she has pledged to increase the minimum wage by circa 11%. This is likely to boost consumer spending, a key driver of growth in recent quarters, but could make it difficult for Banxico to bring down inflation, says Kimberley Sperrfechter, Emerging Markets Economist at Capital Economics.
Threat of being trumped
Despite Donald Trump being convicted of 34 counts of falsifying business records, he still stands a chance of being re-elected in November. Indeed, his conviction has galvanized support for the embattled nominee from within the ranks of the Republican party and led to a flood of donations to his election campaign fund, according to AP News.
The US and Mexican trade agreement (USMCA) is up for review in 2026, and there is a risk that Trump, if re-elected, might reintroduce tariffs on Mexican goods. Such a move would also hamper Mexico’s near-shoring prospects.
For this reason, Sperrfechter thinks that the Peso’s “period of outperformance has largely run its course” and expects the currency to substantially weaken to $19-$20 during the next (Mexican) president’s tenure.
Technical Analysis: USD/MXN pulls back within uptrend
USD/MXN – or the number of Pesos that can be bought with one US Dollar – pulls back and then recovers in a short-term uptrend. Given that “the trend is your friend”, the odds favor a continuation higher.
USD/MXN 4-hour Chart
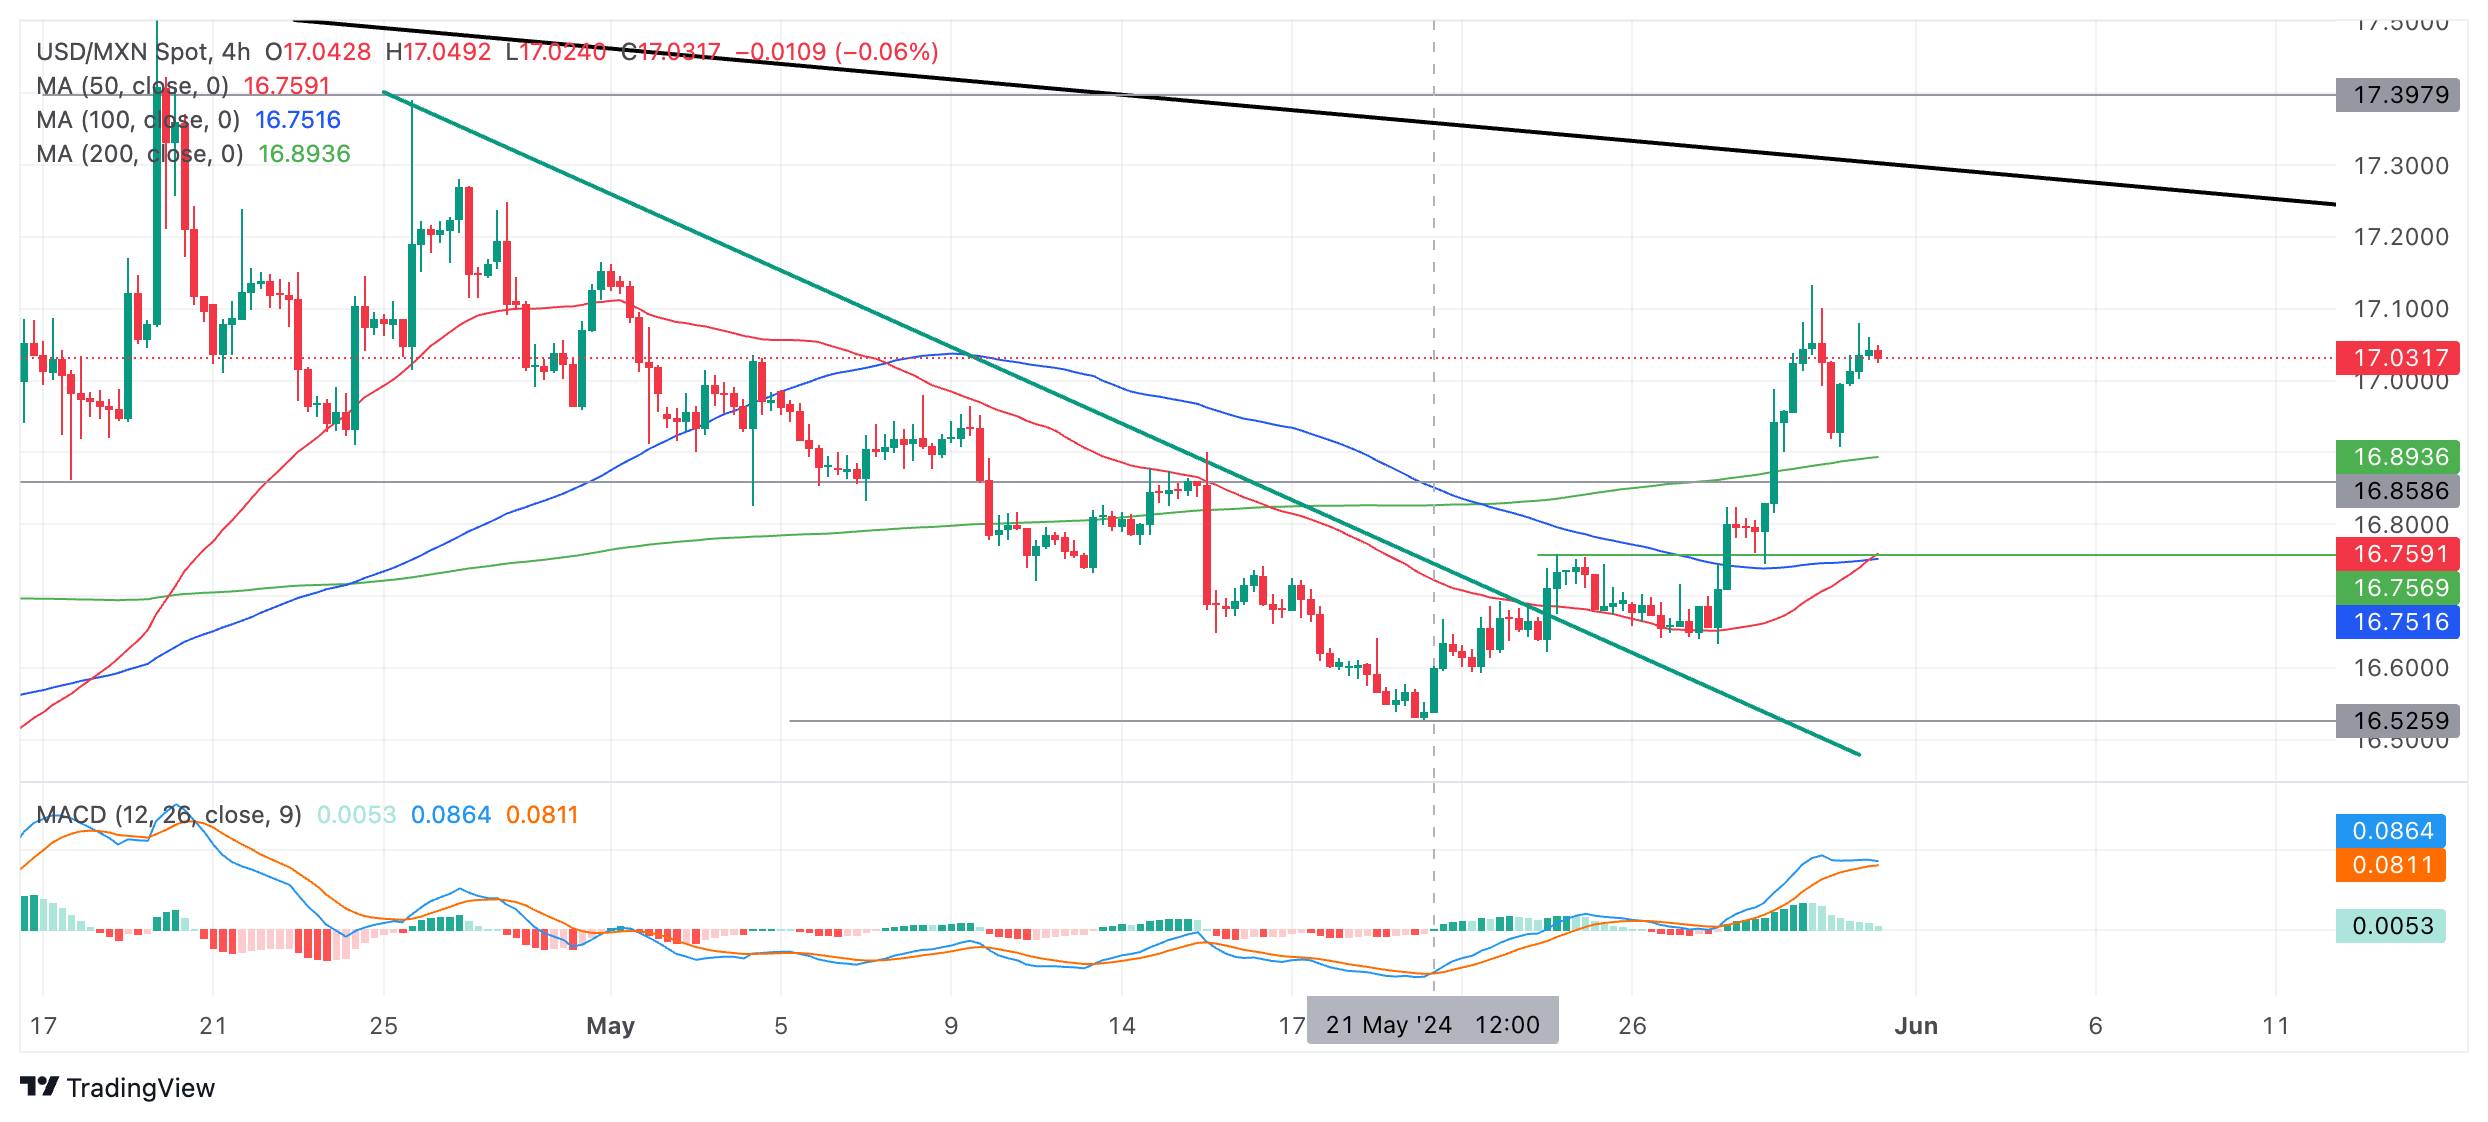
USD/MXN now sets its sights on the major trendline (black) at circa 17.25. A break above the May 30 high at 17.13 would probably confirm an extension towards the trendline target.
The medium and long-term trends remain bearish, however, raising the risk that the pair could reverse lower. As yet, there are no signs of weakness from price action, however. A decisive break above the major trendline would solidify the bullish case and indicate a bullish reversal of the medium-term.
A decisive break would be one accompanied by a long green bar that closed near its high or three consecutive green bars in a row.
Economic Indicator
Personal Consumption Expenditures - Price Index (YoY)
The Personal Consumption Expenditures (PCE), released by the US Bureau of Economic Analysis on a monthly basis, measures the changes in the prices of goods and services purchased by consumers in the United States (US). The YoY reading compares prices in the reference month to a year earlier. Price changes may cause consumers to switch from buying one good to another and the PCE Deflator can account for such substitutions. This makes it the preferred measure of inflation for the Federal Reserve. Generally, a high reading is bullish for the US Dollar (USD), while a low reading is bearish.
Read more.Next release: Fri May 31, 2024 12:30
Frequency: Monthly
Consensus: 2.7%
Previous: 2.7%
Source: US Bureau of Economic Analysis
- Oil flirts with a third consecutive decline ahead of Sunday’s OPEC+ meeting on Sunday.
- OPEC+ will convene online to decide on production cuts, with most analysts expecting current cuts to extend into 2025.
- The US Dollar Index trades just below 105.00 ahead of closing a volatile week driven by bonds and macroeconomic data.
Oil prices are hovering below $78 on Friday, failing to recover from the near 3% decline in just two trading days. For the week, Crude’s performance is broadly flat and could still eke out a gain ahead of the OPEC+ meeting, which will take place on Sunday. The biggest headline ahead of the meeting is that possibly the current production cuts in place might be prolonged even into 2025, as a measure to keep Oil prices near $80.
Meanwhile, the US Dollar Index (DXY) has had a volatile week and is trading just below 105.00. The Greenback roared on Wednesday, when bond traders pushed yields higher across the board during some chunky US sovereign debt bond auctions by demanding a higher yield for the offered debt issuances. However, the move got erased on Thursday with both softer US housing data and the Gross Domestic Product data release. On Friday, the US Personal Consumption Expenditure (PCE) Price Index report might be the judge that decides if the DXY closes above or below 105.00 this week.
At the time of writing, Crude Oil (WTI) trades at $77.60 and Brent Crude at $81.79
Oil news and market movers: OPEC+ headlines buzzing
- OPEC+ meeting on Sunday will be an online meeting. Here are some key takeaways ahead of the meeting:
- Iran, Libya and Venezuela are exempt from production cuts because their output is constrained by external factors such as sanctions or war.
- Both Bloomberg and Reuters have reported plans to keep production cuts in place heading into 2025, according to sources close to the matter.
- United Arab Emirates and Kazakhstan are set to jack up their production in the near future with new installations and production sites set to come online.
- Traders keep pointing to the uncertain US economic outlook with an unclear monetary policy ahead, while the US housing market is showing signs of a cooldown.
- This Friday closes off with the weekly Baker Hughes Oil Rig Count data at 17:00 GMT. The previous number was a count of 497.
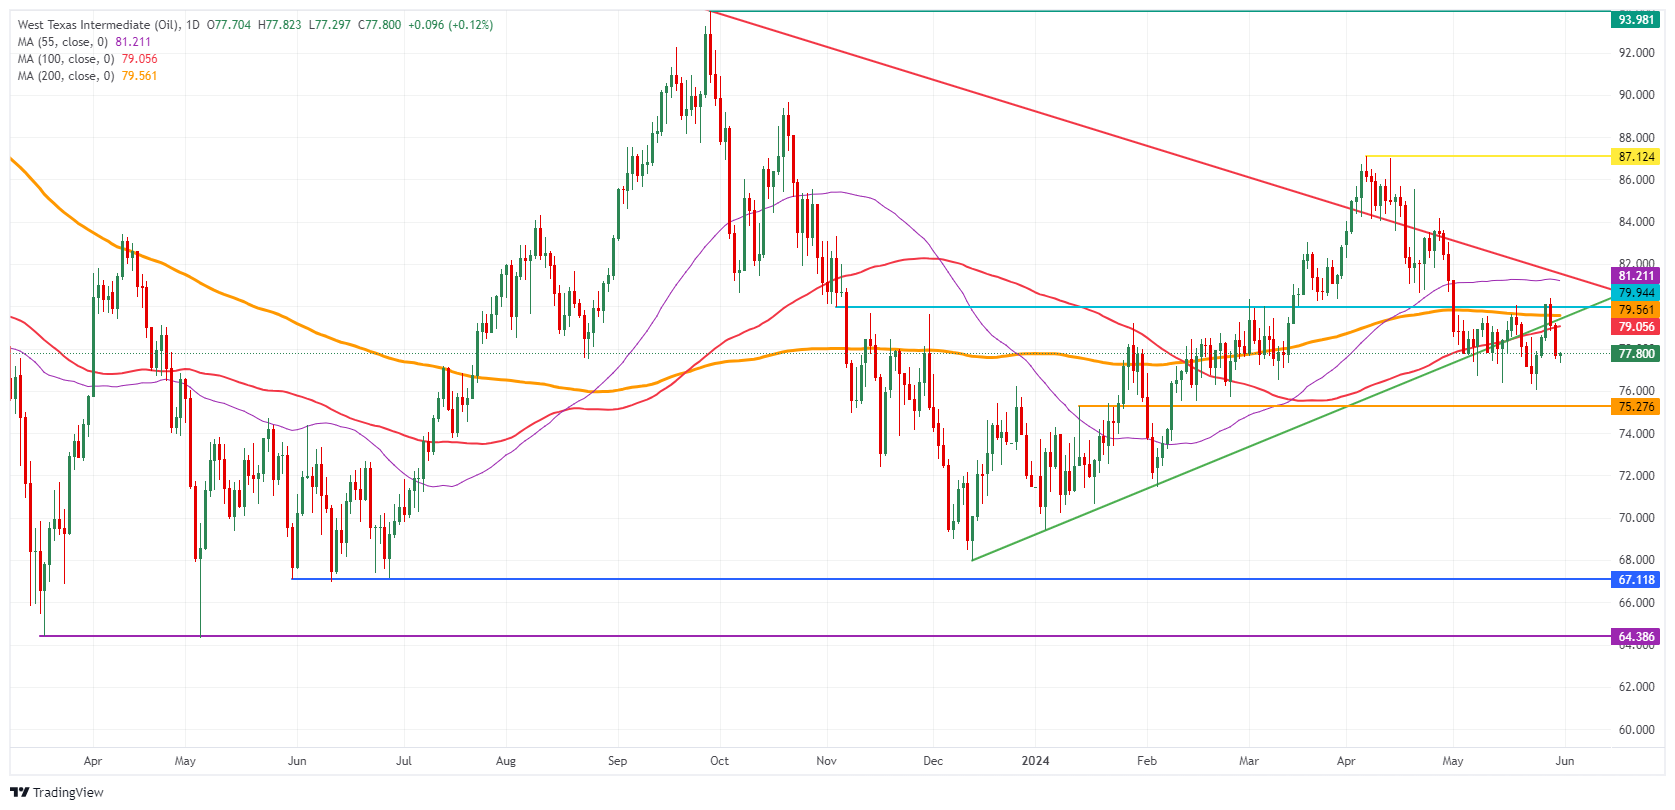
Oil Technical Analysis: What else can be done
Oil prices are showing again their sensitive side, while traders clearly see no confirmation of a pickup in demand on the horizon soon. The Fed has been clearly saying these past two weeks that chances of an initial rate cut for 2024 starts to look bleak. Not much OPEC+ can do against that, and prolonging production cuts into 2025 couldn’t be enough to order the deficit between current supply levels and the sluggish demand outlook.
First, the Simple Moving Averages (SMA) need to be regained under control. The 100-day SMA at $79.05 and the 200-day SMA at $79.56 are the first levels on the upside. Next, the 55-day Simple Moving Average (SMA) at $81.22 and the descending trendline at $81.75 are an area with a lot of resistance where any recovery rally could pause. Once broken through there, the road looks quite open to head to $87.12.
On the downside, the $76.00 marker is coming back into focus with the $75.27 level playing a crucial role if traders still want to have an option to head back to $80.00. Should that $75.27 pivotal level snap, expect to see a risk-full nosedive move that could sprint all the way down to $68, below $70.00.
US WTI Crude Oil: Daily Chart
WTI Oil FAQs
WTI Oil is a type of Crude Oil sold on international markets. The WTI stands for West Texas Intermediate, one of three major types including Brent and Dubai Crude. WTI is also referred to as “light” and “sweet” because of its relatively low gravity and sulfur content respectively. It is considered a high quality Oil that is easily refined. It is sourced in the United States and distributed via the Cushing hub, which is considered “The Pipeline Crossroads of the World”. It is a benchmark for the Oil market and WTI price is frequently quoted in the media.
Like all assets, supply and demand are the key drivers of WTI Oil price. As such, global growth can be a driver of increased demand and vice versa for weak global growth. Political instability, wars, and sanctions can disrupt supply and impact prices. The decisions of OPEC, a group of major Oil-producing countries, is another key driver of price. The value of the US Dollar influences the price of WTI Crude Oil, since Oil is predominantly traded in US Dollars, thus a weaker US Dollar can make Oil more affordable and vice versa.
The weekly Oil inventory reports published by the American Petroleum Institute (API) and the Energy Information Agency (EIA) impact the price of WTI Oil. Changes in inventories reflect fluctuating supply and demand. If the data shows a drop in inventories it can indicate increased demand, pushing up Oil price. Higher inventories can reflect increased supply, pushing down prices. API’s report is published every Tuesday and EIA’s the day after. Their results are usually similar, falling within 1% of each other 75% of the time. The EIA data is considered more reliable, since it is a government agency.
OPEC (Organization of the Petroleum Exporting Countries) is a group of 13 Oil-producing nations who collectively decide production quotas for member countries at twice-yearly meetings. Their decisions often impact WTI Oil prices. When OPEC decides to lower quotas, it can tighten supply, pushing up Oil prices. When OPEC increases production, it has the opposite effect. OPEC+ refers to an expanded group that includes ten extra non-OPEC members, the most notable of which is Russia.
- AUD/USD jumps to near 0.6650 ahead of US core PCE Inflation data.
- The US Dollar weakens as a downwardly revised Q1 GDP keeps hopes of the Fed cutting rates at least once this year on the table.
- Australia’s hot CPI report for April pushes back RBA’s rate-cut prospects.
The AUD/USD pair climbs to near 0.6650 in Friday’s London session. The Aussie asset strengthens as the US Dollar weakens ahead of United States core Personal Consumption Expenditure Price Index (PCE) data for April, which will be published at 12:30 GMT.
The US core PCE Inflation will provide cues about when the Federal Reserve (Fed) will start reducing interest rates. Currently, financial markets are mixed about September’s policy meeting.
Economists expect that core PCE inflation rose steadily by 0.3% and 2.8% monthly and annually, respectively.
The US Dollar Index (DXY) seems vulnerable near day’s low around 104.65. The near-term outlook of the US Dollar turned uncertain after US Bureau of Economic Analysis (BEA) reported its second estimates report for Q1 Gross Domestic Product (GDP) that the economy expanded at a slower pace of 1.3% due to lower consumer spendings from the preliminary estimates of 1.6%.
Meanwhile, the Australian Dollar’s appeal is upbeat as hot monthly Consumer Price Index (CPI) data for April has forced traders to pare Reserve Bank of Australia’s (RBA) early rate-cut bets. Annually, price pressures rose at a higher pace of 3.6% than estimates of 3.5% and the former reading of 3.4%.
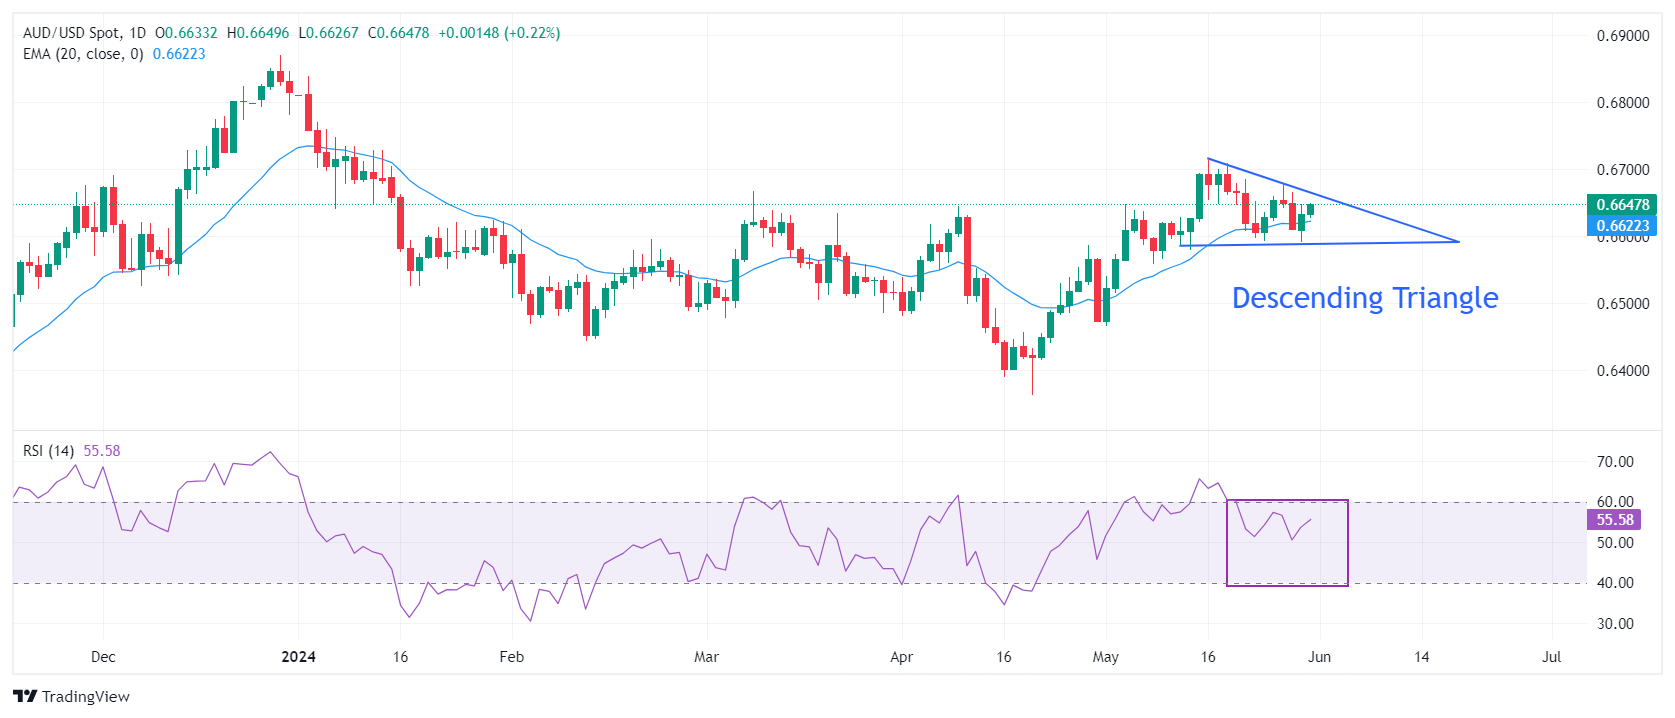
AUD/USD advances toward the downward-sloping border of the Descending Triangle chart pattern, which is plotted from May 16 high at 0.6714, formed on a daily timeframe. The horizontal support of the above-mentioned chart formation is marked from May 13 low at 0.6586.
Upward-sloping 20-day Exponential Moving Average (EMA) near 0.6620 suggests that the near-term trend is bullish.
The 14-period Relative Strength Index (RSI) oscillates in the 40.00-60.00 range, indicating a sharp volatility contraction.
Going forward, a decisive move above May’s high at 0.6714 will drive the asset towards January 3 high at 0.6771 and the round-level resistance of 0.6800.
Alternatively, a downside move would appear if the major breaks below May 14 low at 0.6580, which will expose it to May 1 high at 0.6540, followed by the psychological support of 0.6500.
AUD/USD daily chart
- USD/CAD falls further to 1.3650 as the US Dollar falls back ahead of the US core PCE Price Index.
- Downwardly revised US Q1 GDP growth has kept hopes of the Fed cutting interest rates at least once this year alive.
- The Canadian economy is forecasted to have remained stagnant in March.
The USD/CAD pair extends its downside to 1.3650 in Friday’s European session. The Loonie asset comes under pressure as the US Dollar struggles to gain ground despite uncertainty ahead of the United States core Personal Consumption Expenditure Price Index (PCE) data for April, which will be published at 12:30 GMT.
Economists expect that the core PCE inflation rose steadily by 0.3% and 2.8% on a monthly and an annual basis, respectively. Hot or expected inflation reading would weaken the case of Federal Reserve (Fed) lowering interest rates from the September meeting. The scenario would be favorable for the US Dollar and bond yields. While soft numbers will do the opposite.
The US Dollar Index (DXY), which tracks the Greenback’s value against six major currencies, is subdued around 104.75. The USD Index came under pressure after downwardly revised Q1 Gross Domestic Product (GDP) estimate boosts hopes that the Fed will reduce interest rates at least once this year. US Bureau of Economic Analysis (BEA) reported that the economy expanded at a slower pace of 1.3% due to lower consumer spendings from the preliminary estimates of 1.6%.
Meanwhile, the market sentiment is broadly risk-averse as China’s weak Manufacturing and Non-Manufacturing PMI data has raised concerns over global economic prospects. S&P 500 futures have posted some losses in the European session.
In the neighbour nation, the Canadian Dollar will dance to the tunes of the monthly and Q1 GDP data, which will be published at 12:30 GMT. The Canadian economy is projected to have remained stagnant in March after expanding 0.2% in February. Weak GDP data would boost expectations for the Bank of Canada (BoC) to begin reducing interest rates from the June meeting.
Silver prices (XAG/USD) rose on Friday, according to FXStreet data. Silver trades at $31.23 per troy ounce, up 0.20% from the $31.17 it cost on Thursday.
Silver prices have increased by 22.61% since the beginning of the year.
| Unit measure | Today Price |
|---|---|
| Silver price per troy ounce | $31.23 |
| Silver price per gram | $1.00 |
The Gold/Silver ratio, which shows the number of troy ounces of Silver needed to equal the value of one troy ounce of Gold, stood at 75.06 on Friday, down from 75.19 on Thursday.
Investors might use this ratio to determine the relative valuation of Gold and Silver. Some may consider a high ratio as an indicator that Silver is undervalued – or Gold is overvalued – and might buy Silver or sell Gold accordingly. Conversely, a low ratio might suggest that Gold is undervalued relative to Silver.
Silver FAQs
Silver is a precious metal highly traded among investors. It has been historically used as a store of value and a medium of exchange. Although less popular than Gold, traders may turn to Silver to diversify their investment portfolio, for its intrinsic value or as a potential hedge during high-inflation periods. Investors can buy physical Silver, in coins or in bars, or trade it through vehicles such as Exchange Traded Funds, which track its price on international markets.
Silver prices can move due to a wide range of factors. Geopolitical instability or fears of a deep recession can make Silver price escalate due to its safe-haven status, although to a lesser extent than Gold's. As a yieldless asset, Silver tends to rise with lower interest rates. Its moves also depend on how the US Dollar (USD) behaves as the asset is priced in dollars (XAG/USD). A strong Dollar tends to keep the price of Silver at bay, whereas a weaker Dollar is likely to propel prices up. Other factors such as investment demand, mining supply – Silver is much more abundant than Gold – and recycling rates can also affect prices.
Silver is widely used in industry, particularly in sectors such as electronics or solar energy, as it has one of the highest electric conductivity of all metals – more than Copper and Gold. A surge in demand can increase prices, while a decline tends to lower them. Dynamics in the US, Chinese and Indian economies can also contribute to price swings: for the US and particularly China, their big industrial sectors use Silver in various processes; in India, consumers’ demand for the precious metal for jewellery also plays a key role in setting prices.
Silver prices tend to follow Gold's moves. When Gold prices rise, Silver typically follows suit, as their status as safe-haven assets is similar. The Gold/Silver ratio, which shows the number of ounces of Silver needed to equal the value of one ounce of Gold, may help to determine the relative valuation between both metals. Some investors may consider a high ratio as an indicator that Silver is undervalued, or Gold is overvalued. On the contrary, a low ratio might suggest that Gold is undervalued relative to Silver.
(An automation tool was used in creating this post.)
- NZD/USD halts its losing streak ahead of the release of US Core PCE.
- The New Zealand Dollar may face challenges as the 10-year government bond yield has fallen below 4.85%.
- The hawkish remarks of the Fed officials helped the US Dollar to hold ground.
NZD/USD breaks its three-day losing streak, trading around 0.6130 during the European session on Friday. The New Zealand Dollar (NZD) may face a challenge as the 10-year government bond yield fell below 4.85%, retreating from one-month highs.
The Reserve Bank of New Zealand (RBNZ) has raised its forecast for a peak in interest rates and delayed the timing for any rate cut. The RBNZ kept its cash rate at a 15-year high of 5.5%, indicating that restrictive policy needs to be maintained longer to ensure inflation returns to the 1-3% target range.
On Thursday, New Zealand Finance Minister Nicola Willis stated that the Treasury sees inflation falling to below 3% in Q3 and easing to 2% around 2026. The New Zealand treasury sees NZ GDP contracting in H1 2024, and growth in H2 2024, as per the official transcript from the New Zealand Government's website.
On the USD front, the US Gross Domestic Product (GDP) Annualized for the first quarter was revised lower to 1.3% from 1.6%. Additionally, US weekly Initial Jobless Claims for the week ending on May 24 rose to 219,000 from the previous week's 216,000, slightly exceeding the market consensus of 218,000.
Investors are awaiting the Federal Reserve's preferred inflation gauge, the Core Personal Consumption Expenditures (PCE) Price Index, which will be released on Friday. If the data continues to soften, it could reignite the debate over potential rate cuts in September, weakening the US Dollar and underpinning the NZD/USD pair.
(A story was corrected on May 31 at 09:30 GMT to say, in the last paragraph, "weakening the US Dollar and underpinning the NZD/USD pair".)
European Central Bank (ECB) executive board member Fabio Panetta said on Friday that “monetary policy would remain restrictive even after several rate cuts.”
Additional quotes
Monetary easing can be expected over the coming months if data confirms our forecasts
Must avoid policy becoming too restrictive.
That could push inflation below the ECB's symmetrical target.
Inflation is expected to ease further in the next few quarters.
ECB will take into account Fed policy, but not be bound by it.
Market reaction
EUR/USD was last seen trading at 1.0837, adding 0.06% on the day, just ahead of the Eurozone inflation data release.
- USD/CHF gains ground near 0.9020 ahead of US PCE Inflation report for April.
- The US core PCE is projected to have risen steadily.
- Market sentiment is downside as China’s weak PMI data raises uncertainty over global demand outlook.
The USD/CHF pair rebounds to near 0.9050 in Friday’s European session after discovering buying interest around 0.9020. The Swiss Franc asset finds cushion as the US Dollar manages to have a firm footing amid a cautious market mood.
Market sentiment turns risk-averse amid uncertainty ahead of the United States core Personal Consumption Expenditure Price Index (PCE) data for April, which will be published at 12:30 GMT. S&P 500 futures have posted some losses in the European session. The US Dollar Index (DXY) rebounds slightly to 104.85.
In addition to the weak appeal of US equities, Asian equities also came under pressure as China’s weak National Bureau of Statistics (NBS) Manufacturing and Non-Manufacturing PMI for May missed estimates. This has raised concerns over the global economic outlook.
The core PCE Inflation data, which is the Federal Reserve’s (Fed) preferred inflation gauge, is estimated to have grown steadily by 0.3% and 2.8% on monthly and annual basis, respectively. The underlying inflation data will provide cues about whether the Fed will start reducing interest rates from their current levels in September.
Currently, the CME FedWatch tool shows that traders are mixed about the likelihood of the central bank returning to the policy normalization process in September.
Meanwhile, the Swiss Franc is slightly down against the US Dollar but performed strongly on Thursday after the release of the better-than-expected Swiss Q1 Gross Domestic Product (GDP) data. The Swiss economy expanded by 1.5% against the estimates and the former release of 1.3%. This has deepened upside risks to inflation, which could force the Swiss National Bank (SNB) to avoid subsequent rate-cut plans.
- Gold recovers after the release of the second estimate for US Q1 GDP data showed the economy expanded less than previously anticipated.
- A slowing economy reduces inflation and interest-rate expectations, supporting non-yielding Gold.
- Yet Gold remains technically vulnerable after a breakout from the Bear Flag continuation pattern.
Gold (XAU/USD) trades flat in the $2,340s on Friday, pausing in its labored recovery from Thursday’s three-week trough about $20 lower.
The recovery came after the release of weaker US growth data, which suggested inflation will remain contained and interest rates are more likely to come down. As a non-yielding asset, the expectation of lower interest rates is a positive for Gold.
Gold recovers after US growth slows
Gold rebounded on Thursday after the second estimate of US first-quarter GDP growth showed a downward revision to an annualized 1.3% from 1.6% in the first estimate.
The slower growth came from lower consumer spending, which in turn is expected to keep inflation contained, and the Federal Reserve (Fed) on track to lower interest rates. In a reflection of changing expectations after the GDP release, the US 10-year Treasury Note yield dropped back to 4.55% from a four-week peak of 4.63%.
Markets have been entertaining the possibility the Fed might even increase interest rates. However, commentary from several Fed officials on Thursday threw this idea out of the bag:
- Bank of Atlanta Fed President Raphael Bostic noted that he did not believe further rate hikes should be required to reach the Fed's 2.0% annual inflation target.
- Bank of Chicago Fed President Austan Goolsbee noted that while housing inflation was still "well elevated" making it hard to get to 2.0%, he was “Still optimistic that housing inflation will slow.”
- Bank of New York Fed President John Williams said that he believed Fed policy was well positioned to slowly get price growth back to the Fed's 2.0% annual target.
US Personal Consumption Expenditure (PCE) data for April, out on Friday, could impact interest-rate expectations further, in turn influencing Gold price. PCE is the Federal Reserve’s preferred gauge of inflation so it tends to carry more heft. Although, as several analysts have noted, the release is quite predictable, coming as it does after the CPI and PPI releases for the same month. That said, small deviations from expectations could still generate volatility.
The probabilities of the Fed cutting interest rates before September are insignificant and are hanging in the balance at 50/50 in September, data from the CME FedWatch Tool shows.
Gold and Asian demand as a currency hedge
US interest-rate expectations are not the only factor influencing the Gold price, according to Daniel Ghali, a Senior Commodity Strategist at TD Securities.
Ghali’s research shows that Gold demand is being driven by Asian buyers who are hoarding the precious metal as a hedge as their currencies depreciate against a strengthening US Dollar (USD).
“Precious metals are acting as a currency depreciation hedge. Case in point: fund flows into Chinese gold ETFs are rising once more at their fastest pace since the massive buying activity observed in April. US yields are surging, the dollar broke out of its lull, and yet precious metals prices have remained extremely resilient,” says Ghali.
This suggests the strength of the US Dollar may not be as negatively correlated to Gold as it was in the past, and Gold prices could be capped in the event of an appreciation of USD.
Technical Analysis: Gold poised for weakness after breakout from Bear Flag
Gold price has broken out of a slanted rectangular formation (red-shaded area), probably a Bear Flag continuation price pattern which formed between May 24 and 27.
The breakout activates the Bear Flag’s downside target zone of between $2,303 and $2,295. A break below Thursday’s $2,322 lows would provide further bearish confirmation.
XAU/USD 4-hour Chart
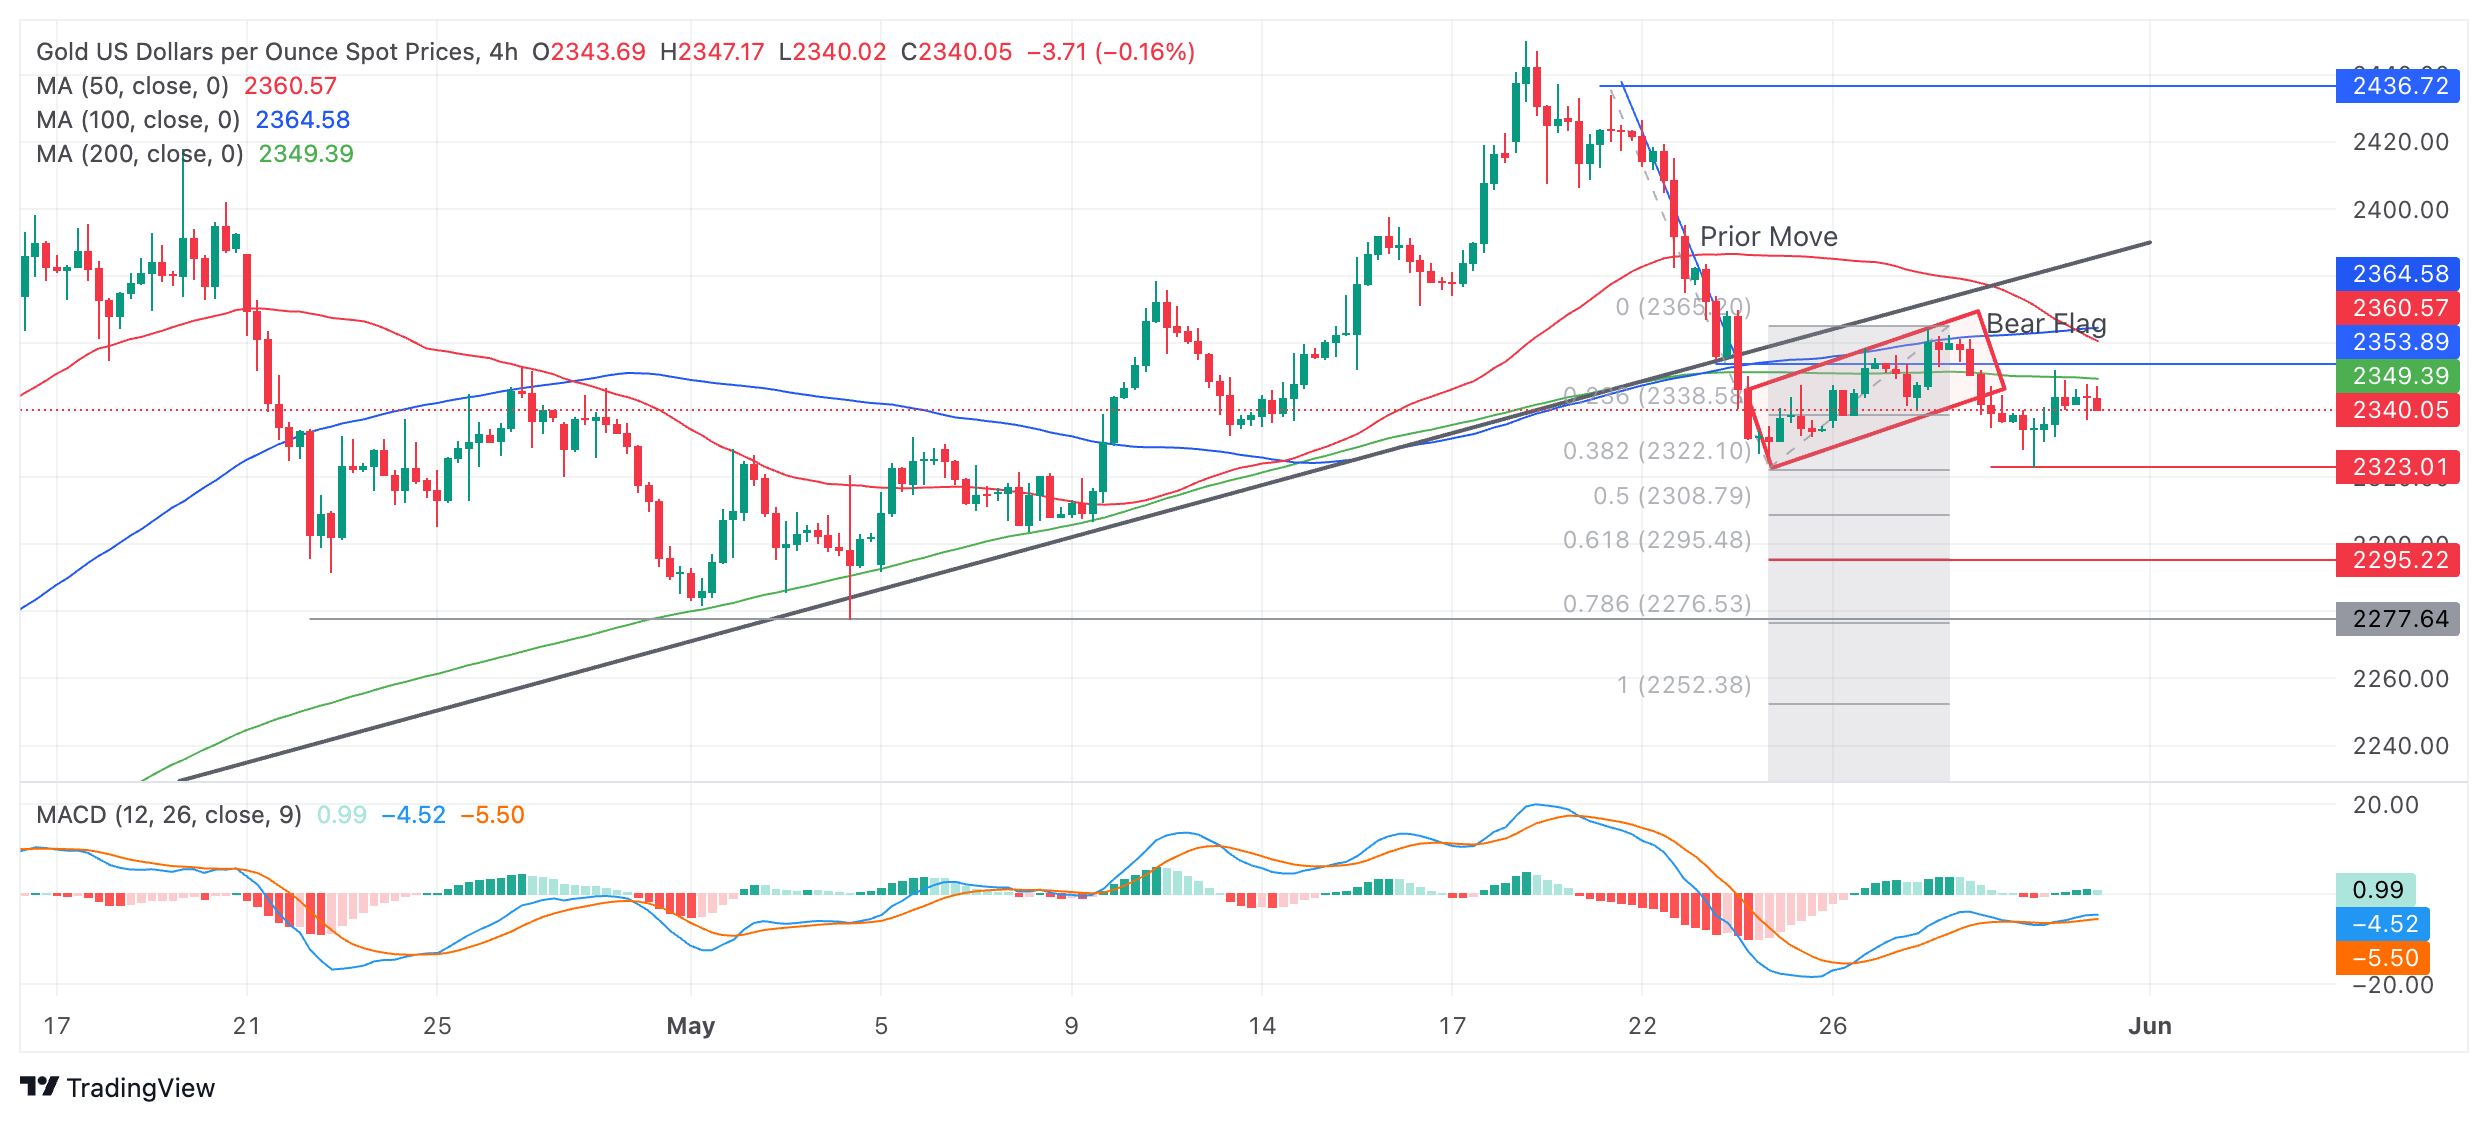
Bear Flags look like upside-down flags composed of a sharp decline – the flagpole – and the consolidation phase or “flag square”.
A more bearish move could even see Gold fall to $2,272-$2,277 (the 100% extrapolation of the move prior to the trend-line break and historic support and resistance).
Gold's 4-hour chart, used to assess the short-term trend, now exhibits a sequence of declining peaks and troughs, suggesting it is in a short-term downtrend and favoring short positions over longs.
The precious metal’s medium and long-term trends are still bullish, however, suggesting the risk of a recovery remains high. That said, price action is not supporting a resumption hypothesis at the moment.
A decisive break back above the trendline, now at around $2,385, would be required to provide evidence of a recovery and reversal of the short-term downtrend.
A decisive break would be one accompanied by a long green bullish candle or three green candles in a row.
Economic Indicator
Core Personal Consumption Expenditures - Price Index (YoY)
The Core Personal Consumption Expenditures (PCE), released by the US Bureau of Economic Analysis on a monthly basis, measures the changes in the prices of goods and services purchased by consumers in the United States (US). The PCE Price Index is also the Federal Reserve’s (Fed) preferred gauge of inflation. The YoY reading compares the prices of goods in the reference month to the same month a year earlier. The core reading excludes the so-called more volatile food and energy components to give a more accurate measurement of price pressures." Generally, a high reading is bullish for the US Dollar (USD), while a low reading is bearish.
Read more.Next release: Fri May 31, 2024 12:30
Frequency: Monthly
Consensus: 2.8%
Previous: 2.8%
Source: US Bureau of Economic Analysis
After publishing the GDP report, the US Bureau of Economic Analysis releases the Personal Consumption Expenditures (PCE) Price Index data alongside the monthly changes in Personal Spending and Personal Income. FOMC policymakers use the annual Core PCE Price Index, which excludes volatile food and energy prices, as their primary gauge of inflation. A stronger-than-expected reading could help the USD outperform its rivals as it would hint at a possible hawkish shift in the Fed’s forward guidance and vice versa.
- Silver price continues to lose ground as traders exercise caution ahead of US Core PCE.
- US Treasury yields appreciate due to the hawkish Fed, which weakens the demand for non-yielding Silver.
- The higher US Dollar impacts the grey metal demand as it becomes more expensive for foreign buyers.
Silver price continues to lose ground for the third consecutive day, trading around $31.10 per troy ounce during the European session on Friday. The hawkish remarks from Federal Reserve (Fed) officials have raised concerns about potential rate hikes. Higher interest rates are negatively impacting non-yielding assets like Silver.
On Thursday, Dallas Fed President Lorie Logan expressed continued concerns about upside risks to inflation despite recent easing. Logan warned that the Federal Reserve needs to remain flexible and keep "all options on the table" as it monitors data and determines how to respond, according to Reuters. Additionally, Bloomberg reported on Wednesday that Atlanta Fed President Raphael Bostic stated the path to 2% inflation is not guaranteed and highlighted the significant breadth of price gains.
Additionally, the stronger US Dollar (USD) makes the grey metal more expensive for foreign buyers. This increased cost leads to lower Silver demand and subsequently lower prices. US Dollar Index (DXY), which measures the value of the US Dollar (DXY) against six other major currencies, trades higher around 104.80 with 2-year and 10-year yields on US Treasury bonds standing at 4.94% and 4.56%, respectively, by the press time.
On Thursday, the US Gross Domestic Product (GDP) Annualized for the first quarter was revised lower to 1.3% from 1.6%. Additionally, US weekly Initial Jobless Claims for the week ending on May 2 rose to 219,000 from the previous week's 216,000, slightly exceeding the market consensus of 218,000. Investors are awaiting the Federal Reserve's preferred inflation gauge, the Core Personal Consumption Expenditures (PCE) Price Index, which will be released on Friday. If the data continues to soften, it could reignite the debate over potential rate cuts in September, which could help Silver limit its downside.
- EUR/USD holds the 1.0800 support with a focus on inflation readings on both sides of the Atlantic.
- Eurozone annual HICP is estimated to accelerate while US core PCE is projected to have grown steadily.
- Eurozone inflation data will impact the ECB’s policy outlook beyond June.
EUR/USD consolidates in a tight range above the round-level support of 1.0800 in Friday’s European session. The price action in the major currency pair is surrounded by uncertainty ahead of the preliminary Eurozone Harmonized Index of Consumer Prices (HICP) data for May and the United States (US) core Personal Consumption Expenditure Price Index (PCE) data for April, which will be published at 09:00 GMT and 12:30 GMT, respectively.
Eurozone annual headline HICP data is forecasted to have grown at a higher pace of 2.5% from 2.4% in April. In the same period, the core HICP data – which excludes volatile components such as food, energy, alcohol and tobacco – is estimated to have accelerated to 2.8% from the prior reading of 2.7%.
Eurozone inflation data for May isn’t likely to impact market speculation for European Central Bank (ECB) rate cuts in the June meeting as it appears to be a done deal. ECB policymakers have remained comfortable with rate-cut speculation for June due to consistently easing price pressures and resumed progress in service disinflation.
However, the inflation data will provide cues about how the ECB will follow the rate-cut path beyond June. A further decline in price pressures would prompt expectations of subsequent rate cuts, while a stubborn reading could force officials to adopt a more gradual approach. Meanwhile, the majority of ECB policymakers have been emphasizing the need to remain data-dependent and have been reluctant to offer any pre-defined rate trajectory.
Daily digest market movers: EUR/USD remains subdued ahead of Eurozone, US inflation data
- EUR/USD is poised for volatility in Friday’s European and American sessions as the inflation data is scheduled to be published. In the US, the Bureau of Economic Analysis (BEA) will report the core PCE Inflation data for April, which is the Federal Reserve’s (Fed) preferred inflation gauge.
- Core PCE inflation is projected to have grown steadily by 0.3% and 2.8% on monthly and annual basis, respectively. Steady or hot inflation reading would likely prompt traders to pare Fed rate-cut bets for the September meeting, while soft figures would do the opposite.
- Currently, the CME FedWatch tool reflects that traders are indecisive about the US central bank reducing interest rates in the September meeting. The reason behind this deepening uncertainty is the strong labor market outlook and upside risks to inflation.
- Fed policymakers emphasize the need to maintain interest rates at their current levels for long until they get sufficient evidence that price pressures will sustainably return to the desired rate of 2%. Officials worry that the progress in the disinflation process has stalled even though the April’s Consumer Price Index (CPI) report showed that price pressures abated.
- Meanwhile, the US Dollar Index (DXY), which tracks the Greenback’s value against six major currencies, is slightly up near 104.85. The USD Index gains ground after correcting sharply on Thursday. The sell-off move was driven by slower United States Q1 Gross Domestic Product (GDP) growth. the revised GDP estimates report showed that the economy expanded at a slower pace of 1.3% against the 1.6% initially estimated.
Technical Analysis: EUR/USD strives to maintain firm footing above 1.0800
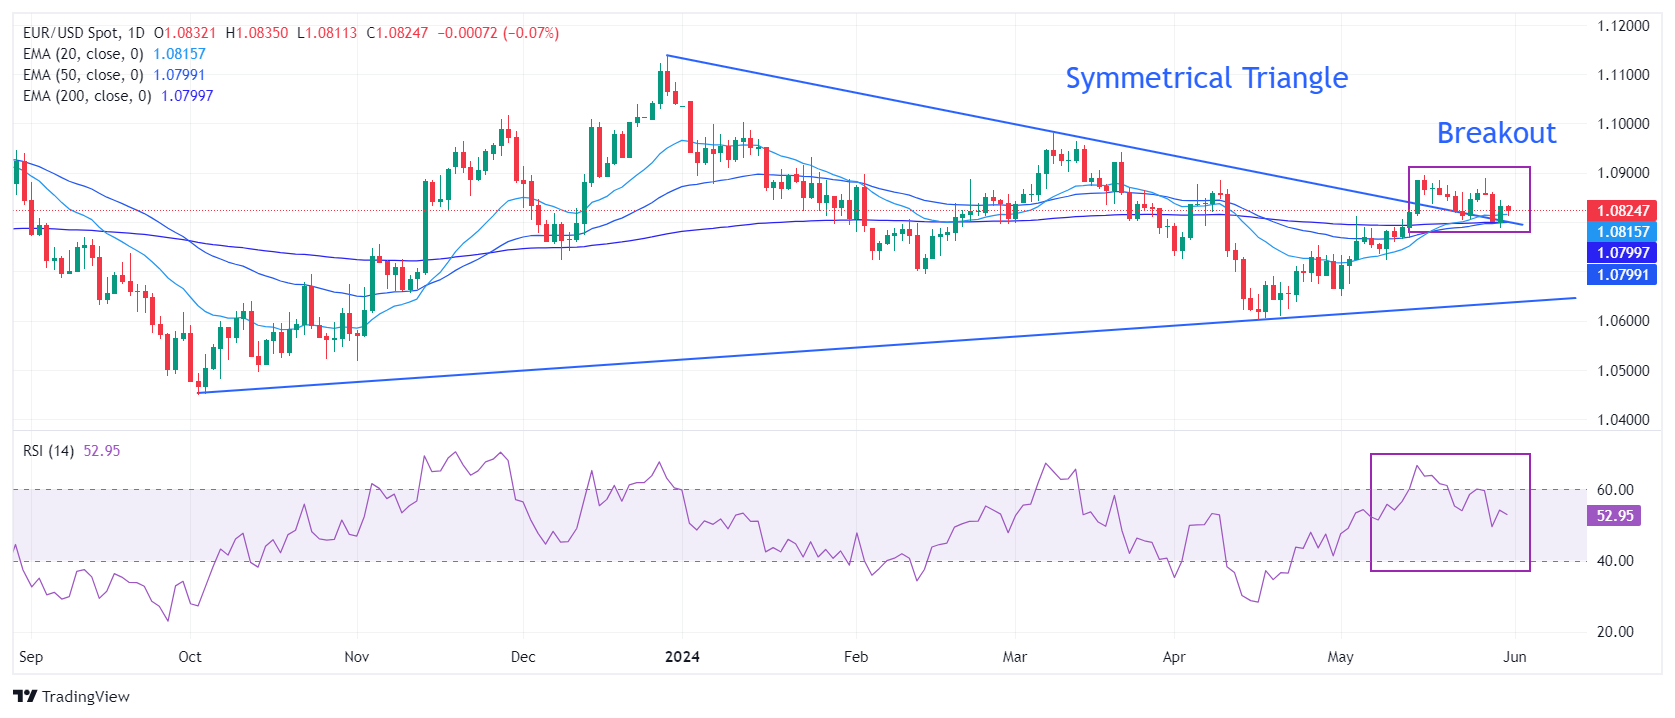
EUR/USD edges down but holds the crucial support of 1.0800 ahead of US core PCE inflation data. The shared currency pair holds the breakout of the Symmetrical Triangle chart pattern formed on a daily time frame, which is in the region of 1.0800. The near-term outlook of the shared currency pair remains uncertain as it struggles to sustain above all short-to-long-term Exponential Moving Averages (EMAs).
The 14-period Relative Strength Index (RSI) has slipped into the 40.00-60.00 range, suggesting that the momentum, which was leaned toward the upside, has faded for now.
The major currency pair would strengthen if it recaptures a two-month high around 1.0900. A decisive break above this level would drive the asset towards the March 21 high, around 1.0950, and the psychological resistance of 1.1000. However, a downside move below the 200-day EMA at 1.0800 could push it further down.
Euro FAQs
The Euro is the currency for the 20 European Union countries that belong to the Eurozone. It is the second most heavily traded currency in the world behind the US Dollar. In 2022, it accounted for 31% of all foreign exchange transactions, with an average daily turnover of over $2.2 trillion a day. EUR/USD is the most heavily traded currency pair in the world, accounting for an estimated 30% off all transactions, followed by EUR/JPY (4%), EUR/GBP (3%) and EUR/AUD (2%).
The European Central Bank (ECB) in Frankfurt, Germany, is the reserve bank for the Eurozone. The ECB sets interest rates and manages monetary policy. The ECB’s primary mandate is to maintain price stability, which means either controlling inflation or stimulating growth. Its primary tool is the raising or lowering of interest rates. Relatively high interest rates – or the expectation of higher rates – will usually benefit the Euro and vice versa. The ECB Governing Council makes monetary policy decisions at meetings held eight times a year. Decisions are made by heads of the Eurozone national banks and six permanent members, including the President of the ECB, Christine Lagarde.
Eurozone inflation data, measured by the Harmonized Index of Consumer Prices (HICP), is an important econometric for the Euro. If inflation rises more than expected, especially if above the ECB’s 2% target, it obliges the ECB to raise interest rates to bring it back under control. Relatively high interest rates compared to its counterparts will usually benefit the Euro, as it makes the region more attractive as a place for global investors to park their money.
Data releases gauge the health of the economy and can impact on the Euro. Indicators such as GDP, Manufacturing and Services PMIs, employment, and consumer sentiment surveys can all influence the direction of the single currency. A strong economy is good for the Euro. Not only does it attract more foreign investment but it may encourage the ECB to put up interest rates, which will directly strengthen the Euro. Otherwise, if economic data is weak, the Euro is likely to fall. Economic data for the four largest economies in the euro area (Germany, France, Italy and Spain) are especially significant, as they account for 75% of the Eurozone’s economy.
Another significant data release for the Euro is the Trade Balance. This indicator measures the difference between what a country earns from its exports and what it spends on imports over a given period. If a country produces highly sought after exports then its currency will gain in value purely from the extra demand created from foreign buyers seeking to purchase these goods. Therefore, a positive net Trade Balance strengthens a currency and vice versa for a negative balance.
Gold prices rose in India on Friday, according to data compiled by FXStreet.
The price for Gold stood at 6,282.77 Indian Rupees (INR) per gram, up INR 0.86 compared with the INR 6,281.91 it cost on Thursday.
The price for Gold increased to INR 73,273.94 per tola from INR 73,270.93 per tola.
| Unit measure | Gold Price in INR |
|---|---|
| 1 Gram | 6,282.77 |
| 10 Grams | 62,821.65 |
| Tola | 73,273.94 |
| Troy Ounce | 195,415.10 |
FXStreet calculates Gold prices in India by adapting international prices (USD/INR) to the local currency and measurement units. Prices are updated daily based on the market rates taken at the time of publication. Prices are just for reference and local rates could diverge slightly.
Global Market Movers: Comex Gold price rises amid geopolitical risks and weaker US GDP
- Israel is in effective control of Gaza’s entire land border after taking control of a buffer zone along the border with Egypt, Israel’s military has said, a move that may complicate its ties with Egypt, per the Guardian.
- The second estimate of US Gross Domestic Product (GDP) showed the economy expanded at an annualized pace of 1.3% in Q1 from 1.6% in the previous reading, in line with market expectations.
- The US weekly Initial Jobless Claims for the week ending May 25 rose to 219K from the previous week of 216K, above the market consensus of 218K.
- Chicago Fed President Austan Goolsbee said on Thursday that housing inflation remains a key sticking point in price growth and that the US labor market remains quite strong.
- Atlanta Fed President Raphael Bostic stated that central bankers are unlikely to deliver an interest rate cut in July amid signs that inflation progress has slowed.
- New York Fed President John Williams noted that inflation is still too high, but he is confident it will start decelerating later this year, per CNBC.
Gold FAQs
Gold has played a key role in human’s history as it has been widely used as a store of value and medium of exchange. Currently, apart from its shine and usage for jewelry, the precious metal is widely seen as a safe-haven asset, meaning that it is considered a good investment during turbulent times. Gold is also widely seen as a hedge against inflation and against depreciating currencies as it doesn’t rely on any specific issuer or government.
Central banks are the biggest Gold holders. In their aim to support their currencies in turbulent times, central banks tend to diversify their reserves and buy Gold to improve the perceived strength of the economy and the currency. High Gold reserves can be a source of trust for a country’s solvency. Central banks added 1,136 tonnes of Gold worth around $70 billion to their reserves in 2022, according to data from the World Gold Council. This is the highest yearly purchase since records began. Central banks from emerging economies such as China, India and Turkey are quickly increasing their Gold reserves.
Gold has an inverse correlation with the US Dollar and US Treasuries, which are both major reserve and safe-haven assets. When the Dollar depreciates, Gold tends to rise, enabling investors and central banks to diversify their assets in turbulent times. Gold is also inversely correlated with risk assets. A rally in the stock market tends to weaken Gold price, while sell-offs in riskier markets tend to favor the precious metal.
The price can move due to a wide range of factors. Geopolitical instability or fears of a deep recession can quickly make Gold price escalate due to its safe-haven status. As a yield-less asset, Gold tends to rise with lower interest rates, while higher cost of money usually weighs down on the yellow metal. Still, most moves depend on how the US Dollar (USD) behaves as the asset is priced in dollars (XAU/USD). A strong Dollar tends to keep the price of Gold controlled, whereas a weaker Dollar is likely to push Gold prices up.
(An automation tool was used in creating this post.)
- EUR/JPY extends the decline near 169.78 in Friday’s early European session.
- The German Retail Sales came in weaker than expected, dropping 1.2% MoM in April from a 1.8% rise in March.
- Tokyo CPI inflation rose 2.2% YoY in May, heightening the uncertainty over the timing of the BoJ's next rate hike.
The EUR/JPY cross trades in negative territory for the third consecutive day around 169.78 on Friday during the early European session. The cross remains under selling pressure after the weaker German Retail Sales data. Investors will shift their attention to the first reading of the Eurozone Harmonized Index of Consumer Prices (HICP) for May, which is due later on Friday.
The German month-on-month Retail Sales for April 2024 came in weaker than expected, Destatis reported on Friday. Germany's Retail Sales dropped by 1.2% MoM in April from a 1.8% rise in March. On an annual basis, Retail Sales fell 0.6% in April from a 1.9% decline recorded in March. The downbeat German data had little to no impact on the Euro (EUR).
Traders pare bets that the European Central Bank (ECB) will start easing policy ahead of other key central banks, and the markets anticipate the ECB will need more time to consider the inflation data carefully. The annual Harmonized Index of Consumer Prices (HICP) is estimated to rise at a stronger pace of 2.5%, compared to the prior reading of 2.4%, while the core HICP is forecast to show an increase of 2.8%, compared to 2.7% in April.
On the JPY’s front, Japanese Finance Minister Shunichi Suzuki said on Friday that he will closely watch the foreign exchange (FX) moves and will take all measures on FX if it’s necessary. The verbal intervention from the Japanese authorities is likely to support the Japanese Yen (JPY) in the near term and cap the upside for the cross.
Nonetheless, Tokyo Consumer Price Index (CPI) inflation rose 2.2% YoY in May from 1.8% in April. Meanwhile, the core CPI in Tokyo rose 1.9% in May, compared to a 1.6% increase in April, matching market expectations. The data heightens the uncertainty about the timing of the Bank of Japan's (BoJ) next interest rate hike.
Here is what you need to know on Friday, May 31:
Following the choppy action seen on Thursday, major currency pairs hold steady early Friday as investors gear up for key data releases. Eurostat will publish the Harmonized Index of Consumer Prices (HICP) and the US Bureau of Economic Analysis will release the Personal Consumption Expenditures (PCE) Price Index for May. First-quarter Gross Domestic Product (GDP) data from Canada will also be watched closely by investors.
Although safe-haven flows continued to dominate the financial markets on Thursday, the US Dollar (USD) struggled to gather strength against its rivals as US Treasury bond yields corrected lower. After rising 0.5% on Wednesday, the USD Index fell 0.35% on Thursday before settling slightly below 105.00 early Friday.
US core PCE inflation set to steady as Federal Reserve rate cut for September hangs in the balance.
US Dollar PRICE This week
The table below shows the percentage change of US Dollar (USD) against listed major currencies this week. US Dollar was the strongest against the Euro.
| USD | EUR | GBP | JPY | CAD | AUD | NZD | CHF | |
|---|---|---|---|---|---|---|---|---|
| USD | 0.22% | 0.16% | -0.08% | -0.04% | -0.18% | -0.23% | -1.09% | |
| EUR | -0.22% | -0.08% | -0.27% | -0.25% | -0.46% | -0.54% | -1.27% | |
| GBP | -0.16% | 0.08% | -0.24% | -0.20% | -0.37% | -0.40% | -1.22% | |
| JPY | 0.08% | 0.27% | 0.24% | 0.00% | -0.12% | -0.06% | -1.04% | |
| CAD | 0.04% | 0.25% | 0.20% | -0.00% | -0.16% | -0.19% | -1.11% | |
| AUD | 0.18% | 0.46% | 0.37% | 0.12% | 0.16% | -0.00% | -0.86% | |
| NZD | 0.23% | 0.54% | 0.40% | 0.06% | 0.19% | 0.00% | -0.87% | |
| CHF | 1.09% | 1.27% | 1.22% | 1.04% | 1.11% | 0.86% | 0.87% |
The heat map shows percentage changes of major currencies against each other. The base currency is picked from the left column, while the quote currency is picked from the top row. For example, if you pick the US Dollar from the left column and move along the horizontal line to the Japanese Yen, the percentage change displayed in the box will represent USD (base)/JPY (quote).
During the Asian trading hours, the data from China showed that the NBS Manufacturing PMI declined to 49.5 in May from 50.4 in April. In the same period, NBS Non-Manufacturing PMI ticked down to 51.1 from 51.2. These readings failed to trigger an immediate reaction. At the time of press, AUD/USD was trading marginally higher on the day at 0.6640.
Retail Sales in Germany declined 1.2% on a monthly basis in April, Germany's Destatis reported early Friday. This print followed the 2.6% expansion recorded in March and came in weaker than the market expectation for a 0.1% decline. EUR/USD largely ignored these data and was last seen fluctuating in a tight channel above 1.0800.
Eurozone Inflation Release: Lower price pressures expected, Euro could suffer.
After rising sharply on Wednesday, USD/CAD turned south and closed the day in negative territory below 1.3700 on Thursday. The pair continues to edge lower toward 1.3650 in the European morning on Friday. Canada's real GDP is forecast to expand at an annual rate of 2.2%.
USD/JPY lost more than 0.5% on Thursday and seems to have entered a consolidation phase at around 157.00 early Friday. The data from Japan showed that the Tokyo Consumer Price Index climbed to 2.2% on a yearly basis in May from 1.8% in April.
GBP/USD staged a rebound on Thursday and closed above 1.2700. The pair stays relatively quiet and moves up and down in a narrow band at around 1.2720 in the European morning on Friday.
Gold benefited from the pullback seen in US Treasury bond yields and registered small gains on Thursday. XAU/USD struggles to gather bullish momentum and trades near mid-$2,340s.
Inflation FAQs
Inflation measures the rise in the price of a representative basket of goods and services. Headline inflation is usually expressed as a percentage change on a month-on-month (MoM) and year-on-year (YoY) basis. Core inflation excludes more volatile elements such as food and fuel which can fluctuate because of geopolitical and seasonal factors. Core inflation is the figure economists focus on and is the level targeted by central banks, which are mandated to keep inflation at a manageable level, usually around 2%.
The Consumer Price Index (CPI) measures the change in prices of a basket of goods and services over a period of time. It is usually expressed as a percentage change on a month-on-month (MoM) and year-on-year (YoY) basis. Core CPI is the figure targeted by central banks as it excludes volatile food and fuel inputs. When Core CPI rises above 2% it usually results in higher interest rates and vice versa when it falls below 2%. Since higher interest rates are positive for a currency, higher inflation usually results in a stronger currency. The opposite is true when inflation falls.
Although it may seem counter-intuitive, high inflation in a country pushes up the value of its currency and vice versa for lower inflation. This is because the central bank will normally raise interest rates to combat the higher inflation, which attract more global capital inflows from investors looking for a lucrative place to park their money.
Formerly, Gold was the asset investors turned to in times of high inflation because it preserved its value, and whilst investors will often still buy Gold for its safe-haven properties in times of extreme market turmoil, this is not the case most of the time. This is because when inflation is high, central banks will put up interest rates to combat it. Higher interest rates are negative for Gold because they increase the opportunity-cost of holding Gold vis-a-vis an interest-bearing asset or placing the money in a cash deposit account. On the flipside, lower inflation tends to be positive for Gold as it brings interest rates down, making the bright metal a more viable investment alternative.
FX option expiries for May 31 NY cut at 10:00 Eastern Time, via DTCC, can be found below
- EUR/USD: EUR amounts
- 1.0825 670m
- 1.0875 1.2b
- 1.0900 1.2b
- USD/JPY: USD amounts
- 155.50 981m
- 157.00 790m
- 158.00 891m
- USD/CHF: USD amounts
- 0.8935 1.2b
- 0.9060 539m
- AUD/USD: AUD amounts
- 0.6600 1.7b
- 0.6700 591m
- USD/CAD: USD amounts
- 1.3750 564m
- 1.3900 932m
- The Pound Sterling is down slightly against the US Dollar ahead of the US core PCE inflation data.
- The underlying US inflation data is expected to have grown steadily.
- UK business optimism improves due to cooling inflationary pressures and expectations for BoE rate cuts.
The Pound Sterling (GBP) comes under pressure in Friday’s early London session as a sharp recovery move from four-day low near 1.2680 appears to be stalled. The GBP/USD treads cautiously amid uncertainty ahead of the United States core Personal Consumption Expenditure Price Index (PCE) data for April, which will be published at 12:30 GMT.
The core PCE Inflation data, which is Federal Reserve’s (Fed) preferred inflation tool, is estimated to have gown steadily by 0.3% and 2.8% on monthly and annual basis, respectively. Investors will keenly focus on the underlying inflation data as it will provide significant cues about the Fed’s rate-cut path.
In-line numbers will less likely prompt expectations of rate-cuts in the September meeting as Fed policymakers want to see inflation declining for months before considering a policy normalization move. Hot inflation reading would significantly impact market speculation for the Fed reducing interest rates in November too. While soft figures would boost prospects of Fed lowering key borrowing rate from September.
Daily digest market movers: Pound Sterling drops amid uncertain market sentiment
- The Pound Sterling edges down to 1.2720 against the US Dollar (USD). The Cable struggles to extend recovery as the US Dollar stabilizes after a steep correction induced by downwardly revised US Q1 Gross Domestic Product (GDP) data on Thursday. The US Bureau of Economic Analysis (BEA) reported that the economy expanded at a slower pace of 1.3% due to lower consumer spendings from the preliminary estimates of 1.6%.
- Downwardly revised GDP estimates weighed on the US Dollar as market speculation for the Fed lowering interest rates from September edged up slightly above 50%. However, Fed rate-cut prospects will be meaningfully influenced by the core PCE Inflation data.
- Meanwhile, Fed policymakers continue to emphasize keeping interest rates at their current levels until they get sufficient evidence that inflation will sustainably return to the desired rate of 2%. On Thursday, Dallas Federal Reserve Bank President Lorie Logan said inflation is on course to return to 2% but the path appears to be slower and bumpier than expected at the beginning of the year. Therefore, it is too early to consider rate cuts.
- On the United Kingdom (UK) front, the outlook for the economy has improved after a survey by Lloyds Bank showed that easing price pressures and firm expectations for the Bank of England (BoE) starting to reduce interest rates sooner have pushed business optimism to highest since November 2015. Lloyds Bank Business Barometer jumps to 50% in Maym advanced by eight points.
- Due to absence of top-tier UK economic data, investors look for developments in upcoming elections. Exit polls show that the Labour Party will come in power after almost 15 years.
- The Pound Sterling could remain slightly volatile due to market expectations for elections but its impact on the monetary policy is expected to light. The outlook of UK economy will change drastically if the Labour Party comes into power but their fiscal plans are expected to remain conservative to avoid any upside risk to price pressures.
Technical Analysis: Pound Sterling holds 1.2700
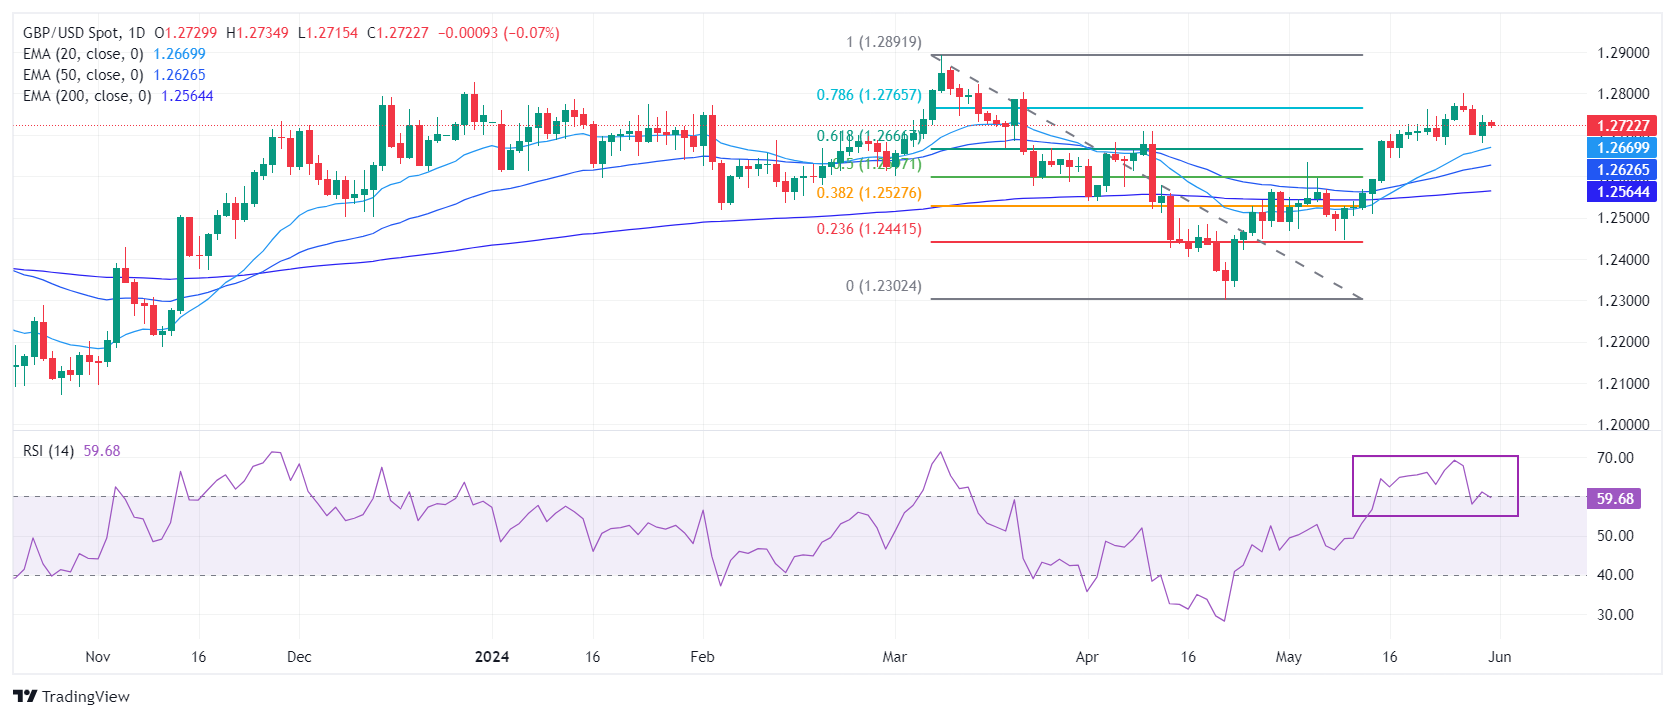
The Pound Sterling exhibits a subdued performance against the US Dollar ahead of the US core PCE Price Index data for April. The near-term outlook of the GBP/USD pair remains upbeat as it holds the 61.8% Fibonacci retracement support (plotted from the March 8 high of 1.2900 to the April 22 low at 1.2300) at 1.2670.
The Cable is expected to remain in the bullish trajectory as all short-to-long-term Exponential Moving Averages (EMAs) are sloping higher, suggesting a strong uptrend.
The 14-period Relative Strength Index (RSI) has slipped into the 40.00-60.00 range, suggesting that the momentum, which was leaned toward the upside has faded for now.
Pound Sterling FAQs
The Pound Sterling (GBP) is the oldest currency in the world (886 AD) and the official currency of the United Kingdom. It is the fourth most traded unit for foreign exchange (FX) in the world, accounting for 12% of all transactions, averaging $630 billion a day, according to 2022 data. Its key trading pairs are GBP/USD, aka ‘Cable’, which accounts for 11% of FX, GBP/JPY, or the ‘Dragon’ as it is known by traders (3%), and EUR/GBP (2%). The Pound Sterling is issued by the Bank of England (BoE).
The single most important factor influencing the value of the Pound Sterling is monetary policy decided by the Bank of England. The BoE bases its decisions on whether it has achieved its primary goal of “price stability” – a steady inflation rate of around 2%. Its primary tool for achieving this is the adjustment of interest rates. When inflation is too high, the BoE will try to rein it in by raising interest rates, making it more expensive for people and businesses to access credit. This is generally positive for GBP, as higher interest rates make the UK a more attractive place for global investors to park their money. When inflation falls too low it is a sign economic growth is slowing. In this scenario, the BoE will consider lowering interest rates to cheapen credit so businesses will borrow more to invest in growth-generating projects.
Data releases gauge the health of the economy and can impact the value of the Pound Sterling. Indicators such as GDP, Manufacturing and Services PMIs, and employment can all influence the direction of the GBP. A strong economy is good for Sterling. Not only does it attract more foreign investment but it may encourage the BoE to put up interest rates, which will directly strengthen GBP. Otherwise, if economic data is weak, the Pound Sterling is likely to fall.
Another significant data release for the Pound Sterling is the Trade Balance. This indicator measures the difference between what a country earns from its exports and what it spends on imports over a given period. If a country produces highly sought-after exports, its currency will benefit purely from the extra demand created from foreign buyers seeking to purchase these goods. Therefore, a positive net Trade Balance strengthens a currency and vice versa for a negative balance.
Germany's Retail Sales dropped by 1.2% MoM in April, having reported a 1.8% jump in March, the official data released by Destatis showed on Friday. The market consensus was for -0.1% in the reported period.
Annually, Retail Sales in the Eurozone's economy fell 0.6% in April, as against a growth of 0.3% recorded in March.
EUR/USD reaction to the German data
Weak German data fails to move the needle around the Euro, keeping EUR/USD around 1.0820, down 0.10% on the day, as of writing.
Euro PRICE Today
The table below shows the percentage change of Euro (EUR) against listed major currencies today. Euro was the weakest against the New Zealand Dollar.
| USD | EUR | GBP | JPY | CAD | AUD | NZD | CHF | |
|---|---|---|---|---|---|---|---|---|
| USD | 0.11% | 0.07% | 0.02% | -0.12% | -0.07% | -0.25% | 0.18% | |
| EUR | -0.11% | -0.02% | -0.10% | -0.22% | -0.20% | -0.36% | 0.07% | |
| GBP | -0.07% | 0.02% | -0.08% | -0.21% | -0.17% | -0.34% | 0.09% | |
| JPY | -0.02% | 0.10% | 0.08% | -0.11% | -0.08% | -0.29% | 0.16% | |
| CAD | 0.12% | 0.22% | 0.21% | 0.11% | 0.04% | -0.13% | 0.28% | |
| AUD | 0.07% | 0.20% | 0.17% | 0.08% | -0.04% | -0.18% | 0.22% | |
| NZD | 0.25% | 0.36% | 0.34% | 0.29% | 0.13% | 0.18% | 0.43% | |
| CHF | -0.18% | -0.07% | -0.09% | -0.16% | -0.28% | -0.22% | -0.43% |
The heat map shows percentage changes of major currencies against each other. The base currency is picked from the left column, while the quote currency is picked from the top row. For example, if you pick the Euro from the left column and move along the horizontal line to the US Dollar, the percentage change displayed in the box will represent EUR (base)/USD (quote).
- The core Personal Consumption Expenditures Price Index is set to rise 0.3% MoM and 2.8% YoY in April.
- Markets see the Federal Reserve keeping the policy rate unchanged in June and July.
- A soft PCE inflation report could weigh on the US Dollar with the immediate reaction.
The core Personal Consumption Expenditures (PCE) Price Index, the US Federal Reserve’s (Fed) preferred inflation measure, will be published on Friday by the US Bureau of Economic Analysis (BEA) at 12:30 GMT.
PCE index: What to expect in the Federal Reserve’s preferred inflation measure
The core PCE Price Index, which excludes volatile food and energy prices, is seen as the more influential measure of inflation in terms of Fed positioning. The index is forecast to rise 0.3% on a monthly basis in April, matching March’s increase. April core PCE is projected to grow at an annual pace of 2.8%, while headline PCE inflation is forecast to hold steady at 2.7% (YoY).
The US Bureau of Labor Statistics reported earlier in the month that the Consumer Price Index (CPI) rose 3.4% on a yearly basis in April, while the core CPI increased 3.6% in the same period, down from 3.8% in March.
Previewing the PCE inflation report, “CPI and PPI data suggest core PCE inflation lost further momentum in April after a strong start to the year,” TD Securities analysts said. “Indeed, we look the core index to advance 0.22% m/m vs 0.32% in March and vs the core CPI's 0.29% April expansion. We've revised our forecast from an initial 0.25% estimate. We also look for the headline to rise 0.23% m/m while the supercore likely cooled to 0.26%.”
When will the PCE inflation report be released, and how could it affect EUR/USD?
The PCE inflation data is slated for release at 12:30 GMT. The monthly core PCE Price Index gauge is the most-preferred inflation reading by the Fed, as it’s not distorted by base effects and provides a clear view of underlying inflation by excluding volatile items. Investors, therefore, pay close attention to the monthly core PCE figure.
The CME Group FedWatch Tool shows that markets currently see virtually no chance of a Fed interest rate cut either in June or July. The probability of the US central bank leaving the policy rate unchanged in September stands at around 48%.
The market positioning suggests that the US Dollar (USD) faces a two-way risk heading into the event. In case the monthly core PCE rises more than 0.3% in April, the immediate market reaction could cause investors to refrain from pricing in a rate reduction in September and help the USD outperform its rivals. On the other hand, a reading of 0.2%, or lower, could trigger a USD selloff ahead of the weekend and open the door for a leg higher in EUR/USD.
FXStreet Analyst Eren Sengezer offers a brief technical outlook for EUR/USD and explains:
“Although EUR/USD edged lower in the first half of the week, the Relative Strength Index (RSI) indicator on the daily chart holds slightly above 50, highlighting a lack of bearish pressure. Following the uptrend that ended on May 16, the pair stabilized above the 1.0780-1.0800 region, where the 50-day, 100-day and 200-day Simple Moving Averages (SMA) are located. If EUR/USD drops below that area and starts using it as resistance, technical sellers could take action. In this scenario, 1.0700 (psychological level, static level) could be seen as the next bearish target before 1.0600 (2024-low set on April 16).”
“On the upside, resistances are located at 1.0900 (static level, psychological level), 1.0950 (static level) and 1.1000 (psychological level, static level). For buyers to remain interested, however, the 1.0780-1.0800 area needs to stay intact as support.”
Economic Indicator
Core Personal Consumption Expenditures - Price Index (YoY)
The Core Personal Consumption Expenditures (PCE), released by the US Bureau of Economic Analysis on a monthly basis, measures the changes in the prices of goods and services purchased by consumers in the United States (US). The PCE Price Index is also the Federal Reserve’s (Fed) preferred gauge of inflation. The YoY reading compares the prices of goods in the reference month to the same month a year earlier. The core reading excludes the so-called more volatile food and energy components to give a more accurate measurement of price pressures." Generally, a high reading is bullish for the US Dollar (USD), while a low reading is bearish.
Read more.Last release: Fri Apr 26, 2024 12:30
Frequency: Monthly
Actual: 2.8%
Consensus: 2.6%
Previous: 2.8%
Source: US Bureau of Economic Analysis
After publishing the GDP report, the US Bureau of Economic Analysis releases the Personal Consumption Expenditures (PCE) Price Index data alongside the monthly changes in Personal Spending and Personal Income. FOMC policymakers use the annual Core PCE Price Index, which excludes volatile food and energy prices, as their primary gauge of inflation. A stronger-than-expected reading could help the USD outperform its rivals as it would hint at a possible hawkish shift in the Fed’s forward guidance and vice versa.
Fed FAQs
Monetary policy in the US is shaped by the Federal Reserve (Fed). The Fed has two mandates: to achieve price stability and foster full employment. Its primary tool to achieve these goals is by adjusting interest rates. When prices are rising too quickly and inflation is above the Fed’s 2% target, it raises interest rates, increasing borrowing costs throughout the economy. This results in a stronger US Dollar (USD) as it makes the US a more attractive place for international investors to park their money. When inflation falls below 2% or the Unemployment Rate is too high, the Fed may lower interest rates to encourage borrowing, which weighs on the Greenback.
The Federal Reserve (Fed) holds eight policy meetings a year, where the Federal Open Market Committee (FOMC) assesses economic conditions and makes monetary policy decisions. The FOMC is attended by twelve Fed officials – the seven members of the Board of Governors, the president of the Federal Reserve Bank of New York, and four of the remaining eleven regional Reserve Bank presidents, who serve one-year terms on a rotating basis.
In extreme situations, the Federal Reserve may resort to a policy named Quantitative Easing (QE). QE is the process by which the Fed substantially increases the flow of credit in a stuck financial system. It is a non-standard policy measure used during crises or when inflation is extremely low. It was the Fed’s weapon of choice during the Great Financial Crisis in 2008. It involves the Fed printing more Dollars and using them to buy high grade bonds from financial institutions. QE usually weakens the US Dollar.
Quantitative tightening (QT) is the reverse process of QE, whereby the Federal Reserve stops buying bonds from financial institutions and does not reinvest the principal from the bonds it holds maturing, to purchase new bonds. It is usually positive for the value of the US Dollar.
Japanese Finance Minister Shunichi Suzuki said on Friday that “it is important for currencies to move in a stable manner reflecting fundamentals.”
Additional quotes
Closely watching FX moves.
Prepared to take all measures on forex.
Separately, Japan’s Prime Minister (PM) Fumio Kishida said that a “’'virtuous cycle' has already begun after this year's wage increases and record capital investment.”
“It would take about 3 years to counteract deflation mindset,” PM Kishida said.
Market reaction
USD/JPY is holding its renewed downside intact on the above comments, trading near 156.70. The pair is down 0.05% on the day, as of writing.
- WTI price lost ground ahead of the US PCE on Friday.
- OPEC+ is expected to maintain supply cuts of 2.2 million barrels per day on June 2.
- EIA Crude Oil Stocks Change declined by 4.156 million barrels in the previous week, against the expected 1.900 million-barrel draw.
West Texas Intermediate (WTI) crude Oil continues its losing streak for the third consecutive day, trading around $77.50 per barrel during the Asian session on Friday. Traders are likely awaiting the upcoming meeting of the Organization of the Petroleum Exporting Countries and its allies, including Russia (OPEC+), scheduled for June 2. OPEC+ will begin a series of online meetings at 1100 GMT on Sunday.
According to Reuters, three sources familiar with OPEC+ discussions indicated on Thursday that the group is working on a complex deal to be agreed upon at its meeting on Sunday. This deal will potentially allow OPEC+ to extend some of its deep Oil production cuts into 2025.
The hawkish remarks from Federal Reserve (Fed) officials have raised concerns about potential rate hikes. Higher interest rates are negatively impacting the US economic outlook, which dampens the demand of the crude Oil.
The US Energy Information Administration (EIA) released its Oil stockpiles report, indicating that US crude inventories declined by 4.156 million barrels in the week ending on May 24. This figure exceeded expectations for a draw of 1.900 million barrels.
On Thursday, Dallas Fed President Lorie Logan expressed continued concerns about upside risks to inflation despite recent easing. Logan warned that the Federal Reserve needs to remain flexible and keep "all options on the table" as it monitors data and determines how to respond, according to Reuters. Additionally, Bloomberg reported on Wednesday that Atlanta Fed President Raphael Bostic stated the path to 2% inflation is not guaranteed and highlighted the significant breadth of price gains.
The US Dollar (USD) bounces back as investors brace for the release of the Federal Reserve's preferred inflation measure, the Core Personal Consumption Expenditures (PCE) Price Index, scheduled for Friday. However, the decrease in US Treasury yields might restrain the USD's gains. This could, in turn, bolster Oil demand as it becomes more affordable for purchasing countries with alternative currencies.
- EUR/USD drifts lower near 1.0820 in Friday’s early European session.
- The bullish outlook of the pair remains intact above the 100-day EMA on the daily timeframe.
- The immediate resistance level will emerge at 1.0875; the first downside target is seen in the 1.0800-1.0805 zone.
The EUR/USD pair weakens to 1.0820 during the early European trading hours on Friday. Investors prefer to wait on the sidelines ahead of the German Retail Sales and the US Core Personal Consumption Expenditures Price Index (Core PCE) data, which are due later on Friday. The markets expect the Core PCE Price Index inflation to show an increase of 2.8% for the year ended in April and the monthly Core PCE inflation to increase 0.3%.
According to the daily chart, EUR/USD remained capped within a descending trend channel since mid-December 2023. The major pair keeps the bullish vibe unchanged as it holds above the key 100-day Exponential Moving Average (EMA). Nonetheless, the 14-day Relative Strength Index (RSI) remains flat around the 50-midline, indicating that further consolidation looks favorable.
The upper boundary of the descending trend channel 1.0875 acts as an immediate resistance level for the major pair. A break above the latter will see a rally to a high of March 21 at 1.0943 en route to a high of March 8 at 1.0981, and finally the 1.1000 psychological level.
On the flip side, the first downside target for EUR/USD will emerge at the 1.0800-1.0805 region, portraying the confluence of the 100-day EMA and psychological level. The additional downside filter to watch is a low of April 2 at 1.0724, followed by a low of May 2 at 1.0650, and finally a low of April 16 at 1.0600.
EUR/USD daily chart
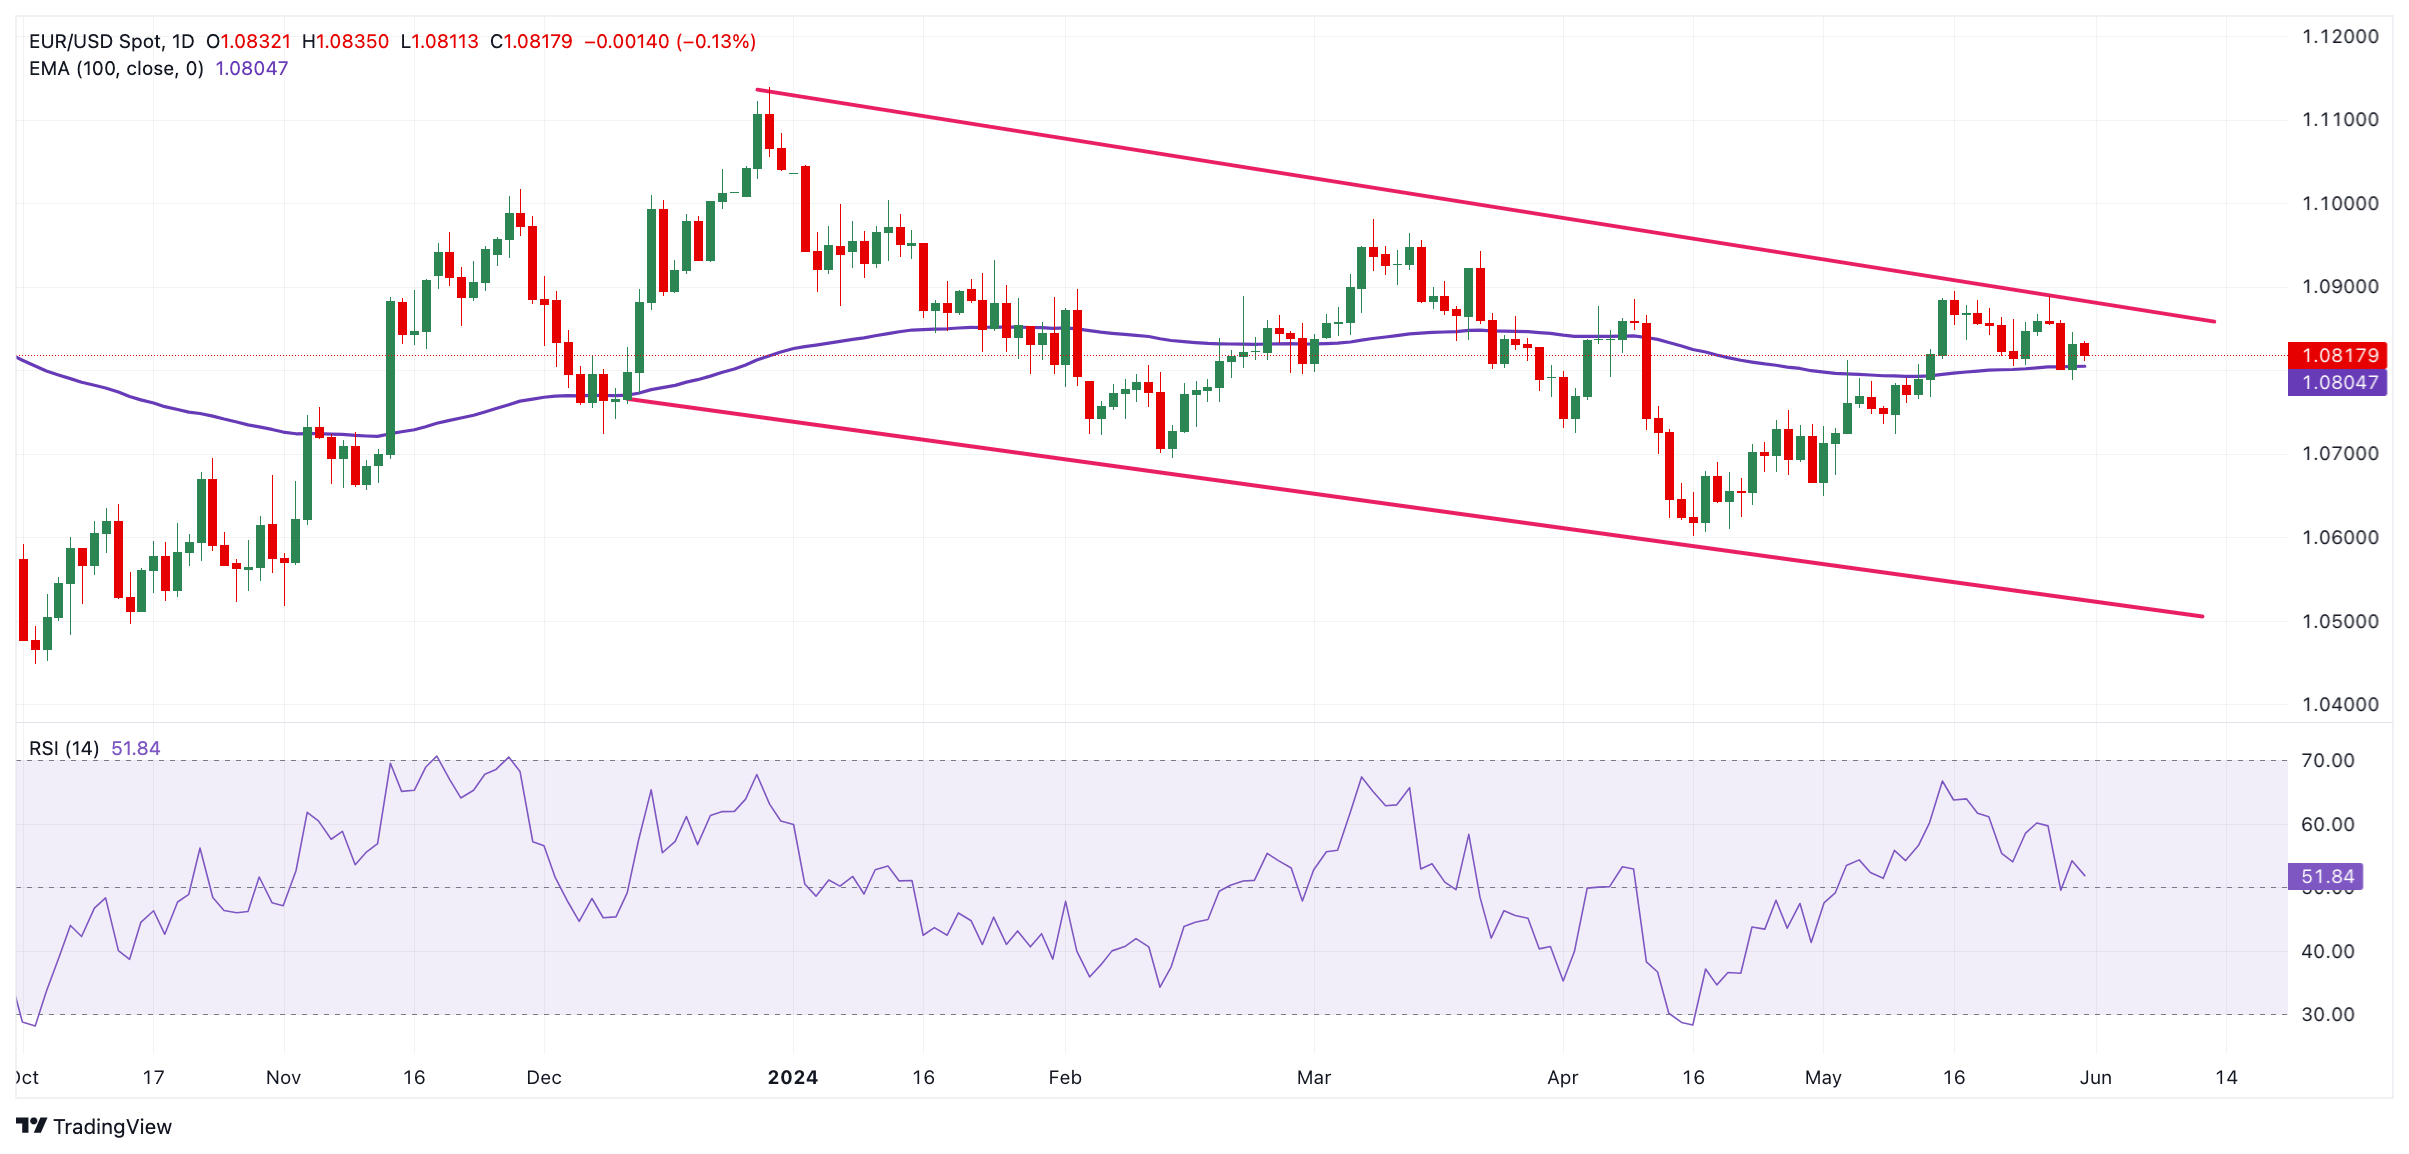
- Eurostat will release crucial European inflation data on Friday.
- Headline inflation is expected to tick higher in May.
- The European Central Bank remains cautious regarding rate cuts.
The Harmonized Index of Consumer Prices (HICP), a broad measure of inflation in the Eurozone, is set to be released on Friday, May 31. The European Central Bank (ECB) will closely analyze this inflation data amidst renewed doubts regarding the potential start of its easing cycle at its June meeting.
Following a gradual drop of the Consumer Price Index (CPI) in the Euro Area since December 2023, the index seems to have met some decent contention around 2.4% YoY, as per March and April prints.
In her last comments on April 19, ECB President Christine Lagarde argued that Euro Zone inflation is expected to decrease further and that the ECB might reduce interest rates if its long-standing price growth criteria are satisfied.
Lagarde also emphasized that the ECB Governing Council is not committing to a specific rate trajectory, reiterating the bank's latest guidance.
She noted that risks to the inflation outlook are two-sided, citing potential upside risks such as increased geopolitical tensions, higher wage growth, and more resilient profit margins than anticipated.
What can we expect in the next European inflation report?
In line with inflation data observed in other G10 countries, the consensus among economists predicts that Core HICP inflation will increase by 2.8% in the year to May, up from 2.7%, while the headline measure is expected to rise by 2.5% compared to the previous year, from a 2.4% increase seen in the prior month.
Supporting the expected uptick in consumer prices, Germany's preliminary headline Consumer Price Index (CPI) rose by 2.4% over the last twelve months in May, an increase from April’s 2.2% rise.
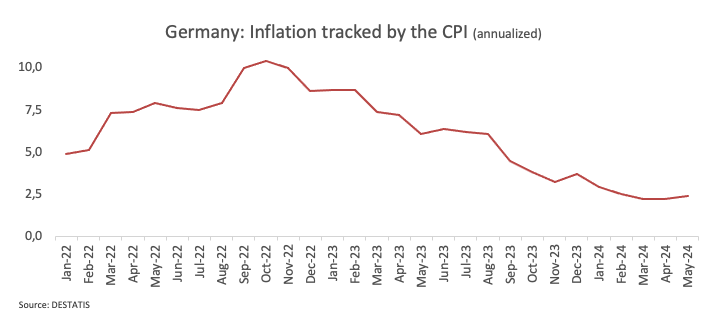
Back to the ECB, the bank published its Consumer Expectations Survey for the month of April on May 28, where consumers in the region reduced their inflation expectations, coinciding with the bank's plans to begin rolling back a record series of interest rate hikes. Indeed, expectations for inflation over the next 12 months decreased to 2.9% from 3.0% the previous month, reaching their lowest level since September 2021. Meanwhile, expectations for inflation three years out declined to 2.4% from 2.5%, though still significantly above the bank’s 2% target.
When will the HICP report be released, and how could it affect EUR/USD?
The Eurozone's preliminary HICP is scheduled to be released at 09:00 GMT on Friday. As this highly anticipated inflation data approaches, the Euro (EUR) is struggling to stay above the significant level of 1.0800 against the US Dollar (USD) in a sustainable fashion, with investors weighing the possibility of the Federal Reserve (Fed) beginning its easing cycle at some point towards year end.
Pablo Piovano, Senior Analyst at FXStreet, notes, "In case the bullish sentiment kicks in, EUR/USD is expected to face initial resistance at monthly peaks near the 1.0900 barrier. The surpass of this region in a convincing mood should allow for a potential move to the March top at 1.0981 (March 8)".
Pablo adds, "On the other hand, if the selling pressure accelerates, spot might confront the key 200-day SMA at 1.0787 ahead of the May low of 1.0649 (May 1). A deeper pullback could then see the 2024 bottom of 1.0601 (April 16)."
Economic Indicator
Harmonized Index of Consumer Prices (MoM)
The Harmonized Index of Consumer Prices (HICP) measures changes in the prices of a representative basket of goods and services in the European Monetary Union. The HICP, released by Eurostat on a monthly basis, is harmonized because the same methodology is used across all member states and their contribution is weighted. The MoM figure compares the prices of goods in the reference month to the previous month. Generally, a high reading is seen as bullish for the Euro (EUR), while a low reading is seen as bearish.
Read more.Next release: Fri May 31, 2024 09:00 (Prel)
Frequency: Monthly
Consensus: -
Previous: 0.6%
Source: Eurostat
Inflation FAQs
Inflation measures the rise in the price of a representative basket of goods and services. Headline inflation is usually expressed as a percentage change on a month-on-month (MoM) and year-on-year (YoY) basis. Core inflation excludes more volatile elements such as food and fuel which can fluctuate because of geopolitical and seasonal factors. Core inflation is the figure economists focus on and is the level targeted by central banks, which are mandated to keep inflation at a manageable level, usually around 2%.
The Consumer Price Index (CPI) measures the change in prices of a basket of goods and services over a period of time. It is usually expressed as a percentage change on a month-on-month (MoM) and year-on-year (YoY) basis. Core CPI is the figure targeted by central banks as it excludes volatile food and fuel inputs. When Core CPI rises above 2% it usually results in higher interest rates and vice versa when it falls below 2%. Since higher interest rates are positive for a currency, higher inflation usually results in a stronger currency. The opposite is true when inflation falls.
Although it may seem counter-intuitive, high inflation in a country pushes up the value of its currency and vice versa for lower inflation. This is because the central bank will normally raise interest rates to combat the higher inflation, which attract more global capital inflows from investors looking for a lucrative place to park their money.
Formerly, Gold was the asset investors turned to in times of high inflation because it preserved its value, and whilst investors will often still buy Gold for its safe-haven properties in times of extreme market turmoil, this is not the case most of the time. This is because when inflation is high, central banks will put up interest rates to combat it. Higher interest rates are negative for Gold because they increase the opportunity-cost of holding Gold vis-a-vis an interest-bearing asset or placing the money in a cash deposit account. On the flipside, lower inflation tends to be positive for Gold as it brings interest rates down, making the bright metal a more viable investment alternative.
- The Japanese Yen may appreciate due to higher economic data from Japan.
- BoJ's Adachi favored raising interest rates if a weaker JPY leads to heightened inflation.
- The decline in the US Treasury yields could limit the advance of the US Dollar.
The Japanese Yen (JPY) remains steady after the Tokyo Consumer Price Index (CPI) data by the Statistics Bureau of Japan was released on Friday. The year-over-year CPI increased to 2.2% in May, up from the previous 26-month low of a 1.8% rise.
The Bank of Japan (BoJ) has maintained a deeply entrenched monetary policy stance. If nationwide inflation in Japan declines, it will prevent the central bank from raising interest rates. The significant rate differential between Japan and other countries continues to pressure the Japanese Yen, underpinning the USD/JPY pair.
US Dollar (USD) rebounds ahead of the Federal Reserve's preferred inflation gauge, the Core Personal Consumption Expenditures (PCE) Price Index, which will be released on Friday. The decline in the US Treasury yields could limit the advance of the US Dollar.
US Dollar Index (DXY), which measures the value of the US Dollar (DXY) against six other major currencies, trades higher around 104.80 with 2-year and 10-year yields on US Treasury bonds standing at 4.92% and 4.54%, respectively, by the press time.
Daily Digest Market Movers: Japanese Yen holds ground after higher economic data
- Tokyo’s Core Consumer Price Index (CPI) rose 1.9% year-over-year in May, accelerating from a two-year low of 1.6% in April, as expected. This figure remains below the Bank of Japan's (BoJ) 2% target for the second consecutive month, reducing the pressure on the BoJ to raise interest rates soon.
- Japan’s Retail Sales (YoY) grew 2.4% in April, accelerating from a downwardly revised 1.1% rise in March and surpassing market forecasts of 1.9% growth. This marks the 26th consecutive month of expansion, indicating a sustained period of healthy consumption in Japan.
- On Thursday, US Gross Domestic Product (GDP) Annualized growth rate was revised lower to 1.3% from 1.6% for the first quarter. Additionally, the US weekly Initial Jobless Claims for the week ending May 2 rose to 219K from the previous week of 216K, above the market consensus of 218K.
- According to Bloomberg, Federal Reserve Bank of Atlanta President Raphael Bostic stated on Wednesday that the path of inflation is expected to be uneven, and a decrease in inflation breadth would bolster confidence in the necessity of a rate cut.
- On Wednesday, the Fed Beige Book report covering April to mid-May showed that national economic activity experienced slight growth, with mixed conditions across industries and districts. The report also indicated that employment rose slightly, wage growth was moderate, and prices increased modestly as consumers resisted further price hikes.
- Reuters reported that Neel Kashkari, President of the Federal Reserve Bank of Minneapolis, hinted at the possibility of a rate hike. Kashkari remarked, “I don’t believe anyone has completely ruled out the option of increasing rates,” expressing doubts about the disinflationary trend and projecting only two rate cuts.
- On Wednesday, BoJ board member Seiji Adachi emphasized the gradual reduction of bond purchases to ensure that long-term yields accurately reflect market signals. Additionally, Adachi suggested that raising interest rates could be appropriate if a weaker JPY leads to increased inflation, per Reuters.
Technical Analysis: USD/JPY drops below 157.00
The USD/JPY pair trades around 156.80 on Friday. The daily chart shows a symmetrical triangle, indicating a pause in the prevailing bullish trend. However, the 14-day Relative Strength Index (RSI) remains above 50, suggesting a continued bullish bias for the pair.
The USD/JPY pair could test the upper boundary of the symmetrical triangle, followed by the psychological level of 158.00. If this level is breached, the next target could be 160.32, marking its highest point in over thirty years.
On the downside, immediate support appears at the psychological level of 157.00, followed by the nine-day Exponential Moving Average (EMA) at 156.55. A further decline could lead the USD/JPY pair to test the lower boundary of the symmetrical triangle.
USD/JPY: Daily Chart
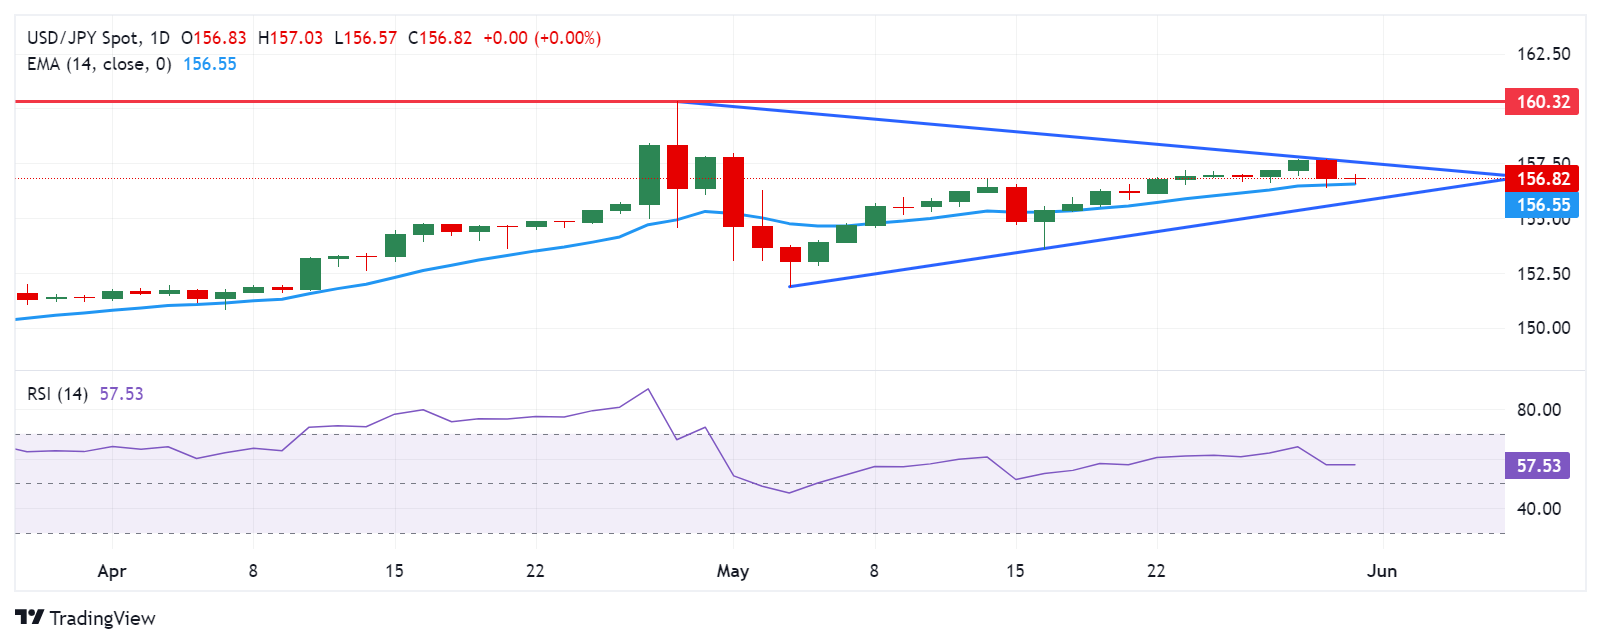
Japanese Yen price this week
The table below shows the percentage change of the Japanese Yen (JPY) against listed major currencies this week. Japanese Yen was the strongest against the Euro.
| USD | EUR | GBP | CAD | AUD | JPY | NZD | CHF | |
| USD | 0.26% | 0.10% | 0.06% | -0.17% | -0.05% | -0.09% | -1.19% | |
| EUR | -0.26% | -0.17% | -0.22% | -0.44% | -0.31% | -0.36% | -1.42% | |
| GBP | -0.10% | 0.15% | -0.05% | -0.28% | -0.15% | -0.20% | -1.30% | |
| CAD | -0.05% | 0.21% | 0.05% | -0.23% | -0.10% | -0.14% | -1.26% | |
| AUD | 0.16% | 0.42% | 0.26% | 0.22% | 0.12% | 0.07% | -1.03% | |
| JPY | 0.05% | 0.31% | 0.16% | 0.07% | -0.14% | -0.03% | -1.14% | |
| NZD | 0.09% | 0.35% | 0.19% | 0.15% | -0.09% | 0.05% | -1.11% | |
| CHF | 1.16% | 1.42% | 1.26% | 1.21% | 1.02% | 1.11% | 1.07% |
The heat map shows percentage changes of major currencies against each other. The base currency is picked from the left column, while the quote currency is picked from the top row. For example, if you pick the Euro from the left column and move along the horizontal line to the Japanese Yen, the percentage change displayed in the box will represent EUR (base)/JPY (quote).
Japanese Yen FAQs
The Japanese Yen (JPY) is one of the world’s most traded currencies. Its value is broadly determined by the performance of the Japanese economy, but more specifically by the Bank of Japan’s policy, the differential between Japanese and US bond yields, or risk sentiment among traders, among other factors.
One of the Bank of Japan’s mandates is currency control, so its moves are key for the Yen. The BoJ has directly intervened in currency markets sometimes, generally to lower the value of the Yen, although it refrains from doing it often due to political concerns of its main trading partners. The current BoJ ultra-loose monetary policy, based on massive stimulus to the economy, has caused the Yen to depreciate against its main currency peers. This process has exacerbated more recently due to an increasing policy divergence between the Bank of Japan and other main central banks, which have opted to increase interest rates sharply to fight decades-high levels of inflation.
The BoJ’s stance of sticking to ultra-loose monetary policy has led to a widening policy divergence with other central banks, particularly with the US Federal Reserve. This supports a widening of the differential between the 10-year US and Japanese bonds, which favors the US Dollar against the Japanese Yen.
The Japanese Yen is often seen as a safe-haven investment. This means that in times of market stress, investors are more likely to put their money in the Japanese currency due to its supposed reliability and stability. Turbulent times are likely to strengthen the Yen’s value against other currencies seen as more risky to invest in.
- Indian Rupee struggles to gain momentum on the modestly stronger USD.
- The Fed’s hawkish stance and cautious mood weigh on the INR.
- The Indian GDP and US core PCE data will be the highlights on Friday.
Indian Rupee (INR) weakens on Friday amid the modest rebound of the US Dollar (USD). The higher-for-longer US rate mantra from the Federal Reserve (Fed) boosts the Greenback and exerts some selling pressure on assets in emerging Asian markets, including the INR. Furthermore, cautious anticipation of the key US inflation data might support the USD for the time being.
On the other hand, the decline in crude oil prices might cap the downside for the INR, as India is the third largest oil consumer. Economists see India’s economic momentum remaining strong in the January-March quarter (Q4 FY24), with GDP growth at 6.8%. The stronger-than-expected reading could underpin the Indian Rupee and weigh on the pair in the near term. On the US docket, the US Core Personal Consumption Expenditures Price Index (Core PCE) for April will be released.
Daily Digest Market Movers: Indian Rupee remains weak despite India’s robust economic outlook
- S&P Global analysts expect robust economic fundamentals in India to underpin the growth momentum over the next two to three years.
- The Indian Rupee might stand out in the emerging market foreign exchange complex, due to its high carry-to-volatility ratio, said Goldman Sachs analysts.
- The US Gross Domestic Product (GDP) expanded at an annual rate of 1.3% in the first quarter from the 1.6% growth recorded in the first estimate and came in line with the market estimation.
- Initial claims for state unemployment benefits increased by 219K for the week ending May 25, above initial estimates of 218K and above the previous weekly gain of 216K (revised from 215K).
- Chicago Fed President Austan Goolsbee said on Thursday that inflation could still fall without rising unemployment, adding that the job market remains the strongest part of the economy, per Reuters.
- Atlanta Fed President Raphael Bostic stated that inflation will come down slowly, and the Fed is unlikely to deliver an interest rate cut in July.
- New York Fed President John Williams said that there is “ample evidence” that monetary policy is restrictive and helps to bring inflation towards the 2% target. Williams added that he doesn’t feel any urgency to cut rates.
Technical analysis: USD/INR turns bullish in the longer term
The Indian Rupee trades on a weaker note on the day. The USD/INR pair resumes its bullish bias as it holds above the key 100-day Exponential Moving Average (EMA) on the daily chart. Further consolidation is not ruled out as the 14-day Relative Strength Index (RSI) hovers around the 50-midline.
USD/INR has established a descending trend channel since mid-April. The first upside barrier will emerge near the upper boundary of the channel at 83.40. A bullish breakout will pave the way to a high of May 13 at 83.54, followed by a high of April 17 at 83.72 and then the 84.00 psychological level.
On the downside, the initial support level for USD/INR is located near the 100-day EMA around 83.20. The potential downside target to watch is the 83.00 round mark. A break below the mentioned level will see a drop to a low of January 15 at 82.78 and finally a low of March 11 at 82.65.
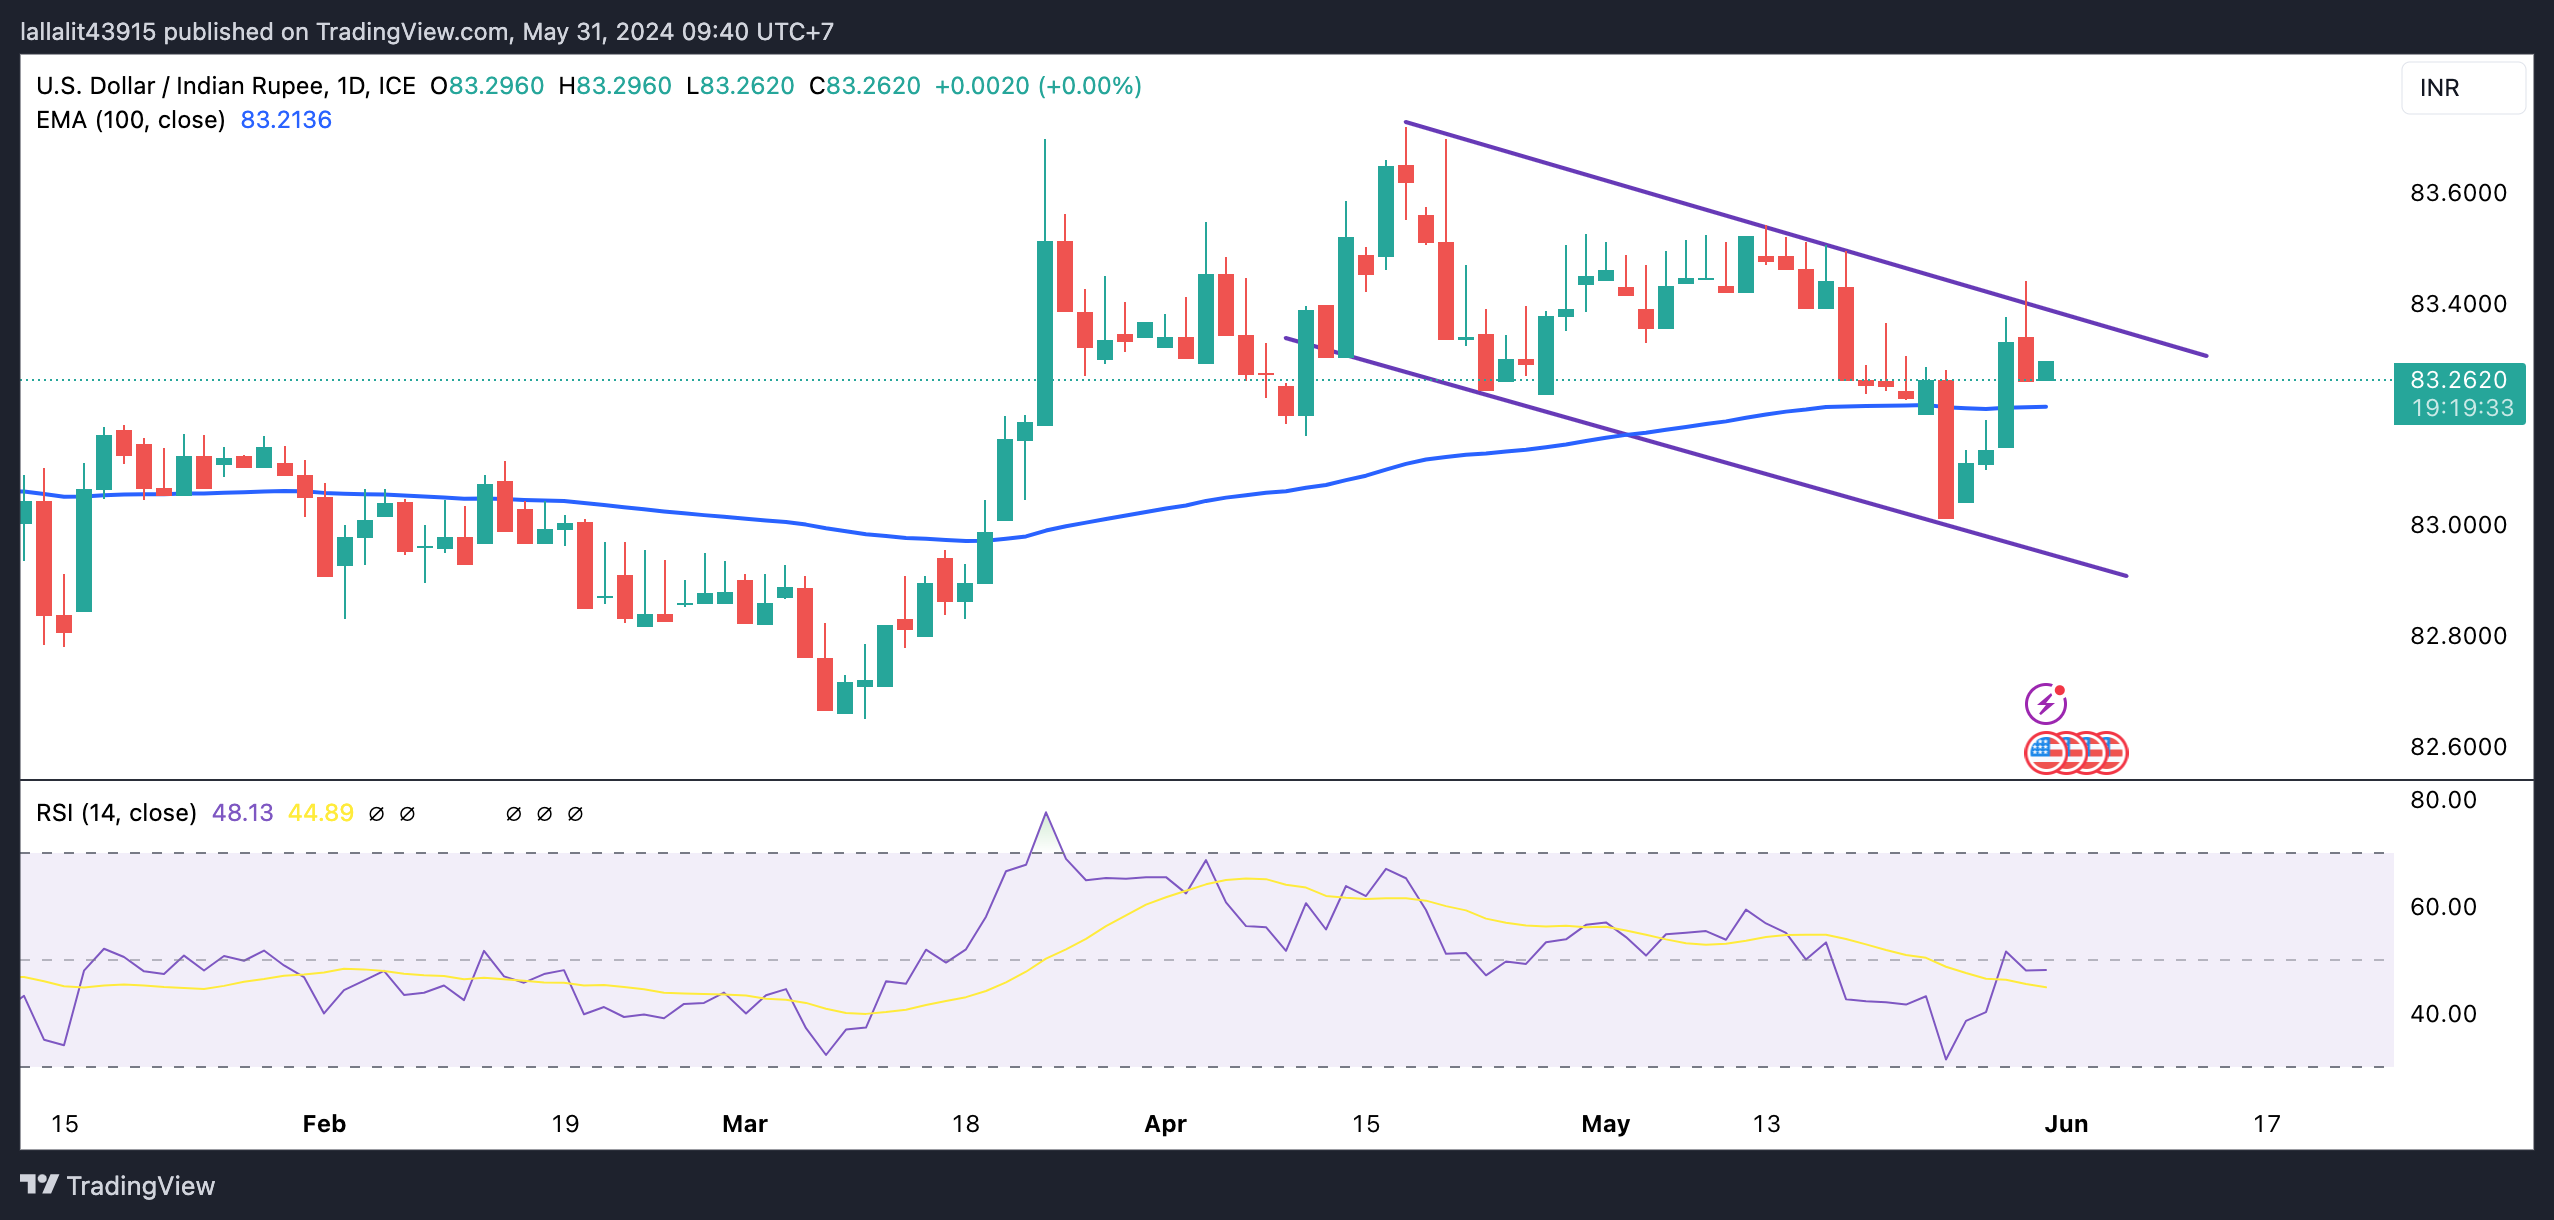
US Dollar price today
The table below shows the percentage change of US Dollar (USD) against listed major currencies today. US Dollar was the strongest against the Euro.
| USD | EUR | GBP | CAD | AUD | JPY | NZD | CHF | |
| USD | 0.17% | 0.07% | 0.02% | 0.01% | -0.12% | -0.09% | 0.04% | |
| EUR | -0.15% | -0.08% | -0.14% | -0.14% | -0.27% | -0.23% | -0.11% | |
| GBP | -0.08% | 0.07% | -0.07% | -0.07% | -0.20% | -0.17% | -0.05% | |
| CAD | -0.02% | 0.11% | 0.07% | -0.02% | -0.14% | -0.11% | 0.02% | |
| AUD | 0.01% | 0.11% | 0.07% | 0.01% | -0.13% | -0.10% | 0.03% | |
| JPY | 0.12% | 0.25% | 0.18% | 0.13% | 0.13% | 0.03% | 0.15% | |
| NZD | 0.05% | 0.24% | 0.17% | 0.09% | 0.10% | -0.05% | 0.13% | |
| CHF | -0.03% | 0.12% | 0.04% | -0.02% | -0.01% | -0.15% | -0.10% |
The heat map shows percentage changes of major currencies against each other. The base currency is picked from the left column, while the quote currency is picked from the top row. For example, if you pick the Euro from the left column and move along the horizontal line to the Japanese Yen, the percentage change displayed in the box will represent EUR (base)/JPY (quote).
Indian Rupee FAQs
The Indian Rupee (INR) is one of the most sensitive currencies to external factors. The price of Crude Oil (the country is highly dependent on imported Oil), the value of the US Dollar – most trade is conducted in USD – and the level of foreign investment, are all influential. Direct intervention by the Reserve Bank of India (RBI) in FX markets to keep the exchange rate stable, as well as the level of interest rates set by the RBI, are further major influencing factors on the Rupee.
The Reserve Bank of India (RBI) actively intervenes in forex markets to maintain a stable exchange rate, to help facilitate trade. In addition, the RBI tries to maintain the inflation rate at its 4% target by adjusting interest rates. Higher interest rates usually strengthen the Rupee. This is due to the role of the ‘carry trade’ in which investors borrow in countries with lower interest rates so as to place their money in countries’ offering relatively higher interest rates and profit from the difference.
Macroeconomic factors that influence the value of the Rupee include inflation, interest rates, the economic growth rate (GDP), the balance of trade, and inflows from foreign investment. A higher growth rate can lead to more overseas investment, pushing up demand for the Rupee. A less negative balance of trade will eventually lead to a stronger Rupee. Higher interest rates, especially real rates (interest rates less inflation) are also positive for the Rupee. A risk-on environment can lead to greater inflows of Foreign Direct and Indirect Investment (FDI and FII), which also benefit the Rupee.
Higher inflation, particularly, if it is comparatively higher than India’s peers, is generally negative for the currency as it reflects devaluation through oversupply. Inflation also increases the cost of exports, leading to more Rupees being sold to purchase foreign imports, which is Rupee-negative. At the same time, higher inflation usually leads to the Reserve Bank of India (RBI) raising interest rates and this can be positive for the Rupee, due to increased demand from international investors. The opposite effect is true of lower inflation.
- USD/CAD rebounds as investors adopt caution ahead of US PCE on Friday.
- The decline in the US Treasury yields could limit the advance of the US Dollar.
- Canada’s GDP Annualized is expected to expand by 2.2% in the first quarter.
USD/CAD halts its recent losses, trading around 1.3690 during the Asian session on Friday. US Dollar (USD) rebounds ahead of the Federal Reserve's preferred inflation gauge, the Core Personal Consumption Expenditures (PCE) Price Index, which will be released on Friday.
US Gross Domestic Product (GDP) Annualized growth rate was revised lower to 1.3% from 1.6% for the first quarter, prompting investors to adjust the Federal Reserve’s (Fed) policy outlook to loosen. This causes uncertainty about a September rate cut. Additionally, the US weekly Initial Jobless Claims for the week ending May 2 rose to 219K from the previous week of 216K, above the market consensus of 218K.
The decline in the US Treasury yields could limit the advance of the US Dollar. US Dollar Index (DXY), which measures the value of the US Dollar (DXY) against six other major currencies, trades higher around 104.80 with 2-year and 10-year yields on US Treasury bonds standing at 4.92% and 4.54%, respectively, by the press time.
In Canada, expectations for June rate cuts by the Bank of Canada (BoC) have waned due to recent data indicating ongoing price pressures. In April, producer prices surged by 1.5% from the previous month, following a 0.9% increase in March, nearly doubling the anticipated 0.8% change. Interest rate futures now show that only 34% of the market is expecting a 25-basis point rate cut at the BoC’s June meeting, down from 46% a week ago.
On Friday, Statistics Canada will release the country's Gross Domestic Product (GDP) data. The annualized figure for the first quarter is expected to show a 2.2% expansion, up from the 1.0% growth recorded in the previous quarter.
| Raw materials | Closed | Change, % |
|---|---|---|
| Silver | 31.12 | -2.67 |
| Gold | 2342.49 | 0.17 |
| Palladium | 948.29 | -0.61 |
- The Australian Dollar depreciated as China's Manufacturing PMI fell to 49.5 in May.
- The AUD could appreciate due to the hawkish sentiment surrounding the RBA hiking rates again.
- US Dollar rebounds despite the lower US Treasury yields ahead of Core PCE on Friday.
The Australian Dollar (AUD) trimmed its gains after the release of lower-than-expected NBS Purchasing Managers Index (PMI) data from China on Friday. Given the close trade relationship between Australia and China, any changes in the Chinese economy can significantly impact the Australian market. However, the AUD/USD pair had gained ground earlier in the day as the US Dollar (USD) struggled due to a slowdown in the US economy.
The AUD also found support as the monthly inflation rate accelerated to 3.6%, raising the possibility that the Reserve Bank of Australia (RBA) might need to hike interest rates again. Investors anticipate that the RBA will maintain high rates for a longer period, with a rate cut not expected until May next year.
The US Dollar Index (DXY), which measures the US Dollar against six major currencies, received pressure from a drop in US Treasury yields. This could be attributed to the US Gross Domestic Product (GDP) Annualized growth rate being revised lower to 1.3% from 1.6% for the first quarter. Traders are likely looking ahead to the Federal Reserve's preferred inflation gauge, the Core Personal Consumption Expenditures (PCE) Price Index, which will be released on Friday.
Daily Digest Market Movers: Australian Dollar trims gains after lower China PMI
- China’s NBS Manufacturing Purchasing Managers Index (PMI) fell to 49.5 in May from 50.4 in April, missing the market consensus of an increase to 50.5. Meanwhile, the Non-Manufacturing PMI declined to 51.1 from the previous reading of 51.2, falling short of the estimated 51.5.
- Australia's Private Capital Expenditure increased by 1.0% in Q1, exceeding expectations for a 0.5% rise and surpassing the previous quarter's 0.9% increase.
- As per a Bloomberg report, RBA Assistant Governor Sarah Hunter said at a conference in Sydney on Thursday that “inflationary pressures" are the key issue. “We’re very mindful of that." Hunter also stated that the RBA Board is concerned about inflation remaining above the target range of 1%-3%, suggesting persistent inflationary pressure. Wages growth appears to be near its peak.
- Bloomberg reported on Wednesday that Atlanta Fed President Raphael Bostic stated that the path to 2% inflation is not assured and that the breadth of price gains is still significant.
- Australia’s Monthly Consumer Price Index rose 3.6% year-over-year in April, surpassing the expected reading of 3.4% and the previous reading of 3.5%.
- On Tuesday, Neel Kashkari, President of the Federal Reserve Bank of Minneapolis, suggested that a rate hike might still be possible. Kashkari stated, “I don’t think anybody has taken rate increases off the table,” and expressed uncertainty about the disinflationary process, predicting only two rate cuts, per MSN.
- US Housing Price Index (MoM) for March was underperformed, with March's number coming in at 0.1% against 1.2% for February, where 0.5% was expected.
Technical Analysis: Australian Dollar remains above the key level of 0.6600
The Australian Dollar trades around 0.6630 on Friday. An analysis of the daily chart suggests a bullish bias for the AUD/USD pair, as it consolidates within the rising wedge. The 14-day Relative Strength Index (RSI) is positioned slightly above the 50 level, suggesting a confirmation of a bullish bias.
The AUD/USD pair could target the psychological level of 0.6700, followed by the four-month high of 0.6714 and the upper limit of the rising wedge around 0.6740.
On the downside, the immediate support appears at the psychological level of 0.6600 around the lower boundary of the rising wedge. Next support appears at the 50-day Exponential Moving Average (EMA) at 0.6588. A further decline could exert downward pressure on the AUD/USD pair, potentially driving it toward the throwback support region at 0.6470.
AUD/USD: Daily Chart
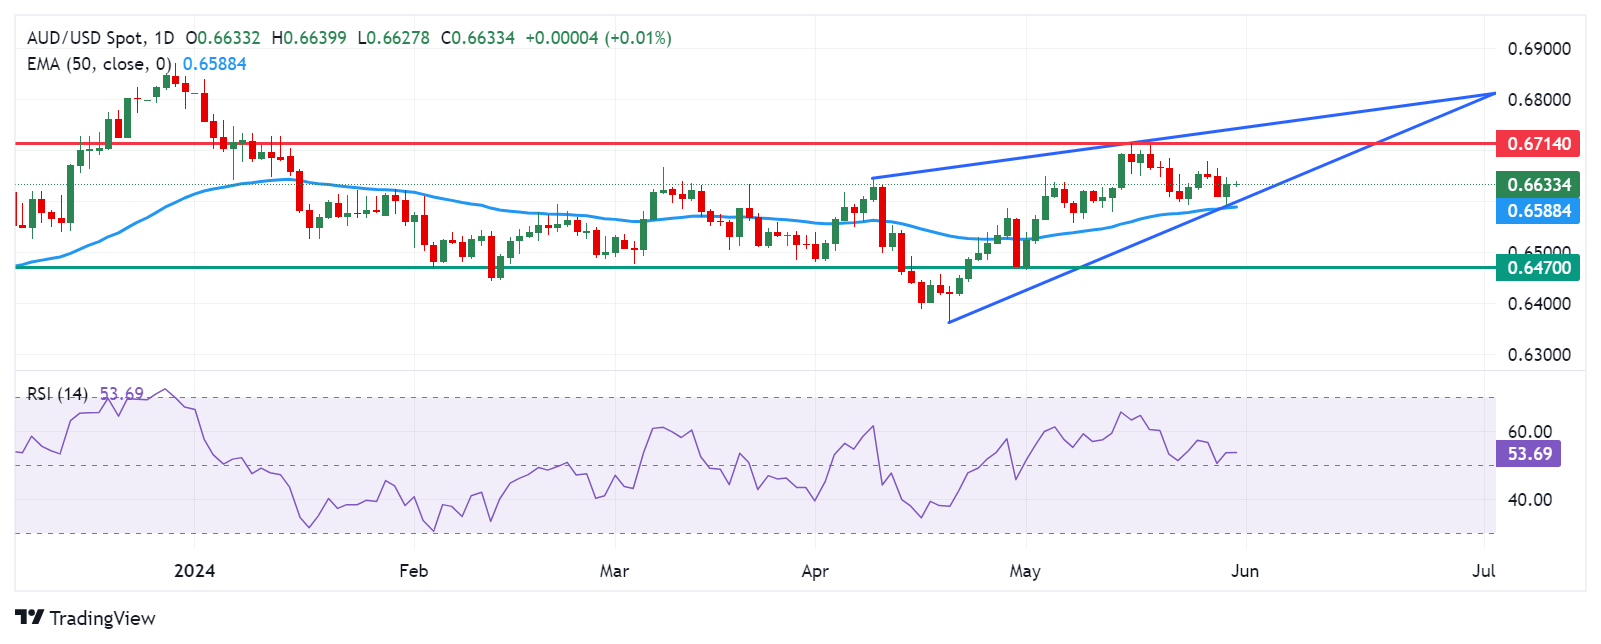
Australian Dollar price today
The table below shows the percentage change of the Australian Dollar (AUD) against listed major currencies today. The Australian Dollar was the weakest against the Japanese Yen.
| USD | EUR | GBP | CAD | AUD | JPY | NZD | CHF | |
| USD | 0.11% | 0.03% | -0.02% | -0.06% | -0.23% | -0.17% | -0.05% | |
| EUR | -0.07% | -0.06% | -0.10% | -0.13% | -0.30% | -0.24% | -0.13% | |
| GBP | -0.03% | 0.06% | -0.05% | -0.08% | -0.26% | -0.19% | -0.08% | |
| CAD | 0.02% | 0.11% | 0.05% | -0.04% | -0.21% | -0.14% | -0.04% | |
| AUD | 0.06% | 0.13% | 0.08% | 0.04% | -0.17% | -0.10% | 0.00% | |
| JPY | 0.23% | 0.31% | 0.24% | 0.20% | 0.15% | 0.06% | 0.17% | |
| NZD | 0.14% | 0.25% | 0.19% | 0.12% | 0.10% | -0.09% | 0.11% | |
| CHF | 0.06% | 0.14% | 0.09% | 0.04% | 0.00% | -0.17% | -0.10% |
The heat map shows percentage changes of major currencies against each other. The base currency is picked from the left column, while the quote currency is picked from the top row. For example, if you pick the Euro from the left column and move along the horizontal line to the Japanese Yen, the percentage change displayed in the box will represent EUR (base)/JPY (quote).
Australian Dollar FAQs
One of the most significant factors for the Australian Dollar (AUD) is the level of interest rates set by the Reserve Bank of Australia (RBA). Because Australia is a resource-rich country another key driver is the price of its biggest export, Iron Ore. The health of the Chinese economy, its largest trading partner, is a factor, as well as inflation in Australia, its growth rate and Trade Balance. Market sentiment – whether investors are taking on more risky assets (risk-on) or seeking safe-havens (risk-off) – is also a factor, with risk-on positive for AUD.
The Reserve Bank of Australia (RBA) influences the Australian Dollar (AUD) by setting the level of interest rates that Australian banks can lend to each other. This influences the level of interest rates in the economy as a whole. The main goal of the RBA is to maintain a stable inflation rate of 2-3% by adjusting interest rates up or down. Relatively high interest rates compared to other major central banks support the AUD, and the opposite for relatively low. The RBA can also use quantitative easing and tightening to influence credit conditions, with the former AUD-negative and the latter AUD-positive.
China is Australia’s largest trading partner so the health of the Chinese economy is a major influence on the value of the Australian Dollar (AUD). When the Chinese economy is doing well it purchases more raw materials, goods and services from Australia, lifting demand for the AUD, and pushing up its value. The opposite is the case when the Chinese economy is not growing as fast as expected. Positive or negative surprises in Chinese growth data, therefore, often have a direct impact on the Australian Dollar and its pairs.
Iron Ore is Australia’s largest export, accounting for $118 billion a year according to data from 2021, with China as its primary destination. The price of Iron Ore, therefore, can be a driver of the Australian Dollar. Generally, if the price of Iron Ore rises, AUD also goes up, as aggregate demand for the currency increases. The opposite is the case if the price of Iron Ore falls. Higher Iron Ore prices also tend to result in a greater likelihood of a positive Trade Balance for Australia, which is also positive of the AUD.
The Trade Balance, which is the difference between what a country earns from its exports versus what it pays for its imports, is another factor that can influence the value of the Australian Dollar. If Australia produces highly sought after exports, then its currency will gain in value purely from the surplus demand created from foreign buyers seeking to purchase its exports versus what it spends to purchase imports. Therefore, a positive net Trade Balance strengthens the AUD, with the opposite effect if the Trade Balance is negative.
China’s official Manufacturing Purchasing Managers' Index (PMI) dropped from 50.4 in April to 49.5 In May, the latest data published by the National Bureau of Statistics (NBS) showed Friday.
The reading missed the market consensus of 50.5 in the reported month, by a wide margin.
The index continued to hold above the 50 mark, which separates expansion from contraction.
The NBS Non-Manufacturing PMI declined to 51.1 in May versus April’s 51.2 figure and the estimates of 51.5.
AUD/USD reaction to China's PMI data
The downbeat Chinese PMIs are weighing on the Australian Dollar, as AUD/USD erasing gains to trade neutral near 0.6630, as of writing.
Australian Dollar FAQs
One of the most significant factors for the Australian Dollar (AUD) is the level of interest rates set by the Reserve Bank of Australia (RBA). Because Australia is a resource-rich country another key driver is the price of its biggest export, Iron Ore. The health of the Chinese economy, its largest trading partner, is a factor, as well as inflation in Australia, its growth rate and Trade Balance. Market sentiment – whether investors are taking on more risky assets (risk-on) or seeking safe-havens (risk-off) – is also a factor, with risk-on positive for AUD.
The Reserve Bank of Australia (RBA) influences the Australian Dollar (AUD) by setting the level of interest rates that Australian banks can lend to each other. This influences the level of interest rates in the economy as a whole. The main goal of the RBA is to maintain a stable inflation rate of 2-3% by adjusting interest rates up or down. Relatively high interest rates compared to other major central banks support the AUD, and the opposite for relatively low. The RBA can also use quantitative easing and tightening to influence credit conditions, with the former AUD-negative and the latter AUD-positive.
China is Australia’s largest trading partner so the health of the Chinese economy is a major influence on the value of the Australian Dollar (AUD). When the Chinese economy is doing well it purchases more raw materials, goods and services from Australia, lifting demand for the AUD, and pushing up its value. The opposite is the case when the Chinese economy is not growing as fast as expected. Positive or negative surprises in Chinese growth data, therefore, often have a direct impact on the Australian Dollar and its pairs.
Iron Ore is Australia’s largest export, accounting for $118 billion a year according to data from 2021, with China as its primary destination. The price of Iron Ore, therefore, can be a driver of the Australian Dollar. Generally, if the price of Iron Ore rises, AUD also goes up, as aggregate demand for the currency increases. The opposite is the case if the price of Iron Ore falls. Higher Iron Ore prices also tend to result in a greater likelihood of a positive Trade Balance for Australia, which is also positive of the AUD.
The Trade Balance, which is the difference between what a country earns from its exports versus what it pays for its imports, is another factor that can influence the value of the Australian Dollar. If Australia produces highly sought after exports, then its currency will gain in value purely from the surplus demand created from foreign buyers seeking to purchase its exports versus what it spends to purchase imports. Therefore, a positive net Trade Balance strengthens the AUD, with the opposite effect if the Trade Balance is negative.
The People’s Bank of China (PBoC) set the USD/CNY central rate for the trading session ahead on Friday at 7.1088, as against the previous day's fix of 7.1111 and 7.2383 Reuters estimates.
- Gold price trades with a mild positive bias on Friday.
- The weaker USD and decline of US yields support the yellow metal.
- Investors will take more cues from the US April PCE inflation data, which is due on Friday.
Gold price (XAU/USD) rises modestly on Friday on the back of the softer US dollar (USD) and lower US yields. Traders place higher bets that the Federal Reserve (Fed) will cut the interest rate this year after the recent weaker US GDP data. Furthermore, the geopolitical risks and conflicts in the Middle East might boost the precious metal as it is perceived as a traditional safe-haven asset.
Later on Friday, gold traders will keep an eye on the US April Core Personal Consumption Expenditures Price Index (Core PCE), the Fed’s preferred inflation measure. The Core PCE figure is projected to show an increase of 0.3% MoM and 2.8% YoY in April. In case of the hotter-than-expected inflation data, this might provide some support to the Greenback and cap the upside for gold price.
Daily Digest Market Movers: Gold price edges higher amid the Middle East geopolitical tensions and weaker US GDP report
- Israel is in effective control of Gaza’s entire land border after taking control of a buffer zone along the border with Egypt, Israel’s military has said, a move that may complicate its ties with Egypt, per the Guardian.
- The second estimate of US Gross Domestic Product (GDP) showed the economy expanded at an annualized pace of 1.3% in Q1 from 1.6% in the previous reading, in line with market expectations.
- The US weekly Initial Jobless Claims for the week ending May 25 rose to 219K from the previous week of 216K, above the market consensus of 218K.
- Chicago Fed President Austan Goolsbee said on Thursday that housing inflation remains a key sticking point in price growth and that the US labor market remains quite strong.
- Atlanta Fed President Raphael Bostic stated that central bankers are unlikely to deliver an interest rate cut in July amid signs that inflation progress has slowed.
- New York Fed President John Williams noted that inflation is still too high, but he is confident it will start decelerating later this year, per CNBC.
Technical analysis: Gold price remains positive on the daily chart
The gold price posts modest gains on the day. Technically, the yellow metal maintains the bullish picture unchanged as it is above the key 100-day Exponential Moving Average (EMA) on the daily timeframe. Nonetheless, the 14-day Relative Strength Index (RSI) hovers around the 50-midline, suggesting a lack of direction of gold price and further consolidation looks favourable.
The upper boundary of the Bollinger Band near $2,425 acts as an immediate resistance level for precious metal. Any follow-through buying will see a rally to the all-time high of $2,450 en route to the $2,500 psychological barrier.
On the other hand, the key contention level will emerge at the $2,290–$2,300 region, portraying the lower limit of the Bollinger Band and the round mark. A decisive break below this level will drag the yellow metal lower to the 100-day EMA of $2,230.
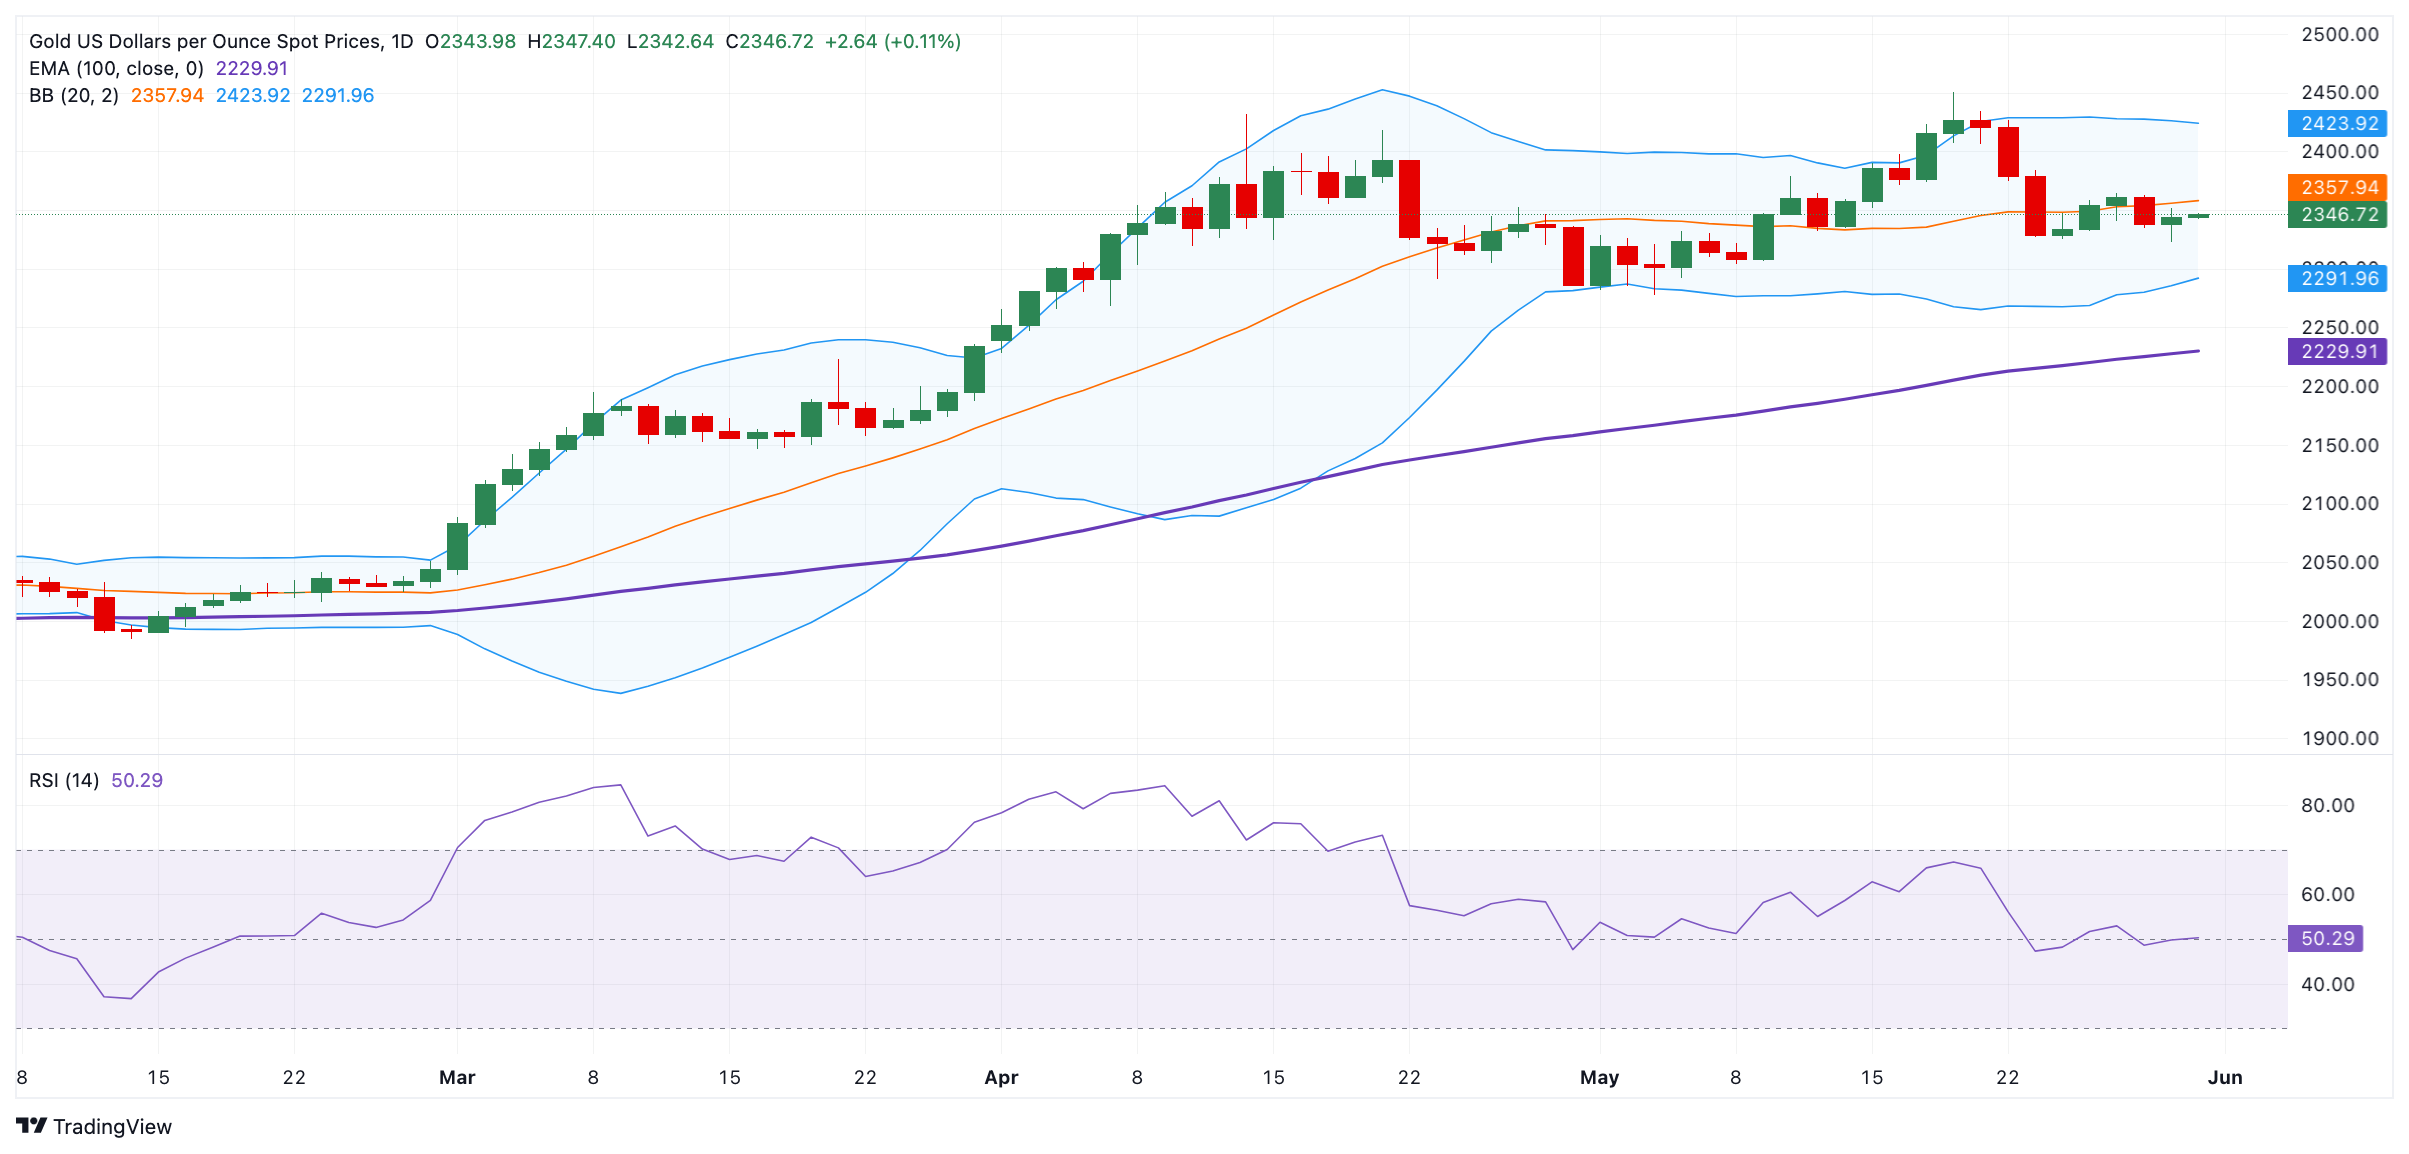
US Dollar price today
The table below shows the percentage change of US Dollar (USD) against listed major currencies today. US Dollar was the weakest against the New Zealand Dollar.
| USD | EUR | GBP | CAD | AUD | JPY | NZD | CHF | |
| USD | 0.00% | -0.02% | -0.03% | -0.15% | -0.15% | -0.19% | -0.09% | |
| EUR | 0.02% | -0.02% | -0.02% | -0.11% | -0.11% | -0.14% | -0.06% | |
| GBP | 0.02% | 0.00% | 0.00% | -0.10% | -0.10% | -0.14% | -0.05% | |
| CAD | 0.03% | 0.01% | 0.01% | -0.10% | -0.10% | -0.13% | -0.05% | |
| AUD | 0.13% | 0.10% | 0.11% | 0.09% | -0.02% | -0.05% | 0.03% | |
| JPY | 0.14% | 0.14% | 0.10% | 0.09% | 0.00% | -0.03% | 0.05% | |
| NZD | 0.16% | 0.14% | 0.14% | 0.12% | 0.03% | 0.01% | 0.09% | |
| CHF | 0.07% | 0.05% | 0.05% | 0.04% | -0.07% | -0.07% | -0.11% |
The heat map shows percentage changes of major currencies against each other. The base currency is picked from the left column, while the quote currency is picked from the top row. For example, if you pick the Euro from the left column and move along the horizontal line to the Japanese Yen, the percentage change displayed in the box will represent EUR (base)/JPY (quote).
Gold FAQs
Gold has played a key role in human’s history as it has been widely used as a store of value and medium of exchange. Currently, apart from its shine and usage for jewelry, the precious metal is widely seen as a safe-haven asset, meaning that it is considered a good investment during turbulent times. Gold is also widely seen as a hedge against inflation and against depreciating currencies as it doesn’t rely on any specific issuer or government.
Central banks are the biggest Gold holders. In their aim to support their currencies in turbulent times, central banks tend to diversify their reserves and buy Gold to improve the perceived strength of the economy and the currency. High Gold reserves can be a source of trust for a country’s solvency. Central banks added 1,136 tonnes of Gold worth around $70 billion to their reserves in 2022, according to data from the World Gold Council. This is the highest yearly purchase since records began. Central banks from emerging economies such as China, India and Turkey are quickly increasing their Gold reserves.
Gold has an inverse correlation with the US Dollar and US Treasuries, which are both major reserve and safe-haven assets. When the Dollar depreciates, Gold tends to rise, enabling investors and central banks to diversify their assets in turbulent times. Gold is also inversely correlated with risk assets. A rally in the stock market tends to weaken Gold price, while sell-offs in riskier markets tend to favor the precious metal.
The price can move due to a wide range of factors. Geopolitical instability or fears of a deep recession can quickly make Gold price escalate due to its safe-haven status. As a yield-less asset, Gold tends to rise with lower interest rates, while higher cost of money usually weighs down on the yellow metal. Still, most moves depend on how the US Dollar (USD) behaves as the asset is priced in dollars (XAU/USD). A strong Dollar tends to keep the price of Gold controlled, whereas a weaker Dollar is likely to push Gold prices up.
Japanese Finance Minister Shunichi Suzuki said on Friday that the foreign exchange (FX) rates should reflect fundamentals and he will respond appropriately to excessive FX moves.
Key quotes
Warns that increasing bond yields could strain government finances
Aims income tax cut to wipe out deflation.
Vows to restore fiscal health with determination
FX Level Determined by Market
Currency rates should reflect fundamentals
FX stability is important
Will respond appropriately to excessive FX moves
Market reaction
At the time of writing, USD/JPY is trading 0.11% lower on the day to trade at 156.67.
Japanese Yen FAQs
The Japanese Yen (JPY) is one of the world’s most traded currencies. Its value is broadly determined by the performance of the Japanese economy, but more specifically by the Bank of Japan’s policy, the differential between Japanese and US bond yields, or risk sentiment among traders, among other factors.
One of the Bank of Japan’s mandates is currency control, so its moves are key for the Yen. The BoJ has directly intervened in currency markets sometimes, generally to lower the value of the Yen, although it refrains from doing it often due to political concerns of its main trading partners. The current BoJ ultra-loose monetary policy, based on massive stimulus to the economy, has caused the Yen to depreciate against its main currency peers. This process has exacerbated more recently due to an increasing policy divergence between the Bank of Japan and other main central banks, which have opted to increase interest rates sharply to fight decades-high levels of inflation.
The BoJ’s stance of sticking to ultra-loose monetary policy has led to a widening policy divergence with other central banks, particularly with the US Federal Reserve. This supports a widening of the differential between the 10-year US and Japanese bonds, which favors the US Dollar against the Japanese Yen.
The Japanese Yen is often seen as a safe-haven investment. This means that in times of market stress, investors are more likely to put their money in the Japanese currency due to its supposed reliability and stability. Turbulent times are likely to strengthen the Yen’s value against other currencies seen as more risky to invest in.
- USD.JPY recovers from intraday lows near 156.40.
- Tokyo CPI inflation bounces from two-year lows in May.
- Investors look ahead to key US inflation data on Friday.
USD/JPY bounced in early Friday trading, catching a ride to the 157.00 handle from a near-term low of 156.40. Japanese Tokyo Consumer Price Index (CPI) inflation bounced early Friday, paving the way for investors to pivot towards Friday’s US Personal Consumption Expenditures (PCE) Price Index inflation print.
Japanese Tokyo Consumer Price Index (CPI) inflation printed higher in May, climbing 2.2% for the year ended in May, rebounding from the previous period’s 26-month low of 1.8%. Japanese Retail Trade also rebound from a two-year low to 2.4%, rising above the forecast 1.9% and recovering from the previous 1.1%, which was revised even lower from 1.2%.
Read more: Japanese Tokyo CPI inflation rises to 2.2% from 1.8%, recovers from 26-month low
With Tokyo CPI inflation out of the way, which acts as a preview for Japanes nationwide inflation released around three weeks after Tokyo CPI, markets are free to pivot to key US data due on Friday.
Market sentiment recovered on Thursday after US Gross Domestic Product (GDP) eased to 1.3% growth over the first quarter, down from the previous 1.6%. Easing growth figures in the US are helping to bolster rate cut hopes, keeping broad-market risk sentiment on the top side heading into Friday.
US Core Personal Consumption Expenditure (PCE) Price Index inflation data is due during Friday’s US market session, and is expected to hold steady at 0.3% MoM as investors hope for enough easing in US economic figures to prompt a rate cut from the Federal Reserve (Fed).
According to the CME FedWatch Tool, rate markets are pricing in better-than-even odds of at least a quarter-point rate trim from the Federal Open Market Committee (FOMC) when the rate-setting arm of the Fed meets in September.
USD/JPY technical outlook
USD/JPY found a quick bump into the 157.00 handle early Friday, but the pair is receding back into familiar congestion near 156.80. The pair has been hamstrung along the 200-hour Exponential Moving Average (EMA) at 156.73 since falling back from this week’s peak near 157.70.
Daily candlesticks chalked in their first meaningful bearish candle since declining nearly 1.0% on May 15, but the pair overall remains firmly bullish as bids trade well above the 200-day EMA at 149.47.
USD/JPY hourly chart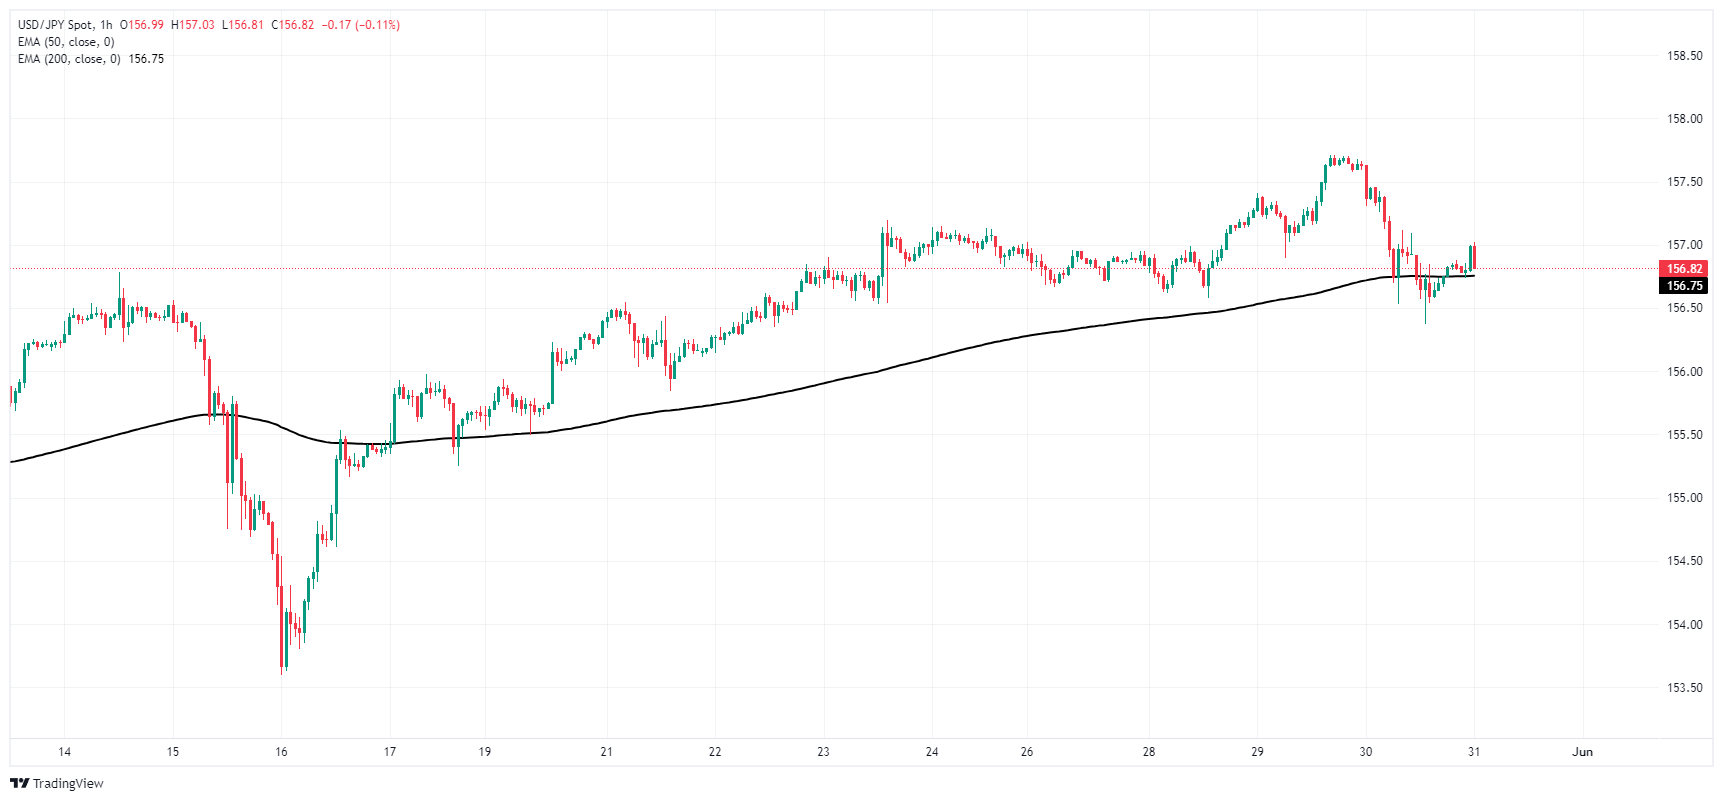
USD/JPY daily chart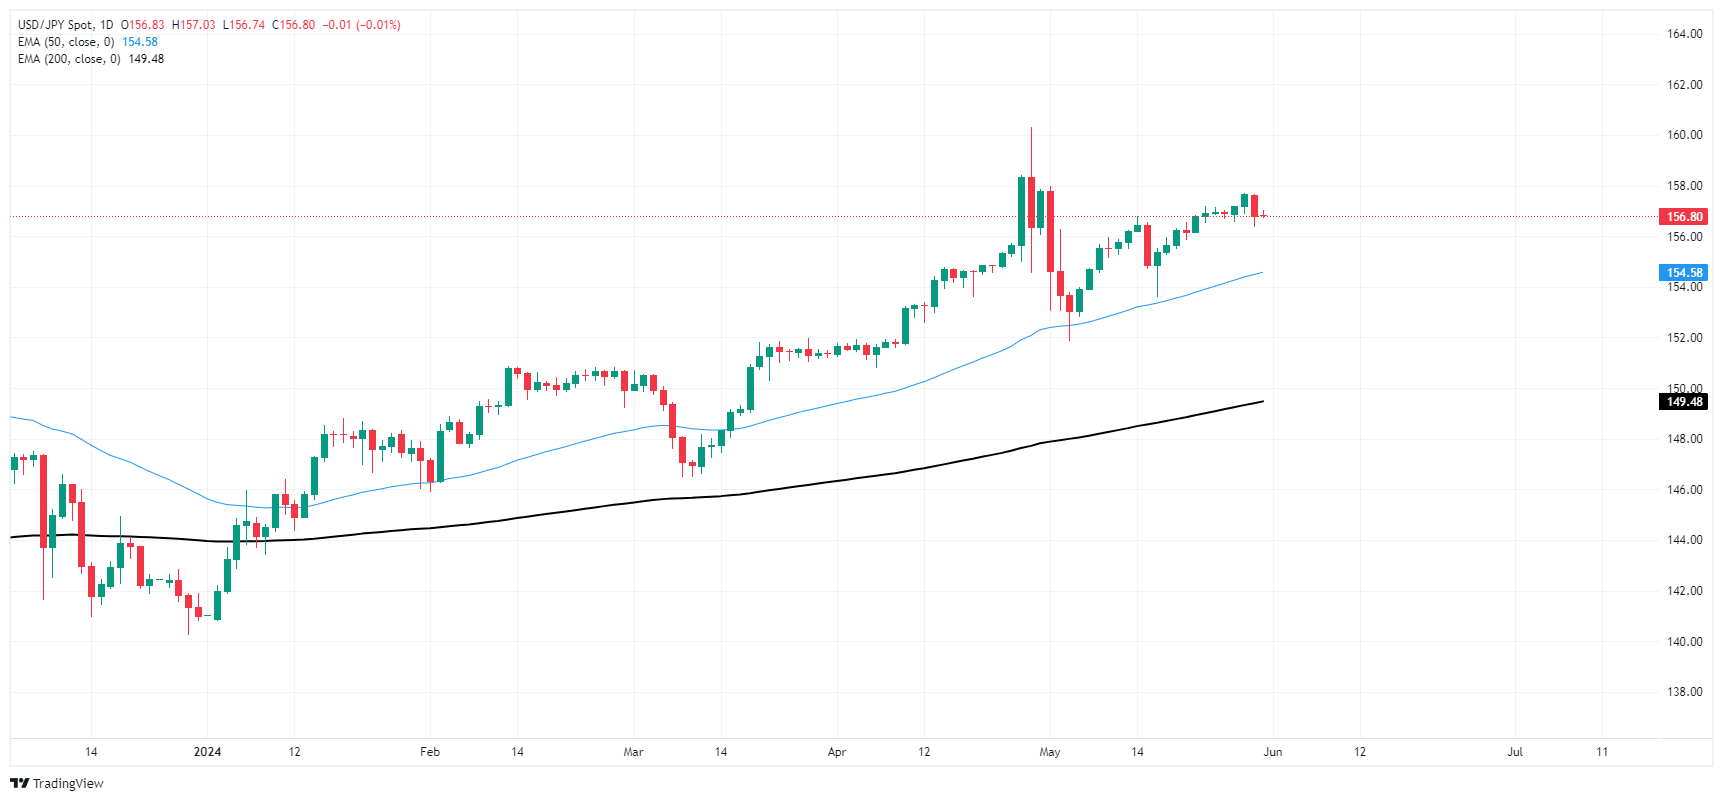
| Index | Change, points | Closed | Change, % |
|---|---|---|---|
| NIKKEI 225 | -502.74 | 38054.13 | -1.3 |
| Hang Seng | -246.82 | 18230.19 | -1.34 |
| KOSPI | -41.86 | 2635.44 | -1.56 |
| ASX 200 | -37.4 | 7628.2 | -0.49 |
| DAX | 23.5 | 18496.79 | 0.13 |
| CAC 40 | 43.48 | 7978.51 | 0.55 |
| Dow Jones | -330.06 | 38111.48 | -0.86 |
| S&P 500 | -31.47 | 5235.48 | -0.6 |
| NASDAQ Composite | -183.5 | 16737.08 | -1.08 |
| Pare | Closed | Change, % |
|---|---|---|
| AUDUSD | 0.66317 | 0.33 |
| EURJPY | 169.833 | -0.28 |
| EURUSD | 1.08325 | 0.27 |
| GBPJPY | 199.599 | -0.31 |
| GBPUSD | 1.2732 | 0.25 |
| NZDUSD | 0.61144 | -0.01 |
| USDCAD | 1.36775 | -0.3 |
| USDCHF | 0.90319 | -1.08 |
| USDJPY | 156.768 | -0.56 |
Japanese Retail Trade grew 2.4% YoY in April, over and above the forecast 1.9% and recovering from the previous period's 24-month low of 1.1%, which was revised even lower from the initial print of 1.2%.
Japanese Large Retailer Sales grew 3.0% YoY in April, but came in lower than the previous month's 7.0% annualized figure.
Economic Indicator
Retail Trade (YoY)
The Retail Trade data, released by the Ministry of Economy, Trade and Industry on a monthly basis, measures the total value of goods sold by retailers in Japan. Changes in Retail Sales are widely followed as an indicator of consumer spending. Percent changes reflect the rate of changes in such sales, with the YoY reading comparing sales values in the reference month with the same month a year earlier. Generally, a high reading is seen as bullish for the Japanese Yen (JPY), while a low reading is seen as bearish.
Read more.Last release: Thu May 30, 2024 23:50
Frequency: Monthly
Actual: 2.4%
Consensus: 1.9%
Previous: 1.2%
On a seasonally-adjusted basis, Japanese Retail Trade grew 1.2% MoM in April, rebounding from the previous seasonally-adjusted Retail Trade print of -1.2%.
Japanese Industrial Production declined -0.1% MoM in April, missing the foreacst 0.9% and falling steeply from the previous month's 4.4%. The annualized figure also declined -1.0%, but less than the previous -6.2%.
Market reaction
USD/JPY is trading into the 157.00 handle in the early Friday market session, testing into the high side as the Yen eases against the Greenback.
About Japanese Retail Trade
The Retail Trade data, released by the Ministry of Economy, Trade and Industry on a monthly basis, measures the total value of goods sold by retailers in Japan. Changes in Retail Sales are widely followed as an indicator of consumer spending. Percent changes reflect the rate of changes in such sales, with the YoY reading comparing sales values in the reference month with the same month a year earlier. Generally, a high reading is seen as bullish for the Japanese Yen (JPY), while a low reading is seen as bear


© 2000-2026. Sva prava zaštićena.
Sajt je vlasništvo kompanije Teletrade D.J. LLC 2351 LLC 2022 (Euro House, Richmond Hill Road, Kingstown, VC0100, St. Vincent and the Grenadines).
Svi podaci koji se nalaze na sajtu ne predstavljaju osnovu za donošenje investicionih odluka, već su informativnog karaktera.
The company does not serve or provide services to customers who are residents of the US, Canada, Iran, The Democratic People's Republic of Korea, Yemen and FATF blacklisted countries.
Izvršenje trgovinskih operacija sa finansijskim instrumentima upotrebom marginalne trgovine pruža velike mogućnosti i omogućava investitorima ostvarivanje visokih prihoda. Međutim, takav vid trgovine povezan je sa potencijalno visokim nivoom rizika od gubitka sredstava. Проведение торговых операций на финанcовых рынках c маржинальными финанcовыми инcтрументами открывает широкие возможноcти, и позволяет инвеcторам, готовым пойти на риcк, получать выcокую прибыль, но при этом неcет в cебе потенциально выcокий уровень риcка получения убытков. Iz tog razloga je pre započinjanja trgovine potrebno odlučiti o izboru odgovarajuće investicione strategije, uzimajući u obzir raspoložive resurse.
Upotreba informacija: U slučaju potpunog ili delimičnog preuzimanja i daljeg korišćenja materijala koji se nalazi na sajtu, potrebno je navesti link odgovarajuće stranice na sajtu kompanije TeleTrade-a kao izvora informacija. Upotreba materijala na internetu mora biti praćena hiper linkom do web stranice teletrade.org. Automatski uvoz materijala i informacija sa stranice je zabranjen.
Ako imate bilo kakvih pitanja, obratite nam se pr@teletrade.global.
транcфери