- Analiza
- Novosti i instrumenti
- Vesti sa tržišta
Forex-novosti i prognoze od 30-04-2021
On Monday, at 01:00 GMT, Australia will release MI inflation data for April. At 01:30 GMT, Australia will release the ANZ job vacancy index for April. At 06:00 GMT, Germany will announce the change in retail trade volume for March. Then the focus will be on the manufacturing PMI for April: Switzerland will report at 07:30 GMT, France at 07:50 GMT, Germany at 07:55 GMT, the euro zone at 08:00 GMT, and the United States at 13:45 GMT. At 14:00 GMT, the US will present the ISM manufacturing index for April and announce changes in the volume of spending in the construction sector for March. At 18:20 GMT in the US, the head of the Federal Reserve Powell will make a speech.
On Tuesday, at 01:30 GMT, Australia will announce a change in the foreign trade balance for March. At 04:30 GMT in Australia, the RBA's interest rate decision will be announced. At 07:00 GMT, Switzerland will release the SECO consumer sentiment index for the 2nd quarter. At 08:30 GMT, Britain will release the manufacturing PMI for April, and will announce changes in the M4 money supply aggregate, the number of approved mortgage applications and the volume of net loans to individuals for March. At 12:30 GMT, Canada will report on the change in the volume of construction permits issued for March. Also at 12:30 GMT, the US and Canada will announce a change in the trade balance for March. At 14:00 GMT, the US will announce a change in the volume of production orders for March. At 21:00 GMT, in New Zealand, the RBNZ Financial Stability Report will be released. At 22:30 GMT, Australia will present the AiG construction activity index for April. At 22:45 GMT, New Zealand will report changes in the unemployment rate and the number of people employed for the 1st quarter. At 23: 00 GMT, in New Zealand, RBNZ Governor Adrian Orr will deliver a speech. At 23:30 GMT, Japan will announce a change in the volume of household spending for March.
On Wednesday, at 01:00 GMT, New Zealand will release the ANZ commodity price index for April. At 01:30 GMT, Australia will report a change in the volume of construction permits issued for March. At 05:00 GMT, Japan will release an index of leading economic indicators for March. At 06:30 GMT, Switzerland will present the consumer price index for April. Then the focus will be on the business activity indices in the services sector for April: at 07:50 GMT, France will report, at 07:55 GMT - Germany, and at 08: 00 GMT - the eurozone. At 09:00 GMT in the euro area, the forecast for the economy from the European Commission will be released, as well as the producer price index for March. At 12:15 GMT, the US will announce the change in the number of employees from ADP for April. At 13:45 GMT, the US will release the PMI for the services sector for April, and at 14: 00 GMT - the index of business activity in the services sector from ISM for April. At 14: 30 GMT, the US Department of Energy will release a report on changes in oil reserves. At 22:30 GMT in Canada, the head of the Bank of Canada, Tiff Macklem, will make a speech. At 22:45 GMT, New Zealand will report a change in the volume of construction permits for March. At 23:50 GMT, in Japan, the minutes of the Bank of Japan's monetary policy meeting will be released.
On Thursday, at 01:45 GMT, China will release the Caixin / Markit Services PMI for April. At 06:00 GMT, Germany will announce a change in the volume of orders in the industry for March. At 08:00 GMT, in the eurozone, the ECB's economic bulletin will be released. At 08:30 GMT, Britain will publish the PMI for the services sector for April. At 09:00 GMT, the euro zone will report the change in retail trade volume for March. At 11:00 GMT in the UK, the Bank of England interest rate decision will be announced. At 12: 30 GMT, the United States will announce changes in the number of initial applications for unemployment benefits, as well as the level of labor productivity in the non-agricultural sector of the economy and the level of labor costs for the 1st quarter. At 22:30 GMT, Australia will present the AiG services activity index for April. At 23:30 GMT, Japan will announce a change in the wage level for March.
On Friday, at 01:30 GMT, Australia will present the Reserve Bank of Australia's monetary policy report. At 01:30 GMT, China will publish the consumer price index and the producer price index for April. At 03:00 GMT, New Zealand will report a change in expected inflation in two years. At 05:45 GMT, Switzerland will announce the change in the unemployment rate for April. At 06:00 GMT, Germany will announce changes in industrial production and the trade balance for March. At 06:45 GMT, France will report changes in the number of people employed in the non-agricultural sector for the 1st quarter, as well as the trade balance for March. At 07:00 GMT, Switzerland will announce the change in the SNB reserves for April. At 08:30 GMT, Britain will publish the PMI index for the construction sector for April. At 10:00 GMT, in the eurozone, ECB President Lagarde will deliver a speech. At 12:30 GMT, the US will announce changes in the unemployment rate and the number of people employed in the non-agricultural sector for April. Also at 12:30 GMT, Canada will report changes in the unemployment rate and the number of people employed for April. At 14:00 GMT, in Canada, the Ivey Managers ' Index for April will be released. At 14:00 GMT, the United States will announce a change in wholesale inventory for March. At 17:00 GMT, in the United States, the Baker Hughes report on the number of active oil drilling rigs will be released. At 19:00 GMT, the US will report on the change in the volume of consumer lending for March.
FXStreet notes that recent data have highlighted the strength of the rebound in physical demand for gold, especially in India and China. But strategists at Capital Economics don’t think this poses much of a risk to their forecast for the gold price to fall this year.
“Consumer demand has historically been strong after a period of falling prices, reflecting the more price-sensitive nature of these purchases... So the recent rise in consumer demand is a symptom of a lower gold price, rather than a reason to think it will rise again.”
“Some of the increase in India’s gold imports in March appears to be due to temporary factors that should fade, rather than a longer-term shift. Imports may have been boosted by seasonal stockpiling and delayed purchases from earlier months given expectations for a cut to gold import duties, which was announced in February.”
“Two other factors, namely US real yields and the US dollar, are much more important drivers of the price, and we expect both to weigh on the price of gold over the next year or so. We think the recent rise in longer-term real yields in the US will resume before long, which would increase the opportunity cost of holding gold. Meanwhile, we also anticipate that a stronger US dollar will make gold more expensive to non-US investors.”
- Says he sees excesses and imbalances in financial markets
- Factors pushing up inflation including base effects, demand-supply imbalances, and fiscal policy
- Sees risk to his 6.5% GDP growth forecast this year is to the upside
- Repeats that Fed should start talking about tapering soon
- Says he hasn't changed his view that rates should start to rise in 2022
The
final reading for the April Reuters/Michigan index of consumer sentiment came
in at 88.3 compared to a preliminary reading of 86.5 and the March final
reading of 84.9. This was the highest reading since March 2020.
Economists
had forecast the index to be revised to 87.4.
According
to the report, the index of consumer expectations rose 3.8 percent m-o-m to 82.7
from March’s final reading of 79.7, while the index of the current economic
conditions climbed 4.5 percent m-o-m to 97.2 from March’s final reading of 93.0.
“The
April survey recorded continued gains in consumer confidence due to a growing
sense that the upward momentum in jobs and incomes will persist,” noted
Richard Curtin, the Surveys of Consumers chief economist. “The renewed
confidence is due to record federal stimulus spending, both recently passed and
proposed, as well as the positive impact from a growing share of the population
who are vaccinated. The largest and most important change in April was that an
all-time record number of consumers expected declines in the unemployment rate
during the year ahead.”
MNI
Indicators’ report revealed on Friday that business activity in Chicago
expanded in April, recording its tenth straight month of growth.
The
MNI Chicago Business Barometer, also known as Chicago purchasing manager's
index (PMI) came in at 72.1 in April, up from an unrevised 66.3 in March. This was the highest reading since December
1983.
Economists
had forecast the index to decrease to 65.3.
A
reading above 50 indicates improving conditions, while a reading below this
level shows worsening of the situation.
According
to the report, Order Backlogs (+16.2 points, to the highest level since
December 1973) recorded the largest gain in April, while Supplier Deliveries (-3.5
points) posted the biggest drop. Elsewhere, New Orders (+9.9 points, to a
near-7-year high), Production (+0.9 points, to the highest level since January 2018),
Employment (+1.7 points, to the highest level since August 2018) all saw
increases. In addition, Prices paid at the factory gate (+11.1 points) surged to
a 41-year high as raw material shortages and transportation problems continue
to weigh on the companies' cost burden.
U.S. stock-index futures fell on Friday, as investors decided to take a breather after a slew of solid earnings reports and upbeat economic data through the week lifted equities to record highs.
Global Stocks:
Index/commodity | Last | Today's Change, points | Today's Change, % |
Nikkei | 28,812.63 | -241.34 | -0.83% |
Hang Seng | 28,724.88 | -578.38 | -1.97% |
Shanghai | 3,446.86 | -28.04 | -0.81% |
S&P/ASX | 7,025.80 | -56.50 | -0.80% |
FTSE | 6,983.78 | +22.30 | +0.32% |
CAC | 6,300.18 | -2.39 | -0.04% |
DAX | 15,194.64 | +40.44 | +0.27% |
Crude oil | $63.60 | -2.17% | |
Gold | $1,768.70 | +0.02% |
(company / ticker / price / change ($/%) / volume)
3M Co | MMM | 197.5 | -1.55(-0.78%) | 2418 |
ALCOA INC. | AA | 36.65 | -0.52(-1.40%) | 15020 |
ALTRIA GROUP INC. | MO | 46.62 | 0.02(0.04%) | 18009 |
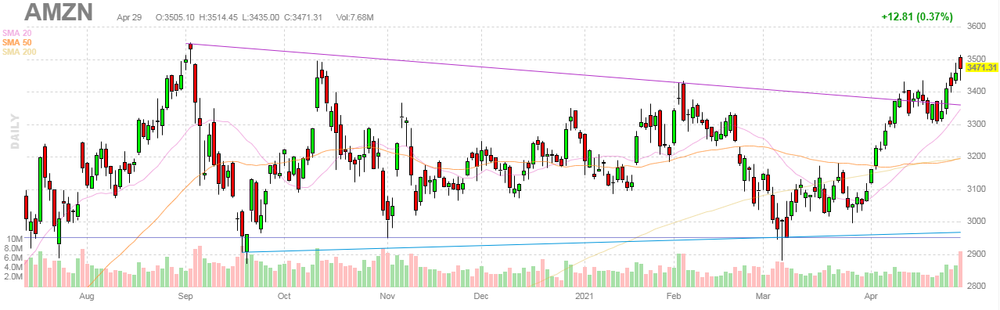
Amazon.com Inc., NASDAQ | AMZN | 3,541.00 | 69.69(2.01%) | 196876 |
American Express Co | AXP | 153.5 | -1.13(-0.73%) | 1395 |
AMERICAN INTERNATIONAL GROUP | AIG | 48.86 | -0.08(-0.16%) | 309 |
Apple Inc. | AAPL | 131.98 | -1.50(-1.12%) | 1348766 |
AT&T Inc | T | 31.25 | -0.09(-0.29%) | 47260 |
Boeing Co | BA | 233.48 | -2.46(-1.04%) | 53158 |
Caterpillar Inc | CAT | 225.01 | -2.46(-1.08%) | 5258 |
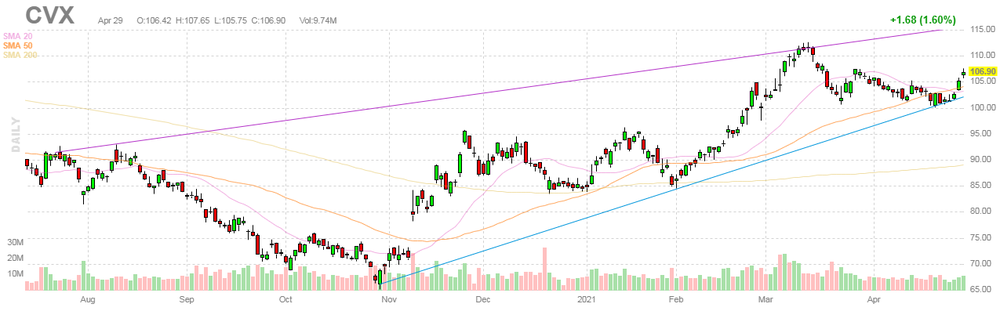
Chevron Corp | CVX | 104.59 | -2.31(-2.16%) | 98035 |
Cisco Systems Inc | CSCO | 51.19 | -0.27(-0.52%) | 48440 |
Citigroup Inc., NYSE | C | 72.71 | -0.62(-0.85%) | 39930 |
Deere & Company, NYSE | DE | 372.15 | -4.24(-1.13%) | 1168 |
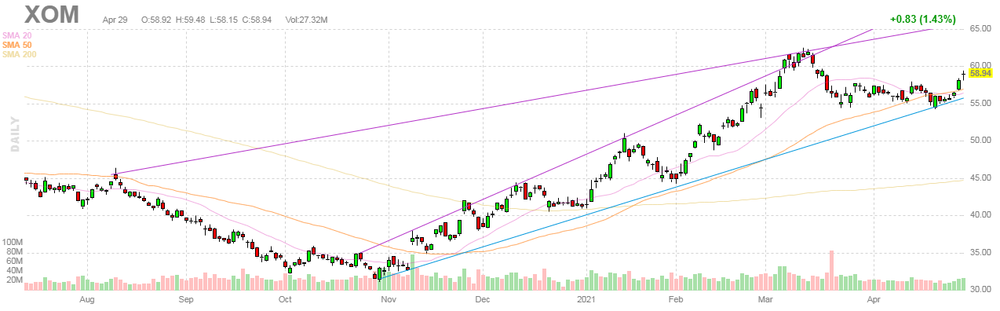
Exxon Mobil Corp | XOM | 58.66 | -0.28(-0.48%) | 313208 |
Facebook, Inc. | FB | 326.62 | -2.89(-0.88%) | 210155 |
FedEx Corporation, NYSE | FDX | 295.4 | -0.66(-0.22%) | 2007 |
Ford Motor Co. | F | 11.36 | 0.10(0.89%) | 1307786 |
Freeport-McMoRan Copper & Gold Inc., NYSE | FCX | 37.92 | -0.48(-1.25%) | 114828 |
General Electric Co | GE | 13.13 | -0.08(-0.61%) | 199677 |
General Motors Company, NYSE | GM | 56.12 | -0.45(-0.80%) | 44001 |
Goldman Sachs | GS | 350.99 | -1.98(-0.56%) | 3560 |
Google Inc. | GOOG | 2,407.50 | -22.39(-0.92%) | 8735 |
Hewlett-Packard Co. | HPQ | 34.53 | -0.17(-0.49%) | 2791 |
Home Depot Inc | HD | 324.2 | -1.14(-0.35%) | 1951 |
HONEYWELL INTERNATIONAL INC. | HON | 221.8 | -2.10(-0.94%) | 798 |
Intel Corp | INTC | 57.77 | -0.51(-0.88%) | 76844 |
International Business Machines Co... | IBM | 143.94 | -0.30(-0.21%) | 3817 |
Johnson & Johnson | JNJ | 163.99 | -0.21(-0.13%) | 2641 |
JPMorgan Chase and Co | JPM | 153.9 | -1.29(-0.83%) | 17667 |
Merck & Co Inc | MRK | 73.51 | -0.17(-0.23%) | 57737 |
Microsoft Corp | MSFT | 250.24 | -2.27(-0.90%) | 161502 |
Nike | NKE | 132.59 | -0.67(-0.50%) | 6080 |
Pfizer Inc | PFE | 38.53 | -0.07(-0.18%) | 70826 |
Procter & Gamble Co | PG | 132.5 | -0.01(-0.01%) | 8004 |
Starbucks Corporation, NASDAQ | SBUX | 114.07 | -0.56(-0.49%) | 13632 |
Tesla Motors, Inc., NASDAQ | TSLA | 664 | -13.00(-1.92%) | 340167 |
The Coca-Cola Co | KO | 54.2 | -0.06(-0.11%) | 10758 |
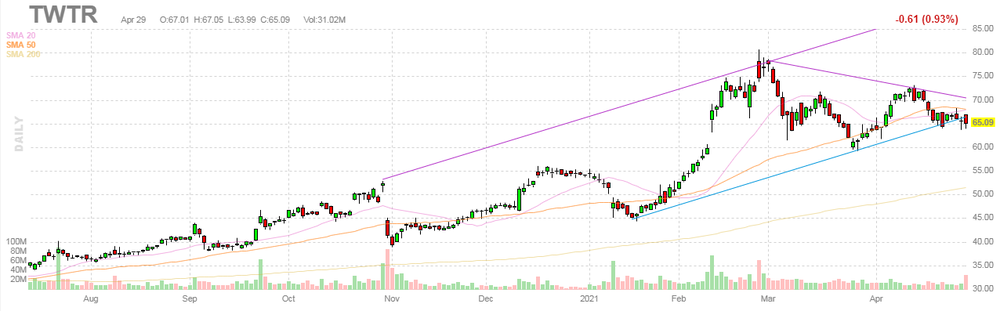
Twitter, Inc., NYSE | TWTR | 56.45 | -8.64(-13.27%) | 1727654 |
UnitedHealth Group Inc | UNH | 399.1 | -2.45(-0.61%) | 1231 |
Verizon Communications Inc | VZ | 57.15 | -0.17(-0.30%) | 26900 |
Visa | V | 235.5 | -1.36(-0.57%) | 4668 |
Wal-Mart Stores Inc | WMT | 139.47 | -0.16(-0.11%) | 7572 |
Walt Disney Co | DIS | 184.12 | -1.21(-0.65%) | 9498 |
Yandex N.V., NASDAQ | YNDX | 65.3 | -2.43(-3.59%) | 31242 |
Statistics Canada announced on Wednesday that the country’s gross domestic product (GDP) grew 0.4 percent m-o-m in February, following an unrevised 0.7 percent m-o-m advance in January.
This marked the tenth consecutive monthly gain but was slightly below economists’ forecast for a 0.5 percent m-o-m advance. However, overall economic activity was still about 2 percent below February's pre-pandemic level.
In
y-o-y terms, the Canadian GDP declined 2.2 percent in February.
According
to the report, services-producing industries (+0.6 percent m-o-m) rose in February,
while goods-producing industries (-0.2 percent m-o-m) contracted for the first
time since April 2020. Overall, 14 of the 20 industrial sectors were up in
February.
It
was also reported that preliminary data indicates an approximate 0.9 percent
m-o-m gain in real GDP for March.
The
Commerce Department reported on Friday that consumer spending in the U.S. rose
4.2 percent m-o-m in March after an unrevised 1.0 percent m-o-m drop in February. This
marked the biggest monthly rise in consumer spending since June 2020. Economists
had forecast the reading to show a 4.1 percent m-o-m surge.
Meanwhile,
consumer income surged 21.1 percent m-o-m in March, following a revised 7.0
percent m-o-m tumble in the previous month (originally a 7.1 percent m-o-m plunge).
This was the largest monthly increase in consumer income on record. Economists
had forecast a 20.3 percent m-o-m climb.
The March
jump in personal income largely reflected an increase in government social
benefits.
The
personal consumption expenditures (PCE) price index, excluding the volatile
categories of food and energy, which is the Fed's preferred inflation measure,
increased 0.4 percent m-o-m in March, following an unrevised 0.1 percent m-o-m
advance in February. Economists had projected the index would increase 0.3 percent
m-o-m.
In the 12 months through March, the core PCE rose
1.8 percent, accelerating from an unrevised 1.4 percent in the 12 months
through February. Economists
had forecast an advance of 1.8 percent y-o-y.
| Time | Country | Event | Period | Previous value | Forecast | Actual |
|---|---|---|---|---|---|---|
| 06:30 | Switzerland | Retail Sales (MoM) | March | -5.3% | 22.1% | |
| 06:30 | Switzerland | Retail Sales Y/Y | March | -6.6% | 22.6% | |
| 06:45 | France | CPI, m/m | April | 0.6% | 0.2% | 0.2% |
| 06:45 | France | CPI, y/y | April | 1.1% | 1.3% | 1.3% |
| 07:00 | Switzerland | KOF Leading Indicator | April | 118 | 119.5 | 134 |
| 08:00 | Germany | GDP (QoQ) | Quarter I | 0.5% | -1.5% | -1.7% |
| 08:00 | Germany | GDP (YoY) | Quarter I | -3.3% | -3.2% | -3% |
| 08:00 | Switzerland | SNB Chairman Jordan Speaks | ||||
| 09:00 | Eurozone | Harmonized CPI | April | 0.9% | 0.6% | |
| 09:00 | Eurozone | Unemployment Rate | March | 8.2% | 8.3% | 8.1% |
| 09:00 | Eurozone | Harmonized CPI ex EFAT, Y/Y | April | 0.9% | 0.8% | 0.8% |
| 09:00 | Eurozone | Harmonized CPI, Y/Y | April | 1.3% | 1.6% | 1.6% |
| 09:00 | Eurozone | GDP (YoY) | Quarter I | -4.9% | -2% | -1.8% |
| 09:00 | Eurozone | GDP (QoQ) | Quarter I | -0.7% | -0.8% | -0.6% |
EUR eased against most of its major rivals in the European session on Friday, undermined by data, which showed that the Eurozone fell into a double-dip recession in Q1, as tougher restrictions were imposed to battle the third wave of Covid-19.
Eurostat reported that its preliminary estimate revealed that Eurozone's gross domestic product (GDP) shrank 0.6% q-o-q and 1.8% y-o-y in the first three months of this year, putting the region in a second technical recession in 12 months. Economists had expected declines of 0.8% q-o-q and 2.0% y-o-y.
Meanwhile, another report from Eurostat showed that the jobless rate in the Eurozone fell unexpectedly to 8.1 percent in March from 8.2 percent in February. Economists had expected the rate to increase to 8.3 percent. The number of unemployed decreased by 209,000 from the previous month to 13.166 million in March.
Market participants also received flash consumer price data for the Eurozone, which showed that inflation in the euro area accelerated in April. Eurozone consumer price inflation rose to 1.6% y-o-y in April, the highest level since April 2019. Economists had expected the consumer price index (CPI) to rise 1.6% y-o-y, following a 1.3% y-o-y gain in March.
Exxon Mobil (XOM) reported Q1 FY 2021 earnings of $0.65 per share (versus -$0.14 per share in Q1 FY 2020), beating analysts’ consensus estimate of $0.53 per share.
The company’s quarterly revenues amounted to $59.147 bln (+5.3% y/y), beating analysts’ consensus estimate of $55.360 bln.
XOM fell to $58.63 (-0.53%) in pre-market trading.
FXStreet reports that in the opinion of FX Strategists at UOB Group, USD/CNH is seen potentially grinding lower to the 6.4410 level in the next weeks.
24-hour view: “The recent weakness appears to have stabilized somewhat but there is still scope for USD to move lower to 6.4550 first before a recovery can be expected. The major support at 6.4410 is not expected to come into the picture. Resistance is at 6.4720 followed by 6.4790.”
Next 1-3 weeks: “ In our latest narrative from Tuesday (27 Apr, spot at 6.4800), we highlighted that ‘the prospect for further USD weakness is not high but only a break of 6.5050 would indicate that weakness in USD has come to an end’. We did not anticipate the ease by which USD cracked the solid support at 6.4700 yesterday. The boost in downward momentum could lead to further USD weakness towards 6.4410. Overall, the negative phase is deemed intact as long as USD does not move above 6.4900 (‘strong resistance’ level previously at 6.5050).”
FXStreet notes that EUR/USD hit the highest since March above 1.2120 on Thursday. Karen Jones, Team Head FICC Technical Analysis Research at Commerzbank, expects the world's most popular currency pair to rise towards the 1.2210/43 zone.
“EUR/USD closed just above the March 3rd high at 1.2115 yesterday, the market stays immediately bid while above the 1.1990 11th March high.”
“We look for gains to 1.2210/43, the 78.6% retracement of the move seen this year and the February high and then 1.2349 the 2021 high.”
“Dips lower are indicated to remain shallow and should be contained by 1.2070/30.”
- Current monetary policy stance is necessary; it is in interest of all the country not for particular sections
- Swiss franc has weakened but remains highly valued
- Cryptocurrencies are not liquid enough for the bank to have as one of its investment assets
Chevron (CVX) reported Q1 FY 2021 earnings of $0.90 per share (versus $1.93 per share in Q1 FY 2020), beating analysts’ consensus estimate of $0.85 per share.
The company’s quarterly revenues amounted to $32.029 bln (+1.7% y/y), being roughly in line with analysts’ consensus estimate of $31.825 bln.
CVX fell to $104.78 (-1.98%) in pre-market trading.
Twitter (TWTR) reported Q1 FY 2021 earnings of $0.16 per share (versus -$0.01 per share in Q1 FY 2020), beating analysts’ consensus estimate of $0.14 per share.
The company’s quarterly revenues amounted to $1.036 bln (+28.3% y/y), roughly in line with analysts’ consensus estimate of $1.026 bln.
The company also issued in-line guidance for Q2 FY 2021, projecting revenues of $0.98-1.08 bln versus analysts’ consensus estimate of $1.06 bln.
TWTR fell to $57.15 (-12.20%) in pre-market trading.
FXStreet reports that Senior Economist at UOB Group Alvin Liew reviews the latest FOMC event (Wednesday).
“The Fed Reserve, as widely expected, kept its policy rates and asset purchase program unchanged in its April FOMC. Even as Fed’s growth outlook continued to turn more bullish, Powell highlighted that the recovery remains uneven and incomplete, the economy is ‘long way’ from employment and inflation goals and likely to take ‘some time’ for substantial further progress to be achieved.”
“Going forward, our base case remains for the Fed to stay on hold for most of 2021, at least, and the taper discussion will only start in late 2021/early 2022. This is premised on the continued successful rollout of vaccinations across the US, additional fiscal stimulus, and the subsequent reduction in COVID-19 infections and deaths with the return to economic/social normalcy in the foreseeable future. We continue to hold the view that the Fed will keep policy rates at the current 0.0-0.25% region at least until 2023.”
FXStreet reports that gold (XAU/USD) holds a near-term base and strategists at Credit Suisse see scope for a fresh test of resistance from its 200-day average at $1857. Rising US Real Yields, as well as a sideways USD, are likely to see strength capped here for now though.
“We look for a recovery back to $1835, potentially the 200-day average and downtrend at $1857/79, but with a fresh cap expected here for now.”
“If this current phase is still a correction in a broader market and if the prior bull market behavior was to be repeated, this would mean a new high would not be posted until December this year at the earliest.”
“An eventual rise in US Real Yields should remain a headwind for Gold though.”
Amazon (AMZN) reported Q1 FY 2021 earnings of $15.79 per share (versus $5.01 per share in Q1 FY 2020), beating analysts’ consensus estimate of $9.55 per share.
The company’s quarterly revenues amounted to $108.518 bln (+43.8% y/y), beating analysts’ consensus estimate of $104.592 bln.
The company also issued upside guidance for Q2 FY 2021, projecting revenues of $110-116 bln versus analysts’ consensus estimate of $107.58 bln.
AMZN rose to $3546.30 (+2.16%) in pre-market trading.
FXStreet reports that analysts at Capital Economics expect poor returns from commodities over the next few years, but reasonable returns from US equities.
“We do not expect commodities to collapse by as much as they did in 2014-15 over the next few years. Meanwhile, we think that the returns from US equities will be positive, but far from stellar.”
“We will see a strong global recovery, but one in which China’s economy loses steam as stimulus is withdrawn. We also expect commodity supply to recover markedly. If we are right to expect a strong global recovery, but one in which growth is softer in some commodity-intensive parts of the world, along with a rebound in commodities supply, it seems perfectly plausible to us that the returns from commodities and US equities could diverge once again.”
According to a flash estimate from Eurostat, euro area annual inflation is expected to be 1.6% in April 2021, up from 1.3% in March. The core figures eased to 0.8%% Y/Y in April when compared to 0.9% expectations and 0.9% booked in March.
Looking at the main components of euro area inflation, energy is expected to have the highest annual rate in April (10.3%, compared with 4.3% in March), followed by services (0.9%, compared with 1.3% in March), food, alcohol & tobacco (0.7%, compared with 1.1% in March) and non-energy industrial goods (0.5%, compared with 0.3% in March).
Eurostat also reported that in March 2021, the euro area seasonally adjusted unemployment rate was 8.1%, down from 8.2% in February 2021 and up from 7.1% in March 2020. The unemployment rate was expected to be 8.3%. The EU unemployment rate was 7.3% in March 2021, also down from 7.4% in February 2021 and up from 6.4% in March 2020.
Eurostat estimates that 15.520 million men and women in the EU, of whom 13.166 million in the euro area, were unemployed in March 2021. Compared with February 2021, the number of persons unemployed decreased by 237 000 in the EU and by 209 000 in the euro area. Compared with March 2020, unemployment rose by 2.019 million in the EU and by 1.614 million in the euro area.
According to the report from Eurostat, in the first quarter 2021, seasonally adjusted GDP decreased by 0.6% in the euro area and by 0.4% in the EU, compared with the previous quarter. Economists had expected a 0.8% decrease in the euro area. These declines follow falls in the fourth quarter of 2020 (-0.7% in the euro area and -0.5% in the EU) after a strong rebound in the third quarter of 2020 (+12.5% in the euro area and +11.7% in the EU) and the sharpest decreases since the time series started in 1995 observed in the second quarter of 2020 (-11.6% in the euro area and -11.2% in the EU).
Compared with the same quarter of the previous year, seasonally adjusted GDP decreased by 1.8% in the euro area and by 1.7% in the EU in the first quarter of 2021, after -4.9% in the euro area and -4.6% in the EU in the previous quarter.
Among the Member States for which data are available for the first quarter 2021, Portugal (-3.3%) recorded the highest decrease compared to the previous quarter, followed by Latvia (-2.6%) and Germany (-1.7%), while Lithuania (+1.8%) and Sweden (+1.1%) recorded the highest increases. The year on year growth rates were negative for all countries except for France (+1.5%) and Lithuania (+1.0%).
Reuters reports that a top Securities and Exchange Commission official said that China's planned digital yuan will not dethrone the dollar, citing the growth of so-called stablecoins backed by the greenback.
The People's Bank of China work on a digital yuan - part of a push to internationalise the currency and reduced its - is far ahead of similar initiatives in other major economies. That has led some analysts to question if the faster pace from the globe's second largest economy could lead the yuan to gain dominance over the dollar.
Yet Hester Peirce, a Republican commissioner at the SEC, said the rise of stablecoins would maintain the U.S. currency's status.
"Even in 2021, there's been a tremendous growth in stablecoins - these are essentially private digital dollars," she said. "That, effectively, may be our answer to the Chinese CBDC (central bank digital currency). It may be just private stablecoins."
"If they're dollar-backed then I think that the dollar will still be quite relevant," said Peirce.
According to the report from Destatis, the gross domestic product (GDP) declined by 1.7% in the 1st quarter of 2021 on the 4th quarter of 2020 after adjustment for price, seasonal and calendar variations. Economists had expected a 1.5% decrease.
After the German economy had recovered slightly in the second half of 2020 (by +8.7% in the 3rd quarter and +0.5% in the 4th quarter, according to most recent calculations), the coronavirus crisis caused another decline in economic performance at the beginning of 2021. This affected household consumption in particular, while exports of goods supported the economy.
GDP in the 1st quarter of 2021 was down a price-adjusted 3.3% and a price- and calendar-adjusted 3.0% compared with the 1st quarter of 2020. Compared with the 4th quarter of 2019, the quarter before the coronavirus crisis began, GDP was 4.9% lower in the 1st quarter of 2021.
KOF Economic Research Agency said that the economic barometer rises in April for the second month in a row by about 15 points. It thus surpasses its previous historical high, which it reached in the recovery after the financial crisis in the first months of the year 2010. Unless the virus takes another volte, economic development is likely to get a strong boost in the near future.
The KOF Economic Barometer climbs by 16.0 points in April from 118.0 in March (revised from 117.8) to now 134.0 points. As in the previous month, manufacturing leads the positive development in April. It is therefore coming back with a force and is benefiting from more favourable international demand. But the outlook for other services, financial and insurance services and consumer demand also brightens considerably. The outlook for construction is slightly more favourable than in the previous month. Only the accommodation and food service activities cannot keep pace, with the indicators showing hardly any change overall.
| Time | Country | Event | Period | Previous value | Forecast | Actual |
|---|---|---|---|---|---|---|
| 00:30 | Japan | Manufacturing PMI | April | 52.7 | 53.3 | 53.6 |
| 01:00 | China | Non-Manufacturing PMI | April | 56.3 | 54.9 | |
| 01:00 | China | Manufacturing PMI | April | 51.9 | 51.7 | 51.1 |
| 01:30 | Australia | Private Sector Credit, y/y | March | 1.6% | 1.0% | |
| 01:30 | Australia | Private Sector Credit, m/m | March | 0.2% | 0.4% | |
| 01:30 | Australia | Producer price index, q / q | Quarter I | 0.5% | 0.4% | |
| 01:30 | Australia | Producer price index, y/y | Quarter I | -0.1% | 0.2% | |
| 05:00 | Japan | Consumer Confidence | April | 36.1 | 34.7 | |
| 05:30 | France | Consumer spending | March | 0% | 0.4% | -1.1% |
| 05:30 | France | GDP, q/q | Quarter I | -1.4% | 0.1% | 0.4% |
| 06:00 | United Kingdom | Nationwide house price index, y/y | April | 5.7% | 5% | 7.1% |
| 06:00 | United Kingdom | Nationwide house price index | April | -0.3% | 0.5% | 2.1% |
| 06:30 | Switzerland | Retail Sales (MoM) | March | -5.3% | 22.1% | |
| 06:30 | Switzerland | Retail Sales Y/Y | March | -6.6% | 22.6% | |
| 06:45 | France | CPI, m/m | April | 0.6% | 0.2% | 0.2% |
| 06:45 | France | CPI, y/y | April | 1.1% | 1.3% | 1.3% |
| 07:00 | Switzerland | KOF Leading Indicator | April | 118 | 119.5 | 134 |
During today's Asian trading, the US dollar rose slightly against most major currencies, but was on track for a weekly drop. The ICE index, which tracks the dynamics of the dollar against six currencies (euro, swiss franc, yen, canadian dollar, pound sterling and swedish krona), rose by 0.07%. The dollar index was on course to end the week 0.2% lower, as the Fed stuck to its message of ultra-low interest rates for longer.
At the conclusion of the Fed's latest policy meeting on Wednesday, Chair Powell acknowledged the U.S. economy's growth, but said there was not yet enough evidence of "substantial further progress" toward recovery to warrant a change to its ultra-loose monetary settings. That growth accelerated in the first quarter, buoyed by government stimulus cheques, setting the course for what is expected to be the strongest performance this year in nearly four decades.
Data on China was also in focus. Survey results from IHS Markit showed that China's manufacturing sector grew at the fastest pace in four months in April. Manufacturing PMI rose to 51.9 in April from an 11-month low of 50.6 in March. A score above 50 indicates expansion in the sector. Driven by improved market conditions and greater customer demand, total new orders grew for the eleventh straight month in April. Greater inflows of new work led goods producers in China to expand production volumes again in April, with the rate of expansion also improving to a four-month high. Prices data showed a further rapid increase in input costs amid reports of supplier price hikes. The latest increase in expenses was the quickest since November 2017. Companies often passed on higher costs to customers through higher factory gate charges, which rose sharply overall.
According to the report from INSEE, over a year, the Consumer Price Index (CPI) should rise by 1.3% in April 2021, after +1.1% in the previous month, according to the provisional estimate made at the end of the month. This increase in inflation should result from the acceleration of the service prices and those of energy. The tobacco prices should rise at the same rate as in the last month. The decrease in manufactured good prices should maintain at the same level as in March. The food prices should fall back in the wake of those of fresh produces.
Over one month, consumer prices should rise by 0.2% after +0.6% in March. The prices of energy should fall back and those of manufactured goods and those of tobacco should be stable. The service prices and those of food should increase.
Year on year, the Harmonised Index of Consumer Prices should rise by 1.7% after +1.4% in March. Over one month, it should increase by 0.3% after +0.7% in the previous month.
EUR/USD
Resistance levels (open interest**, contracts)
$1.2216 (1775)
$1.2188 (1337)
$1.2160 (1591)
Price at time of writing this review: $1.2113
Support levels (open interest**, contracts):
$1.2076 (579)
$1.2039 (1601)
$1.1995 (1308)
Comments:
- Overall open interest on the CALL options and PUT options with the expiration date May, 7 is 55214 contracts (according to data from April, 29) with the maximum number of contracts with strike price $1,2000 (3316);
GBP/USD
$1.4033 (1193)
$1.4005 (792)
$1.3984 (1853)
Price at time of writing this review: $1.3944
Support levels (open interest**, contracts):
$1.3866 (702)
$1.3829 (275)
$1.3787 (425)
Comments:
- Overall open interest on the CALL options with the expiration date May, 7 is 12559 contracts, with the maximum number of contracts with strike price $1,4200 (2932);
- Overall open interest on the PUT options with the expiration date May, 7 is 18664 contracts, with the maximum number of contracts with strike price $1,3750 (1914);
- The ratio of PUT/CALL was 1.49 versus 1.49 from the previous trading day according to data from April, 29
* - The Chicago Mercantile Exchange bulletin (CME) is used for the calculation.
** - Open interest takes into account the total number of option contracts that are open at the moment.
According to the report from the Federal Statistical Office (FSO), turnover adjusted for sales days and holidays rose in the retail sector by 21.5% in nominal terms in March 2021 compared with the previous year. This sharp increase is mainly due to the low value for March 2020 when the Covid-19 pandemic first began to filter through. Seasonally adjusted, nominal turnover rose by 21.9% compared with the previous month.
Real turnover adjusted for sales days and holidays rose in the retail sector by 22.6% in March 2021 compared with the previous year. Real growth takes inflation into consideration. Compared with the previous month, real, seasonally adjusted retail trade turnover registered an increase of 22.1%.
Adjusted for sales days and holidays, the retail sector excluding service stations showed a 22.3% increase in nominal turnover in March 2021 compared with March 2020 (in real terms +23.5%). Service stations recorded a nominal turnover increase of 10.9% (real +2.0%).
Retail sales of food, drinks and tobacco registered an increase in nominal turnover of 7.0% (in real terms +8.5%), whereas the non-food sector registered a nominal plus of 39.9% (in real terms +41.1%). All sectors recorded strong increases.
Excluding service stations, the retail sector showed a seasonally adjusted increase in nominal turnover of 23.3% compared with the previous month (in real terms +23.6%).
According to the report from Nationwide Building Society, annual house price growth rebounded to 7.1% in April, from 5.7% in March. Economists had expected a 5.0% increase. Prices up 2.1% month-on-month, the biggest monthly rise since February 2004. Economists had expected a 0.5% increase. Annual growth will reach double digits in June if prices are flat over next two months. New record high average price of £238,831, up £15,916 over the past 12 months.
Commenting on the figures, Robert Gardner, Nationwide's Chief Economist, said: “Annual house price growth accelerated to 7.1% in April, only slightly below the peak of 7.3% recorded in December and up from 5.7% in March. In month-on-month terms, house prices rose by 2.1% in April, after taking account of seasonal effects, the biggest month rise since February 2004. Just as expectations of the end of the stamp duty holiday led to a slowdown in house price growth in March, so the extension of the stamp duty holiday in the Budget prompted a reacceleration in April. However, our research suggests that while the stamp duty holiday is impacting the timing of housing transactions, for most people it is not the key motivating factor prompting them to move in the first place".
| Raw materials | Closed | Change, % |
|---|---|---|
| Brent | 68.29 | 1.83 |
| Silver | 26.071 | -0.54 |
| Gold | 1771.878 | -0.56 |
| Palladium | 2951.65 | 0.81 |
| Time | Country | Event | Period | Previous value | Forecast |
|---|---|---|---|---|---|
| 00:30 (GMT) | Japan | Manufacturing PMI | April | 52.7 | 53.3 |
| 01:00 (GMT) | China | Non-Manufacturing PMI | April | 56.3 | |
| 01:00 (GMT) | China | Manufacturing PMI | April | 51.9 | 51.7 |
| 01:30 (GMT) | Australia | Private Sector Credit, y/y | March | 1.6% | |
| 01:30 (GMT) | Australia | Private Sector Credit, m/m | March | 0.2% | |
| 01:30 (GMT) | Australia | Producer price index, q / q | Quarter I | 0.5% | |
| 01:30 (GMT) | Australia | Producer price index, y/y | Quarter I | -0.1% | |
| 05:00 (GMT) | Japan | Construction Orders, y/y | March | 2.5% | |
| 05:00 (GMT) | Japan | Housing Starts, y/y | March | -3.7% | -7.4% |
| 05:00 (GMT) | Japan | Consumer Confidence | April | 36.1 | |
| 05:30 (GMT) | France | GDP, q/q | Quarter I | -1.4% | 0.1% |
| 06:00 (GMT) | United Kingdom | Nationwide house price index, y/y | April | 5.7% | 5% |
| 06:00 (GMT) | United Kingdom | Nationwide house price index | April | -0.2% | 0.5% |
| 06:30 (GMT) | Switzerland | Retail Sales (MoM) | March | -5.2% | |
| 06:30 (GMT) | Switzerland | Retail Sales Y/Y | March | -6.3% | |
| 06:45 (GMT) | France | CPI, m/m | April | 0.6% | 0.2% |
| 06:45 (GMT) | France | Consumer spending | March | 0% | 0.4% |
| 06:45 (GMT) | France | CPI, y/y | April | 1.1% | 1.3% |
| 07:00 (GMT) | Switzerland | KOF Leading Indicator | April | 117.8 | 119.5 |
| 08:00 (GMT) | Germany | GDP (QoQ) | Quarter I | 0.3% | -1.5% |
| 08:00 (GMT) | Germany | GDP (YoY) | Quarter I | -3.7% | -3.2% |
| 09:00 (GMT) | Eurozone | Harmonized CPI | April | 0.9% | |
| 09:00 (GMT) | Eurozone | Unemployment Rate | March | 8.3% | 8.3% |
| 09:00 (GMT) | Eurozone | Harmonized CPI ex EFAT, Y/Y | April | 0.9% | 0.8% |
| 09:00 (GMT) | Eurozone | Harmonized CPI, Y/Y | April | 1.3% | 1.6% |
| 09:00 (GMT) | Eurozone | GDP (YoY) | Quarter I | -4.9% | -2% |
| 09:00 (GMT) | Eurozone | GDP (QoQ) | Quarter I | -0.7% | -0.8% |
| 12:30 (GMT) | U.S. | Personal spending | March | -1.0% | 4.1% |
| 12:30 (GMT) | U.S. | Employment Cost Index | Quarter I | 0.7% | 0.7% |
| 12:30 (GMT) | Canada | GDP (m/m) | February | 0.7% | 0.5% |
| 12:30 (GMT) | U.S. | PCE price index ex food, energy, Y/Y | March | 1.4% | 1.8% |
| 12:30 (GMT) | U.S. | PCE price index ex food, energy, m/m | March | 0.1% | 0.3% |
| 12:30 (GMT) | U.S. | Personal Income, m/m | March | -7.1% | 20.3% |
| 13:45 (GMT) | U.S. | Chicago Purchasing Managers' Index | April | 66.3 | 65.3 |
| 14:00 (GMT) | U.S. | Reuters/Michigan Consumer Sentiment Index | April | 84.9 | 87.4 |
| 17:00 (GMT) | U.S. | Baker Hughes Oil Rig Count | April | 343 |
| Pare | Closed | Change, % |
|---|---|---|
| AUDUSD | 0.77664 | -0.28 |
| EURJPY | 132.014 | 0.27 |
| EURUSD | 1.21213 | -0.01 |
| GBPJPY | 151.8 | 0.32 |
| GBPUSD | 1.39386 | 0.04 |
| NZDUSD | 0.72412 | -0.21 |
| USDCAD | 1.22807 | -0.27 |
| USDCHF | 0.9084 | -0.08 |
| USDJPY | 108.909 | 0.3 |


© 2000-2026. Sva prava zaštićena.
Sajt je vlasništvo kompanije Teletrade D.J. LLC 2351 LLC 2022 (Euro House, Richmond Hill Road, Kingstown, VC0100, St. Vincent and the Grenadines).
Svi podaci koji se nalaze na sajtu ne predstavljaju osnovu za donošenje investicionih odluka, već su informativnog karaktera.
The company does not serve or provide services to customers who are residents of the US, Canada, Iran, The Democratic People's Republic of Korea, Yemen and FATF blacklisted countries.
Izvršenje trgovinskih operacija sa finansijskim instrumentima upotrebom marginalne trgovine pruža velike mogućnosti i omogućava investitorima ostvarivanje visokih prihoda. Međutim, takav vid trgovine povezan je sa potencijalno visokim nivoom rizika od gubitka sredstava. Проведение торговых операций на финанcовых рынках c маржинальными финанcовыми инcтрументами открывает широкие возможноcти, и позволяет инвеcторам, готовым пойти на риcк, получать выcокую прибыль, но при этом неcет в cебе потенциально выcокий уровень риcка получения убытков. Iz tog razloga je pre započinjanja trgovine potrebno odlučiti o izboru odgovarajuće investicione strategije, uzimajući u obzir raspoložive resurse.
Upotreba informacija: U slučaju potpunog ili delimičnog preuzimanja i daljeg korišćenja materijala koji se nalazi na sajtu, potrebno je navesti link odgovarajuće stranice na sajtu kompanije TeleTrade-a kao izvora informacija. Upotreba materijala na internetu mora biti praćena hiper linkom do web stranice teletrade.org. Automatski uvoz materijala i informacija sa stranice je zabranjen.
Ako imate bilo kakvih pitanja, obratite nam se pr@teletrade.global.
транcфери