- Analiza
- Novosti i instrumenti
- Vesti sa tržišta
Forex-novosti i prognoze od 27-09-2024
- The NZD/USD climbed to fresh highs since December.
- The RSI stands deep in positive area and the MACD shows rising green bars supporting an overall bullish outlook.
- If the bulls fail to conquer 0.6400, it might trigger a downward correction.
On Friday, the NZD/USD pair continued its ascent from Thursday, adding 0.20%, reaching 0.6354 and continuing the bullish trend.
The technical indicators suggest that the buying pressure is likely to continue. The Relative Strength Index (RSI) is currently at 66, which is near the overbought area. This suggests that buying pressure is strong but that the movements might have become over-extended. The Moving Average Convergence Divergence (MACD) is also bullish, with the histogram rising and green.
NZD/USD daily chart
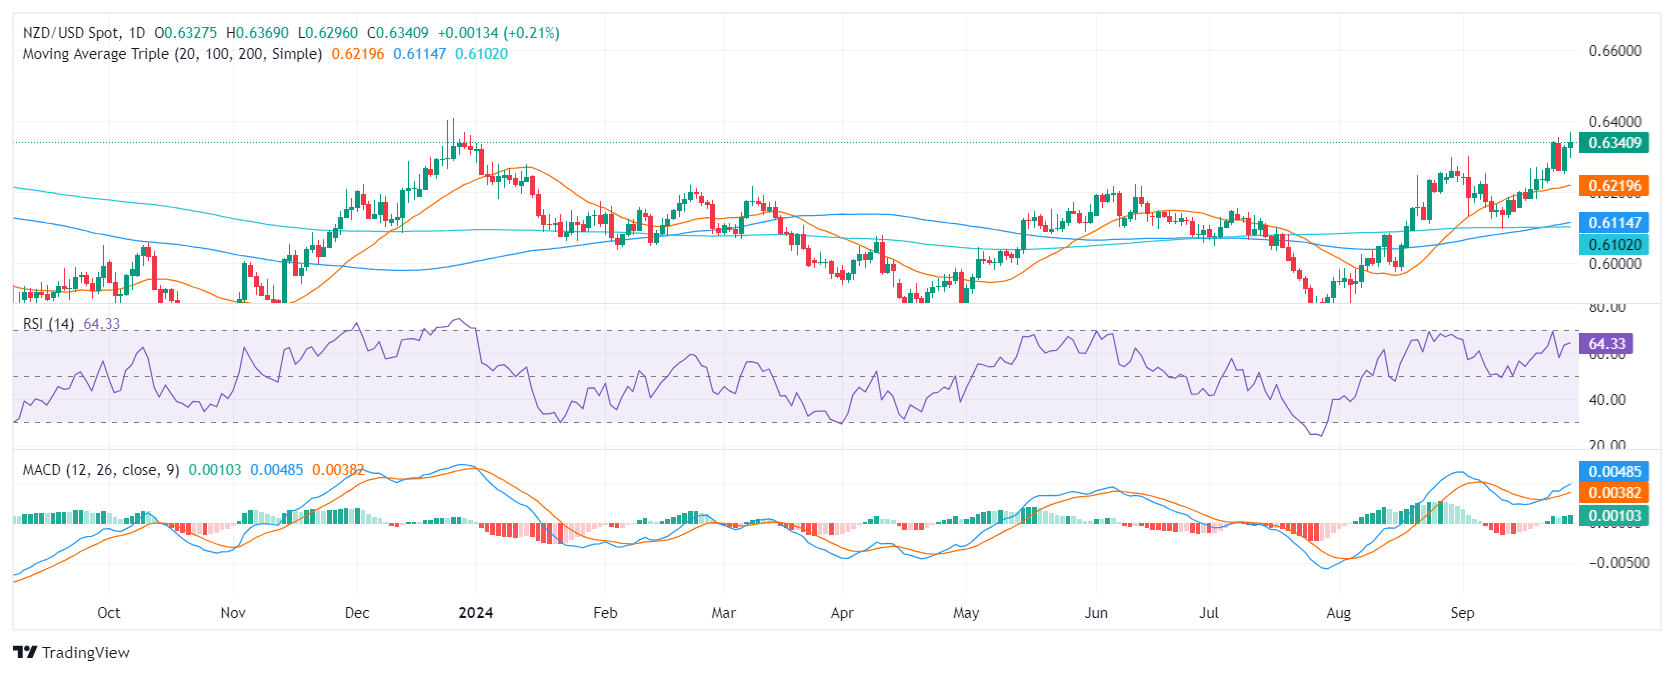
The overall outlook for the NZD/USD is bullish. The pair is trading above its key moving averages, and the technical indicators are regaining strength. Buyers seem to have hit a solid resistance at 0.6350, but buyers might be preparing to retest it. A break above could pave the way for more upside and the pair could test the 0.6400 level. On the other hand, a rejection at this level might trigger selling pressure and the bears might target the 0.6300 area and even more push the pair down to the 0.6250-0.6200. That being said, if the pair holds the 20-day Simple Moving Average (SMA) at 0.6220, the bullish outlook will remain intact.
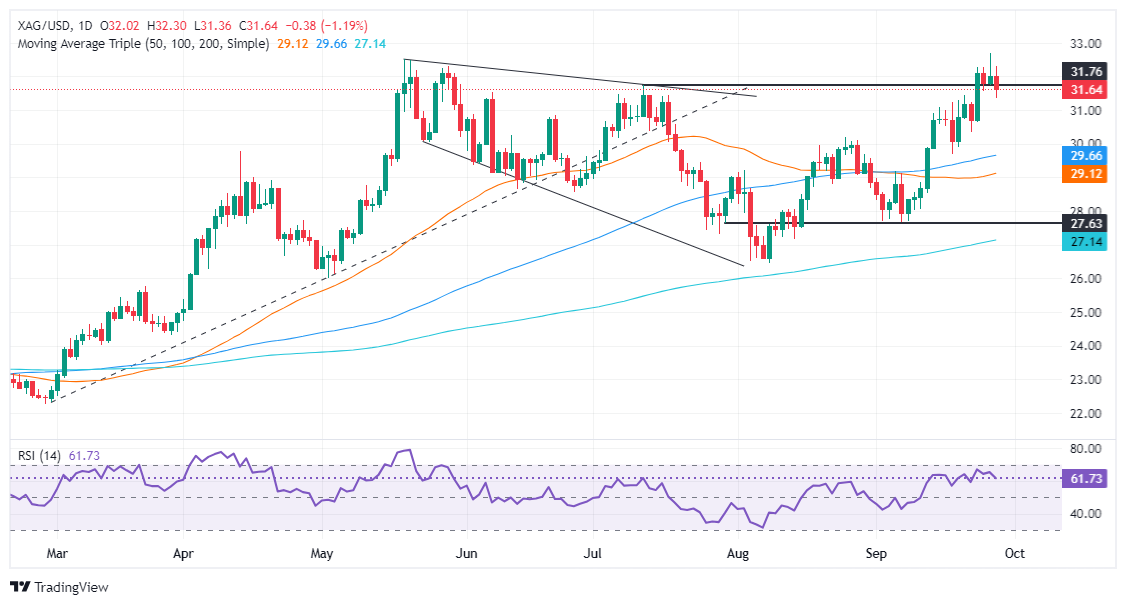
- XAG/USD drops over 1% to $31.60 after reaching a yearly high of $32.71 earlier in the week.
- Failure to close above $31.75 could see Silver trading between $31.00 and $31.70, with potential for further weakness.
- A break above $32.00 may lead to retesting the YTD high of $32.71, with $33.00 as the next key resistance level.
Silver prices dropped on Friday, finishing the session down by more than 1% after hitting a yearly record high of $32.71 on September 26. Buyers' failure to cling to gains above $32.00 exacerbated the drop toward $31.60, but they held to weekly profits of over 1.50%.
XAG/USD Price Forecast: Technical outlook
Silver is upward biased amid dipping to a four-day low of $31.37, but a daily close below the July 13 peak of $31.75 opens the scope to trade within the $31.00-$31.70 range.
The Relative Strength Index (RSI) remains bullish, but in the short term, sellers could push prices toward the September 23 low of $30.36. On further weakness, the next stop would be the 50-day moving average (DMA) at $29.64.
Conversely, if XAG/USD climbs back above $32.00, this could pave the way to test the YTD high of $32.71 before challenging $33.00 ahead of the October 1, 2012, peak at $35340.
XAG/USD Price Action – Daily Chart
Silver FAQs
Silver is a precious metal highly traded among investors. It has been historically used as a store of value and a medium of exchange. Although less popular than Gold, traders may turn to Silver to diversify their investment portfolio, for its intrinsic value or as a potential hedge during high-inflation periods. Investors can buy physical Silver, in coins or in bars, or trade it through vehicles such as Exchange Traded Funds, which track its price on international markets.
Silver prices can move due to a wide range of factors. Geopolitical instability or fears of a deep recession can make Silver price escalate due to its safe-haven status, although to a lesser extent than Gold's. As a yieldless asset, Silver tends to rise with lower interest rates. Its moves also depend on how the US Dollar (USD) behaves as the asset is priced in dollars (XAG/USD). A strong Dollar tends to keep the price of Silver at bay, whereas a weaker Dollar is likely to propel prices up. Other factors such as investment demand, mining supply – Silver is much more abundant than Gold – and recycling rates can also affect prices.
Silver is widely used in industry, particularly in sectors such as electronics or solar energy, as it has one of the highest electric conductivity of all metals – more than Copper and Gold. A surge in demand can increase prices, while a decline tends to lower them. Dynamics in the US, Chinese and Indian economies can also contribute to price swings: for the US and particularly China, their big industrial sectors use Silver in various processes; in India, consumers’ demand for the precious metal for jewellery also plays a key role in setting prices.
Silver prices tend to follow Gold's moves. When Gold prices rise, Silver typically follows suit, as their status as safe-haven assets is similar. The Gold/Silver ratio, which shows the number of ounces of Silver needed to equal the value of one ounce of Gold, may help to determine the relative valuation between both metals. Some investors may consider a high ratio as an indicator that Silver is undervalued, or Gold is overvalued. On the contrary, a low ratio might suggest that Gold is undervalued relative to Silver.
- The Canadian Dollar fell across the board on Friday.
- Canada saw a higher-then-expected GDP print from July.
- US PCE inflation data dominated Friday’s headlines.
The Canadian Dollar (CAD) fell back against all of its major currency peers on Friday, shedding nearly one-third of one percent against the Greenback. Markets shrugged off an upbeat print in Canadian Gross Domestic Product (GDP) growth figures, and cooling US Personal Consumption Expenditure Price Index (PCE) inflation is keeping market hopes for a follow-up rate cut on the high end.
Canada saw GDP rise more than expected in July, but a lack of other meaningful data saw CAD flows brush off the long-dated growth figure in favour of watching the US PCE inflation print. Headline PCE inflation cooled even faster than expected in August, keeping risk appetite on-balance.
Daily digest market movers
- Canadian MoM GDP bounced to 0.2% MoM in July, over and above the expected 0.1% and grinding up from the previous month’s 0.0%.
- Despite the upbeat Canadian GDP growth figure, CAD flows remained firmly lower on Friday.
- Headline US PCE inflation cooled faster than expected in August, easing to 2.2% YoY versus the forecast 2.3% and well back from the previous print of 2.5%.
- Despite the top being taken off the top of headline PCE inflation, core PCE inflation ticked higher to 2.7% YoY compared to the previous 2.6%.
- Rate market bets of another double rate cut for 50 bps have risen to 55% according to the CME’s FedWatch Tool.
Canadian Dollar price forecast
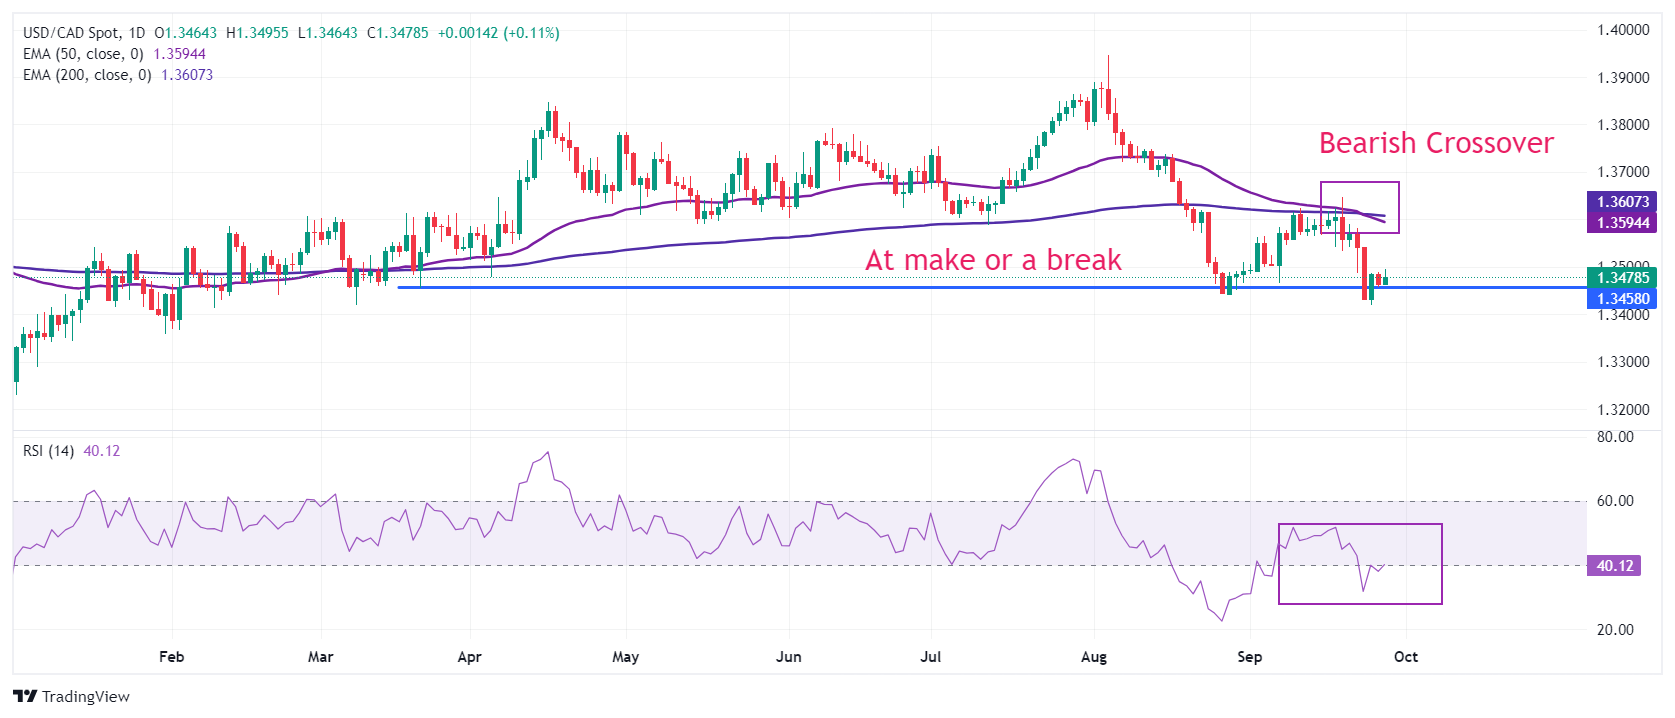
The Canadian Dollar (CAD0 is caught in the middle of lazy congestion against the Greenback, with the USD/CAD pair trading well within recent highs and lows. The pair is caught in sideways churn below the 200-day Exponential Moving Average (EMA).
USD/CAD has recovered from near-term lows priced in just south of the 1.3450 level, but US Dollar bulls are struggling to put stakes in and make a meaningful bullish drive despite clearing the 1.3500 handle on Friday.
USD/CAD daily chart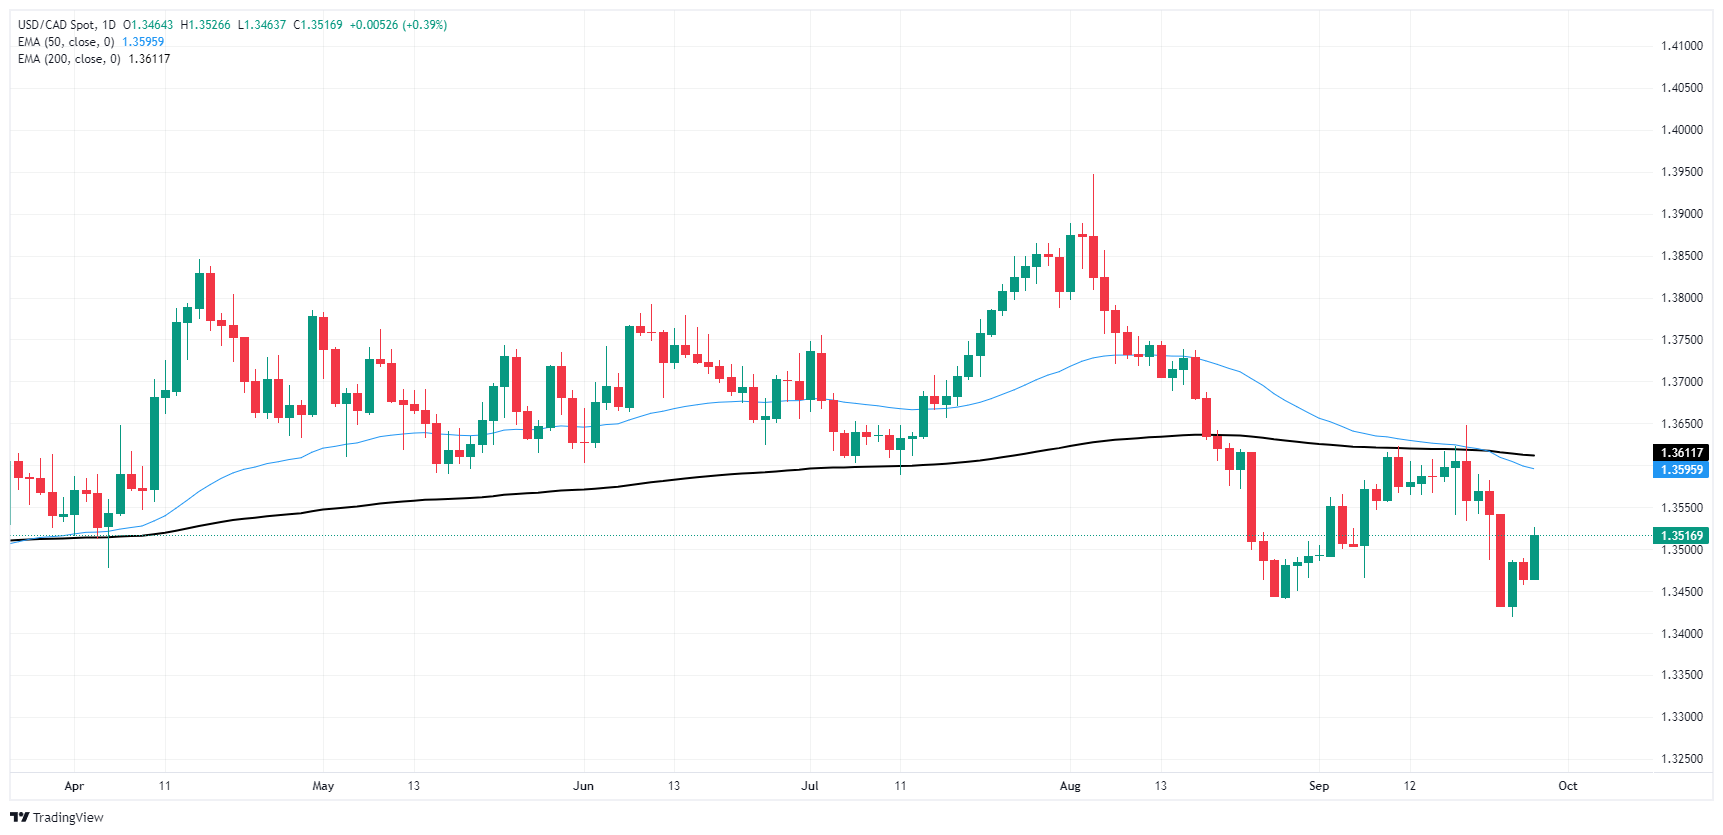
Canadian Dollar FAQs
The key factors driving the Canadian Dollar (CAD) are the level of interest rates set by the Bank of Canada (BoC), the price of Oil, Canada’s largest export, the health of its economy, inflation and the Trade Balance, which is the difference between the value of Canada’s exports versus its imports. Other factors include market sentiment – whether investors are taking on more risky assets (risk-on) or seeking safe-havens (risk-off) – with risk-on being CAD-positive. As its largest trading partner, the health of the US economy is also a key factor influencing the Canadian Dollar.
The Bank of Canada (BoC) has a significant influence on the Canadian Dollar by setting the level of interest rates that banks can lend to one another. This influences the level of interest rates for everyone. The main goal of the BoC is to maintain inflation at 1-3% by adjusting interest rates up or down. Relatively higher interest rates tend to be positive for the CAD. The Bank of Canada can also use quantitative easing and tightening to influence credit conditions, with the former CAD-negative and the latter CAD-positive.
The price of Oil is a key factor impacting the value of the Canadian Dollar. Petroleum is Canada’s biggest export, so Oil price tends to have an immediate impact on the CAD value. Generally, if Oil price rises CAD also goes up, as aggregate demand for the currency increases. The opposite is the case if the price of Oil falls. Higher Oil prices also tend to result in a greater likelihood of a positive Trade Balance, which is also supportive of the CAD.
While inflation had always traditionally been thought of as a negative factor for a currency since it lowers the value of money, the opposite has actually been the case in modern times with the relaxation of cross-border capital controls. Higher inflation tends to lead central banks to put up interest rates which attracts more capital inflows from global investors seeking a lucrative place to keep their money. This increases demand for the local currency, which in Canada’s case is the Canadian Dollar.
Macroeconomic data releases gauge the health of the economy and can have an impact on the Canadian Dollar. Indicators such as GDP, Manufacturing and Services PMIs, employment, and consumer sentiment surveys can all influence the direction of the CAD. A strong economy is good for the Canadian Dollar. Not only does it attract more foreign investment but it may encourage the Bank of Canada to put up interest rates, leading to a stronger currency. If economic data is weak, however, the CAD is likely to fall.
- AUD/USD gains traction from risk-on sentiment and China's stimulus measures.
- Hawkish RBA stance and soft US inflation maintain upside potential for AUD/USD.
- Markets are still betting on a 50 bps cut by the Fed.
The AUD/USD gained traction on Friday, climbing by 0.20% to 0.6910. Optimism surrounding China's stimulus measures, including monetary easing by the People's Bank of China (PBOC), provided support to the Australian Dollar, boosting risk appetite among investors. Personal Consumption Expenditures (PCE) figures from the US from August came in soft, also prompting USD weakness.
On one hand, the Reserve Bank of Australia (RBA) doesn't plan on cutting rates while the Federal Reserve (Fed) has already started its easing cycle, which adds downward pressure to the pair.
Daily digest market movers: Australian Dollar rises PCE data weights on the USD.
- The Australian Dollar appreciated against the US Dollar (USD) due to positive economic news from China and soft economic data from the US.
- The People's Bank of China (PBOC) implemented stimulus measures, including a rate cut and lower reserve requirement ratio, boosting risk sentiment and supporting the AUD.
- The RBA reiterated its hawkish stance, implying that the bank will maintain high interest rates until inflation returns to the target range, supporting the AUD.
- US inflation, as measured by the headline PCE Price Index, increased by 2.2% YoY in August, slightly below expectations and suggesting a modest inflationary environment.
- The core PCE Price Index, excluding food and energy, rose by 2.7%, in line with expectations and indicating a stable core inflation rate.
- Markets are betting on high odds of a 50 bps cut by the Fed in the November meeting and monetary policy divergence between the US central bank and the RBA, both supportive of the Aussie.
AUD/USD technical outlook: AUD/USD steady, hovering below 0.7000
The Relative Strength Index (RSI) and Moving Average Convergence Divergence (MACD) on the daily chart are strong, with the former above 50 pointing upward and the latter printing rising green bars.
With bullish momentum mounting, it all points to the pair being set for more upside. The next target is seen at 0.7000.
Australian Dollar FAQs
One of the most significant factors for the Australian Dollar (AUD) is the level of interest rates set by the Reserve Bank of Australia (RBA). Because Australia is a resource-rich country another key driver is the price of its biggest export, Iron Ore. The health of the Chinese economy, its largest trading partner, is a factor, as well as inflation in Australia, its growth rate and Trade Balance. Market sentiment – whether investors are taking on more risky assets (risk-on) or seeking safe-havens (risk-off) – is also a factor, with risk-on positive for AUD.
The Reserve Bank of Australia (RBA) influences the Australian Dollar (AUD) by setting the level of interest rates that Australian banks can lend to each other. This influences the level of interest rates in the economy as a whole. The main goal of the RBA is to maintain a stable inflation rate of 2-3% by adjusting interest rates up or down. Relatively high interest rates compared to other major central banks support the AUD, and the opposite for relatively low. The RBA can also use quantitative easing and tightening to influence credit conditions, with the former AUD-negative and the latter AUD-positive.
China is Australia’s largest trading partner so the health of the Chinese economy is a major influence on the value of the Australian Dollar (AUD). When the Chinese economy is doing well it purchases more raw materials, goods and services from Australia, lifting demand for the AUD, and pushing up its value. The opposite is the case when the Chinese economy is not growing as fast as expected. Positive or negative surprises in Chinese growth data, therefore, often have a direct impact on the Australian Dollar and its pairs.
Iron Ore is Australia’s largest export, accounting for $118 billion a year according to data from 2021, with China as its primary destination. The price of Iron Ore, therefore, can be a driver of the Australian Dollar. Generally, if the price of Iron Ore rises, AUD also goes up, as aggregate demand for the currency increases. The opposite is the case if the price of Iron Ore falls. Higher Iron Ore prices also tend to result in a greater likelihood of a positive Trade Balance for Australia, which is also positive of the AUD.
The Trade Balance, which is the difference between what a country earns from its exports versus what it pays for its imports, is another factor that can influence the value of the Australian Dollar. If Australia produces highly sought after exports, then its currency will gain in value purely from the surplus demand created from foreign buyers seeking to purchase its exports versus what it spends to purchase imports. Therefore, a positive net Trade Balance strengthens the AUD, with the opposite effect if the Trade Balance is negative.
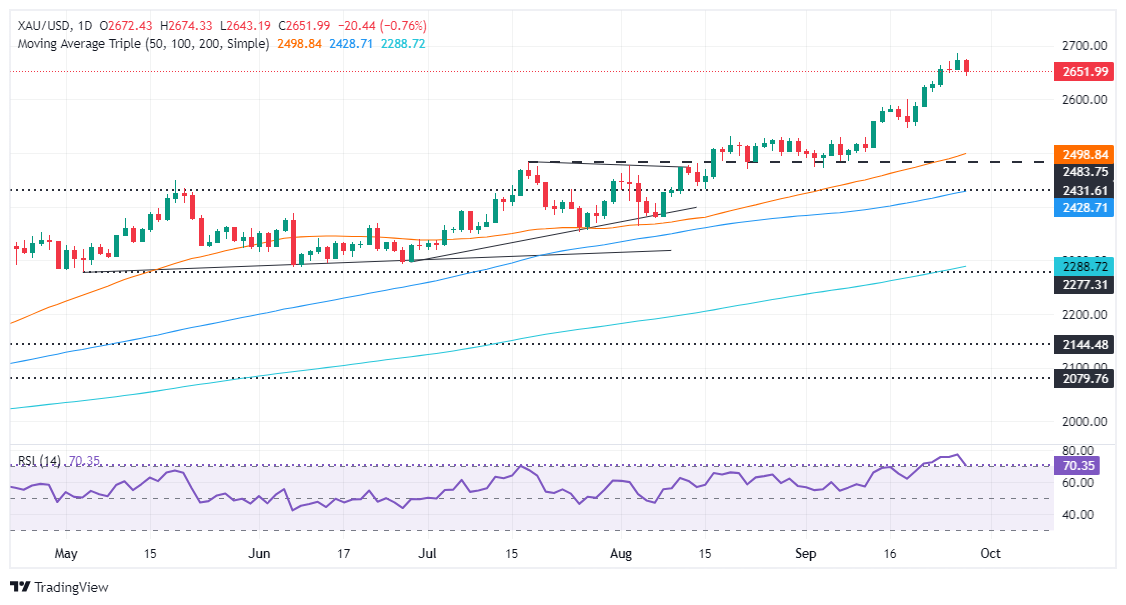
- XAU/USD drops to $2,646 after September inflation data suggests progress toward the Fed’s 2% target.
- US 10-year Treasury yield falls five basis points, while the US Dollar Index dips by 0.16% to 100.41.
- Geopolitical risks rise as Israel strikes Lebanon, but Gold fails to gain momentum as traders cash in profits.
Gold fell to a three-day low beneath $2,650 after the US Bureau of Economic Analysis (BEA) revealed that September inflation continued to evolve toward the Federal Reserve’s (Fed) goal. Even though this warranted further easing by the Fed, the golden metal failed to gain traction as analysts speculated that traders were booking profits. The XAU/USD trades at $2,646, down by almost 1%.
Earlier, the BEA revealed that the Fed’s preferred inflation gauge, the Personal Consumption Expenditures Price Index (PCE), is slightly closer to the central bank’s 2% target, according to August’s data. Meanwhile, core PCE increased by a tenth of a percentage point compared to July’s data.
Following the data, the US 10-year Treasury note yield fell five basis points to 3.749%. Consequently, the Greenback dropped as the US Dollar Index (DXY) slumped 0.16% to 100.41.
After the data, the odds of 50 basis points (bps) of easing at the November meeting increased, according to the CME FedWatch Tool.
Given the market’s reaction, it was expected that Gold prices might be set for another record high. Nevertheless, the XAU/USD plummeted below the September 26 daily low of $2,654, opening the door for a deeper pullback.
Other data revealed that the University of Michigan Consumer Sentiment for September improved in its final reading.
Aside from this, an escalation in the Middle East conflict between Israel and Hezbollah looms. Israel claimed that it hit Hezbollah’s main headquarters in southern Beirut on Friday.An Israeli official said the government hopes not to proceed with a ground invasion of Lebanon but would not rule it out.
Reuters revealed that Gold ETFs saw modest net inflows last week and have yet to fully contribute to Gold’s rally, though analysts expect more activity from ETFs in coming months.
Daily digest market movers: Gold price tumbles as US inflation approaches 2% goal
- August US PCE came in at 2.2% YoY, down from 2.5% a month earlier and slightly lower than the consensus estimate.
- Core PCE increased modestly as expected from 2.6% to 2.7% YoY for the same period.
- The University of Michigan (UoM) Consumer Sentiment for September improved from 69.0 to 70.1. Inflation expectations for one year dipped from 2.8% to 2.7%, while five-year expectations rose from 3% to 3.1%.
- Market participants have fully priced in at least a 25 bps rate cut by the Fed. However, the odds of a 50 bps cut have decreased to 54.7%, down from a 60% chance two days ago, according to the CME FedWatch Tool.
XAU/USD technical analysis: Gold price slumps and hovers around $2,650
Gold price hit an all-time high of $2,685 and remains upwardly biased. However, buyers were unable to hit new record highs, opening the door for a pullback. Short-term momentum favors sellers as the Relative Strength Index (RSI) exits from overbought territory, aiming toward the 60 mark.
If XAU/USD drops below $2,650, look for a test of the September 18 daily high at $2,600. The following key support levels to test will be the September 18 low of $2,546, followed by the 50-day Simple Moving Average (SMA) at $2,488.
Conversely, If XAU/USD extends its rally past the current year-to-date (YTD) peak of $2,685, the next resistance would be the $2,700 mark. Up next would be the $2,750 level, followed by $2,800.
Gold FAQs
Gold has played a key role in human’s history as it has been widely used as a store of value and medium of exchange. Currently, apart from its shine and usage for jewelry, the precious metal is widely seen as a safe-haven asset, meaning that it is considered a good investment during turbulent times. Gold is also widely seen as a hedge against inflation and against depreciating currencies as it doesn’t rely on any specific issuer or government.
Central banks are the biggest Gold holders. In their aim to support their currencies in turbulent times, central banks tend to diversify their reserves and buy Gold to improve the perceived strength of the economy and the currency. High Gold reserves can be a source of trust for a country’s solvency. Central banks added 1,136 tonnes of Gold worth around $70 billion to their reserves in 2022, according to data from the World Gold Council. This is the highest yearly purchase since records began. Central banks from emerging economies such as China, India and Turkey are quickly increasing their Gold reserves.
Gold has an inverse correlation with the US Dollar and US Treasuries, which are both major reserve and safe-haven assets. When the Dollar depreciates, Gold tends to rise, enabling investors and central banks to diversify their assets in turbulent times. Gold is also inversely correlated with risk assets. A rally in the stock market tends to weaken Gold price, while sell-offs in riskier markets tend to favor the precious metal.
The price can move due to a wide range of factors. Geopolitical instability or fears of a deep recession can quickly make Gold price escalate due to its safe-haven status. As a yield-less asset, Gold tends to rise with lower interest rates, while higher cost of money usually weighs down on the yellow metal. Still, most moves depend on how the US Dollar (USD) behaves as the asset is priced in dollars (XAU/USD). A strong Dollar tends to keep the price of Gold controlled, whereas a weaker Dollar is likely to push Gold prices up.
- The Dow Jones climbed into another fresh peak after PCE inflation print.
- Headline PCE inflation eased closer to Fed targets in August.
- Coming up next week: PMI activity measures, NFP labor print.
The Dow Jones Industrial Average (DJIA) rallied into another fresh record high on Friday, spurred higher by a cooler-than-expected print in the US Personal Consumption Expenditure Price Index (PCE) for August. Sentiment indicators also improved for September, and rate watchers will be pivoting to look ahead to next week’s Nonfarm Payrolls (NFP) report.
The PCE price index rose 0.1% in August, and chalked in PCE inflation growth of just 2.2% YoY, easing to the key inflation indicator’s lowest level since March of 2021. Headline inflation figures continue to ease toward the Federal Reserve’s (Fed) 2% target, but data watchers will note that the annualized core PCE print ticked higher for the year ended August, rising to 2.7% YoY from the previous 2.6%.
The University of Michigan’s (UoM) Consumer Sentiment Index rose again in September, printing at 70.1 compared to the expected 69.3 and even higher than the previous month’s print of 69.0. The UoM’s 5-year Consumer Inflation Expectations survey also held steady at 3.1% as elevated inflation expectations at the consumer level remain pervasive.
With this week’s data docket in the books, Fed watchers will be looking ahead to the next key data print, next Friday’s NFP labor report. Markets will broadly be looking for ongoing strength is the US labor market to further quell concerns about a potential recession looming over the US economy. US Purchasing Managers Index (PMI) business activity results are also expected early next week.
Dow Jones news
The Dow Jones leaned heavily into the bullish side on Friday, clipping a fresh record bid with most of the index’s individual stocks tilting into the green side. Only five of the Dow Jones’ constituent securities were stuck in the red for the day, with Amazon (AMZN) falling 1.5% to $188 per share. On the high end, Chevron (CVX) led the charge higher, rising 2.35% and climbing over the $145 per share level.
Dow Jones price forecast
The Dow Jones found a new record bid to wrap up the trading week, chalking in a new all-time high of 42,6365 before easing back below 42,500. Despite a regular stream of broken record highs, Dow Jones bulls are struggling to snag confident climbs, and bears are waiting just outside of the doors for an opportunity to drag price action back to the 50-day Exponential Moving Average (EMA) at 40,930.
Dow Jones daily chart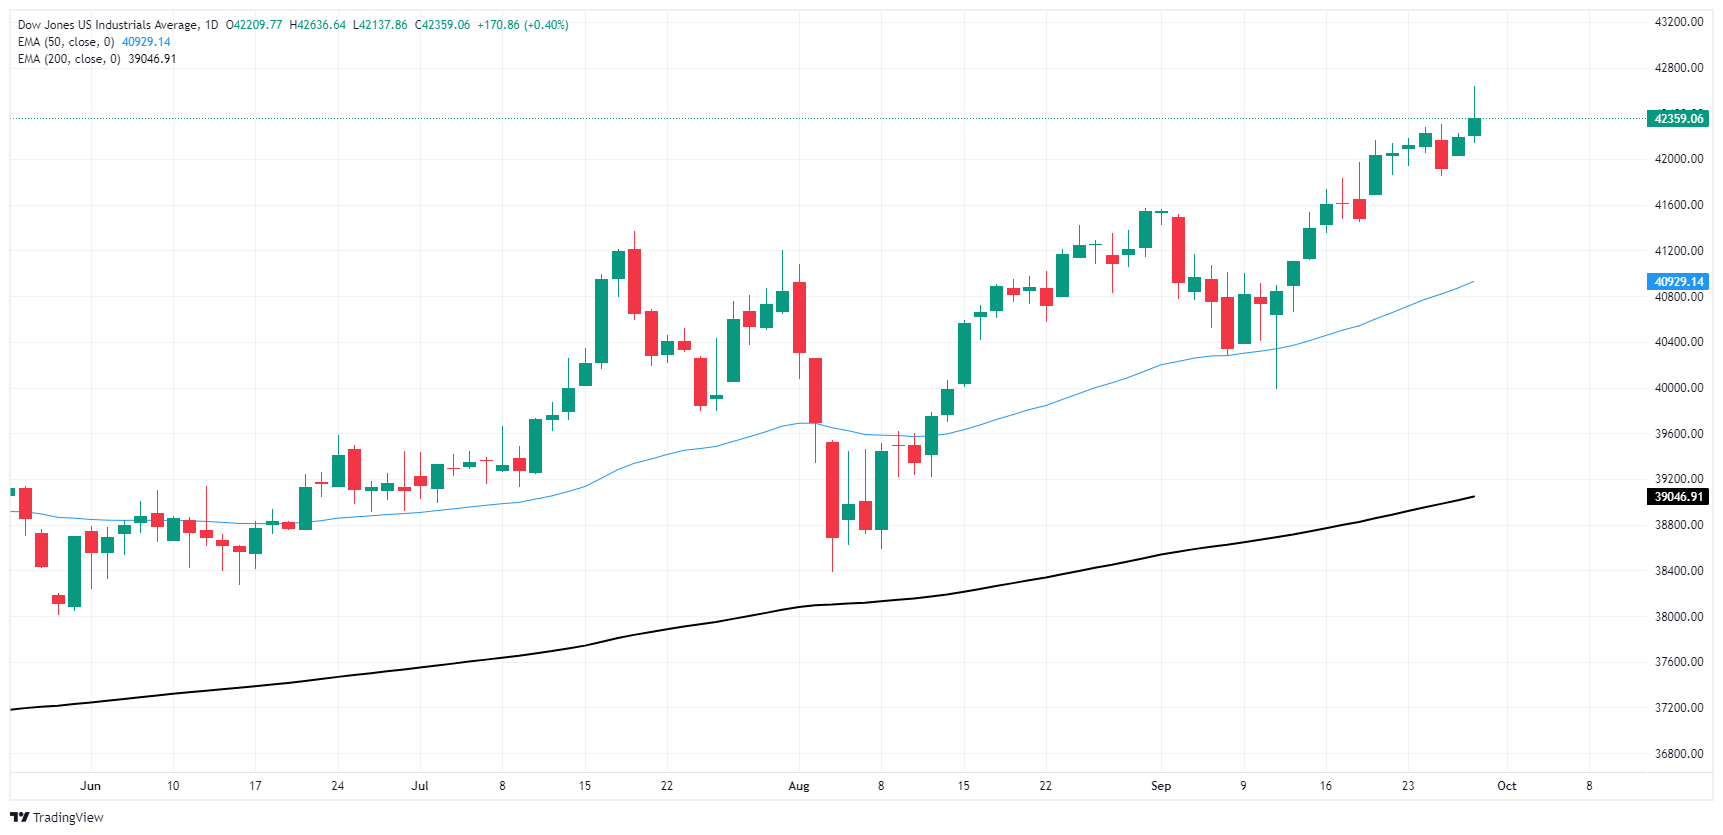
Dow Jones FAQs
The Dow Jones Industrial Average, one of the oldest stock market indices in the world, is compiled of the 30 most traded stocks in the US. The index is price-weighted rather than weighted by capitalization. It is calculated by summing the prices of the constituent stocks and dividing them by a factor, currently 0.152. The index was founded by Charles Dow, who also founded the Wall Street Journal. In later years it has been criticized for not being broadly representative enough because it only tracks 30 conglomerates, unlike broader indices such as the S&P 500.
Many different factors drive the Dow Jones Industrial Average (DJIA). The aggregate performance of the component companies revealed in quarterly company earnings reports is the main one. US and global macroeconomic data also contributes as it impacts on investor sentiment. The level of interest rates, set by the Federal Reserve (Fed), also influences the DJIA as it affects the cost of credit, on which many corporations are heavily reliant. Therefore, inflation can be a major driver as well as other metrics which impact the Fed decisions.
Dow Theory is a method for identifying the primary trend of the stock market developed by Charles Dow. A key step is to compare the direction of the Dow Jones Industrial Average (DJIA) and the Dow Jones Transportation Average (DJTA) and only follow trends where both are moving in the same direction. Volume is a confirmatory criteria. The theory uses elements of peak and trough analysis. Dow’s theory posits three trend phases: accumulation, when smart money starts buying or selling; public participation, when the wider public joins in; and distribution, when the smart money exits.
There are a number of ways to trade the DJIA. One is to use ETFs which allow investors to trade the DJIA as a single security, rather than having to buy shares in all 30 constituent companies. A leading example is the SPDR Dow Jones Industrial Average ETF (DIA). DJIA futures contracts enable traders to speculate on the future value of the index and Options provide the right, but not the obligation, to buy or sell the index at a predetermined price in the future. Mutual funds enable investors to buy a share of a diversified portfolio of DJIA stocks thus providing exposure to the overall index.
- US inflation signals are cooling with PCE reading below expectations.
- Consumer sentiment has rebounded, indicating brighter economic expectations.
- USD might see additional downside if the markets remain stubborn on November’s 50 bps cut bet.
The US Dollar Index (DXY), which measures the value of the USD against a basket of major currencies, stands soft after the release of the US Personal Consumption Expenditures (PCE) data from August. The headline PCE inflation, the Federal Reserve's (Fed) preferred inflation measure, came in softer than expected, while the core PCE inflation matched expectations.
Investors will be attentive to incoming data to continue placing their bets on the next Fed decision. Now focus shifts to September’s labor market data.
Daily digest market movers: US Dollar declines on soft PCE data
- Market is starting to pare back its Fed easing bets, with the market now pricing in 175 bps of total easing over the next 12 months vs. 200 bps at the start of this week.
- Headline PCE Price Index rose by 2.2% YoY in August, below market expectations of 2.3%.
- Core PCE Price Index, excluding food and energy, increased by 2.7%, matching consensus estimates.
- Consumer confidence in the US improved in September with the University of Michigan's Consumer Sentiment Index edging higher to 70.1 from 66 in August.
- The five-year inflation expectation held steady at 3.1%, indicating that consumers do not expect inflation to rise significantly in the coming years.
- While dovish bets eased somewhat, the markets are pricing in a 50 bps cut for the next November meeting, which seems to weaken the USD.
DXY technical outlook: DXY signals bearish momentum, resistance at 101.00
Technical analysis indicates that the DXY index remains vulnerable to further declines as the Relative Strength Index (RSI) and the Moving Average Convergence Divergence (MACD) continue their downward trend and struggle to gather momentum. The 101.00 level continues to act as a strong resistance, capping the upside potential for the US Dollar.
Supports are located at 100.50, 100.30 and 100.00, while resistances are at 101.00, 101.30 and 101.60. The index's inability to overcome the 101.00 level suggests that the downside momentum could persist in the near term.
US Dollar FAQs
The US Dollar (USD) is the official currency of the United States of America, and the ‘de facto’ currency of a significant number of other countries where it is found in circulation alongside local notes. It is the most heavily traded currency in the world, accounting for over 88% of all global foreign exchange turnover, or an average of $6.6 trillion in transactions per day, according to data from 2022. Following the second world war, the USD took over from the British Pound as the world’s reserve currency. For most of its history, the US Dollar was backed by Gold, until the Bretton Woods Agreement in 1971 when the Gold Standard went away.
The most important single factor impacting on the value of the US Dollar is monetary policy, which is shaped by the Federal Reserve (Fed). The Fed has two mandates: to achieve price stability (control inflation) and foster full employment. Its primary tool to achieve these two goals is by adjusting interest rates. When prices are rising too quickly and inflation is above the Fed’s 2% target, the Fed will raise rates, which helps the USD value. When inflation falls below 2% or the Unemployment Rate is too high, the Fed may lower interest rates, which weighs on the Greenback.
In extreme situations, the Federal Reserve can also print more Dollars and enact quantitative easing (QE). QE is the process by which the Fed substantially increases the flow of credit in a stuck financial system. It is a non-standard policy measure used when credit has dried up because banks will not lend to each other (out of the fear of counterparty default). It is a last resort when simply lowering interest rates is unlikely to achieve the necessary result. It was the Fed’s weapon of choice to combat the credit crunch that occurred during the Great Financial Crisis in 2008. It involves the Fed printing more Dollars and using them to buy US government bonds predominantly from financial institutions. QE usually leads to a weaker US Dollar.
Quantitative tightening (QT) is the reverse process whereby the Federal Reserve stops buying bonds from financial institutions and does not reinvest the principal from the bonds it holds maturing in new purchases. It is usually positive for the US Dollar.
- Mexican Peso extended its losses for the second straight day as USD/MXN hit a 19.74 peak.
- Banxico cuts rates to 10.50%, weakening the Peso as economic activity cools and inflation projections rise for 2024.
- US PCE inflation edged lower, but core PCE remains within the Fed’s comfort range of 2%-3%.
The Mexican peso lost steam on Friday against the US Dollar after inflation data in the United States (US) edged lower and failed to underpin the Mexican currency. However, the recent Bank of Mexico — known as Banxico — decision to lower interest rates weakened the Peso. At the time of writing, the USD/MXN trades at 19.72, gaining 0.50%.
The Federal Reserve’s favorite inflation gauge, the Personal Consumption Expenditures (PCE) Price Index, was lower than expected in August, according to the US Bureau of Economic Analysis (BEA). The same report showed that core PCE, which excludes volatile items like food and energy, ticked up by a tenth, yet it remains within the 2% to 3% range.
Further data showed that Personal Spending and Personal Income showed signs of deceleration, while the University of Michigan Consumer Sentiment for September, in its final reading, improved.
In Mexico, Banxico decided to cut interest rates from 10.75% to 10.50% in a 4-1 vote split on Thursday, with Deputy Governor Jonathan Heath dissenting after voting to keep rates unchanged.
Officials acknowledged that economic activity is weakening, putting pressure on the labor market, which has shown signs of cooling. Banxico revised its inflation expectations upward for headline and core figures in 2024 but maintained its estimate that inflation will reach the target by the end of 2025.
Despite revising inflation, the bank stated, "[T]he nature of the shocks that have affected the non-core component and the projection that their effects on headline inflation will continue dissipating over the next quarters,” adding that “although the outlook for inflation still calls for a restrictive monetary policy stance, its evolution implies that it is adequate to reduce the level of monetary restriction.”
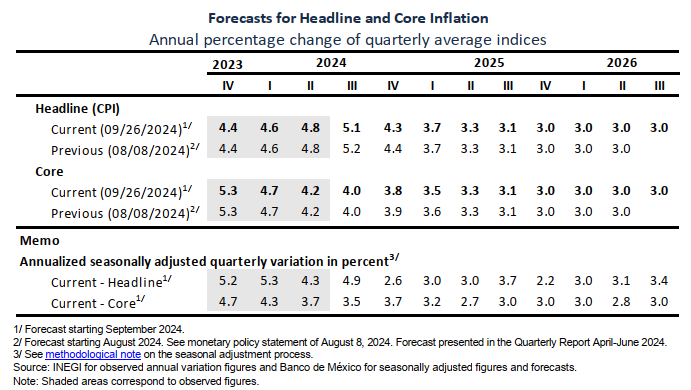
Source: Banxico's forecast
The Balance of Trade showed that Mexico’s economy printed a deficit five times larger than expected, exerting pressure on the Peso.
Daily digest market movers: Mexican Peso tumbles on Banxico’s decision, US inflation data
- Mexican political turmoil eases as market participants prepare for the change of president on October 1, a bank holiday in Mexico. President-Elect Claudia Sheinbaum’s speech will be watched for hints about her economic plan.
- Mexico’s Balance of Trade registered a deficit of $-4.86 billion in August, more than the $-0.5 billion expected by the consensus.
- August US PCE came at 2.2% YoY, down from 2.5% and a tenth lower than expected by the consensus.
- The core PCE edged modestly up, as expected, from 2.6% to 2.7% for the same period.
- The UoM Consumer Sentiment in September improved from 69.0 to 70.1. Inflation expectations for one year edged from 2.8% to 2.7%, and for a five-year period rose from 3% to 3.1%.
- Banxico is expected to lower borrowing costs by 175 bps toward the end of 2025, according to the swaps markets.
- US Dollar Index (DXY), which tracks the buck’s performance against a basket of six peers, is virtually unchanged at 100.50.
- Market participants have fully priced in at least a 25 bps rate cut by the Fed. However, the odds for 50 bps of easing are 54.7%, lower than the 60% chance two days ago, according to the CME FedWatch Tool.
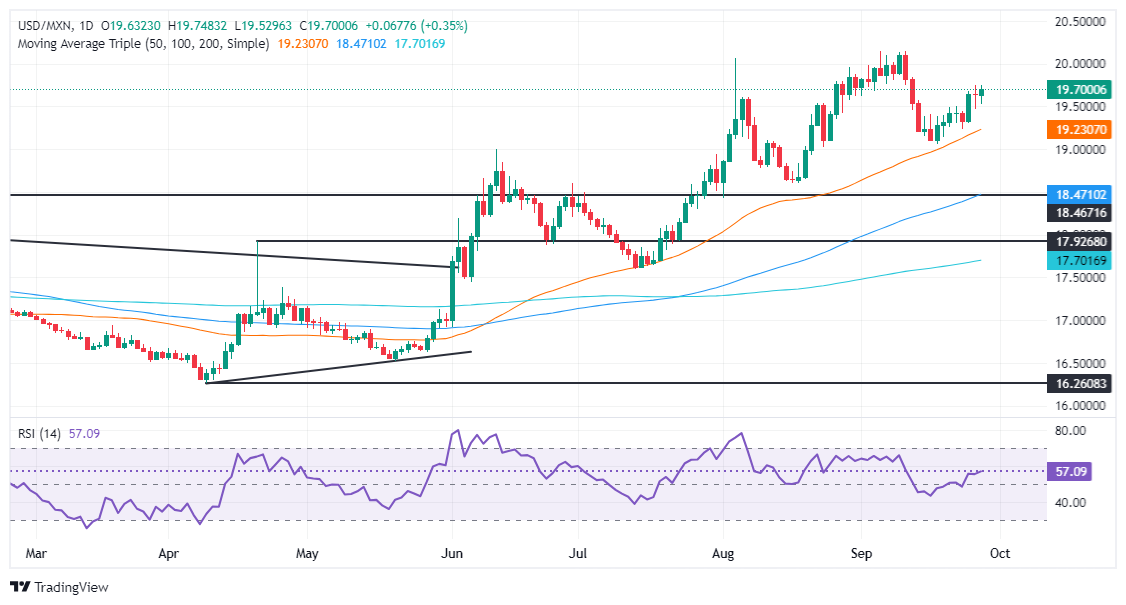
USD/MXN technical analysis: Mexican Peso slips as USD/MXN rises above 19.65
The USD/MXN resumed its uptrend, hitting a daily high of 19.74, following the tranche of data in Mexico and the US. The Relative Strength Index (RSI) remains bullish, hinting that momentum favors buyers.
Therefore, the USD/MXN could be headed for further gains. The first resistance would be the current week’s high of 19.75. Once surpassed, the next stop would be the September 12 peak at 19.84, followed by the 20.00 mark. If those two levels are cleared, the current year-to-date (YTD) high of 20.22 will be exposed.
On the flip side, if USD/MXN struggles to break 19.75, it could pave the way for lower prices. The first support would be the 19.50 mark, followed by the September 24 swing low of 19.23, before the pair moves toward the September 18 low of 19.06. Once those levels are surpassed, the 19.00 figure emerges as the next line of defense.
Mexican Peso FAQs
The Mexican Peso (MXN) is the most traded currency among its Latin American peers. Its value is broadly determined by the performance of the Mexican economy, the country’s central bank’s policy, the amount of foreign investment in the country and even the levels of remittances sent by Mexicans who live abroad, particularly in the United States. Geopolitical trends can also move MXN: for example, the process of nearshoring – or the decision by some firms to relocate manufacturing capacity and supply chains closer to their home countries – is also seen as a catalyst for the Mexican currency as the country is considered a key manufacturing hub in the American continent. Another catalyst for MXN is Oil prices as Mexico is a key exporter of the commodity.
The main objective of Mexico’s central bank, also known as Banxico, is to maintain inflation at low and stable levels (at or close to its target of 3%, the midpoint in a tolerance band of between 2% and 4%). To this end, the bank sets an appropriate level of interest rates. When inflation is too high, Banxico will attempt to tame it by raising interest rates, making it more expensive for households and businesses to borrow money, thus cooling demand and the overall economy. Higher interest rates are generally positive for the Mexican Peso (MXN) as they lead to higher yields, making the country a more attractive place for investors. On the contrary, lower interest rates tend to weaken MXN.
Macroeconomic data releases are key to assess the state of the economy and can have an impact on the Mexican Peso (MXN) valuation. A strong Mexican economy, based on high economic growth, low unemployment and high confidence is good for MXN. Not only does it attract more foreign investment but it may encourage the Bank of Mexico (Banxico) to increase interest rates, particularly if this strength comes together with elevated inflation. However, if economic data is weak, MXN is likely to depreciate.
As an emerging-market currency, the Mexican Peso (MXN) tends to strive during risk-on periods, or when investors perceive that broader market risks are low and thus are eager to engage with investments that carry a higher risk. Conversely, MXN tends to weaken at times of market turbulence or economic uncertainty as investors tend to sell higher-risk assets and flee to the more-stable safe havens.
What just happened?
August’s US Personal Consumption Expenditure Price Index (PCE), or PCEPI as the US Federal Reserve (Fed) refers to it, clocked in at an annualized rate of 2.2% YoY on September 27, the lowest print of the key inflation metric since March of 2021. This is an important step toward the Fed being able to claim ‘victory’ over inflation as price indexes continue to ease toward the US central bank’s overall target of 2% annual PCE inflation.
Despite the rosy print in headline PCEPI inflation in August, several headwinds to the Fed’s policy goals remain. Core PCEPI, a measure of PCE inflation that excludes food and energy prices which are subject to seasonality and volatility, ticked higher to 2.7% YoY in August, implying that underlying price pressures still remain.
Why does PCE inflation matter?
PCEPI is a key metric in the Fed’s wide stable of metrics. The Fed broadly favors PCEPI over the widely-followed Consumer Price Index (CPI), because the basket of goods and services used to track PCEPI is adjusted on a more regular basis, and includes out-of-pocket spending for both urban and rural communities. CPI inflation metrics only look at consumer expenses within urban regions, and the CPI index is updated biannually, as opposed to the PCEPI’s quarterly rebalance. Because of this, the Fed gives a heavier weighting to changes in PCEPI numbers when setting targets and debating policy shifts.
What happens next?
With PCEPI figures continuing to grind toward in Fed price targets (albeit in a wobbly way), the Fed and global markets will be pivoting to the next round of key US labor and employment figures. The Fed will also be looking for confirmation signs in other inflation metrics, such as the monthly CPI figure, to confirm that inflation will continue to head in the preferred direction.
Economic Indicator
Personal Consumption Expenditures - Price Index (YoY)
The Personal Consumption Expenditures (PCE), released by the US Bureau of Economic Analysis on a monthly basis, measures the changes in the prices of goods and services purchased by consumers in the United States (US). The YoY reading compares prices in the reference month to a year earlier. Price changes may cause consumers to switch from buying one good to another and the PCE Deflator can account for such substitutions. This makes it the preferred measure of inflation for the Federal Reserve. Generally, a high reading is bullish for the US Dollar (USD), while a low reading is bearish.
Read more.Last release: Fri Sep 27, 2024 12:30
Frequency: Monthly
Actual: 2.2%
Consensus: 2.3%
Previous: 2.5%
Source: US Bureau of Economic Analysis
Inflation FAQs
Inflation measures the rise in the price of a representative basket of goods and services. Headline inflation is usually expressed as a percentage change on a month-on-month (MoM) and year-on-year (YoY) basis. Core inflation excludes more volatile elements such as food and fuel which can fluctuate because of geopolitical and seasonal factors. Core inflation is the figure economists focus on and is the level targeted by central banks, which are mandated to keep inflation at a manageable level, usually around 2%.
The Consumer Price Index (CPI) measures the change in prices of a basket of goods and services over a period of time. It is usually expressed as a percentage change on a month-on-month (MoM) and year-on-year (YoY) basis. Core CPI is the figure targeted by central banks as it excludes volatile food and fuel inputs. When Core CPI rises above 2% it usually results in higher interest rates and vice versa when it falls below 2%. Since higher interest rates are positive for a currency, higher inflation usually results in a stronger currency. The opposite is true when inflation falls.
Although it may seem counter-intuitive, high inflation in a country pushes up the value of its currency and vice versa for lower inflation. This is because the central bank will normally raise interest rates to combat the higher inflation, which attract more global capital inflows from investors looking for a lucrative place to park their money.
Formerly, Gold was the asset investors turned to in times of high inflation because it preserved its value, and whilst investors will often still buy Gold for its safe-haven properties in times of extreme market turmoil, this is not the case most of the time. This is because when inflation is high, central banks will put up interest rates to combat it. Higher interest rates are negative for Gold because they increase the opportunity-cost of holding Gold vis-a-vis an interest-bearing asset or placing the money in a cash deposit account. On the flipside, lower inflation tends to be positive for Gold as it brings interest rates down, making the bright metal a more viable investment alternative.
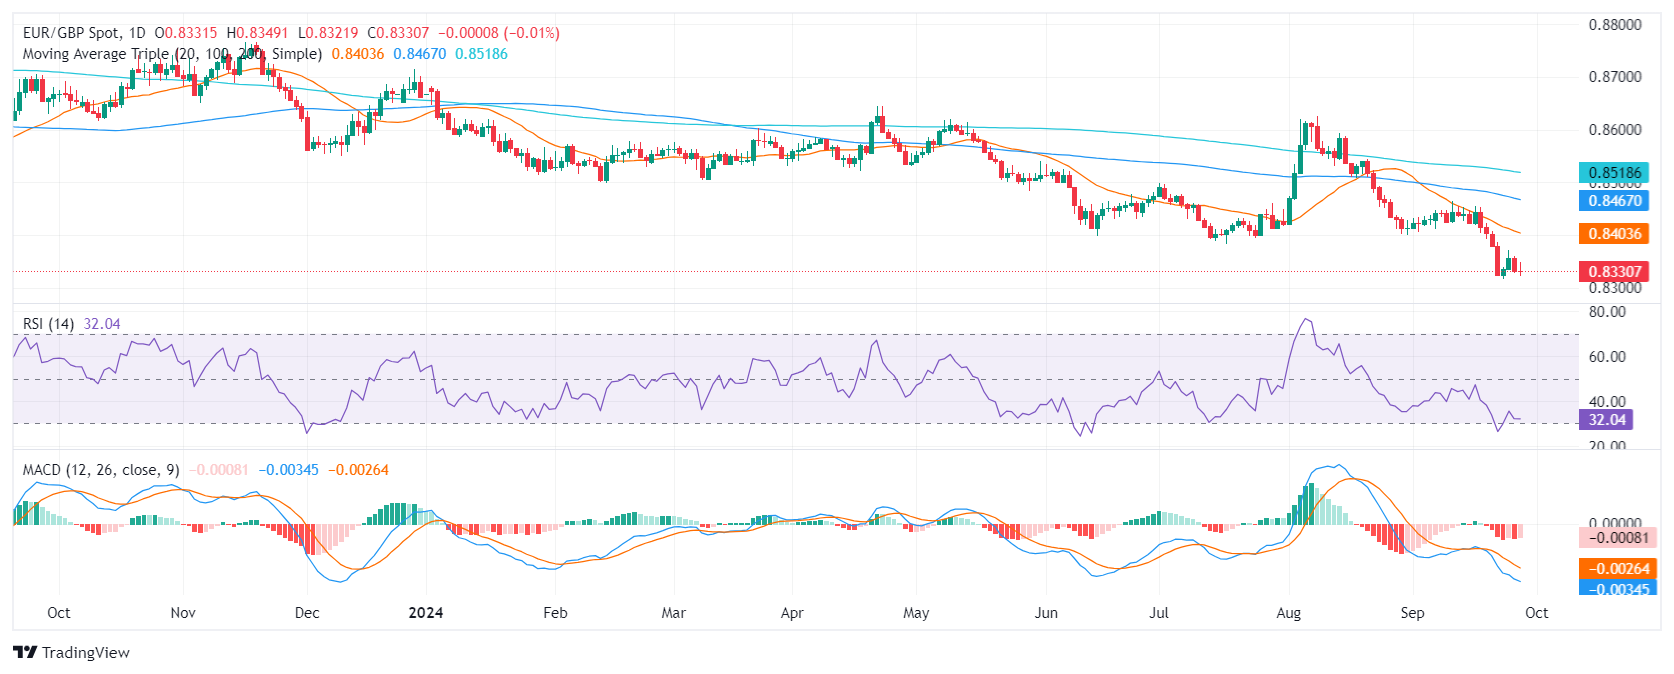
- The EUR/GBP pair traded sideways on Friday, clearing daily gains and stabilizing at 0.8335.
- The RSI and MACD suggest that selling pressure is steady but continues flashing oversold conditions.
- The pair seems to be consolidating Wednesday’s sharp downward movements.
The EUR/GBP has been in a steady decline over the past trading days and bears stepped out to take a breather. On Friday, the cross initially jumped to 0.8350 and then stabilized at 0.8330 which gives more arguments that the buyers struggle.
The Relative Strength Index (RSI) is in the near oversold area, suggesting that selling pressure is intense while the Moving Average Convergence Divergence (MACD) histogram is red and flat, which supports the case for consolidation in the near tear.
The EUR/GBP pair appears to face near-term downward pressure, with bears currently dominating the market. A drop below the 0.8300 support level could trigger further declines. However, oversold signals from technical indicators suggest the possibility of an upward correction. For the bulls to regain control, a break above the 0.8400 resistance level would be necessary.
EUR/GBP daily chart
As reported by the Financial Times, citing sources with knowledge of the matter, Saudi Arabia intends to abandon its unofficial price target of $100 per barrel allowing it to increase oil production. There is no officially announced price target, Commerzbank commodity analyst Carsten Fritsch notes.
Gradual withdrawal of the voluntary production cuts seems likely
“According to IMF calculations, Saudi Arabia needs an oil price of almost $100 to balance the national budget. Due to the production cuts and the resulting reduction in export volumes, the required price had continued to rise. Saudi Arabia is no longer willing to give up market share to other producers and also has sufficient alternative financing options to weather a period of lower oil prices. Thus, a gradual withdrawal of the voluntary production cuts from the beginning of December seems likely.”
“Two OPEC+ sources said yesterday that the planned production increase would go ahead. For Saudi Arabia, we are talking about 1 million barrels per day; for OPEC+ as a whole, 2.2 million barrels per day. Since some countries, such as Iraq and Kazakhstan, have not cut their production as agreed, the actual production increase is likely to be closer to 1.6-1.7 million barrels per day.”
“If this amount does indeed come onto the market gradually from December, the oil market will potentially face a considerable oversupply in the coming year. The oil price would react to this with a further price drop. There would then be downside risks to our oil price forecast of USD 80 next year.”
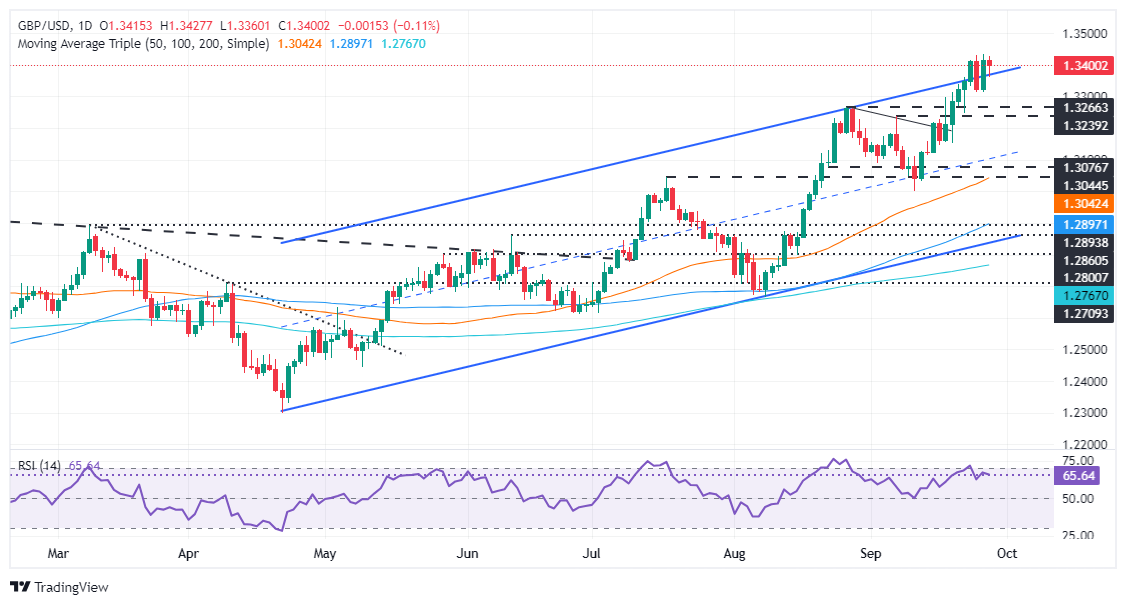
- GBP/USD trades at 1.3403, down 0.08%, close to its two-year peak.
- Momentum fades with potential negative divergence, but a break above 1.3437 could target 1.3450 and 1.3500.
- A drop below 1.3312 could see further declines toward the September 23 low of 1.3248.
The Pound Sterling registered minuscule losses against the Greenback, yet it remains close to two-year peak levels on Friday. The US Bureau of Economic Analysis revealed that inflation is about to hit the Fed’s 2% target. At the time of writing, the GBP/USD trades at 1.3403, down 0.08%.
GBP/USD Price Forecast: Technical outlook
The pair is upward biased, though the trend has lost some steam as buyers failed to push the GBP/USD to a new record high in 2024.
As price action continues to edge higher, momentum has faded. The Relative Strength Index (RSI) continues to edge lower, while spot prices are aimed higher. Hence, a negative divergence might be forming, but sellers must push prices below the top trendline of an ascending channel.
If GBP/USD extends its gains past the March 1, 2022 peak of 1.3437, the next resistance would be 1.3450, followed by 1.3500.
Conversely, if the major drops below the September 25, 26 low of 1.3312, further losses beneath. The next support would be the September 23 low at 1.3248, followed by the 1.3200 figure.
GBP/USD Price Action – Daily Chart
Pound Sterling FAQs
The Pound Sterling (GBP) is the oldest currency in the world (886 AD) and the official currency of the United Kingdom. It is the fourth most traded unit for foreign exchange (FX) in the world, accounting for 12% of all transactions, averaging $630 billion a day, according to 2022 data. Its key trading pairs are GBP/USD, aka ‘Cable’, which accounts for 11% of FX, GBP/JPY, or the ‘Dragon’ as it is known by traders (3%), and EUR/GBP (2%). The Pound Sterling is issued by the Bank of England (BoE).
The single most important factor influencing the value of the Pound Sterling is monetary policy decided by the Bank of England. The BoE bases its decisions on whether it has achieved its primary goal of “price stability” – a steady inflation rate of around 2%. Its primary tool for achieving this is the adjustment of interest rates. When inflation is too high, the BoE will try to rein it in by raising interest rates, making it more expensive for people and businesses to access credit. This is generally positive for GBP, as higher interest rates make the UK a more attractive place for global investors to park their money. When inflation falls too low it is a sign economic growth is slowing. In this scenario, the BoE will consider lowering interest rates to cheapen credit so businesses will borrow more to invest in growth-generating projects.
Data releases gauge the health of the economy and can impact the value of the Pound Sterling. Indicators such as GDP, Manufacturing and Services PMIs, and employment can all influence the direction of the GBP. A strong economy is good for Sterling. Not only does it attract more foreign investment but it may encourage the BoE to put up interest rates, which will directly strengthen GBP. Otherwise, if economic data is weak, the Pound Sterling is likely to fall.
Another significant data release for the Pound Sterling is the Trade Balance. This indicator measures the difference between what a country earns from its exports and what it spends on imports over a given period. If a country produces highly sought-after exports, its currency will benefit purely from the extra demand created from foreign buyers seeking to purchase these goods. Therefore, a positive net Trade Balance strengthens a currency and vice versa for a negative balance.
- USD/JPY falls further to 142.50 on multiple headwinds.
- Japan Ishiba’s victory in PM elections has strengthened the Japanese Yen.
- Cooling US inflationary pressures have weighed on the US Dollar.
The USD/JPY pair nosedives to near 142.50 in Friday’s North American session. The asset weakens as the victory of Japan's former defence minister Shigeru Ishiba in the Prime Ministerial contest has strengthened the Japanese Yen (JPY).
Japanese Yen PRICE Today
The table below shows the percentage change of Japanese Yen (JPY) against listed major currencies today. Japanese Yen was the strongest against the Canadian Dollar.
| USD | EUR | GBP | JPY | CAD | AUD | NZD | CHF | |
|---|---|---|---|---|---|---|---|---|
| USD | -0.02% | 0.11% | -1.54% | 0.11% | -0.47% | -0.53% | -0.50% | |
| EUR | 0.02% | 0.12% | -1.53% | 0.09% | -0.45% | -0.54% | -0.47% | |
| GBP | -0.11% | -0.12% | -1.64% | -0.02% | -0.57% | -0.63% | -0.59% | |
| JPY | 1.54% | 1.53% | 1.64% | 1.66% | 1.10% | 1.02% | 1.10% | |
| CAD | -0.11% | -0.09% | 0.02% | -1.66% | -0.59% | -0.63% | -0.59% | |
| AUD | 0.47% | 0.45% | 0.57% | -1.10% | 0.59% | -0.06% | -0.02% | |
| NZD | 0.53% | 0.54% | 0.63% | -1.02% | 0.63% | 0.06% | 0.04% | |
| CHF | 0.50% | 0.47% | 0.59% | -1.10% | 0.59% | 0.02% | -0.04% |
The heat map shows percentage changes of major currencies against each other. The base currency is picked from the left column, while the quote currency is picked from the top row. For example, if you pick the Japanese Yen from the left column and move along the horizontal line to the US Dollar, the percentage change displayed in the box will represent JPY (base)/USD (quote).
A sharp rally in the Yen suggests that the market participants expect the victory of new PM Shigeru Ishiba to be favorable for further interest rate hikes by the Bank of Japan (BoJ). In his previous comments, Ishiba told Reuters that the central bank was "on the right policy track" with rate hikes thus far.
Meanwhile, a sharp weakness in the US Dollar (USD) after the release of the softer-than-expected United States (US) Personal Consumption Expenditure Price Index (PCE) data for August has also prompted further downside in the asset. Annual PCE inflation decelerated to 2.2%, faster than estimates of 2.3% and the July’s reading of 2.5%. The core PCE price index, which excludes volatile food and energy prices and is a Federal Reserve’s (Fed) preferred inflation measure, rose expectedly by 2.7%.
The US Dollar Index (DXY), which tracks the Greenback’s value against six major currencies, slumps to near the Year-to-date (YTD) low of 100.20. More weakness in the US Dollar would result in a fresh bear cycle.
A further slowdown in US inflationary pressures has added to expectations that the Fed could cut interest rates by 50 basis points (bps) again in November. The Fed pivoted to policy-normalization with a larger-than-usual 50 bps rate last week due to growing concerns over deteriorating job growth.
- Consumer confidence in the US improved by more than anticipated in September.
- UoM survey showed five-year inflation expectation held steady at 3.1%.
Consumer confidence in the US improved in September, with the University of Michigan's Consumer Sentiment Index edging higher to 70.1 from 66 in August. This reading came in above the market expectation of 69.3. “Sentiment appears to be building some momentum as consumers’ expectations for the economy brighten,” the report reads.
The Current Conditions Index improved to 63.3 from 61.3 7, and the Consumer Expectations Index rose to 74.4 from 72.1
The survey details revealed that the five-year inflation expectation held steady at 3.1%.
Market reaction
The report gave the US Dollar a modest boost, helping the USD to recover some ground after the sharp slide resulting from softer-than-anticipated inflation-related figures.
US Dollar PRICE Today
The table below shows the percentage change of US Dollar (USD) against listed major currencies today. US Dollar was the strongest against the Canadian Dollar.
| USD | EUR | GBP | JPY | CAD | AUD | NZD | CHF | |
|---|---|---|---|---|---|---|---|---|
| USD | -0.05% | 0.06% | -1.61% | 0.11% | -0.47% | -0.54% | -0.54% | |
| EUR | 0.05% | 0.10% | -1.56% | 0.12% | -0.41% | -0.50% | -0.46% | |
| GBP | -0.06% | -0.10% | -1.66% | 0.03% | -0.52% | -0.59% | -0.57% | |
| JPY | 1.61% | 1.56% | 1.66% | 1.73% | 1.16% | 1.08% | 1.14% | |
| CAD | -0.11% | -0.12% | -0.03% | -1.73% | -0.59% | -0.64% | -0.62% | |
| AUD | 0.47% | 0.41% | 0.52% | -1.16% | 0.59% | -0.07% | -0.05% | |
| NZD | 0.54% | 0.50% | 0.59% | -1.08% | 0.64% | 0.07% | 0.02% | |
| CHF | 0.54% | 0.46% | 0.57% | -1.14% | 0.62% | 0.05% | -0.02% |
The heat map shows percentage changes of major currencies against each other. The base currency is picked from the left column, while the quote currency is picked from the top row. For example, if you pick the US Dollar from the left column and move along the horizontal line to the Japanese Yen, the percentage change displayed in the box will represent USD (base)/JPY (quote).
- AUD/USD breaks out of the top of a range and rallies.
- It has reached an initial bullish target and there is a risk it could soon pull back.
AUD/USD breaks above its range highs and follows through to the upside on Friday.
It is in a short-term uptrend which given the principle that “the trend is your friend” is more likely to extend than not.
AUD/USD Daily Chart
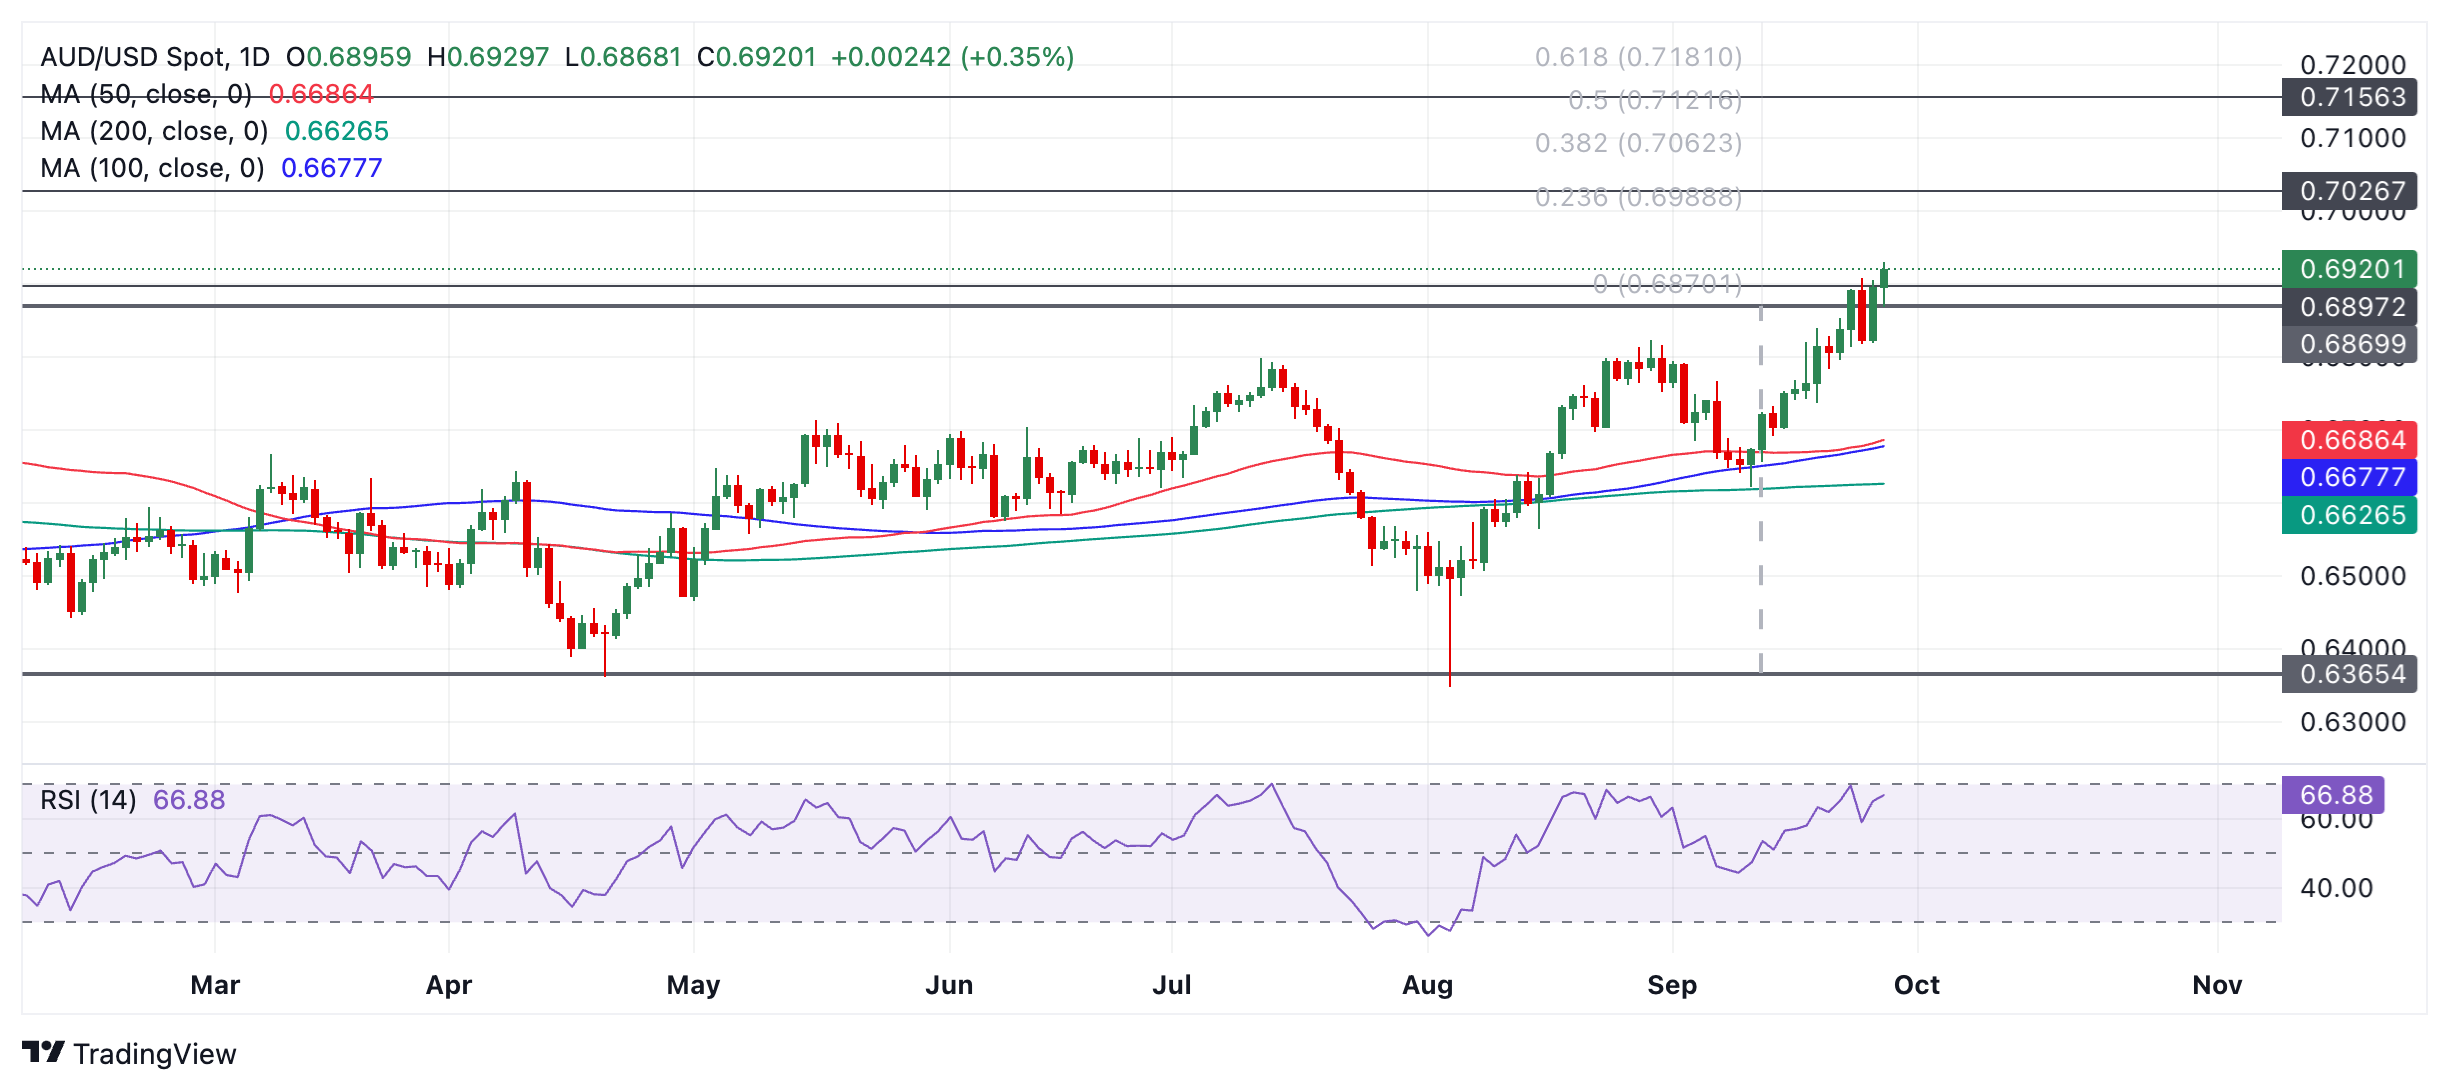
The next target to the upside is 0.6988 (14 February ‘23 swing high), followed by 0.7156 in a bullish case (2 February ‘23 high).
The pair is not overbought according to the Relative Strength Index (RSI) momentum indicator and so has breadth for more upside.
AUD/USD has reached an initial upside target based on extrapolating the August rally from the base of the early September correction, higher by a 61.8% Fibonacci. This target lies at around 0.6115 and has already been surpassed. This could indicate the trend has no higher to go and the pair will pull back. There are no signs yet from price action that this is about to occur.
- USD/CAD remains below 1.3500 after the release of the US PCE inflation and the Canadian GDP data.
- The US PCE inflation decelerated at a faster-than-expected pace to 2.2% in August.
- The Canadian economy expanded at a better-than-expected pace of 0.2% in July.
The USD/CAD continues to range below the psychological resistance of 1.3500, in Friday’s New York session, despite the release of the United States (US) Personal Consumption Expenditure inflation (PCE) report for August, suggesting that inflation is on track to return to bank’s target of 2%.
The annual PCE Price Index came in lower at 2.2%, slower than estimates of 2.3% and the July’s reading of 2.5%. In the same period, the core PCE inflation, which excludes volatile food and energy prices, rose by 2.7%, as expected. This would prompt market expectations for the Federal Reserve (Fed) to deliver another 50 basis points (bps) interest rate cut in November.
Going forward, investors will shift focus to a slew of US labor market data, which will be published next week. Market participants will keenly focus on them to know the current status of job growth. Last week, the Fed delivered an outsized interest rate cut of 50 bps, pushing interest rates down to 4.75%-5.00% amid growing concerns over weakening labor demand.
Next week, investors will also focus on the US ISM Manufacturing and Services Purchasing Managers’ Index (PMI) data for September, which will provide the current status of the economic health.
Meanwhile, the monthly Canadian Gross Domestic Product (GDP) growth for July has come in higher at 0.2% than expectations of 0.1% and a flat performance in June. Better-than-expected Canadian GDP data is unlikely to provide a reason to Bank of Canada (BoC) policymakers to pause the policy-easing cycle, which started in June. The BoC has already cut interest rates by 75 bps to 4.25%.
- EUR/GBP appears to have stalled after pulling back higher from the September 24 lows.
- The pair may be resuming its downtrend and could break lower.
EUR/GBP stalls in its pull back from the September 24 lows and resumes its downside bias.
The pair is in a short and medium-term downtrend which given the technical analysis theory that “the trend is your friend” is more likely than not to continue.
EUR/GBP Daily Chart
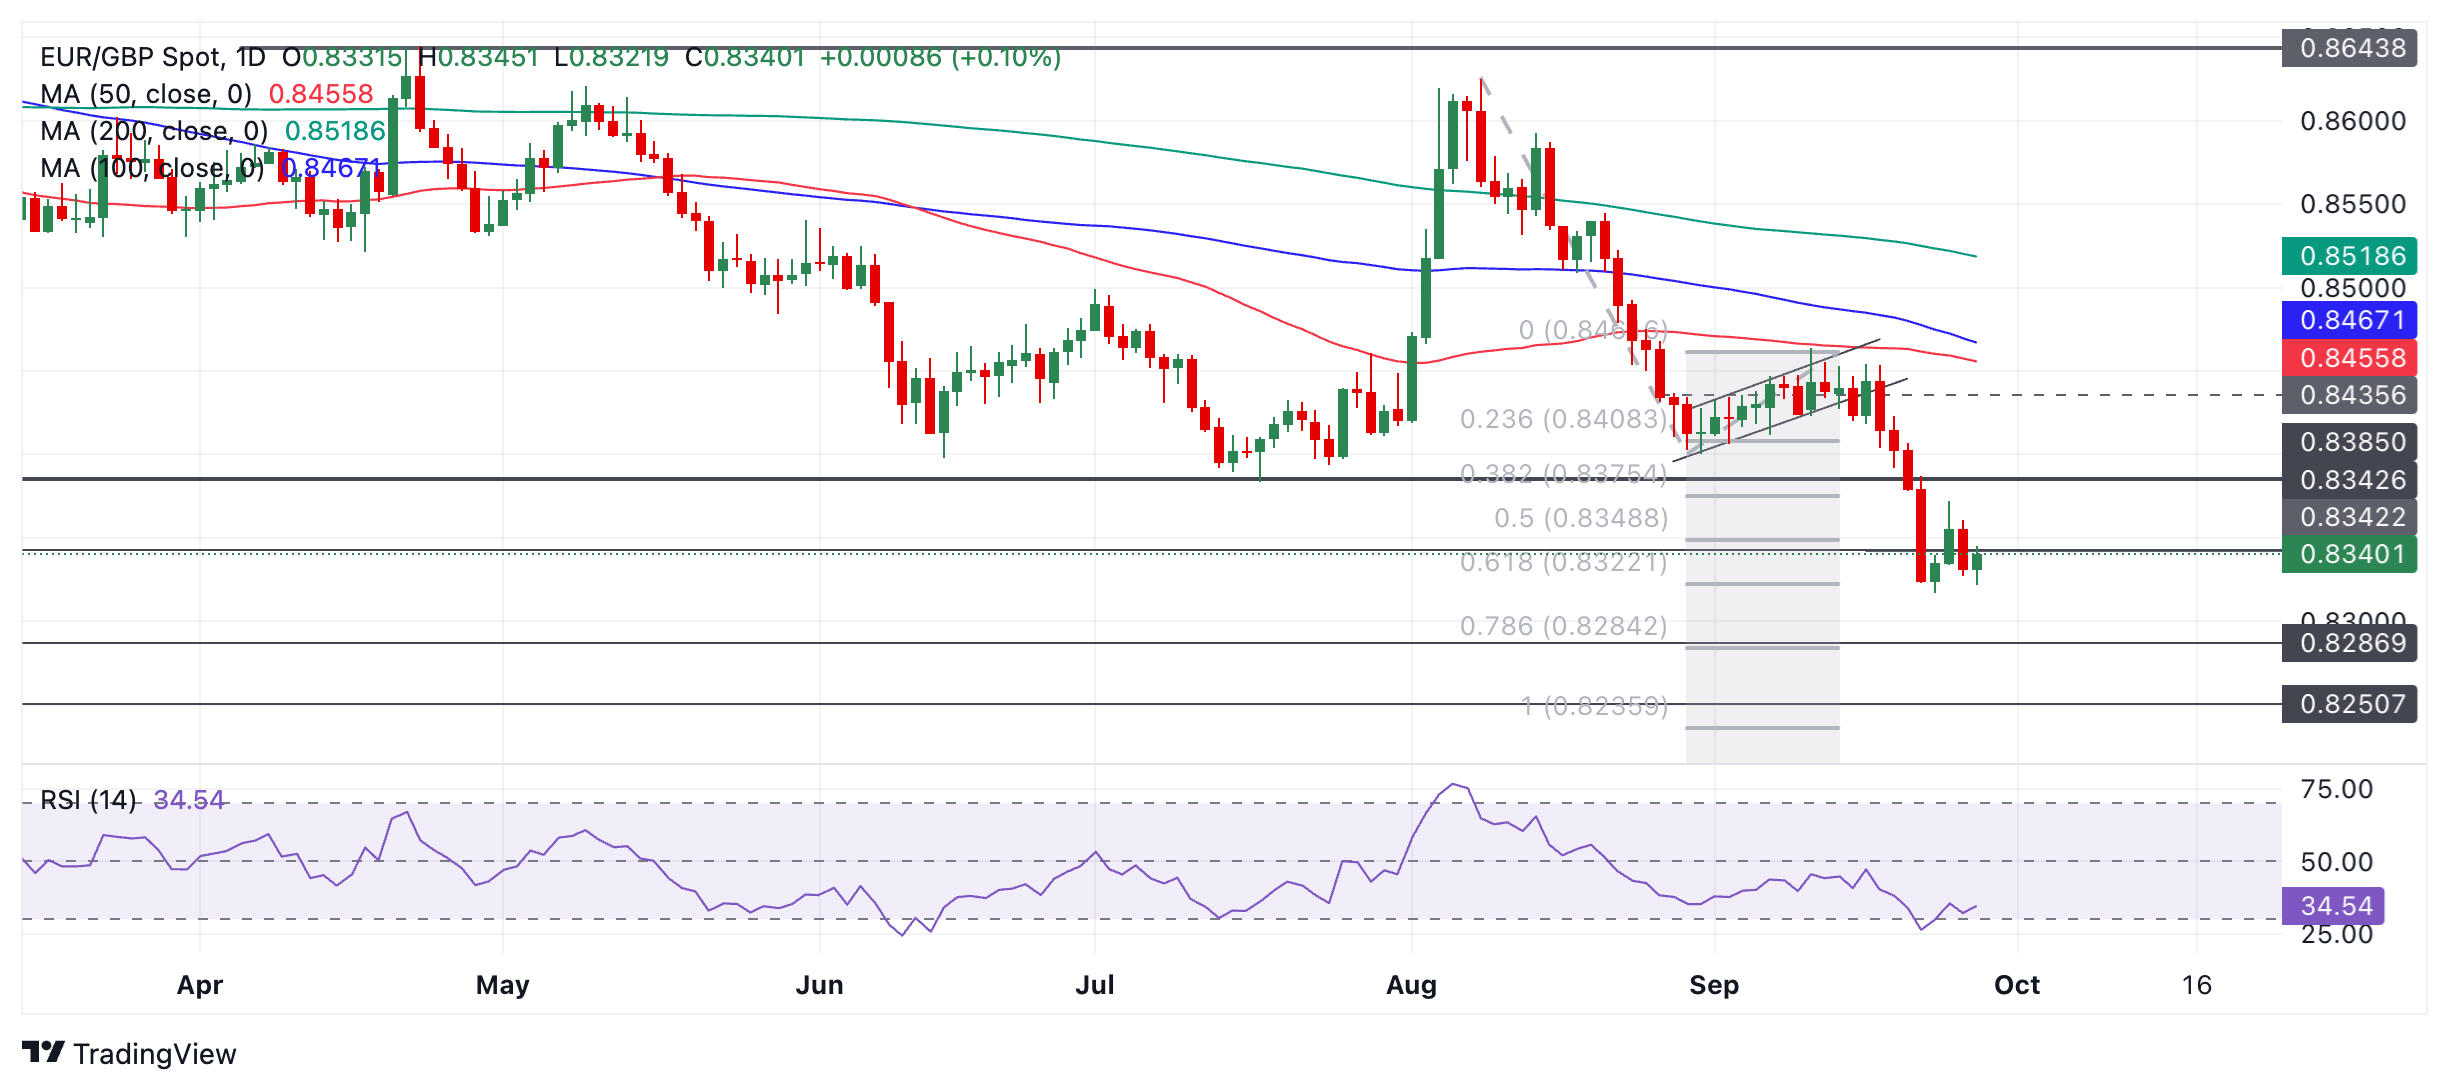
That said, EUR/GBP has now reached the first downside target for the bear move that began at the August 5 high and this could indicate the end of its decline. The target is the 61.8% extrapolation of the initial move down during August before the channel that formed in early September.
A break below the 0.8317 September 24 low would reconfirm a continuation of the downtrend towards the next target at 0.8287, the August 2022 low.
The Relative Strength Index (RSI) exited oversold after the bounce on September 24 and this could indicate the risk that a stronger correction may still unfold higher.
- GBP/JPY sells off following the defeat of Sanae Takaichi in the Japanese ruling party’s leadership run off.
- Takaichi had warned that if elected she would restrict the BoJ from raising interest rates.
- The Pound pulls back after Bailey indicates steady return to more normal rate environment.
GBP/JPY declines by almost one and a half percentage points to trade in the 191.50s on Friday after the news that former Japanese defense minister Shigeru Ishiba beat his opponent Sanae Takaichi to win the ruling-LDP party’s leadership race run-off. Ishiba won by 215 votes to Sanae Takaichi’s 194 votes.
The Japanese Yen had weakened on concerns Takaichi might win after she said that if elected she would not allow the interest rates to rise because a weak Yen was positive for exports. Her defeat now means she will not be able to restrict rate hikes.
The Yen’s immediate reaction was to strengthen in all its pairs. The expectation of higher interest rates is positive for the currency since it reduces capital outflows to currencies offering higher returns.
GBP/JPY came under further pressure after the Japanese Yen rose following the release of Tokyo inflation data early on Friday. The data showed the Tokyo Consumer Price Index (CPI) rose 2.2% in September, which whilst lower than the 2.6% previously, was in line with the BoJ’s forecast and the median. BoJ Governor Kazuo Ueda had said that if inflation data met the bank’s forecasts it would go ahead with plans to lift interest rates.
The Pound Sterling, meanwhile, remains on a weaker footing after the Governor of the Bank of England (BoE) Andrew Bailey said earlier in the week that he saw interest rates continuing to fall gradually. Lower interest rates are negative for the Pound as they reduce capital inflows.
“I do think the path for interest rates will be downwards, gradually, to the ´neutral’ rate,” Bailey said on Tuesday. The neutral rate of interest is the long run equilibrium level, or “ideal” level for interest rates in the economy.
His remarks come after a close call five-to-four vote at the BoE’s August meeting backed up a quarter point cut from the bank, pushing borrowing costs down to 5.00%. Financial markets, meanwhile, are pricing in a drop to 4.5% by the end of 2024, and lower to 3.5% by the end of 2025.
GBP/JPY was buoyed on Wednesday, however, after BoE policymaker Megan Greene was more hawkish than Bailey when she said that a “cautious, steady-as-she-goes approach to monetary policy easing is appropriate.”
Greene added “I believe the risks to activity are to the upside, which could suggest that the long-run neutral rate is higher and - all else equal - our stance of policy isn’t as restrictive as we had thought.” Greene was one of four on the MPC who voted to hold rates in August.
OPEC published its long-term outlook for the oil market up to 2050 this week, Commerzbank’s commodity analyst Carsten Fritsch notes.
Demand forecast is likely to prove too high
“It shows that OPEC is convinced that oil demand will increase until the middle of the century. At that point, global consumption is expected to reach 120.1 million barrels per day. At the end of this decade, OPEC expects demand to reach 112.3 million barrels per day.”
“OPEC's forecast is thus more than 6 million barrels per day higher than that of the IEA, which expects demand to start falling after 2029. OPEC assumes that e-mobility will advance at a much slower rate than the IEA. The total number of vehicles is expected to increase from 1.2 billion in 2023 to 2.9 billion in 2050.”
“Of these, 70% are still expected to have an internal combustion engine. OPEC sees obstacles for electric vehicles in the power grids, battery production capacities and access to critical minerals. Thus, OPEC’s demand forecast depends on its assumption for EV sales. If these rise faster than OPEC assumes, the demand forecast is likely to prove too high.”
The Bank of England and the Fed were expected to cut rates slightly less than the ECB. This changed after the US employment report at the beginning of August. The Fed's expectations have decoupled from those of the Bank of England and caught up with those of the ECB. More interesting, however, is the further decoupling in recent weeks. The market now expects the Fed to do more than the ECB this year, i.e. to pursue a more ‘active’ monetary policy, as my boss would put it, Commerzbank FX analyst Michael Pfister notes.
EUR/USD probably won’t be able to remain higher in the long term
“Our economists anticipate roughly the same number of interest rate cuts as expected from the Fed, while the ECB is likely to cut significantly less. Accordingly, not only is the already priced-in difference in monetary policy to be expected, which has led EUR/USD to the 1.12 level, but the gap is likely to widen even further in the coming months.”
“This is also important because, as already mentioned, the underlying conditions differ significantly. In the US, we are seeing a stronger real economy and higher inflation expectations at the same time, while in the euro area the real economy is weakening and the market is expecting slight inflationary pressure at best.”
“The associated more dovish Fed monetary policy should ensure that EUR/USD rises further if our economists are right. In view of the significantly stronger US real economy, however, I have my doubts as to whether EUR/USD will be able to maintain the higher levels in the long term.”
CNY appreciated 0.5% overnight on China’s stimulus hopes, and CNH did better with a 1.0% again, DBS FX analyst Philip Wee notes.
Shanghai Composite Index has a best weekly rise in almost 16 years
“CNY appreciated 0.5% (CNH did better with a 1.0% again) overnight on China’s stimulus hopes.”
“Despite doubts that the stimulus would reverse China’s slowdown, the Shanghai Composite Index surged 9.7%, its best weekly rise in almost 16 years, to a three-month high of 3001.”
“Offshore USD/CNH fell from 7.10 to 6.98, closing below 7.00 for the first time since May 2023. Onshore USD/CNY lagged at 7.01.”
The two most important consumer countries of Gold have recently been sending out very different signals. While India reported a significant increase in Gold imports in August, China's Gold imports plummeted, Commerzbank’s commodity analyst Carsten Fritsch notes.
India’s Gold demand is likely to fade
“According to the World Gold Council, India imported 140 tons of Gold, which was three times as much as in the previous month and, based on the data of the central bank, the largest amount in 3½ years. The import surge was triggered by the steep reduction of the import tax from 15 percent to 6 percent, which apparently more than compensated for the price increase.”
“Furthermore, purchases may have been brought forward in anticipation of the festival and wedding season. In China, the significant increase in prices visibly dampened demand. According to data from the Hong Kong statistics department, China's net Gold imports from Hong Kong fell by 76% to just over 6 tons in August. They were last lower in April 2022, when the coronavirus lockdowns hit Gold demand and imports in China.”
“Switzerland did not export any Gold to China at all in August, as reported by the Swiss Federal Customs Administration last week. By contrast, Swiss Gold exports to India rose sharply. However, given the record high local prices, Gold demand there is also likely to fade as soon as the effect of the tax cut subsides.”
On Thursday, the Gold price rose to a new record high of $2,685 per troy ounce. The data on speculative market positioning showed that speculative net long positions in Gold rose to their highest level since February 2020 in the last reporting week. It would not be surprising if more investors have jumped on the bandwagon since then. However, this also increases the risk of a correction, Commerzbank’s commodity analyst Carsten Fritsch notes.
Gold climbs to new record highs, Silver follows
“It is difficult to explain the price increase of the last few days with rate cut expectations, as these have not increased further and were even scaled back somewhat yesterday. This is probably why the price has come off its record high meanwhile. The price could also rise because investors are buying Gold in anticipation of a further price increase. In this context, we spoke of a rational bubble a few months ago.”
“The data on speculative market positioning, which will be published by the CFTC this evening after the close of trading, could provide some insight into this. Speculative net long positions in Gold rose to their highest level since February 2020 in the last reporting week. It would not be surprising if more investors have jumped on the bandwagon since then. However, this also increases the risk of a correction if these investors were to exit again.”
“Silver has recently risen in the wake of Gold. Yesterday, it reached $32.7 per troy ounce, its highest level since December 2012. The Gold/silver ratio then fell to 82, its lowest level since mid-July. Silver is likely to have benefited additionally from the extensive stimulus measures in China, which were announced this week and also caused the prices of base metals to rise sharply.”
The Swiss National Bank’s third interest rate cut did not push USD/CHF out of its month-long range between 0.84 and 0.8550, DBS’ FX analyst Philip Wee notes.
SNB does not want EUR/CHF to find new lows
“SNB lowered the policy rate by 25 bps to 1.00% and kept the door open for more easing in the coming quarters on its new forecast for inflation to decelerate to 0.6% in 2025 from 1.2% in 2024.”
“In June, SNB projected a modest slowdown in inflation to 1.1% from 1.3% based on its assumption of a stable 1.25% policy rate over the forecast horizon.”
“SNB signalled its readiness to intervene in currency markets, reinforcing its concerns about the CHF’s strength as a source of significant disinflation and pressure for Swiss industries amid weak demand from Europe. SNB likely does not want EUR/CHF to post a new year’s low below 0.93.”
The Dollar Index (DXY) depreciated by 0.4% to 100.56 overnight, holding below 101 for the ninth session, DBS’ FX analyst Philip Wee notes.
JPY challenges weakish USD this week
“In the first four days of the week, except for the JPY (-0.7%), the currencies in the DXY basket appreciated, led by the CAD (+0.8%), GBP (+0.7%), CHF (+0.5%), and EUR (+0.1%). US stock indices rallied on better-than-expected US data.”
“The US Commerce Department updated its GDP estimates, which cited faster growth in 2021, 2022, and early 2023. It also erased the technical recession in 1H22; the quarterly contraction in 2Q22 was revised to an expansion.”
“The Dow, S&P 500, and Nasdaq Composite indices rose by 0.6%, 0.4%, and 0.6%, respectively. S&P closed at a new record high of 5745.”
The Gold market continues to rush from record high to record high; nevertheless, the high price level is likely to slow the physical demand for Gold, Commerzbank’s Commodity Analyst Barbara Lambrecht notes.
Gold market continues to rush higher and higher
“Interest from ETF investors has also awakened again: since the beginning of August, Gold ETF holdings tracked by Bloomberg have been rising almost continuously; since the low in mid-May, they have now increased by almost 4%.”
“Nevertheless, we do not expect the upward trend in the Gold price to continue at this pace, partly because we consider the interest rate hopes to be exaggerated. In addition, the high price level is likely to slow the physical demand for Gold.”
- USD/CHF is trading lower within a range formed since August.
- It is in a sideways trend and a decisive breakout would be required to give directionality.
USD/CHF continues trading up and down within a range. It is probably in a sideways trend, which given the principle that “the trend is your friend” is likely to endure.
USD/CHF 4-hour Chart
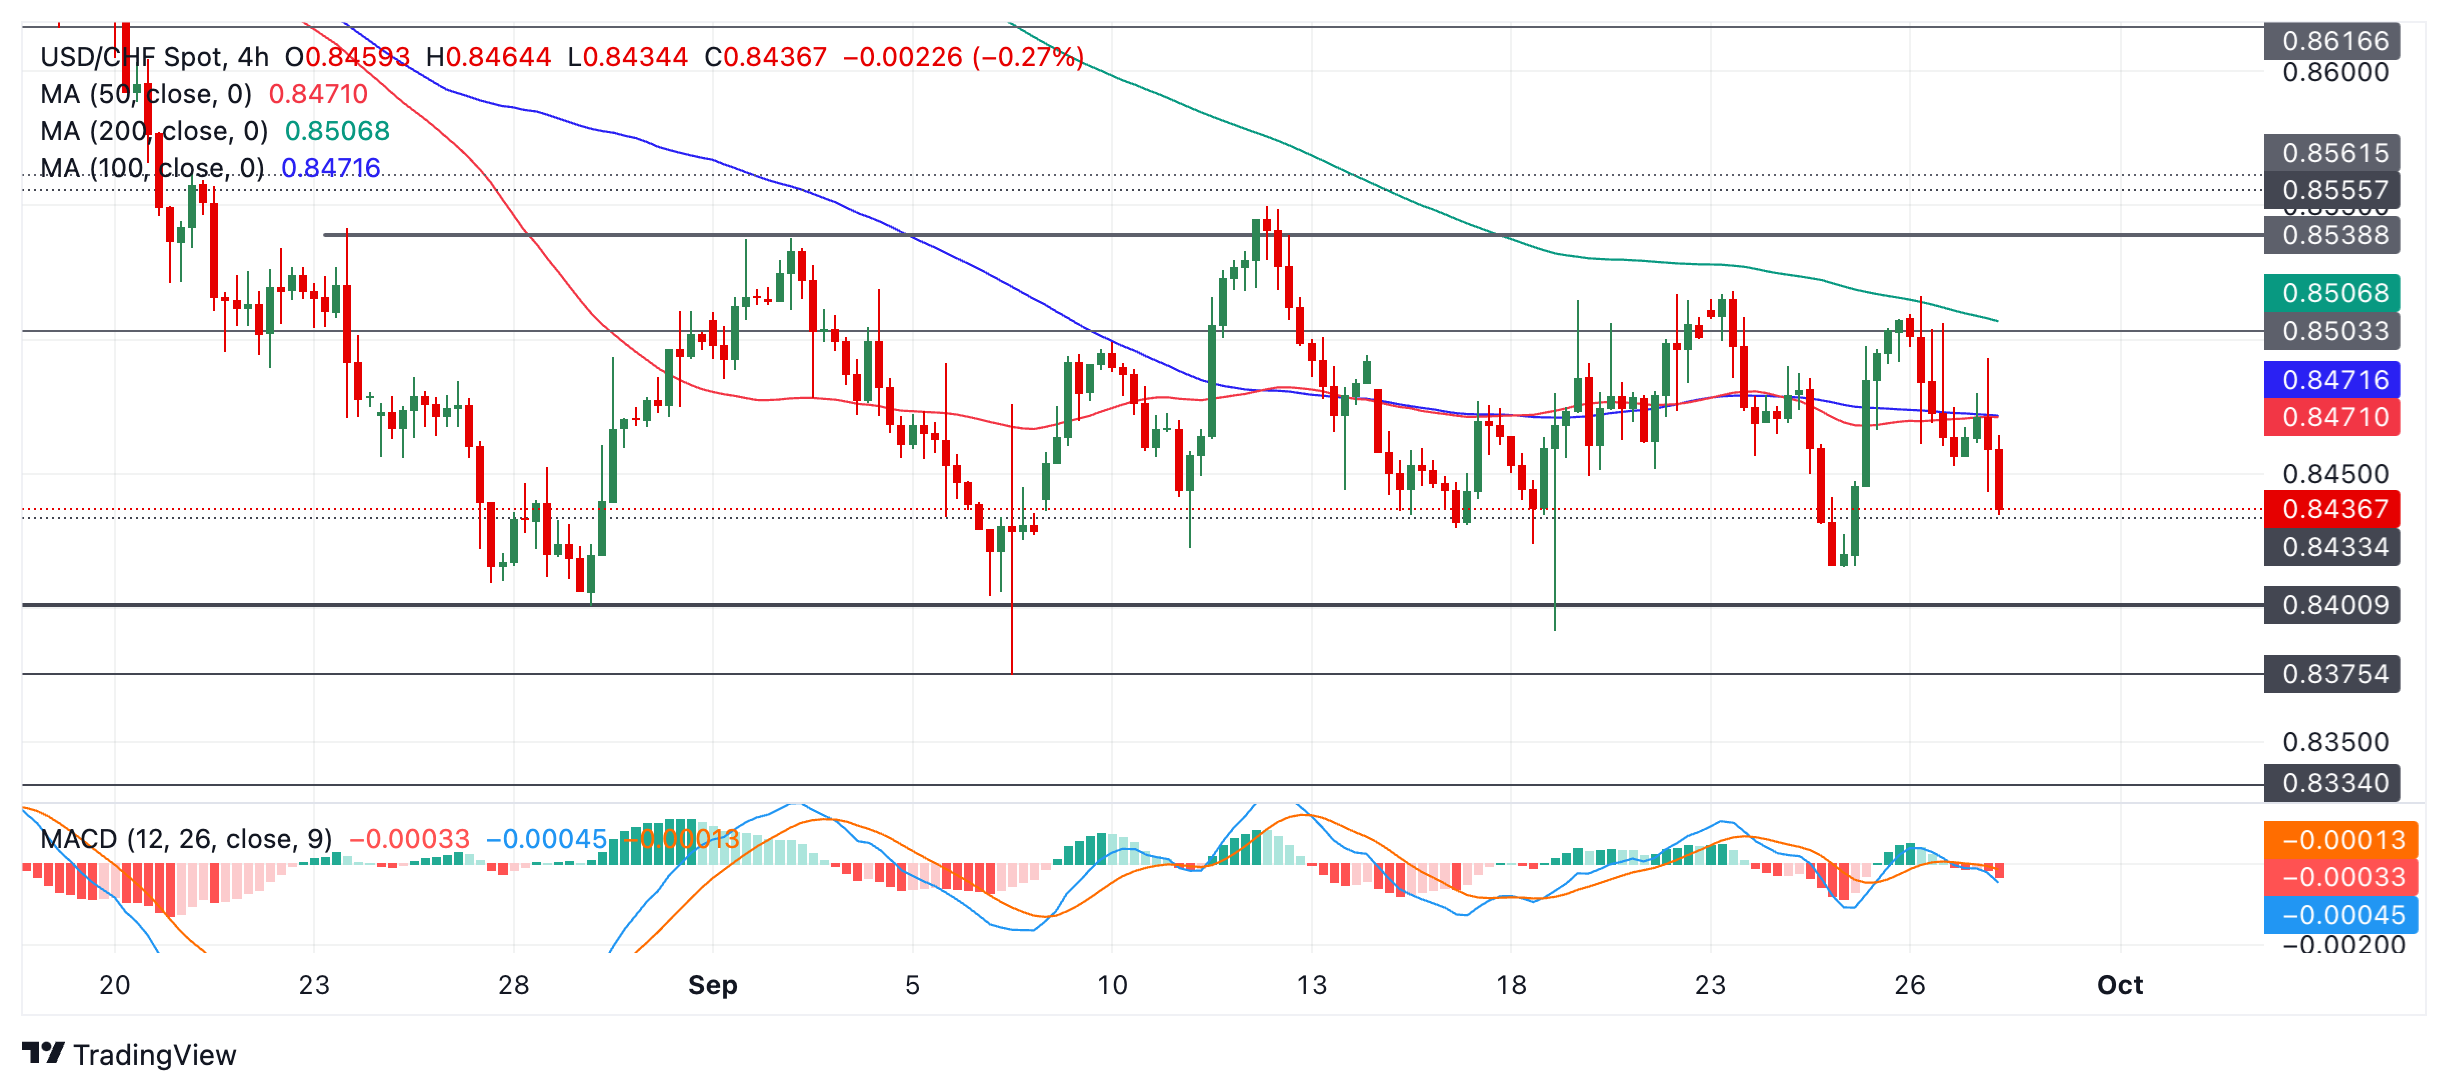
USD/CHF is currently moving down within the range and it will probably reach at least as far as the 0.8415, the September 25 lows. A particularly bearish move might even fall to the 0.8400 floor. After that it will probably recover and continue the sideways trend.
The Moving Average Convergence Divergence (MACD) momentum indicator is below the signal and the zero lines indicating bearishness.
A decisive break out of the range – either higher or lower – would change the range-bound consolidation mode. The top of the range lies at 0.8550 (September 12 high); the bottom at 0.8375 (September 6 low). A decisive break would be one accompanied by a longer-than-average candlestick that closed near its high in the case of a bullish break and low in a bearish case. That, or three consecutive bullish or bearish candles that broke either above or below the levels.
Given the trend prior to the range was bearish the odds margin ally favor a downside breakout. Such a move would be expected to go as low as 0.8318, the 61.8% Fibonacci extrapolation of the height of the range extrapolated lower.
It’s been a quiet week in the UK calendar, but the weak economic indicators out of the eurozone have dealt a blow to EUR/GBP, ING’s FX strategist Francesco Pesole notes.
GBP/USD may start to look expensive soon
“We saw the pair test the 0.8320 level earlier this week, and while we continue to see a good case for a rebound beyond the short term as Bank of England easing may be underpriced, we probably need some inflation surprise in the eurozone to prevent 0.8300 to be tested soon.”
“The EUR:GBP swap rate differential collapsed as markets increased bets the eurozone’s grim outlook will force the ECB into larger cuts than the BoE, and is now at -155bp, the widest since December 2023. That should keep some pressure on the pair in the near term.”
“In cable, the fresh 1.34+ highs are also justified by the policy rate differential, although expectations for a 50bp Fed cut may be misplaced, and GBP/USD may start to look expensive soon.”
- USD/CAD exhibits caution below 1.3500 ahead of US and Canada data.
- Economists estimate the Canadian economy to have grown by 0.1% in July.
- The US PCE inflation will influence market expectation for Fed’s interest rate outlook.
The USD/CAD pair trades with caution below the psychological resistance of 1.3500 in Friday’s European session. The Loonie asset is marginally higher despite a slight decline in the US Dollar (USD), suggesting a weakness in the Canadian Dollar (CAD) ahead of the monthly Gross Domestic Product (GDP) data for July, which will be published at 12:30 GMT.
The Canadian economy is estimated to have barely grown after remaining flat in June. The Bank of Canada (BoC) is already expected to extend its policy-easing cycle due to decelerating inflation trend and weakening labor market conditions.
At the same time, the major release will be the United States (US) Personal Consumption Expenditure price index (PCE) data for August. The core PCE inflation, a Federal Reserve’s (Fed) preferred inflation gauge, is estimated to have grown by 2.7%, faster than 2.6% in July year-on-year.
The underlying inflation data will significantly influence the Fed’s interest rate outlook for the last quarter of the year. Financial market participants expect the Fed to reduce interest rates further by 75 bps, collectively in the remaining two policy meetings.
USD/CAD trades at make or a break above the immediate support of 1.3400. The major formed a fresh swing low near 1.3400 on a daily timeframe, suggesting a bearish trend. A bear cross, represented by the 20 and 50-day Exponential Moving Averages (EMAs) near 1.3600, indicates more downside ahead.
The 14-day Relative Strength Index delivers a range shift move into the 20.00-60.00 territory from 40.00-80.00, which suggests that pullbacks would be considered as selling opportunities by investors.
Going forward, a further correction by the major below the immediate support of 1.3400 would expose it to the January 31 low of 1.3360 and a June 9 low of 1.3340.
In an alternate scenario, a recovery move above the psychological support of 1.3500 would drive the asset towards the April 5 low of 1.3540, followed by the September 20 high of 1.3590.
USD/CAD daily chart
Canadian Dollar FAQs
The key factors driving the Canadian Dollar (CAD) are the level of interest rates set by the Bank of Canada (BoC), the price of Oil, Canada’s largest export, the health of its economy, inflation and the Trade Balance, which is the difference between the value of Canada’s exports versus its imports. Other factors include market sentiment – whether investors are taking on more risky assets (risk-on) or seeking safe-havens (risk-off) – with risk-on being CAD-positive. As its largest trading partner, the health of the US economy is also a key factor influencing the Canadian Dollar.
The Bank of Canada (BoC) has a significant influence on the Canadian Dollar by setting the level of interest rates that banks can lend to one another. This influences the level of interest rates for everyone. The main goal of the BoC is to maintain inflation at 1-3% by adjusting interest rates up or down. Relatively higher interest rates tend to be positive for the CAD. The Bank of Canada can also use quantitative easing and tightening to influence credit conditions, with the former CAD-negative and the latter CAD-positive.
The price of Oil is a key factor impacting the value of the Canadian Dollar. Petroleum is Canada’s biggest export, so Oil price tends to have an immediate impact on the CAD value. Generally, if Oil price rises CAD also goes up, as aggregate demand for the currency increases. The opposite is the case if the price of Oil falls. Higher Oil prices also tend to result in a greater likelihood of a positive Trade Balance, which is also supportive of the CAD.
While inflation had always traditionally been thought of as a negative factor for a currency since it lowers the value of money, the opposite has actually been the case in modern times with the relaxation of cross-border capital controls. Higher inflation tends to lead central banks to put up interest rates which attracts more capital inflows from global investors seeking a lucrative place to keep their money. This increases demand for the local currency, which in Canada’s case is the Canadian Dollar.
Macroeconomic data releases gauge the health of the economy and can have an impact on the Canadian Dollar. Indicators such as GDP, Manufacturing and Services PMIs, employment, and consumer sentiment surveys can all influence the direction of the CAD. A strong economy is good for the Canadian Dollar. Not only does it attract more foreign investment but it may encourage the Bank of Canada to put up interest rates, leading to a stronger currency. If economic data is weak, however, the CAD is likely to fall.
- The US Dollar trades in the green across the board, although with minor gains.
- All eyes are on the last data point for this week, the PCE inflation gauge.
- The US Dollar Index consolidates and pops back in September’s range.
The US Dollar (USD) trades flat to marginally higher on Friday, with traders looking forward to the release of the Personal Consumption Expenditures (PCE) Price Index for August. The PCE is the Federal Reserve‘s (Fed) preferred inflation gauge in order to determine how their policy rate impacts inflation. With the data-driven decision-making approach for the upcoming policy rate decision in November, the PCE reading can and could be market-moving in case it prints out of consensus.
On the economic data front, looking back to Thursday, it was a very disappointing day with no Fed comment or data point being able to move the needle substantially for the DXY. With only one trading day left, it will either be the PCE number or the University of Michigan Consumer Sentiment reading that might stir up things.
Daily digest market movers: PCE last man standing
- At 12:30 GMT, the Personal Consumption Expenditures Price Index for August will be released:
- Monthly headline PCE is expected to ease to 0.1% from 0.2% previously.
- Monthly core PCE is expected to grow steadily by 0.2%.
- Yearly headline PCE is expected to grow by 2.3% following the 2.5% increase in July.
- Yearly core PCE is expected to increase by 2.7% after a reading of 2.6% the month before.
- Personal Income should rise by 0.4%, coming from 0.3% in July.
- Personal Spending is expected to fall by 0.2% to 0.3%, coming from 0.5%.
- At 14:00 GMT, the University of Michigan will release its final reading for September:
- Consumer Sentiment should tick up to 69.3, from 69.0 in the first reading.
- The 5-year inflation expectation rate is expected to remain stable at 3.1%.
- Asian equity markets are closing the week with a bang as China heads into the Golden Week on a high note. US futures are flat, while European equities are mildly in the green.
- The CME Fedwatch Tool shows a 51.3% chance of a 25 basis-point rate cut at the next Fed meeting on November 7, while 48.7% is pricing in another 50-basis-point rate cut.
- The US 10-year benchmark rate trades at 3.79%, looking to test the three-week high at 3.81%
US Dollar Index Technical Analysis: Markets backtracking
The US Dollar Index (DXY) is hesitant, with the CME Fedwatch tool back at nearly even odds for either a 25 or a 50 basis point rate cut in November. The constant switching between the two possibilities is moving the DXY in a very tight range. A substantial move is needed, and with very small expectations for the PCE number on Friday, it does not look that it will be an eventful Friday.
The upper level of the September range remains at 101.90. Further up, the index could go to 103.18, with the 55-day Simple Moving Average (SMA) at 102.30 along the way. The next tranche up is very misty, with the 100-day SMA at 103.52 and the 200-day SMA at 103.75, just ahead of the big 104.00 round level.
On the downside, 100.22 (the September 18 low) is the first support, and a break could point to more weakness ahead. Should that take place, the low from July 14, 2023, at 99.58, will be the next level to look out for. If that level gives way, early levels from 2023 are coming in near 97.73.
US Dollar FAQs
The US Dollar (USD) is the official currency of the United States of America, and the ‘de facto’ currency of a significant number of other countries where it is found in circulation alongside local notes. It is the most heavily traded currency in the world, accounting for over 88% of all global foreign exchange turnover, or an average of $6.6 trillion in transactions per day, according to data from 2022. Following the second world war, the USD took over from the British Pound as the world’s reserve currency. For most of its history, the US Dollar was backed by Gold, until the Bretton Woods Agreement in 1971 when the Gold Standard went away.
The most important single factor impacting on the value of the US Dollar is monetary policy, which is shaped by the Federal Reserve (Fed). The Fed has two mandates: to achieve price stability (control inflation) and foster full employment. Its primary tool to achieve these two goals is by adjusting interest rates. When prices are rising too quickly and inflation is above the Fed’s 2% target, the Fed will raise rates, which helps the USD value. When inflation falls below 2% or the Unemployment Rate is too high, the Fed may lower interest rates, which weighs on the Greenback.
In extreme situations, the Federal Reserve can also print more Dollars and enact quantitative easing (QE). QE is the process by which the Fed substantially increases the flow of credit in a stuck financial system. It is a non-standard policy measure used when credit has dried up because banks will not lend to each other (out of the fear of counterparty default). It is a last resort when simply lowering interest rates is unlikely to achieve the necessary result. It was the Fed’s weapon of choice to combat the credit crunch that occurred during the Great Financial Crisis in 2008. It involves the Fed printing more Dollars and using them to buy US government bonds predominantly from financial institutions. QE usually leads to a weaker US Dollar.
Quantitative tightening (QT) is the reverse process whereby the Federal Reserve stops buying bonds from financial institutions and does not reinvest the principal from the bonds it holds maturing in new purchases. It is usually positive for the US Dollar.
The US Dollar (USD) is likely to trade in a range between 6.9700 and 7.0100. In the longer run, price action continues to suggest USD weakness, albeit likely at a slower pace; the levels to monitor are 6.9400 and 6.9200, UOB Group FX analysts Quek Ser Leang and Lee Sue Ann note.
Markets to monitor support levels at 6.9400 and 6.9200
24-HOUR VIEW: “USD rebounded strongly on Wednesday. Yesterday (Thursday), we pointed out that ‘the rebound lacks momentum, and instead of continuing to advance, USD is more likely to trade in a 7.0180/7.0430 range.’ Instead of trading in a range, USD plummeted to a low of 6.9717, closing lower by a whopping 0.84% (6.9730). Inevitably, the outsized decline has resulted in oversold conditions, and USD is unlikely to weaken much further. Today, USD is more likely to trade in a range, probably between 6.9700 and 7.0100.”
1-3 WEEKS VIEW: “We turned negative in USD last Friday (20 Sep) when it was trading at 7.0700, indicating that it ‘is likely to trade with a downward bias towards 7.0500.’ After USD plunged, in our most recent narrative from two days ago (25 Sep, spot at 6.9990), we highlighted that ‘after the recent sharp drop, it is not unreasonable to expect further USD weakness, particularly when there are no significant support levels close by.’ We also pointed out that ‘the short-term levels to monitor are 6.9700 and 6.9400.’ Yesterday, USD sold off to a low of 6.9717. While the price action continues to suggest further USD weakness, severely oversold short-term conditions are likely to lead to a slower pace of decline. The levels to monitor are 6.9400 and 6.9200. We will continue to expect a lower USD provided that 7.0450 (‘strong resistance’ previously at 7.0600) is not breached.”
The US Dollar (USD) could rise 145.50; a sustained advance above this major resistance level is unlikely. In the longer run, USD has to break and maintain a foothold above 145.50 before further advance is likely, UOB Group FX analysts Quek Ser Leang and Lee Sue Ann note.
USD/JPY can rise towards 145.50 near term
24-HOUR VIEW: “Yesterday, when USD was at 144.60, we indicated that ‘the advance in USD has scope to extend above 145.00, but the major resistance at 145.50 is likely out of reach for now.’ We also indicated that ‘to maintain the buildup in momentum, USD must remain above 144.00 with minor support at 144.35.’ Our view was not wrong, as USD rose to 145.21, dropped to 144.10 and then closed largely unchanged at 144.80 (+0.03%). While upward momentum has not increased significantly, today, USD could rise above the major resistance at 145.50. A sustained advance above this level seems unlikely. The next resistance at 146.10 is also unlikely to come into view. Support levels are at 144.65 and 144.25.”
1-3 WEEKS VIEW: “In our most recent narrative from Monday (23 Sep, spot at 144.20), we highlighted that ‘the strong advance in USD last week reinforces our view that USD could recover further to 145.50.’ Yesterday, USD rose and reached a high of 145.21. We continue to expect USD to rise to 145.50, but it has to break and maintain a foothold above this level before a further advance is likely. Given that momentum has not increased much, the chance of it reaching the next major resistance at 147.00 is not high for now (there is another resistance at 146.10). Overall, we will remain positive USD as long as 143.40 (‘strong support’ level previously at 142.30) is not breached.”
- Gold retreats at the end of the week as the effect of Chinese stimulus fades and global central banks adopt a more cautious stance.
- Stronger US labor market and economic growth data lower the chances of the Fed easing aggressively.
- Gold price retreats as less dovish interest rate prospects and a stronger US Dollar are bearish.
Gold (XAU/USD) edges lower to trade in the $2.660s per troy ounce on Friday, as the impact of Chinese government stimulus starts to ebb and central banks globally adopt a less dovish stance.
In addition, better-than-expected data out of the US lowered the chances of the Fed making another aggressive 50 basis point (bps) rate cut in November. This further weighs on Gold as expectations of interest rates falling at a slower pace suggest a high opportunity cost of holding the non-interest-bearing asset. The USD is recovering too, adding to the precious metal’s headwinds.
Gold edges lower after making new record highs
Gold pulls back after touching a new record high of $2,685 on Thursday, as the effect of the extra 1 trillion CNY of stimulus announced by the Chinese Politburo appears to have been priced in and central banks globally tend to adopt a less dovish stance. The Central Bank of Sri Lanka kept rates unchanged at their meeting, and the Swiss National Bank (SNB) and Bank of Mexico (Banxico) cut rates by only 25 bps. A recent Reuters poll, meanwhile, showed that the Reserve Bank of India (RBI) is expected to cut interest rates by a modest 50 bps over the next six months.
In addition, the expectation that the Fed would cut interest rates by half a percent at their meeting in November has eased after positive US macroeconomic data. US Initial Jobless Claims showed a decline to 218K in the week ending September 20, and the final estimate of Q2 Gross Domestic Product (GDP) growth remained in line with previous estimates at a fairly healthy 3.0% annualized. Further, US Durable Goods Orders beat estimates and overall recent data out of the US describes a soft landing for the economy that goes against market bets for aggressive monetary easing.
The probability of a 50 bps rate cut at the November Fed meeting has fallen back down to 50% from over 60% prior to the data, according to the CME FedWatch tool.
Gold may also be seeing reduced safe-haven flows as fears the conflict between Israel and Hezbollah might spill over into a ground offensive fail to materialize. Although tensions remain high and a 21-day ceasefire deal put together by the Americans was rejected on Thursday, neither has the situation escalated either.
On Wednesday, the head of Israeli Defence Forces, Herzi Halevi, told his troops that they should prepare for a ground offensive on Lebanon. If such an invasion should take place, it would further ratchet up risk aversion and increase safe-haven flows into the yellow metal.
Technical Analysis: Gold pulls back from new all-time highs
Gold pulls back after hitting yet another all-time high of $2,685 on Thursday.
That said, it is overall still in an uptrend on a short, medium and long-term basis. Since it is a foundational principle of technical analysis that “the trend is your friend,” the odds favor even more upside for the yellow metal.
XAU/USD Daily Chart
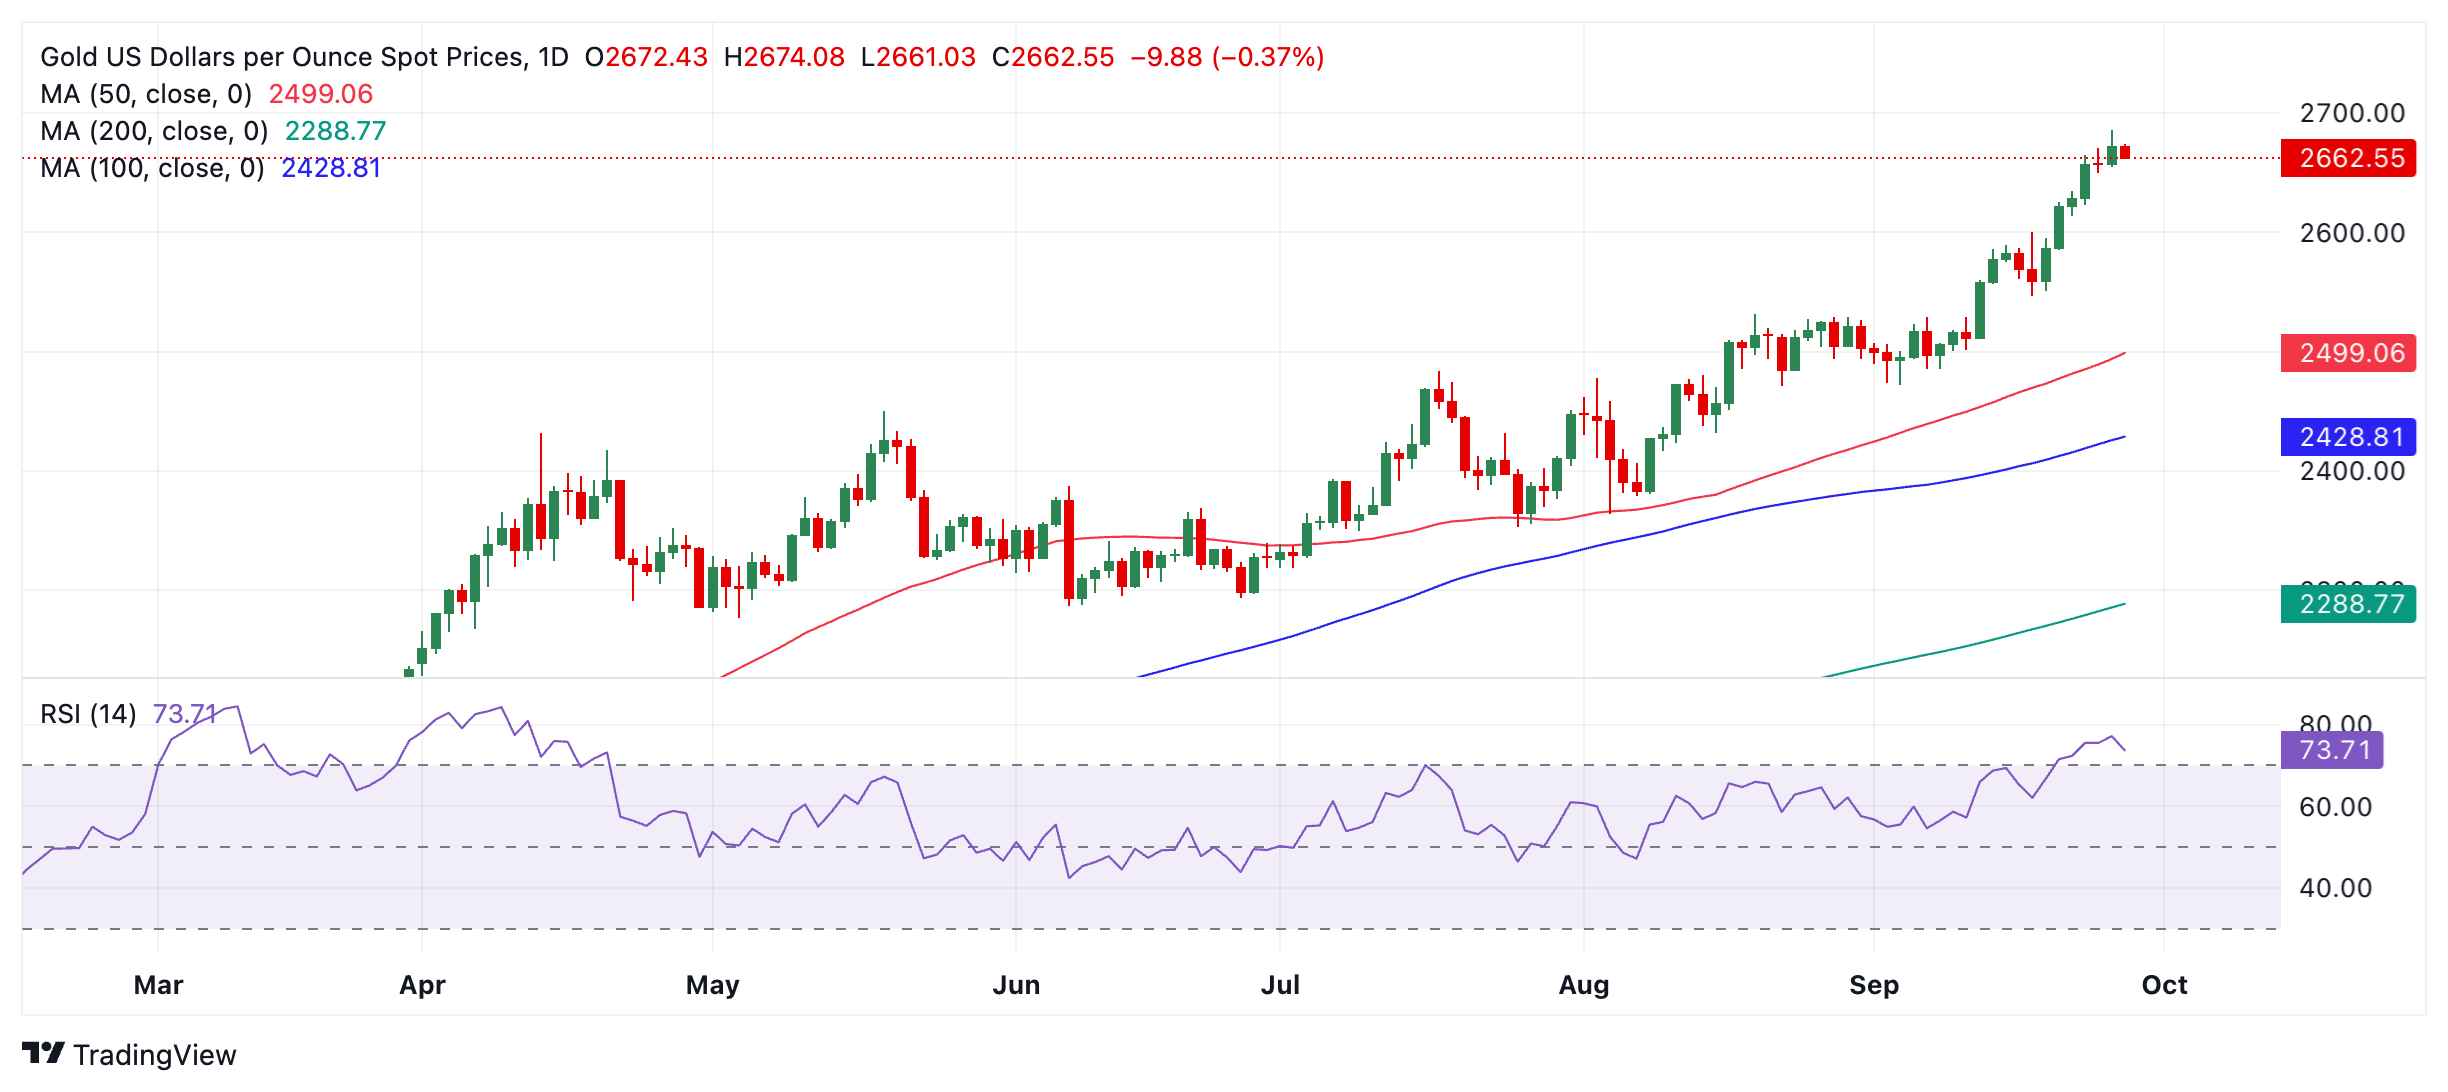
Gold is also now overbought, according to the Relative Strength Index (RSI) momentum indicator, which increases the chances of a deeper pullback evolving. It also advises traders not to add to their long positions. If Gold exits overbought, it will be a sign to close long positions and sell shorts, suggesting an even deeper correction is in the process of unfolding.
That said, RSI can remain overbought for fairly long periods of time in a strongly trending market, and if Gold breaks to higher highs, it will further reconfirm the metal’s uptrending bias. The next targets to the upside are the round numbers $2,700 and then $2,750.
If a correction evolves, firm support lies at $2,600 (September 18 high), $2,550 and $2,544 (0.382 Fibonacci retracement of the September rally).
Gold FAQs
Gold has played a key role in human’s history as it has been widely used as a store of value and medium of exchange. Currently, apart from its shine and usage for jewelry, the precious metal is widely seen as a safe-haven asset, meaning that it is considered a good investment during turbulent times. Gold is also widely seen as a hedge against inflation and against depreciating currencies as it doesn’t rely on any specific issuer or government.
Central banks are the biggest Gold holders. In their aim to support their currencies in turbulent times, central banks tend to diversify their reserves and buy Gold to improve the perceived strength of the economy and the currency. High Gold reserves can be a source of trust for a country’s solvency. Central banks added 1,136 tonnes of Gold worth around $70 billion to their reserves in 2022, according to data from the World Gold Council. This is the highest yearly purchase since records began. Central banks from emerging economies such as China, India and Turkey are quickly increasing their Gold reserves.
Gold has an inverse correlation with the US Dollar and US Treasuries, which are both major reserve and safe-haven assets. When the Dollar depreciates, Gold tends to rise, enabling investors and central banks to diversify their assets in turbulent times. Gold is also inversely correlated with risk assets. A rally in the stock market tends to weaken Gold price, while sell-offs in riskier markets tend to favor the precious metal.
The price can move due to a wide range of factors. Geopolitical instability or fears of a deep recession can quickly make Gold price escalate due to its safe-haven status. As a yield-less asset, Gold tends to rise with lower interest rates, while higher cost of money usually weighs down on the yellow metal. Still, most moves depend on how the US Dollar (USD) behaves as the asset is priced in dollars (XAU/USD). A strong Dollar tends to keep the price of Gold controlled, whereas a weaker Dollar is likely to push Gold prices up.
- Crude Oil edges up slightly after the sharp correction earlier this week.
- Markets are rebalancing after the news that Saudi Arabia is giving up its price target of $100 per barrel and mulls an increase in output.
- The US Dollar Index holds steady ahead of PCE inflation data for August.
Crude Oil is bouncing off a substantial support level on Friday, consolidating the recent losses the commodity had to digest earlier in the week. Still, Oil is set to close the week in the red, weighed by news that Saudi Arabia – the world’s largest crude exporter – is letting loose on its $100 price target and is thinking about increasing production, The downturn seen this week could be seen as an adjustment to the additional supply that will likely be released to markets.
The US Dollar Index (DXY), which tracks the performance of the Greenback against six other currencies, is consolidating ahead of the Personal Consumption Expenditures (PCE) Price Index data. With the release of this index, which is the Federal Reserve’s (Fed) preferred inflation gauge, markets will get another piece of the puzzle to work out how big the November interest-rate cut will be. Expect to see volatility pick up should PCE beats expectations.
At the time of writing, Crude Oil (WTI) trades at $67.40 and Brent Crude at $70.99.
Oil news and market movers: Once risk fades, supply is there
- Oil demand should pick up in Asia after the People’s Bank of China’s (PBoC) decision to lower interest rates and inject liquidity into the banking system. Beijing assembled a last-ditch stimulus assault to pull economic growth back towards this year's roughly 5% target, Bloomberg reports.
- Fuel distributors in Florida are bracing for supply shortages as government officials issued dire warnings about strengthening hurricane Helene, which made landfall in the state on Thursday evening, Reuters reports.
- At 17:00 GMT, the Baker Hughes OIl Rig Count is due to be released. The previous number was at 488, with no forecast available.
- Israel continues this Friday with its bombing of Hezbollah military installations in Lebanon.
Oil Technical Analysis: Under the hood supply remains solid
Crude Oil traders are letting prices bounce on Friday after the sharp price correction unfolded over the past two days. When stripping away the risk premiums that are being priced in on geopolitical developments as in Lebanon or Ukraine, supply is flowing. With more supply from Saudi Arabia set to hit markets, more downturn looks inevitable.
At current levels, $71.46 is back in focus as a first price cap on the upside after a brief false break. If positive momentum continues, a return to $75.27 (the January 12 high) could play out. Along the way towards that level, the 55-day Simple Moving Average (SMA) at $73.83 could ease the rally a bit. Once above $75.27, the first resistance to follow is $76.24, with the 100-day SMA in play.
On the downside, $67.11, a triple bottom in the summer of 2023, should support any downturns and trigger a bounce. Further down, the next level is $64.38, the low from March and May 2023.
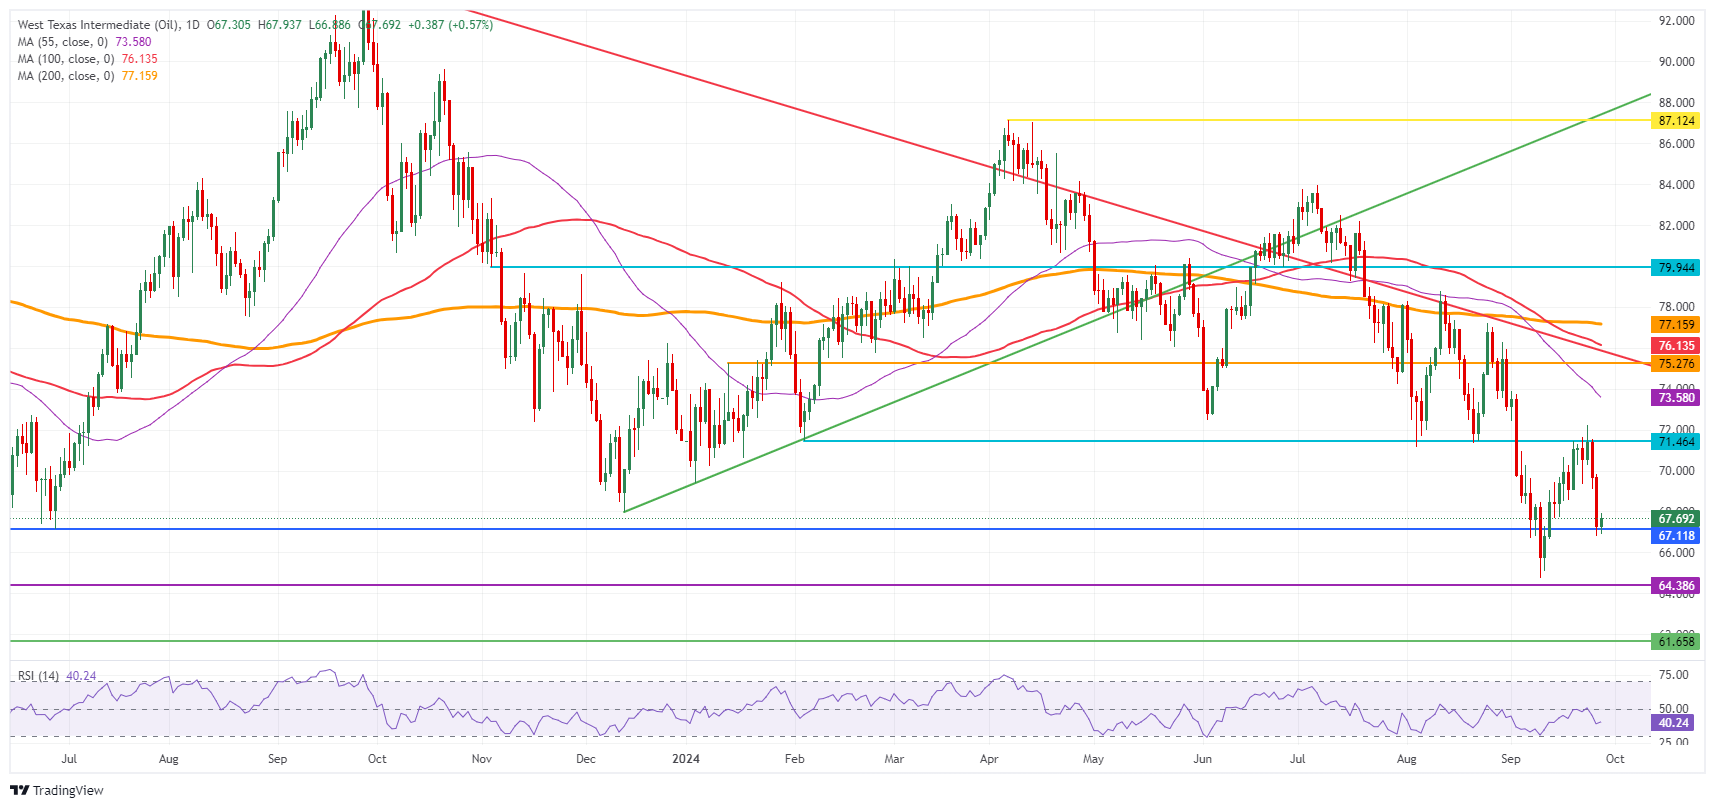
US WTI Crude Oil: Daily Chart
WTI Oil FAQs
WTI Oil is a type of Crude Oil sold on international markets. The WTI stands for West Texas Intermediate, one of three major types including Brent and Dubai Crude. WTI is also referred to as “light” and “sweet” because of its relatively low gravity and sulfur content respectively. It is considered a high quality Oil that is easily refined. It is sourced in the United States and distributed via the Cushing hub, which is considered “The Pipeline Crossroads of the World”. It is a benchmark for the Oil market and WTI price is frequently quoted in the media.
Like all assets, supply and demand are the key drivers of WTI Oil price. As such, global growth can be a driver of increased demand and vice versa for weak global growth. Political instability, wars, and sanctions can disrupt supply and impact prices. The decisions of OPEC, a group of major Oil-producing countries, is another key driver of price. The value of the US Dollar influences the price of WTI Crude Oil, since Oil is predominantly traded in US Dollars, thus a weaker US Dollar can make Oil more affordable and vice versa.
The weekly Oil inventory reports published by the American Petroleum Institute (API) and the Energy Information Agency (EIA) impact the price of WTI Oil. Changes in inventories reflect fluctuating supply and demand. If the data shows a drop in inventories it can indicate increased demand, pushing up Oil price. Higher inventories can reflect increased supply, pushing down prices. API’s report is published every Tuesday and EIA’s the day after. Their results are usually similar, falling within 1% of each other 75% of the time. The EIA data is considered more reliable, since it is a government agency.
OPEC (Organization of the Petroleum Exporting Countries) is a group of 13 Oil-producing nations who collectively decide production quotas for member countries at twice-yearly meetings. Their decisions often impact WTI Oil prices. When OPEC decides to lower quotas, it can tighten supply, pushing up Oil prices. When OPEC increases production, it has the opposite effect. OPEC+ refers to an expanded group that includes ten extra non-OPEC members, the most notable of which is Russia.
US initial jobless claims came in once again lower than expected on Thursday, but continuing claims rebounded to 1.834m. Durable goods orders were stronger than expected and the expected revision lower in 2Q GDP from 3.0% to 2.9% didn’t materialize. August PCE data will be released on Friday, ING’s FX analyst Francesco Pesole notes.
DXY to trade in the 100.0-101.0 range near term
“Market pricing for year-end Fed rates inched higher by a few basis points over the past couple of sessions, but the dollar was offered again yesterday after some positioning adjustment on Wednesday. Anyway, markets continue to factor in a 50bp cut at one of the next two meetings.”
“Today, August PCE data will be released. We expect a core 0.2% month-on-month print, in line with consensus, and limited market impact. Even in the case of a small deviation from consensus, the recent shift in the Fed’s focus to the employment side of its mandate means markets are less sensitive to inflation news.”
“We think DXY can stay around in the 100.0-101.0 range for a few days. The next big move may only happen with a jobs data surprise next week.”
Eurozone-wide CPI figures will be published next Tuesday, and another break above 1.12 for EUR/USD is surely possible into next week’s US payrolls data, FX strategist Francesco Pesole notes.
ECB repricing faces inflation test
“German CPI numbers are published on Monday and the eurozone-wide figures on Tuesday. Inflation has the potential to trigger some hawkish repricing in European Central Bank rate expectations given that Governing Council members recently showed reluctance to give in to easing pressure despite a gloomy economic picture.”
“EUR/USD found some support yesterday, and another break above 1.12 is surely possible into next week’s US payrolls data.”
The New Zealand Dollar (NZD) could continue to rise but is unlikely to break above 0.6355. In the longer run, to continue to advance, NZD must break clearly above 0.6355, UOB Group FX analysts Quek Ser Leang and Lee Sue Ann note.
To advance, NZD must break above 0.6355
24-HOUR VIEW: “After NZD fell sharply on Wednesday, we indicated yesterday that it ‘could continue to decline, but it is unlikely to challenge the major support at 0.6200.’ Our view was incorrect, as NZD rose instead, reaching a high of 0.6332. While NZD could continue to rise, lackluster momentum suggests it is unlikely to break above 0.6355 (there is another resistance at 0.6340). Support is at 0.6300, followed by 0.6275.”
1-3 WEEKS VIEW: “We turned neutral in NZD yesterday (26 Sep, 0.6260), indicating that it ‘is likely to trade between 0.6200 and 0.6340.’ We did not expect NZD to rise and approach 0.6340 as quickly (high has been 0.6332). Despite the advance, upward momentum has not increased much. To continue to advance, NZD must break clearly above 0.6355. The probability of NZD breaking clearly above 0.6355 seems low for now, but it will remain intact as long as 0.6240 is not breached in the next few days.”
- Silver price drops to near $31.60 with US core PCE inflation taking center stage.
- The US core PCE price index accelerated to 2.7% in August year-on-year.
- Investors expect the Fed to reduce interest rates further by 75 bps in the remainder of the year.
Silver price (XAG/USD) extends its correction to near $31.60 in Friday’s European session after facing selling pressure from fresh highs of $32.70 on Thursday. The white metal comes under pressure as investors turn cautious ahead of the United States (US) Personal Consumption Expenditure Price Index (PCE) for August, which will be published at 12:30 GMT.
Economists estimate the core PCE price index, a Federal Reserve’s (Fed) preferred inflation measure, to have grown by 2.37%, faster than 2.6% in July, with monthly figures rising steadily by 0.2%. Investors keenly await the US inflation data as it will shape market speculation for the Fed’s likely policy action in the final quarter of this year.
According to the CME FedWatch tool, the central bank is expected to reduce its key borrowing rates further by 75 bps in the remaining two meetings this year, suggesting that there will be one 50 bps and one 25 bps rate cut. 30-day Federal fund futures pricing data shows that traders are equally split over a 25 or 50 bps interest rate cut in November.
Meanwhile, the US Dollar Index (DXY), which tracks the Greenback’s value against six major currencies, surrenders its early gains and hovers above 100.50. 10-year US Treasury yields edge lower to 3.79%.
Silver technical analysis
Silver price falls slightly after posting a fresh decade high near $32.70. The white metal is under pressure ahead of key inflation data. However, its near-term outlook is bullish as all short-to-long-term Exponential Moving Averages (EMAs) are sloping higher.
The 14-day Relative Strength Index (RSI) oscillates in the bullish range of 60.00-80.00, suggesting a strong bullish momentum.
Silver daily chart
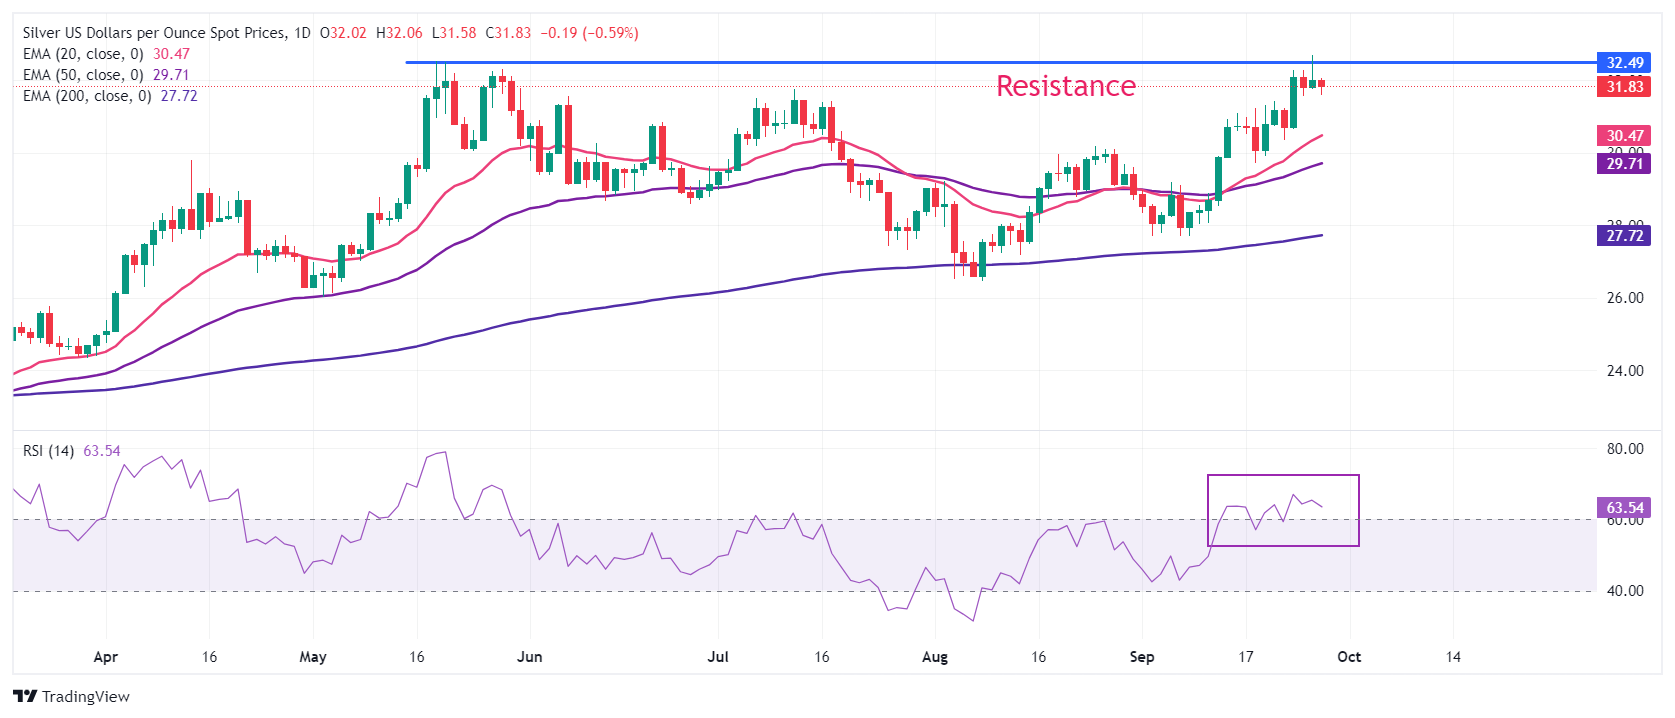
Silver FAQs
Silver is a precious metal highly traded among investors. It has been historically used as a store of value and a medium of exchange. Although less popular than Gold, traders may turn to Silver to diversify their investment portfolio, for its intrinsic value or as a potential hedge during high-inflation periods. Investors can buy physical Silver, in coins or in bars, or trade it through vehicles such as Exchange Traded Funds, which track its price on international markets.
Silver prices can move due to a wide range of factors. Geopolitical instability or fears of a deep recession can make Silver price escalate due to its safe-haven status, although to a lesser extent than Gold's. As a yieldless asset, Silver tends to rise with lower interest rates. Its moves also depend on how the US Dollar (USD) behaves as the asset is priced in dollars (XAG/USD). A strong Dollar tends to keep the price of Silver at bay, whereas a weaker Dollar is likely to propel prices up. Other factors such as investment demand, mining supply – Silver is much more abundant than Gold – and recycling rates can also affect prices.
Silver is widely used in industry, particularly in sectors such as electronics or solar energy, as it has one of the highest electric conductivity of all metals – more than Copper and Gold. A surge in demand can increase prices, while a decline tends to lower them. Dynamics in the US, Chinese and Indian economies can also contribute to price swings: for the US and particularly China, their big industrial sectors use Silver in various processes; in India, consumers’ demand for the precious metal for jewellery also plays a key role in setting prices.
Silver prices tend to follow Gold's moves. When Gold prices rise, Silver typically follows suit, as their status as safe-haven assets is similar. The Gold/Silver ratio, which shows the number of ounces of Silver needed to equal the value of one ounce of Gold, may help to determine the relative valuation between both metals. Some investors may consider a high ratio as an indicator that Silver is undervalued, or Gold is overvalued. On the contrary, a low ratio might suggest that Gold is undervalued relative to Silver.
USD/SGD continues to trade near recent low but decline may have found strong support in the short term. Pair was last at 1.2830, OCBC FX analysts Frances Cheung and Christopher Wong note.
Daily momentum is flat
“USD/SGD continued to trade near recent low but decline may have found strong support in the short term.”
“Daily momentum is flat while RSI rose. Risks somewhat skewed to the upside. Resistance at 1.2910, 1.2970 (21 DMA). Support at 1.2820, 1.2740 levels. Sell rallies preferred.”
The Australian Dollar (AUD) could edge higher, but it is unlikely to be able to break above 0.6930. In the longer run, AUD has to break and remain above 0.6930 before an advance to 0.6980 can be expected, UOB Group FX analysts Quek Ser Leang and Lee Sue Ann note.
AUD has to remain above 0.6930 to advance towards 0.6980
24-HOUR VIEW: “We highlighted yesterday that AUD ‘could dip below 0.6800 before stabilisation can be expected.’ However, AUD rebounded strongly, reaching a high of 0.6905. The strong rebound has resulted in an increase in momentum, albeit not much. Today, we expect AUD to edge higher, but it is unlikely to be able to break above 0.6930. Support is at 0.6875; a breach of 0.6840 would mean that the current mild upward pressure has eased.”
1-3 WEEKS VIEW: “After holding a positive AUD view for more than a week, we shifted to a neutral stance yesterday (26 Sep, spot at 0.6825), indicating that ‘the advance in AUD has come to an end, and it is likely to trade between 0.6750 and 0.6900 for now.’ We did expect AUD to reverse its decline as it soared to a high of 0.6905. Despite the advance, upward momentum has not increased sufficiently to indicate that AUD is ready to rise in a sustained manner. AUD has to break and remain above 0.6930 before an advance to 0.6980 can be expected. The chance of AUD breaking clearly above 0.6930 will remain intact, provided that it stays above 0.6820.”
Room for the Pound Sterling (GBP) to edge higher, but any advance is unlikely to break above 1.3455. In the longer run, GBP must break and hold above 1.3455 to resume strength, UOB Group FX analysts Quek Ser Leang and Lee Sue Ann note.
GBP must hold above 1.3455 to resume strength
24-HOUR VIEW: “Our view for GBP to ‘continue to decline’ yesterday was incorrect. Instead of declining, GBP rose and reached a high of 1.3434. Despite the relatively strong advance, there has been no significant increase in momentum. Today, there is room for GBP to edge higher, but any advance is unlikely to break above 1.3455. Support is at 1.3375, followed by 1.3340.”
1-3 WEEKS VIEW: “Yesterday (26 Sep, spot at 1.3325), we indicated that ‘the more than week-long GBP strength has ended.’ We expected GBP to ‘trade in a 1.3200/1.3430 range for the time being.’ We did not anticipate GBP to test 1.3430 as quickly, as it rose to a high of 1.3434 in NY trade. While upward momentum seems to be building again, it is not enough to indicate the resumption of GBP strength. GBP must break and hold above 1.3455 before further advance to 1.3500 can be expected. The likelihood of GBP breaking clearly above 1.3455 appears low for now, but it will remain intact as long as 1.3310 is not breached within these few days.”
Silver prices (XAG/USD) fell on Friday, according to FXStreet data. Silver trades at $31.74 per troy ounce, down 0.87% from the $32.02 it cost on Thursday.
Silver prices have increased by 33.37% since the beginning of the year.
| Unit measure | Silver Price Today in USD |
|---|---|
| Troy Ounce | 31.74 |
| 1 Gram | 1.02 |
The Gold/Silver ratio, which shows the number of ounces of Silver needed to equal the value of one ounce of Gold, stood at 83.83 on Friday, up from 83.47 on Thursday.
Silver FAQs
Silver is a precious metal highly traded among investors. It has been historically used as a store of value and a medium of exchange. Although less popular than Gold, traders may turn to Silver to diversify their investment portfolio, for its intrinsic value or as a potential hedge during high-inflation periods. Investors can buy physical Silver, in coins or in bars, or trade it through vehicles such as Exchange Traded Funds, which track its price on international markets.
Silver prices can move due to a wide range of factors. Geopolitical instability or fears of a deep recession can make Silver price escalate due to its safe-haven status, although to a lesser extent than Gold's. As a yieldless asset, Silver tends to rise with lower interest rates. Its moves also depend on how the US Dollar (USD) behaves as the asset is priced in dollars (XAG/USD). A strong Dollar tends to keep the price of Silver at bay, whereas a weaker Dollar is likely to propel prices up. Other factors such as investment demand, mining supply – Silver is much more abundant than Gold – and recycling rates can also affect prices.
Silver is widely used in industry, particularly in sectors such as electronics or solar energy, as it has one of the highest electric conductivity of all metals – more than Copper and Gold. A surge in demand can increase prices, while a decline tends to lower them. Dynamics in the US, Chinese and Indian economies can also contribute to price swings: for the US and particularly China, their big industrial sectors use Silver in various processes; in India, consumers’ demand for the precious metal for jewellery also plays a key role in setting prices.
Silver prices tend to follow Gold's moves. When Gold prices rise, Silver typically follows suit, as their status as safe-haven assets is similar. The Gold/Silver ratio, which shows the number of ounces of Silver needed to equal the value of one ounce of Gold, may help to determine the relative valuation between both metals. Some investors may consider a high ratio as an indicator that Silver is undervalued, or Gold is overvalued. On the contrary, a low ratio might suggest that Gold is undervalued relative to Silver.
(An automation tool was used in creating this post.)
The US Dollar (USD) slipped amid slippage in initial jobless claims but levels remain confined to recent lows. Dollar Index (DXY) was last at 100.65, OCBC FX analysts Frances Cheung and Christopher Wong note.
Interim double-bottom seems to be forming
“Daily momentum is mild bullish while RSI dipped. Interim double-bottom appears to be forming – we continue to watch price action. Resistance at 101.10 (21 DMA), 101.90. Support at 100.20 levels (interim double bottom).”
“This week, we watch core PCE (Friday). A hotter print would bring back fears of second-round inflation risks, especially so when Fed is guiding for frontloading of rate cuts. We are also caution of quarter-end flows that may distort price action in the short term.”
Slight increase in momentum is likely to result in a higher trading range of 1.1140/1.1205 instead of a sustained advance. In the longer run, Euro (EUR) has likely entered a range trading phase, probably between 1.1060 and 1.1215, UOB Group FX analysts Quek Ser Leang and Lee Sue Ann note.
To trade between 1.1060 and 1.1215 mid term
24-HOUR VIEW: “Two days ago, EUR fell sharply to 1.1113. Yesterday, when EUR was at 1.1130, we highlighted that ‘the swift decline appears to be overdone, and EUR is unlikely to weaken much further.’ We were of the view that EUR ‘is more likely to trade in a 1.1110/1.1170 range.’ EUR subsequently traded in a higher range of 1.1124/1.1189, closing at 1.1176 (+0.40%). While the price action has resulted in a slight increase in momentum, this is likely to translate into a higher trading of 1.1140/1.1205 instead of a sustained advance.”
1-3 WEEKS VIEW: “We highlighted yesterday (26 Sep, spot at 1.1130) that the recent short-term upward momentum has faded, and EUR ‘has likely entered a range trading phase, probably between 1.1060 and 1.1215.’ We continue to hold the same view. Looking ahead, EUR not only has to break above 1.1215 but also 1.1230 before a sustained rise towards 1.1275 can be expected.”
- EUR/USD falls below 1.1150 as softer-than-expected inflation data from France and Spain has prompted ECB rate cut prospects in October.
- Flash French CPI (EU norm) and Spain's HICP fell below 2% year-on-year in September.
- Investors await the US core PCE inflation data on Friday for fresh Fed interest rate guidance.
EUR/USD slumps below 1.1150 in Friday’s European session. The major currency pair faces sharp selling pressure as the Euro (EUR) declines after the flash French Consumer Price Index (CPI) (EU Norm) and the Spain Harmonized Index of Consumer Prices (HICP) data showed that price pressures grew at a slower-than-expected pace in September.
A sharp deceleration in French and Spanish inflationary pressures has prompted market expectations for the European Central Bank (ECB) to cut interest rates again in the October meeting. This would be the third interest rate cut by the ECB in its current policy-easing cycle, which started in June. The ECB reduced interest rates again in September after leaving them unchanged in July.
Annual CPI in France grew at a pace of 1.5%, sharply lower than estimates of 1.9% and the former release of 2.2%. On month, price pressures deflated at a robust pace of 1.2%, faster than expectations of 0.8%.
In Spain, the annual HICP rose by 1.7%, slower than estimates of 1.9% and from 2.4% in August. On month, the HICP declined by 0.1%, which was expected to remain flat.
Going forward, investors will focus on the preliminary German and Eurozone HICP data for September, which will be published on Monday and Tuesday, respectively.
Daily digest market movers: EUR/USD comes under pressure ahead of US core PCE inflation
- EUR/USD faces selling pressure as the US Dollar (USD) rises ahead of the United States (US) Personal Consumption Expenditures Price Index (PCE) for August, which will be published at 12:30 GMT. The inflation data will significantly influence market expectations of the Federal Reserve (Fed) interest rate outlook for the last quarter of the year. The US Dollar Index (DXY), which tracks the Greenback’s value against six major currencies, edges higher to near 100.65 but has remained inside the 100.20-101.40 range for the past two weeks.
- The PCE report is expected to show that core inflation rose at a faster pace of 2.7% year-on-year from 2.6% in June, with monthly figures growing steadily by 0.2%.
- Currently, financial markets seem to be confident that the Fed will cut interest rates for the second straight time in November as inflation is on track to return to the bank’s target of 2% and policymakers are concerned over growing risks to labor demand. However, traders remain equally split over the potential rate cut size between 25 and 50 bps, according to the CME FedWatch tool.
- Next week, investors will focus on Fed Chair Jerome Powell’s speech on Monday, a slew of labor market data, and the ISM Purchasing Managers’ Index (PMI) to project the next move in the US Dollar.
Technical Analysis: EUR/USD ranges below 1.1200
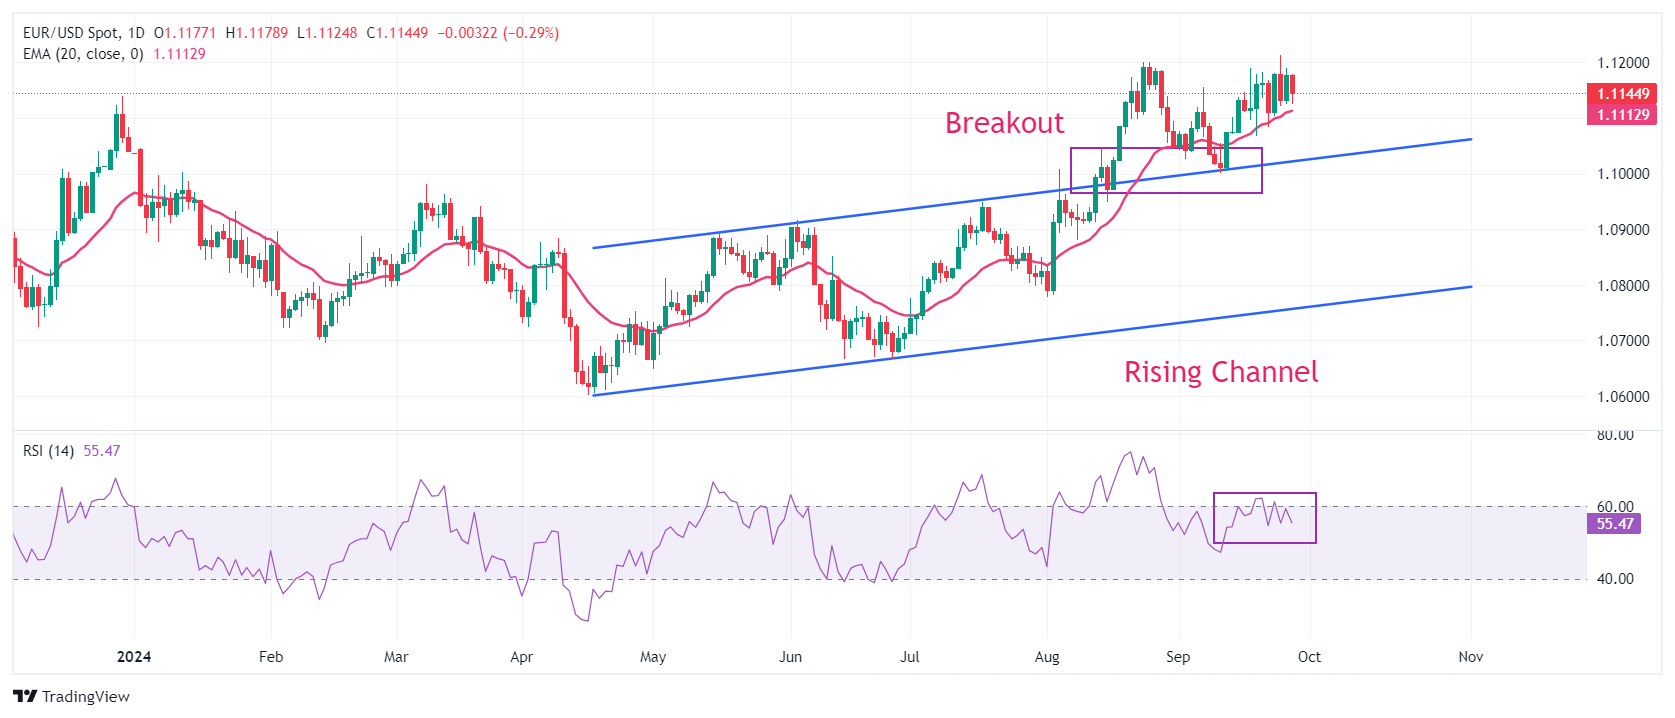
EUR/USD has consolidated in a 100-pip range since Tuesday as investors look for fresh Fed-ECB interest rate cues. The major currency pair remains firm as it holds the breakout of the Rising Channel chart pattern formed on a daily time frame near the psychological support of 1.1000.
The upward-sloping 20-day Exponential Moving Average (EMA) near 1.1110 suggests that the near-term trend is bullish.
The 14-day Relative Strength Index (RSI) edges lower below 60.00, suggesting momentum is weakening.
Looking up, a decisive break above the round-level resistance of 1.1200 will result in further appreciation toward the July 2023 high of 1.1276. On the downside, the psychological level of 1.1000 and the July 17 high near 1.0950 will be major support zones.
Euro FAQs
The Euro is the currency for the 20 European Union countries that belong to the Eurozone. It is the second most heavily traded currency in the world behind the US Dollar. In 2022, it accounted for 31% of all foreign exchange transactions, with an average daily turnover of over $2.2 trillion a day. EUR/USD is the most heavily traded currency pair in the world, accounting for an estimated 30% off all transactions, followed by EUR/JPY (4%), EUR/GBP (3%) and EUR/AUD (2%).
The European Central Bank (ECB) in Frankfurt, Germany, is the reserve bank for the Eurozone. The ECB sets interest rates and manages monetary policy. The ECB’s primary mandate is to maintain price stability, which means either controlling inflation or stimulating growth. Its primary tool is the raising or lowering of interest rates. Relatively high interest rates – or the expectation of higher rates – will usually benefit the Euro and vice versa. The ECB Governing Council makes monetary policy decisions at meetings held eight times a year. Decisions are made by heads of the Eurozone national banks and six permanent members, including the President of the ECB, Christine Lagarde.
Eurozone inflation data, measured by the Harmonized Index of Consumer Prices (HICP), is an important econometric for the Euro. If inflation rises more than expected, especially if above the ECB’s 2% target, it obliges the ECB to raise interest rates to bring it back under control. Relatively high interest rates compared to its counterparts will usually benefit the Euro, as it makes the region more attractive as a place for global investors to park their money.
Data releases gauge the health of the economy and can impact on the Euro. Indicators such as GDP, Manufacturing and Services PMIs, employment, and consumer sentiment surveys can all influence the direction of the single currency. A strong economy is good for the Euro. Not only does it attract more foreign investment but it may encourage the ECB to put up interest rates, which will directly strengthen the Euro. Otherwise, if economic data is weak, the Euro is likely to fall. Economic data for the four largest economies in the euro area (Germany, France, Italy and Spain) are especially significant, as they account for 75% of the Eurozone’s economy.
Another significant data release for the Euro is the Trade Balance. This indicator measures the difference between what a country earns from its exports and what it spends on imports over a given period. If a country produces highly sought after exports then its currency will gain in value purely from the extra demand created from foreign buyers seeking to purchase these goods. Therefore, a positive net Trade Balance strengthens a currency and vice versa for a negative balance.
- The Mexican Peso seesaws between tepid gains and losses following the Bank of Mexico (Banxico) meeting.
- The bank decided to cut interest rates by 25 bps and revised down its forecasts for inflation.
- USD/MXN steadily climbs within its rising channel.
The Mexican Peso (MXN) fluctuates between tepid gains and losses in its major pairs on Friday, a day after the Bank of Mexico (Banxico) policy meeting at which the bank decided to cut interest rates by 25 basis points (0.25%), bringing the official cash rate down to 10.50% from 10.75% previously.
Changes to interest rates can have a high impact on exchange rates. However, the cut was in line with consensus expectations, so the Peso remained relatively stable following the announcement.
Revisions to Banxico’s forecasts for the economy, however, suggest more interest rate cuts are probably on the way, with potentially negative implications for MXN.
Mexican Peso weighed by downwardly revised inflation forecasts
The Mexican Peso ended the day little-changed following the Banxico interest-rate decision, closing Thursday close to where it started in its major pairs.
The bank decided to cut interest rates by 25 bps to 10.50% as expected, with four of the members of the board voting in support of the decision and one dissenter – Jonathan Heath – voting to keep rates unchanged.
Banxico did, however, revise down its inflation forecasts in light of recent data that showed a cooling in price pressures. It forecast headline inflation (INPC) at 5.1% in Q3 of 2024, down from 5.2% in the August policy statement, and at 4.3% instead of 4.4% in Q4. As for core inflation, the bank saw it falling to 3.8% in Q4 of 2024, below the 3.9% in the previous forecast, and to 3.5% in Q1 of 2025, down from 3.6% previously.
The Banxico statement noted that “Mexico’s economy is undergoing a period of weakness” and that the balance of risks to growth remains to the downside.
With lower inflation expected and doubts over economic growth, the forecast revisions suggest a greater likelihood of the Banxico making more cuts to interest rates in the future.
“We are forecasting two more 25bp cuts this year at the November 14th and December 19th meetings, respectively, bringing the year-end rate to 10.00%. This in addition to a total of 200 bps cuts throughout next year,” said Rabobank in a note.
Advisory service Capital Economics were of a similar view stating: “Overall, we expect two more 25bp interest rate cuts over the rest of the year, to 10.00%. The easing cycle is likely to be a bit more stop-start next year as it takes time for inflation to fall to the central bank's 2-4% target. Our end-2025 forecast of 8.50% is above consensus expectations,” said Liam Peach, Senior Emerging Markets Economist.
Technical Analysis: USD/MXN continues steady rise within channel
USD/MXN continues to trade within its rising channel as it extends the uptrending bias of recent months. Overall, it is in a short, medium and long-term uptrend. Given the theory that “the trend is your friend”, it’s more likely than not to continue higher.
USD/MXN Daily Chart
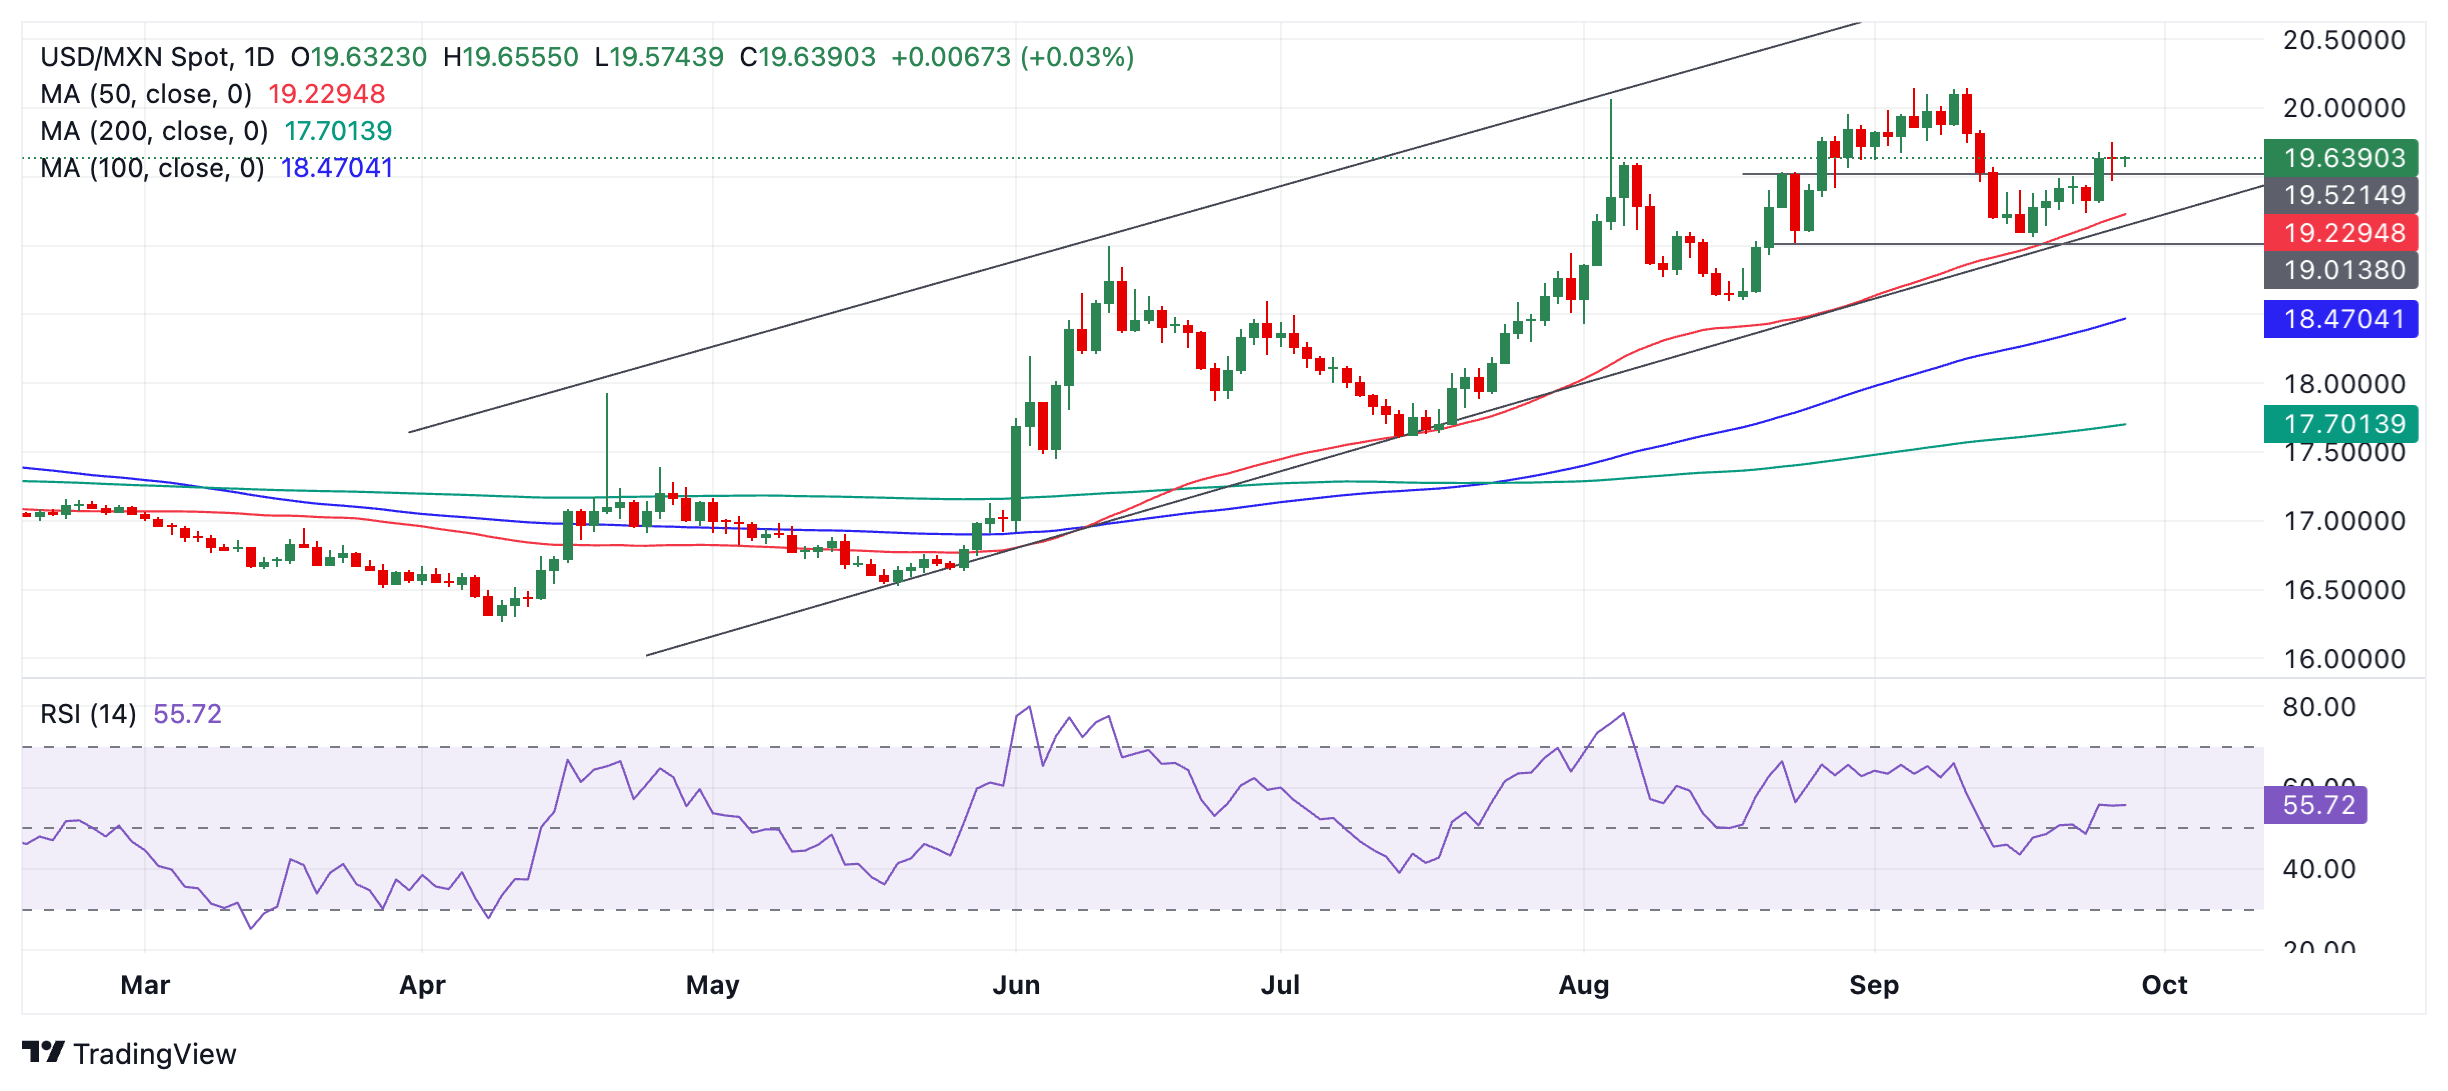
Thursday’s close above 19.63 (September 25 high) provided more bullish certainty of the pair’s near-term upside bias after it recently bottomed out at the base of the rising channel, towards a target at 20.15, the high of the year.
A further break above 19.75 (the September 26 high) would create a higher high and provide yet more proof of an extension of the uptrend.
Economic Indicator
Central Bank Interest Rate
The Bank of Mexico announces a key interest rate which affects the whole range of interest rates set by commercial banks, building societies and other institutions for their own savers and borrowers. Generally speaking, if the central bank is hawkish about the inflationary outlook of the economy and rises the interest rates it is positive, or bullish, for the Mexican Peso.
Read more.Last release: Thu Sep 26, 2024 19:00
Frequency: Irregular
Actual: 10.5%
Consensus: 10.5%
Previous: 10.75%
Source: Banxico
- AUD/USD struggles for a firm intraday direction amid mixed fundamental cues.
- The optimism over China’s stimulus measures lends some support to the Aussie.
- A modest USD strength caps spot prices ahead of the key US PCE Price Index.
The AUD/USD pair oscillates in a narrow trading band below the 0.6900 mark through the first half of the European session on Friday and remains close to its highest level since February 2023 touched earlier this week.
The US Dollar (USD) attracts some buyers ahead of the US Personal Consumption Expenditure (PCE) Price Index and turns out to be a key factor acting as a headwind for the AUD/USD pair. That said, bets for another oversized interest rate cut by the Federal Reserve (Fed) in November hold back the USD bulls from placing aggressive bets. Apart from this, the upbeat market mood caps the safe-haven buck and lends some support to the risk-sensitive Aussie.
The global risk sentiment gets an additional boost after the People's Bank of China (PBOC) cut the seven-day repo rate to 1.5% from 1.7% and lowered the Reserve Requirement Ratio (RRR) by 50 bps. This comes on top of a slew of stimulus measures announced this week, which continues to fuel the risk-on rally across the global equity markets and underpins the China-proxy Australian Dollar (AUD) amid the Reserve Bank of Australia's (RBA) hawkish stance.
In fact, the Australian central bank reiterated on Tuesday that policy will need to be restrictive until confidence returns that inflation is moving sustainably towards the target range. Adding to this, RBA Governor Michele Bullock stated that the recent data has not significantly influenced the policy outlook. This, in turn, suggests that the path of least resistance for the AUD/USD pair is to the upside and supports prospects for an extension of over a two-week-old rally.
Economic Indicator
Personal Consumption Expenditures - Price Index (YoY)
The Personal Consumption Expenditures (PCE), released by the US Bureau of Economic Analysis on a monthly basis, measures the changes in the prices of goods and services purchased by consumers in the United States (US). The YoY reading compares prices in the reference month to a year earlier. Price changes may cause consumers to switch from buying one good to another and the PCE Deflator can account for such substitutions. This makes it the preferred measure of inflation for the Federal Reserve. Generally, a high reading is bullish for the US Dollar (USD), while a low reading is bearish.
Read more.Next release: Fri Sep 27, 2024 12:30
Frequency: Monthly
Consensus: 2.3%
Previous: 2.5%
Source: US Bureau of Economic Analysis
- EUR/JPY plummets around 450 pips intraday and is pressured by a combination of factors.
- Ishiba wins the LDP presidential election to become Japan's Prime Minister and boosts the JPY.
- Sofer French, and Spanish CPI prints weigh on the Euro and further exerts pressure on the cross.
The EUR/JPY cross witnessed a dramatic intraday turnaround and tumbled around 450 pips from its highest level since August 16 set earlier this Friday. The downward trajectory drags spot prices to a fresh weekly low during the first half of the European session, though stalls near the 159.00 round-figure mark.
The Japanese Yen (JPY) rallies across the board after former Défense Chief Shigeru Ishiba beat Sanae Takaichi to become the next leader of the ruling Liberal Democratic Party (LDP) and secure the role of Japan’s Prime Minister on his fifth attempt. The news was taken positively by the JPY bulls as was the one who had been vocal in scrutinizing the Bank of Japan (BoJ) for hiking rates too fast. This turned out to be a key trigger behind the initial leg of a sharp intraday downfall for the EUR/JPY cross.
The selling bias picked up pace following the release of softer consumer inflation figures from France and Spain. The preliminary data from statistics agency INSEE showed that French consumer prices rose less than anticipated and the harmonized inflation rate increased 1.5% YoY in September, down from 2.2% in the previous month. Adding to this, the flash indicator prepared by the NSI revealed that the Spanish Consumer Price Index (CPI) decelerated to the 1.5% YoY rate from 2.3% in August.
The softer data reaffirmed market bets for at least a 25 basis points (bps) interest rate cut by the European Central Bank (ECB) at its next policy meeting in October. This, in turn, weighs heavily on the shared currency and further contributes to the EUR/JPY pair's downfall. Meanwhile, core inflation in Tokyo – Japan's capital – matched the BoJ's 2% target in September, which, along with the risk-on mood, caps gains for the safe-haven JPY and assists the cross to rebound to the 159.40-159.50 area.
Nevertheless, investors are still pricing in the possibility of another BoJ rate hike by the end of this year. This, in turn, favors the JPY bulls and supports prospects for a further depreciating move for the EUR/JPY cross. Even from a technical perspective, the formation of a 'Death Cross' on the daily chart – the 50-day Simple Moving Average (SMA) crossing below the very important 200-day SMA earlier this month – validates the negative outlook and supports prospects for further losses.
Economic Indicator
Consumer Price Index (EU norm) (YoY)
The Consumer Price Index released by INSEE is a measure of price movements by the comparison between the retail prices of a representative shopping basket of goods and services. The purchase power of the Euro is dragged down by inflation. The CPI is a key indicator to measure inflation and changes in purchasing trends. Generally speaking, a high reading is seen as positive (or bullish) for the Euro, while a low reading is seen as negative (or bearish).
Read more.Last release: Fri Sep 27, 2024 06:45 (Prel)
Frequency: Monthly
Actual: 1.5%
Consensus: 1.9%
Previous: 2.2%
Source: INSEE
- The Pound Sterling faces pressure near 1.3400 against the US Dollar ahead of the US PCE inflation data for August.
- Market expectations for the Fed cutting rates by 50 basis points in November have slightly declined.
- The BoE is expected to cut interest rates once in the last quarter of the year.
The Pound Sterling (GBP) continues to face selling pressure near the round-level resistance of 1.3400 against the US Dollar (USD) in Friday’s London session. The rally for the GBP/USD pair appears to have stalled, as investors focus on the United States (US) Personal Consumption Expenditure Price Index (PCE) data for August, which will be published at 12:30 GMT.
The US core PCE index, the Federal Reserve’s (Fed) preferred inflation gauge, is estimated to have grown 2.7% on year, faster than the 2.6% increase seen in July, while on month prices are expected to have grown steadily by 0.2%.
The data is likely to influence market speculation for the Fed interest rate cuts in November. Markets are almost equally split about the US central bank lowering rates again by 50 basis points or by a smaller 25 basis points.
According to the CME FedWatch tool, the probability of the Fed reducing interest rates by 50 basis points in November has dropped to 51% from 57% on Thursday. If the PCE data gave signs of a further slowdown in inflationary pressures, market expectations of a big cut interest rate cut would increase. On the contrary, hot inflation figures would weaken the chances of this scenario.
The significance of the US inflation data has declined recently as Fed officials seem confident that price pressures will return to the bank’s target of 2%. Also, policymakers have become more vigilant about labor market risks. Last week, the Fed started the policy-easing cycle with a larger-than-usual interest rate cut of 50 basis points (bps) to 4.75%-5.00%, which signaled that officials would do whatever it takes to revive labor market strength.
Daily digest market movers: Pound Sterling looks set for another week of gains
- The Pound Sterling performs weakly against its major peers, except the Asia-Pacific currencies, on Friday. The British currency weakens as investors turn cautious ahead of PCE inflation data.
- There isn’t any top-tier United Kingdom (UK) economic data this week or the next one. Therefore, the GBP will be influenced by market expectations for the Bank of England’s (BoE) monetary policy action for the remainder of the year.
- Financial market participants expect that the BoE will lower interest rates once in any of the two policy meetings remaining this year. The BoE pivoted to policy normalization with a 25-bps interest rate cut in August to 5%, but left rates unchanged in its last week’s meeting.
- On Tuesday, BoE Governor Andrew Bailey said in an interview with the Kent Messenger newspaper that "the path for interest rates will be downwards, gradually,” Reuters reports. Bailey’s comments suggest that he is confident about inflation sustainably returning to the bank’s target of 2%. He didn’t provide a specific neutral rate but assured that they will not return to historic lows as seen in times of pandemic.
Technical Analysis: Pound Sterling struggles to climb above 1.3400
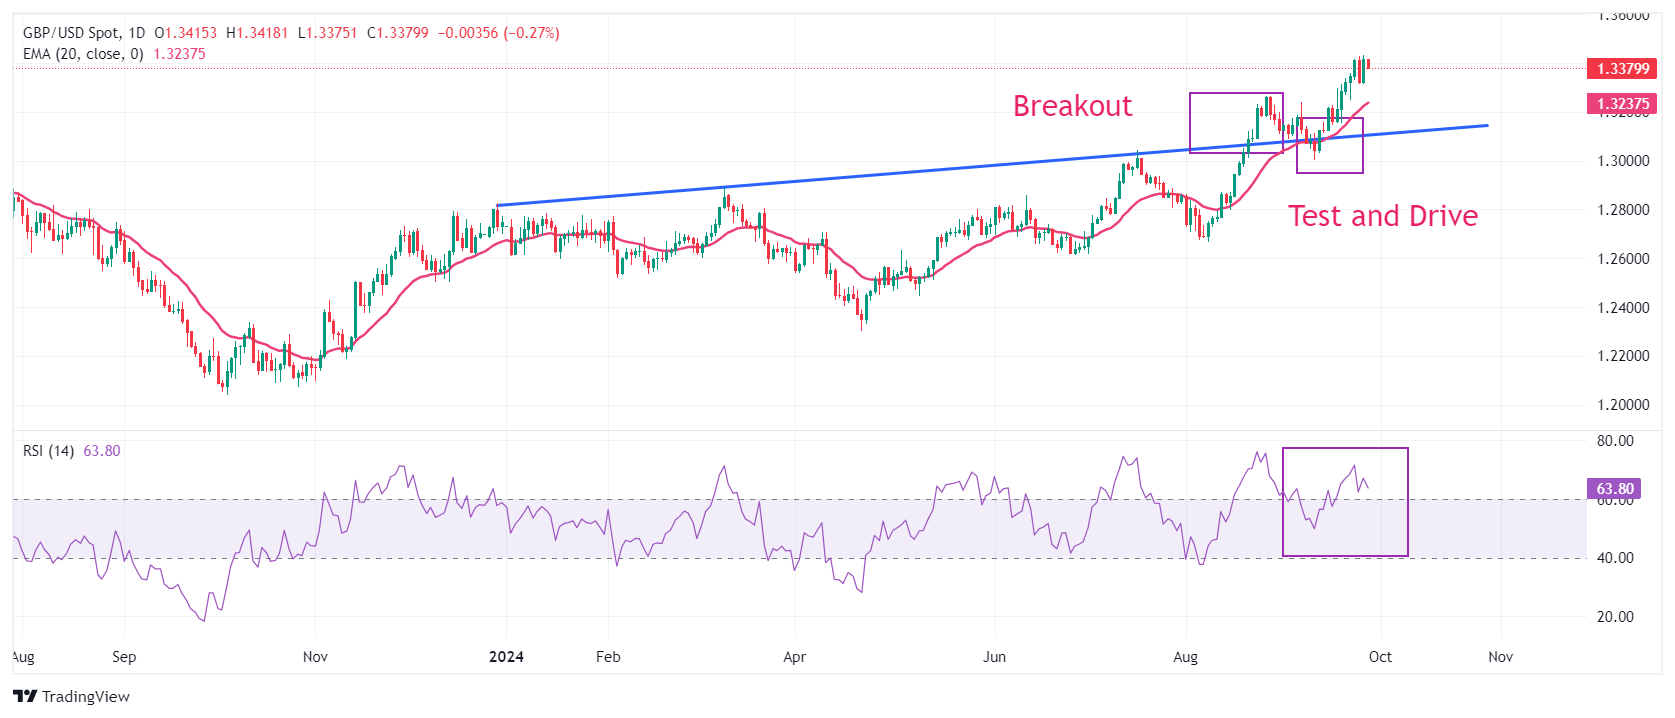
The Pound Sterling drops as it struggles to extend its upside above the key resistance of 1.3400 against the US Dollar in European trading hours. The GBP/USD pair faced selling pressure after posting a fresh more-than-two-year high above 1.3430. The near-term outlook of the Cable remains firm as the 20-day Exponential Moving Average (EMA) near 1.3235 is sloping higher.
Earlier in September, the Cable strengthened after recovering from a corrective move to near the trendline plotted from the December 28, 2023, high of 1.2828, from where it delivered a sharp increase after a breakout on August 21.
The 14-day Relative Strength Index (RSI) tilts down but remains above 60.00, suggesting an active bullish momentum.
Looking up, the Cable will face resistance near the psychological level of 1.3500. On the downside, the 20-day EMA near 1.3235 will be the key support for Pound Sterling bulls.
Pound Sterling FAQs
The Pound Sterling (GBP) is the oldest currency in the world (886 AD) and the official currency of the United Kingdom. It is the fourth most traded unit for foreign exchange (FX) in the world, accounting for 12% of all transactions, averaging $630 billion a day, according to 2022 data. Its key trading pairs are GBP/USD, aka ‘Cable’, which accounts for 11% of FX, GBP/JPY, or the ‘Dragon’ as it is known by traders (3%), and EUR/GBP (2%). The Pound Sterling is issued by the Bank of England (BoE).
The single most important factor influencing the value of the Pound Sterling is monetary policy decided by the Bank of England. The BoE bases its decisions on whether it has achieved its primary goal of “price stability” – a steady inflation rate of around 2%. Its primary tool for achieving this is the adjustment of interest rates. When inflation is too high, the BoE will try to rein it in by raising interest rates, making it more expensive for people and businesses to access credit. This is generally positive for GBP, as higher interest rates make the UK a more attractive place for global investors to park their money. When inflation falls too low it is a sign economic growth is slowing. In this scenario, the BoE will consider lowering interest rates to cheapen credit so businesses will borrow more to invest in growth-generating projects.
Data releases gauge the health of the economy and can impact the value of the Pound Sterling. Indicators such as GDP, Manufacturing and Services PMIs, and employment can all influence the direction of the GBP. A strong economy is good for Sterling. Not only does it attract more foreign investment but it may encourage the BoE to put up interest rates, which will directly strengthen GBP. Otherwise, if economic data is weak, the Pound Sterling is likely to fall.
Another significant data release for the Pound Sterling is the Trade Balance. This indicator measures the difference between what a country earns from its exports and what it spends on imports over a given period. If a country produces highly sought-after exports, its currency will benefit purely from the extra demand created from foreign buyers seeking to purchase these goods. Therefore, a positive net Trade Balance strengthens a currency and vice versa for a negative balance.
The People’s Bank of China (PBOC) said in a statement on Friday, “ the decision to lower RRR is equivalent to providing long-term low-cost funds for banks.”
Additional takeaways
The impact of the recently announced incremental interest rate policy on banks' net interest margins remains neutral overall.
Lowering of the interest rate of the stock of mortgage loans will reduce the interest income of banks, but will also reduce the early repayment of customers.
Lowering 7-day reverse repo rate is expected to asymmetrically reduce loan prime rate and deposit rates.
Banks' net interest margins will remain largely stable.
PBOC’s decision to lower RRR is equivalent to provide long-term low-cost funds for banks.
Medium-term lending facility and open market operation will be the main method for the PBOC to provide short- and medium-term funds to commercial banks.
Market reaction
AUD/USD is recovering some ground on these headlines, currently trading at 0.6885, still down 0.14% on the day.
Australian Dollar FAQs
One of the most significant factors for the Australian Dollar (AUD) is the level of interest rates set by the Reserve Bank of Australia (RBA). Because Australia is a resource-rich country another key driver is the price of its biggest export, Iron Ore. The health of the Chinese economy, its largest trading partner, is a factor, as well as inflation in Australia, its growth rate and Trade Balance. Market sentiment – whether investors are taking on more risky assets (risk-on) or seeking safe-havens (risk-off) – is also a factor, with risk-on positive for AUD.
The Reserve Bank of Australia (RBA) influences the Australian Dollar (AUD) by setting the level of interest rates that Australian banks can lend to each other. This influences the level of interest rates in the economy as a whole. The main goal of the RBA is to maintain a stable inflation rate of 2-3% by adjusting interest rates up or down. Relatively high interest rates compared to other major central banks support the AUD, and the opposite for relatively low. The RBA can also use quantitative easing and tightening to influence credit conditions, with the former AUD-negative and the latter AUD-positive.
China is Australia’s largest trading partner so the health of the Chinese economy is a major influence on the value of the Australian Dollar (AUD). When the Chinese economy is doing well it purchases more raw materials, goods and services from Australia, lifting demand for the AUD, and pushing up its value. The opposite is the case when the Chinese economy is not growing as fast as expected. Positive or negative surprises in Chinese growth data, therefore, often have a direct impact on the Australian Dollar and its pairs.
Iron Ore is Australia’s largest export, accounting for $118 billion a year according to data from 2021, with China as its primary destination. The price of Iron Ore, therefore, can be a driver of the Australian Dollar. Generally, if the price of Iron Ore rises, AUD also goes up, as aggregate demand for the currency increases. The opposite is the case if the price of Iron Ore falls. Higher Iron Ore prices also tend to result in a greater likelihood of a positive Trade Balance for Australia, which is also positive of the AUD.
The Trade Balance, which is the difference between what a country earns from its exports versus what it pays for its imports, is another factor that can influence the value of the Australian Dollar. If Australia produces highly sought after exports, then its currency will gain in value purely from the surplus demand created from foreign buyers seeking to purchase its exports versus what it spends to purchase imports. Therefore, a positive net Trade Balance strengthens the AUD, with the opposite effect if the Trade Balance is negative.
- NZD/USD depreciates due to market caution ahead of August’s US Personal Consumption Expenditures Price Index data.
- The upside of the US Dollar could be limited due to the dovish Fedspeak.
- The ANZ Roy Morgan Consumer Confidence Index rose to 95.1 points in September, from 92.2 prior.
NZD/USD retraces its recent gains, trading around 0.6300 during the European hours on Friday. This downside is attributed to the improved US Dollar (USD) amid market caution ahead of the US Personal Consumption Expenditures (PCE) Price Index data for August. The Fed’s preferred inflation indicator is scheduled to be released later in the North American session.
On the data front, the US Gross Domestic Product Annualized increased at a rate of 3.0% in the second quarter, as estimated, according to the US Bureau of Economic Analysis (BEA) on Thursday. Meanwhile, the GDP Price Index rose 2.5% in the second quarter.
Additionally, US Initial Jobless Claims for the week ending September 20 were reported at 218K, according to the US Department of Labor (DoL). This figure came in below the initial consensus of 225K and was lower than the previous week's revised number of 222K (previously reported as 219K).
However, the US Dollar might have received downward pressure following the dovish remarks from the US Federal Reserve (Fed) officials. According to Reuters, Fed Governor Lisa Cook stated on Thursday that she supported last week's 50 basis point (bps) interest rate cut, citing increased "downside risks" to employment.
On the Kiwi front, the ANZ Roy Morgan Consumer Confidence Index rose for the third consecutive month, reaching 95.1 points in September, up from the previous reading of 92.2. This marked the highest reading since January 2022.
However, the New Zealand Dollar (NZD) is under pressure due to growing expectations that the Reserve Bank of New Zealand (RBNZ) will cut interest rates again in October, with markets pricing in a 67% probability of a 50 basis point rate cut. Investors currently anticipate the 5.25% cash rate to decline to 2.83% by the end of 2025.
New Zealand Dollar FAQs
The New Zealand Dollar (NZD), also known as the Kiwi, is a well-known traded currency among investors. Its value is broadly determined by the health of the New Zealand economy and the country’s central bank policy. Still, there are some unique particularities that also can make NZD move. The performance of the Chinese economy tends to move the Kiwi because China is New Zealand’s biggest trading partner. Bad news for the Chinese economy likely means less New Zealand exports to the country, hitting the economy and thus its currency. Another factor moving NZD is dairy prices as the dairy industry is New Zealand’s main export. High dairy prices boost export income, contributing positively to the economy and thus to the NZD.
The Reserve Bank of New Zealand (RBNZ) aims to achieve and maintain an inflation rate between 1% and 3% over the medium term, with a focus to keep it near the 2% mid-point. To this end, the bank sets an appropriate level of interest rates. When inflation is too high, the RBNZ will increase interest rates to cool the economy, but the move will also make bond yields higher, increasing investors’ appeal to invest in the country and thus boosting NZD. On the contrary, lower interest rates tend to weaken NZD. The so-called rate differential, or how rates in New Zealand are or are expected to be compared to the ones set by the US Federal Reserve, can also play a key role in moving the NZD/USD pair.
Macroeconomic data releases in New Zealand are key to assess the state of the economy and can impact the New Zealand Dollar’s (NZD) valuation. A strong economy, based on high economic growth, low unemployment and high confidence is good for NZD. High economic growth attracts foreign investment and may encourage the Reserve Bank of New Zealand to increase interest rates, if this economic strength comes together with elevated inflation. Conversely, if economic data is weak, NZD is likely to depreciate.
The New Zealand Dollar (NZD) tends to strengthen during risk-on periods, or when investors perceive that broader market risks are low and are optimistic about growth. This tends to lead to a more favorable outlook for commodities and so-called ‘commodity currencies’ such as the Kiwi. Conversely, NZD tends to weaken at times of market turbulence or economic uncertainty as investors tend to sell higher-risk assets and flee to the more-stable safe havens.
- AUD/JPY loses ground as Shigeru Ishiba has won the leadership race to become Japan’s prime minister.
- The Tokyo Consumer Price Index rose 2.2% YoY in September, down from a 2.6% increase in August.
- Australian Treasurer Jim Chalmers views China's new stimulus measures as a "really welcome development."
AUD/JPY breaks its winning streak that began on September 16, trading around 98.60 during the early European session on Friday. The Japanese Yen (JPY) gains ground as former Defense Chief Shigeru Ishiba won the Liberal Democratic Party's (LDP) presidential election to become Japan's prime minister. However, the JPY received downward pressure due to the rising concerns over the Bank of Japan’s (BoJ) interest rates outlook.
On Friday, The Tokyo Consumer Price Index (CPI) increased 2.2% year-over-year in September, down from a 2.6% rise in August. Meanwhile, the CPI excluding fresh food and energy climbed 1.6% YoY in September, unchanged from the previous reading. The CPI excluding fresh food increased 2.0% as expected, compared to the previous rise of 2.4%.
The AUD/JPY cross may receive upward support following the news of further stimulus from China, its largest trading partner, along with the dovish Federal Reserve’s (Fed) policy outlook, which lifted market sentiment for riskier currencies like the Australian Dollar (AUD).
Australian Treasurer Jim Chalmers is currently in China to strengthen economic ties between the two nations. During his visit, Chalmers held candid and productive discussions with the National Development and Reform Commission (NDRC). He highlighted China's economic slowdown as a key factor in weaker global growth while welcoming the country's new stimulus measures as a "really welcome development."
Interest rates FAQs
Interest rates are charged by financial institutions on loans to borrowers and are paid as interest to savers and depositors. They are influenced by base lending rates, which are set by central banks in response to changes in the economy. Central banks normally have a mandate to ensure price stability, which in most cases means targeting a core inflation rate of around 2%. If inflation falls below target the central bank may cut base lending rates, with a view to stimulating lending and boosting the economy. If inflation rises substantially above 2% it normally results in the central bank raising base lending rates in an attempt to lower inflation.
Higher interest rates generally help strengthen a country’s currency as they make it a more attractive place for global investors to park their money.
Higher interest rates overall weigh on the price of Gold because they increase the opportunity cost of holding Gold instead of investing in an interest-bearing asset or placing cash in the bank. If interest rates are high that usually pushes up the price of the US Dollar (USD), and since Gold is priced in Dollars, this has the effect of lowering the price of Gold.
The Fed funds rate is the overnight rate at which US banks lend to each other. It is the oft-quoted headline rate set by the Federal Reserve at its FOMC meetings. It is set as a range, for example 4.75%-5.00%, though the upper limit (in that case 5.00%) is the quoted figure. Market expectations for future Fed funds rate are tracked by the CME FedWatch tool, which shapes how many financial markets behave in anticipation of future Federal Reserve monetary policy decisions.
- GBP/JPY attracts some sellers to 191.85 in Friday’s early European session.
- Former defense minister Shigeru Ishiba won the LDP leadership race run-off and will be Japan's next prime minister.
- The BoE is expected to deliver another interest rate cut in any of its two policy meetings remaining this year.
The GBP/JPY cross faces some selling pressure to around 191.85, snapping the three-day winning streak during the early European session on Friday. The winning of former defense minister Shigeru Ishiba in the Liberal Democratic Party's (LDP) leadership race run-off boosts the Japanese Yen (JPY) and creates a headwind for the cross.
Japan’s ruling party holds its leadership election on Friday and the former defense minister Shigeru Ishiba won the LDP leadership race run-off. The Japanese Yen (JPY) gains traction in an immediate reaction to the outcome as Ishiba received 215 votes in the run-off while Sanae Takaich only got 194 votes.
The Tokyo core Consumer Price Index (CPI), which excludes volatile fresh food costs, rose 2.0% in September from the previous year, the Statistics Bureau of Japan showed Friday. This figure matched the Bank of Japan’s (BoJ) target and the median market forecast. The headline Tokyo Consumer Price Index (CPI) increased 2.2% YoY in September, compared to a 2.6% rise in August. The Tokyo CPI inflation data indicates the Japanese economy is making progress in meeting the criteria for further interest rate hikes, which further boosts the JPY.
On the other hand, the dovish comments from the Bank of England (BoE) Governor Andrew Bailey might weigh on the Pound Sterling (GBP). Bailey stated that the UK central bank should be able to lower interest rates gradually as it gains confidence that inflation will remain close to its 2% target. Economists expect the BoE to deliver one interest rate cut in any of its two policy meetings remaining this year.
Japanese Yen FAQs
The Japanese Yen (JPY) is one of the world’s most traded currencies. Its value is broadly determined by the performance of the Japanese economy, but more specifically by the Bank of Japan’s policy, the differential between Japanese and US bond yields, or risk sentiment among traders, among other factors.
One of the Bank of Japan’s mandates is currency control, so its moves are key for the Yen. The BoJ has directly intervened in currency markets sometimes, generally to lower the value of the Yen, although it refrains from doing it often due to political concerns of its main trading partners. The current BoJ ultra-loose monetary policy, based on massive stimulus to the economy, has caused the Yen to depreciate against its main currency peers. This process has exacerbated more recently due to an increasing policy divergence between the Bank of Japan and other main central banks, which have opted to increase interest rates sharply to fight decades-high levels of inflation.
The BoJ’s stance of sticking to ultra-loose monetary policy has led to a widening policy divergence with other central banks, particularly with the US Federal Reserve. This supports a widening of the differential between the 10-year US and Japanese bonds, which favors the US Dollar against the Japanese Yen.
The Japanese Yen is often seen as a safe-haven investment. This means that in times of market stress, investors are more likely to put their money in the Japanese currency due to its supposed reliability and stability. Turbulent times are likely to strengthen the Yen’s value against other currencies seen as more risky to invest in.
- EUR/GBP gains ground ahead of the speeches from ECB’s Philip Lane and Piero Cipollone on Friday.
- The Euro may face challenges as the ECB is widely expected to deliver another rate cut in October.
- The Pound Sterling receives support as the BoE is expected to reduce rates more gradually compared to other central banks.
EUR/GBP retraces its recent losses from the previous session, trading around 0.8340 during Friday’s Asian hours. However, further gains may be limited, as the Euro’s performance against major currencies remains weak amid increasing speculation that the European Central Bank (ECB) could lower the Deposit Facility Rate for the second consecutive time next month. This would mark the ECB's third dovish move this year.
ECB Chief Economist Philip Lane will likely deliver the opening remarks at a conference focused on Fiscal Policy, Financial Sector Policy, and Economic Growth in Dublin, Ireland. Meanwhile, ECB board member Piero Cipollone will give a keynote speech at the "Economics of Payments XIII" conference, organized by the Austrian Central Bank.
According to a Reuters report, economists at HSBC anticipate that the ECB will reduce interest rates by 25 basis points at each meeting from October through next April. Meanwhile, Societe Generale economist Anatoli Annenkov suggested there is a case for front-loading the rate cuts, indicating a preference for more aggressive action earlier in the easing cycle.
On the GBP side, expectations that the Bank of England's (BoE) rate-cutting cycle will likely proceed more slowly than the ECB’s should continue to support the British Pound (GBP) and exert downward pressure on the EUR/GBP cross.
The BoE allotted 37.059 billion pounds ($49.52 billion) in seven-day funds during its weekly short-term repo on Thursday, down from last week’s record of 44.523 billion pounds. Repos, or repurchase agreements, allow banks to temporarily exchange government bonds for central bank cash, helping to maintain market interest rates in line with the BoE’s policy rate, according to Reuters.
Interest rates FAQs
Interest rates are charged by financial institutions on loans to borrowers and are paid as interest to savers and depositors. They are influenced by base lending rates, which are set by central banks in response to changes in the economy. Central banks normally have a mandate to ensure price stability, which in most cases means targeting a core inflation rate of around 2%. If inflation falls below target the central bank may cut base lending rates, with a view to stimulating lending and boosting the economy. If inflation rises substantially above 2% it normally results in the central bank raising base lending rates in an attempt to lower inflation.
Higher interest rates generally help strengthen a country’s currency as they make it a more attractive place for global investors to park their money.
Higher interest rates overall weigh on the price of Gold because they increase the opportunity cost of holding Gold instead of investing in an interest-bearing asset or placing cash in the bank. If interest rates are high that usually pushes up the price of the US Dollar (USD), and since Gold is priced in Dollars, this has the effect of lowering the price of Gold.
The Fed funds rate is the overnight rate at which US banks lend to each other. It is the oft-quoted headline rate set by the Federal Reserve at its FOMC meetings. It is set as a range, for example 4.75%-5.00%, though the upper limit (in that case 5.00%) is the quoted figure. Market expectations for future Fed funds rate are tracked by the CME FedWatch tool, which shapes how many financial markets behave in anticipation of future Federal Reserve monetary policy decisions.
FX option expiries for Sept 27 NY cut at 10:00 Eastern Time, via DTCC, can be found below.
EUR/USD: EUR amounts
- 1.1050 1.8b
- 1.1100 1.5b
- 1.1150 975m
- 1.1250 1.1b
GBP/USD: GBP amounts
- 1.3220 528m
- 1.3370 824m
USD/JPY: USD amounts
- 143.00 842m
- 144.80 659m
- 146.00 582m
- 147.00 681m
USD/CHF: USD amounts
- 0.8475 759m
AUD/USD: AUD amounts
- 0.6710 543m
- 0.6925 706m
USD/CAD: USD amounts
- 1.3460 670m
- 1.3500 1.2b
- 1.3575 750m
Here is what you need to know on Friday, September 27:
Risk-on sentiment seen in global markets on Thursday extends into Friday, as a raft of Chinese stimulus measures continue to lift investors’ confidence. The People's Bank of China (PBOC) finally lowered the reserve requirement ratio (RRR), the required minimum capital banks must hold in reserve, by 50 basis points (bps), effective from Friday. The Chinese central bank also cut the seven-day repo rate to 1.5% from 1.7%.
Despite the risk-rally in Asian indices and higher US S&P 500 futures, the US Dollar is looking to build on the overnight recovery, fuelled after a brief dip in early opening hours following the dovish remarks from US Federal Reserve (Fed) Governor Lisa Cook.
Cook said that she “wholeheartedly supported 50 bps rate cut,” adding that the “normalization of economy, particularly of inflation, is quite welcome.”
The Greenback suffered on Thursday, as the European and Wall Street stocks advanced on rate-cut momentum while the mixed US Jobless Claims and Durable Goods Orders data failed to inspire USD buyers.
Several Fed policymakers made their scheduled appearances on Thursday, including Fed Chair Jerome Powell. However, only two of them spoke on monetary policy. Fed Governor Cook supported the 50 bps rate cut move in September while Governor Michelle Bowman stuck to her hawkish rhetoric.
Markets are currently pricing in about a 50% chance of a 50 basis points (bps) rate reduction by the Fed in November, according to the CME Group’s Fed WatchTool, down from over 60% seen a day ago.
The next directional move in the USD hinges on the upcoming US core Personal Consumption Expenditures (PCE) Price Index, the Fed’s most preferred inflation gauge, which could affirm bets of an outsized next rate cut. Additionally, the quarter-end flows could come into play and stir markets.
US Dollar PRICE Today
The table below shows the percentage change of US Dollar (USD) against listed major currencies today. US Dollar was the strongest against the Japanese Yen.
| USD | EUR | GBP | JPY | CAD | AUD | NZD | CHF | |
|---|---|---|---|---|---|---|---|---|
| USD | 0.14% | 0.25% | 1.01% | 0.21% | 0.30% | 0.45% | 0.25% | |
| EUR | -0.14% | 0.11% | 0.85% | 0.04% | 0.17% | 0.30% | 0.13% | |
| GBP | -0.25% | -0.11% | 0.74% | -0.05% | 0.06% | 0.22% | 0.02% | |
| JPY | -1.01% | -0.85% | -0.74% | -0.79% | -0.67% | -0.53% | -0.70% | |
| CAD | -0.21% | -0.04% | 0.05% | 0.79% | 0.08% | 0.26% | 0.06% | |
| AUD | -0.30% | -0.17% | -0.06% | 0.67% | -0.08% | 0.16% | -0.04% | |
| NZD | -0.45% | -0.30% | -0.22% | 0.53% | -0.26% | -0.16% | -0.19% | |
| CHF | -0.25% | -0.13% | -0.02% | 0.70% | -0.06% | 0.04% | 0.19% |
The heat map shows percentage changes of major currencies against each other. The base currency is picked from the left column, while the quote currency is picked from the top row. For example, if you pick the US Dollar from the left column and move along the horizontal line to the Japanese Yen, the percentage change displayed in the box will represent USD (base)/JPY (quote).
Across the FX board, USD/JPY remains volatile, falling as low as 144.75 on Tokyo inflation data before rebounding sharply to beyond 146.00. The Japanese Yen sees a steep sell-off, as Japan’s ruling Liberal Democratic Party’s (LDP) leadership race headed to a run-off between ex-defence minister Shigeru Ishiba and economic security minister Sanae Takaichi, with the former winning the battle to become the country’s next Prime Minister.
The higher-yielding Australian Dollar shrugged off the risk-on mood, as AUD/USD corrected from 19-month highs on a broad US Dollar rebound. The Aussie was last seen trading at 0.6870.
USD/CAD is bouncing back to 1.3500, as Oil price mires in two-week troughs. The black gold extends the downtrend, as markets expect increased oil output from Libya and the OPEC+. WTI is currently trading modestly flat on the day to trade near $67.25.
GBP/USD is consolidating weekly gains near 1.3400, slightly on the back foot as the US Dollar upswing offset the risk-on market profile.
EUR/USD is holding losses below 1.1200 early Europe, having faced rejection at that level on Thursday. The Euro remains pressured by the latest Reuters reports, citing sources, ECB doves are likely to fight for an October rate cut after weak data while the push for an October rate cut is likely to face resistance from ECB hawks arguing for pause.
Gold price is treading water below the record high of $2,686. Overbought conditions on Gold’s daily chart keep buyers defensive.
- The core Personal Consumption Expenditures Price Index is seen rising 0.2% MoM and 2.7% YoY in August.
- Markets have already priced in near 50 bps of easing in the next two Federal Reserve meetings.
- A firm PCE result is unlikely to move the Fed’s stance on policy.
The United States Bureau of Economic Analysis (BEA) is set to release the significant Personal Consumption Expenditures (PCE) Price Index, which is the Federal Reserve’s preferred measure of inflation, on Friday at 12:30 GMT.
While this PCE inflation data may influence the very-near-term trajectory of the US Dollar (USD), it is highly unlikely to alter the Fed’s course regarding its interest-rate path.
Anticipating the PCE: Insights into the Federal Reserve's key inflation metric
The core PCE Price Index is projected to rise by 0.2% in August compared to the previous month, aligning with July’s figures. Over the last twelve months, the core PCE is expected to increase by 2.7%, slightly up from July’s 2.6% rise.
This core PCE Price Index, which excludes the more volatile food and energy categories, plays a crucial role in shaping market expectations for the Federal Reserve's interest-rate outlook. Both the central bank and market participants closely monitor this measure, as it is not distorted by base effects and provides a clearer view of underlying inflation by excluding unstable components.
As for the headline PCE, consensus forecasts suggest that the downward trend will persist in August, with the monthly PCE expected to rise by 0.1% (down from 0.2% previously) and an annual increase of 2.3% (down from 2.5% previously).
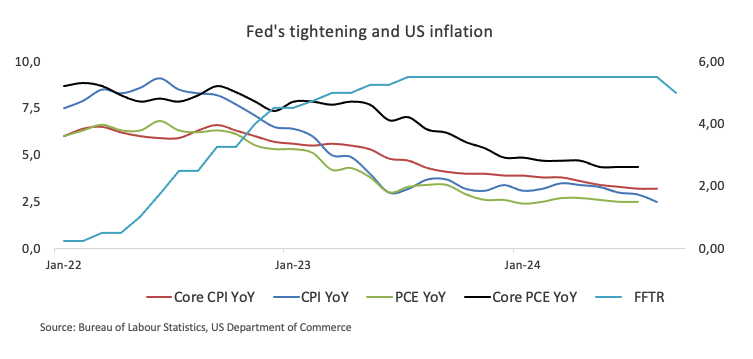
Previewing the PCE inflation report, analysts at TD Securities argued: “Core PCE inflation likely stayed under control in August, with prices advancing at a soft 0.15% m/m pace. Given shelter price strength acted as a key driver of core CPI inflation, the core PCE will not increase as much. Headline PCE inflation likely printed an also soft 0.10% m/m. Separately, we expect personal spending to moderate, rising 0.2% m/m and 0.1% m/m in real terms.”
How will the Personal Consumption Expenditures Price Index affect EUR/USD?
The Greenback navigates the lower end of its multi-month range south of the 101.00 barrier, with initial contention around 100.20 so far.
Following the Fed’s jumbo rate cut at its September 17-18 gathering, investors now see around 50 basis points of easing for the remainder of the year, and between 100 and 125 basis points by the end of 2025.
A surprise at the PCE release should barely influence the Dollar’s price action, as market participants have already shifted their attention to next week’s crucial Nonfarm Payrolls amids the broader Fed’s shift to the labour market in detriment of the progress around inflation.
According to Pablo Piovano, Senior Analyst at FX Street.com, “further upside impulse should motivate EUR/USD to confront its year-to-date peak of 1.1214 (September 25). Once this region is cleared, spot could set sails to the 2023 high of 1.1275 recorded on July 18.”
“On the downside, the September low at 1.1001 (September 11) appears to be reinforced by the provisional 55-day SMA at 1.1009 ahead of the weekly low of 1.0949 (August 15)," Pablo adds.
Finally, Pablo suggests that “while above the 200-day SMA of 1.0873, the pair’s constructive outlook should remain unchanged.”
Economic Indicator
Personal Consumption Expenditures - Price Index (MoM)
The Personal Consumption Expenditures (PCE), released by the US Bureau of Economic Analysis on a monthly basis, measures the changes in the prices of goods and services purchased by consumers in the United States (US).. The MoM figure compares prices in the reference month to the previous month. Price changes may cause consumers to switch from buying one good to another and the PCE Deflator can account for such substitutions. This makes it the preferred measure of inflation for the Federal Reserve. Generally speaking, a high reading is bullish for the US Dollar (USD), while a low reading is bearish.
Read more.Last release: Fri Aug 30, 2024 12:30
Frequency: Monthly
Actual: 0.2%
Consensus: 0.2%
Previous: 0.1%
Source: US Bureau of Economic Analysis
Inflation FAQs
Inflation measures the rise in the price of a representative basket of goods and services. Headline inflation is usually expressed as a percentage change on a month-on-month (MoM) and year-on-year (YoY) basis. Core inflation excludes more volatile elements such as food and fuel which can fluctuate because of geopolitical and seasonal factors. Core inflation is the figure economists focus on and is the level targeted by central banks, which are mandated to keep inflation at a manageable level, usually around 2%.
The Consumer Price Index (CPI) measures the change in prices of a basket of goods and services over a period of time. It is usually expressed as a percentage change on a month-on-month (MoM) and year-on-year (YoY) basis. Core CPI is the figure targeted by central banks as it excludes volatile food and fuel inputs. When Core CPI rises above 2% it usually results in higher interest rates and vice versa when it falls below 2%. Since higher interest rates are positive for a currency, higher inflation usually results in a stronger currency. The opposite is true when inflation falls.
Although it may seem counter-intuitive, high inflation in a country pushes up the value of its currency and vice versa for lower inflation. This is because the central bank will normally raise interest rates to combat the higher inflation, which attract more global capital inflows from investors looking for a lucrative place to park their money.
Formerly, Gold was the asset investors turned to in times of high inflation because it preserved its value, and whilst investors will often still buy Gold for its safe-haven properties in times of extreme market turmoil, this is not the case most of the time. This is because when inflation is high, central banks will put up interest rates to combat it. Higher interest rates are negative for Gold because they increase the opportunity-cost of holding Gold vis-a-vis an interest-bearing asset or placing the money in a cash deposit account. On the flipside, lower inflation tends to be positive for Gold as it brings interest rates down, making the bright metal a more viable investment alternative.
- USD/CHF holds positive ground near 0.8485 in Friday’s early European session, up 0.32% on the day.
- The SNB cut the interest rates by 25 bps, bringing its policy rate to 1.00% at its September meeting on Thursday.
- Fed’s Cook said she 'wholeheartedly' backed rate cut.
The USD/CHF pair attracts some buyers to around 0.8485 on Friday during the early European session. The Swiss Franc (CHF) weakens after the Swiss National Bank (SNB) reduced interest rates on Thursday. All eyes will be on the release of US Personal Consumption Expenditures (PCE) Price Index data, which is due later on Friday.
The Swiss central bank decided to cut the interest rates by 25 basis points (bps), bringing its policy rate to 1.00%, the lowest level since early 2023. Goldman Sachs analysts noted the SNB cut on Thursday was supported by lower inflationary pressure, driven by a stronger CHF and other factors, and they expect a further 25 bps reduction at the December meeting, citing its dovish guidance and new inflation projections.
The better-than-estimated US economic data on Thursday have provided some support to the US Dollar (USD) against the CHF. The US weekly Initial Jobless Claims for the week ending September 21 rose to 218K, up from the previous week's 222K (revised from 219K). The figure came in below the initial consensus of 225K. Meanwhile, US Durable Goods Orders were flat in August, compared to a rise of 9.9% in July, stronger than the expectation of a decline of 2.6%.
Nonetheless, the dovish remarks from the Federal Reserve (Fed) officials and rising bets of Fed rate reduction in the coming months could cap the upside for the USD. Fed Governor Lisa Cook stated on Thursday that she "wholeheartedly" supported the central bank's decision to cut interest rates by 50 bps, calling it an important step in maintaining the path to "moderate" economic growth.
SNB FAQs
The Swiss National Bank (SNB) is the country’s central bank. As an independent central bank, its mandate is to ensure price stability in the medium and long term. To ensure price stability, the SNB aims to maintain appropriate monetary conditions, which are determined by the interest rate level and exchange rates. For the SNB, price stability means a rise in the Swiss Consumer Price Index (CPI) of less than 2% per year.
The Swiss National Bank (SNB) Governing Board decides the appropriate level of its policy rate according to its price stability objective. When inflation is above target or forecasted to be above target in the foreseeable future, the bank will attempt to tame excessive price growth by raising its policy rate. Higher interest rates are generally positive for the Swiss Franc (CHF) as they lead to higher yields, making the country a more attractive place for investors. On the contrary, lower interest rates tend to weaken CHF.
Yes. The Swiss National Bank (SNB) has regularly intervened in the foreign exchange market in order to avoid the Swiss Franc (CHF) appreciating too much against other currencies. A strong CHF hurts the competitiveness of the country’s powerful export sector. Between 2011 and 2015, the SNB implemented a peg to the Euro to limit the CHF advance against it. The bank intervenes in the market using its hefty foreign exchange reserves, usually by buying foreign currencies such as the US Dollar or the Euro. During episodes of high inflation, particularly due to energy, the SNB refrains from intervening markets as a strong CHF makes energy imports cheaper, cushioning the price shock for Swiss households and businesses.
The SNB meets once a quarter – in March, June, September and December – to conduct its monetary policy assessment. Each of these assessments results in a monetary policy decision and the publication of a medium-term inflation forecast.
- The EUR/JPY cross may explore the region around its eight-week high at 163.89 level.
- The daily chart analysis suggests a bullish bias as the currency cross moves upwards within an ascending channel.
- The immediate support appears at the lower ascending channel boundary at the level of 161.50.
EUR/JPY extends its upside for the fourth consecutive day, trading around 162.50 during the Asian session on Friday. Technical analysis of the daily chart shows the pair is moving upwards within the ascending channel, suggesting an ongoing bullish bias.
Additionally, the 14-day Relative Strength Index (RSI) remains above the 50 level, confirming the bullish sentiment for the EUR/JPY cross. A further move toward the 70 level would strengthen the upside trend for the currency cross.
On the upside, the EUR/JPY cross may explore the area around its eight-week high at 163.89, which was recorded on August 15. A break above this level could lead the currency cross to test the upper boundary of the ascending channel around the level of 164.50.
In terms of support, the EUR/JPY cross may find immediate support at the lower boundary of the ascending channel around the level of 161.50, followed by the nine-day Exponential Moving Average (EMA) at 160.47 level.
A break below the nine-day EMA could weaken the bullish bias and put downward pressure on the EUR/JPY cross to navigate the area around its seven-week low of 155.15 level.
EUR/JPY: Daily Chart
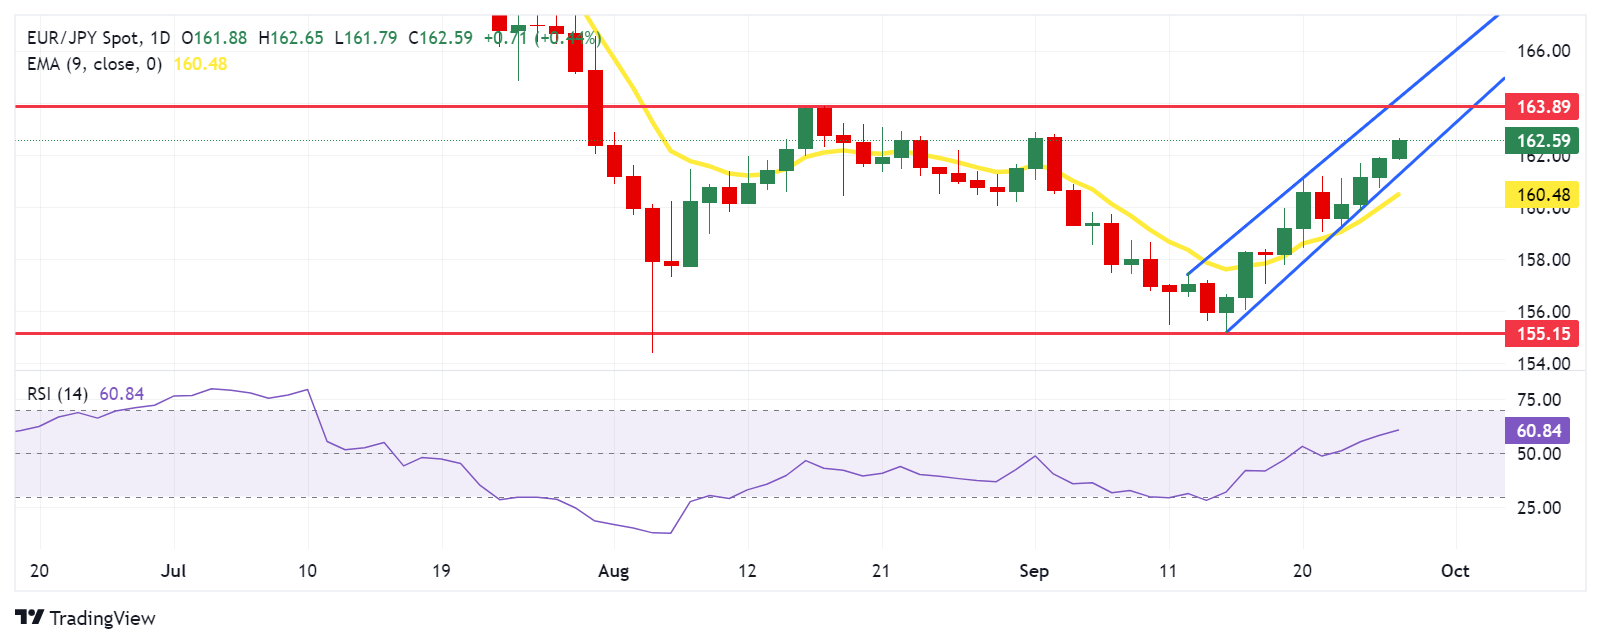
Euro PRICE Today
The table below shows the percentage change of Euro (EUR) against listed major currencies today. Euro was the strongest against the Japanese Yen.
| USD | EUR | GBP | JPY | CAD | AUD | NZD | CHF | |
|---|---|---|---|---|---|---|---|---|
| USD | 0.11% | 0.21% | 0.58% | 0.21% | 0.28% | 0.37% | 0.19% | |
| EUR | -0.11% | 0.09% | 0.46% | 0.04% | 0.17% | 0.25% | 0.10% | |
| GBP | -0.21% | -0.09% | 0.37% | -0.04% | 0.08% | 0.18% | 0.00% | |
| JPY | -0.58% | -0.46% | -0.37% | -0.38% | -0.29% | -0.20% | -0.35% | |
| CAD | -0.21% | -0.04% | 0.04% | 0.38% | 0.08% | 0.20% | 0.02% | |
| AUD | -0.28% | -0.17% | -0.08% | 0.29% | -0.08% | 0.11% | -0.09% | |
| NZD | -0.37% | -0.25% | -0.18% | 0.20% | -0.20% | -0.11% | -0.17% | |
| CHF | -0.19% | -0.10% | -0.00% | 0.35% | -0.02% | 0.09% | 0.17% |
The heat map shows percentage changes of major currencies against each other. The base currency is picked from the left column, while the quote currency is picked from the top row. For example, if you pick the Euro from the left column and move along the horizontal line to the US Dollar, the percentage change displayed in the box will represent EUR (base)/USD (quote).
- USD/CAD attracts some buyers on Friday in the wake of a modest USD strength.
- Bearish Oil prices undermine the Loonie and further lend support to the major.
- The US PCE Price Index and monthly Canadian GDP print eyed for some impetus.
The USD/CAD pair regains positive traction during the Asian session on Friday and looks to build on this week's recovery move from the 1.3420 area, or its lowest level since March 8. Spot prices, however, remain below the 1.3500 mark as traders keenly await Friday's key macro data from the US and Canada before placing aggressive directional bets.
The monthly Canadian GDP report is due for release later today, though the market focus will remain glued to the US Personal Consumption Expenditure (PCE) Price Index. The crucial US inflation data will play a key role in influencing market expectations about the Federal Reserve's (Fed) rate-cut path, which, in turn, will drive the US Dollar (USD) demand and provide some meaningful impetus to the USD/CAD pair.
In the meantime, a modest USD uptick, along with this week's sharp decline in Crude Oil prices, which tends to undermine the commodity-linked Loonie, offers some support to spot prices. That said, bets for another oversized interest rate cut by the Fed in November keep the USD confined in a familiar range held over the past two weeks or so and within the striking distance of the YTD low touched last week.
Apart from this, the prevalent risk-on environment, bolstered by additional monetary stimulus measures from the People's Bank of China (PBOC), should contribute to capping the safe-haven Greenback. Hence, it will be prudent to wait for strong follow-through buying before confirming that the USD/CAD pair has already bottomed out in the near term and positioning for any further appreciating move.
Economic Indicator
Gross Domestic Product (MoM)
The Gross Domestic Product (GDP), released by Statistics Canada on a monthly and quarterly basis, is a measure of the total value of all goods and services produced in Canada during a given period. The GDP is considered as the main measure of Canadian economic activity. The MoM reading compares economic activity in the reference month to the previous month. Generally, a high reading is seen as bullish for the Canadian Dollar (CAD), while a low reading is seen as bearish.
Read more.
Gold prices remained broadly unchanged in India on Friday, according to data compiled by FXStreet.
The price for Gold stood at 7,180.29 Indian Rupees (INR) per gram, broadly stable compared with the INR 7,185.96 it cost on Thursday.
The price for Gold was broadly steady at INR 83,749.47 per tola from INR 83,815.65 per tola a day earlier.
| Unit measure | Gold Price in INR |
|---|---|
| 1 Gram | 7,180.29 |
| 10 Grams | 71,802.88 |
| Tola | 83,749.47 |
| Troy Ounce | 223,337.10 |
FXStreet calculates Gold prices in India by adapting international prices (USD/INR) to the local currency and measurement units. Prices are updated daily based on the market rates taken at the time of publication. Prices are just for reference and local rates could diverge slightly.
Gold FAQs
Gold has played a key role in human’s history as it has been widely used as a store of value and medium of exchange. Currently, apart from its shine and usage for jewelry, the precious metal is widely seen as a safe-haven asset, meaning that it is considered a good investment during turbulent times. Gold is also widely seen as a hedge against inflation and against depreciating currencies as it doesn’t rely on any specific issuer or government.
Central banks are the biggest Gold holders. In their aim to support their currencies in turbulent times, central banks tend to diversify their reserves and buy Gold to improve the perceived strength of the economy and the currency. High Gold reserves can be a source of trust for a country’s solvency. Central banks added 1,136 tonnes of Gold worth around $70 billion to their reserves in 2022, according to data from the World Gold Council. This is the highest yearly purchase since records began. Central banks from emerging economies such as China, India and Turkey are quickly increasing their Gold reserves.
Gold has an inverse correlation with the US Dollar and US Treasuries, which are both major reserve and safe-haven assets. When the Dollar depreciates, Gold tends to rise, enabling investors and central banks to diversify their assets in turbulent times. Gold is also inversely correlated with risk assets. A rally in the stock market tends to weaken Gold price, while sell-offs in riskier markets tend to favor the precious metal.
The price can move due to a wide range of factors. Geopolitical instability or fears of a deep recession can quickly make Gold price escalate due to its safe-haven status. As a yield-less asset, Gold tends to rise with lower interest rates, while higher cost of money usually weighs down on the yellow metal. Still, most moves depend on how the US Dollar (USD) behaves as the asset is priced in dollars (XAU/USD). A strong Dollar tends to keep the price of Gold controlled, whereas a weaker Dollar is likely to push Gold prices up.
(An automation tool was used in creating this post.)
- The US Dollar Index gains traction around 100.65 in Friday’s Asian session.
- US Durable Goods Orders remained flat in August; US economy grew at an annual rate of 3.0% in Q2.
- The dovish tone of the US Fed continues to weigh on the Greenback.
The US Dollar Index (DXY) rebounds to near 100.65 during the Asian trading hours on Friday. The expectation that the Federal Reserve (Fed) will lower its borrowing costs in the future continues to undermine the USD broadly.
The Fed decided to cut interest rates last week by half a percentage point. Fed Chair Jerome Powell noted that the 50 basis points (bps) reduction was a "recalibration" of rates aimed at maintaining strength in the labor market while inflation moves sustainably to the Fed's 2% goal.
Fed officials expect to cut interest rates more in the months to come, but they are not on a preset path. This, in turn, might drag the DXY lower in the near term. The markets are now pricing in nearly a 48.8% chance for another outsized half-percentage-point cut, while the odds of 25 bps stand at 51.2%, according to CME Group's FedWatch Tool.
The upbeat US economic data on Thursday provided some support to the Greenback, but a rally faded as traders shifted the focus to the US inflation data, which is due later on Friday. Analysts estimate the headline Personal Consumption Expenditures (PCE) Price Index to rise 2.3% YoY in August and the core PCE to jump 2.7% YoY in the same period.
Data released by the US Census Bureau revealed that US Durable Goods Orders were unchanged in August versus 9.9% prior, above the market consensus of 2.6%. Meanwhile, the final US Gross Domestic Product (GDP) rose at an annual rate of 3.0% in the second quarter (Q2), as previously estimated.
Fed Governor Lisa Cook said on Thursday that she endorsed the 50 bps interest rate cut last week as a way to address increased "downside risks" to employment. Fed Governor Adriana Kugler stuck to the Fed’s dovish tone, saying “I strongly supported the decision last week by the Federal Open Market Committee (FOMC) to cut the federal funds rate by 50 basis points…If conditions continue to evolve in the direction traveled thus far, then additional cuts will be appropriate.” The dovish stance of the US central bank contributes to the US Dollar Index’s downside.
US Dollar FAQs
The US Dollar (USD) is the official currency of the United States of America, and the ‘de facto’ currency of a significant number of other countries where it is found in circulation alongside local notes. It is the most heavily traded currency in the world, accounting for over 88% of all global foreign exchange turnover, or an average of $6.6 trillion in transactions per day, according to data from 2022. Following the second world war, the USD took over from the British Pound as the world’s reserve currency. For most of its history, the US Dollar was backed by Gold, until the Bretton Woods Agreement in 1971 when the Gold Standard went away.
The most important single factor impacting on the value of the US Dollar is monetary policy, which is shaped by the Federal Reserve (Fed). The Fed has two mandates: to achieve price stability (control inflation) and foster full employment. Its primary tool to achieve these two goals is by adjusting interest rates. When prices are rising too quickly and inflation is above the Fed’s 2% target, the Fed will raise rates, which helps the USD value. When inflation falls below 2% or the Unemployment Rate is too high, the Fed may lower interest rates, which weighs on the Greenback.
In extreme situations, the Federal Reserve can also print more Dollars and enact quantitative easing (QE). QE is the process by which the Fed substantially increases the flow of credit in a stuck financial system. It is a non-standard policy measure used when credit has dried up because banks will not lend to each other (out of the fear of counterparty default). It is a last resort when simply lowering interest rates is unlikely to achieve the necessary result. It was the Fed’s weapon of choice to combat the credit crunch that occurred during the Great Financial Crisis in 2008. It involves the Fed printing more Dollars and using them to buy US government bonds predominantly from financial institutions. QE usually leads to a weaker US Dollar.
Quantitative tightening (QT) is the reverse process whereby the Federal Reserve stops buying bonds from financial institutions and does not reinvest the principal from the bonds it holds maturing in new purchases. It is usually positive for the US Dollar.
- Silver drifts lower and retreats further from a 12-year peak touched on Thursday.
- The setup favors bulls and warrants caution before positioning for deeper losses.
- Any meaningful downfall is likely to attract some dip-buying and remain limited.
Silver (XAG/USD) extends the overnight modest pullback from the $32.70 area, or its highest level since December 2012 and remains under some selling pressure during the Asian session on Friday. The white metal, however, attracts some dip-buyers at lower levels and currently trades just below the $32.00 mark, down 0.25% for the day.
Meanwhile, technical indicators on the daily chart are holding comfortably in positive territory and are still away from being in the overbought zone. This, along with the recent breakout through a short-term descending trend-line resistance, favor bullish traders and suggests that the path of least resistance for the XAG/USD is to the upside. That said, Thursday's failure to build on the momentum beyond the $32.45-$32.50 region warrants some caution.
The aforementioned area might continue to act as an immediate hurdle ahead of the overnight swing high, around the $32.70 area. Some follow-through buying should pave the way for a move towards reclaiming the $33.00 mark and lift the XAG/USD further towards the $33.45 intermediate hurdle en route to the December 2012 swing high, around the $33.85 region.
On the flip side, the $31.60-$31.55 zone now seems to have emerged as an immediate support. Any further decline could be seen as a buying opportunity around the $31.25 area and remain limited near the $31.00 mark. A convincing break below the latter could drag the XAG/USD to the $30.60-$30.55 zone en route to the $30.00 psychological mark and the $29.70-$29.65 area, or the descending trend-line resistance breakpoint, now turned support.
The latter now coincides with the 100-day Simple Moving Average (SMA) and should act as a key pivotal point. Failure to defend the said support levels will suggest that the XAG/USD has topped out and pave the way for a meaningful corrective decline in the near term.
Silver daily chart
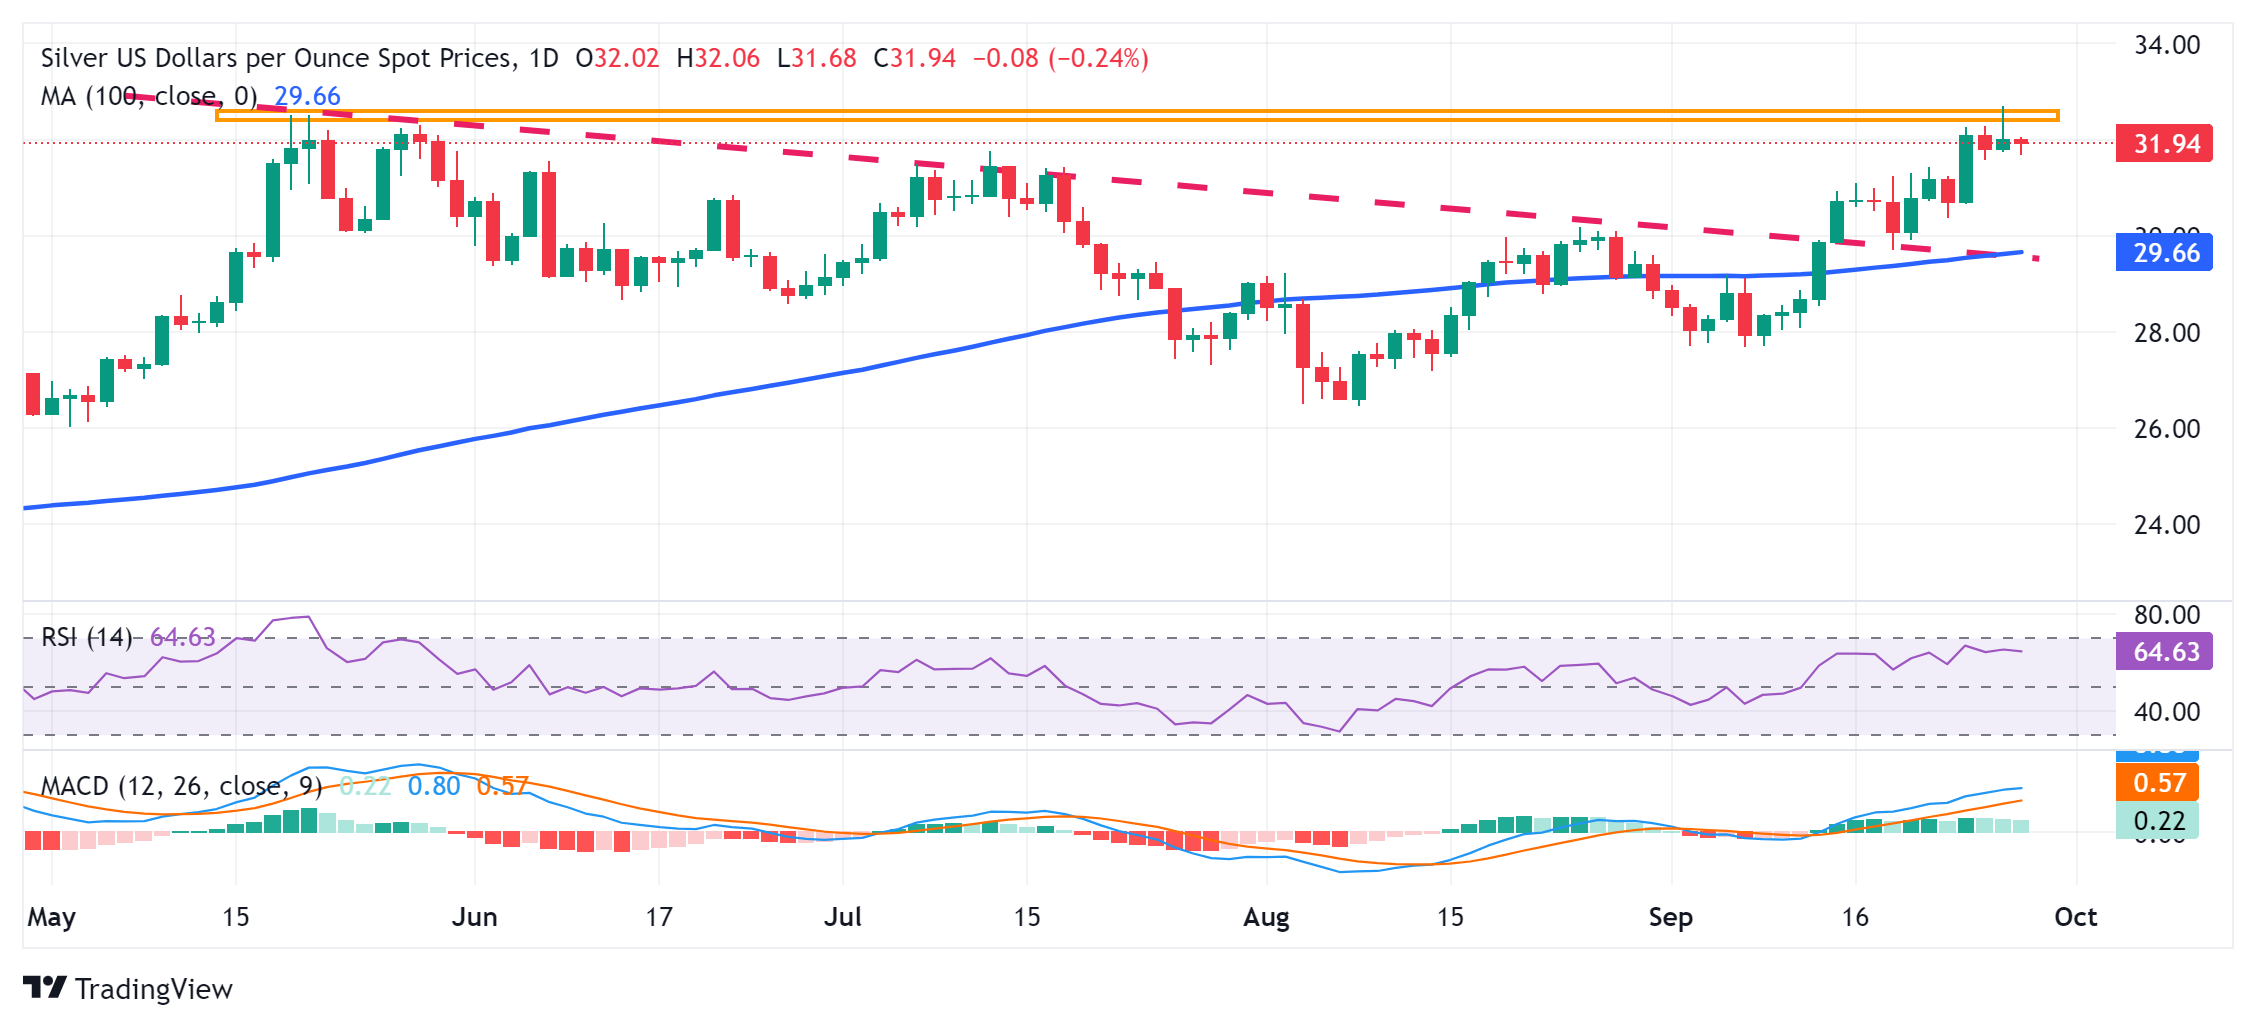
Silver FAQs
Silver is a precious metal highly traded among investors. It has been historically used as a store of value and a medium of exchange. Although less popular than Gold, traders may turn to Silver to diversify their investment portfolio, for its intrinsic value or as a potential hedge during high-inflation periods. Investors can buy physical Silver, in coins or in bars, or trade it through vehicles such as Exchange Traded Funds, which track its price on international markets.
Silver prices can move due to a wide range of factors. Geopolitical instability or fears of a deep recession can make Silver price escalate due to its safe-haven status, although to a lesser extent than Gold's. As a yieldless asset, Silver tends to rise with lower interest rates. Its moves also depend on how the US Dollar (USD) behaves as the asset is priced in dollars (XAG/USD). A strong Dollar tends to keep the price of Silver at bay, whereas a weaker Dollar is likely to propel prices up. Other factors such as investment demand, mining supply – Silver is much more abundant than Gold – and recycling rates can also affect prices.
Silver is widely used in industry, particularly in sectors such as electronics or solar energy, as it has one of the highest electric conductivity of all metals – more than Copper and Gold. A surge in demand can increase prices, while a decline tends to lower them. Dynamics in the US, Chinese and Indian economies can also contribute to price swings: for the US and particularly China, their big industrial sectors use Silver in various processes; in India, consumers’ demand for the precious metal for jewellery also plays a key role in setting prices.
Silver prices tend to follow Gold's moves. When Gold prices rise, Silver typically follows suit, as their status as safe-haven assets is similar. The Gold/Silver ratio, which shows the number of ounces of Silver needed to equal the value of one ounce of Gold, may help to determine the relative valuation between both metals. Some investors may consider a high ratio as an indicator that Silver is undervalued, or Gold is overvalued. On the contrary, a low ratio might suggest that Gold is undervalued relative to Silver.
- EUR/USD edges lower due to market caution ahead of US Personal Consumption Expenditures data release on Friday.
- Fed Governor Lisa Cook has expressed support for last week's 50 basis point rate cut, pointing to heightened "downside risks" to employment.
- Traders await speeches from ECB’s Philip Lane and Piero Cipollone scheduled later in the day.
EUR/USD retraces its recent gains registered in the previous session, trading around 1.1170 during the Asian session on Friday. The US Dollar (USD) receives support as traders adopt caution ahead of the US Personal Consumption Expenditures (PCE) Price Index data for August. The Fed’s preferred inflation indicator is scheduled to be released later in the North American session.
On the data front, the US Gross Domestic Product Annualized increased at a rate of 3.0% in the second quarter, as estimated, according to the US Bureau of Economic Analysis (BEA) on Thursday. Meanwhile, the GDP Price Index rose 2.5% in the second quarter.
Additionally, US Initial Jobless Claims for the week ending September 20 were reported at 218K, according to the US Department of Labor (DoL). This figure came in below the initial consensus of 225K and was lower than the previous week's revised number of 222K (previously reported as 219K).
However, the US Dollar might have received downward pressure following the dovish remarks from the US Federal Reserve (Fed) officials. Fed Governor Lisa Cook stated on Thursday that she supported last week's 50 basis point (bps) interest rate cut, citing increased "downside risks" to employment, according to Reuters.
European Central Bank (ECB) Chief Economist Philip Lane will likely to deliver the opening remarks at a conference focused on Fiscal Policy, Financial Sector Policy, and Economic Growth in Dublin, Ireland. Meanwhile, ECB board member Piero Cipollone will give a keynote speech at the "Economics of Payments XIII" conference, organized by the Austrian Central Bank.
Euro FAQs
The Euro is the currency for the 20 European Union countries that belong to the Eurozone. It is the second most heavily traded currency in the world behind the US Dollar. In 2022, it accounted for 31% of all foreign exchange transactions, with an average daily turnover of over $2.2 trillion a day. EUR/USD is the most heavily traded currency pair in the world, accounting for an estimated 30% off all transactions, followed by EUR/JPY (4%), EUR/GBP (3%) and EUR/AUD (2%).
The European Central Bank (ECB) in Frankfurt, Germany, is the reserve bank for the Eurozone. The ECB sets interest rates and manages monetary policy. The ECB’s primary mandate is to maintain price stability, which means either controlling inflation or stimulating growth. Its primary tool is the raising or lowering of interest rates. Relatively high interest rates – or the expectation of higher rates – will usually benefit the Euro and vice versa. The ECB Governing Council makes monetary policy decisions at meetings held eight times a year. Decisions are made by heads of the Eurozone national banks and six permanent members, including the President of the ECB, Christine Lagarde.
Eurozone inflation data, measured by the Harmonized Index of Consumer Prices (HICP), is an important econometric for the Euro. If inflation rises more than expected, especially if above the ECB’s 2% target, it obliges the ECB to raise interest rates to bring it back under control. Relatively high interest rates compared to its counterparts will usually benefit the Euro, as it makes the region more attractive as a place for global investors to park their money.
Data releases gauge the health of the economy and can impact on the Euro. Indicators such as GDP, Manufacturing and Services PMIs, employment, and consumer sentiment surveys can all influence the direction of the single currency. A strong economy is good for the Euro. Not only does it attract more foreign investment but it may encourage the ECB to put up interest rates, which will directly strengthen the Euro. Otherwise, if economic data is weak, the Euro is likely to fall. Economic data for the four largest economies in the euro area (Germany, France, Italy and Spain) are especially significant, as they account for 75% of the Eurozone’s economy.
Another significant data release for the Euro is the Trade Balance. This indicator measures the difference between what a country earns from its exports and what it spends on imports over a given period. If a country produces highly sought after exports then its currency will gain in value purely from the extra demand created from foreign buyers seeking to purchase these goods. Therefore, a positive net Trade Balance strengthens a currency and vice versa for a negative balance.
- GBP/USD attracts some sellers on Friday and is pressured by a modest USD strength.
- Bets for another oversized Fed rate cut in November should cap gains for the buck.
- A relatively hawkish BoE expectations should contribute to limiting losses for the pair.
The GBP/USD pair drifts lower during the Asian session on Friday and moves away from its highest levels since March 2022, around the 1.3435 region touched the previous day. Spot prices slide below the 1.3400 mark in the last hour amid a modest US Dollar (USD) uptick, though any meaningful corrective decline still seems elusive.
The Greenback attracts some buyers and reverses a part of the previous day's losses amid some repositioning trade ahead of the crucial US inflation data – the Personal Consumption Expenditure (PCE) Price Index due later today. In the meantime, rising bets for a more aggressive policy easing by the Federal Reserve (Fed), along with the upbeat market mood, should cap the upside for the safe-haven buck.
Despite the fact that several Federal Reserve (Fed) officials this week tried to push back against bets for a more aggressive policy easing, the markets are pricing in a greater chance of another oversized rate cut in November. This overshadowed Thursday's better-than-expected US macro data and should hold back the USD bulls from placing fresh bets, which, in turn, should lend support to the GBP/USD pair.
Meanwhile, the global risk sentiment remains supported by hopes that interest rate cuts will boost global economic activity. Adding to this, a slew of stimulus measures from the People's Bank of China (PBOC), including Friday's announcement to cut the seven-day repo rate to 1.5% from 1.7% and lower the Reserve Requirement Ratio (RRR) by 50 bps, further boosts investors' appetite for riskier assets.
Furthermore, expectations that the Bank of England's (BoE) rate-cutting cycle is likely to be slower than in the United States (US) should continue to underpin the British Pound (GBP) and contribute to limiting losses for the GBP/USD pair. This makes it prudent to wait for strong follow-through selling before confirming a near-term top for the major, which remains on track to end the week on a positive note.
Pound Sterling FAQs
The Pound Sterling (GBP) is the oldest currency in the world (886 AD) and the official currency of the United Kingdom. It is the fourth most traded unit for foreign exchange (FX) in the world, accounting for 12% of all transactions, averaging $630 billion a day, according to 2022 data. Its key trading pairs are GBP/USD, aka ‘Cable’, which accounts for 11% of FX, GBP/JPY, or the ‘Dragon’ as it is known by traders (3%), and EUR/GBP (2%). The Pound Sterling is issued by the Bank of England (BoE).
The single most important factor influencing the value of the Pound Sterling is monetary policy decided by the Bank of England. The BoE bases its decisions on whether it has achieved its primary goal of “price stability” – a steady inflation rate of around 2%. Its primary tool for achieving this is the adjustment of interest rates. When inflation is too high, the BoE will try to rein it in by raising interest rates, making it more expensive for people and businesses to access credit. This is generally positive for GBP, as higher interest rates make the UK a more attractive place for global investors to park their money. When inflation falls too low it is a sign economic growth is slowing. In this scenario, the BoE will consider lowering interest rates to cheapen credit so businesses will borrow more to invest in growth-generating projects.
Data releases gauge the health of the economy and can impact the value of the Pound Sterling. Indicators such as GDP, Manufacturing and Services PMIs, and employment can all influence the direction of the GBP. A strong economy is good for Sterling. Not only does it attract more foreign investment but it may encourage the BoE to put up interest rates, which will directly strengthen GBP. Otherwise, if economic data is weak, the Pound Sterling is likely to fall.
Another significant data release for the Pound Sterling is the Trade Balance. This indicator measures the difference between what a country earns from its exports and what it spends on imports over a given period. If a country produces highly sought-after exports, its currency will benefit purely from the extra demand created from foreign buyers seeking to purchase these goods. Therefore, a positive net Trade Balance strengthens a currency and vice versa for a negative balance.
- The Japanese Yen loses ground after the release of Tokyo CPI inflation data on Friday.
- The Tokyo Consumer Price Index rose 2.2% YoY in September, down from August’s 2.6% increase.
- The US Dollar receives downward pressure from dovish Fedspeak.
The Japanese Yen (JPY) extends its downside for the third successive session following the Tokyo Consumer Price Index (CPI) data released on Friday. The JPY faces challenges as traders expect the BoJ to ponder before further rate hikes.
The Tokyo Consumer Price Index (CPI) increased 2.2% year-over-year in September, down from a 2.6% rise in August. Meanwhile, the CPI excluding fresh food and energy climbed 1.6% YoY in September, unchanged from the previous reading. The CPI excluding fresh food increased 2.0% as expected, compared to the previous rise of 2.4%.
The US Dollar could face pressure following dovish remarks from Federal Reserve officials. Traders are now expected to closely monitor the US Personal Consumption Expenditures (PCE) Price Index data for August, the Fed’s preferred inflation indicator, on Friday for fresh impetus, which is scheduled for release later in the North American session.
Daily Digest Market Movers: Japanese Yen extends losses amid doubts over BoJ policy outlook
- According to Reuters, Fed Governor Lisa Cook stated on Thursday that she supported last week's 50 basis points (bps) interest rate cut, citing increased "downside risks" to employment.
- US Gross Domestic Product Annualized increased at a rate of 3.0% in the second quarter, as previously estimated, according to the US Bureau of Economic Analysis (BEA) on Thursday. Meanwhile, the GDP Price Index rose 2.5% in the second quarter.
- US Initial Jobless Claims for the week ending September 20 were reported at 218K, according to the US Department of Labor (DoL). This figure came in below the initial consensus of 225K and was lower than the previous week's revised number of 222K (previously reported as 219K).
- On Thursday, the BoJ Monetary Policy Meeting Minutes expressed the members’ consensus on the importance of remaining vigilant regarding the risks of inflation exceeding targets. Several members indicated that raising rates to 0.25% would be suitable as a way to adjust the level of monetary support. A few others suggested that a moderate adjustment to monetary support would also be appropriate.
- Federal Reserve Governor Adriana Kugler said on Wednesday that she “strongly supported” the Fed’s decision to cut the interest rates by a half point last week. Kugler further stated that it will be appropriate to make additional rate cuts if inflation continues to ease as expected, per Bloomberg.
- US Consumer Confidence Index fell to 98.7 in September from a revised 105.6 in August. This figure registered the biggest decline since August 2021.
- On Tuesday, BoJ Governor Kazuo Ueda indicated that the central bank has time to evaluate market and economic conditions before making any policy adjustments, signaling that there is no urgency to raise interest rates again. Ueda also noted that Japan's real interest rate remains deeply negative, which is helping to stimulate the economy and drive up prices.
Technical Analysis: USD/JPY holds position above 145.00, nine-day EMA
USD/JPY trades around 145.10 on Friday. Analysis of the daily chart shows that the pair is moving upwards within an ascending channel, indicating a bullish bias. Additionally, the 14-day Relative Strength Index (RSI) remains slightly above the 50 level, confirming an emergence of a bullish sentiment.
On the upside, the ongoing bullish bias could lead the USD/JPY pair may explore the region around the upper boundary of the ascending channel at 146.90 level, followed by its five-week high of 147.21 level, which was recorded on September 3.
In terms of support, the USD/JPY pair may test the nine-day Exponential Moving Average (EMA) at the level of 143.89, aligned with the lower boundary of the ascending channel.
USD/JPY: Daily Chart
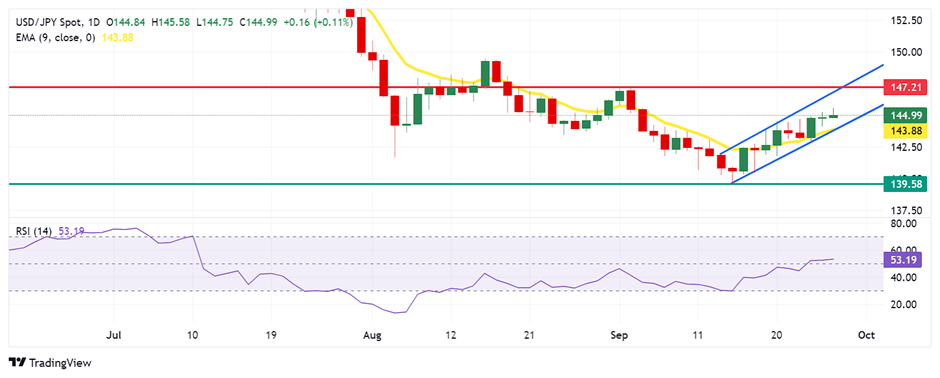
Japanese Yen PRICE Today
The table below shows the percentage change of Japanese Yen (JPY) against listed major currencies today. Japanese Yen was the weakest against the US Dollar.
| USD | EUR | GBP | JPY | CAD | AUD | NZD | CHF | |
|---|---|---|---|---|---|---|---|---|
| USD | 0.06% | 0.15% | 0.13% | 0.17% | 0.28% | 0.33% | 0.02% | |
| EUR | -0.06% | 0.08% | 0.05% | 0.07% | 0.22% | 0.25% | -0.02% | |
| GBP | -0.15% | -0.08% | 0.00% | 0.00% | 0.14% | 0.19% | -0.10% | |
| JPY | -0.13% | -0.05% | 0.00% | 0.03% | 0.16% | 0.20% | -0.07% | |
| CAD | -0.17% | -0.07% | -0.00% | -0.03% | 0.10% | 0.18% | -0.13% | |
| AUD | -0.28% | -0.22% | -0.14% | -0.16% | -0.10% | 0.06% | -0.25% | |
| NZD | -0.33% | -0.25% | -0.19% | -0.20% | -0.18% | -0.06% | -0.29% | |
| CHF | -0.02% | 0.02% | 0.10% | 0.07% | 0.13% | 0.25% | 0.29% |
The heat map shows percentage changes of major currencies against each other. The base currency is picked from the left column, while the quote currency is picked from the top row. For example, if you pick the Japanese Yen from the left column and move along the horizontal line to the US Dollar, the percentage change displayed in the box will represent JPY (base)/USD (quote).
Japanese Yen FAQs
The Japanese Yen (JPY) is one of the world’s most traded currencies. Its value is broadly determined by the performance of the Japanese economy, but more specifically by the Bank of Japan’s policy, the differential between Japanese and US bond yields, or risk sentiment among traders, among other factors.
One of the Bank of Japan’s mandates is currency control, so its moves are key for the Yen. The BoJ has directly intervened in currency markets sometimes, generally to lower the value of the Yen, although it refrains from doing it often due to political concerns of its main trading partners. The current BoJ ultra-loose monetary policy, based on massive stimulus to the economy, has caused the Yen to depreciate against its main currency peers. This process has exacerbated more recently due to an increasing policy divergence between the Bank of Japan and other main central banks, which have opted to increase interest rates sharply to fight decades-high levels of inflation.
The BoJ’s stance of sticking to ultra-loose monetary policy has led to a widening policy divergence with other central banks, particularly with the US Federal Reserve. This supports a widening of the differential between the 10-year US and Japanese bonds, which favors the US Dollar against the Japanese Yen.
The Japanese Yen is often seen as a safe-haven investment. This means that in times of market stress, investors are more likely to put their money in the Japanese currency due to its supposed reliability and stability. Turbulent times are likely to strengthen the Yen’s value against other currencies seen as more risky to invest in.
- NZD/USD drifts lower amid a modest USD uptick, though the downside seems limited.
- The optimism over additional stimulus from China should act as a tailwind for the Kiwi.
- Dovish Fed expectations to cap the USD and lend some support to the currency pair.
The NZD/USD pair attracts some sellers near the 0.6335 region during the Asian session on Friday and reverses a part of the previous day's strong move up. Spot prices currently trade around the 0.6300 mark, down 0.30% for the day, though remain within the striking distance of the YTD peak touched earlier this week.
The US Dollar (USD) ticks higher in a familiar range amid some repositioning ahead of the crucial US inflation data and turns out to be a key factor exerting some downward pressure on the NZD/USD pair. The US Personal Consumption Expenditure (PCE) Price Index is due for release later today and will be looked upon for cues about the Federal Reserve's (Fed) rate-cut path. This, in turn, will play a key role in influencing the near-term USD price dynamics and provide some meaningful impetus to the currency pair.
Heading into the key data risk, bets for a more aggressive policy easing by the Fed might keep the buck confined in a familiar range held over the past two weeks or so and closer to the YTD low touched last week. In fact, the markets are currently pricing in over a 50% chance for another oversized interest rate cut at the next FOMC policy meeting in November. This overshadowed Thursday's better-than-expected US macro data, which, along with the upbeat market mood, should cap the upside for the safe-haven buck.
Investors continue to cheer a slew of stimulus measures announced by the People's Bank of China (PBOC) this week, including Friday's announcement to cut the seven-day repo rate to 1.5% from 1.7% and lower the Reserve Requirement Ratio (RRR) by 50 bps. Furthermore, the hopes that interest rate cuts will boost global economic activity continue to fuel the risk-on rally across the global equity markets. This, in turn, warrants some caution before positioning for any further intraday depreciating move for the NZD/USD pair.
New Zealand Dollar FAQs
The New Zealand Dollar (NZD), also known as the Kiwi, is a well-known traded currency among investors. Its value is broadly determined by the health of the New Zealand economy and the country’s central bank policy. Still, there are some unique particularities that also can make NZD move. The performance of the Chinese economy tends to move the Kiwi because China is New Zealand’s biggest trading partner. Bad news for the Chinese economy likely means less New Zealand exports to the country, hitting the economy and thus its currency. Another factor moving NZD is dairy prices as the dairy industry is New Zealand’s main export. High dairy prices boost export income, contributing positively to the economy and thus to the NZD.
The Reserve Bank of New Zealand (RBNZ) aims to achieve and maintain an inflation rate between 1% and 3% over the medium term, with a focus to keep it near the 2% mid-point. To this end, the bank sets an appropriate level of interest rates. When inflation is too high, the RBNZ will increase interest rates to cool the economy, but the move will also make bond yields higher, increasing investors’ appeal to invest in the country and thus boosting NZD. On the contrary, lower interest rates tend to weaken NZD. The so-called rate differential, or how rates in New Zealand are or are expected to be compared to the ones set by the US Federal Reserve, can also play a key role in moving the NZD/USD pair.
Macroeconomic data releases in New Zealand are key to assess the state of the economy and can impact the New Zealand Dollar’s (NZD) valuation. A strong economy, based on high economic growth, low unemployment and high confidence is good for NZD. High economic growth attracts foreign investment and may encourage the Reserve Bank of New Zealand to increase interest rates, if this economic strength comes together with elevated inflation. Conversely, if economic data is weak, NZD is likely to depreciate.
The New Zealand Dollar (NZD) tends to strengthen during risk-on periods, or when investors perceive that broader market risks are low and are optimistic about growth. This tends to lead to a more favorable outlook for commodities and so-called ‘commodity currencies’ such as the Kiwi. Conversely, NZD tends to weaken at times of market turbulence or economic uncertainty as investors tend to sell higher-risk assets and flee to the more-stable safe havens.
| Raw materials | Closed | Change, % |
|---|---|---|
| Silver | 32.004 | 0.64 |
| Gold | 267.202 | 0.52 |
| Palladium | 1047.26 | 0.61 |
- WTI trades in negative territory for the third consecutive day near $67.00 in Friday’s Asian session.
- The prospect of more oil output drags the WTI price lower.
- The Chinese fresh stimulus plans help limit the WTI’s losses.
West Texas Intermediate (WTI), the US crude oil benchmark, is trading around $71.30 on Friday. WTI price edges lower as Saudi Arabia is committed to pressing ahead with output increases later this year.
Saudi Arabia is ready to abandon its unofficial price target of $100 a barrel for crude oil as it prepares to increase production, even if the move results in a prolonged period of low oil prices, per the Financial Times.
Furthermore, the expectation that oil production in Libya will rise after rival political factions agreed to appoint a new central bank governor on Thursday exerts some selling pressure on the WTI price. "The prospect of additional supply from Libya and Saudi Arabia has been the main driver behind the latest weakness," said Ole Hansen, an analyst at Saxo Bank.
On the other hand, the downside of the black gold might be limited as Chinese officials announced a fresh stimulus package earlier this week. The prospect of higher Chinese demand due to the recent measures could lift the WTI price as China is the world’s largest crude importer and second-largest consumer.
On Friday, the People's Bank of China (PBOC) cut the seven-day repo rate to 1.5% from 1.7% on Friday. Additionally, the Chinese central bank announced to cut the amount of the reserve requirement ratio (RRR), the required minimum capital banks must hold in reserve, by 50 basis points (bps).
WTI Oil FAQs
WTI Oil is a type of Crude Oil sold on international markets. The WTI stands for West Texas Intermediate, one of three major types including Brent and Dubai Crude. WTI is also referred to as “light” and “sweet” because of its relatively low gravity and sulfur content respectively. It is considered a high quality Oil that is easily refined. It is sourced in the United States and distributed via the Cushing hub, which is considered “The Pipeline Crossroads of the World”. It is a benchmark for the Oil market and WTI price is frequently quoted in the media.
Like all assets, supply and demand are the key drivers of WTI Oil price. As such, global growth can be a driver of increased demand and vice versa for weak global growth. Political instability, wars, and sanctions can disrupt supply and impact prices. The decisions of OPEC, a group of major Oil-producing countries, is another key driver of price. The value of the US Dollar influences the price of WTI Crude Oil, since Oil is predominantly traded in US Dollars, thus a weaker US Dollar can make Oil more affordable and vice versa.
The weekly Oil inventory reports published by the American Petroleum Institute (API) and the Energy Information Agency (EIA) impact the price of WTI Oil. Changes in inventories reflect fluctuating supply and demand. If the data shows a drop in inventories it can indicate increased demand, pushing up Oil price. Higher inventories can reflect increased supply, pushing down prices. API’s report is published every Tuesday and EIA’s the day after. Their results are usually similar, falling within 1% of each other 75% of the time. The EIA data is considered more reliable, since it is a government agency.
OPEC (Organization of the Petroleum Exporting Countries) is a group of 13 Oil-producing nations who collectively decide production quotas for member countries at twice-yearly meetings. Their decisions often impact WTI Oil prices. When OPEC decides to lower quotas, it can tighten supply, pushing up Oil prices. When OPEC increases production, it has the opposite effect. OPEC+ refers to an expanded group that includes ten extra non-OPEC members, the most notable of which is Russia.
- Gold price climbed to a fresh all-time peak on Thursday amid dovish Fed expectations.
- The USD languished near the YTD low and shrugged off Thursday’s upbeat US data.
- The upbeat market mood caps the XAU/USD ahead of the key US PCE Price Index.
Gold price (XAU/USD) extended its record-breaking run for the fifth straight day on Thursday amid the emergence of fresh US Dollar (USD) selling. Despite the fact that several Federal Reserve (Fed) officials this week tried to push back against bets for a more aggressive policy easing, the markets are still pricing in a greater chance of another oversized rate cut in November. This overshadowed the better-than-expected US macro data and weighed heavily on the buck, benefiting the non-yielding yellow metal.
Apart from this, persistent geopolitical tensions stemming from the ongoing conflicts in the Middle East continue to drive haven flows and turn out to be another factor acting as a tailwind for the Gold price. That said, the prevalent risk-on mood across the global equity markets – bolstered by China's stimulus measures – caps any further gains for the XAU/USD. Investors also seem reluctant and prefer to wait on the sidelines ahead of Friday's release of the US Personal Consumption Expenditure (PCE) Price Index.
Daily Digest Market Movers: Gold price bulls turn cautious amid risk-on mood, ahead of US PCE Price Index
- Federal Reserve Governor Michelle Bowman again defended her decision to vote against the oversized rate cut in September and said that the upside risk to inflation is still prominent.
- Earlier this week, Atlanta Fed President Raphael Bostic warned that the central bank needn't go on a mad dash to lower rates, while other Fed officials left the door open for large rate cuts.
- Fed Governor Lisa Cook said on Thursday that she endorsed the 50 basis points rate cut last week as upside risks to inflation have diminished and increasing downside risks to employment.
- According to the CME Group's FedWatch Tool, market participants see over a 50% chance that the Fed will lower borrowing costs by 50 basis points at the November policy meeting.
- Data released by the Bureau of Economic Analysis (BEA) on Thursday showed that the US economy grew at a 3% annual rate in the second quarter, matching the original estimates.
- Separately, the US Census Bureau reported that new orders for manufactured durable goods stagnated in August, while orders excluding transportation items rose 0.5% last month.
- Adding to this, the US Labor Department said that initial claims for state unemployment benefits dropped to 218,000 for the week ended September 21 – marking the lowest since mid-May.
- The data did provide some intraday respite to the US Dollar bulls, though the initial market reaction turned out to be short-lived in the wake of dovish Fed expectations.
- Apart from this, the risk of a further escalation of geopolitical tensions in the Middle East and a broader regional conflict lifts the safe-haven Gold price to a fresh record high.
- Meanwhile, interest rate cut is expected to boost global economic activity, which, along with stimulus measures from China, fuels the risk-on rally and caps the XAU/USD.
- The People's Bank of China (PBOC) cut the seven-day repo rate to 1.5% from 1.7% and lowered the amount of the Reserve Requirement Ratio (RRR) by 50 bps on Friday.
- Friday's release of the US Personal Consumption Expenditure Price Index might provide some impetus to the metal, which remains on track to register a third straight week of gains.
Technical Outlook: Gold price consolidates before the next leg up, dips to $2,625 might be bought into
From a technical perspective, the Relative Strength Index (RSI) on the daily chart has been flashing overbought conditions and holding back bulls from placing fresh bets around the XAU/USD. That said, the recent breakout through a short-term ascending trend channel suggests that the path of least resistance for the Gold price is to the upside. Bulls, however, need to wait for some near-term consolidation or a modest pullback before positioning for an extension of the recent well-established uptrend.
Meanwhile, any meaningful dip could be seen as a buying opportunity near the channel resistance breakpoint, around the $2,625 region. This, in turn, should help limit the downside for the commodity near the $2,600 mark. The latter should act as a key pivotal point, which if broken decisively should pave the way for some meaningful downside in the near term.
Gold FAQs
Gold has played a key role in human’s history as it has been widely used as a store of value and medium of exchange. Currently, apart from its shine and usage for jewelry, the precious metal is widely seen as a safe-haven asset, meaning that it is considered a good investment during turbulent times. Gold is also widely seen as a hedge against inflation and against depreciating currencies as it doesn’t rely on any specific issuer or government.
Central banks are the biggest Gold holders. In their aim to support their currencies in turbulent times, central banks tend to diversify their reserves and buy Gold to improve the perceived strength of the economy and the currency. High Gold reserves can be a source of trust for a country’s solvency. Central banks added 1,136 tonnes of Gold worth around $70 billion to their reserves in 2022, according to data from the World Gold Council. This is the highest yearly purchase since records began. Central banks from emerging economies such as China, India and Turkey are quickly increasing their Gold reserves.
Gold has an inverse correlation with the US Dollar and US Treasuries, which are both major reserve and safe-haven assets. When the Dollar depreciates, Gold tends to rise, enabling investors and central banks to diversify their assets in turbulent times. Gold is also inversely correlated with risk assets. A rally in the stock market tends to weaken Gold price, while sell-offs in riskier markets tend to favor the precious metal.
The price can move due to a wide range of factors. Geopolitical instability or fears of a deep recession can quickly make Gold price escalate due to its safe-haven status. As a yield-less asset, Gold tends to rise with lower interest rates, while higher cost of money usually weighs down on the yellow metal. Still, most moves depend on how the US Dollar (USD) behaves as the asset is priced in dollars (XAU/USD). A strong Dollar tends to keep the price of Gold controlled, whereas a weaker Dollar is likely to push Gold prices up.
- The Australian Dollar may regain ground due to improved market sentiment amid China’s stimulus measures.
- Australian Treasurer Jim Chalmers welcomed China's new stimulus measures as a "really welcome development."
- Higher US Treasury yields contribute support for the US Dollar.
The Australian Dollar (AUD) edges lower against the US Dollar (USD) on Friday. The AUD/USD pair receives downward pressure from stable Greenback amid improved US Treasury yields. However, the downside of the risk-sensitive AUD could be retrained as news of further stimulus from China, its largest trading partner, lifted market sentiment globally.
Australian Treasurer Jim Chalmers is currently in China to strengthen economic ties between the two nations. During his visit, Chalmers held candid and productive discussions with the National Development and Reform Commission (NDRC). He highlighted China's economic slowdown as a key factor in weaker global growth while welcoming the country's new stimulus measures as a "really welcome development."
The US Dollar could face pressure following dovish remarks from Federal Reserve officials. Fed Governor Lisa Cook stated on Thursday that she supported last week's 50 basis points (bps) interest rate cut, citing increased "downside risks" to employment, according to Reuters.
Traders are now expected to closely monitor the US Personal Consumption Expenditures (PCE) Price Index data for August, which is scheduled for release later in the North American session.
Daily Digest Market Movers: Australian Dollar edges lower despite a positive market sentiment
- US Gross Domestic Product Annualized increased at a rate of 3.0% in the second quarter, as previously estimated, according to the US Bureau of Economic Analysis (BEA) on Thursday. Meanwhile, GDP Price Index rose 2.5% in the second quarter.
- US Initial Jobless Claims for the week ending September 20 were reported at 218K, according to the US Department of Labor (DoL). This figure came in below the initial consensus of 225K and was lower than the previous week's revised number of 222K (previously reported as 219K).
- China plans to inject over CNY 1 trillion in capital into its largest state banks, facing challenges such as shrinking margins, declining profits, and increasing bad loans. This substantial capital infusion would mark the first of its kind since the 2008 global financial crisis.
- According to the Reserve Bank of Australia's Financial Stability Review from September 2024, the Australian financial system remains resilient, with risks largely contained. However, notable concerns include stress in China's financial sector and the limited response from Beijing to address these issues. Domestically, a small but growing portion of Australian home borrowers are falling behind on their payments, though only about 2% of owner-occupier borrowers are at serious risk of default.
- The Commonwealth Bank of Australia (CBA) anticipates that the RBA must revise its consumption forecasts downward in November. The RBA has already acknowledged downside risks to its current outlook. This potential revision, combined with expectations of a further rise in unemployment and trimmed mean inflation aligning with CBA's forecasts, could position the RBA to implement rate cuts before the end of the year.
- Federal Reserve Governor Adriana Kugler said on Wednesday that she “strongly supported” the Fed’s decision to cut the interest rates by a half point last week. Kugler further stated that it will be appropriate to make additional rate cuts if inflation continues to ease as expected, per Bloomberg.
- In a recent note, JP Morgan advised investors to monitor commodities and bond yields in light of the positive market outlook following China's stimulus proposals on Tuesday. The bank emphasized that global growth has received a new boost from China, a factor that has been lacking in recent years. This development notably reduces the risk of a recession and is seen as favorable for the markets. However, JP Morgan also cautioned about the potential risk of reinflation.
- Australia’s Monthly Consumer Price Index rose 2.7% year-over-year in August, down from the previous 3.5% rise and expected 2.8% increase.
Technical Analysis: Australian Dollar hovers around the lower ascending channel boundary near 0.6900
The AUD/USD pair trades near 0.6880 on Friday. Technical analysis of the daily chart shows that the pair is positioned near the lower boundary of an ascending channel pattern, with further movement likely to provide a clearer indication of market bias. Additionally, the 14-day Relative Strength Index (RSI) remains above the 50 level, indicating that bullish sentiment is still holding.
In terms of resistance, the AUD/USD pair could explore the region around the upper boundary of the ascending channel, around the 0.6990 level.
On the downside, a break below the lower boundary of the ascending channel could weaken the bearish bias and lead the AUD/USD pair to test the nine-day Exponential Moving Average (EMA) at the 0.6832 level. The next significant support is at the psychological level of 0.6700, followed by the six-week low of 0.6622.
AUD/USD: Daily Chart
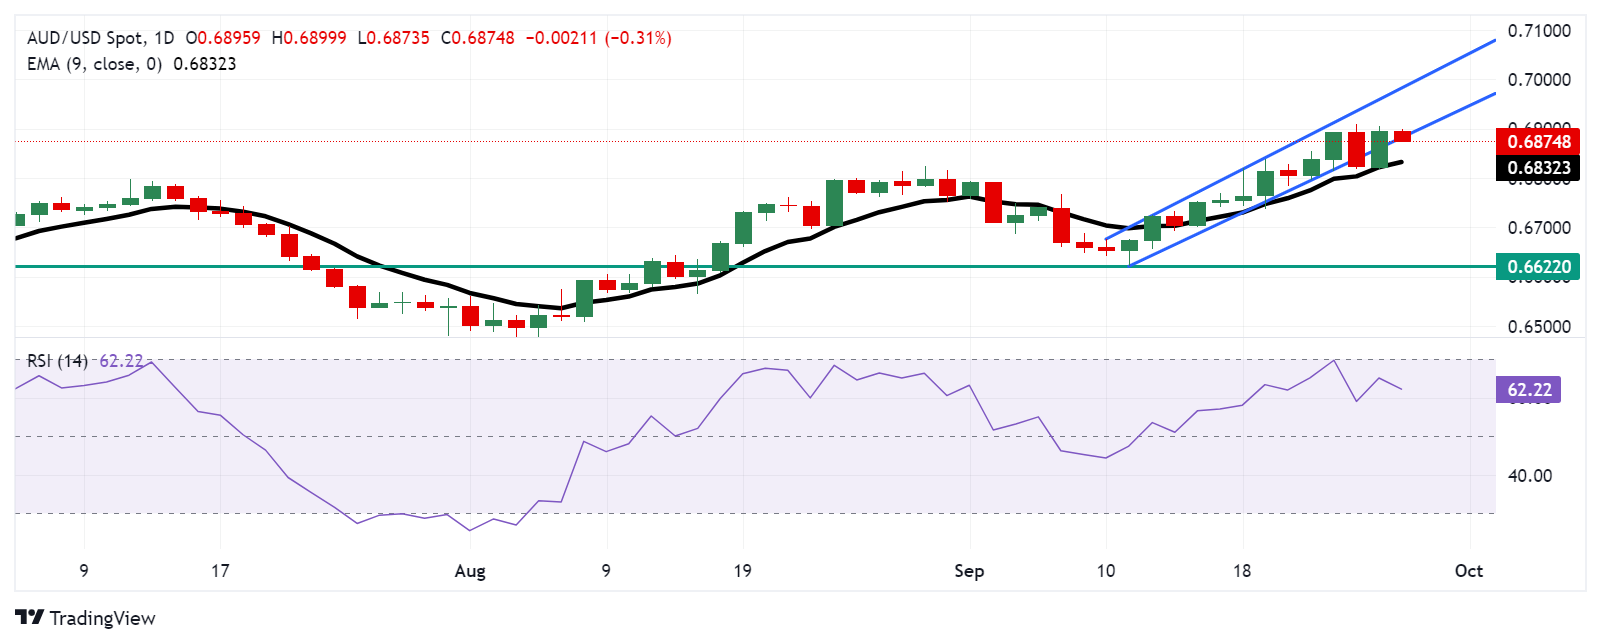
Australian Dollar PRICE Today
The table below shows the percentage change of Australian Dollar (AUD) against listed major currencies today. Australian Dollar was the weakest against the US Dollar.
| USD | EUR | GBP | JPY | CAD | AUD | NZD | CHF | |
|---|---|---|---|---|---|---|---|---|
| USD | 0.12% | 0.21% | 0.35% | 0.20% | 0.32% | 0.35% | 0.15% | |
| EUR | -0.12% | 0.07% | 0.23% | 0.03% | 0.20% | 0.21% | 0.05% | |
| GBP | -0.21% | -0.07% | 0.16% | -0.03% | 0.13% | 0.15% | -0.03% | |
| JPY | -0.35% | -0.23% | -0.16% | -0.16% | -0.01% | 0.00% | -0.15% | |
| CAD | -0.20% | -0.03% | 0.03% | 0.16% | 0.12% | 0.17% | -0.02% | |
| AUD | -0.32% | -0.20% | -0.13% | 0.01% | -0.12% | 0.03% | -0.16% | |
| NZD | -0.35% | -0.21% | -0.15% | -0.00% | -0.17% | -0.03% | -0.18% | |
| CHF | -0.15% | -0.05% | 0.03% | 0.15% | 0.02% | 0.16% | 0.18% |
The heat map shows percentage changes of major currencies against each other. The base currency is picked from the left column, while the quote currency is picked from the top row. For example, if you pick the Australian Dollar from the left column and move along the horizontal line to the US Dollar, the percentage change displayed in the box will represent AUD (base)/USD (quote).
Australian Dollar FAQs
One of the most significant factors for the Australian Dollar (AUD) is the level of interest rates set by the Reserve Bank of Australia (RBA). Because Australia is a resource-rich country another key driver is the price of its biggest export, Iron Ore. The health of the Chinese economy, its largest trading partner, is a factor, as well as inflation in Australia, its growth rate and Trade Balance. Market sentiment – whether investors are taking on more risky assets (risk-on) or seeking safe-havens (risk-off) – is also a factor, with risk-on positive for AUD.
The Reserve Bank of Australia (RBA) influences the Australian Dollar (AUD) by setting the level of interest rates that Australian banks can lend to each other. This influences the level of interest rates in the economy as a whole. The main goal of the RBA is to maintain a stable inflation rate of 2-3% by adjusting interest rates up or down. Relatively high interest rates compared to other major central banks support the AUD, and the opposite for relatively low. The RBA can also use quantitative easing and tightening to influence credit conditions, with the former AUD-negative and the latter AUD-positive.
China is Australia’s largest trading partner so the health of the Chinese economy is a major influence on the value of the Australian Dollar (AUD). When the Chinese economy is doing well it purchases more raw materials, goods and services from Australia, lifting demand for the AUD, and pushing up its value. The opposite is the case when the Chinese economy is not growing as fast as expected. Positive or negative surprises in Chinese growth data, therefore, often have a direct impact on the Australian Dollar and its pairs.
Iron Ore is Australia’s largest export, accounting for $118 billion a year according to data from 2021, with China as its primary destination. The price of Iron Ore, therefore, can be a driver of the Australian Dollar. Generally, if the price of Iron Ore rises, AUD also goes up, as aggregate demand for the currency increases. The opposite is the case if the price of Iron Ore falls. Higher Iron Ore prices also tend to result in a greater likelihood of a positive Trade Balance for Australia, which is also positive of the AUD.
The Trade Balance, which is the difference between what a country earns from its exports versus what it pays for its imports, is another factor that can influence the value of the Australian Dollar. If Australia produces highly sought after exports, then its currency will gain in value purely from the surplus demand created from foreign buyers seeking to purchase its exports versus what it spends to purchase imports. Therefore, a positive net Trade Balance strengthens the AUD, with the opposite effect if the Trade Balance is negative.
- Indian Rupee softens in Friday’s Asian session.
- The month-end importer USD bids and likely position unwinding weigh on the INR.
- The US August PCE Price Index data will take center stage on Friday.
The Indian Rupee (INR) loses momentum on Friday amid the renewed US Dollar (USD) demand from importers related to month-end payments and the likely unwinding of long positions. Nonetheless, a fall in crude oil prices and a robust trend in Indian equities might help limit the INR’s losses.
Investors will closely monitor the release of the US August Personal Consumption Expenditures (PCE) Price Index, the Fed’s preferred inflation indicator, on Friday. The headline PCE is forecast to show an increase of 2.3% YoY in August, while the core PCE is estimated to show a rise of 2.7% YoY in the same report. Also, the Michigan Consumer Sentiment Index for September will be released later in the day.
Daily Digest Market Movers: Indian Rupee declines due to USD demand related to month-end payments
- "Over the week, the (dollar-rupee) pair has opened lower, only to rebound as importers rush to meet month-end dollar demand, causing USD/INR to close higher," said Amit Pabari, managing director at FX advisory firm CR Forex.
- India’s Sensex climbed 666.25 points to settle at an all-time high of 85,836.12, while Nifty rose 211.90 points to hit a record of 26,216.05.
- US Durable Goods Orders were flat in August, compared to a rise of 9.9% in July, according to the US Census Bureau. This figure came in better than the estimation of a decline of 2.6%.
- The US Gross Domestic Product (GDP) increased at an annual rate of 3.0% in the second quarter (Q2), as previously estimated, the US Bureau of Economic Analysis (BEA) showed Thursday.
- Fed Governor Lisa Cook stated on Thursday that she endorsed the 50 bps interest rate cut last week as a way to address increased "downside risks" to employment, per Reuters.
Technical Analysis: USD/INR’s bearish outlook remains intact
The Indian Rupee weakens on the day. Technically, the USD/INR pair maintains a negative view on the daily chart as the price remains capped under the key 100-day Exponential Moving Average (EMA). The downward momentum is reinforced by the 14-day Relative Strength Index (RSI), which is located below the midline near 39.30, suggesting that further downside cannot be ruled out.
The low of September 23 acts as an initial support level for USD/INR. Sustained trading below this level could lead the pair to drop to 83.00, representing the psychological level and the low of May 24.
On the upside, a decisive break above the 100-day EMA at 83.62 could set the pair up for a retest of the support-turned-resistance level at 83.75. The additional upside filter to watch is the 84.00 round mark.
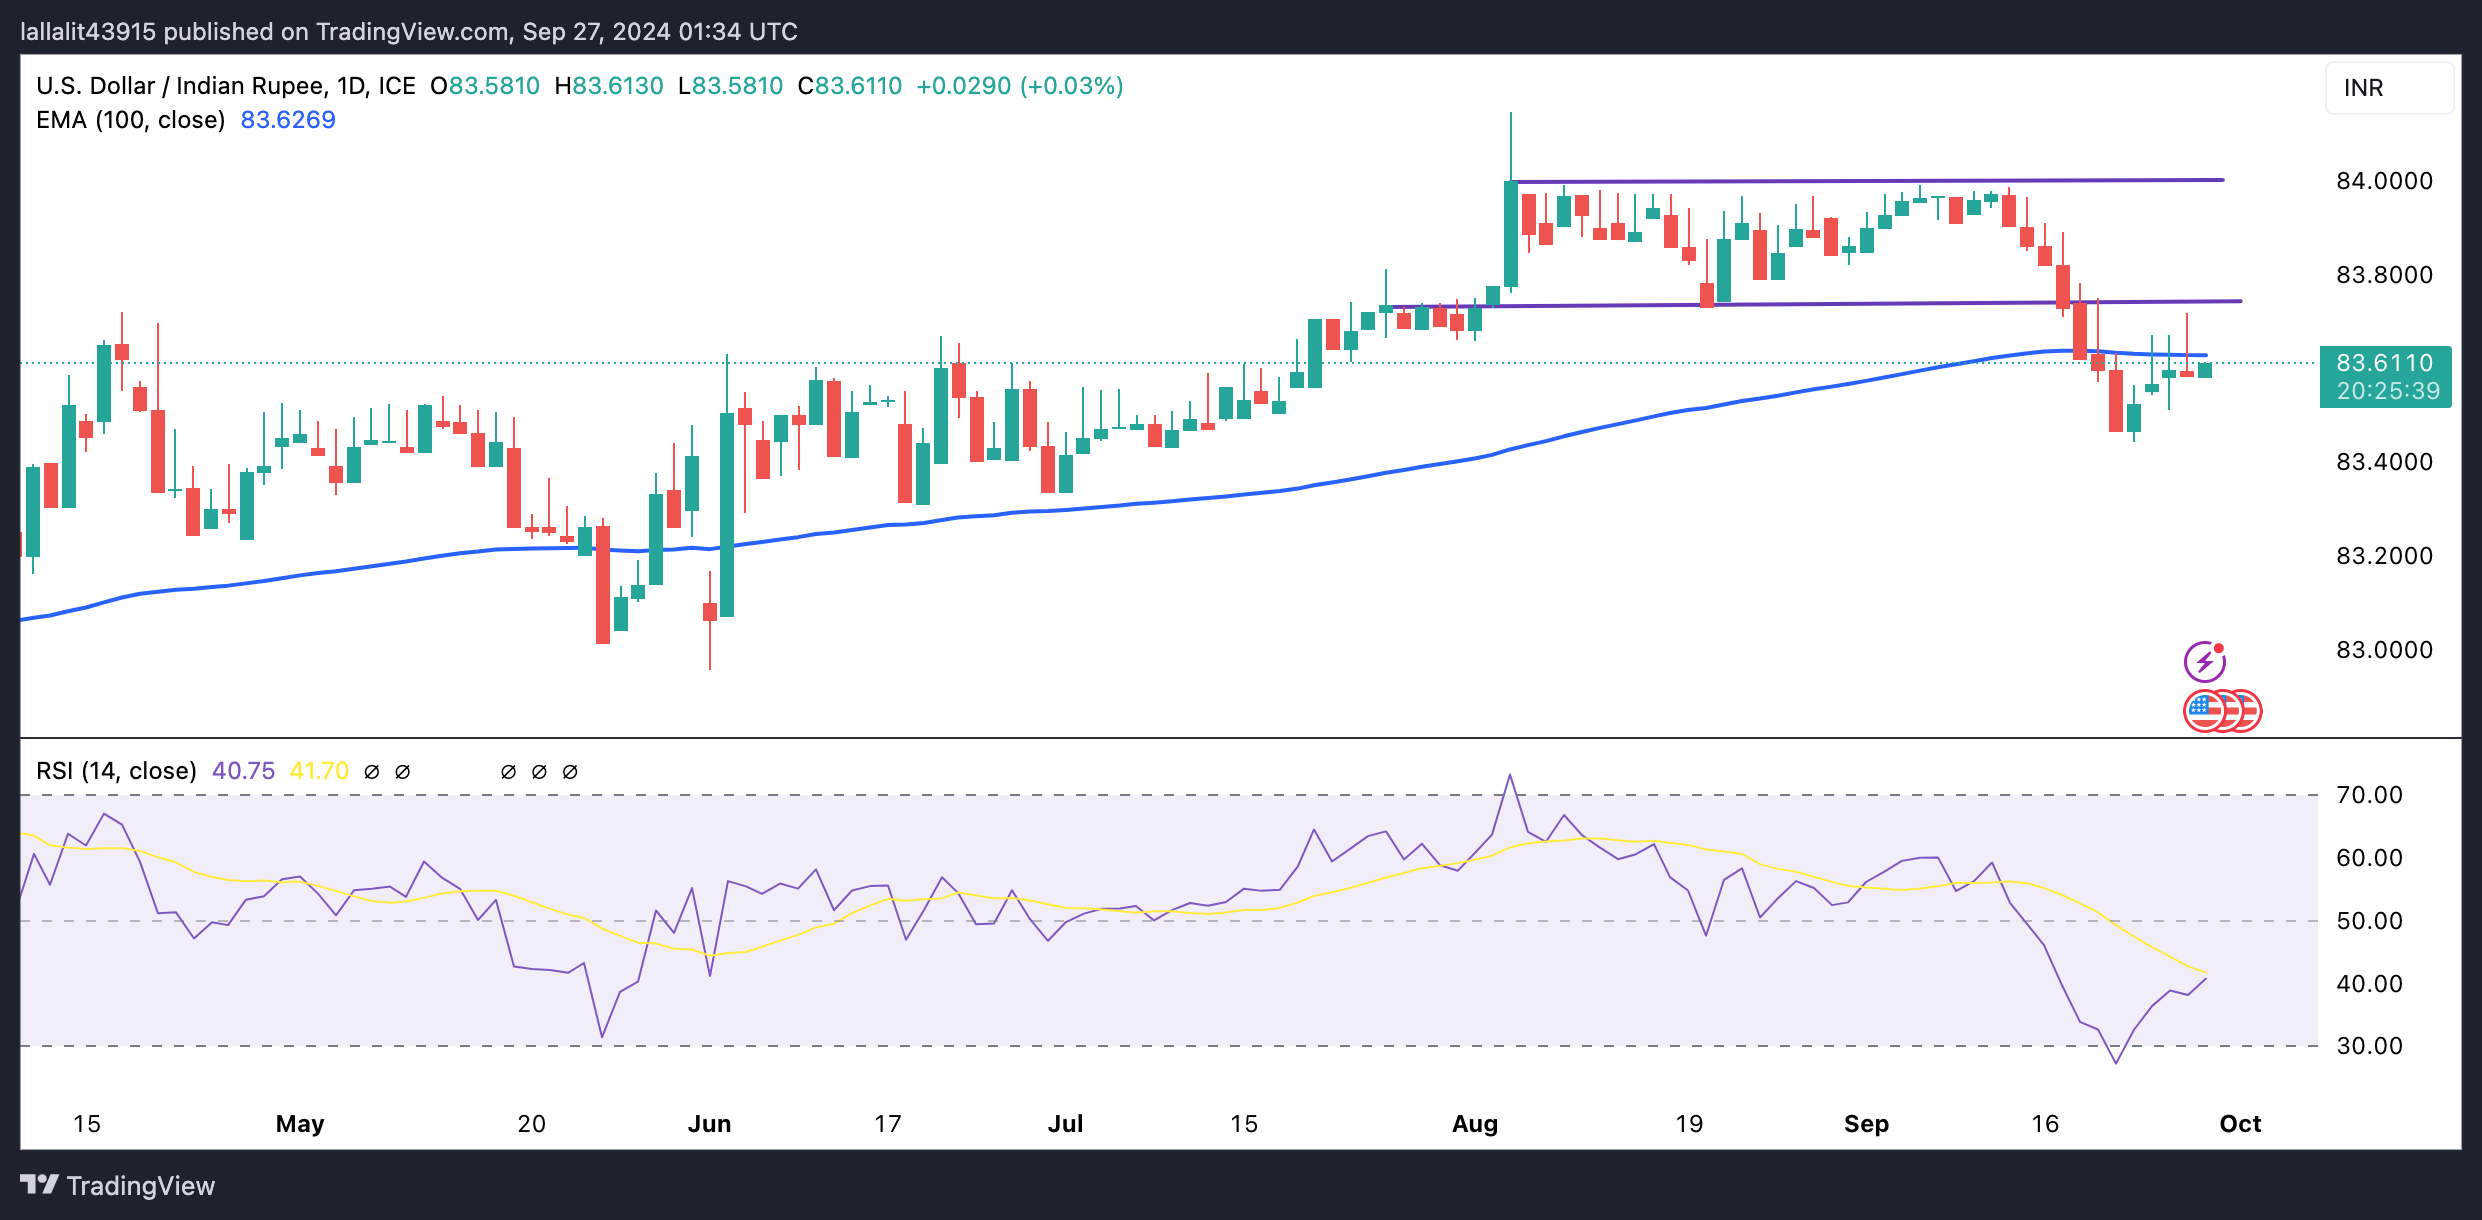
Indian Rupee FAQs
The Indian Rupee (INR) is one of the most sensitive currencies to external factors. The price of Crude Oil (the country is highly dependent on imported Oil), the value of the US Dollar – most trade is conducted in USD – and the level of foreign investment, are all influential. Direct intervention by the Reserve Bank of India (RBI) in FX markets to keep the exchange rate stable, as well as the level of interest rates set by the RBI, are further major influencing factors on the Rupee.
The Reserve Bank of India (RBI) actively intervenes in forex markets to maintain a stable exchange rate, to help facilitate trade. In addition, the RBI tries to maintain the inflation rate at its 4% target by adjusting interest rates. Higher interest rates usually strengthen the Rupee. This is due to the role of the ‘carry trade’ in which investors borrow in countries with lower interest rates so as to place their money in countries’ offering relatively higher interest rates and profit from the difference.
Macroeconomic factors that influence the value of the Rupee include inflation, interest rates, the economic growth rate (GDP), the balance of trade, and inflows from foreign investment. A higher growth rate can lead to more overseas investment, pushing up demand for the Rupee. A less negative balance of trade will eventually lead to a stronger Rupee. Higher interest rates, especially real rates (interest rates less inflation) are also positive for the Rupee. A risk-on environment can lead to greater inflows of Foreign Direct and Indirect Investment (FDI and FII), which also benefit the Rupee.
Higher inflation, particularly, if it is comparatively higher than India’s peers, is generally negative for the currency as it reflects devaluation through oversupply. Inflation also increases the cost of exports, leading to more Rupees being sold to purchase foreign imports, which is Rupee-negative. At the same time, higher inflation usually leads to the Reserve Bank of India (RBI) raising interest rates and this can be positive for the Rupee, due to increased demand from international investors. The opposite effect is true of lower inflation.
The People’s Bank of China (PBoC) set the USD/CNY central rate for the trading session ahead on Friday at 7.0101, as compared to the previous day's fix of 7.0354 and 7.0093 Reuters estimates.
Australia Treasurer Jim Chalmers said on Friday that China's economic slowdown is a crucial factor in weaker growth globally, adding that he sees China's fresh stimulus as a "really welcome development.
Key quotes
China slowdown is a crucial factor in weaker global growth.
China stimulus as a really welcome development.
China's economic weakness has negative impact on Australia.
Sees positive impact on Australia from past Chinese stimulus.
Market reaction
AUD/USD is trading 0.10% lower on the day at 0.6890, as of writing.
Australian Dollar FAQs
One of the most significant factors for the Australian Dollar (AUD) is the level of interest rates set by the Reserve Bank of Australia (RBA). Because Australia is a resource-rich country another key driver is the price of its biggest export, Iron Ore. The health of the Chinese economy, its largest trading partner, is a factor, as well as inflation in Australia, its growth rate and Trade Balance. Market sentiment – whether investors are taking on more risky assets (risk-on) or seeking safe-havens (risk-off) – is also a factor, with risk-on positive for AUD.
The Reserve Bank of Australia (RBA) influences the Australian Dollar (AUD) by setting the level of interest rates that Australian banks can lend to each other. This influences the level of interest rates in the economy as a whole. The main goal of the RBA is to maintain a stable inflation rate of 2-3% by adjusting interest rates up or down. Relatively high interest rates compared to other major central banks support the AUD, and the opposite for relatively low. The RBA can also use quantitative easing and tightening to influence credit conditions, with the former AUD-negative and the latter AUD-positive.
China is Australia’s largest trading partner so the health of the Chinese economy is a major influence on the value of the Australian Dollar (AUD). When the Chinese economy is doing well it purchases more raw materials, goods and services from Australia, lifting demand for the AUD, and pushing up its value. The opposite is the case when the Chinese economy is not growing as fast as expected. Positive or negative surprises in Chinese growth data, therefore, often have a direct impact on the Australian Dollar and its pairs.
Iron Ore is Australia’s largest export, accounting for $118 billion a year according to data from 2021, with China as its primary destination. The price of Iron Ore, therefore, can be a driver of the Australian Dollar. Generally, if the price of Iron Ore rises, AUD also goes up, as aggregate demand for the currency increases. The opposite is the case if the price of Iron Ore falls. Higher Iron Ore prices also tend to result in a greater likelihood of a positive Trade Balance for Australia, which is also positive of the AUD.
The Trade Balance, which is the difference between what a country earns from its exports versus what it pays for its imports, is another factor that can influence the value of the Australian Dollar. If Australia produces highly sought after exports, then its currency will gain in value purely from the surplus demand created from foreign buyers seeking to purchase its exports versus what it spends to purchase imports. Therefore, a positive net Trade Balance strengthens the AUD, with the opposite effect if the Trade Balance is negative.
- USD/JPY gather strength around 145.20 in Friday’s early Asian session, gaining 0.26% on the day.
- Tokyo CPI rose 2.2% YoY in September vs. a 2.6% rise prior.
- The US August core PCE data will be closely monitored.
The USD/JPY pair attracts some buyers to near 145.20 on Friday during the early Asian session. The pair gains ground near three-week highs after the Tokyo Consumer Price Index (CPI). The attention will shift to the US Personal Consumption Expenditures (PCE) Price Index for August, which is due later on Friday.
Data released by the Statistics Bureau of Japan showed on Friday that the headline Tokyo Consumer Price Index (CPI) increased 2.2% YoY in September, compared to a 2.6% rise in August. Meanwhile, the CPI ex Fresh Food, Energy climbed 1.6% YoY in September, compared to a 1.6% rise in the previous reading. Tokyo CPI ex Fresh Food rose 2.0% for the said month, compared to a 2.4% rise in August and in line with the market consensus of 2.0%.
The Japanese Yen (JPY) edges lower in an immediate reaction to Tokyo’s CPI inflation data. The slower price increase is unlikely to deter the Bank of Japan (BoJ) from raising interest rates later this year as BoJ Governor Kazuo Ueda committed to hiking its borrowing costs if the economy performs as expected.
However, uncertainty surrounding Japan’s interest rate path might cap the upside for the JPY and create a tailwind for USD/JPY in the near term. Ueda said this week that the Japanese central bank is not in any rush to raise rates and can wait for more data before making any moves. The BOJ is expected to stand pat on rates at the October meeting.
On the other hand, the Fed delivered a jumbo rate cut last week and signaled another 50 basis points (bps) reductions before year-end. On Thursday, Fed Governor Lisa Cook said that she endorsed the 50 bps interest rate cut last week as a way to address increased "downside risks" to employment. The dovish remarks from the Fed officials are likely to drag the Greenback lower against the JPY in the near term.
Market players will closely watch the release of the US August core Personal Consumption Expenditures (PCE) Price Index, the Fed’s preferred inflation indicator, on Friday for fresh impetus. A surprise upside inflation reading could dampen the rate-cut hopes for the November meeting and provide some support to the US Dollar (USD).
Japanese Yen FAQs
The Japanese Yen (JPY) is one of the world’s most traded currencies. Its value is broadly determined by the performance of the Japanese economy, but more specifically by the Bank of Japan’s policy, the differential between Japanese and US bond yields, or risk sentiment among traders, among other factors.
One of the Bank of Japan’s mandates is currency control, so its moves are key for the Yen. The BoJ has directly intervened in currency markets sometimes, generally to lower the value of the Yen, although it refrains from doing it often due to political concerns of its main trading partners. The current BoJ ultra-loose monetary policy, based on massive stimulus to the economy, has caused the Yen to depreciate against its main currency peers. This process has exacerbated more recently due to an increasing policy divergence between the Bank of Japan and other main central banks, which have opted to increase interest rates sharply to fight decades-high levels of inflation.
The BoJ’s stance of sticking to ultra-loose monetary policy has led to a widening policy divergence with other central banks, particularly with the US Federal Reserve. This supports a widening of the differential between the 10-year US and Japanese bonds, which favors the US Dollar against the Japanese Yen.
The Japanese Yen is often seen as a safe-haven investment. This means that in times of market stress, investors are more likely to put their money in the Japanese currency due to its supposed reliability and stability. Turbulent times are likely to strengthen the Yen’s value against other currencies seen as more risky to invest in.
| Index | Change, points | Closed | Change, % |
|---|---|---|---|
| NIKKEI 225 | 1055.37 | 38925.63 | 2.79 |
| Hang Seng | 795.48 | 19924.58 | 4.16 |
| KOSPI | 75.25 | 2671.57 | 2.9 |
| ASX 200 | 77.3 | 8203.7 | 0.95 |
| DAX | 319.86 | 19238.36 | 1.69 |
| CAC 40 | 176.47 | 7742.09 | 2.33 |
| Dow Jones | 260.36 | 42175.11 | 0.62 |
| S&P 500 | 23.11 | 5745.37 | 0.4 |
| NASDAQ Composite | 108.08 | 18190.29 | 0.6 |
The People's Bank of China (PBOC) cut the seven-day repo rate to 1.5% from 1.7% on Friday.
Additionally, the Chinese central bank announced to cut the amount of the reserve requirement ratio (RRR), the required minimum capital banks must hold in reserve, by 50 basis points (bps).
Australian Dollar FAQs
One of the most significant factors for the Australian Dollar (AUD) is the level of interest rates set by the Reserve Bank of Australia (RBA). Because Australia is a resource-rich country another key driver is the price of its biggest export, Iron Ore. The health of the Chinese economy, its largest trading partner, is a factor, as well as inflation in Australia, its growth rate and Trade Balance. Market sentiment – whether investors are taking on more risky assets (risk-on) or seeking safe-havens (risk-off) – is also a factor, with risk-on positive for AUD.
The Reserve Bank of Australia (RBA) influences the Australian Dollar (AUD) by setting the level of interest rates that Australian banks can lend to each other. This influences the level of interest rates in the economy as a whole. The main goal of the RBA is to maintain a stable inflation rate of 2-3% by adjusting interest rates up or down. Relatively high interest rates compared to other major central banks support the AUD, and the opposite for relatively low. The RBA can also use quantitative easing and tightening to influence credit conditions, with the former AUD-negative and the latter AUD-positive.
China is Australia’s largest trading partner so the health of the Chinese economy is a major influence on the value of the Australian Dollar (AUD). When the Chinese economy is doing well it purchases more raw materials, goods and services from Australia, lifting demand for the AUD, and pushing up its value. The opposite is the case when the Chinese economy is not growing as fast as expected. Positive or negative surprises in Chinese growth data, therefore, often have a direct impact on the Australian Dollar and its pairs.
Iron Ore is Australia’s largest export, accounting for $118 billion a year according to data from 2021, with China as its primary destination. The price of Iron Ore, therefore, can be a driver of the Australian Dollar. Generally, if the price of Iron Ore rises, AUD also goes up, as aggregate demand for the currency increases. The opposite is the case if the price of Iron Ore falls. Higher Iron Ore prices also tend to result in a greater likelihood of a positive Trade Balance for Australia, which is also positive of the AUD.
The Trade Balance, which is the difference between what a country earns from its exports versus what it pays for its imports, is another factor that can influence the value of the Australian Dollar. If Australia produces highly sought after exports, then its currency will gain in value purely from the surplus demand created from foreign buyers seeking to purchase its exports versus what it spends to purchase imports. Therefore, a positive net Trade Balance strengthens the AUD, with the opposite effect if the Trade Balance is negative.
| Pare | Closed | Change, % |
|---|---|---|
| AUDUSD | 0.6892 | 1.01 |
| EURJPY | 161.776 | 0.48 |
| EURUSD | 1.1176 | 0.4 |
| GBPJPY | 194.151 | 0.77 |
| GBPUSD | 1.34128 | 0.69 |
| NZDUSD | 0.63265 | 1.04 |
| USDCAD | 1.34671 | -0.12 |
| USDCHF | 0.84578 | -0.53 |
| USDJPY | 144.758 | 0.1 |


© 2000-2026. Sva prava zaštićena.
Sajt je vlasništvo kompanije Teletrade D.J. LLC 2351 LLC 2022 (Euro House, Richmond Hill Road, Kingstown, VC0100, St. Vincent and the Grenadines).
Svi podaci koji se nalaze na sajtu ne predstavljaju osnovu za donošenje investicionih odluka, već su informativnog karaktera.
The company does not serve or provide services to customers who are residents of the US, Canada, Iran, The Democratic People's Republic of Korea, Yemen and FATF blacklisted countries.
Izvršenje trgovinskih operacija sa finansijskim instrumentima upotrebom marginalne trgovine pruža velike mogućnosti i omogućava investitorima ostvarivanje visokih prihoda. Međutim, takav vid trgovine povezan je sa potencijalno visokim nivoom rizika od gubitka sredstava. Проведение торговых операций на финанcовых рынках c маржинальными финанcовыми инcтрументами открывает широкие возможноcти, и позволяет инвеcторам, готовым пойти на риcк, получать выcокую прибыль, но при этом неcет в cебе потенциально выcокий уровень риcка получения убытков. Iz tog razloga je pre započinjanja trgovine potrebno odlučiti o izboru odgovarajuće investicione strategije, uzimajući u obzir raspoložive resurse.
Upotreba informacija: U slučaju potpunog ili delimičnog preuzimanja i daljeg korišćenja materijala koji se nalazi na sajtu, potrebno je navesti link odgovarajuće stranice na sajtu kompanije TeleTrade-a kao izvora informacija. Upotreba materijala na internetu mora biti praćena hiper linkom do web stranice teletrade.org. Automatski uvoz materijala i informacija sa stranice je zabranjen.
Ako imate bilo kakvih pitanja, obratite nam se pr@teletrade.global.
транcфери