- Analiza
- Novosti i instrumenti
- Vesti sa tržišta
Forex-novosti i prognoze od 27-04-2018
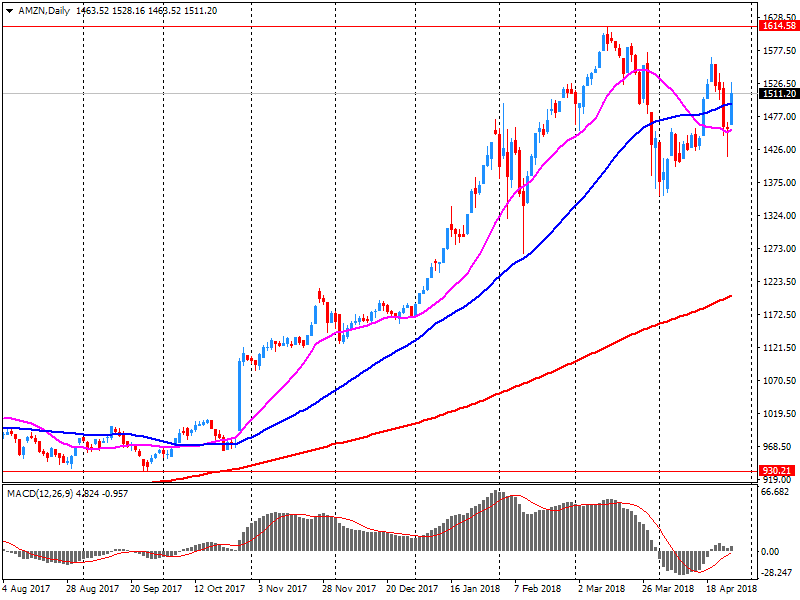
U.S. stock-index futures were mixed on Friday, with Nasdaq futures outperforming due to solid gains in Amazon (AMZN; +9.0%), Microsoft (MSFT; +3.4%) and Intel (INTC; +6.4%), buoyed by better-than-expected earnings reports. Investors also digested preliminary data on the U.S. Q1 GDP.
Global Stocks:
| Index/commodity | Last | Today's Change, points | Today's Change, % |
| Nikkei | 22,467.87 | +148.26 | +0.66% |
| Hang Seng | 30,280.67 | +272.99 | +0.91% |
| Shanghai | 3,082.18 | +7.15 | +0.23% |
| S&P/ASX | 5,953.60 | +42.80 | +0.72% |
| FTSE | 7,487.72 | +66.29 | +0.89% |
| CAC | 5,470.32 | +16.74 | +0.31% |
| DAX | 12,613.41 | +112.94 | +0.90% |
| Crude | $67.93 | | -0.38% |
| Gold | $1,319.00 | | +0.08% |
Real gross domestic product (GDP) increased at an annual rate of 2.3 percent in the first quarter of 2018, according to the "advance" estimate released by the Bureau of Economic Analysis. In the fourth quarter, real GDP increased 2.9 percent.
The increase in real GDP in the first quarter reflected positive contributions from nonresidential fixed investment, personal consumption expenditures (PCE), exports, private inventory investment, federal government spending, and state and local government spending. Imports, which are a subtraction in
the calculation of GDP, increased
Current-dollar personal income increased $182.1 billion in the first quarter, compared with an increase of $186.4 billion in the fourth quarter. Decelerations in personal interest income, rental income, and nonfarm proprietors' income were largely offset by accelerations in wages and salaries and in government social benefits.
(company / ticker / price / change ($/%) / volume)
| 3M Co | MMM | 196.9 | -0.19(-0.10%) | 2173 |
| ALTRIA GROUP INC. | MO | 54.7 | -0.07(-0.13%) | 873 |
| Amazon.com Inc., NASDAQ | AMZN | 1,654.99 | 137.03(9.03%) | 343276 |
| American Express Co | AXP | 100.2 | -0.03(-0.03%) | 535 |
| AMERICAN INTERNATIONAL GROUP | AIG | 55.72 | 0.18(0.32%) | 2755 |
| Apple Inc. | AAPL | 164.79 | 0.57(0.35%) | 86271 |
| AT&T Inc | T | 33.18 | 0.08(0.24%) | 79162 |
| Barrick Gold Corporation, NYSE | ABX | 13.64 | 0.02(0.15%) | 17852 |
| Boeing Co | BA | 341.75 | -1.04(-0.30%) | 11196 |
| Caterpillar Inc | CAT | 146.26 | -0.05(-0.03%) | 6490 |
| Chevron Corp | CVX | 126.45 | 2.23(1.80%) | 52177 |
| Cisco Systems Inc | CSCO | 44.3 | 0.09(0.20%) | 36385 |
| Citigroup Inc., NYSE | C | 68.9 | -0.28(-0.40%) | 27919 |
| Deere & Company, NYSE | DE | 137 | 0.67(0.49%) | 1600 |
| Exxon Mobil Corp | XOM | 78.86 | -2.00(-2.47%) | 278150 |
| Facebook, Inc. | FB | 176.55 | 2.39(1.37%) | 321299 |
| Ford Motor Co. | F | 11.39 | -0.04(-0.35%) | 23559 |
| Freeport-McMoRan Copper & Gold Inc., NYSE | FCX | 15.4 | -0.23(-1.47%) | 51192 |
| General Electric Co | GE | 14.3 | -0.08(-0.56%) | 201933 |
| General Motors Company, NYSE | GM | 38 | -0.25(-0.65%) | 1466 |
| Goldman Sachs | GS | 239.7 | -0.39(-0.16%) | 6083 |
| Google Inc. | GOOG | 1,049.30 | 9.26(0.89%) | 9393 |
| Hewlett-Packard Co. | HPQ | 21.6 | 0.12(0.56%) | 3839 |
| Home Depot Inc | HD | 185.39 | -0.33(-0.18%) | 5791 |
| Intel Corp | INTC | 56.76 | 3.71(6.99%) | 624734 |
| International Business Machines Co... | IBM | 146.52 | -0.20(-0.14%) | 6738 |
| Johnson & Johnson | JNJ | 127.78 | -0.23(-0.18%) | 1423 |
| JPMorgan Chase and Co | JPM | 109.85 | -0.25(-0.23%) | 10288 |
| McDonald's Corp | MCD | 158.78 | -0.12(-0.08%) | 4341 |
| Merck & Co Inc | MRK | 59.3 | -0.11(-0.19%) | 5968 |
| Microsoft Corp | MSFT | 97.68 | 3.42(3.63%) | 481925 |
| Nike | NKE | 68.24 | 0.19(0.28%) | 13867 |
| Pfizer Inc | PFE | 36.69 | -0.16(-0.43%) | 6133 |
| Procter & Gamble Co | PG | 72.6 | -0.15(-0.21%) | 12592 |
| Starbucks Corporation, NASDAQ | SBUX | 58.44 | -0.94(-1.58%) | 17239 |
| Tesla Motors, Inc., NASDAQ | TSLA | 284.28 | -1.20(-0.42%) | 21393 |
| The Coca-Cola Co | KO | 42.7 | -0.05(-0.12%) | 6935 |
| Twitter, Inc., NYSE | TWTR | 30.38 | 0.11(0.36%) | 66717 |
| Verizon Communications Inc | VZ | 50.1 | 0.34(0.68%) | 39157 |
| Visa | V | 127.03 | -0.05(-0.04%) | 19115 |
| Wal-Mart Stores Inc | WMT | 87.61 | -0.33(-0.38%) | 7958 |
| Walt Disney Co | DIS | 99.8 | -0.04(-0.04%) | 10949 |
| Yandex N.V., NASDAQ | YNDX | 33.32 | 0.59(1.80%) | 7109 |
Intel (INTC) target raised to $65 from $55 at B. Riley FBR
Intel (INTC) target raised to $57 from $53 at Stifel
Intel (INTC) target raised to $62 from $50 at Needham
Intel (INTC) target raised to $65 at JPMorgan
Amazon (AMZN) target raised to $2200 from $2000 at Monness Crespi & Hardt
Amazon (AMZN) target raised to $2020 from $1800 at Stifel
Amazon (AMZN) target raised to $1900 at JPMorgan
Amazon (AMZN) target raised to $1900 at RBC Capital Mkts
Amazon (AMZN) target raised to $1800 at Deutsche Bank
Microsoft (MSFT) target raised to $109 from $107 at BMO Capital Mkts
Microsoft (MSFT) target raised to $107 from $105 at Stifel
Microsoft (MSFT) target raised to $75 from $62 at Jefferies
Microsoft (MSFT) target raised to $115 at RBC Capital Mkts
Intel (INTC) upgraded to Mkt Perform at Bernstein
Facebook (FB) upgraded to Buy at Stifel; target raised to $202
NIKE (NKE) upgraded to Buy from Hold at HSBC Securities; target $77
Microsoft (MSFT) upgraded to Overweight from Neutral at JP Morgan; target raised to $110 from $94
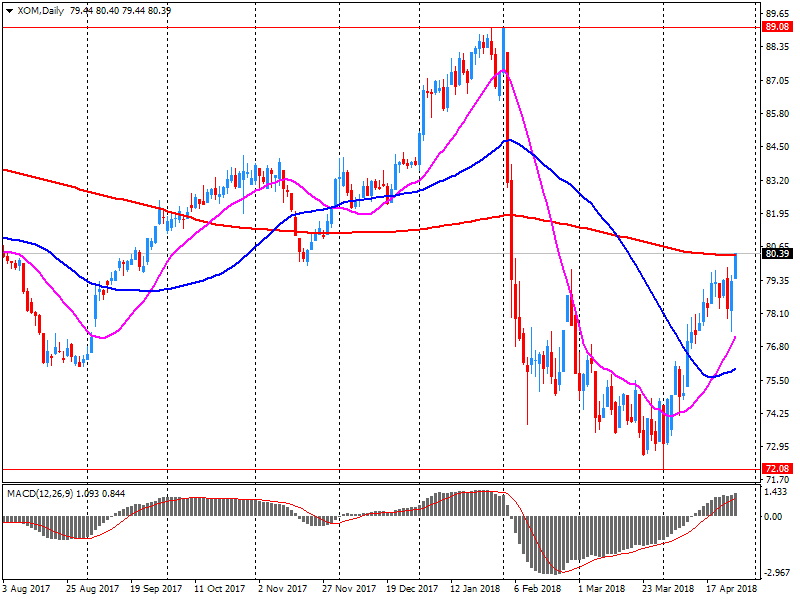
Exxon Mobil (XOM) reported Q1 FY 2018 earnings of $1.09 per share (versus $0.95 in Q1 FY 2017), missing analysts' consensus estimate of $1.10.
The company's quarterly revenues amounted to $68.211 bln (+2.5% y/y), beating analysts' consensus estimate of $61.495 bln.
XOM fell to $80.01 (-1.05%) in pre-market trading.
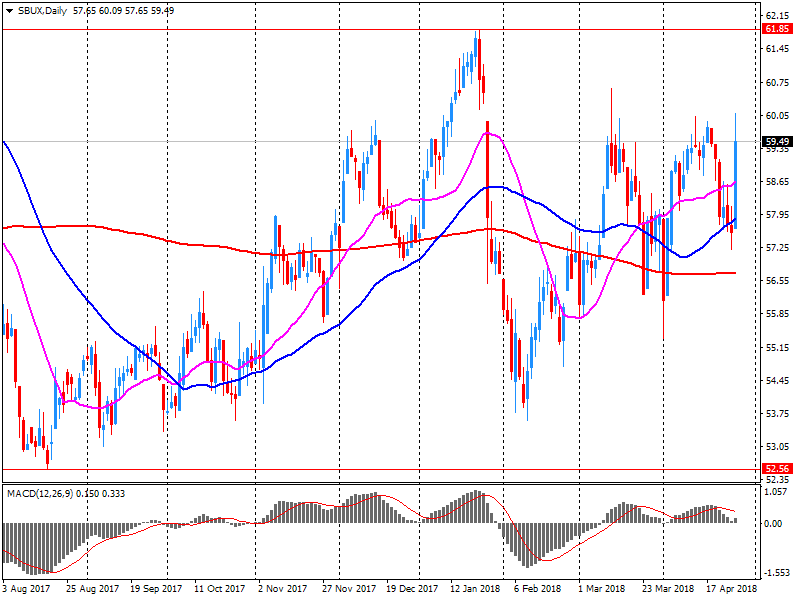
Starbucks (SBUX) reported Q2 FY 2018 earnings of $0.53 per share (versus $0.45 in Q2 FY 2017), in-line with analysts' consensus estimate.
The company's quarterly revenues amounted to $6.032 bln (+13.9% y/y), beating analysts' consensus estimate of $5.934 bln.
The company also reaffirmed guidance for FY 2018, projecting EPS of $2.48-2.53 versus analysts' consensus estimate of $2.49.
SBUX fell to $58.35 (-1.73%) in pre-market trading.
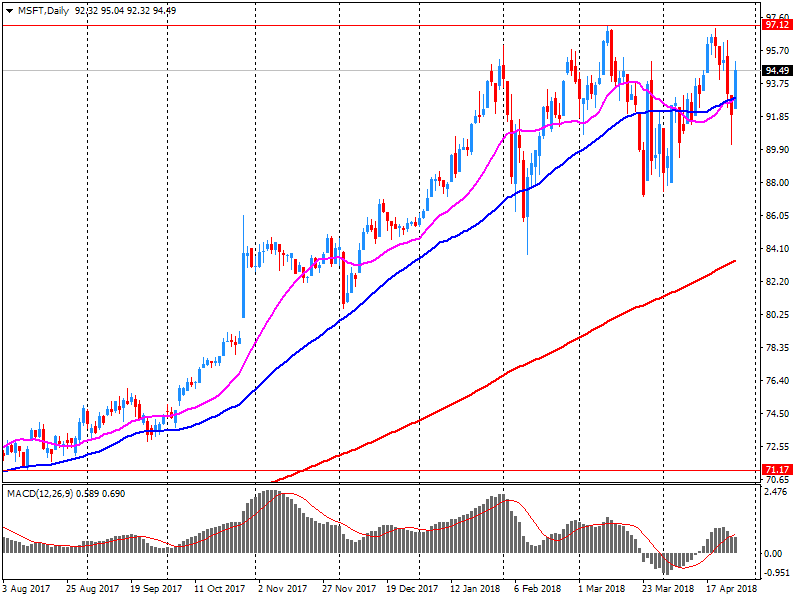
Microsoft (MSFT) reported Q3 FY 2018 earnings of $0.95 per share (versus $0.73 in Q3 FY 2017), beating analysts' consensus estimate of $0.85.
The company's quarterly revenues amounted to $26.819 bln (+15.5% y/y), beating analysts' consensus estimate of $25.784 bln.
MSFT rose to $97.82 (+3.78%) in pre-market trading.
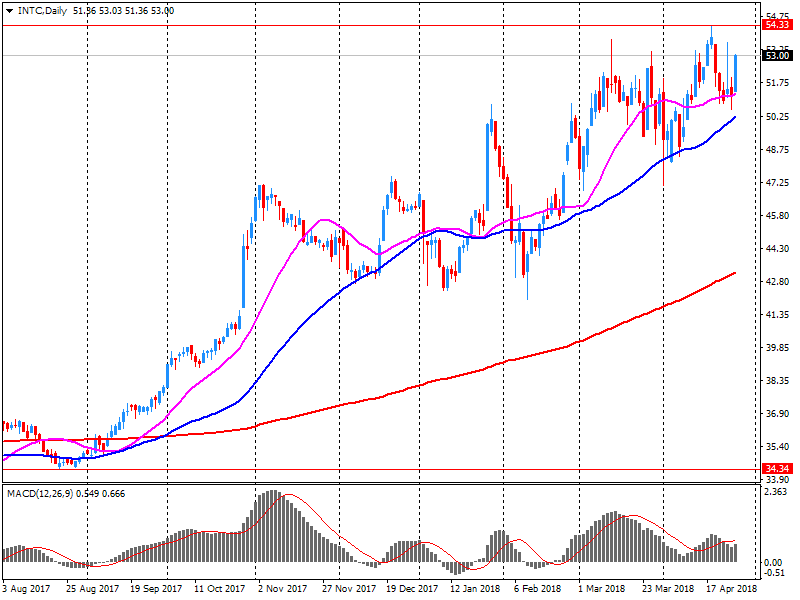
Intel (INTC) reported Q1 FY 2018 earnings of $0.87 per share (versus $0.66 in Q1 FY 2017), beating analysts' consensus estimate of $0.72.
The company's quarterly revenues amounted to $16.100 bln (+8.8% y/y), beating analysts' consensus estimate of $15.076 bln.
The company also issued upside guidance for Q2, projecting EPS of $0.80-0.90 (versus analysts' consensus estimate of $0.82) at Q2 revenues of $15.8-16.8 bln (versus analysts' consensus estimate of $15.59 bln).
For the FY 2018, the company forecasts EPS of $3.66-4.04 (versus its prior guidance of $3.55 and analysts' consensus estimate of $3.58) and revenues of $66.5-68.5 bln (versus its prior projection of $65 bln and analysts' consensus estimate of $65.07 bln).
INTC rose to $56.35 (+6.22%) in pre-market trading.
Amazon (AMZN) reported Q1 FY 2018 earnings of $3.27 per share (versus $1.48 in Q1 FY 2017), beating analysts' consensus estimate of $1.25.
The company's quarterly revenues amounted to $51.042 bln (+42.9% y/y), beating analysts' consensus estimate of $49.937 bln.
AMZN rose to $1,626.98 (+7.18%) in pre-market trading.
-
Registers a rise in inflation risks triggered by some internal and external factors
-
In its decision-making the Bank of Russia will be guided by assessments of inflation risks, inflation dynamics and economic developments against the forecast
-
Uncertainty still persists over the dimensions of fiscal decisions, which are needed to estimate the impact of such decisions on inflation
-
Leaves unchanged its estimates of risks associated with consumer and oil price volatility, wage movements and possible changes in consumer behaviour
UK gross domestic product (GDP) was estimated to have increased by 0.1% in Quarter 1 (Jan to Mar) 2018, compared with 0.4% in Quarter 4 (Oct to Dec) 2017.
UK GDP growth was the slowest since Quarter 4 2012, with construction being the largest downward pull on GDP, falling by 3.3%.
Production increased by 0.7%, with manufacturing growth slowing to 0.2%; slowing manufacturing was partially offset by an increase in energy production due to the below-average temperatures.
The services industries were the largest contributor to GDP growth, increasing by 0.3% in Quarter 1 2018, although the longer-term trend continues to show a weakening in services growth.
-
2018 growth lifted to 2.4 pct vs 2.3 pct, 2019 raised to 2.0 pct vs 1.9 pct
-
2022 gdp growth projection unchanged at 1.6 pct
-
Core inflation forecasts unchanged throughout projection horizon
-
BoJ remains committed to achieving 2 pct price target at earliest possible time
-
Timeframe was always just a forecast, not a firm limit
-
There is view that timeframe for price target was a limit implying immediate policy change
-
Focus on timeframe was not good for communication
-
Think it's appropriate to continue powerful monetary easing
-
Decision on yield curve control made by 8-1 vote, board member Kataoka dissents
-
Japan core cpi expected +1.3 pct in fy2018/19 vs +1.4 pct projected in jan
-
Momentum for hitting price goal sustained but lacking steam
-
Median real gdp forecast for fiscal 2019/20 at +0.8 pct vs +0.7 pct projected in jan
-
Risks to the price outlook skewed to downside
-
Deletes mention of time frame for price target in outlook report
-
Annual house price growth picks up to 2.6%
-
Prices rose 0.2% month-on-month
Commenting on the figures, Robert Gardner, Nationwide's Chief Economist, said: "There was a slight pickup in UK annual house growth in April to 2.6%, from 2.1% in March. House prices rose by 0.2% over the month, after taking account of seasonal factors. "February saw a softening in house purchase approvals to 64,000 cases, following a surprise rise in January. These figures are broadly in line with our expectations and close to the average for the last three months of 2017"
As reported by the Federal Statistical Office (Destatis), the index of import prices decreased by 0.1% in March 2018 compared with the corresponding month of the preceding year. In February and in January 2018 the annual rates of change were -0.6% and +0.7%, respectively. From February 2018 to March 2018 the index did not change.
The index of import prices, excluding crude oil and mineral oil products, decreased by 0.9% compared with the level of a year earlier.
The index of export prices increased by 0.7% in March 2018 compared with the corresponding month of the preceding year. In February and in January 2018 the annual rates of change were +0.5% and +0.7%, respectively. From February 2018 to March 2018 the export price index rose by 0.2%.
Over a year, the Consumer Price Index (CPI) should increase by +1.6% in April 2018, as in the previous month, according to the provisional estimate made at the end of the month. This stability in the year-on-year inflation should result from a sharp acceleration in energy prices, and to a lesser extent, in food products prices, offset by a slowdown in the prices of services. Otherwise, manufactured product prices should decline at the same pace as in March.
Over one month, consumer prices should slow down (+0.1%) after the rebound of the previous month. This deceleration should result from the seasonal decline in manufactured product prices, as well as stable tobacco prices after a sharp rise in March. Services prices should slow, as well as those of food because of fresh products. In contrast, the prices of petroleum products should rebound strongly this month.
In Q1 2018, GDP in volume terms accelerated: +0.3% after +0.7% in Q4 2017. Household consumption expenditures rose at the same pace as in Q4 2017 (+0.2%), whereas total gross fixed capital formation lost momentum (GFCF: +0.6% after +1.1%). Overall, final domestic demand excluding inventory changes slowed down and contributed less to GDP growth: +0.3 points after +0.5 points.
Exports weakened slightly (−0.1% after +2.5%) and imports held steady (0.0% after +0.4%). All in all, foreign trade balance didn't contribute to GDP growth in Q1. Similarly, changes in inventories were stable and therefore they didn't contribute to GDP growth.
EUR/USD
Resistance levels (open interest**, contracts)
$1.2270 (1790)
$1.2235 (472)
$1.2207 (866)
Price at time of writing this review: $1.2097
Support levels (open interest**, contracts):
$1.2063 (3334)
$1.2027 (1808)
$1.1986 (3268)
Comments:
- Overall open interest on the CALL options and PUT options with the expiration date May, 4 is 83478 contracts (according to data from April, 26) with the maximum number of contracts with strike price $1,2650 (4260);
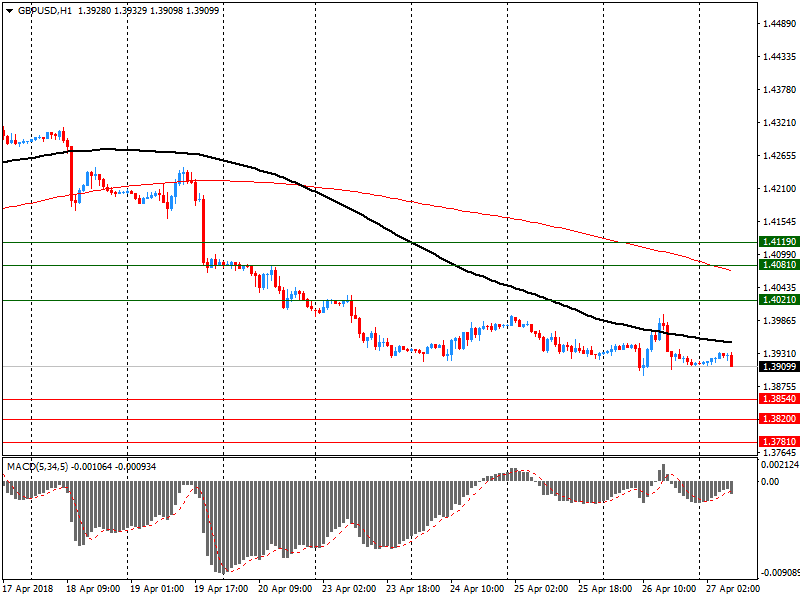
GBP/USD
Resistance levels (open interest**, contracts)
$1.4119 (1858)
$1.4081 (929)
$1.4021 (971)
Price at time of writing this review: $1.3909
Support levels (open interest**, contracts):
$1.3854 (1649)
$1.3820 (2222)
$1.3781 (1820)
Comments:
- Overall open interest on the CALL options with the expiration date May, 4 is 22643 contracts, with the maximum number of contracts with strike price $1,4400 (3260);
- Overall open interest on the PUT options with the expiration date May, 4 is 24728 contracts, with the maximum number of contracts with strike price $1,3850 (2222);
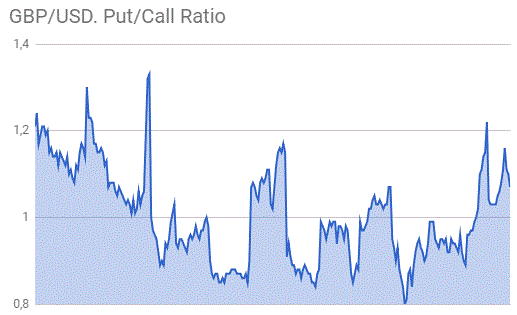
- The ratio of PUT/CALL was 1.09 versus 1.09 from the previous trading day according to data from April, 26
* - The Chicago Mercantile Exchange bulletin (CME) is used for the calculation.
** - Open interest takes into account the total number of option contracts that are open at the moment.
European stocks leapt Thursday, strengthened by a slide in the euro after European Central Bank President Mario Draghi offered little in the way of providing further insight into when the central bank will wind down bond purchases and begin to raise interest rates.
U.S. stocks closed sharply higher on Thursday, with major indexes up 1% as strong results from a number of bellwethers, including technology behemoth Facebook, jolted equities in to a broad advance.
Asian stocks gave back much of their early gains Friday as trade concerns remained in the spotlight despite easing geopolitical risks.
© 2000-2026. Sva prava zaštićena.
Sajt je vlasništvo kompanije Teletrade D.J. LLC 2351 LLC 2022 (Euro House, Richmond Hill Road, Kingstown, VC0100, St. Vincent and the Grenadines).
Svi podaci koji se nalaze na sajtu ne predstavljaju osnovu za donošenje investicionih odluka, već su informativnog karaktera.
The company does not serve or provide services to customers who are residents of the US, Canada, Iran, The Democratic People's Republic of Korea, Yemen and FATF blacklisted countries.
Izvršenje trgovinskih operacija sa finansijskim instrumentima upotrebom marginalne trgovine pruža velike mogućnosti i omogućava investitorima ostvarivanje visokih prihoda. Međutim, takav vid trgovine povezan je sa potencijalno visokim nivoom rizika od gubitka sredstava. Проведение торговых операций на финанcовых рынках c маржинальными финанcовыми инcтрументами открывает широкие возможноcти, и позволяет инвеcторам, готовым пойти на риcк, получать выcокую прибыль, но при этом неcет в cебе потенциально выcокий уровень риcка получения убытков. Iz tog razloga je pre započinjanja trgovine potrebno odlučiti o izboru odgovarajuće investicione strategije, uzimajući u obzir raspoložive resurse.
Upotreba informacija: U slučaju potpunog ili delimičnog preuzimanja i daljeg korišćenja materijala koji se nalazi na sajtu, potrebno je navesti link odgovarajuće stranice na sajtu kompanije TeleTrade-a kao izvora informacija. Upotreba materijala na internetu mora biti praćena hiper linkom do web stranice teletrade.org. Automatski uvoz materijala i informacija sa stranice je zabranjen.
Ako imate bilo kakvih pitanja, obratite nam se pr@teletrade.global.
