- Analiza
- Novosti i instrumenti
- Vesti sa tržišta
Forex-novosti i prognoze od 24-06-2024
- NZD/USD weakens around 0.6120 on Tuesday amid the USD softness, down 0.11% on the day.
- Fed’s Daly said the Fed should cut rates before policymakers are confident that inflation is headed towards 2%.
- The expectation the RBNZ will cut rates earlier than projected exerts some selling pressure on the Kiwi.
The NZD/USD pair trades on a softer note near 0.6120 despite the weaker US Dollar (USD) during the early Asian trading hours on Tuesday. In the absence of top-tier economic data released from New Zealand on Tuesday, speeches by FOMC members could influence USD demand ahead of the key US economic data, which are due later this week. The revision of US Gross Domestic Product (GDP) for the first quarter (Q1) is due on Thursday, and the Personal Consumption Expenditure (PCE) Price Index will be published on Friday.
The US Federal Reserve (Fed) officials emphasized that they need to see more progress on inflation before considering a rate cut. Financial markets are now pricing in a 65% odds of a Fed rate cut in September, up from 59.5% at the end of last week, according to the CME FedWatch Tool. The cautious stance from the US central bank continues to support the Greenback in the near term against the Kiwi.
San Francisco Federal Reserve Bank President Mary Daly said on Monday that she does not believe the Fed should cut rates before policymakers are confident that inflation is headed towards 2%. Daly further stated that the labour market, albeit strong, might face rising unemployment if inflation remains persistent.
On the Kiwi front, the Reserve Bank of New Zealand (RBNZ) forecast during its last policy meeting in May that the central bank wouldn’t start cutting its Official Cash Rate from 5.5% until the third quarter of next year as inflation remains elevated. Nonetheless, many analysts expect the beginning of the rate cut in early 2025. The speculation that the RBNZ will cut rates earlier than projected weighs on the New Zealand Dollar (NZD) and creates a headwind for the NZD/USD pair.
Data released on Monday showed that New Zealand’s Trade Balance arrived at NZD $-10.05B YoY in May from the previous reading of $-10.22B, according to Statistics New Zealand. Meanwhile, Exports rose to $7.16B in the same month versus $6.31B prior. Imports increased to $6.95B in May compared to $6.32B in April.
- USD/CAD posts modest gains near 1.3655 in Tuesday’s early Asian session.
- BoC Governor Tiff Macklem said the Canadian economy is on track for a soft landing.
- Investors await the release of the US GDP growth number on Thursday and the PCE Price Index on Friday.
The USD/CAD pair remains on the defensive around 1.3655 during the early Asian session on Tuesday. The USD Index (DXY) retreats from nearly two-month tops to 105.50, exerting some selling pressure on the pair. Investors will focus on the Canadian Consumer Price Index (CPI) inflation report, which is forecast to cool slightly for the year through May.
Late Monday, the Bank of Canada (BoC) Governor Tiff Macklem said that the Canadian economy is on track for a soft landing where the central bank doesn’t need a large rise in the unemployment rate to achieve the inflation target. Macklem further stated that it's reasonable to expect additional rate cuts. This speech came two weeks after the Canadian central bank lowered its policy interest rate to 4.75% from 5%, the first rate cut in four years. The Canadian Dollar (CAD) strengthens, even though investors expect that the BoC will deliver more rate cuts this year.
Meanwhile, the rise in crude oil prices amid renewed hopes of a summertime upswing in fuel demand continues to underpin the commodity-linked Loonie. It's worth noting that higher oil prices could support the CAD as Canada is the major crude oil exporter to the United States.
On the USD’s front, the US Federal Reserve (Fed) officials maintain a cautious stance on rate cuts, highlighting that their decisions would remain data-dependent. On Monday, San Francisco Fed President Mary Daly said that the Fed must continue the work of fully restoring price stability without a painful disruption to the economy. Daly added that while the central bank still has "more work to do" on bringing inflation down, inflation is not the only risk they face.
Traders will take more cues from the crucial US economic data this week. The revision of US Gross Domestic Product (GDP) for the first quarter will be released on Thursday. On Friday, the Personal Consumption Expenditure (PCE) Price Index will be published. Traders are now pricing in a 66% odds of Fed rate cut in September, up from 59.5% at the end of last week, according to the CME FedWatch Tool.
- EUR/USD recovered from last week’s downside but remains hung up on 1.0730.
- As USD flows turned lower, Euro traders shrugged off a miss in German data.
- Tuesday restricted to mid-tier releases, and a fistful of central planner speeches.
EUR/USD drifted up in a mild recovery from last Friday’s dip into 1.0670. The new trading week is kicking things off with risk appetite firmly pinned higher, sending the US Dollar lower and bolstering the Euro as investors head into a relatively quiet Tuesday.
Fed's Daly: Inflation is not the only risk, but recent inflation readings are more encouraging
Key economic data releases are relegated to later in the week, leaving traders to focus on statements from policymakers that dot the landscape until meaningful data releases kick off in the back half of the trading week. An update to US Gross Domestic Product (GDP) figures is slated for Thursday, with Friday rounding out the trading week with German Retail Sales and the latest update for US Personal Consumption Expenditure (PCE) Price Index inflation.
Fed's Goolsbee: Slowing inflation data would open door to easier policy
Tuesday’s economic calendar is notably restrained, with an appearance expected from German central bank President Joachim Nagel. During Tuesday's US market session, Federal Reserve (Fed) officials are expected to give several speeches, and central planners will likely lean into middling Fedspeak in echoes of Monday’s performances.
German sentiment surveys broadly missed expectations early Monday, but Euro markets are flaunting downside EU figures to follow the broader market higher as risk appetite continues to pin to hopes of at least a quarter-point cut from the Federal Open Market Committee’s (FOMC) September 18 rate call. According to the CME’s FedWatch Tool, rate traders are pricing in around 70% odds of a 25 basis point rate trim from the Fed in September.
EUR/USD technical outlook
EUR/USD pulled higher after walking back last Friday’s dip into 1.0670, but bullish momentum hit a snag after intraday bids got hung up on the 200-hour Exponential Moving Average (EMA) at 1.0737. EUR/USD still remains on the low side on daily candles, with price action trading on the bearish side of the 200-day EMA at 1.0815.
EUR/USD hourly chart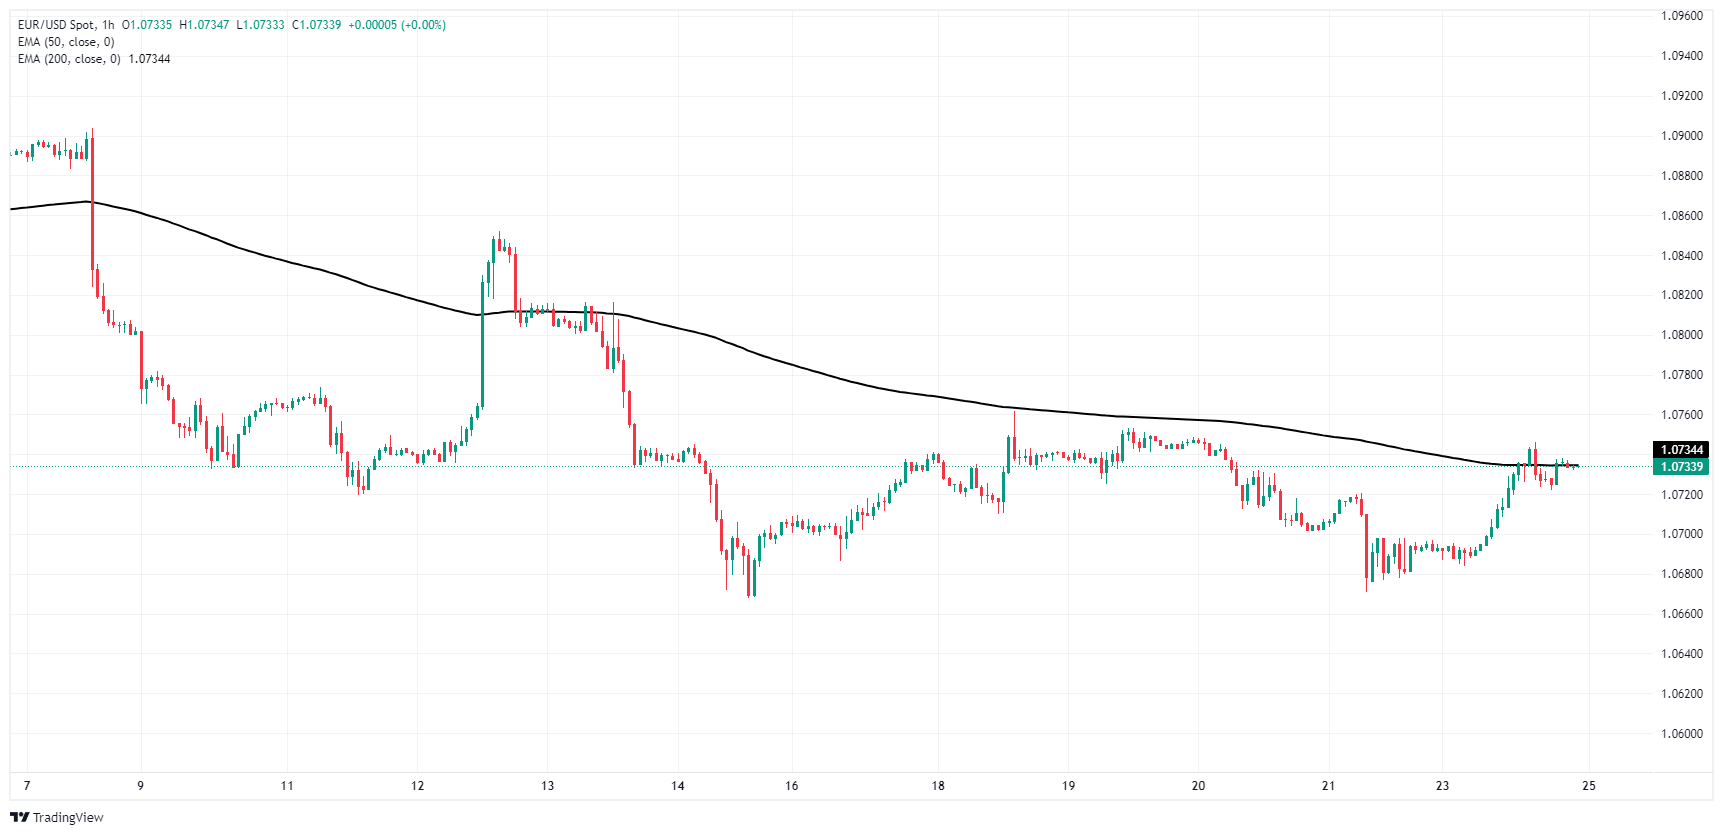
EUR/USD daily chart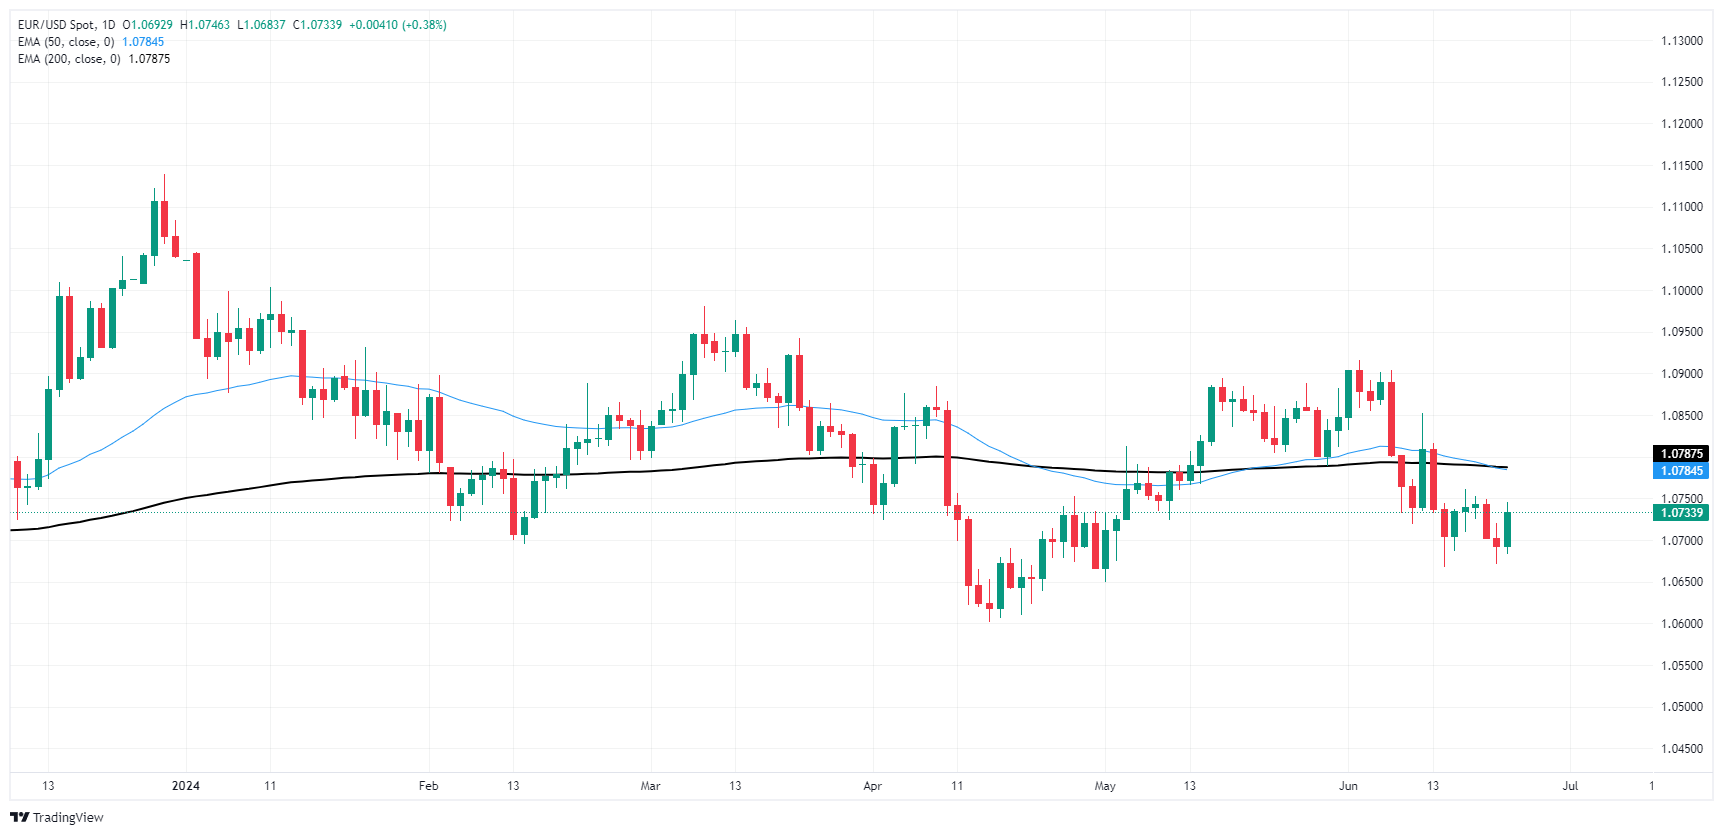
Euro FAQs
The Euro is the currency for the 20 European Union countries that belong to the Eurozone. It is the second most heavily traded currency in the world behind the US Dollar. In 2022, it accounted for 31% of all foreign exchange transactions, with an average daily turnover of over $2.2 trillion a day. EUR/USD is the most heavily traded currency pair in the world, accounting for an estimated 30% off all transactions, followed by EUR/JPY (4%), EUR/GBP (3%) and EUR/AUD (2%).
The European Central Bank (ECB) in Frankfurt, Germany, is the reserve bank for the Eurozone. The ECB sets interest rates and manages monetary policy. The ECB’s primary mandate is to maintain price stability, which means either controlling inflation or stimulating growth. Its primary tool is the raising or lowering of interest rates. Relatively high interest rates – or the expectation of higher rates – will usually benefit the Euro and vice versa. The ECB Governing Council makes monetary policy decisions at meetings held eight times a year. Decisions are made by heads of the Eurozone national banks and six permanent members, including the President of the ECB, Christine Lagarde.
Eurozone inflation data, measured by the Harmonized Index of Consumer Prices (HICP), is an important econometric for the Euro. If inflation rises more than expected, especially if above the ECB’s 2% target, it obliges the ECB to raise interest rates to bring it back under control. Relatively high interest rates compared to its counterparts will usually benefit the Euro, as it makes the region more attractive as a place for global investors to park their money.
Data releases gauge the health of the economy and can impact on the Euro. Indicators such as GDP, Manufacturing and Services PMIs, employment, and consumer sentiment surveys can all influence the direction of the single currency. A strong economy is good for the Euro. Not only does it attract more foreign investment but it may encourage the ECB to put up interest rates, which will directly strengthen the Euro. Otherwise, if economic data is weak, the Euro is likely to fall. Economic data for the four largest economies in the euro area (Germany, France, Italy and Spain) are especially significant, as they account for 75% of the Eurozone’s economy.
Another significant data release for the Euro is the Trade Balance. This indicator measures the difference between what a country earns from its exports and what it spends on imports over a given period. If a country produces highly sought after exports then its currency will gain in value purely from the extra demand created from foreign buyers seeking to purchase these goods. Therefore, a positive net Trade Balance strengthens a currency and vice versa for a negative balance.
- GBP/USD drifts higher on Monday amidst a thin early-week economic calendar.
- UK GDP data due at the end of the week, strictly mid-tier releases on offer until then.
- Fed news cycle to dominate market attention as policymakers caution restraint.
GBP/USD ground out some bullish chart paper on Monday, climbing from a recent swing low into 1.2650 as markets kicked off the new trading week with risk appetite firmly on the front foot. Key economic data remains limited through most of the week, with Cable traders set to look ahead to high-impact calendar releases that won’t land until later. Gross Domestic Product (GDP) updates for the US and the UK are due in the back half of the trading week, with US Personal Consumption Expenditure (PCE) Price Index inflation numbers slated for Friday.
Fed's Daly: Inflation is not the only risk, but recent inflation readings are more encouraging
Fed's Goolsbee: Slowing inflation data would open door to easier policy
Tuesday's release schedule is strictly mid-tier, leaving markets to churn on statements from central bank policymakers. A smattering of Fedspeak comments sent minor jitters through Monday's markets, with more of the same expected on Tuesday.
Federal Reserve Bank of San Francisco President Mary Daly noted on Monday that 2024’s inflation prints have not inspired much confidence when viewed in the aggregate, though recent prints have shown promise. Fed policymaker Daly’s comments followed on the heels of earlier comments from Federal Reserve Bank of Chicago President Austan Goolsbee, who remains optimistic that further progress on inflation will be forthcoming, noting that the Fed’s policy stance remains appropriately restrictive.
GBP/USD technical outlook
The Cable’s Monday bull run drove the pair up six-tenths of one percent bottom-to-top from last Friday’s bottom bids at 1.2622. Hourly candles have tipped into technical resistance at the 200-hour Exponential Moving Average (EMA) at 1.2695, which could be a bump in the road for bullish momentum.
Daily candlesticks are churning in neutral territory just north of the 200-day EMA at 1.2603, and further downside could be on the cards as intraday bids get hung up on the 50-day EMA at 1.2673.
GBP/USD hourly chart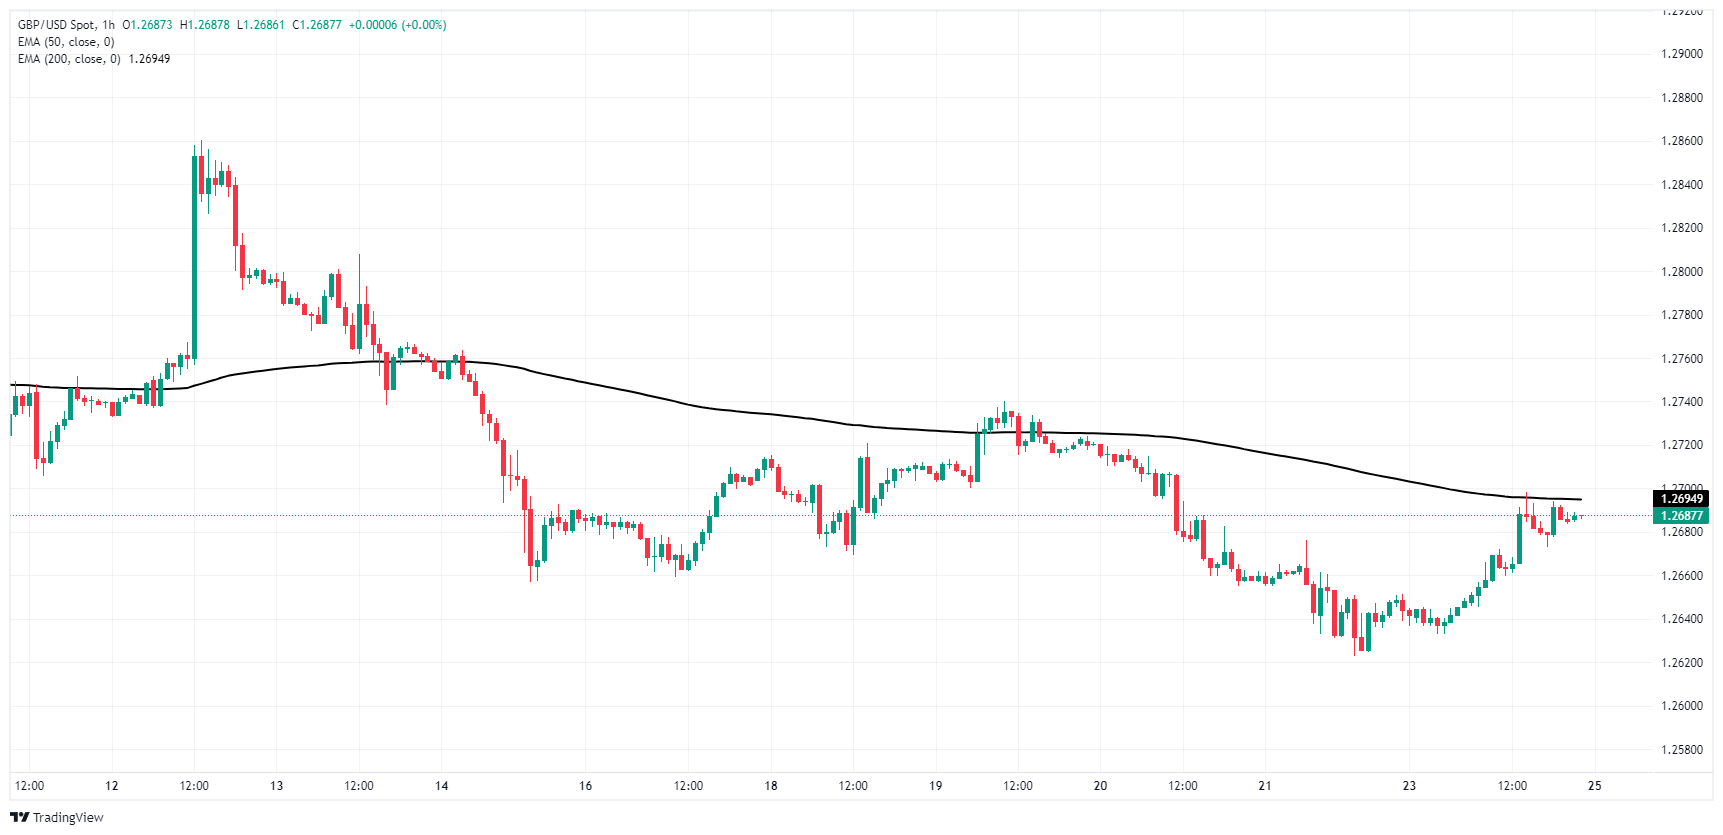
GBP/USD daily chart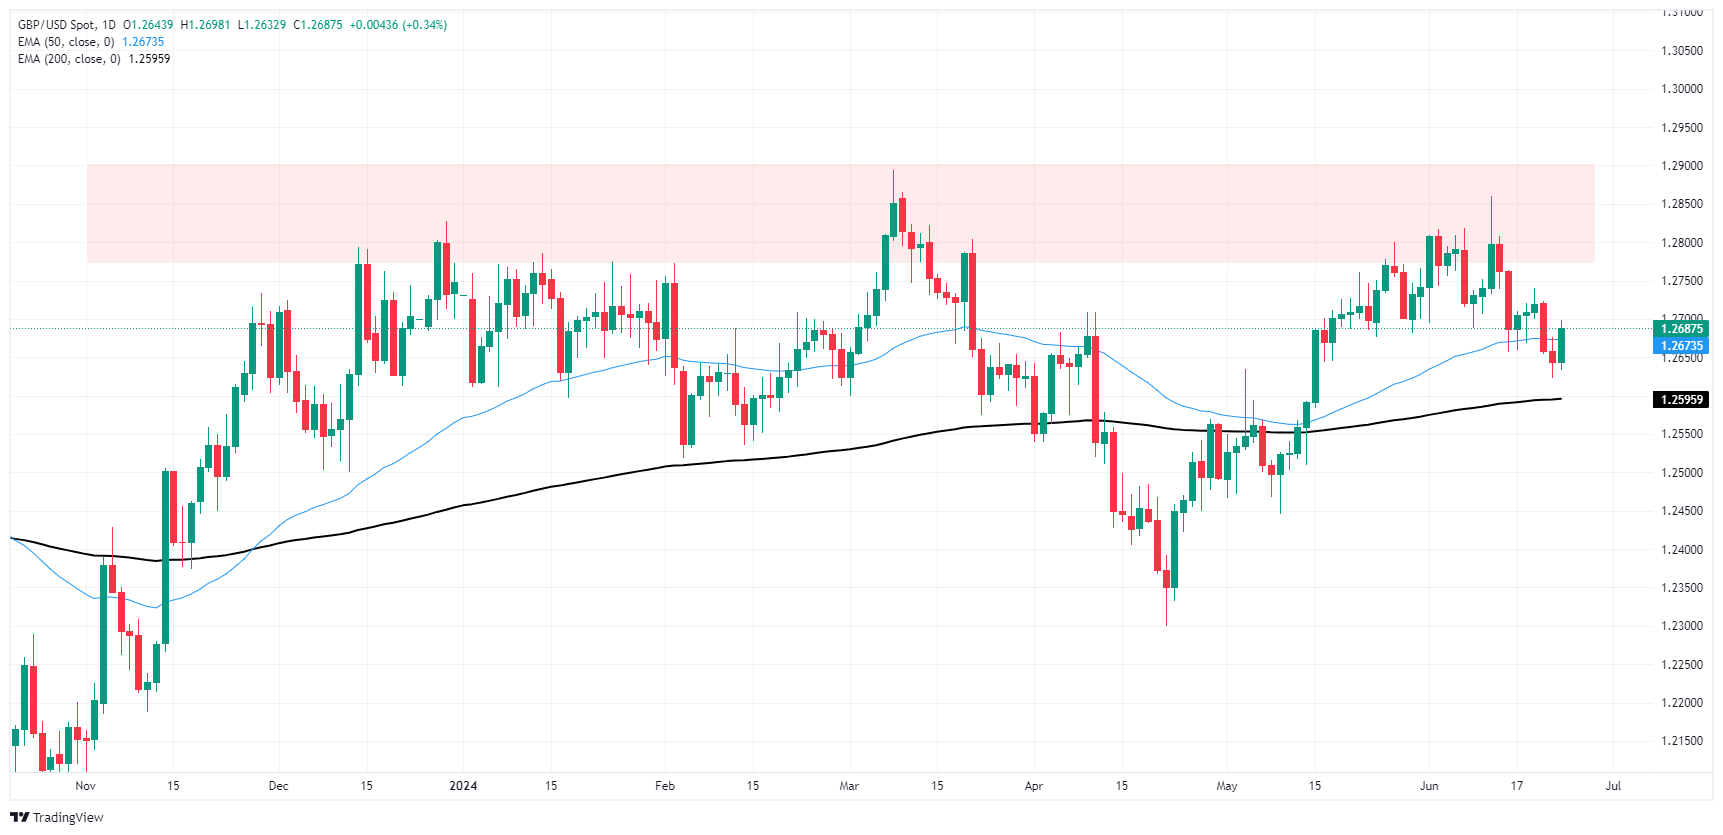
Pound Sterling FAQs
The Pound Sterling (GBP) is the oldest currency in the world (886 AD) and the official currency of the United Kingdom. It is the fourth most traded unit for foreign exchange (FX) in the world, accounting for 12% of all transactions, averaging $630 billion a day, according to 2022 data. Its key trading pairs are GBP/USD, aka ‘Cable’, which accounts for 11% of FX, GBP/JPY, or the ‘Dragon’ as it is known by traders (3%), and EUR/GBP (2%). The Pound Sterling is issued by the Bank of England (BoE).
The single most important factor influencing the value of the Pound Sterling is monetary policy decided by the Bank of England. The BoE bases its decisions on whether it has achieved its primary goal of “price stability” – a steady inflation rate of around 2%. Its primary tool for achieving this is the adjustment of interest rates. When inflation is too high, the BoE will try to rein it in by raising interest rates, making it more expensive for people and businesses to access credit. This is generally positive for GBP, as higher interest rates make the UK a more attractive place for global investors to park their money. When inflation falls too low it is a sign economic growth is slowing. In this scenario, the BoE will consider lowering interest rates to cheapen credit so businesses will borrow more to invest in growth-generating projects.
Data releases gauge the health of the economy and can impact the value of the Pound Sterling. Indicators such as GDP, Manufacturing and Services PMIs, and employment can all influence the direction of the GBP. A strong economy is good for Sterling. Not only does it attract more foreign investment but it may encourage the BoE to put up interest rates, which will directly strengthen GBP. Otherwise, if economic data is weak, the Pound Sterling is likely to fall.
Another significant data release for the Pound Sterling is the Trade Balance. This indicator measures the difference between what a country earns from its exports and what it spends on imports over a given period. If a country produces highly sought-after exports, its currency will benefit purely from the extra demand created from foreign buyers seeking to purchase these goods. Therefore, a positive net Trade Balance strengthens a currency and vice versa for a negative balance.
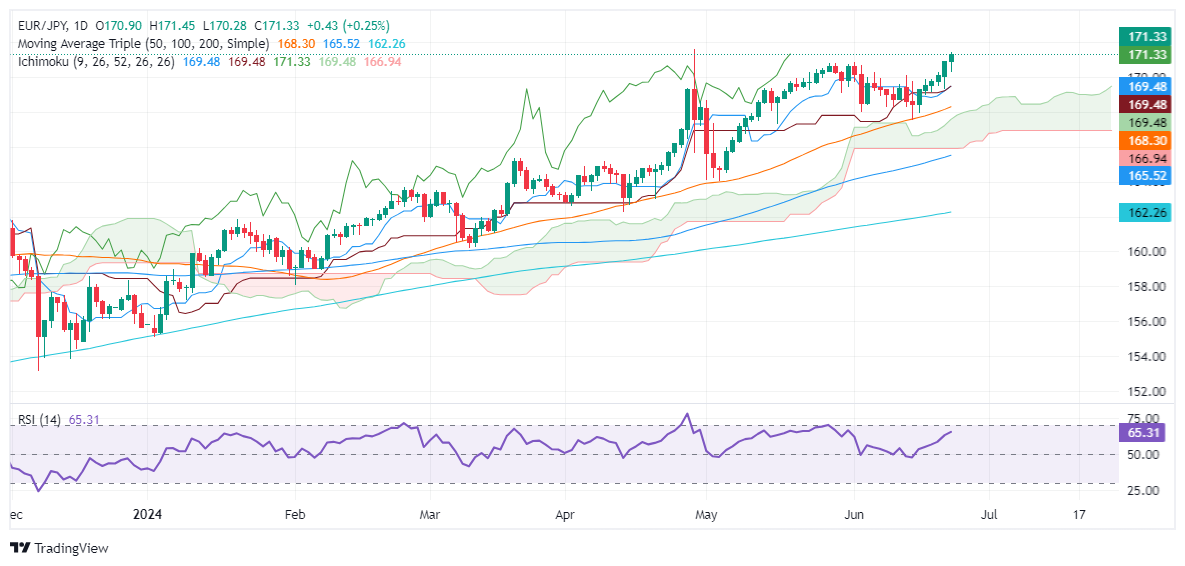
- EUR/JPY extends its gains for the sixth consecutive day and nearing the YTD high of 171.58.
- Technical outlook shows bullish momentum, with RSI indicating potential for further gains.
- Key resistance levels are YTD high at 171.58, 172.00, 172.50, and 173.00.
- Key support levels would be 171.00, the confluence of Tenkan, Kijun-Sen, and Senkou Span A at 169.48, and 50-DMA.
The EUR/JPY extended its gains for the sixth straight day on Monday and is up 0.24%. Yet it remains shy of testing the year-to-date (YTD) high reached on April 29 at 171.58. At the time of writing, the cross is trading at 171.29, above the 171.00 key technical level.
EUR/JPY Price Analysis: Technical outlook
The pair is set to extend its gains. Still, intervention fears that the Bank of Japan or the Minister of Finance might step into the FX markets loom, keeping investors on their toes.
Momentum suggests that the cross could extend its gains, as the Relative Strength Index (RSI) is bullish.
Therefore, the EUR/JPY first resistance would be the YTD high at 171.58. A breach of the latter will expose the 172.00 figure, followed by the 172.50 mark. Once those two levels are cleated, up next will be the 173.00 psychological level.
On further weakness, the EUR/JPY might be headed for a pullback, and test 171.00. Once cleared, the next support would be the confluence of the Tenkan, Kijun-Sen and Senkou Span A at 169.48. Once surpassed, the next stop would be the 50-day moving average (DMA) at 168.40.
EUR/JPY Price Action – Daily Chart
- Buyers successfully clear previous losses, stabilizing the cross at 97.80
- The 20-day SMA at 96.60 remains an important support, defending against sellers' attempts.
- Approaching overbought conditions suggests a potential correction, although the overall outlook remains positive.
On Monday, the NZD/JPY pair recorded a low of 97.28 before buyers stepped in and cleared all losses, stabilizing the cross at around 97.80. The potent performance fortified the bullish sentiment, with the pair glowing at highs not seen since July 2007, but in entered the Asian session on a neutral note. In the last sessions, the 20-day Simple Moving Average (SMA) at 96.60 has emerged as strong support, with sellers yet unable to breach this level, serving to further solidify the positive outlook.
The daily Relative Strength Index (RSI) currently reads 67, indicating higher momentum than Friday's reading and continues to suggest an upward trend. Meanwhile, the Moving Average Convergence Divergence (MACD) for Monday presents a fresh green bar, indicating increased buying pressure. However, investors are advised caution as the RSI nears the overbought threshold, hinting at the possibility of a near-term correction.
NZD/JPY daily chart
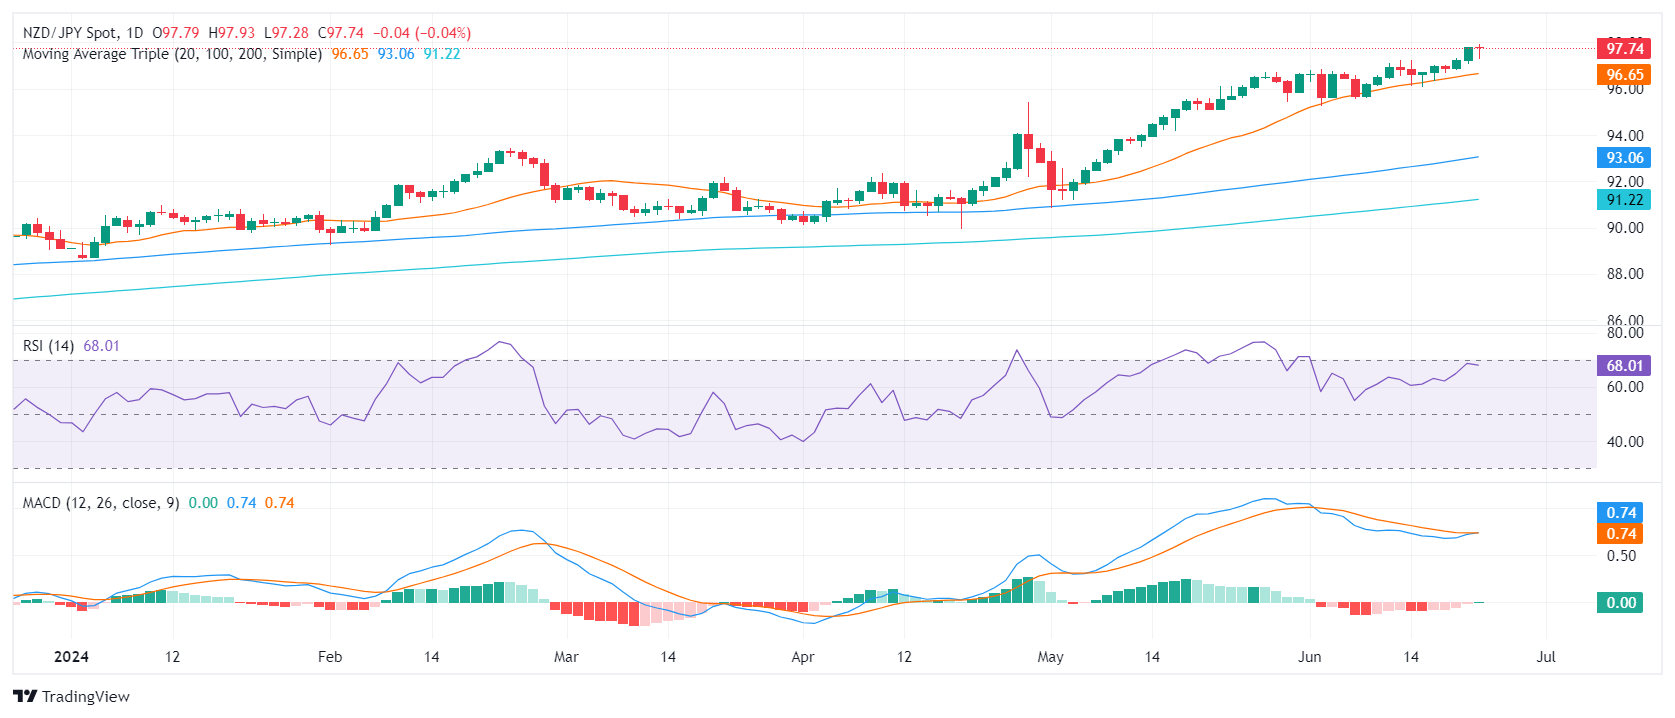
The bulls' resilience in maintaining positions above the 20-day SMA remains steadfast. This, combined with the approaching overbought daily technical indicators, further reinforces the positive technical outlook of the Kiwi against the Yen.
In subsequent trading sessions, the cross may fluctuate between the immediate support at 97.00 and the resistance target at 98.00. Investors should monitor these levels for a break above the consolidation range, indicating continued upward movement, or a breach below the 20-day SMA, which could signal a deeper correction. The 97.30 area also showed itself as a strong support.
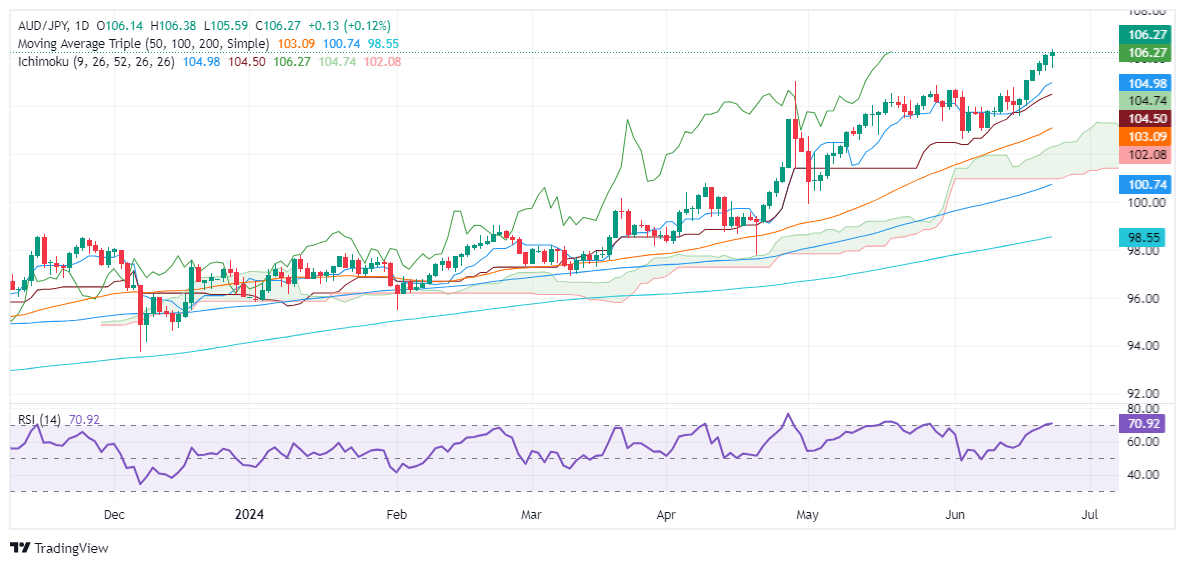
- AUD/JPY hits a 17-year peak at 106.37, following the BoJ's decision to maintain interest rates.
- Technicals indicate a strong uptrend with RSI in bullish territory; upcoming resistance at 106.50 and 107.00.
- Support levels include Tenkan-Sen at 104.98, Senkou Span A at 104.73, and Kijun-Sen at 104.49.
The Australian Dollar surged to a new 17-year high of 106.37 against the Japanese Yen as the Bank of Japan failed to increase interest rates on its latest monetary policy decision, which weighed on the Japanese currency. Therefore, the AUD/JPY rallied higher and traded at 106.22, up 0.16%.
AUD/JPY Price Analysis: Technical outlook
The AUD/JPY cross-pair uptrend remains intact, with the pair breaching the previous year-to-date (YTD) high of 104.94, which opened the door to test 105.00 and beyond. Even though momentum favors buyers with the Relative Strength Index (RSI) in bullish territory, downside risks remain due to verbal intervention by Japanese authorities.
If the JPY continued to depreciate steadily, that could pave the way for further gains. The next resistance would be the 106.50, ahead of 107.00. UP next would be the October 2007 peak at 107.86.
Conversely, if the cross-pair extends its losses past 106.00, the first support would be the Tenkan-Sen at 104.98, followed by the Senkou Span A at 104.73. Once cleared, the bull’s last line of defense would be the Kijun-Sen at 104.49.
AUD/JPY Price Action – Daily Chart
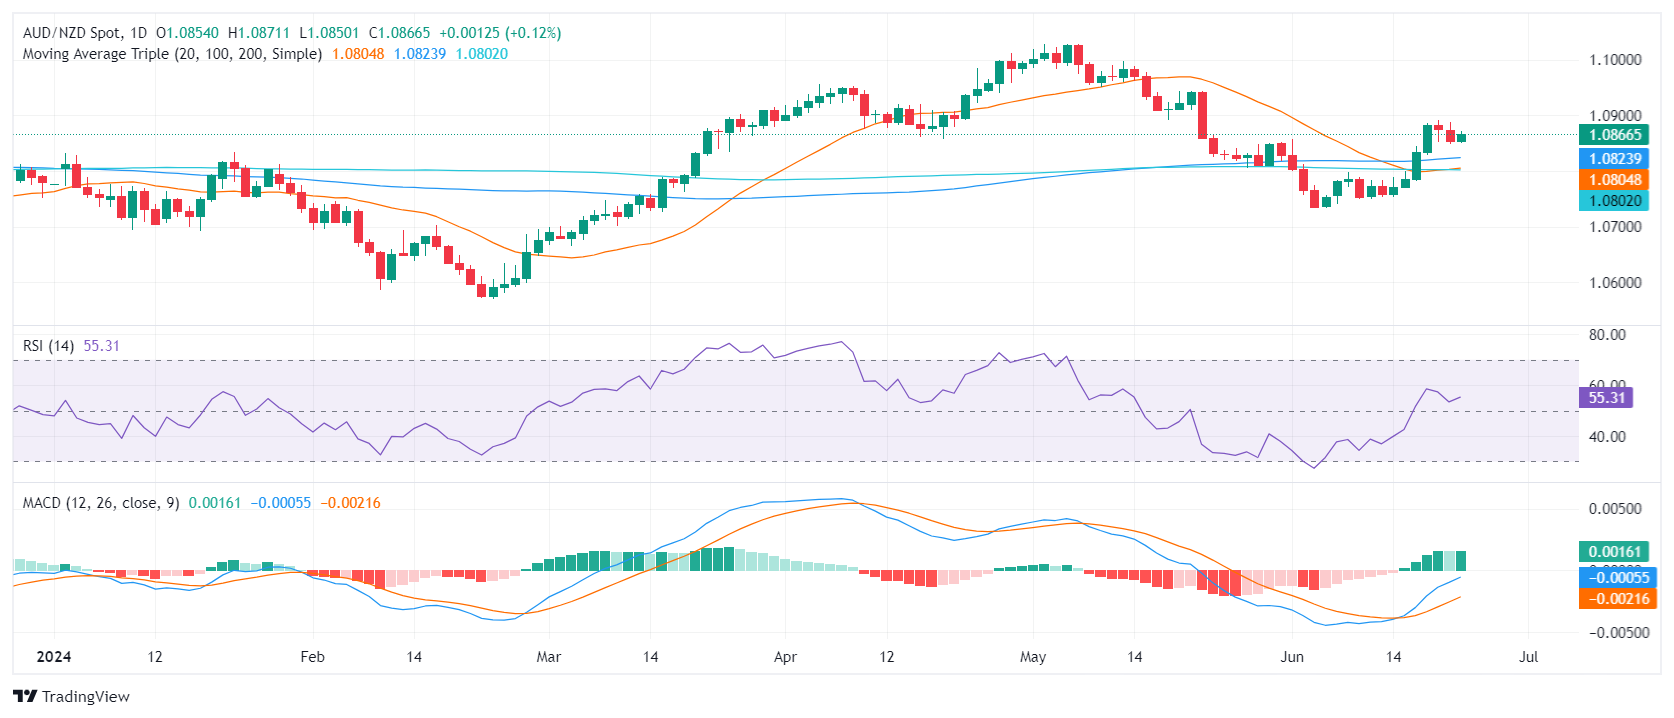
- On Monday, the AUD/NZD paused its selling trend, marking a two-day losing streak at the end of last week.
- New Zealand's June ANZ consumer and business surveys are eyed in this Wednesday's Asian session.
- Australia's AUD continues to be driven by anticipations of the upcoming CPI data, also due this Wednesday.
The AUD/NZD sellers took a Monday pause after the tally of a two-day losing streak at the end of last week. The Reserve Bank of Australia (RBA) and the Reserve Bank of New Zealand (RBNZ) moves are awaited by investors, who continue to place their bets.
In New Zealand, the June ANZ consumer and business surveys are in focus this Wednesday. The data for May showed a clear weakening in activity and easing inflation pressure, with the business confidence dropping to 11.20. Moreover, the consumer confidence index advanced to 84.90 in May but stayed at historically weak levels. Despite inflation receding slowly in the New Zealand services sector and some signs of fragility in the overall economy, the RBNZ is delaying its first rate cut for Q3 2025, contradicting the market which fully expects a cut this November.
For Australia, the spotlight turns to the May Consumer Price Index (CPI) data released this Wednesday. Headline inflation is expected to leap by two ticks to a five-month peak of 3.8% year on year. As for now, the swaps market gave up nearly all rate cut hopes in 2024 and approximates a 70% likelihood of the initial cut in February 2025. In the meantime, the RBA remains patient, maintaining that a considerable period will elapse before inflation sustainably sits within the 2-3% target range. It's worth noticing that Governor Bullock noted last week that the bank will do whatever is necessary to tackle inflation and this hawkish stance might cushion the Aussie.
AUD/NZD technical analysis
In the near term, the technical outlook for the AUD/NZD cross remains positive, recording a gain of nearly 0.80% in the previous fortnight. While the indicators may have flattened, the overall scenario suggests that the bearish spell might be taking a break.
However, the Simple Moving Averages (SMA) position remains like previously mentioned, capping the upward potential.
AUD/NZD daily chart
Here is what you need to know on Monday, June 24:
The US Dollar (USD) extended Monday declines through the US market session, easing back as investor confidence continues to pin higher at the outset of a fresh trading week. Key US data looms ahead later in the week with a revision to first-quarter US Gross Domestic Product (GDP) growth on Thursday, with updated Personal Consumption Expenditure (PCE) Price Index inflation slated for Friday.
Tuesday will drop the latest Canadian Consumer Price Index (CPI) inflation figures on CAD traders, forecast to cool slightly for the year through May, while Australia’s CPI for the year ended in May is expected to tick upwards slightly. Australia’s Monthly CPI inflation is slated to print early Wednesday.
This week, an otherwise moderate release schedule leaves investors to drift as key data loads into the barrel for Friday. Japan’s Tokyo CPI inflation preview will kick off Friday’s upcoming data splurge, followed by German Retail Sales, UK GDP, and US PCE inflation, rounding out the capstone on the week’s economic calendar.
US Dollar PRICE Today
The table below shows the percentage change of US Dollar (USD) against listed major currencies today. US Dollar was the strongest against the Japanese Yen.
| USD | EUR | GBP | JPY | CAD | AUD | NZD | CHF | |
|---|---|---|---|---|---|---|---|---|
| USD | -0.41% | -0.35% | -0.10% | -0.27% | -0.26% | -0.15% | -0.10% | |
| EUR | 0.41% | 0.08% | 0.38% | 0.19% | 0.16% | 0.31% | 0.38% | |
| GBP | 0.35% | -0.08% | 0.24% | 0.11% | 0.08% | 0.23% | 0.30% | |
| JPY | 0.10% | -0.38% | -0.24% | -0.17% | -0.13% | 0.00% | -0.01% | |
| CAD | 0.27% | -0.19% | -0.11% | 0.17% | 0.01% | 0.12% | 0.19% | |
| AUD | 0.26% | -0.16% | -0.08% | 0.13% | -0.01% | 0.14% | 0.21% | |
| NZD | 0.15% | -0.31% | -0.23% | -0.00% | -0.12% | -0.14% | 0.07% | |
| CHF | 0.10% | -0.38% | -0.30% | 0.00% | -0.19% | -0.21% | -0.07% |
The heat map shows percentage changes of major currencies against each other. The base currency is picked from the left column, while the quote currency is picked from the top row. For example, if you pick the US Dollar from the left column and move along the horizontal line to the Japanese Yen, the percentage change displayed in the box will represent USD (base)/JPY (quote).
EUR/USD held steady in the US market session on Monday, drifting around technical levels near 1.0740 as a broad-market Greenback selloff helped Euro traders to fend off a broad miss in German sentiment surveys that dropped earlier in the day.
GBP/USD likewise stuck to its guns near 1.2690 as bullish Cable bets remained pinned on the high side, but couldn’t stretch to make a break above the 1.2700 handle. The UK is broadly absent from the economic calendar this week, with mostly mid- to low-tier data on the offering as GBP traders wait for Friday’s UK GDP print for the first quarter.
Fed FAQs
Monetary policy in the US is shaped by the Federal Reserve (Fed). The Fed has two mandates: to achieve price stability and foster full employment. Its primary tool to achieve these goals is by adjusting interest rates. When prices are rising too quickly and inflation is above the Fed’s 2% target, it raises interest rates, increasing borrowing costs throughout the economy. This results in a stronger US Dollar (USD) as it makes the US a more attractive place for international investors to park their money. When inflation falls below 2% or the Unemployment Rate is too high, the Fed may lower interest rates to encourage borrowing, which weighs on the Greenback.
The Federal Reserve (Fed) holds eight policy meetings a year, where the Federal Open Market Committee (FOMC) assesses economic conditions and makes monetary policy decisions. The FOMC is attended by twelve Fed officials – the seven members of the Board of Governors, the president of the Federal Reserve Bank of New York, and four of the remaining eleven regional Reserve Bank presidents, who serve one-year terms on a rotating basis.
In extreme situations, the Federal Reserve may resort to a policy named Quantitative Easing (QE). QE is the process by which the Fed substantially increases the flow of credit in a stuck financial system. It is a non-standard policy measure used during crises or when inflation is extremely low. It was the Fed’s weapon of choice during the Great Financial Crisis in 2008. It involves the Fed printing more Dollars and using them to buy high grade bonds from financial institutions. QE usually weakens the US Dollar.
Quantitative tightening (QT) is the reverse process of QE, whereby the Federal Reserve stops buying bonds from financial institutions and does not reinvest the principal from the bonds it holds maturing, to purchase new bonds. It is usually positive for the value of the US Dollar.
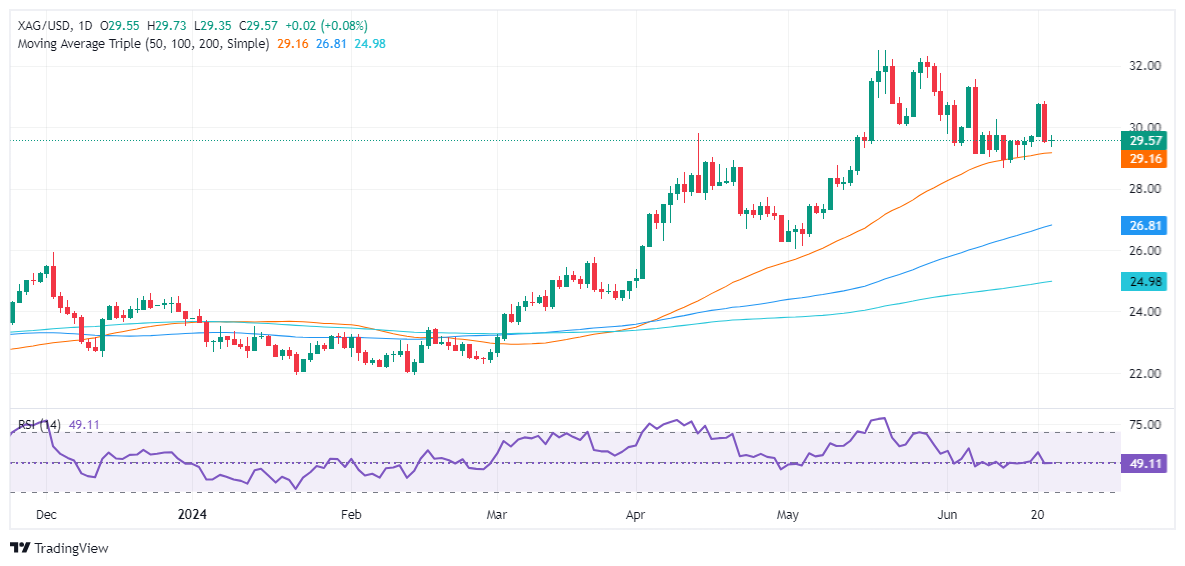
- Silver trades slightly up by 0.16% due to the soft US Dollar.
- Technical outlook shows a bearish engulfing pattern from last week, with RSI indicating bearish momentum.
- Key support levels: 50-DMA at $29.14, $29.00, MTD low at $28.66, and 100-DMA at $26.82.
- Key resistance levels: June 7 high at $31.54, $32.00, and YTD high at $32.51.
Silver prices remain flat on Monday amid firm US Treasury yields and a weaker US Dollar. The XAG/USD trades at $29.58, up a minimal 0.16%.
XAG/USD Price Analysis: Technical outlook
Last week, the grey metal formed a ‘bearish engulfing’ chart pattern, which opened the door for further downside. Momentum shifted in the seller's favor as the Relative Strength Index (RSI) turned bearish, opening the door for further losses.
Given the backdrop, the XAG/USD's first support would be the 50-day moving average (DMA) at $29.14; it will expose $29.00. Breaching this level could lead to the MTD low of $28.66, ahead of a potential drop towards the 100-DMA at $26.82.
On the flip side, if XAG/USD resumes its uptrend, the next resistance level is the June 7 high of $31.54. Clearing this level would target $32.00 before challenging the year-to-date (YTD) high of $32.51.
XAG/USD Price Action – Daily Chart
- WTI rebounded after a near-term dip towards $80.00.
- Energy markets are churning as investors look for firmer signs of supply drawdown.
- Ongoing geopolitical turmoil keeps supply concerns front and center, bolstering prices.
West Texas Intermediate (WTI) US Crude Oil found a firm bid on Monday, rebounding to the $81.50 region after easing within reach of the $80.00 handle. Energy markets remain choppy as investors hope for a broad-market push higher on the possibility of rising demand in the future while trying to shrug off current supplies, which see an increasing overhang on current demand.
Leadership in Israel shrugged off the latest version of a proposed ceasefire between Israeli forces and Palestinian Hamas, keeping Crude Oil markets underpinned as investors continue to bake in the possibility of the ongoing Gaza conflict spilling over into neighboring countries.
Energy investors will be looking ahead to this week’s US Crude Oil stocks updates from the American Petroleum Institute (API) and the Energy Information Administration. Week-on-week counts went in different directions last week, with the API noting a drawdown while the EIA found a slight uptick in supply counts. Crude Oil speculators will be looking for a steeper draw on US Crude Oil supplies as economies head into the summer months, with barrel traders specifically looking for increased fuel demand for cooling and summer travel.
Economic Indicator
API Weekly Crude Oil Stock
API’s Weekly Statistical Bulletin (WSB) has reported total U.S. and regional data relating to refinery operations and the production of the four major petroleum products: motor gasoline, kerosene jet fuel, distillate (by sulfur content), and residual fuel oil. These products represent more than 85% of total petroleum industry.
Read more.Next release: Tue Jun 25, 2024 20:30
Frequency: Weekly
Consensus: -
Previous: 2.264M
Source: American Petroleum Institute
Economic Indicator
EIA Crude Oil Stocks Change
The EIA Crude Oil stockpiles report is a weekly measure of the change in the number of barrels in stock of crude oil and its derivates, and it's released by the Energy Information Administration. This report tends to generate large price volatility, as oil prices impact on worldwide economies, affecting the most, commodity related currencies such as the Canadian dollar. Despite it has a limited impact among currencies, this report tends to affect the price of oil itself, and, therefore, had a more notorious impact on WTI crude futures.
Read more.Next release: Wed Jun 26, 2024 14:30
Frequency: Weekly
Consensus: -
Previous: -2.547M
WTI technical outlook
Bullish intraday momentum has left US Crude Oil stranded in a growing supply zone above the $81.00 handle, with prices growing sluggish at $81.50 and could be poised for an exhaustion pullback to familiar levels. Daily candles are pinned into near-term bull country above the 200-day Exponential Moving Average (EMA) at $78.38, but a rapid rise from the last swing low into $72.45 could leave bullish momentum without a firm technical leg to stand on, and odds are leaning into a return to long-term median prices.
WTI hourly chart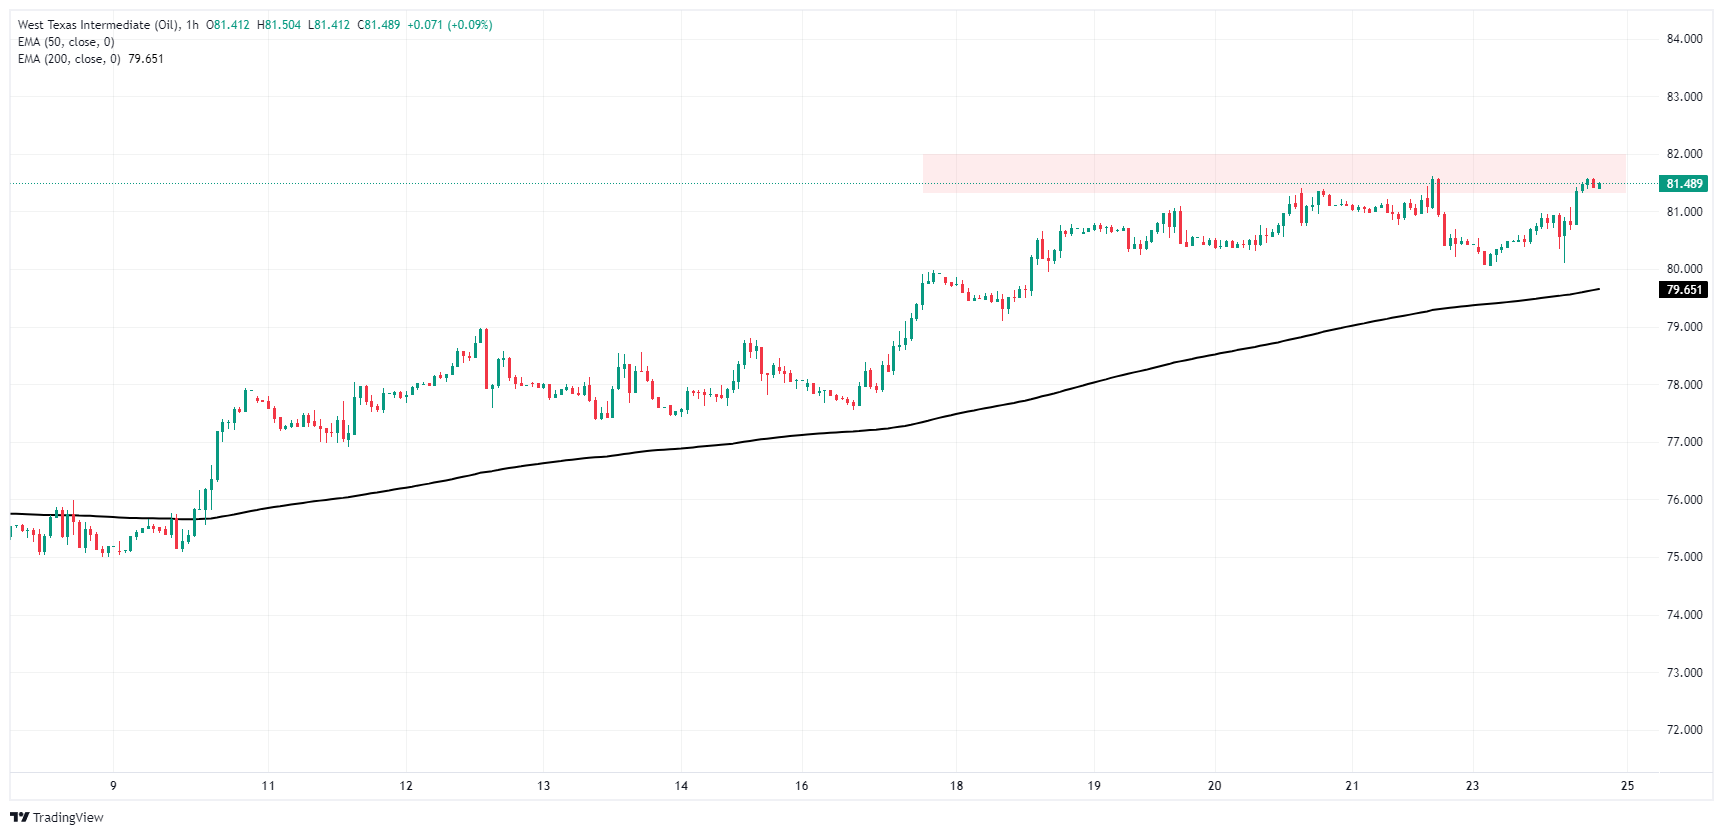
WTI daily chart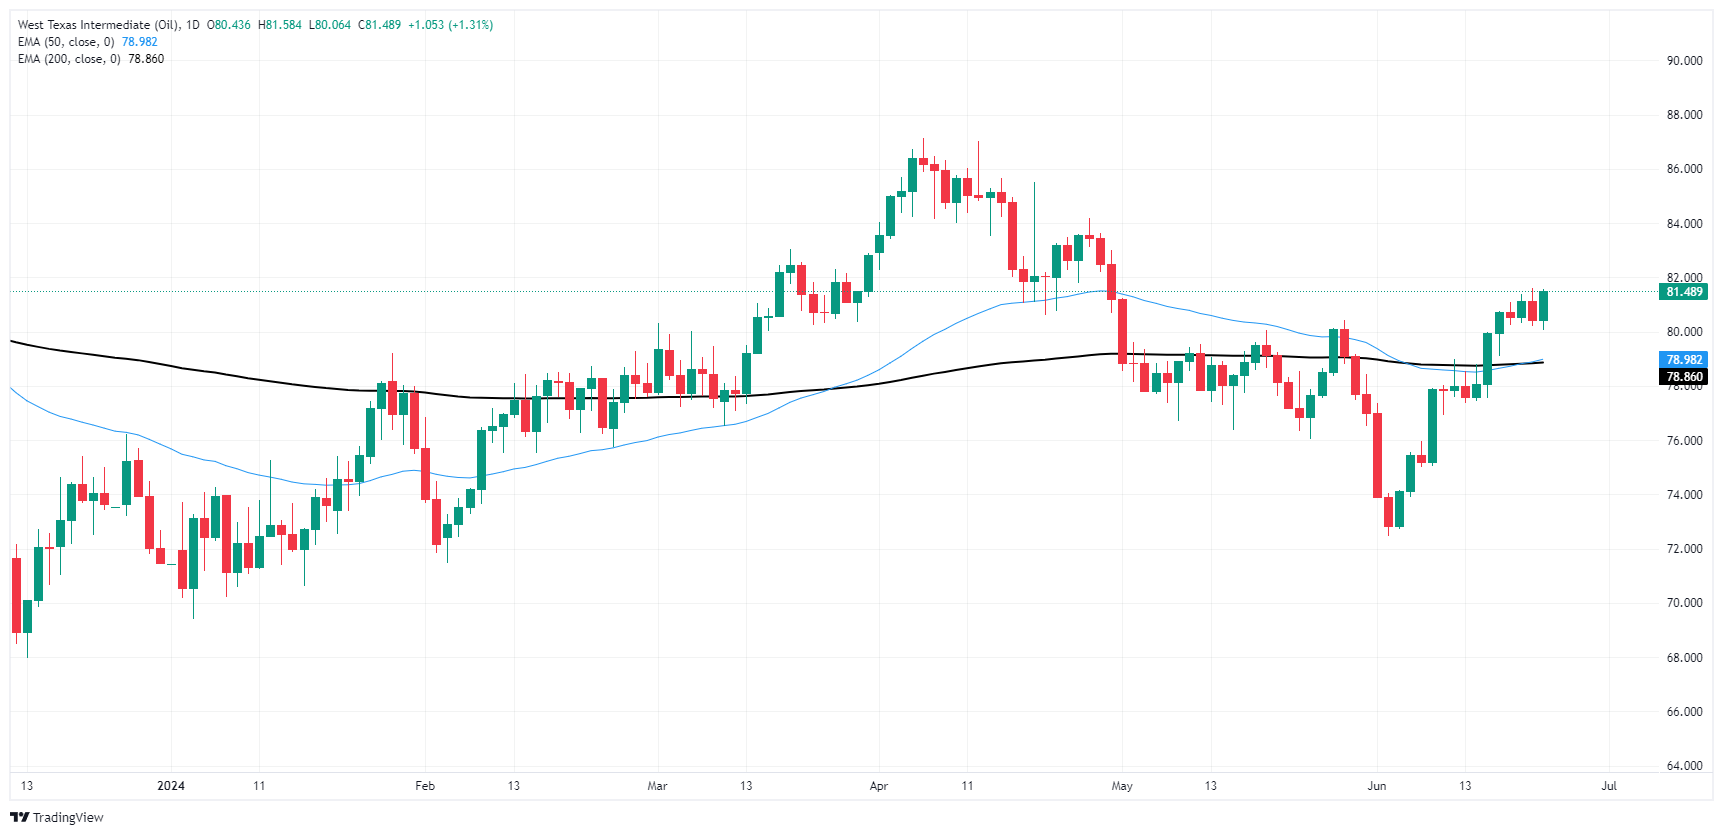
WTI Oil FAQs
WTI Oil is a type of Crude Oil sold on international markets. The WTI stands for West Texas Intermediate, one of three major types including Brent and Dubai Crude. WTI is also referred to as “light” and “sweet” because of its relatively low gravity and sulfur content respectively. It is considered a high quality Oil that is easily refined. It is sourced in the United States and distributed via the Cushing hub, which is considered “The Pipeline Crossroads of the World”. It is a benchmark for the Oil market and WTI price is frequently quoted in the media.
Like all assets, supply and demand are the key drivers of WTI Oil price. As such, global growth can be a driver of increased demand and vice versa for weak global growth. Political instability, wars, and sanctions can disrupt supply and impact prices. The decisions of OPEC, a group of major Oil-producing countries, is another key driver of price. The value of the US Dollar influences the price of WTI Crude Oil, since Oil is predominantly traded in US Dollars, thus a weaker US Dollar can make Oil more affordable and vice versa.
The weekly Oil inventory reports published by the American Petroleum Institute (API) and the Energy Information Agency (EIA) impact the price of WTI Oil. Changes in inventories reflect fluctuating supply and demand. If the data shows a drop in inventories it can indicate increased demand, pushing up Oil price. Higher inventories can reflect increased supply, pushing down prices. API’s report is published every Tuesday and EIA’s the day after. Their results are usually similar, falling within 1% of each other 75% of the time. The EIA data is considered more reliable, since it is a government agency.
OPEC (Organization of the Petroleum Exporting Countries) is a group of 13 Oil-producing nations who collectively decide production quotas for member countries at twice-yearly meetings. Their decisions often impact WTI Oil prices. When OPEC decides to lower quotas, it can tighten supply, pushing up Oil prices. When OPEC increases production, it has the opposite effect. OPEC+ refers to an expanded group that includes ten extra non-OPEC members, the most notable of which is Russia.
- GBP/JPY extends its rally, hitting fresh cycle highs of around 202.50 on Monday.
- Daily RSI and MACD stand near overbought territory.
- Trend remains bullish but overbought conditions suggest potential corrections.
During Monday's session, the GBP/JPY pair sustained its uptrend, hitting new cycle highs around 202.50, reaching its highest point since 2007. Despite sellers making strides earlier in the session, bringing the pair down to a low of 106.14, buyers managed to counteract and propel the pair back to fresh cycle highs.
The Daily Relative Strength Index (RSI) currently sits at 68, settling slightly below the overbought territory. The upsurge recorded in last Friday’s readings hints at remaining bullish momentum, though the swift approach to overbought conditions may suggest a potential incoming correction. The Daily Moving Average Convergence Divergence (MACD) continues to display rising green bars, implying that the bullish momentum is still in the play, albeit approaching a crest.
GBP/JPY daily chart
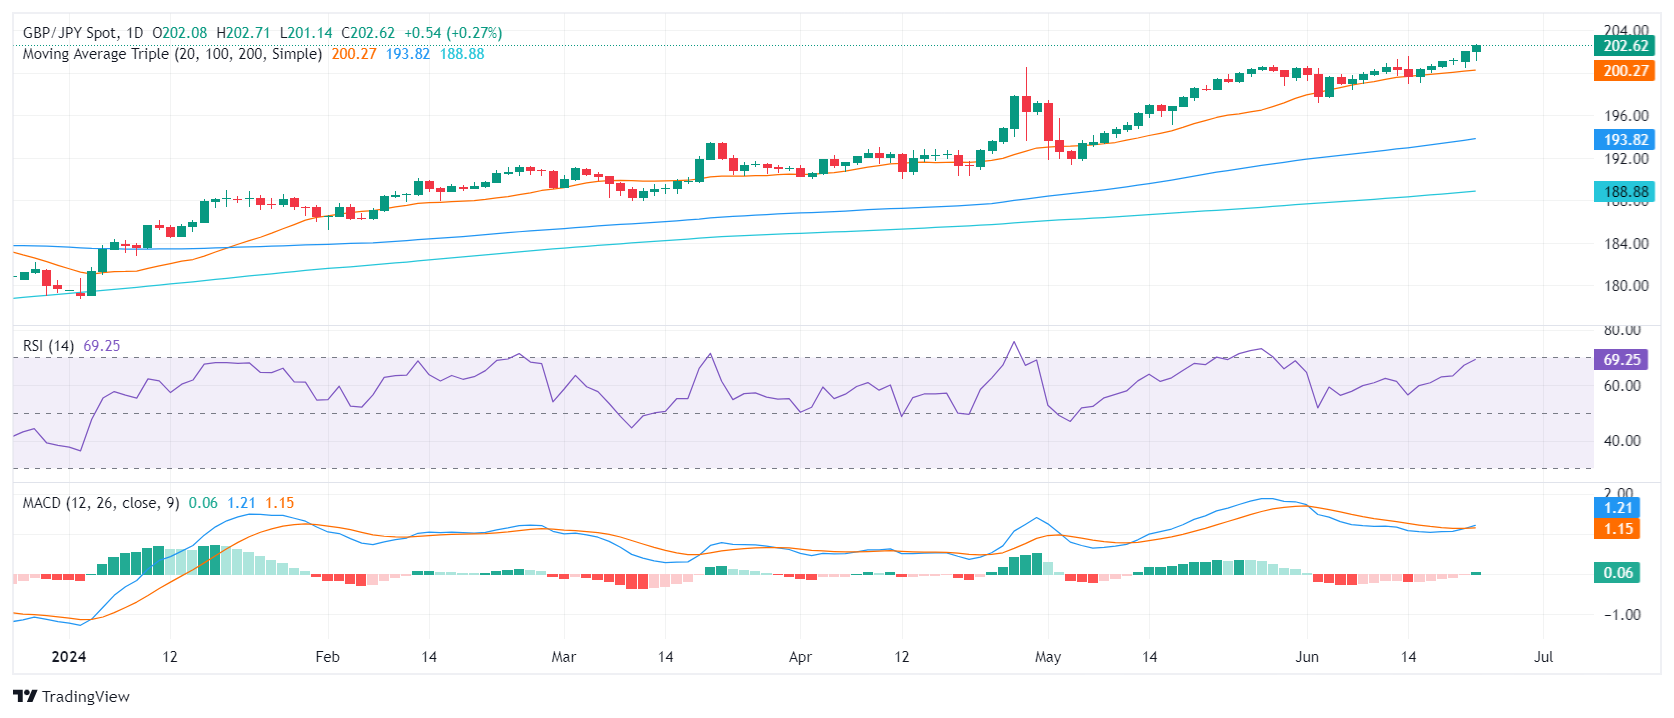
In summary, the GBP/JPY pair's solid performance on Monday underpins a broader bullish trend. The trend's positive outlook is validated by the pair's position above the 20-day, 100-day, and 200-day Simple Moving Averages (SMAs). However, as current indicators suggest over-extended movements, traders might brace for a likely correction event.
If the pair falls below the immediate support level set at 202.00, followed by the 201.00 and 202.20 levels (20-day SMA), it would likely seek new support thresholds at around the 200.00 psychological area. Conversely, resistance is seen near the psychological mark of 203.00 and further at 203.50, in case the bulls persist.
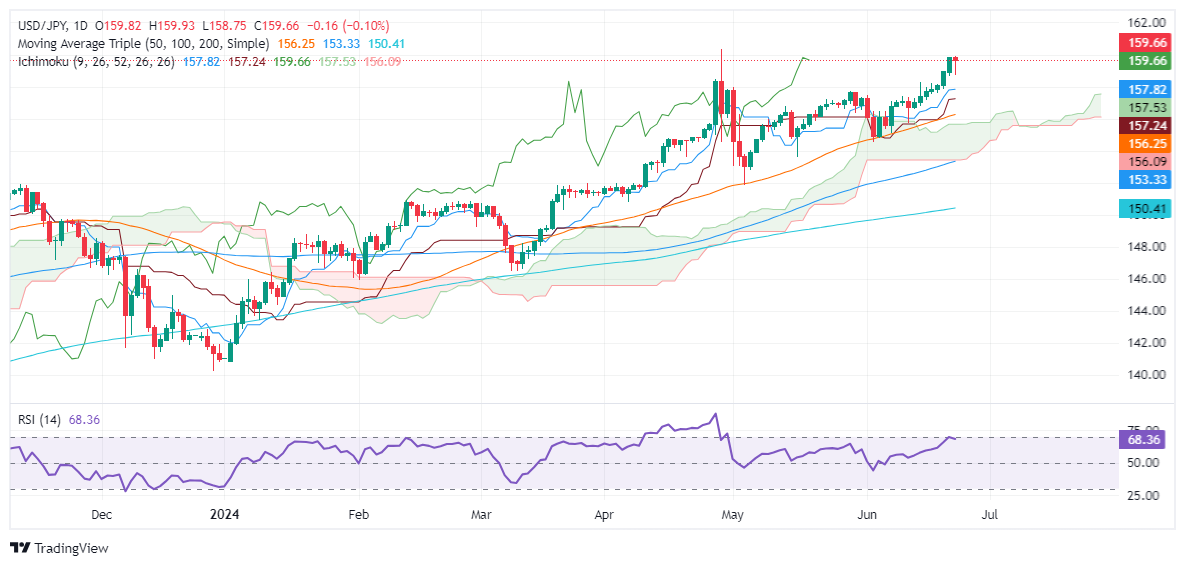
- USD/JPY advances towards 160.00 for the second time in 2024.
- Momentum favors buyers with a bullish RSI, but risks of downward pressure remain.
- Key resistance levels are 160.00, YTD high at 160.32, further gains at 160.50 and 161.00.
- Key support levels are the day's low at 158.75, Tenkan-Sen at 157.82, Senkou Span A at 157.53, and Kijun-Sen at 157.24.
The USD/JPY is flat but advanced steadily towards the 160.00 figure for the second time in 2024 and hit a two-month high of 159.93 before trimming some of earlier gains. The pair trades at 159.65, down some 0.10%, amid Japanese authority's verbal intervention.
USD/JPY Price Analysis: Technical outlook
The USD/JPY has managed to climb back above 159.00, even though traders were reluctant to re-test the Bank of Japan’s (BoJ) patience of intervening in the FX space to tame the Japanese Yen (JPY) depreciation.
Momentum favors buyers, with the Relatives Strength Index (RSI) remaining bullish, but downward risks remain. If the USD/JPY clears the psychological 160.00 mark, the next resistance would be the year-to-date (YTD) high of 160.32. Further gains are seen above 160.50 and at 161.00.
On the other hand, if USD/JPY drops below the day's low of 158.75, that could pave the way for testing key support levels. Up next would be the Tenkan-Sen at 157.82, followed by the Senkou Span A at 157.53, ahead of the Kijun-Sen at 157.24.
USD/JPY Price Action – Daily Chart
- Gold benefits from a weaker US Dollar, and edges up 0.45%, amid firm US Treasury bond yields.
- Investors eye the upcoming PCE Price Index, the Fed’s preferred inflation measure, which could impact rate cut expectations.
- The US Dollar Index (DXY) falls as the CME FedWatch Tool indicates a 66% chance of a rate cut in September, up from 59.5%.
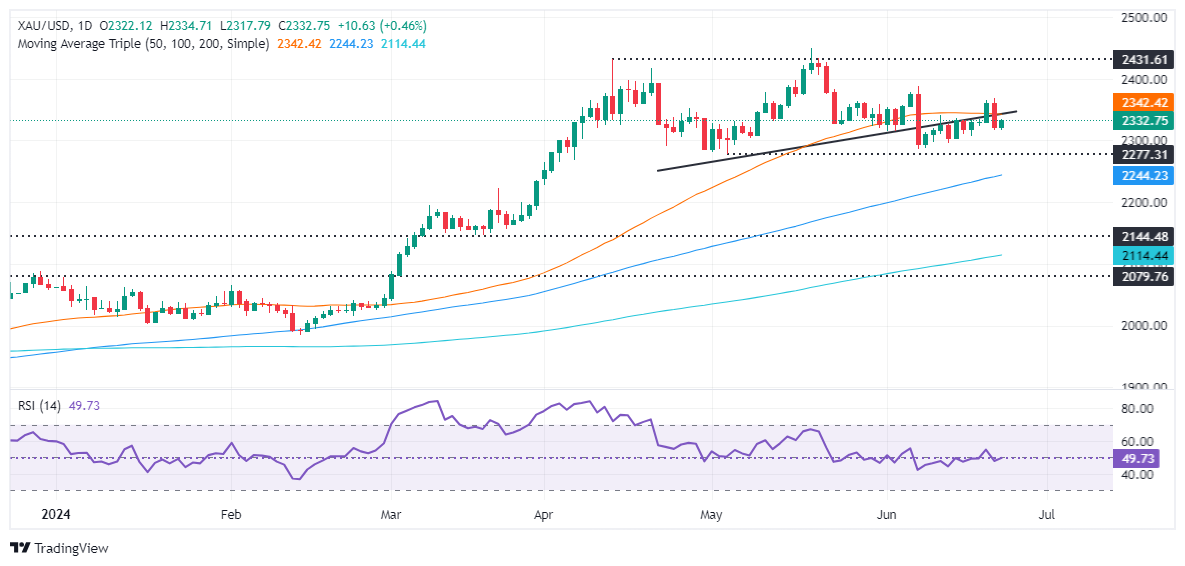
Gold jumped off last Friday’s low and benefitted from a weaker US Dollar on Monday. On Friday, investors are bracing for the release of the Federal Reserve’s preferred gauge for inflation, the Personal Consumption Expenditures (PCE) Price Index. XAU/USD trades at $2,331, up 0.45%, while the Greenback falls amid firm US Treasury bond yields.
Risk appetite deteriorated; investors seeking safety flock to the golden metal. US Treasury bond yields are flat, as depicted by the 10-year Treasury note standing at 4.253% unchanged.
The US Dollar Index (DXY), which tracks the value of American currency against a basket of six other currencies, fell 0.26% to 105.53.
The US economic docket will feature the Fed’s preferred gauge for inflation, the PCE. If the data aligns with the consensus, this will mean that the disinflation process is evolving as Fed policymakers expect and increase the chances for an interest rate cut as soon as September.
According to the CME FedWatch Tool, traders are pricing in a 66% chance of easing in September, up from 59.5%.
In the meantime, San Francisco Fed President Mary Daly said the labor market is ‘nearing” an inflection point, where further weakening will signify higher unemployment. Daly’s comments signal she’s leaning dovish as she added, “At this point, inflation is not the only risk we face.”
The December 2024 federal funds rate futures contract implies the Fed will ease policy by just 36 basis points (bps) toward the end of the year.
Daily digest market movers: Gold price advances on a soft US Dollar
- Headline PCE is expected to hit 0% in May, lower than April’s 0.3%, and in the twelve months to May, to edge lower from 2.7% to 2.6%.
- Core PCE is foreseen at 0.1% MoM, down from 0.2%, and on an annual basis, is estimated to dip from 2.8% to 2.6%.
- Last week’s US economic data was mixed. On the growth side, the economy remains robust via strong S&P Global Flash PMIs and a slowdown in Retail Sales. Nevertheless, it shows some weakness on the labor market side.
- Fed officials advised patience regarding interest rate cuts, emphasizing that their decisions would remain data dependent. Despite last week's positive CPI report, policymakers reiterated the need to see more data like May's before considering any changes.
Technical analysis: Gold price climbs and test Head-and-Shoulders neckline at around $2,330
Gold price remains downward biased after forming a ‘bearish-engulfing’ chart pattern on Friday. This further validates the Head-and-Shoulders chart pattern, meaning that further downside is expected for the non-yielding metal
The XAU/USD next support would be $2,300. Once cleared, XAU/USD would fall to $2,277, the May 3 low, followed by the March 21 high of $2,222. Further losses lie underneath, with sellers eyeing the Head-and-Shoulders chart pattern objective from $2,170 to $2,160.
Conversely, if Gold reclaims $2,350, that will expose additional key resistance levels like the June 7 cycle high of $2,387, ahead of challenging the $2,400 figure.
Gold FAQs
Gold has played a key role in human’s history as it has been widely used as a store of value and medium of exchange. Currently, apart from its shine and usage for jewelry, the precious metal is widely seen as a safe-haven asset, meaning that it is considered a good investment during turbulent times. Gold is also widely seen as a hedge against inflation and against depreciating currencies as it doesn’t rely on any specific issuer or government.
Central banks are the biggest Gold holders. In their aim to support their currencies in turbulent times, central banks tend to diversify their reserves and buy Gold to improve the perceived strength of the economy and the currency. High Gold reserves can be a source of trust for a country’s solvency. Central banks added 1,136 tonnes of Gold worth around $70 billion to their reserves in 2022, according to data from the World Gold Council. This is the highest yearly purchase since records began. Central banks from emerging economies such as China, India and Turkey are quickly increasing their Gold reserves.
Gold has an inverse correlation with the US Dollar and US Treasuries, which are both major reserve and safe-haven assets. When the Dollar depreciates, Gold tends to rise, enabling investors and central banks to diversify their assets in turbulent times. Gold is also inversely correlated with risk assets. A rally in the stock market tends to weaken Gold price, while sell-offs in riskier markets tend to favor the precious metal.
The price can move due to a wide range of factors. Geopolitical instability or fears of a deep recession can quickly make Gold price escalate due to its safe-haven status. As a yield-less asset, Gold tends to rise with lower interest rates, while higher cost of money usually weighs down on the yellow metal. Still, most moves depend on how the US Dollar (USD) behaves as the asset is priced in dollars (XAU/USD). A strong Dollar tends to keep the price of Gold controlled, whereas a weaker Dollar is likely to push Gold prices up.
- Australian Dollar’s downside is limited by hawkish RBA outlook.
- Market delays expectation for RBA interest rate cuts to February 2025.
- May’s CPI figures will be key for markets to place their bets on the next RBA moves.
Monday's session noted a recovery in the Australian Dollar (AUD) and the AUD/USD found support at the 0.6640 threshold, where the 20-day Simple Moving Average (SMA) converges. The highlight will be Australian inflation data eyed to shape ensuing RBA decisions.
In Australia, despite noticeable frailties in the economy, stubborn inflation continues to clog the Reserve Bank of Australia's (RBA) road to potential interest rate cuts, thus setting a possible limit to the downside pressure on the Aussie. The RBA is now placed among the last G10 nations' central banks to initiate rate cuts, with this stance expected to bolster the Australian Dollar's upcoming gains.
Daily Digest Market Movers: Aussie up ahead of key May CPI
- Investors are now eagerly waiting for Wednesday's release of the May Consumer Price Index (CPI) data, expecting the headline inflation to sneak up two points to reach a five-month high of 3.8% YoY.
- The swaps market hints at virtually no rate cuts in 2024 and around 70% odds of the first cut in February 2025, hinting at the RBA's hawkish approach toward tackling inflation.
- Last week, Governor Bullock uncovered the RBA's inclination and sent the markets a clear message of resilience in the face of inflationary pressures. The Board's insistence that "inflation remains above target and is proving persistent" and its expectation that it "will be some time yet before inflation is sustainably in the target range", further asserts the central bank's tough stance.
- As the RBA doesn’t consider rate cuts, the Aussie’s downside is limited.
Technical analysis: AUD/USD recovers, buyers defend 20-day SMA
On the technical front, flat movements are noted as the Relative Strength Index (RSI) remains above 50 but flattened. Simultaneously, the Moving Average Convergence Divergence (MACD) lingers in negative territory with steady red bars. The upcoming sessions hinge on the buyers maintaining the AUD/USD pair above the 20-day Simple Moving Average (SMA), whose strong defense is currently casting a positive light on the pair’s future outlook.
Australian Dollar FAQs
One of the most significant factors for the Australian Dollar (AUD) is the level of interest rates set by the Reserve Bank of Australia (RBA). Because Australia is a resource-rich country another key driver is the price of its biggest export, Iron Ore. The health of the Chinese economy, its largest trading partner, is a factor, as well as inflation in Australia, its growth rate and Trade Balance. Market sentiment – whether investors are taking on more risky assets (risk-on) or seeking safe-havens (risk-off) – is also a factor, with risk-on positive for AUD.
The Reserve Bank of Australia (RBA) influences the Australian Dollar (AUD) by setting the level of interest rates that Australian banks can lend to each other. This influences the level of interest rates in the economy as a whole. The main goal of the RBA is to maintain a stable inflation rate of 2-3% by adjusting interest rates up or down. Relatively high interest rates compared to other major central banks support the AUD, and the opposite for relatively low. The RBA can also use quantitative easing and tightening to influence credit conditions, with the former AUD-negative and the latter AUD-positive.
China is Australia’s largest trading partner so the health of the Chinese economy is a major influence on the value of the Australian Dollar (AUD). When the Chinese economy is doing well it purchases more raw materials, goods and services from Australia, lifting demand for the AUD, and pushing up its value. The opposite is the case when the Chinese economy is not growing as fast as expected. Positive or negative surprises in Chinese growth data, therefore, often have a direct impact on the Australian Dollar and its pairs.
Iron Ore is Australia’s largest export, accounting for $118 billion a year according to data from 2021, with China as its primary destination. The price of Iron Ore, therefore, can be a driver of the Australian Dollar. Generally, if the price of Iron Ore rises, AUD also goes up, as aggregate demand for the currency increases. The opposite is the case if the price of Iron Ore falls. Higher Iron Ore prices also tend to result in a greater likelihood of a positive Trade Balance for Australia, which is also positive of the AUD.
The Trade Balance, which is the difference between what a country earns from its exports versus what it pays for its imports, is another factor that can influence the value of the Australian Dollar. If Australia produces highly sought after exports, then its currency will gain in value purely from the surplus demand created from foreign buyers seeking to purchase its exports versus what it spends to purchase imports. Therefore, a positive net Trade Balance strengthens the AUD, with the opposite effect if the Trade Balance is negative.
Federal Reserve (Fed) Bank of San Francisco President Mary Daly noted on Monday that despite recent relief in inflation figures, the Fed will have no choice but to keep policy rates pinned higher for longer if price growth doesn't continue cooling to the Fed's 2% target range.
Key highlights
Inflation is not the only risk.
We have made a lot of progress on inflation, there is still work to do.
The bumpiness of inflation data so far this year has not inspired confidence.
We must fully restore price stability without a painful disruption to the economy.
If inflation falls rapidly or the labor market softens more than expected, lowering the policy rate would be necessary.
If inflation falls more slowly than expected, the policy rate must stay higher for longer.
We are nearer to a point where benign outcome on labor market could be less likely.
At this point, we have a good labor market, not a frothy one.
Restrained demand, not improved supply is likely needed to get inflation to 2% goal.
Recent inflation readings are more encouraging, but it's hard to know if we're on track to sustainable price stability.
Bank of Canada (BoC) Governor Tiff Macklem touched on monetary policy during a luncheon on Monday. Further points are expected from the BoC Governor later in the day.
Key highlights
We continue to think that we don't need a large rise in the jobless rate to get inflation back to the target.
With inflation now much lower and the labor market rebalancing, we are starting to see evidence that wage growth is moderating.
Some people are finding it harder to get a job, particularly young people and newcomers to Canada.
Signs of financial stress are particularly evident among renters, who are often younger workers and newcomers.
We can't rule out new bumps but increasingly we look to be on our way to hitting the target.
There is room for the Canadian economy to grow and add jobs even as inflation moves closer to the 2% target.
In assessing implications of wage growth for labor costs and inflation, it is important to separate out wage gains that reflect productivity improvements.
The government has some room to slow the growth of non-permanent residents without tightening the labor market too much.
Going forward we will be looking for wage growth to moderate further.
- Dow Jones is the clear winner of the major US equity indexes on Monday.
- The Dow Jones is up over three-quarters of one percent to kick off the trading week.
- Key US data data due later in the week as rate cut hopes grip September.
The Dow Jones Industrial Average (DJIA) gained ground on Monday, extending a near-term rebound and on pace to see one of its best single-day performances in June. Treasuries are holding flat and investor sentiment, while mixed, is holding broadly in place as rate cut hopes continue to hold out for a September rate trim.
Key US data looms ahead later in the week, with an update to annualized US Gross Domestic Product (GDP) for the first quarter on Thursday and a new print of US Personal Consumption Expenditure (PCE) Price Index inflation slated for Friday. Investors will broadly be looking for cooling inflation metrics and slightly soft economic figures to drive the Federal Reserve (Fed) towards a rate cut in September, but both too-good and too-bad figures will spark a dogpile into safe havens.
Dow Jones news
The Dow Jones is broadly higher on Monday, with over two-thirds of the index’s securities seeing green to kick off the new trading week. Salesforce Inc. (CRM) still struggled on the day, backsliding -1.75% and falling to $240.00 per share as the digital management software company struggles to capitalize on the broad-market AI splurge.
Familiar crowd favorites Chevron Corp. (CVX), Amgen Inc. (AMGN), and International Business Machines Corp. (IBM) are all up over 2% on the day as investor appetite bids up the big name houses. Chevron rose above $158.00 per share, with Amgen climbing to $314.81 and IBM testing $176.00 per share.
Dow Jones technical outlook
The Dow Jones tested a fresh five-week high on Monday, clipping into 39,581.81 before cooling off in the back half of the day’s US market session. The index has climbed 4% after hitting a near-term bottom at the 38,000.00 handle.
There is still plenty of ground to cover before bulls can pierce into new all-time highs above the 40,000.00 major handle, but shorts will have an equally hard time pushing back to major long-term technical support at the 200-day Exponential Moving Average (EMA) at 37,462.29.
Dow Jones five minute chart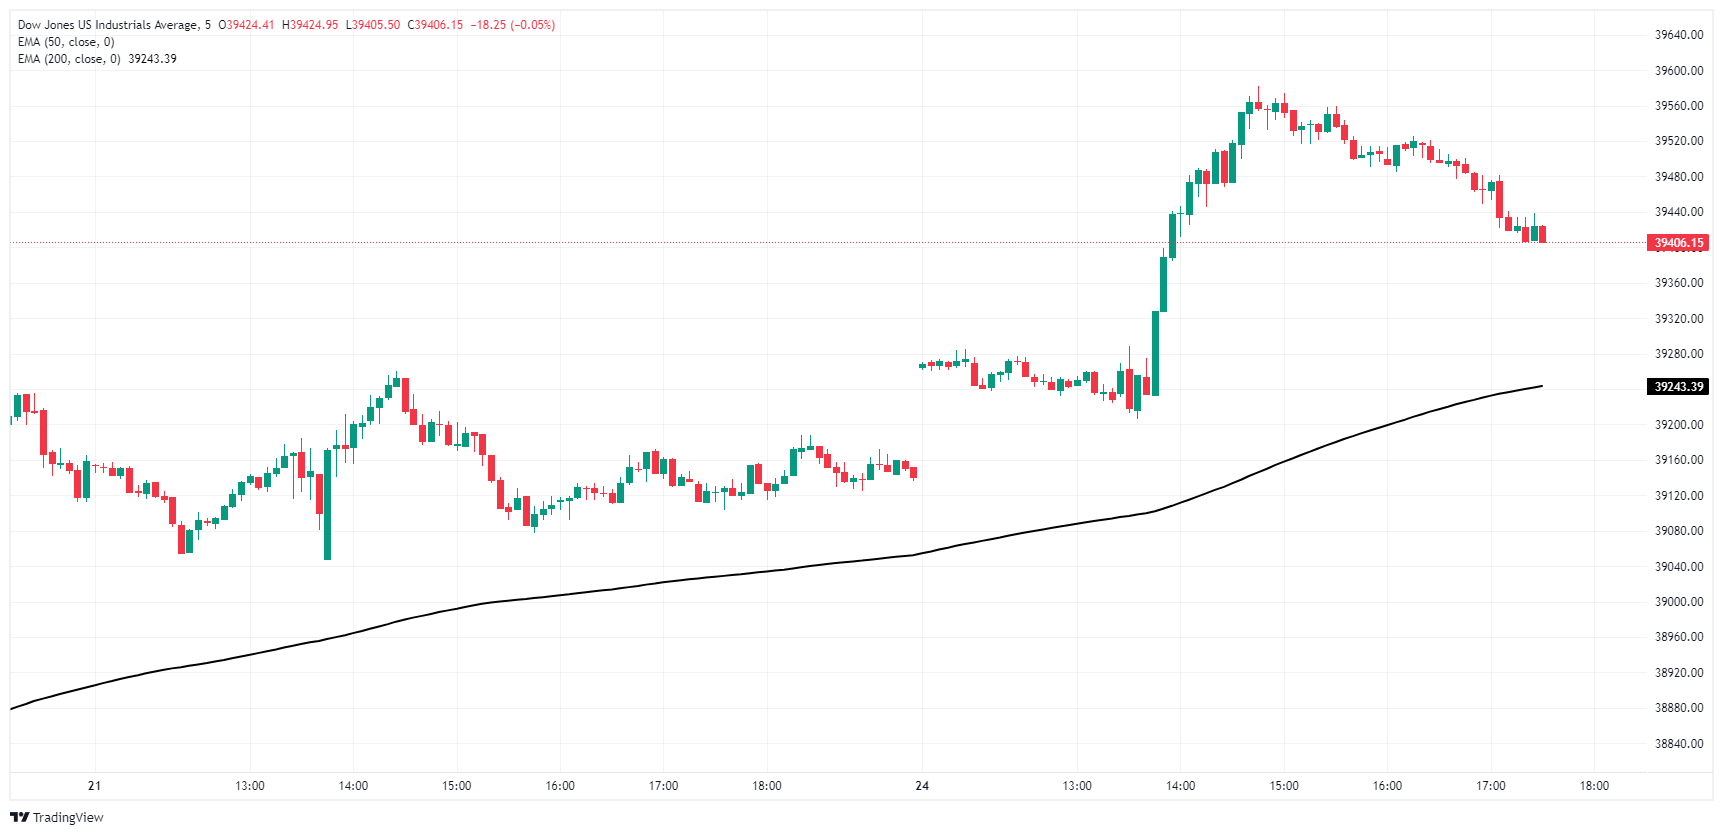
Dow Jones daily chart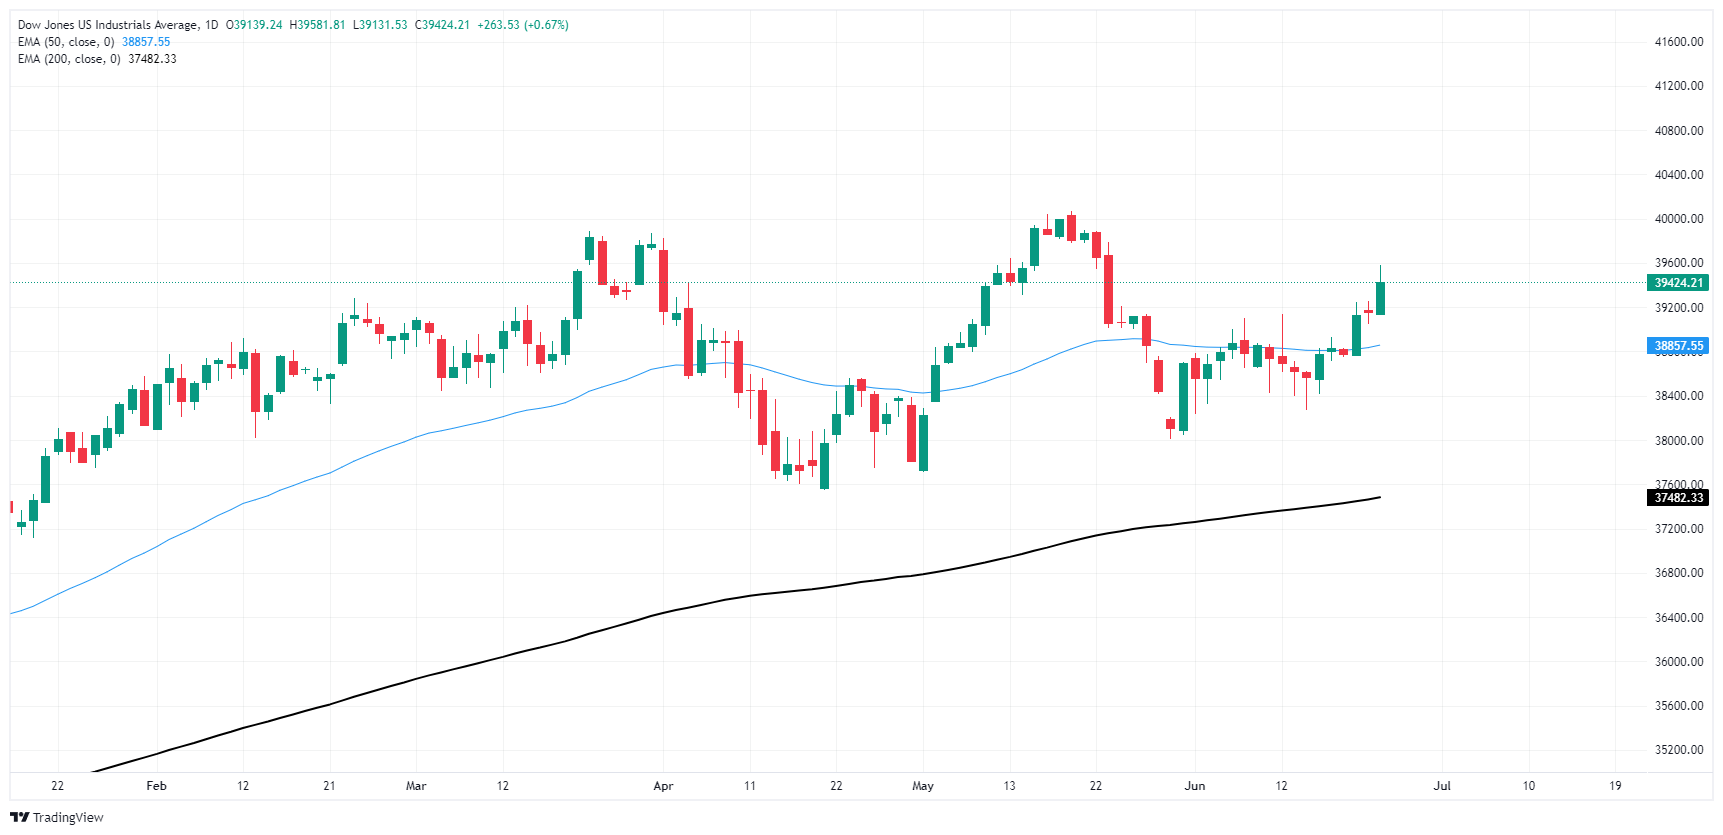
Dow Jones FAQs
The Dow Jones Industrial Average, one of the oldest stock market indices in the world, is compiled of the 30 most traded stocks in the US. The index is price-weighted rather than weighted by capitalization. It is calculated by summing the prices of the constituent stocks and dividing them by a factor, currently 0.152. The index was founded by Charles Dow, who also founded the Wall Street Journal. In later years it has been criticized for not being broadly representative enough because it only tracks 30 conglomerates, unlike broader indices such as the S&P 500.
Many different factors drive the Dow Jones Industrial Average (DJIA). The aggregate performance of the component companies revealed in quarterly company earnings reports is the main one. US and global macroeconomic data also contributes as it impacts on investor sentiment. The level of interest rates, set by the Federal Reserve (Fed), also influences the DJIA as it affects the cost of credit, on which many corporations are heavily reliant. Therefore, inflation can be a major driver as well as other metrics which impact the Fed decisions.
Dow Theory is a method for identifying the primary trend of the stock market developed by Charles Dow. A key step is to compare the direction of the Dow Jones Industrial Average (DJIA) and the Dow Jones Transportation Average (DJTA) and only follow trends where both are moving in the same direction. Volume is a confirmatory criteria. The theory uses elements of peak and trough analysis. Dow’s theory posits three trend phases: accumulation, when smart money starts buying or selling; public participation, when the wider public joins in; and distribution, when the smart money exits.
There are a number of ways to trade the DJIA. One is to use ETFs which allow investors to trade the DJIA as a single security, rather than having to buy shares in all 30 constituent companies. A leading example is the SPDR Dow Jones Industrial Average ETF (DIA). DJIA futures contracts enable traders to speculate on the future value of the index and Options provide the right, but not the obligation, to buy or sell the index at a predetermined price in the future. Mutual funds enable investors to buy a share of a diversified portfolio of DJIA stocks thus providing exposure to the overall index.
- Mexican Peso appreciates for third consecutive day, hits daily low below 18.00 against US Dollar.
- June’s mid-month inflation data shows core figures declining, while general inflation expands but stalls compared to May.
- Analysts revise Banxico rate cut expectations from June to August, with Citibanamex survey adjusting USD/MXN forecast from 18.00 to 18.70.
The Mexican Peso recovered and appreciated for the third consecutive trading day against the US Dollar as investors braced for the Bank of Mexico's (Banxico) next monetary policy decision on Thursday. Analysts became more skeptical that the Mexican institution would lower rates following a more than 6.90% depreciation of the Peso following the June 2 general election. The USD/MXN trades at 18.02, down 0.29%.
Mexico’s economic docket featured June’s mid-month inflation data. Core figures continued to decline, while general inflation expanded above estimates but stalled compared to May’s data. After the data, the USD/MXN tumbled to an 11-day low and tested the 18.00 psychological level as investors brace for Banxico’s decision.
The Citibanamex survey showed that most analysts seemed sure Banxico would continue to ease policy but shifted the next rate cut from June to August. Additionally, economists priced out fewer rate cuts by the central bank while adjusting the USD/MXN exchange rate forecast from 18.00 in the previous report to 18.70.
Regarding economic growth, the consensus revised the Gross Domestic Product (GDP) for 2024 downward from 2.2% to 2.1% YoY.
Across the border, Federal Reserve (Fed) officials remained cautious. Chicago Fed President Austan Goolsbee expressed that policy is restrictive and that he’s optimistic that he’ll see an improvement in inflation data.
Daily digest market movers: Mexican Peso advances as inflation jumps in June
- Mexico’s June mid-month Consumer Price Index rose by 0.21% MoM, above estimates, and expanded by 4.78% annually, unchanged from the previous reading and higher than the 4.70% estimate.
- Core inflation rose below estimates of 0.18% MoM, reaching 0.17%. Annually, it was below estimates and the previous reading of 4.17%.
- Citibanamex Survey showed that most analysts estimate Banxico’s next rate cut will come at the August 8 meeting and that interest rates will be lowered from 11.00% to 10.25%, up from 10%.
- USD/MXN stabilizes following last week’s verbal intervention by Banxico Governor Victoria Rodriguez Ceja, who stated that the central bank is attentive to volatility in the Mexican currency exchange rate and could restore "order" in the markets.
- USD/MXN is extending its losses due to a softer US Dollar. The US Dollar Index (DXY), which tracks the Greenback’s value against a basket of six other currencies, dropped 0.28% to 105.53.
- CME FedWatch Tool shows odds for a 25-basis-point Fed rate cut at 61.1%, up from 59.5% last Friday.
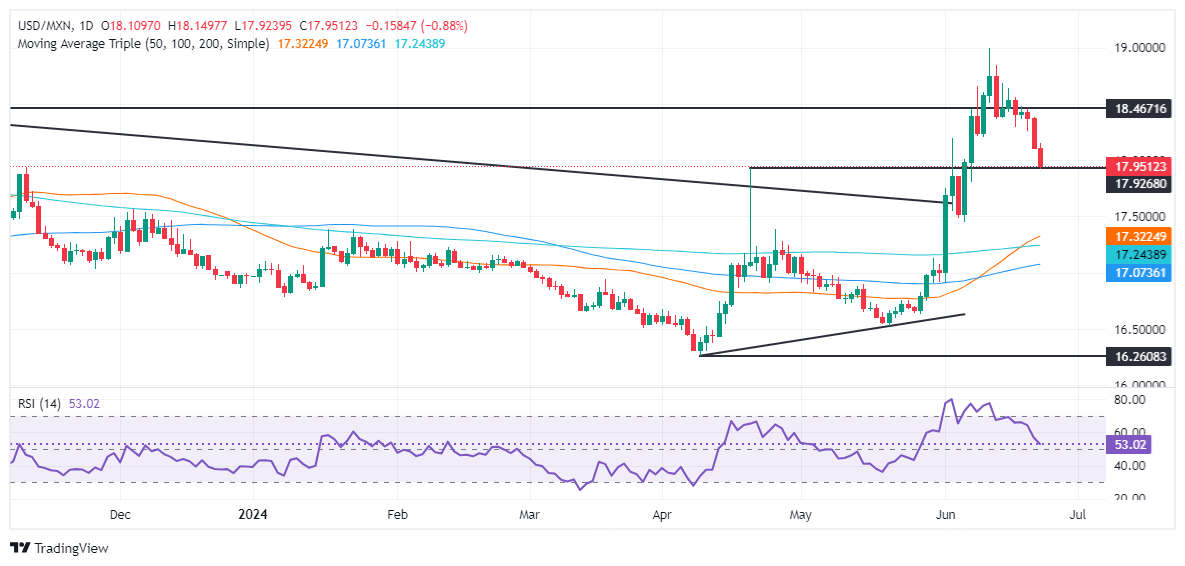
Technical analysis: Mexican Peso surges as USD/MXN falls below 18.00
The USD/MXN uptrend remains in place, though the ongoing pullback from around 18.37 to below the 18.00 figure could pave the way to challenge the 50-day Simple Moving Average (SMA) at 17.37 before testing the 200-day SMA at 17.23. Once those two levels are cleared, the next stop would be the 100-day SMA at 17.06.
Although momentum shows sellers are in charge, the Relative Strength Index (RSI) remains above the 50-neutral line. That said, traders should be cautious about whether the USD/MXN could reverse its ongoing downtrend.
For a bullish continuation, the USD/MXN must clear 18.50 if buyers want to retest the year-to-date high of 18.99. A breach of the latter will expose the March 20, 2023, high of 19.23. If that price is cleared, this will sponsor an uptick to 19.50.
Mexican Peso FAQs
The Mexican Peso (MXN) is the most traded currency among its Latin American peers. Its value is broadly determined by the performance of the Mexican economy, the country’s central bank’s policy, the amount of foreign investment in the country and even the levels of remittances sent by Mexicans who live abroad, particularly in the United States. Geopolitical trends can also move MXN: for example, the process of nearshoring – or the decision by some firms to relocate manufacturing capacity and supply chains closer to their home countries – is also seen as a catalyst for the Mexican currency as the country is considered a key manufacturing hub in the American continent. Another catalyst for MXN is Oil prices as Mexico is a key exporter of the commodity.
The main objective of Mexico’s central bank, also known as Banxico, is to maintain inflation at low and stable levels (at or close to its target of 3%, the midpoint in a tolerance band of between 2% and 4%). To this end, the bank sets an appropriate level of interest rates. When inflation is too high, Banxico will attempt to tame it by raising interest rates, making it more expensive for households and businesses to borrow money, thus cooling demand and the overall economy. Higher interest rates are generally positive for the Mexican Peso (MXN) as they lead to higher yields, making the country a more attractive place for investors. On the contrary, lower interest rates tend to weaken MXN.
Macroeconomic data releases are key to assess the state of the economy and can have an impact on the Mexican Peso (MXN) valuation. A strong Mexican economy, based on high economic growth, low unemployment and high confidence is good for MXN. Not only does it attract more foreign investment but it may encourage the Bank of Mexico (Banxico) to increase interest rates, particularly if this strength comes together with elevated inflation. However, if economic data is weak, MXN is likely to depreciate.
As an emerging-market currency, the Mexican Peso (MXN) tends to strive during risk-on periods, or when investors perceive that broader market risks are low and thus are eager to engage with investments that carry a higher risk. Conversely, MXN tends to weaken at times of market turbulence or economic uncertainty as investors tend to sell higher-risk assets and flee to the more-stable safe havens.
- US Dollar closed out a strong week and opened Monday on a soft note.
- Fed officials offer cautionary advice concerning easing cycles amidst mixed signals in the economic outlook.
- May’s PCE data will be key, as well as GDP revisions.
On Monday, the US Dollar, as portrayed by the Dollar Index (DXY), declined to 105.50, following a series of gains since early May, with investors seeming to capitalize on profits ahead of a tumultuous week.
As for the US economic outlook, a mixed picture prevails with some signs of disinflation. However, Federal Reserve (Fed) officials have chosen a cautious stance and have yet to fully adopt easing cycles. This guarded approach by the Fed continues to create an atmosphere of suspense regarding market expectations.
Daily digest market movers: US Dollar staying course, eyes on crucial data
- On Tuesday, investors will eye the Conference Board confidence report. Headline figures are expected to drop slightly to 100, hinting at tepid consumer spending activity.
- Moving to Thursday, the Gross Domestic Product (GDP) revisions for the year are anticipated to hold steady at 1.3%.
- Friday will signify a pivotal event as the May Personal Consumption Expenditures (PCE), the Fed’s preferred gauge of inflation data is due for release.
- Both headline and core PCE are expected to drop to 2.6% YoY from 2.7% and 2.8%, respectively, in April.
- Despite encouraging progress on inflation, multiple Fed officials, including Chair Powell, recommended that markets maintain composure and not exaggerate the implications of one or two months of favorable data.
- However, the market pins November as the most likely time frame for a cut but is expecting a 70% chance of a cut in September. Forthcoming data will prove to be instrumental in creating market bets.
DXY technical analysis: Positive trajectory maintained despite losses
The technical environment still portrays a positive layout with indicators situated in favorable territory. The Relative Strength Index (RSI) remains above 50, however, it inclines downward. The Moving Average Convergence Divergence (MACD) keeps constructing green bars, implying that bulls seem to be holding their grip.
Consistently, the DXY Index retains its stance above the 20, 100 and 200-day Simple Moving Averages (SMAs). Coupling these conditions with climbing indicators, it seems that the US Dollar (USD) could witness additional gains, mainly if it holds the 20-day SMA.
US Dollar FAQs
The US Dollar (USD) is the official currency of the United States of America, and the ‘de facto’ currency of a significant number of other countries where it is found in circulation alongside local notes. It is the most heavily traded currency in the world, accounting for over 88% of all global foreign exchange turnover, or an average of $6.6 trillion in transactions per day, according to data from 2022. Following the second world war, the USD took over from the British Pound as the world’s reserve currency. For most of its history, the US Dollar was backed by Gold, until the Bretton Woods Agreement in 1971 when the Gold Standard went away.
The most important single factor impacting on the value of the US Dollar is monetary policy, which is shaped by the Federal Reserve (Fed). The Fed has two mandates: to achieve price stability (control inflation) and foster full employment. Its primary tool to achieve these two goals is by adjusting interest rates. When prices are rising too quickly and inflation is above the Fed’s 2% target, the Fed will raise rates, which helps the USD value. When inflation falls below 2% or the Unemployment Rate is too high, the Fed may lower interest rates, which weighs on the Greenback.
In extreme situations, the Federal Reserve can also print more Dollars and enact quantitative easing (QE). QE is the process by which the Fed substantially increases the flow of credit in a stuck financial system. It is a non-standard policy measure used when credit has dried up because banks will not lend to each other (out of the fear of counterparty default). It is a last resort when simply lowering interest rates is unlikely to achieve the necessary result. It was the Fed’s weapon of choice to combat the credit crunch that occurred during the Great Financial Crisis in 2008. It involves the Fed printing more Dollars and using them to buy US government bonds predominantly from financial institutions. QE usually leads to a weaker US Dollar.
Quantitative tightening (QT) is the reverse process whereby the Federal Reserve stops buying bonds from financial institutions and does not reinvest the principal from the bonds it holds maturing in new purchases. It is usually positive for the US Dollar.
- Canadian Dollar found room up top, bolstered by floundering Greenback.
- Canada to deliver update on CPI inflation on Tuesday.
- Risk appetite remains subdued as markets await signs of rate cuts.
The Canadian Dollar (CAD) found some room on the high side on Monday, easing higher as the US Dollar softly receded across the board. Investors have little meaningful information to chew on to kick off the new trading week, leaving market sentiment adrift.
Canada will deliver an update on Canadian Consumer Price Index (CPI) inflation on Tuesday. Outside of Friday’s upcoming Canadian Gross Domestic Product (GDP) print, this week's agenda includes little else, save for a Monday appearance from Bank of Canada (BoC) Governor Tiff Macklem. USD traders will also have a long wait for US Durable Goods Orders and US Personal Consumption Expenditures (PCE) Price Index, both of which are due on Friday.
Daily digest market movers: Thin Monday leaves Canadian Dollar to drift higher
- Canadian Dollar is broadly higher on Monday, but gains remain thin. The CAD is up a third of a percent against the US Dollar, while shedding one-tenth of one percent against the Euro.
- Canada’s Tuesday CPI print will be the key release for CAD traders this week, with Canadian GDP far off in the distance.
- Canada’s CPI inflation is expected to tick lower to 2.6% from 2.7% for the year ended in May.
- BoC’s own CPI core inflation metric is forecast to hold flat at 0.2% MoM.
- Broad-market focus will be looking ahead to Friday’s US PCE Price Index inflation print as investors continue to cling to hopes for a September rate cut from the Federal Reserve (Fed).
Canadian Dollar PRICE Today
The table below shows the percentage change of Canadian Dollar (CAD) against listed major currencies today. Canadian Dollar was the strongest against the Swiss Franc.
| USD | EUR | GBP | JPY | CAD | AUD | NZD | CHF | |
|---|---|---|---|---|---|---|---|---|
| USD | -0.34% | -0.32% | -0.06% | -0.23% | -0.22% | -0.11% | 0.00% | |
| EUR | 0.34% | 0.04% | 0.34% | 0.15% | 0.14% | 0.27% | 0.41% | |
| GBP | 0.32% | -0.04% | 0.24% | 0.11% | 0.10% | 0.24% | 0.38% | |
| JPY | 0.06% | -0.34% | -0.24% | -0.17% | -0.12% | -0.01% | 0.06% | |
| CAD | 0.23% | -0.15% | -0.11% | 0.17% | 0.03% | 0.13% | 0.28% | |
| AUD | 0.22% | -0.14% | -0.10% | 0.12% | -0.03% | 0.13% | 0.27% | |
| NZD | 0.11% | -0.27% | -0.24% | 0.00% | -0.13% | -0.13% | 0.13% | |
| CHF | -0.00% | -0.41% | -0.38% | -0.06% | -0.28% | -0.27% | -0.13% |
The heat map shows percentage changes of major currencies against each other. The base currency is picked from the left column, while the quote currency is picked from the top row. For example, if you pick the Canadian Dollar from the left column and move along the horizontal line to the US Dollar, the percentage change displayed in the box will represent CAD (base)/USD (quote).
Technical analysis: Canadian Dollar finds fresh highs against Greenback on thin Monday
The Canadian Dollar (CAD) found a bid on Monday as the US Dollar eased into the low end. The CAD is extending a recent bout of strength against the Greenback, clipping into a fresh three-week high against the USD and dragging the USD/CAD pair toward 1.3650.
USD/CAD has closed in the red for all but two of the last ten consecutive trading days and is on pace to extend into another bearish candle as bids fall below the 50-day Exponential Moving Average (EMA) at 1.3675. Long-term technical support sits at the 200-day EMA, which is rising into the 1.3600 handle.
USD/CAD hourly chart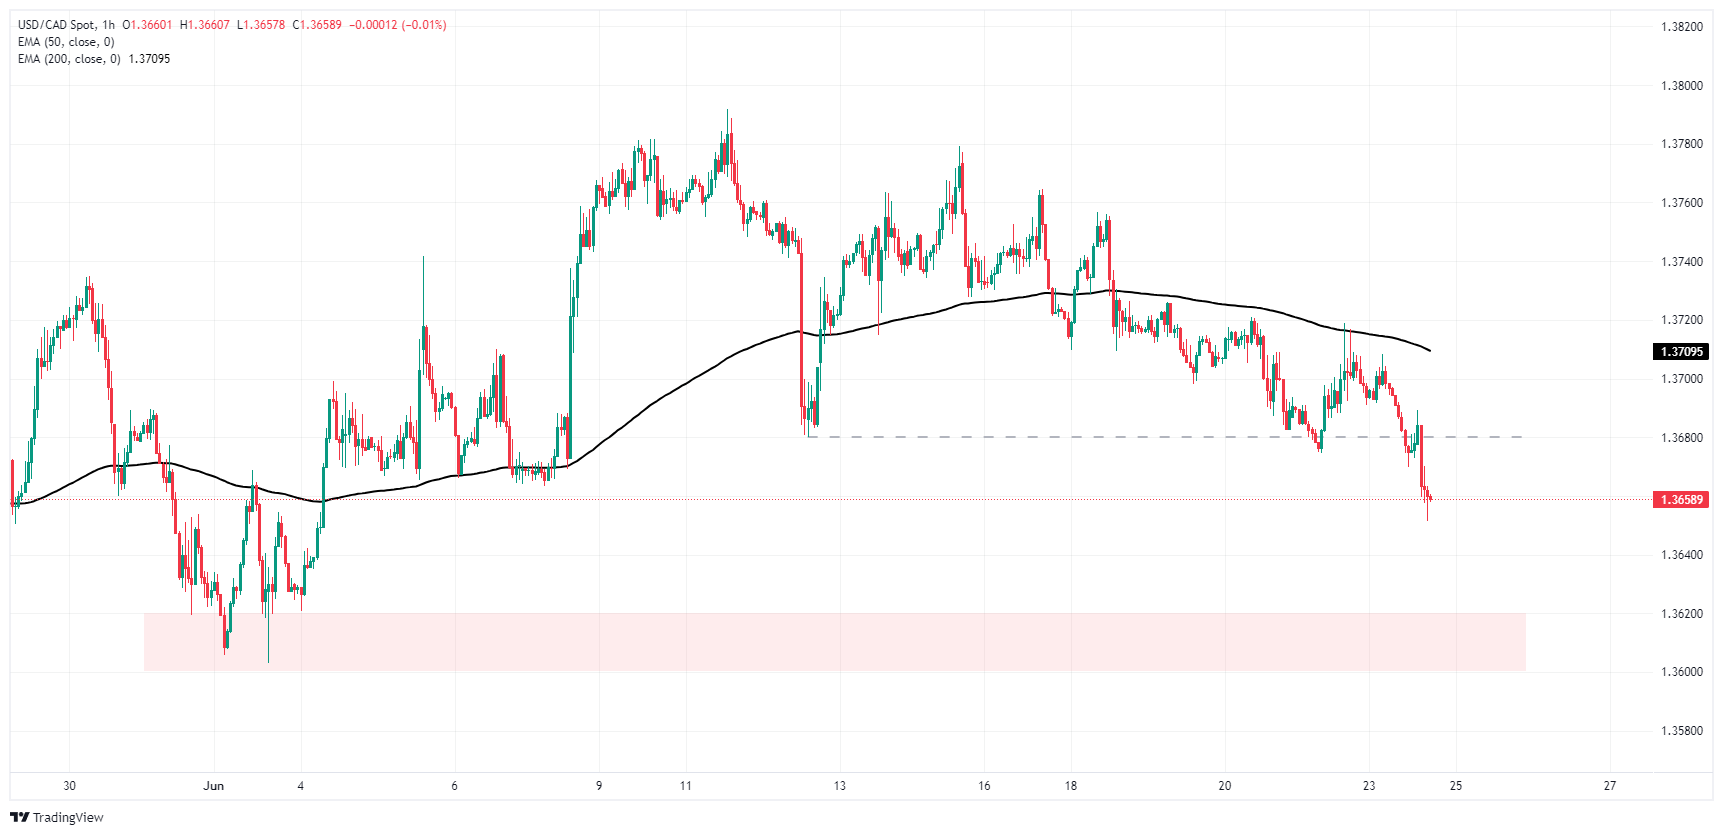
USD/CAD daily chart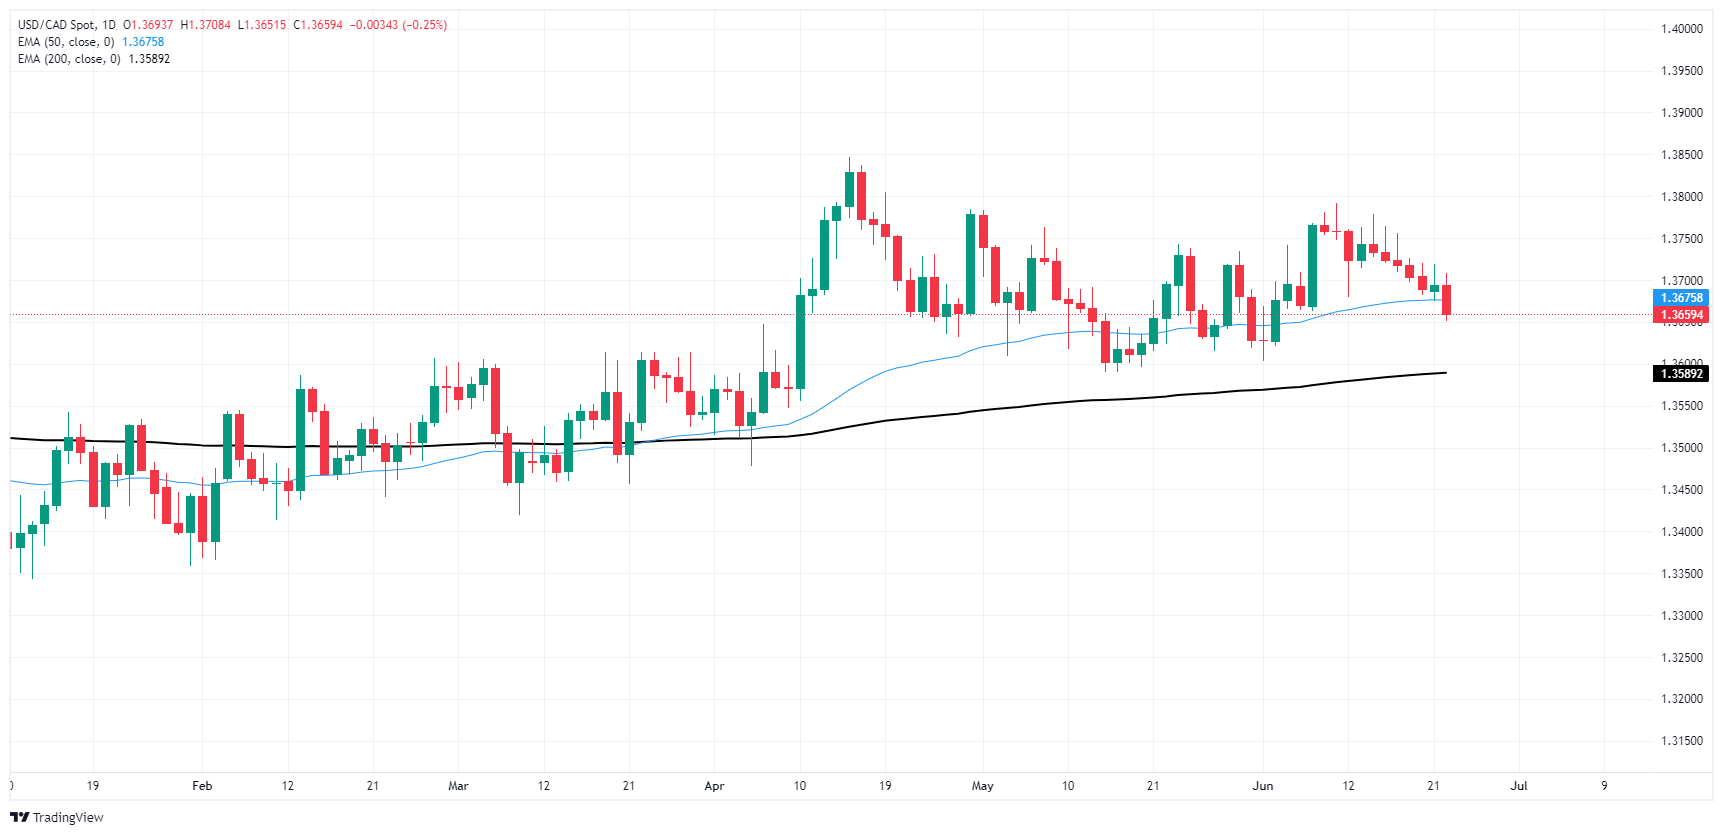
Canadian Dollar FAQs
The key factors driving the Canadian Dollar (CAD) are the level of interest rates set by the Bank of Canada (BoC), the price of Oil, Canada’s largest export, the health of its economy, inflation and the Trade Balance, which is the difference between the value of Canada’s exports versus its imports. Other factors include market sentiment – whether investors are taking on more risky assets (risk-on) or seeking safe-havens (risk-off) – with risk-on being CAD-positive. As its largest trading partner, the health of the US economy is also a key factor influencing the Canadian Dollar.
The Bank of Canada (BoC) has a significant influence on the Canadian Dollar by setting the level of interest rates that banks can lend to one another. This influences the level of interest rates for everyone. The main goal of the BoC is to maintain inflation at 1-3% by adjusting interest rates up or down. Relatively higher interest rates tend to be positive for the CAD. The Bank of Canada can also use quantitative easing and tightening to influence credit conditions, with the former CAD-negative and the latter CAD-positive.
The price of Oil is a key factor impacting the value of the Canadian Dollar. Petroleum is Canada’s biggest export, so Oil price tends to have an immediate impact on the CAD value. Generally, if Oil price rises CAD also goes up, as aggregate demand for the currency increases. The opposite is the case if the price of Oil falls. Higher Oil prices also tend to result in a greater likelihood of a positive Trade Balance, which is also supportive of the CAD.
While inflation had always traditionally been thought of as a negative factor for a currency since it lowers the value of money, the opposite has actually been the case in modern times with the relaxation of cross-border capital controls. Higher inflation tends to lead central banks to put up interest rates which attracts more capital inflows from global investors seeking a lucrative place to keep their money. This increases demand for the local currency, which in Canada’s case is the Canadian Dollar.
Macroeconomic data releases gauge the health of the economy and can have an impact on the Canadian Dollar. Indicators such as GDP, Manufacturing and Services PMIs, employment, and consumer sentiment surveys can all influence the direction of the CAD. A strong economy is good for the Canadian Dollar. Not only does it attract more foreign investment but it may encourage the Bank of Canada to put up interest rates, leading to a stronger currency. If economic data is weak, however, the CAD is likely to fall.
We believe that the US Dollar (USD) will remain strong supported by the level of US yields and divergent monetary paths. The “safe haven” USD is also likely to benefit in uncertain times, FX strategist Jackit Wong notes.
USD is likely to remain strong over the coming months
“We are nearing the halfway point of the year and our broad FX views remain largely unchanged. Since early September last year, we have believed in the strong USD, and we see this continuing in the months ahead. The US Dollar Index (DXY) has strengthened since the start of the year and has been tracking changes in the Federal Reserve (Fed) rate cut expectations closely.”
“Widespread rate cuts (ECB, BoC, Riksbank), while Bank of England (BoE) and the Reserve Bank of Australia (RBA) remaining on hold in June, raised questions abound on the pace and depth of the respective cutting cycles. Divergent monetary paths and the level of US yields should support our strong USD view.”
“The USD is likely to remain strong over the coming months. While the GBP has been stronger than expected so far this year, supported by buoyant risk appetite and relatively high yields, it is likely to be on a path of gradual weakness over the coming months when the BoE starts cutting rates. We expect the EUR to weaken against the USD.”
- GBP/USD up 0.40%, boosted as the US Dollar Index (DXY) hits a new two-day low.
- Technical outlook neutral to slightly bearish, with RSI signaling bearish momentum.
- Key support levels at 100-DMA (1.2664), 50-DMA (1.2627), 1.2600, and 200-DMA (1.2553).
- Resistance at 1.2700 and 1.2750, with less likelihood of being tested in the near term.
The Pound Sterling climbs sharply against the US Dollar as US Treasury bond yields remain unchanged, but the Greenback remains softer as it falls to a fresh two-day low, as depicted by the US Dollar Index (DXY). With the DXY dropping below 105.50, the GBP/USD rose and traded at 1.2691, up 0.40%.
GBP/USD Price Analysis: Technical outlook
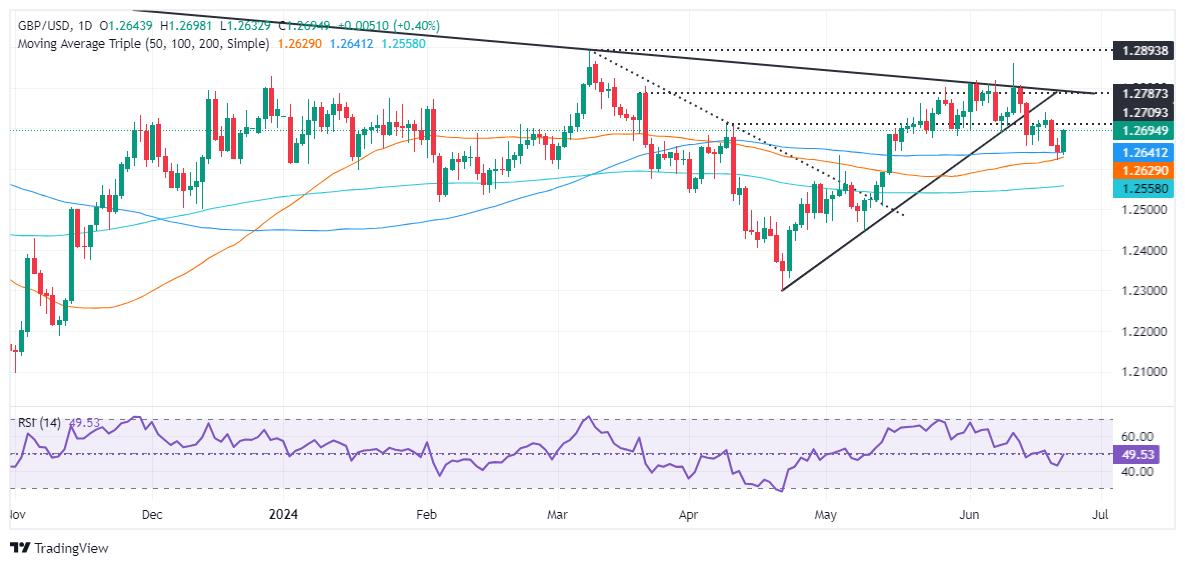
From a daily chart perspective, the GBP/USD is neutral to slightly downward biased, even though the exchange rate trades above the daily moving averages (DMA).
The Relative Strength Index (RSI) turned bearish, hinting that sellers are in charge. It is eyeing a break of key support levels, which, once cleared, could cause the GBP/USD to re-test year-to-date (YTD) lows.
The first support would be the 100-DMA at 1.26643, ahead of the 50-DMA at 1.2627. A further downside lies beneath at 1.2600, exposing the 200-DMA at 1.2553 once surpassed. A breach of the latter, the pair will test 1.2500.
Conversely, and the less likely path in the near term, the GBP/USD first resistance level would be 1.2700. Once hurdle, the next stop would be 1.2750.
GBP/USD Price Action – Daily Chart
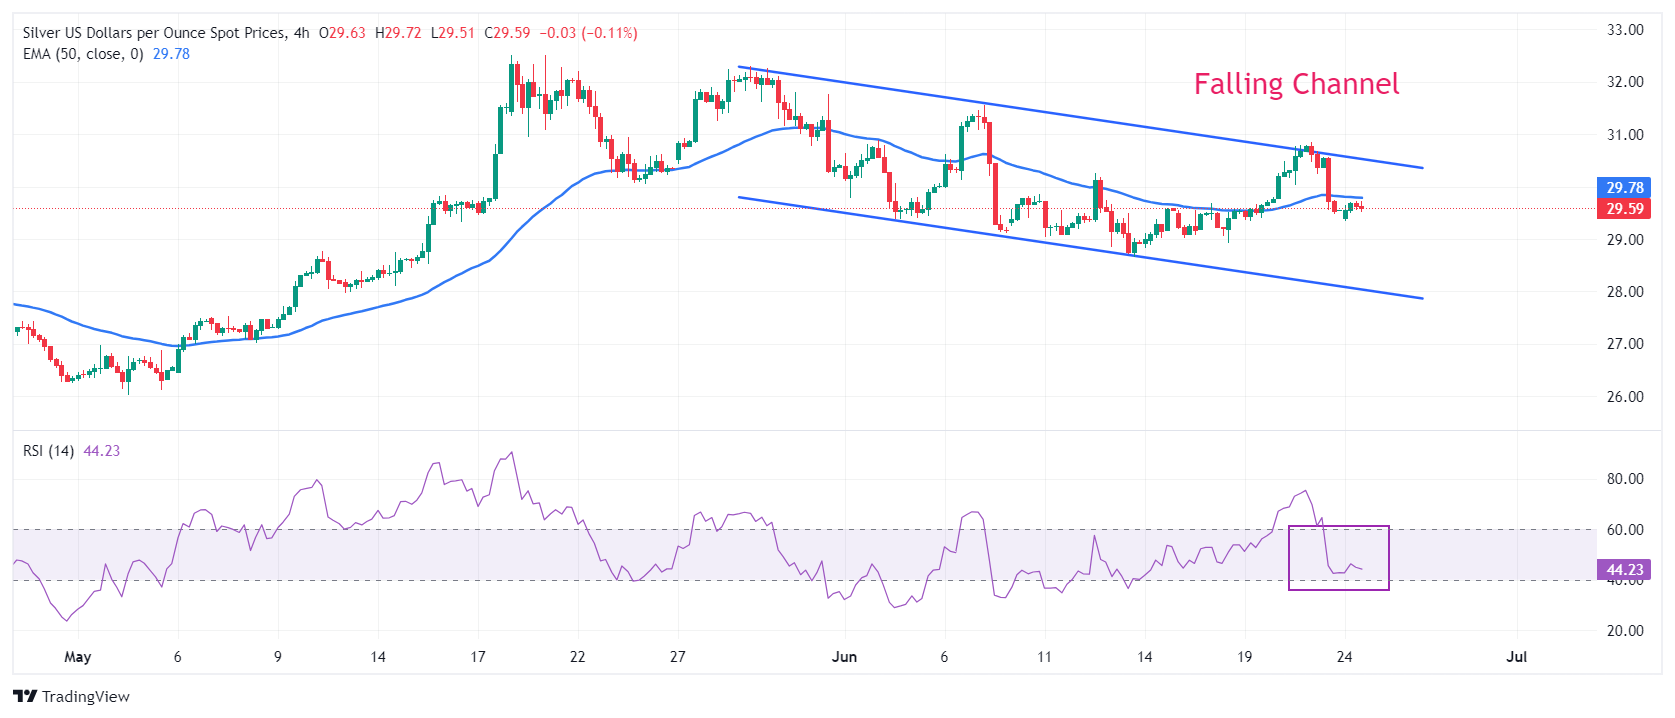
- Silver price holds the key support of $29.40 with a focus on US core PCE Inflation data.
- The US core PCE inflation will provide cues about when the Fed will start reducing interest rates.
- Silver price oscillates in a Falling channel chart formation.
Silver price (XAG/USD) hovers above the crucial support of $29.40 in Monday’s New York session. The white metal witnesses slight gains as the US Dollar (USD) slumps despite strong preliminary United States (US) S&P Global PMI for June raises doubts over market expectations pointing to two rate cuts by the Federal Reserve (Fed) this year.
The US Dollar Index (DXY), which tracks the Greenback’s value against ix major currencies, declines to 105.40. 10-year US Treasury yields remain sluggish near 4.26%.
Data released on Friday showed that activities unexpectedly expanded at a faster pace in the manufacturing and service sectors. However, the report showed that price inflation cooled down after ticking higher in May.
Currently, financial market participants expect that the Fed will begin reducing interest rates from the September meeting and will deliver subsequent rate cuts in November or December meeting.
This week, investors will focus on core Personal Consumption Expenditure price index (PCE) for May. The core PCE price index data is Fed’s preferred inflation measure, which will provide fresh cues on when and how much the central bank will reduce interest rates this year.
Silver technical analysis
Silver price trades in a Falling Channel chart pattern formed on a four-hour timeframe in which each pullback is considered as selling opportunity by market participants. The white metal hovers near the 50-period Exponential Moving Average (EMA) near $29.80, indicating indecisiveness among investors.
The 14-period Relative Strength Index (RSI) shifts into the 40.00-60.00 range from the bullish territory of 60.00-80.00, suggesting that the upside momentum has faded.
Silver four-hour chart
The Dollar Index (DXY) firmed for a 3rd consecutive week. Better than expected prelim PMIs and still-hawkish Fedspeaks were the main drivers underpinning USD strength, OCBC Rates Strategist Frances Cheung notes.
Mild bullish momentum is still intact
“DXY was last at 105.46. Mild bullish momentum on daily chart intact while RSI rose. Risks skewed to the upside. Resistance at 105.75/80 levels (76.4% fibo).”
“Breakout puts 106.20, 106.50 in focus. Support at 105.20 (50 DMA), 104.80/90 (61.8% fibo retracement of Oct high to 2024 low, 21 DMA) and 104.50 (200 DMA).”
“We also note that ½-yearly end and month-end flows may have the potential to distort price action later this week. US presidential debate on Fri (9am SGT) may also be of interest to FX and rates markets.”
The Summary of Opinions for the June MPM suggested that the BoJ delayed additional policy rate hikes as it would like to wait for confirmation from the data. Meanwhile, there is a strong intention to reduce JGB purchase amounts, OCBC Rates Strategist Frances Cheung notes.
BoJ to continue further monetary tightening
“The BoJ said ‘any change in the policy interest rate should be considered only after economic indicators confirm.’ And ‘it is difficult to say at this time that the results of this year’s annual spring labour-management wage negotiations have been reflected in wage statistics.’
“The base-case shall still be for further monetary tightening, as the BoJ continues to see ‘steady progress has been made toward achieving the prices stability target’; and if their outlook materializes, ‘the Bank will raise the policy interest rate and adjust the degree of monetary accommodation.”
“On balance, we expect the policy rate to be hiked to 0.2-0.3% by year-end. In terms of balance sheet policy, the Summary of Opinions commented ‘it is appropriate for the Bank to make a sizeable reduction in the purchase amount [of JGBs] in a predictable manner.”
Supply risks are back in focus for Crude oil with tensions building in the Middle East between Israel and Lebanon, while further ship attacks in the Red Sea reignite concerns, commodity strategists at TD Securities note.
Crude oil is back on the bid
“This comes at a time when algorithmic inflows had already been supporting the market after the OPEC+ driven selloff, and the firm price action has seen Commodity Trading Advisors (CTAs) back on the bid in WTI crude.”
“A renewed surge in our energy supply risk indicator can further support price action in the near term, however, the bar is growing higher for algorithmic flows to continue.”
“We still argue that the rally could start to fade as CTA buying flows taper off. Indeed, prices below $81.92/bbl would halt the WTI buying, and prices just below $81/bbl would see funds begin to liquidate the length.”
Our gauge of commodity demand continues to weaken amid a precarious global macro landscape, Senior Commodity Strategist at TD Securities Ryan McKay notes.
Base metals finally start looking lower
“The demand side is finally starting to weigh heavy on base metals as the early summer euphoria fades.”
“Inflows into broad commodity ETFs throughout May had lifted the complex, but an easing of inflows and modest outflows have also started to weigh on the base metal complex. AUM for base metal specific ETFs have also notably declined.”
“For Copper, our return decomposition framework is also showing a major drag from idiosyncratic factors, such as positioning. This suggests that the Red Metal could still be prone to additional downside in the near-term as bloated positions are cut.”
Gold (XAU/USD) ETF holdings jumped by the largest amount in the last three months, commodity strategists at TDS say.
Precious metals get support from China
“While only a small blip on the chart, and a smaller amount than the amount added during the period of building in early June, it is still giving hope to the Gold bugs that this may finally be the turning point in macro positioning.”
“Precious metals continue to get support from the East as top traders on the Shanghai Futures Exchange (SHFE) continue to hold large positions in the Yellow Metal and Silver (XAG/USD), while inflows continue into Chinese Gold ETFs.”
“This continues to highlight that precious metals have increasingly morphed into a currency depreciation hedge, with resumed pressures in Asia supporting buying activity.”
- NZD/USD trades sideways as investors look for fresh Fed interest rate cues.
- Investors see the Fed easing interest rates twice this year.
- NZD/USD struggles for direction with focus on US core PCE inflation data.
The NZD/USD pair trades in a limited range between 0.6105-0.1030 in Monday’s early American session. The Kiwi asset consolidates as uncertainty over when the Federal Reserve (Fed) will start reducing interest rates has deepened. Investors see the Fed to begin reducing rates from the September and a subsequent move in the November or December meeting.
Contrary to market expectations, Fed policymakers see only one rate cut this year in the last quarter. Officials want to see inflation declining for months to gain conviction before pivoting to policy-normalization.
The US Dollar Index (DXY) has dropped to 105.50 amid a cheerful market mood. On Friday, the US Dollar witnessed strong buying interest as the preliminary S&P Global PMI report showed that overall activity surprisingly expanded, with robust improvement in the manufacturing and service sectors.
This week, investors will focus on the United States (US) core Personal Consumption Expenditure price index (PCE) for May, which will provide fresh cues on when and how much the central bank will reduce interest rates this year.
NZD/USD exhibits an inventory adjustment formation on a four-hour timeframe, which indicates an auction in a limited range with lower volume. Generally, the inventory adjustment process results in a decisive break in either direction. The Kiwi asset trades below the 50-period Exponential Moving Average (EMA) near 0.6133, suggesting a sharp volatility contraction.
The 14-period Relative Strength Index (RSI) oscillates in the 40.00-60.00 range, indicating indecisiveness among investors.
Fresh downside would appear if the asset delivers a decisive break below the round-level support of 0.6100. This would drag the asset towards April 4 high around 0.6050 and psychological support of 0.6000.
On the contrary, a reversal move above June 12 high of 0.6222, which will expose the asset January 15 high near 0.6250, followed by January 12 high near 0.6280.
NZD/USD four-hour chart
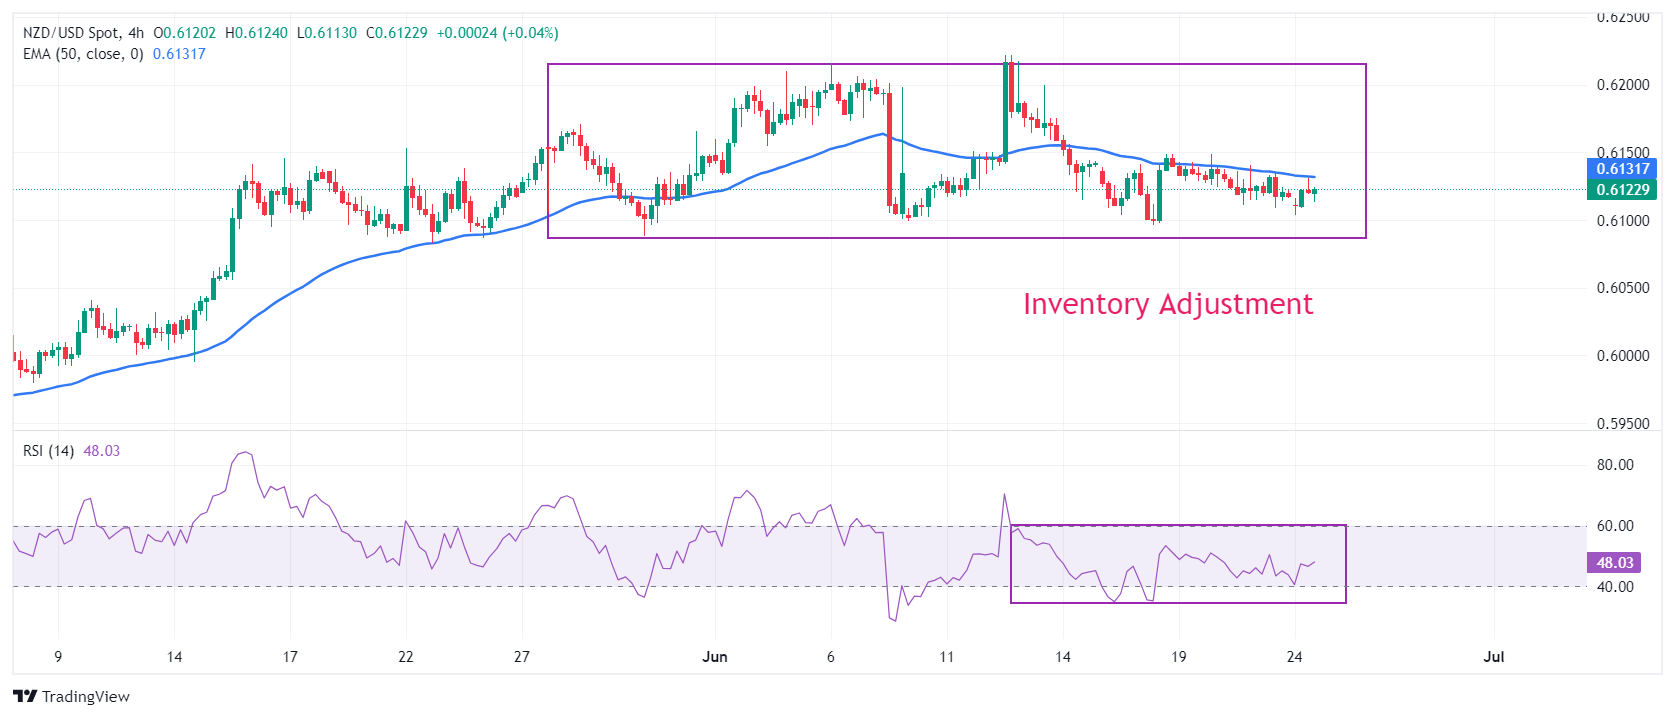
Federal Reserve (Fed) Bank of Chicago President Austan Goolsbee told CNBC on Monday that the Fed's monetary policy is restrictive and added that slowing inflation data would open the door to an easier policy, per Reuters.
Key takeaways
"Optimistic we'll see improvement in inflation data."
"Hopeful Fed will get more confidence inflation heading back to 2%."
"Economy outside of inflation data showing signs of cooling."
Market reaction
The US Dollar stays under modest bearish pressure following these comments. At the time of press, the USD Index was down 0.25% on the day at 105.55.
- Natural Gas remains steady above $2.80 on Monday, near last week’s support.
- Traders assess another outage in Norway at the Hammerfest LNG plant.
- The US Dollar index trades in the high 105.00-region, though it might face pressure from Yen interventions.
Natural Gas price (XNG/USD) trades steady to slightly higher on Monday. Despite last week’s retreat, some headline risk is forming again, with Norway having to report an unforeseen outage. This makes it very difficult for Europe to foresee if it will get refueled ahead of the heating seasons with Gas flows into Europe being very unpredictable.
Meanwhile, the US Dollar Index (DXY), which tracks the Greenback’s value against six major currencies, is trading near its June high, where it roughly closed at the end of last week. However, there is a risk for a quick correction as the US Dollar (USD) is near the feared 160.00 level against the Japanese Yen (JPY), a level at which the Japanese government intervened in the past. The last time the government intervened, the Japanese Yen appreciated over 5% against the Greenback with a ripple effect into the DXY, which dropped nearly 2% on the back of it.
Natural Gas is trading at $2.83 per MMBtu at the time of writing.
Natural Gas news and market movers: Russia on the move
- Russia is going around the Arctic Sea quicker than expected, with Liquefied Natural Gas (LNG) tanker Eduard Toll passing through the Northern Sea Route. This is the quickest way for Russia to get LNG to Asia.
- Norwegian network operator Gassco reported an outage at the Hammerfest LNG Plant on Monday, according to Bloomberg. Although the outage should be solved during the day, it again shows how unreliable the current Gas flows from Norway into Europe are.
- Japan is buying into Texas shale Gas, with Mitsui & Co Limited, buying some acres to excavate for drilling. The site should be operational by 2026.
Natural Gas Technical Analysis: RSI has cooled down
Natural Gas prices have eased and might start to pick up again if the Relative Strength Index (RSI) indicator is any guide. With the price near $2.83, the RSI has cooled down after trading at elevated levels and is currently in the middle of the range around 50.00. With these constantly interrupted Gas flows from Norway into Europe, it becomes very difficult to assess whether Europe will see its Gas storage filled up in time.
The pivotal level near $3.08 (March 6, 2023, high) remains key after its false break last week. In addition, the red descending trendline in the chart below at $3.10 will also weigh on this area as a cap. Further up, the fresh year-to-date high at $3.16 is the level to beat.
On the downside, the 200-day Simple Moving Average (SMA) acts as the first support near $2.54. Should that support area fail to hold, the next target could be the pivotal level near $2.13, with interim support by the 55-day SMA near $2.51 and by the 100-day SMA at $2.21.
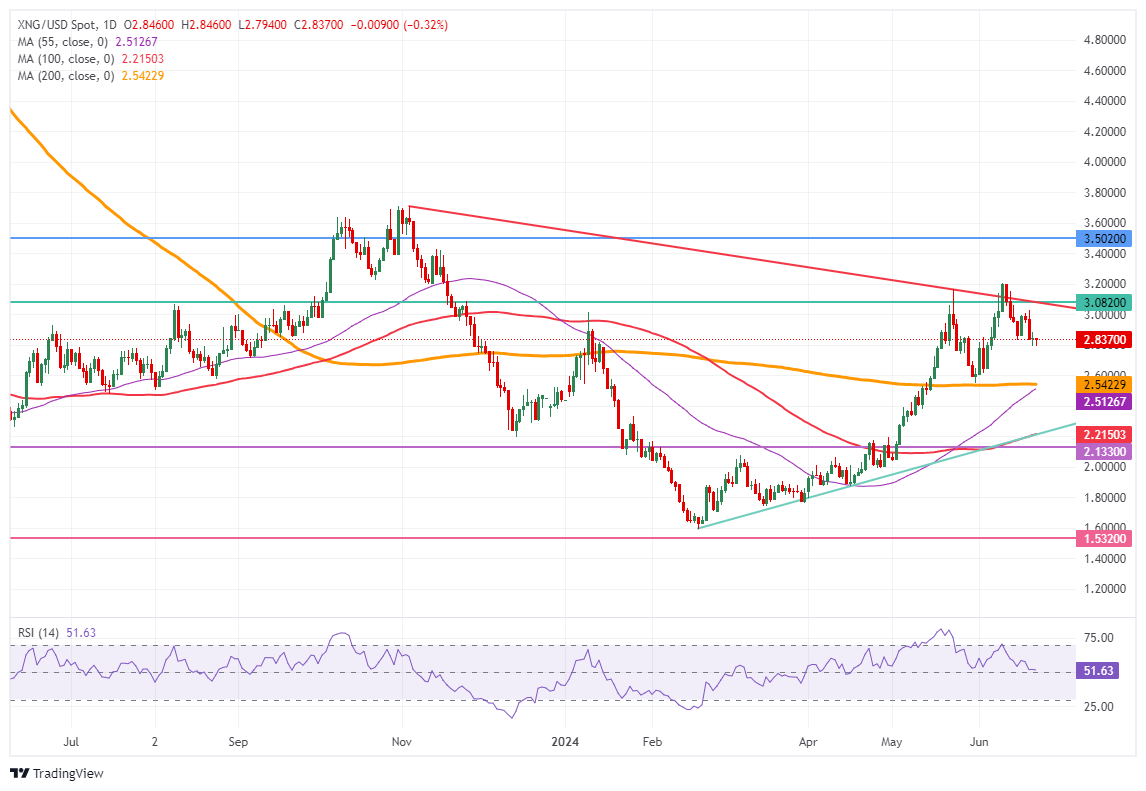
Natural Gas: Daily Chart
Natural Gas FAQs
Supply and demand dynamics are a key factor influencing Natural Gas prices, and are themselves influenced by global economic growth, industrial activity, population growth, production levels, and inventories. The weather impacts Natural Gas prices because more Gas is used during cold winters and hot summers for heating and cooling. Competition from other energy sources impacts prices as consumers may switch to cheaper sources. Geopolitical events are factors as exemplified by the war in Ukraine. Government policies relating to extraction, transportation, and environmental issues also impact prices.
The main economic release influencing Natural Gas prices is the weekly inventory bulletin from the Energy Information Administration (EIA), a US government agency that produces US gas market data. The EIA Gas bulletin usually comes out on Thursday at 14:30 GMT, a day after the EIA publishes its weekly Oil bulletin. Economic data from large consumers of Natural Gas can impact supply and demand, the largest of which include China, Germany and Japan. Natural Gas is primarily priced and traded in US Dollars, thus economic releases impacting the US Dollar are also factors.
The US Dollar is the world’s reserve currency and most commodities, including Natural Gas are priced and traded on international markets in US Dollars. As such, the value of the US Dollar is a factor in the price of Natural Gas, because if the Dollar strengthens it means less Dollars are required to buy the same volume of Gas (the price falls), and vice versa if USD strengthens.
The drop in the eurozone PMI supports the idea that the latest Eropean Central Bank's (ECB's) "hawkish cut" was about growth risks, BBH FX strategists note.
Monetary policy to drive the market this week
“The drop in the eurozone PMI supports our view that the ECB's 'hawkish cut' this month was all about growth risks. The SNB cut rates for a second time last week, while the BOE delivered a dovish hold that sets up an August cut.”
“Meanwhile, Fed officials continue to counsel patience, with most stressing that the bank needs to see more progress on inflation before contemplating a rate cut. The market continues to see November as the most likely meeting for a cut, though there are nearly 75% odds of a cut in September. As always, it will come down to the data.”
“Waller, Goolsbee, and Daly speak today. Even consummate dove Goolsbee has been staying on message and so the cautious messaging is likely to continue this week.”
The fact that the Federal Reserve (Fed) targets the US core PCE deflator makes it more important than core CPI, FX strategist Kit Juckes at Societe Generale notes.
US PCE dominates the market
“The week’s data highlight seems to be the US core PCE deflator. The fact that the Federal Reserve (Fed) targets it makes it more important than core CPI, but the latter is more informative – I doubt the market will learn much.”
“The Canadian rates market is uncertain whether the Bank of Canada will cut rates in July or September and will react to any surprise from tomorrow’s CPI data (expected to show a 0.1% fall in headline and trimmed core readings to 2.6% and 2.8% respectively).”
“Australian May CPI matters less to the RBA than the quarterly figure at the end of July, but an as-expected acceleration back to 3.8% wouldn’t hurt the AUD. A pick-up in Tokyo’s inflation (Friday) to 2.3%, with core CPI is likely to be steady at 1.7%, won’t have much impact.”
Meanwhile, the yen is in a big spot of bother, FX strategist at Societe Generale Kit Juckes notes.
USD/JPY trades near 160 yet again
“In early May 10-year Note yields were trading above 4.5% and USD/JPY was at 153, but here we are with yields down by 25bop and USD/JPY up near 160 again. Client warnings that with yield differentials this big, it isn’t the direction of those differentials which matters as much as their sheer size, seem to be validated.”
“Value investors are chased away by carry traders and the only way to chase them off decisively may be for the Federal Reserve (Fed) to cut rates (probably more than once). The Bank of Japan (BoJ) is in for a long summer and perhaps a long Autumn too.”
This morning’s IFO data confirm what the PMIs told us – expectations are down, FX strategist at Societe Generale Kit Juckes notes.
Euro is unlikely to get back to 1.08
“Whether the French elections are a driver of the increased uncertainty and caution, or not, is hard to tell, but either way the lift the Euro (EUR) was getting from positive economic surprises, is melting away.”
“Meanwhile, a regression of EUR/USD against the OAT/Bund yield differential suggests that EUR/USD ought to be heading to parity. That it isn’t, may tell us a market which is already long USD in a multitude of ways, and has bought into US exceptionalism hook, line and sinker, hasn’t got a great many more euros to sell.”
“However, just as I might scratch an itch, even though I know it’s futile, I continue to draw these charts because they make me worry! At the very least, the topside for EUR/USD is very limited and while it has a bit of a Monday morning bid today, I doubt we’ll get back to EUR/USD 1.08, let alone higher.”
We believe the Bank of England (BoE) took a step in the direction of an August rate cut last week, even though core policy communication did not change meaningfully, FX Strategist at ING Francesco Pesole notes.
GBP looks more likely to display weakness
“Markets remain undecided on an August move (14bp priced in) and in our view, are also still too conservative on the total easing this year with 47bp versus our call for 75bp. Our dovish BoE view means a bearish call on the Pound Sterling (GBP), this summer. We could also see some negative spillover on GBP from the UK election.”
“However, political uncertainty currently weighs more on the Euro (EUR) than on the GBP, and that’s why we think a re-appreciation in EUR/GBP beyond 0.8500 has likely been delayed. We see wide upside room for the pair once the EU political noise has settled due to monetary policy convergence.”
“GBP looks more likely to display weakness against the US Dollar (USD) in the near term, and we expect a move to below 1.25 in Cable in July. This week’s calendar is very quiet in the UK data-wise, and there are no BoE speakers scheduled for now.”
- EUR/USD rebounds swiftly from 1.0670 as the appeal for risk-perceived assets improves.
- The US economic outlook appears to be stronger than its peers.
- Weak preliminary Eurozone PMI boosts hopes of ECB’s subsequent rate cuts.
The EUR/USD pair recovers strongly from a weekly low of 1.0670 in Monday’s European session. The major currency pair bounces back as the appeal for risk-sensitive assets improves amid growing speculation that the Federal Reserve (Fed) will start reducing interest rates in the September meeting and will deliver two rate cuts this year.
S&P 500 futures have posted some gains in the London session. 10-Year US Treasury yields remain sluggish near 4.25%. The US Dollar Index (DXY), which tracks the Greenback’s value against six major currencies, corrects from the seven-week high of 105.90.
On Friday, the US Dollar (USD) performed strongly after the preliminary S&P Global PMI report for June showed that overall economic activity surprisingly expanded. Flash United States (US) Services business activity expanded to 26-month high at 55.1. The Manufacturing PMI rose to three-month high at 51.7.
Though the US Dollar corrects from seven-month high, its near-term appeal has improved. Where all major economies failed to meeting PMI estimates, the US economy surprisingly expanded at a faster pace than their prior release.
Meanwhile, the Euro delivers an upbeat performance against its peers in Monday’s session as investors digest political uncertainty in France ahead of thefirst legislative elections round scheduled for June 30.
The Euro recovered despite the preliminary HCOB PMI report for June pointing to a slowdown in the Eurozone economy. Both Manufacturing and Services PMIs were weaker than expected, which has boosted expectations of subsequent rate cuts by the European Central Bank (ECB).
Latest polls show Marine Le Pen’s far-right RN party remains in the lead (35%) ahead of Sunday’s first round parliamentary vote, followed by left-wing NPF party (29%) and President Emmanuel Macron’s centrist coalition (19%), ING’s FX Strategist Francesco Pesole notes.
Euro unlikely to find support amid political uncertainty
“We continue to keep a close eye on the EUR/USD risk premium. As of Friday’s close, that amounted to 0.9% in our estimates, well below the 2.4% 14 June peak and also below the 1.8%. We see risks skewed to the downside for EUR/USD before the Friday-Sunday events in the US and the EU.”
“Today, the German IFO survey will add information on how much political uncertainty has spread to German business confidence following soft PMIs last week. On Friday, CPI figures for France, Spain and Italy will start directing expectations, but the proximity to the French vote means any upside surprises may still struggle to feed into a stronger EUR.”
“EUR/USD may find more sellers below 1.0700 in the coming days on the back of political risk. Should US PCE offer no support to the pair, the 1.0600 April lows will be at reach. Another pair to watch this week is EUR/SEK, which has paused its big downward trend ahead of the Riksbank announcement on Thursday.”
- The US Dollar trades relatively flat despite USD/JPY near 160.00.
- All eyes will be on US Q1 GDP and PCE data for May as focal points this week.
- The US Dollar index pivots around June’s high.
The US Dollar (USD) is going sideways to a touch lower in the European trading session on Monday, with markets seeing headlines on the political difficulties around Europe fading into the background. This means some fading in the safe-haven flows into the Greenback. Some counterweight, though, comes from the Japanese Yen (JPY), which is devaluing further against the Greenback and has the 160.00 level in reach, where the Ministry of Finance of Japan intervened last time.
On the economic data front, there are some lighter numbers to start the week with, such as the Chicago Fed Activity Index for May and the Dallas Fed Manufacturing Business Index for June. Besides that, the US Treasury is heading back to markets to allot some US debt while US Federal Reserve Bank of San Francisco President Mary Daly will close off this Monday with some comments.
Daily digest market movers: Some minor optimism
- At 12:30 GMT, the Chicago Fed National Activity Index for May is set to be released. April’s number came in at -0.23, with no forecast available for the May number.
- At 14:30 GMT, the Dallas Fed Manufacturing Business Index for June will be unleashed. Previous print was at -19.4, with no forecast available.
- The US Treasury is set to auction a 3-month and a 6-month bill at 15:30 GMT.
- At 18:00 GMT, Federal Reserve Bank of San Francisco President Mary Daly delivers remarks and participates in a Q&A session with Deidre Bosa, "TechCheck" Anchor at CNBC.
- Equities are not breaking any pots on Monday, with minor gains and losses on the quote board. There are no real outliers to report during the European trading session.
- The CME Fedwatch Tool is backing a rate cut in September, with odds now standing at 59.5% for a 25 basis point cut. A rate pause stands at a 34.1% chance, while a 50-basis-point rate cut has a slim 6.4% possibility.
- The US 10-year benchmark rate is trading at 4.25%, rather steady since the end of last week.
US Dollar Index Technical Analysis: Watch out for USD/JPY
The US Dollar Index (DXY) is easing a touch on Monday, and while economic data will be very important again, as always, traders will need to have a hawkeye on the US Dollar against the Japanese Yen (USD/JPY) this week. With that forex pair trading near 160.00, markets are gearing up for possible intervention risk from the Japanese government. The last time the Japanese government intervened, the USD/JPY dove 5% lower, and the DXY dropped lower to 104.52.
On the upside, there are no significant changes to the levels traders need to watch out for. The first level to watch is 105.88, which triggered a rejection at the start of May and on Friday last week. Further up, the biggest challenge remains at 106.51, the year-to-date high from April 16.
On the downside, the 105.52 level is the first support ahead of the trifecta of Simple Moving Averages (SMA). First is the 55-day SMA at 105.20, safeguarding the 105.00 round figure. A touch lower, near 104.64 and 104.48, both the 100-day and the 200-day SMA form a double layer of protection to support any declines. Should this area be broken, look for 104.00 to salvage the situation.
US Dollar FAQs
The US Dollar (USD) is the official currency of the United States of America, and the ‘de facto’ currency of a significant number of other countries where it is found in circulation alongside local notes. It is the most heavily traded currency in the world, accounting for over 88% of all global foreign exchange turnover, or an average of $6.6 trillion in transactions per day, according to data from 2022. Following the second world war, the USD took over from the British Pound as the world’s reserve currency. For most of its history, the US Dollar was backed by Gold, until the Bretton Woods Agreement in 1971 when the Gold Standard went away.
The most important single factor impacting on the value of the US Dollar is monetary policy, which is shaped by the Federal Reserve (Fed). The Fed has two mandates: to achieve price stability (control inflation) and foster full employment. Its primary tool to achieve these two goals is by adjusting interest rates. When prices are rising too quickly and inflation is above the Fed’s 2% target, the Fed will raise rates, which helps the USD value. When inflation falls below 2% or the Unemployment Rate is too high, the Fed may lower interest rates, which weighs on the Greenback.
In extreme situations, the Federal Reserve can also print more Dollars and enact quantitative easing (QE). QE is the process by which the Fed substantially increases the flow of credit in a stuck financial system. It is a non-standard policy measure used when credit has dried up because banks will not lend to each other (out of the fear of counterparty default). It is a last resort when simply lowering interest rates is unlikely to achieve the necessary result. It was the Fed’s weapon of choice to combat the credit crunch that occurred during the Great Financial Crisis in 2008. It involves the Fed printing more Dollars and using them to buy US government bonds predominantly from financial institutions. QE usually leads to a weaker US Dollar.
Quantitative tightening (QT) is the reverse process whereby the Federal Reserve stops buying bonds from financial institutions and does not reinvest the principal from the bonds it holds maturing in new purchases. It is usually positive for the US Dollar.
Both politics and monetary policy will need to be pondered in the first part of the summer, ING’s FX Strategist Francesco Pesole notes.
The US Dollar is the current favorite hedge for political uncertainty
"The US Dollar (USD) has emerged as the favorite hedge for political uncertainty. If the US May core PCE on Friday does come in at the consensus 0.1% month-on-month, the short-term downside for the USD against European currencies may be less pronounced as markets could still favor defensive positions ahead of the French vote on Sunday."
"When taking EU political noise out of the equation, though, PCE data should in our view feed into an increasingly dovish Federal Reserve narrative this summer, culminating with a September rate cut. This is why we remain generally bearish on the USD for the end of next quarter."
"Today, the only US data release is the Dallas Fed manufacturing index, while three Fed speakers will deliver remarks: Christopher Waller, Austan Goolsbee and Mary Daly. We think DXY can trade above 106.0 and potentially test the 106.50 May high into the events at the back-end of this week."
- Gold price rebounds from $2,315 as US bond yields come under pressure on Monday.
- Investors see the Fed reducing interest rates twice this year.
- The US economic outlook improved as preliminary PMI expanded at a faster pace in June.
Gold price (XAU/USD) attracts bids near $2,315 in Monday’s European session as US bond yields edge down amid firm speculation that the Federal Reserve (Fed) will deliver two rate cuts this year. Expectations for the Fed to reduce interest rates twice in 2024 strengthened amid easing inflationary pressures in the United States (US). The 10-year US Treasury yields drop to near 4.25% on Monday.
The US Consumer Price Index (CPI) report showed that price pressures decelerated more than expected in May. Also, the preliminary S&P Global Purchasing Managers Indes (PMI) report for June showed signs of moderate cooling in cost growth. “Selling price inflation cooled to a five-month low in June. The rate of increase nevertheless fell to a five-month low in the services sector, where the rise was among the lowest seen over the past four years, and a six-month low in manufacturing,” the report said.
The CME FedWatch tool suggests that the central bank will start the policy-easing campaign at the September meeting and deliver subsequent rate cuts in November or December. The 30-day Federal Funds futures pricing data indicate that the probability of a rate cut in September is 66%.
On the contrary, according to the dot plot chart at the June FOMC economic projections, Fed policymakers expect that interest rates will be cut only once this year. Officials want to see inflation declining for months before pivoting to the policy-normalization process.
Daily digest market movers: Gold price rebounds while US bond yields ease
- Gold’s price finds buying interest near $2,315 after a sharp decline on Friday. The precious metal faced an intense sell-off as the US Dollar (USD) rose after the preliminary S&P Global PMI report for June showed that economic activity unexpectedly expanded at a faster pace. The surprisingly upbeat US PMI report prompted an upside in the US Dollar, making Gold an expensive bet for currency holders.
- The report showed that the Composite PMI surprisingly jumped to 51.7. Investors expected the PMI data to decline to 51.0 from the prior release of 51.3. Chris Williamson, Chief Business Economist at S&P Global Market Intelligence, commented, “The PMI is running at a level broadly consistent with the economy growing at an annualized rate of just under 2.5%. The upturn is broad-based, as rising demand continues to filter through the economy. Although led by the service sector, reflecting strong domestic spending, the expansion is being supported by an ongoing recovery in manufacturing, which so far this year is enjoying its best growth spell for two years.”
- This week, investors will keenly focus on the revised Q1 Gross Domestic Product (GDP) data and the core Personal Consumption Expenditure price index (PCE) for May. The core PCE price index data is the Fed’s preferred inflation measure, which will provide fresh cues on when and how much the central bank will reduce interest rates this year.
- On the global front, the security pact between Russian President Vladimir Putin and North Korean leader Kim Jong-un in Pyongyang has raised the risk of further escalating geopolitical tensions. In a wide-ranging treaty spanning political, trade, investment, and security cooperation, North Korea and Russia pledged to use all available means to provide immediate military assistance in the event the other is attacked, CNN reported. Mounting global tensions could limit the downside of the Gold price.
Technical Analysis: Gold price ranges for more than two months
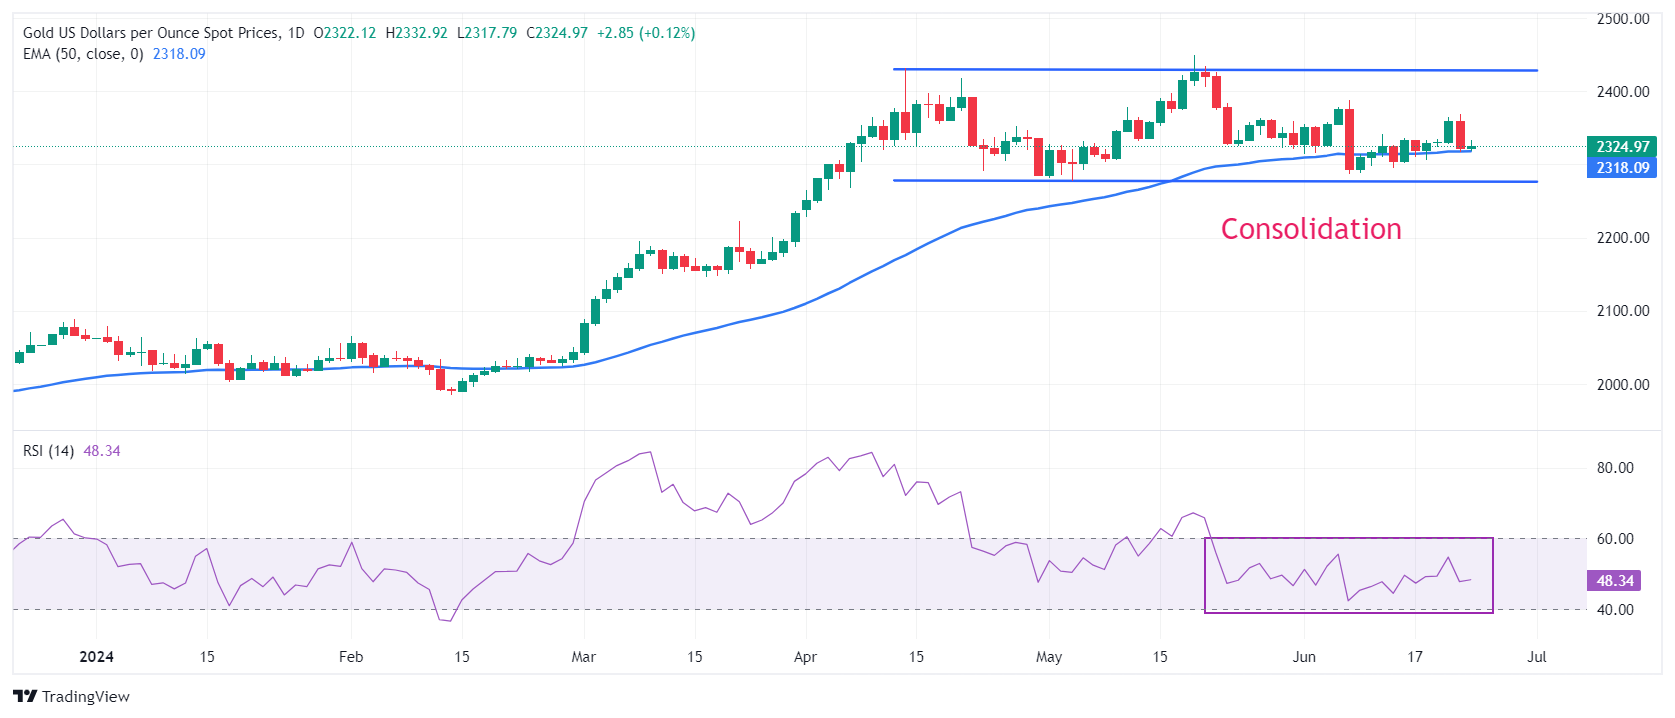
Gold price consolidates between $2,277-$2,450 for more than two months. The 50-day Exponential Moving Average (EMA) near $2,318 continues to provide support to the Gold price bulls. The 14-day Relative Strength Index (RSI) oscillates in the 40.00-60.00 range, indicating indecisiveness among market participants.
The precious metal could come under pressure if the Gold price breaks below the May 3 low around $2,277. A downside move could expose the March 21 high at $2,223. On the contrary, the Gold price could enter an unchartered trajectory if it breaks above the May 20 high of $2,450.
Gold FAQs
Gold has played a key role in human’s history as it has been widely used as a store of value and medium of exchange. Currently, apart from its shine and usage for jewelry, the precious metal is widely seen as a safe-haven asset, meaning that it is considered a good investment during turbulent times. Gold is also widely seen as a hedge against inflation and against depreciating currencies as it doesn’t rely on any specific issuer or government.
Central banks are the biggest Gold holders. In their aim to support their currencies in turbulent times, central banks tend to diversify their reserves and buy Gold to improve the perceived strength of the economy and the currency. High Gold reserves can be a source of trust for a country’s solvency. Central banks added 1,136 tonnes of Gold worth around $70 billion to their reserves in 2022, according to data from the World Gold Council. This is the highest yearly purchase since records began. Central banks from emerging economies such as China, India and Turkey are quickly increasing their Gold reserves.
Gold has an inverse correlation with the US Dollar and US Treasuries, which are both major reserve and safe-haven assets. When the Dollar depreciates, Gold tends to rise, enabling investors and central banks to diversify their assets in turbulent times. Gold is also inversely correlated with risk assets. A rally in the stock market tends to weaken Gold price, while sell-offs in riskier markets tend to favor the precious metal.
The price can move due to a wide range of factors. Geopolitical instability or fears of a deep recession can quickly make Gold price escalate due to its safe-haven status. As a yield-less asset, Gold tends to rise with lower interest rates, while higher cost of money usually weighs down on the yellow metal. Still, most moves depend on how the US Dollar (USD) behaves as the asset is priced in dollars (XAU/USD). A strong Dollar tends to keep the price of Gold controlled, whereas a weaker Dollar is likely to push Gold prices up.
This week has a lot of politics in it, and markets are rarely that good at pricing political risk, Chief Economist at UBS Global Wealth Management Paul Donovan argues.
Markets focus on politics in the US and Europe
"The US presidential debate may make investors pay attention to political risk earlier than is normal in the US political cycle. Because so much attention has focused on the suitability of the candidates for office (rather than their policy positions), this debate might actually matter."
"Inflation is one real world issue that has had political. Politically, inflation is an emotional issue not a rational issue—consumers focus on price levels of high frequency purchases. Reports of price discounting in food items profit-led inflation retreats are likely to impact political perceptions far more than official data."
"The UK prime minister and the leader of the opposition are set to debate this week as well. Markets do not think there is much political uncertainty in the UK. We conclude the week with the first round of the French parliamentary elections. Market uncertainties there are specific (who forms the next government in France?), and more general (the rise of prejudice politics in Europe)."
- USD/CAD declines further to 1.3670 ahead of BoC’s Macklem speech.
- Canadian annual headline CPI is estimated to have declined to 2.6%.
- Fed policymakers want to see inflation declining for months before shifting to rate cuts.
The USD/CAD pair extends its losing streak for the seventh trading session on Monday. The Loonie asset weakens as the US Dollar Index (DXY) corrects to near 105.66 after failing to extend upside above the crucial resistance of 106.00. The US Dollar (USD) drops as investors shift to risk-perceived assets amid expectations that the Federal Reserve (Fed) will deliver two rate cuts this year.
S&P 500 futures have posted decent gains in the European session, exhibiting a higher risk appetite of investors. 10-year US Treasury yields edge down to 4.25%.
Contrary to market expectations, Fed policymakers signalled in latest interest rate projections that there will be only one rate-cut this year. The Fed continues to reiterate the same despite May’s Consumer Price Index (CPI) report showed that price pressured eased more than expected.
Richmond Fed Bank President Thomas Barkin said on Friday that he wants more conviction before moving on rate cuts. Fed officials would get more conviction after seeing inflation declining for months.
Meanwhile, the Canadian Dollar strengthens even though investors expect that the Bank of Canada (BoC) will deliver subsequent rate cuts. For more clarity on the interest rate outlook, investors will look to the speech from BoC Governor Tiff Macklem, which is scheduled at 17:00 GMT.
This week, investors will also focus on the Canadian CPI report for May, which will be published on Tuesday. Annual headline CPI is expected to have decelerated to 2.6% from 2.7% in April.
The US Dollar (USD) is likely to trade in a sideways range of 7.2850/7.2950, but it’s also likely to rise above this range. Resistance levels to watch are at 7.3000 and 7.3100, UOB Group analysts say.
A breach below 7.2700 to turn the USD southwards
24-HOUR VIEW: “Our view for USD to continue to rise last Friday was incorrect, as it traded sideways between 7.2838 and 7.2920, closing largely unchanged (7.2915, -0.01%). There has been no increase in momentum, and USD could continue to trade sideways today, likely in a range of 7.2850/7.2950.”
1-3 WEEKS VIEW: “We have expected USD to strengthen since early last week (see annotations in the chart below). In our latest update from last Friday (21 Jun, spot at 7.2920), we indicated that ‘further USD strength is likely, and the resistance levels to watch are 7.3000 and 7.3100.’ There is no change in our view. On the downside, a breach of 7.2700 (no change in ‘strong support’ level from last Friday) would mean that USD is not strengthening further.”
As long as the US Dollar (USD) remains above 159.30, it could rise above 160.00, potentially reaching another resistance level at 160.25, UOB Group analysts note.
A break below 158.80 to indicate more downside
24-HOUR VIEW: “After AUD soared last Thursday, we indicated on Friday that ‘strong momentum suggests further USD strength.’ We also indicated that ‘given that conditions are overbought, the major resistance at 159.50 is likely out of reach for now.’ The anticipated USD strength exceeded our expectations, as USD surged to 159.84. Momentum remains strong, and further USD strength is not ruled out. Today, as long as USD remains above 159.30 (minor support is at 159.55), it could rise above 160.00, potentially reaching 160.25.
1-3 WEEKS VIEW: “We have held a positive USD view since early last week (see annotations in the chart below). Last Friday (24 Jun, spot at 158.90), we noted that ‘upward momentum has increased, and USD could continue to advance to 159.50, with a lower probability of it reaching 160.00.’ While our view was not wrong, we did not quite expect USD to break above 159.50 and approach 160.00 as quickly (USD rose to a high of 159.84 in NY trade). From here, USD could break above 160.00, but note that there is another resistance level at 160.25. On the downside, should USD break below 158.80 (‘strong support’ level was at 158.00 last Friday), it would indicate that USD is not strengthening further.”
Silver prices (XAG/USD) rose on Monday, according to FXStreet data. Silver trades at $29.67 per troy ounce, up 0.40% from the $29.55 it cost on Friday.
Silver prices have increased by 24.68% since the beginning of the year.
| Unit measure | Silver Price Today in USD |
|---|---|
| Troy Ounce | 29.67 |
| 1 Gram | 0.95 |
The Gold/Silver ratio, which shows the number of ounces of Silver needed to equal the value of one ounce of Gold, stood at 78.49 on Monday, down from 78.59 on Friday.
Silver FAQs
Silver is a precious metal highly traded among investors. It has been historically used as a store of value and a medium of exchange. Although less popular than Gold, traders may turn to Silver to diversify their investment portfolio, for its intrinsic value or as a potential hedge during high-inflation periods. Investors can buy physical Silver, in coins or in bars, or trade it through vehicles such as Exchange Traded Funds, which track its price on international markets.
Silver prices can move due to a wide range of factors. Geopolitical instability or fears of a deep recession can make Silver price escalate due to its safe-haven status, although to a lesser extent than Gold's. As a yieldless asset, Silver tends to rise with lower interest rates. Its moves also depend on how the US Dollar (USD) behaves as the asset is priced in dollars (XAG/USD). A strong Dollar tends to keep the price of Silver at bay, whereas a weaker Dollar is likely to propel prices up. Other factors such as investment demand, mining supply – Silver is much more abundant than Gold – and recycling rates can also affect prices.
Silver is widely used in industry, particularly in sectors such as electronics or solar energy, as it has one of the highest electric conductivity of all metals – more than Copper and Gold. A surge in demand can increase prices, while a decline tends to lower them. Dynamics in the US, Chinese and Indian economies can also contribute to price swings: for the US and particularly China, their big industrial sectors use Silver in various processes; in India, consumers’ demand for the precious metal for jewellery also plays a key role in setting prices.
Silver prices tend to follow Gold's moves. When Gold prices rise, Silver typically follows suit, as their status as safe-haven assets is similar. The Gold/Silver ratio, which shows the number of ounces of Silver needed to equal the value of one ounce of Gold, may help to determine the relative valuation between both metals. Some investors may consider a high ratio as an indicator that Silver is undervalued, or Gold is overvalued. On the contrary, a low ratio might suggest that Gold is undervalued relative to Silver.
(An automation tool was used in creating this post.)
The New Zealand Dollar (NZD) is expected to drift lower towards 0.6085, but this level is still likely out of reach, UOB Group strategists note.
NZD to drift lower towards 0.6085
24-HOUR VIEW:
“We highlighted last Friday that NZD ‘is likely to edge lower, but it is unlikely to be able to reach the major support at 0.6085.’ Our expectations did not materialise as NZD traded between 0.6110 and 0.6134, closing largely unchanged at 0.6119 (-0.02%). The underlying tone still appears soft, and we continue to expect NZD to drift lower. However, 0.6085 is still likely out of reach. Resistance is at 0.6125, followed by 0.6135.”
1-3 WEEKS VIEW:
“Our most recent narrative was from Tuesday (18 Jun, spot at 0.6130), wherein ‘as long as NZD remains below 0.6180, it could drift lower towards the support at 0.6085.’ While we continue to expect NZD to drift lower towards 0.6085, the ‘strong resistance’ level has moved lower to 0.6160 from 0.6180.”
The Australian Dollar (AUD) is likely to drift lower. Any decline is unlikely to reach 0.6600. There is another support level at 0.6620.
AUD to trade between 0.6600 and 0.6685
24-HOUR VIEW: “We expected AUD to trade in a 0.6640/0.6675 range last Friday. AUD subsequently rose to 0.6670, dropped to 0.6632 and then closed at 0.6641 (-0.23%). Downward momentum has increased slightly, and AUD is likely to drift lower today. However, any decline is unlikely to reach 0.6600. There is another support level at 0.6620. If AUD breaks above 0.6665 (minor resistance is at 0.6655), it would indicate that the current downward pressure has eased.”
1-3 WEEKS VIEW: “Our most recent narrative was from last Thursday (20 Jun, spot at 0.6670), wherein ‘while AUD could edge higher, the chance of it breaking above the major resistance zone of 0.6705/0.6715 is not high.’ On Friday, AUD fell to a low of 0.6632. While our ‘strong support’ level at 0.6620 has not been breached yet, upward momentum has largely dissipated.’ The current price action is likely part of a range-trading phase. For the time being, AUD is likely to trade between 0.6600 and 0.6685.”
- EUR/GBP gains ground as the BoE dovish pause increased expectations for a rate cut in August.
- The Euro could struggle due to uncertainties surrounding the outcome of a snap election in France.
- The headline German IFO Business Climate Index fell to 88.6 in June from 89.3 in May.
EUR/GBP extends its gains for the third successive session, trading around 0.8460 during the European session on Monday. The British Pound (GBP) remains under pressure following the Bank of England's (BoE) dovish pause last week, which increased expectations for an interest rate cut at the August monetary policy meeting.
Thursday’s BoE statement and minutes indicated that officials are nearing a decision to cut interest rates, as noted by ING’s FX Strategist Francesco Pesole. Pesole mentioned that "three rate cuts in 2024 starting from August remain ING’s base case," which is more dovish compared to the two cuts currently priced in by the market.
Additionally, the flash UK PMIs released on Friday showed that private sector business activity in June expanded at its slowest rate since last November. This has exerted further pressure on the Pound Sterling, bolstering the EUR/GBP cross.
The EUR/GBP cross may limit its upside as the Euro could struggle due to uncertainties surrounding the outcome of a snap election in France, fueling concerns that a new government might worsen the fiscal situation in the Eurozone's second-largest economy.
On Monday, the headline German IFO Business Climate Index fell to 88.6 in June from 89.3 in May, coming in below the market expectation of 89.7. The Current Assessment Index remained unchanged at 88.3, while the Expectations Index dropped to 89.0 from 90.4. This weaker German data could put pressure on the Euro, further limiting the upside of the EUR/GBP cross.
The Pound Sterling (GBP) could dip towards 1.2600 before the risk of a rebound increases, UOB Group strategists note.
A clear break below 1.2600 is unlikely
24-HOUR VIEW: “We indicated last Friday that GBP could break below the major support at 1.2650. However, we were of the view that ‘the next major support at 1.2600 is highly unlikely to come under threat.’ In line with our expectations, GBP dropped below 1.2650, reaching a low of 1.2622. Conditions are oversold, but GBP could dip towards 1.2600 before the risk of a rebound increases. A clear break below 1.2600 is unlikely. Resistance levels are at 1.2655 and 1.2670.”
1-3 WEEKS VIEW: “We highlighted last Friday (21 Jun, spot at 1.2660) that ‘the weakness in GBP is not showing any sign of stabilisation just yet.’ We added, ‘if it breaks and stays below 1.2650, it could continue to weaken to 1.2600.’ GBP subsequently dropped to a of low of 1.2622. From here, we expect GBP to continue to weaken to 1.2600. Only a breach of 1.2705 (‘strong resistance’ level previously at 1.2730) would mean that the weakness in GBP has stabilised.”
The Euro (EUR) is likely to trade in a range, probably between 1.0665 and 1.0715. Bias for EUR remains on the downside; it must break clearly below 1.0665 before further decline can be expected, UOB Group analysts note.
Euro to trade in 1.0665-1.0715 range
24-HOUR VIEW: “When EUR was trading at 1.0705 last Friday, we indicated that EUR could continue to weaken. However, we pointed out that ‘it might not be able to break clearly below 1.0665.’ Our view was not wrong, as EUR fell to 1.0668 before rebounding to close little changed at 1.0691 (-0.08%). Downward momentum is slowing, and EUR is unlikely to weaken much further. Today, EUR is more likely to trade in a range, probably between 1.0665 and 1.0715.”
1-3 WEEKS VIEW: “Last Tuesday (18 Jun, spot at 1.0735), we highlighted that ‘there has been a slight buildup in downward momentum, and there is a chance for EUR to retest the 1.0665 level.’ We also highlighted that ‘the likelihood of a sustained decline below this level is not high.’ On Friday (21 Jun, spot at 1.0705), we highlighted that ‘the chance of EUR breaking clearly below 1.0665 has increased slightly.’ EUR subsequently dropped to a low of 1.0668. While the bias for EUR remains on the downside, it must break clearly below 1.0665 before further decline can be expected. Looking ahead, the next level to watch below 1.0665 is at 1.0630. On the upside, a breach of 1.0740 (‘strong resistance’ level was at 1.0760 last Friday) would mean that the downward bias has faded.”
- German IFO Business Climate Index retreated to 88.6 in June, pointing to a decline in business morale.
- EUR/USD holds steady slightly above 1.0700 in the European session.
The headline German IFO Business Climate Index declined to 88.6 in June from 89.3 in May. This reading came in below the market expectation of 89.7.
The Current Assessment Index remained unchanged at 88.3 in the same period, while the Expectations Index edged lower to 89 from 90.4.
Market reaction
EUR/USD clings to modest daily gains slightly above 1.0700 despite the weak sentiment data from Germany.
- The Pound Sterling finds support near 1.2620 against the US Dollar.
- UK’s economic outlook appears to be uncertain ahead of UK elections.
- The BoE is expected to start lowering interest rates in August.
The Pound Sterling (GBP) gains ground against the US Dollar (USD) and trades around 1.2650 in Monday’s London session after facing a sharp sell-off last week. The GBP/USD pair rebounds as the upside move in the US Dollar Index (DXY), which tracks the Greenback’s value against six major peers, appears to have paused and struggles to extend upside above the immediate resistance of 106.00.
However, the near-term outlook of the US Dollar has strengthened after the preliminary S&P Global Purchasing Managers Index (PMI) report for June showed that activities in the manufacturing and the service sector surprisingly expanded at a faster pace than expected. The report showed that the Composite PMI surprisingly jumped to 51.7. Investors expected the PMI data to decline to 51.0 from the prior release of 51.3.
The report also lifted the mood of Federal Reserve (Fed) policymakers as it said, “Selling price inflation has meanwhile cooled again after ticking higher in May, down to one of the lowest levels seen over the past four years. Historical comparisons indicate that the latest decline brings the survey’s price gauge into line with the Fed’s 2% inflation target.”
Daily digest market movers: Pound Sterling is underpinned against majority of currencies
- The Pound Sterling performs strongly against its major peers, except the Euro, even though financial markets expect that the Bank of England (BoE) will start reducing interest rates from the August meeting. Market speculation for the BoE to begin lowering its key borrowing rates in August was boosted by a slightly dovish monetary policy statement commentary on the interest rate outlook.
- In the monetary policy statement, policymakers said the decision to hold interest rates at 5.25% was “finely balanced”, which investors took it as a signal that rate cuts are around the corner.
- Market expectations for BoE rate cuts have also strengthened as annual headline inflation has returned to the desired rate of 2%. In the press conference after the June meeting, BoE Governor Andrew Bailey acknowledged, “It’s good news that inflation has returned to our 2% target.” And “officials want to be sure that inflation should stay low which is why we have decided to leave interest rates unchanged.
- Though price pressures have returned to 2%, officials worry about the risks of persistent service inflation. In May, service inflation decelerated at a slower pace to 5.7% from the prior release of 5.9%. Investors expected the underlying inflation to have declined to 5.5%.
- Meanwhile, investors have become concerned over the United Kingdom’s (UK) economic outlook after the preliminary S&P Global/CIPS PMI report showed that the overall activity unexpectedly slowed in the service sector in June. However, the Manufacturing PMI expanded at a faster pace than estimates and the former release. "The slowdown in part reflects uncertainty around the business environment in the lead-up to the general election, with many firms seeing a hiatus in decision-making pending clarity on various policies," the report said.
Pound Sterling Price Today:
British Pound PRICE Today
The table below shows the percentage change of British Pound (GBP) against listed major currencies today. British Pound was the strongest against the Swiss Franc.
| USD | EUR | GBP | JPY | CAD | AUD | NZD | CHF | |
|---|---|---|---|---|---|---|---|---|
| USD | -0.19% | -0.08% | -0.05% | -0.07% | -0.17% | -0.07% | -0.02% | |
| EUR | 0.19% | 0.13% | 0.22% | 0.17% | 0.04% | 0.17% | 0.24% | |
| GBP | 0.08% | -0.13% | 0.04% | 0.04% | -0.08% | 0.04% | 0.11% | |
| JPY | 0.05% | -0.22% | -0.04% | -0.01% | -0.09% | 0.02% | 0.03% | |
| CAD | 0.07% | -0.17% | -0.04% | 0.01% | -0.10% | 0.00% | 0.08% | |
| AUD | 0.17% | -0.04% | 0.08% | 0.09% | 0.10% | 0.13% | 0.20% | |
| NZD | 0.07% | -0.17% | -0.04% | -0.02% | -0.01% | -0.13% | 0.07% | |
| CHF | 0.02% | -0.24% | -0.11% | -0.03% | -0.08% | -0.20% | -0.07% |
The heat map shows percentage changes of major currencies against each other. The base currency is picked from the left column, while the quote currency is picked from the top row. For example, if you pick the British Pound from the left column and move along the horizontal line to the US Dollar, the percentage change displayed in the box will represent GBP (base)/USD (quote).
Technical Analysis: Pound Sterling finds interim support near 1.2620
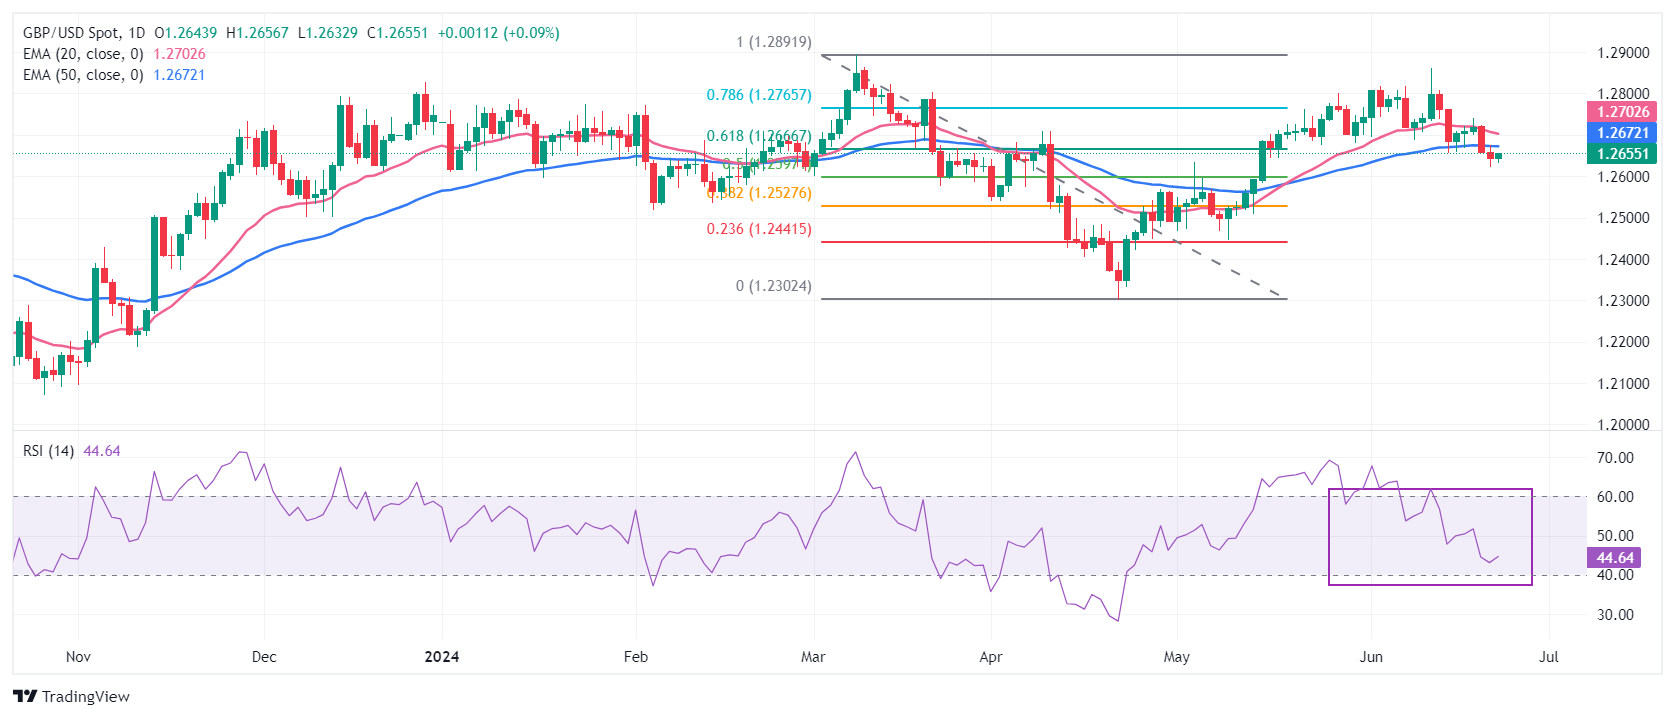
The Pound Sterling finds temporary support near 1.2620 against the US Dollar. However, the near-term appeal is uncertain as the GBP/USD pair has slipped below the 20-day and 50-day Exponential Moving Averages (EMAs), which trade around 1.2700 and 1.2670, respectively.
The Cable also declines below the 61.8% Fibonacci retracement support at 1.2667, plotted from the March 8 high of 1.2900 to the April 22 low at 1.2300.
The 14-day Relative Strength Index (RSI) falls back into the 40.00-60.00 range, indicating that the upside momentum has faded.
Pound Sterling FAQs
The Pound Sterling (GBP) is the oldest currency in the world (886 AD) and the official currency of the United Kingdom. It is the fourth most traded unit for foreign exchange (FX) in the world, accounting for 12% of all transactions, averaging $630 billion a day, according to 2022 data. Its key trading pairs are GBP/USD, aka ‘Cable’, which accounts for 11% of FX, GBP/JPY, or the ‘Dragon’ as it is known by traders (3%), and EUR/GBP (2%). The Pound Sterling is issued by the Bank of England (BoE).
The single most important factor influencing the value of the Pound Sterling is monetary policy decided by the Bank of England. The BoE bases its decisions on whether it has achieved its primary goal of “price stability” – a steady inflation rate of around 2%. Its primary tool for achieving this is the adjustment of interest rates. When inflation is too high, the BoE will try to rein it in by raising interest rates, making it more expensive for people and businesses to access credit. This is generally positive for GBP, as higher interest rates make the UK a more attractive place for global investors to park their money. When inflation falls too low it is a sign economic growth is slowing. In this scenario, the BoE will consider lowering interest rates to cheapen credit so businesses will borrow more to invest in growth-generating projects.
Data releases gauge the health of the economy and can impact the value of the Pound Sterling. Indicators such as GDP, Manufacturing and Services PMIs, and employment can all influence the direction of the GBP. A strong economy is good for Sterling. Not only does it attract more foreign investment but it may encourage the BoE to put up interest rates, which will directly strengthen GBP. Otherwise, if economic data is weak, the Pound Sterling is likely to fall.
Another significant data release for the Pound Sterling is the Trade Balance. This indicator measures the difference between what a country earns from its exports and what it spends on imports over a given period. If a country produces highly sought-after exports, its currency will benefit purely from the extra demand created from foreign buyers seeking to purchase these goods. Therefore, a positive net Trade Balance strengthens a currency and vice versa for a negative balance.
Here is what you need to know on Monday, June 24:
The US Dollar (USD) struggles to find demand at the beginning of the new week after outperforming its rivals on Friday. IFO business sentiment data from Germany will be featured in the European economic docket on Monday. Later in the day, Chicago Fed National Activity Index and Dallas Fed Manufacturing Business Index will be featured in the US economic docket. Investors will also continue to assess comments from central bank officials.
US Dollar PRICE Last 7 days
The table below shows the percentage change of US Dollar (USD) against listed major currencies last 7 days. US Dollar was the strongest against the Japanese Yen.
| USD | EUR | GBP | JPY | CAD | AUD | NZD | CHF | |
|---|---|---|---|---|---|---|---|---|
| USD | -0.02% | 0.28% | 1.47% | -0.41% | -0.49% | 0.26% | 0.29% | |
| EUR | 0.02% | 0.34% | 1.52% | -0.38% | -0.56% | 0.34% | 0.31% | |
| GBP | -0.28% | -0.34% | 1.27% | -0.72% | -0.89% | -0.03% | 0.04% | |
| JPY | -1.47% | -1.52% | -1.27% | -1.76% | -1.93% | -1.05% | -1.08% | |
| CAD | 0.41% | 0.38% | 0.72% | 1.76% | -0.13% | 0.69% | 0.77% | |
| AUD | 0.49% | 0.56% | 0.89% | 1.93% | 0.13% | 0.95% | 0.95% | |
| NZD | -0.26% | -0.34% | 0.03% | 1.05% | -0.69% | -0.95% | 0.07% | |
| CHF | -0.29% | -0.31% | -0.04% | 1.08% | -0.77% | -0.95% | -0.07% |
The heat map shows percentage changes of major currencies against each other. The base currency is picked from the left column, while the quote currency is picked from the top row. For example, if you pick the US Dollar from the left column and move along the horizontal line to the Japanese Yen, the percentage change displayed in the box will represent USD (base)/JPY (quote).
Upbeat PMI data from the US on Friday helped the USD gather strength ahead of the weekend. The USD Index extended its weekly uptrend and reached its highest level since early May near 106.00. In the European session on Monday, the USD Index stays in a consolidation phase above 105.50. Meanwhile, US stock index futures trade mixed, while the benchmark 10-year US Treasury bond yield fluctuates at around 4.25%.
The Bank of Japan's (BoJ) Summary of Opinions from its June monetary policy meeting showed that some policymakers voiced their preference for raising interest rates amid upside risks to inflation. USD/JPY closed the seventh consecutive day in positive territory on Friday and came in within a touching distance of 160.00, reaching the highest level since the BoJ intervened in foreign exchange markets late April. Early Monday, the pair corrects lower but holds above 159.50. Japan's top currency diplomat, Masato Kanda, reiterated earlier in the day that they stand ready to intervene if necessary.
EUR/USD registered small losses on Friday but managed to recover back above 1.0700 in the European morning on Monday.
GBP/USD stretched lower on Friday and closed the third consecutive week in negative territory. The pair holds steady at around 1.2650 to start the new week.
After rising sharply on escalating geopolitical tensions on Thursday, Gold erased its weekly gains on Friday amid broad-based USD strength. XAU/USD holds its ground on Monday and trades above $2,320.
Central banks FAQs
Central Banks have a key mandate which is making sure that there is price stability in a country or region. Economies are constantly facing inflation or deflation when prices for certain goods and services are fluctuating. Constant rising prices for the same goods means inflation, constant lowered prices for the same goods means deflation. It is the task of the central bank to keep the demand in line by tweaking its policy rate. For the biggest central banks like the US Federal Reserve (Fed), the European Central Bank (ECB) or the Bank of England (BoE), the mandate is to keep inflation close to 2%.
A central bank has one important tool at its disposal to get inflation higher or lower, and that is by tweaking its benchmark policy rate, commonly known as interest rate. On pre-communicated moments, the central bank will issue a statement with its policy rate and provide additional reasoning on why it is either remaining or changing (cutting or hiking) it. Local banks will adjust their savings and lending rates accordingly, which in turn will make it either harder or easier for people to earn on their savings or for companies to take out loans and make investments in their businesses. When the central bank hikes interest rates substantially, this is called monetary tightening. When it is cutting its benchmark rate, it is called monetary easing.
A central bank is often politically independent. Members of the central bank policy board are passing through a series of panels and hearings before being appointed to a policy board seat. Each member in that board often has a certain conviction on how the central bank should control inflation and the subsequent monetary policy. Members that want a very loose monetary policy, with low rates and cheap lending, to boost the economy substantially while being content to see inflation slightly above 2%, are called ‘doves’. Members that rather want to see higher rates to reward savings and want to keep a lit on inflation at all time are called ‘hawks’ and will not rest until inflation is at or just below 2%.
Normally, there is a chairman or president who leads each meeting, needs to create a consensus between the hawks or doves and has his or her final say when it would come down to a vote split to avoid a 50-50 tie on whether the current policy should be adjusted. The chairman will deliver speeches which often can be followed live, where the current monetary stance and outlook is being communicated. A central bank will try to push forward its monetary policy without triggering violent swings in rates, equities, or its currency. All members of the central bank will channel their stance toward the markets in advance of a policy meeting event. A few days before a policy meeting takes place until the new policy has been communicated, members are forbidden to talk publicly. This is called the blackout period.
- USD/CHF faces challenges as the US Dollar declines amid lower yields.
- Stronger US PMI data has fueled speculation about delaying the Fed's rate cut, which in turn supports the Greenback.
- The Swiss Franc may further struggle as the SNB is expected to implement another rate cut in September.
USD/CHF retraces its gains from the last three sessions, trading around 0.8930 during the early European session on Monday. The US Dollar Index (DXY), which measures the value of the US Dollar (USD) against six major currencies, edges lower to near 105.70. This downward correction could be attributed to the decline in the 2-year and 10-year yields on US Treasury bonds standing at 4.73% and 4.25%, respectively, at the time of writing.
The downside of the US Dollar (USD) may limit itself as the higher-than-expected US Purchasing Managers Index (PMI) from Friday boosted the speculation of delaying interest rate cut by the Federal Reserve. According to the CME FedWatch Tool, investors are pricing in nearly 65.9% odds of a Fed rate cut in September, compared to 70.2% a week earlier.
The US Composite PMI for June surpassed expectations, rising to 54.6 from May’s reading of 54.5. This figure marked the highest level since April 2022. The Manufacturing PMI increased to a reading of 51.7 from a 51.3 figure, exceeding the forecast of 51.0. Similarly, the Services PMI rose to 55.1 from 54.8 in May, beating the consensus estimate of 53.7.
The Swiss Franc (CHF) struggled against the US Dollar (USD) after the Swiss National Bank (SNB) decided to cut rates for the second time in the year, lowering rates from 1.50% to 1.25% on Thursday.
Additionally, SNB Chairman Thomas Jordan said the CHF strengthened significantly in recent weeks, adding that the central bank is ready to intervene in the FX market, per Reuters. This might have put pressure on the Swiss Franc and underpinned the USD/CHF pair.
Traders will likely observe the ZEW Survey Expectations, which will be published by the Centre for European Economic Research on Wednesday. This survey will present business and employment conditions in Switzerland.
Gold prices remained broadly unchanged in India on Monday, according to data compiled by FXStreet.
The price for Gold stood at 6,239.86 Indian Rupees (INR) per gram, broadly stable compared with the INR 6,234.73 it cost on Friday.
The price for Gold was broadly steady at INR 72,779.83 per tola from INR 72,720.65 per tola a day earlier.
| Unit measure | Gold Price in INR |
|---|---|
| 1 Gram | 6,239.86 |
| 10 Grams | 62,398.30 |
| Tola | 72,779.83 |
| Troy Ounce | 194,083.00 |
FXStreet calculates Gold prices in India by adapting international prices (USD/INR) to the local currency and measurement units. Prices are updated daily based on the market rates taken at the time of publication. Prices are just for reference and local rates could diverge slightly.
Gold FAQs
Gold has played a key role in human’s history as it has been widely used as a store of value and medium of exchange. Currently, apart from its shine and usage for jewelry, the precious metal is widely seen as a safe-haven asset, meaning that it is considered a good investment during turbulent times. Gold is also widely seen as a hedge against inflation and against depreciating currencies as it doesn’t rely on any specific issuer or government.
Central banks are the biggest Gold holders. In their aim to support their currencies in turbulent times, central banks tend to diversify their reserves and buy Gold to improve the perceived strength of the economy and the currency. High Gold reserves can be a source of trust for a country’s solvency. Central banks added 1,136 tonnes of Gold worth around $70 billion to their reserves in 2022, according to data from the World Gold Council. This is the highest yearly purchase since records began. Central banks from emerging economies such as China, India and Turkey are quickly increasing their Gold reserves.
Gold has an inverse correlation with the US Dollar and US Treasuries, which are both major reserve and safe-haven assets. When the Dollar depreciates, Gold tends to rise, enabling investors and central banks to diversify their assets in turbulent times. Gold is also inversely correlated with risk assets. A rally in the stock market tends to weaken Gold price, while sell-offs in riskier markets tend to favor the precious metal.
The price can move due to a wide range of factors. Geopolitical instability or fears of a deep recession can quickly make Gold price escalate due to its safe-haven status. As a yield-less asset, Gold tends to rise with lower interest rates, while higher cost of money usually weighs down on the yellow metal. Still, most moves depend on how the US Dollar (USD) behaves as the asset is priced in dollars (XAU/USD). A strong Dollar tends to keep the price of Gold controlled, whereas a weaker Dollar is likely to push Gold prices up.
(An automation tool was used in creating this post.)
FX option expiries for June 24 NY cut at 10:00 Eastern Time, via DTCC, can be found below
- EUR/USD: EUR amounts
- 1.0690 1.4b
- 1.0700 1.3b
- 1.0710 742m
- 1.0755 717m
- GBP/USD: GBP amounts
- 1.2630 570m
- 1.2840 439m
- USD/CHF: USD amounts
- 0.8910 1.1b
- AUD/USD: AUD amounts
- 0.6500 427m
- 0.6640 410m
- USD/CAD: USD amounts
- 1.3585 400m
- 1.3700 1.3b
- EUR/USD trades on a stronger around 1.0700 in Monday’s early European session.
- The pair keeps the negative vibe below the key 100-period EMA, with the bearish RSI indicator.
- The key upside barrier will emerge near 1.0762; 1.0670 acts as an initial support level for the pair.
The EUR/USD pair trims losses near 1.0700 during the early European session on Monday. The upside of the major pair might be limited as investors are concerned about the political uncertainties in the Eurozone, particularly the outcome of a snap election in France. Furthermore, the firmer US Dollar (USD) after the stronger-than-expected US PMIs released on Friday might lift the Greenback and create a headwind for the pair.
Technically, the bearish outlook of EUR/USD remains intact as the major pair holds below the key 100-period Exponential Moving Average (EMA) on the 4-hour chart. The downward momentum is backed by the Relative Strength Index (RSI), which stands in the bearish zone near 40.0, indicating that further downside looks favorable.
The key upside barrier for EUR/USD will emerge near 1.0762, portraying the confluence of the 100-period EMA and the upper boundary of the Bollinger Band. Further north, the next hurdle is seen at 1.0815, a high of June 15. Any follow-through buying will see a rally to 1.0852, a high of June 12.
On the flip side, the lower limit of the Bollinger Band at 1.0670 acts as an initial support level for the major pair. A breach of this level will pave the way to 1.0650, a low of May 1. The additional downside filter to watch is the 1.0600 psychological level.
EUR/USD 4-hour chart
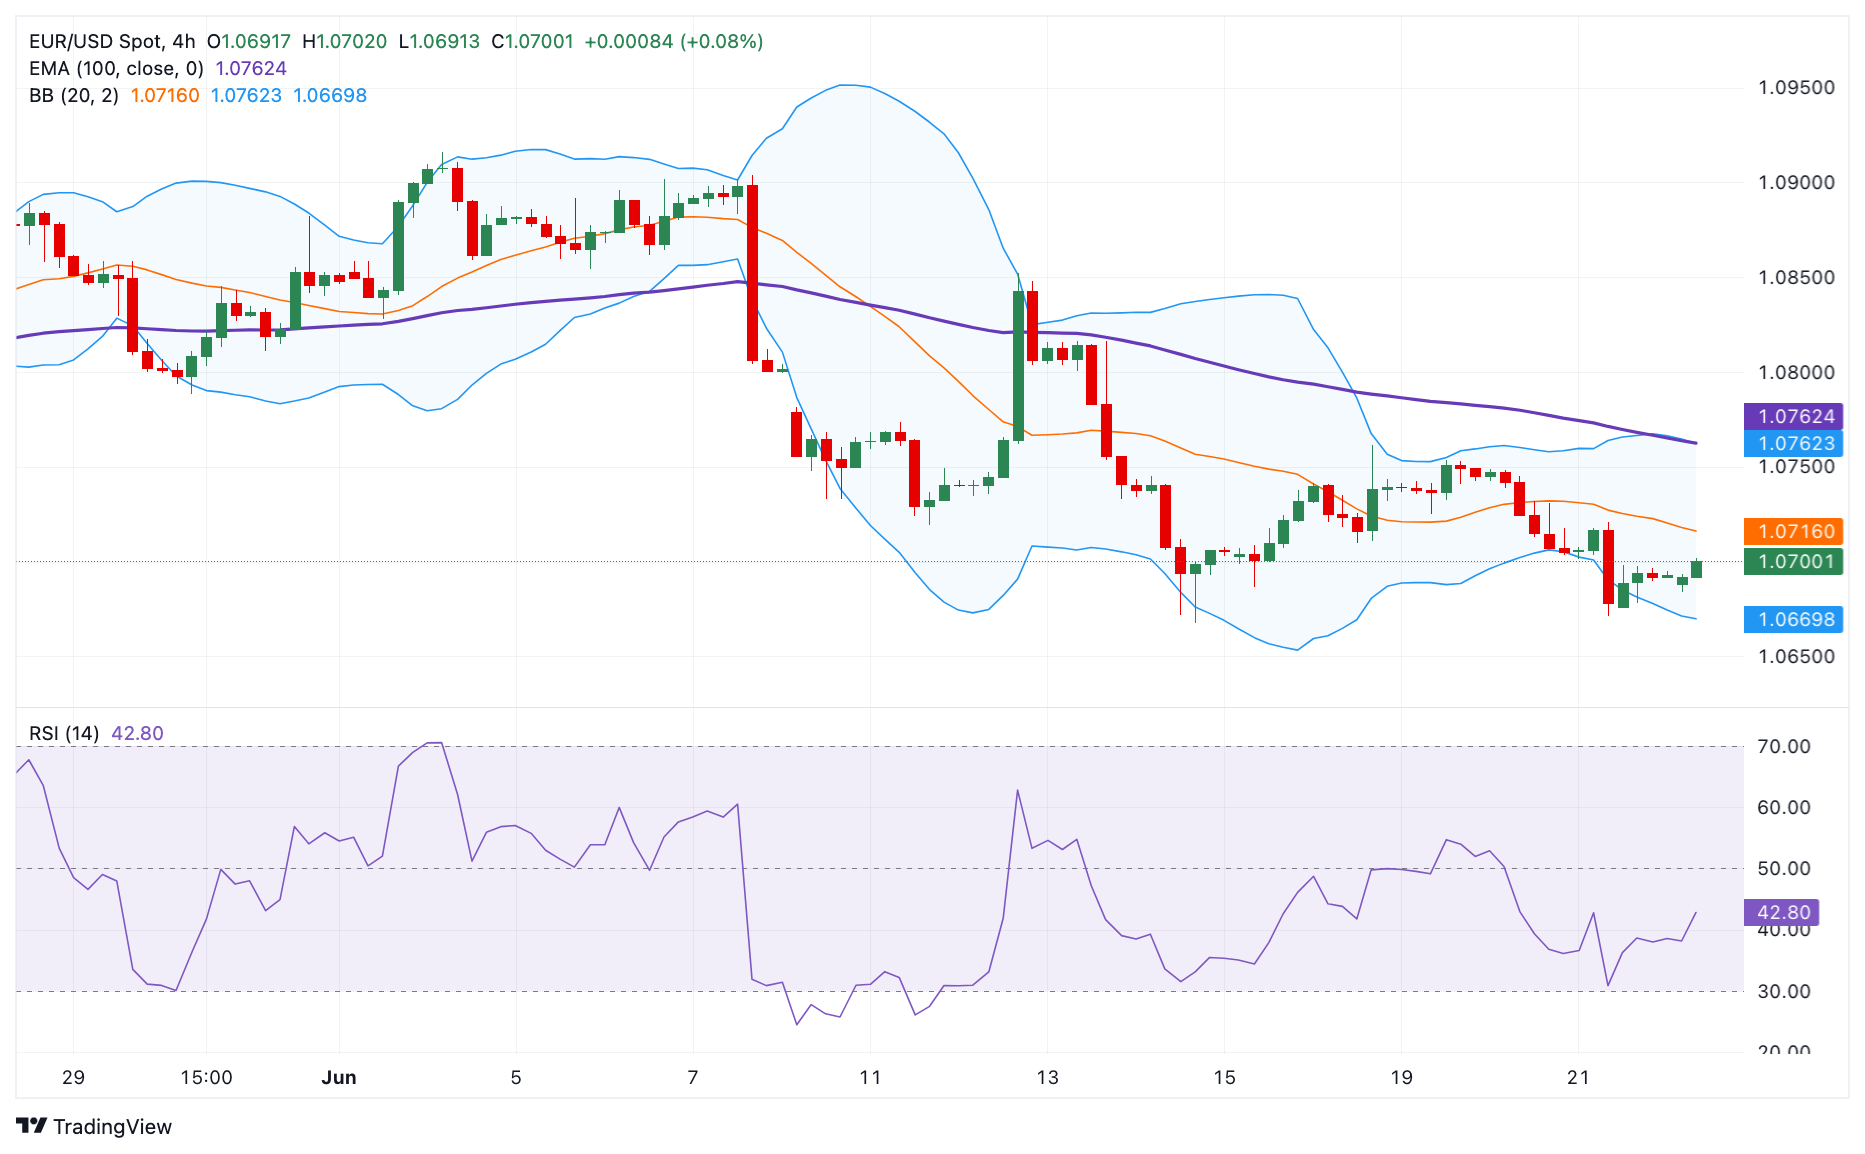
- Silver struggles to register any meaningful recovery from a multi-day low touched this Monday.
- The mixed technical setup warrants caution before placing bullish bets around the XAG/USD.
- A convincing break below the 50-day SMA is needed to support prospects for further losses.
Silver (XAG/USD) finds some support ahead of the 50-day Simple Moving Average (SMA) and stages a modest bounce from a three-day low, around the $29.35 region touched during the Asian session on Monday. The white metal, for now, seems to have stalled its retracement slide from the vicinity of the $31.00 mark, or a two-week high touched on Friday, though struggles to attract any meaningful buyers.
From a technical perspective, the XAG/USD is holding above 50-day, 100-day and 200-day SMAs, which favors bullish traders. That said, oscillators on the daily chart have just started drifting in negative territory and warrant some caution before positioning for any further appreciating move. Meanwhile, the 50-day SMA, currently pegged near the $29.15 area, is likely to protect the immediate downside ahead of the $29.00 round-figure mark.
A convincing break below the latter will shift the near-term bias in favor of bearish traders and set the stage for some meaningful downside. The XAG/USD might then accelerate the fall towards the next relevant support near the $28.30-28.25 region and eventually drop to the $28.00 mark. The downward trajectory could extend further towards the $27.55 support en route to the $27.00 round figure and the 100-day SMA, around the $26.90-26.85 area.
On the flip side, the $30.00 psychological mark might act as an immediate strong barrier ahead of the $30.45-30.50 region. This is followed by the $30.70 supply zone, above which the XAG/USD could aim to surpass the $31.00 round figure and test the next relevant hurdle near the $31.35 area. The subsequent move-up should allow bulls to reclaim the $32.00 mark and retest the $32.50 supply zone, or the YTD peak touched in May.
Silver daily chart
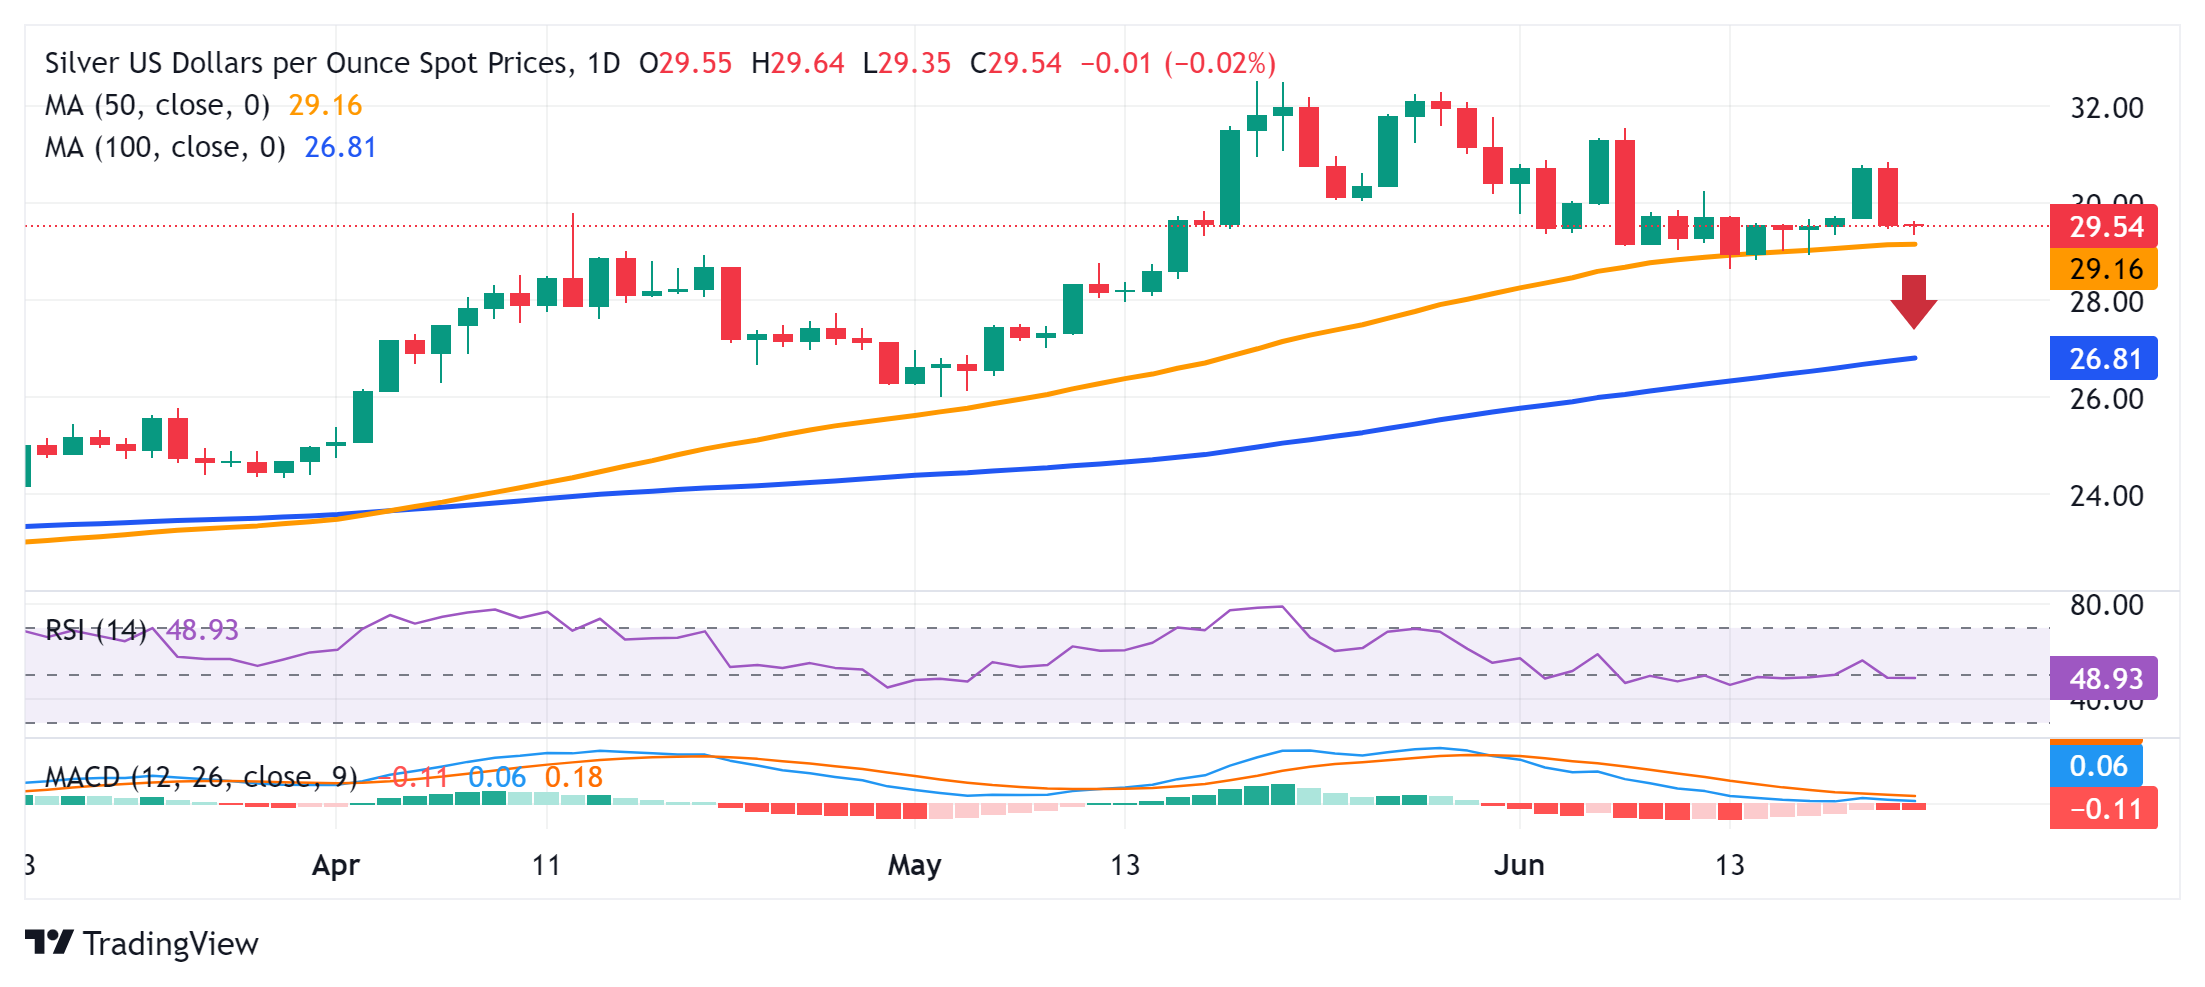
- WTI price edges higher to $80.50 on Monday.
- The escalating Middle East geopolitical tensions and hope for a summertime uptick in fuel demand support the WTI price.
- The renewed US Dollar demand might cap the upside for black gold.
West Texas Intermediate (WTI), the US crude oil benchmark, is trading around $80.50 on Monday. The black gold edges modestly higher on the back of ongoing geopolitical tensions in the Middle East and the expectation of a summer uptick in oil demand.
Investors are concerned about a wider conflict in the Middle East that could endanger crude flows from the region, which boost the WTI price. The UN Secretary-General said on Sunday that a full-scale war between Israel and Hezbollah would be a catastrophe. Additionally, the Anadolu news agency reported that several Palestinian children and women were killed and injured overnight Saturday in Israeli air strikes that targeted two homes in Gaza City.
Furthermore, the hope for a summertime uptick in fuel demand for cooling and travel purposes could further support WTI prices. JPMorgan reported that global oil demand rose by 1.4 million bpd in June, supported by robust summer travel across Europe and Asia.
On the other hand, the stronger US Dollar (USD) after the US S&P PMI data for June and the hawkish stance of Federal Reserve (Fed) officials is likely to support the black gold. The Fed policymakers noted that the US central bank needs to see more progress on inflation before considering a rate cut. The higher-for-longer US rate narrative continues to weigh on WTI prices as it increases the cost of borrowing, which can dampen economic activity and oil demand.
- USD/CAD broke its losing streak as higher-than-expected US PMI data supported the US Dollar.
- Fed’s Neel Kashkari argued that it will probably take a year or two to get inflation back to 2%.
- Higher Crude Oil prices could limit the downside of the commodity-linked Canadian Dollar.
USD/CAD halts its six-day losing streak, trading around 1.3700 during the Asian session on Monday. On Friday, a higher-than-expected US Purchasing Managers Index (PMI) boosted the US Dollar (USD), underpinning the USD/CAD pair.
The US Composite PMI for June surpassed expectations, rising to 54.6 from May’s reading of 54.5. This figure marked the highest level since April 2022. The Manufacturing PMI increased to a reading of 51.7 from a 51.3 figure, exceeding the forecast of 51.0. Similarly, the Services PMI rose to 55.1 from 54.8 in May, beating the consensus estimate of 53.7.
The US Dollar Index (DXY), which measures the value of the US Dollar (USD) against six major currencies, edges higher due to the Federal Reserve (Fed) officials delaying the anticipated timing of the first interest rate cut this year. Fed Bank of Minneapolis President Neel Kashkari argued on Thursday that it will probably take a year or two to get inflation back to 2%, per Reuters.
According to the CME FedWatch Tool, investors are pricing in nearly 65.9% odds of a Fed rate cut in September, compared to 70.2% a week earlier.
On Loonie’s front, the upward correction in crude Oil prices could limit the downside of the commodity-linked Canadian Dollar (CAD). Geopolitical tensions are supporting Oil prices, with Israeli troops advancing deeper into Gaza in the Middle East, while Ukrainian drone attacks on Russian refineries persistently disrupt supply.
- NZD/USD remains depressed on Monday amid a modest USD strength.
- A softer risk tone contributes to the offered tone surrounding the pair.
- September Fed rate cut bets cap gains for the USD and lend support.
The NZD/USD pair kicks off the new week on a weaker note and drops to a multi-day trough during the Asian session, albeit finds some support near the 0.6100 round-figure mark. Any meaningful recovery, however, still seems elusive in the wake of a modest US Dollar (USD) strength and the cautious market mood.
The USD Index (DXY), which tracks the Greenback against a basket of currencies, climbs to its highest level since May 9 in the wake of the Federal Reserve's (Fed) hawkish stance, indicating only one rate cut this year. This, along with Friday's better-than-expected release of the flash US PMIs, continues to lend some support to the buck. Meanwhile, persistent geopolitical tensions and political uncertainty in Europe temper investors' appetite for riskier assets, which is seen as another factor that benefits the Greenback's relative safe-haven status and should act as a headwind for the risk-sensitive Kiwi.
Furthermore, expectations that the Reserve Bank of New Zealand (RBNZ) will cut rates earlier than projected might contribute to capping gains for the NZD/USD pair. In fact, the central bank projected that it will wait until the third quarter of 2025 before cutting rates amid still-elevated inflation. Market players, however, expect the beginning of the rate-cutting cycle early next year in the wake of the recent economic downturn. This, along with China's economic woes, warrants caution before positioning for any recovery for antipodean currencies, including the New Zealand Dollar (NZD).
The aforementioned fundamental backdrop suggests that the path of least resistance for the NZD/USD pair is to the downside. Traders, however, might refrain from placing aggressive bets and prefer to wait for this week's release of important US macro data – the final Q1 GDP print and the Personal Consumption Expenditures (PCE) Price Index. In the meantime, speeches by influential FOMC members could drive the USD demand and provide some impetus to the currency pair in the absence of any relevant market-moving economic releases from the US.
- The Australian Dollar declines as the US Dollar remains stronger on the hawkish Fed.
- The Aussie Dollar may limit its downside due to the RBA’s hawkish stance on rates trajectory.
- The US Dollar remains stable as Fed officials delay the timing of the first interest rate cut in 2024.
The Australian Dollar (AUD) extends its losses for the third successive session on Monday. However, the AUD/USD pair may limit its downside due to the hawkish stance of the Reserve Bank of Australia (RBA). The RBA Governor Michele Bullock said during her latest press conference that the Board discussed potential rate hikes, dismissing considerations of rate cuts in the near term, as per ABC News.
The US Dollar (USD) remains stable as Federal Reserve (Fed) officials delay the timing of the first interest rate cut this year. According to the CME FedWatch Tool, investors are now pricing in nearly 65.9% odds of a Fed rate cut in September, down from 70.2% a week earlier.
Daily Digest Market Movers: Australian Dollar declines due to hawkish Fed
- The ASX 200 Index fell below 7,750 on Monday, relinquishing some of the gains from the previous session. This decline follows a weak lead from Wall Street, where Nvidia and other artificial intelligence-related chip stocks faced heavy selling after a strong run.
- The People's Bank of China injected 50 billion Yuan via seven-day reverse repos, maintaining the reverse repo rate at 1.8%. Any change in the Chinese economy could impact the Australian market, as China and Australia are close trade partners.
- Investors are likely to be cautious ahead of this week's Australian inflation data. Markets have significantly reduced their expectations for a RBA’s rate cut this year, with an easing not anticipated until April next year.
- On Friday, the US Composite PMI for June surpassed expectations, rising to 54.6 from May’s reading of 54.5. This figure marked the highest level since April 2022. The Manufacturing PMI increased to a reading of 51.7 from a 51.3 figure, exceeding the forecast of 51.0. Similarly, the Services PMI rose to 55.1 from 54.8 in May, beating the consensus estimate of 53.7.
- As per a Bloomberg report, Fed Bank of Richmond President Tom Barkin said on Thursday that the central bank is well-positioned with the necessary firepower for the job, but will learn a lot more over the next several months. Meanwhile, Fed Bank of Minneapolis President Neel Kashkari noted that it will probably take a year or two to get inflation back to 2%.
Technical Analysis: Australian Dollar remains below 0.6650
The Australian Dollar trades around 0.6630 on Monday. Analysis of the daily chart shows a neutral bias for the AUD/USD pair as it consolidates within a rectangle formation. The 14-day Relative Strength Index (RSI) is positioned on the 50 level, further movement may give a clear directional trend.
The AUD/USD pair may find support around the 50-day Exponential Moving Average (EMA) at 0.6612, with additional support at approximately 0.6585, marking the lower boundary of a rectangle formation.
On the upside, the AUD/USD pair may encounter resistance near the upper boundary of the rectangle formation around 0.6700. Beyond that, potential resistance levels include the high of 0.6714 observed since January.
AUD/USD: Daily Chart
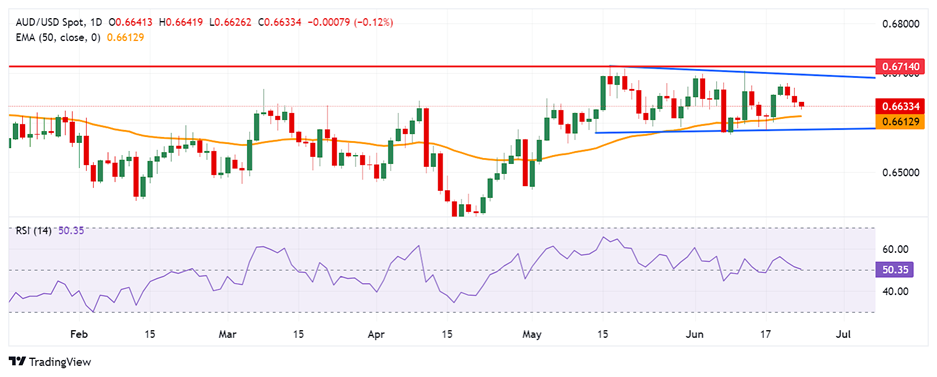
Australian Dollar price today
The table below shows the percentage change of the Australian Dollar (AUD) against listed major currencies today. The Australian Dollar was the weakest against the Japanese Yen.
| USD | EUR | GBP | CAD | AUD | JPY | NZD | CHF | |
| USD | -0.04% | -0.03% | -0.04% | -0.01% | -0.13% | 0.00% | -0.13% | |
| EUR | 0.03% | 0.00% | 0.00% | 0.05% | -0.09% | 0.04% | -0.10% | |
| GBP | 0.03% | 0.00% | -0.01% | 0.05% | -0.09% | 0.04% | -0.10% | |
| CAD | 0.04% | 0.00% | 0.02% | 0.05% | -0.08% | 0.05% | -0.09% | |
| AUD | 0.01% | -0.05% | -0.05% | -0.07% | -0.13% | 0.00% | -0.10% | |
| JPY | 0.13% | 0.10% | 0.09% | 0.10% | 0.13% | 0.14% | 0.01% | |
| NZD | -0.01% | -0.04% | -0.04% | -0.04% | 0.01% | -0.13% | -0.13% | |
| CHF | 0.14% | 0.09% | 0.10% | 0.09% | 0.14% | 0.02% | 0.13% |
The heat map shows percentage changes of major currencies against each other. The base currency is picked from the left column, while the quote currency is picked from the top row. For example, if you pick the Euro from the left column and move along the horizontal line to the Japanese Yen, the percentage change displayed in the box will represent EUR (base)/JPY (quote).
Australian Dollar FAQs
One of the most significant factors for the Australian Dollar (AUD) is the level of interest rates set by the Reserve Bank of Australia (RBA). Because Australia is a resource-rich country another key driver is the price of its biggest export, Iron Ore. The health of the Chinese economy, its largest trading partner, is a factor, as well as inflation in Australia, its growth rate and Trade Balance. Market sentiment – whether investors are taking on more risky assets (risk-on) or seeking safe-havens (risk-off) – is also a factor, with risk-on positive for AUD.
The Reserve Bank of Australia (RBA) influences the Australian Dollar (AUD) by setting the level of interest rates that Australian banks can lend to each other. This influences the level of interest rates in the economy as a whole. The main goal of the RBA is to maintain a stable inflation rate of 2-3% by adjusting interest rates up or down. Relatively high interest rates compared to other major central banks support the AUD, and the opposite for relatively low. The RBA can also use quantitative easing and tightening to influence credit conditions, with the former AUD-negative and the latter AUD-positive.
China is Australia’s largest trading partner so the health of the Chinese economy is a major influence on the value of the Australian Dollar (AUD). When the Chinese economy is doing well it purchases more raw materials, goods and services from Australia, lifting demand for the AUD, and pushing up its value. The opposite is the case when the Chinese economy is not growing as fast as expected. Positive or negative surprises in Chinese growth data, therefore, often have a direct impact on the Australian Dollar and its pairs.
Iron Ore is Australia’s largest export, accounting for $118 billion a year according to data from 2021, with China as its primary destination. The price of Iron Ore, therefore, can be a driver of the Australian Dollar. Generally, if the price of Iron Ore rises, AUD also goes up, as aggregate demand for the currency increases. The opposite is the case if the price of Iron Ore falls. Higher Iron Ore prices also tend to result in a greater likelihood of a positive Trade Balance for Australia, which is also positive of the AUD.
The Trade Balance, which is the difference between what a country earns from its exports versus what it pays for its imports, is another factor that can influence the value of the Australian Dollar. If Australia produces highly sought after exports, then its currency will gain in value purely from the surplus demand created from foreign buyers seeking to purchase its exports versus what it spends to purchase imports. Therefore, a positive net Trade Balance strengthens the AUD, with the opposite effect if the Trade Balance is negative.
- Gold price attracts some buyers and reverses a part of Friday’s slide from a two-week high.
- Bets for a September Fed rate cut and geopolitical risk lend some support to the XAU/USD.
- The USD climbs to its highest level since May 9 and acts as a headwind for the commodity.
Gold price (XAU/USD) finds some support near the $2,317 region during the Asian session on Monday and for now, seems to have stalled its retracement slide from a two-week high touched on Friday. Growing acceptance that the Federal Reserve (Fed) will start its rate-cutting cycle in September amid signs of easing inflationary pressures acts as a tailwind for the non-yielding yellow metal. Adding to this, a softer risk tone, persistent geopolitical tensions and political uncertainty in Europe lend support to the safe-haven commodity.
Meanwhile, the stronger-than-expected US PMIs released on Friday pointed to a still resilient economy. This comes on top of the Fed's hawkish surprise earlier this month, forecasting only one rate cut in 2024, which continues to underpin the US Dollar (USD) and should keep a lid on any meaningful upside for the Gold price. Traders might also prefer to move to the sidelines ahead of this week's release of the final US Q1 GDP print and the Personal Consumption Expenditures (PCE) Price Index before placing fresh directional bets.
Daily Digest Market Movers: Gold price benefits from Fed rate cut bets, stronger USD caps gains
- A combination of diverging forces fails to provide any meaningful impetus to the Gold price and leads to subdued range-bound price action on the first day of a new week.
- The Federal Reserve adopted a more hawkish stance at the end of the June meeting, while policymakers continue to argue in favor of only one interest rate cut by the end of this year.
- This, along with Friday's better-than-expected US flash PMIs, lifts the US Dollar to its highest level since May 9 and turns out to be a key factor acting as a headwind for the commodity.
- The flash US composite PMI edged up from 54.5 in May to 54.6 this month, or the highest level since April 2022, suggesting that the economy ended the second quarter on a solid note.
- Meanwhile, the prices paid for inputs measure dropped to 56.6 from 57.2 previous, while the output prices gauge fell to 53.5, marking one of the slowest rises over the past four years.
- This comes on the back of softer US consumer and producer prices, which, along with last week's disappointing US Retail Sales figures, keep bets for two rate cuts this year on the table.
- According to the CME Group's FedWatch Tool, the markets are currently pricing in over a 60% chance that the Federal Reserve will begin cutting interest rates at the September meeting.
- The US central bank is anticipated to lower borrowing costs further in December, which acts as a headwind for the US Treasury bond yields and lends support to the XAU/USD.
- The security pact between Russian President Vladimir Putin and North Korean leader Kim Jong-un in Pyongyang raises the risk of a further escalation of geopolitical tensions.
- Furthermore, French President Emmanuel Macron's decision to call snap elections sparked concerns about wider political uncertainty and should limit losses for the safe-haven metal.
- Traders will continue to take cues from comments by FOMC members ahead of this week's release of the final US GDP and the Personal Consumption Expenditures (PCE) Price Index.
Technical Analysis: Gold price manages to hold above a short-term ascending trend-line support
From a technical perspective, Friday's decline could be categorized as a failed breakout through the 50-day Simple Moving Average (SMA) resistance. The subsequent downfall, however, stalls ahead of a two-week-old ascending trend-line support, currently pegged near the $2,312 region, which should now act as a key pivotal point. Given that oscillators on the daily chart have just started drifting in negative territory, a convincing break below the said support will make the Gold price vulnerable to weaken below the $2,300 mark and retest the monthly swing low around the $2,285 horizontal zone. Some follow-through selling will be seen as a fresh trigger for bearish traders and expose the 100-day SMA support near the $2,247-2,246 area. The downward trajectory could extend further towards the $2,225-2,220 support before the commodity eventually drops to the $2,200 round-figure mark.
On the flip side, the 50-day SMA, currently pegged near the $2,341-2,342 region, is likely to act as an immediate strong hurdle ahead of Friday's swing high, around the $2,368-2,369 zone. Some follow-through buying has the potential to lift the Gold price towards the $2,387-2,388 intermediate hurdle en route to the $2,400 round-figure mark. A sustained strength beyond the latter will negate any near-term negative outlook and allow the XAU/USD to aim back to retest the all-time peak, around the $2,450 area touched in May.
Gold FAQs
Gold has played a key role in human’s history as it has been widely used as a store of value and medium of exchange. Currently, apart from its shine and usage for jewelry, the precious metal is widely seen as a safe-haven asset, meaning that it is considered a good investment during turbulent times. Gold is also widely seen as a hedge against inflation and against depreciating currencies as it doesn’t rely on any specific issuer or government.
Central banks are the biggest Gold holders. In their aim to support their currencies in turbulent times, central banks tend to diversify their reserves and buy Gold to improve the perceived strength of the economy and the currency. High Gold reserves can be a source of trust for a country’s solvency. Central banks added 1,136 tonnes of Gold worth around $70 billion to their reserves in 2022, according to data from the World Gold Council. This is the highest yearly purchase since records began. Central banks from emerging economies such as China, India and Turkey are quickly increasing their Gold reserves.
Gold has an inverse correlation with the US Dollar and US Treasuries, which are both major reserve and safe-haven assets. When the Dollar depreciates, Gold tends to rise, enabling investors and central banks to diversify their assets in turbulent times. Gold is also inversely correlated with risk assets. A rally in the stock market tends to weaken Gold price, while sell-offs in riskier markets tend to favor the precious metal.
The price can move due to a wide range of factors. Geopolitical instability or fears of a deep recession can quickly make Gold price escalate due to its safe-haven status. As a yield-less asset, Gold tends to rise with lower interest rates, while higher cost of money usually weighs down on the yellow metal. Still, most moves depend on how the US Dollar (USD) behaves as the asset is priced in dollars (XAU/USD). A strong Dollar tends to keep the price of Gold controlled, whereas a weaker Dollar is likely to push Gold prices up.
- The Indian Rupee kicks off the new week on a positive note on Monday.
- A positive economic growth outlook, significant India’s foreign inflows, lower oil prices support the INR.
- Investors await the US Chicago Fed National Activity Index, Dallas Fed Manufacturing Business Index and Fed’s Daly speech on Monday.
The Indian Rupee (INR) strengthens on Monday despite the firmer US Dollar (USD). The expectations of continued policy reforms following India’s general election results, a sustained economic growth outlook, and significant foreign inflows into Indian markets may have been factors that triggered the INR’s upside. Additionally, the decline of crude oil prices continues to underpin the local currency as India is the third-largest consumer of crude oil in the world.
Nonetheless, the stronger-than-expected advanced US Purchasing Managers Index (PMI) data and cautious approach from the US Federal Reserve (Fed) are likely to boost the Greenback and create a tailwind for USD/INR. On Monday, the US Chicago Fed National Activity Index for May and the Dallas Fed Manufacturing Business Index for June will be released. Also, the Fed’s Mary Daly is set to speak later in the day.
Daily Digest Market Movers: Indian Rupee edges higher amid encouraging factors
- The Reserve Bank of India (RBI) published the Monetary Policy Committee (MPC) minutes on Friday, stating that the policy must continue to be actively disinflationary to ensure inflation is on course to its target level and fuller transmission.
- “Food inflation is the main factor behind the grudgingly slow pace of disinflation. Recurring and overlapping supply-side shocks continue to play an outsized role in food inflation,” said RBI Governor Shaktikanta Das in minutes.
- The first reading of India’s HSBC Manufacturing PMI data rose to 58.5 in June from 57.5 in May. Meanwhile, the Services PMI climbed to 60.4 in the same reported period from 60.2 in May, better than the market expectation of 60.0.
- The flash US S&P Composite PMI climbed to 54.6 in June from a final reading of 54.5 in May. The US Manufacturing PMI rose to 51.7 in the same reported period from 51.3 in May and was stronger than the expected 51. The Services PMI improved to 55.1 in June from 54.8 prior, beating the estimation of 53.7.
- US Existing Home Sales in May were lower than expected, falling to 4.11 million in May from 4.14 million in April, representing a contraction of -0.7% MoM.
Technical analysis: USD/INR remains firm in the longer term
The Indian Rupee trades stronger on the day. Nonetheless, the USD/INR pair maintains the bullish bias on the daily chart beyond the key 100-day Exponential Moving Average (EMA), with the 14-day Relative Strength Index (RSI) holding above the 50-midline. This indicates that the support is more likely to hold than to break.
The all-time high of 83.75 acts as an immediate resistance level for the pair. Any follow-through buying possibly sends the pair up to the 84.00 psychological level.
On the bearish side, the initial support level for USD/INR will emerge at 83.43, a low of June 20. The crucial contention level is located in the 83.30-83.35 zone, representing the resistance-turned-support level and the 100-day EMA.
US Dollar price today
The table below shows the percentage change of US Dollar (USD) against listed major currencies today. US Dollar was the weakest against the Japanese Yen.
| USD | EUR | GBP | CAD | AUD | JPY | NZD | CHF | |
| USD | -0.05% | -0.01% | -0.03% | -0.08% | -0.11% | -0.03% | -0.11% | |
| EUR | 0.04% | 0.02% | 0.01% | -0.01% | -0.06% | 0.01% | -0.08% | |
| GBP | 0.01% | -0.03% | -0.03% | -0.03% | -0.10% | -0.02% | -0.10% | |
| CAD | 0.03% | -0.02% | 0.02% | -0.03% | -0.08% | 0.00% | -0.08% | |
| AUD | 0.08% | 0.01% | 0.04% | 0.01% | -0.06% | 0.03% | -0.02% | |
| JPY | 0.11% | 0.09% | 0.10% | 0.09% | 0.05% | 0.11% | 0.00% | |
| NZD | 0.03% | -0.01% | 0.01% | 0.00% | -0.03% | -0.08% | -0.10% | |
| CHF | 0.13% | 0.07% | 0.11% | 0.08% | 0.06% | 0.02% | 0.08% |
The heat map shows percentage changes of major currencies against each other. The base currency is picked from the left column, while the quote currency is picked from the top row. For example, if you pick the Euro from the left column and move along the horizontal line to the Japanese Yen, the percentage change displayed in the box will represent EUR (base)/JPY (quote).
Indian Rupee FAQs
The Indian Rupee (INR) is one of the most sensitive currencies to external factors. The price of Crude Oil (the country is highly dependent on imported Oil), the value of the US Dollar – most trade is conducted in USD – and the level of foreign investment, are all influential. Direct intervention by the Reserve Bank of India (RBI) in FX markets to keep the exchange rate stable, as well as the level of interest rates set by the RBI, are further major influencing factors on the Rupee.
The Reserve Bank of India (RBI) actively intervenes in forex markets to maintain a stable exchange rate, to help facilitate trade. In addition, the RBI tries to maintain the inflation rate at its 4% target by adjusting interest rates. Higher interest rates usually strengthen the Rupee. This is due to the role of the ‘carry trade’ in which investors borrow in countries with lower interest rates so as to place their money in countries’ offering relatively higher interest rates and profit from the difference.
Macroeconomic factors that influence the value of the Rupee include inflation, interest rates, the economic growth rate (GDP), the balance of trade, and inflows from foreign investment. A higher growth rate can lead to more overseas investment, pushing up demand for the Rupee. A less negative balance of trade will eventually lead to a stronger Rupee. Higher interest rates, especially real rates (interest rates less inflation) are also positive for the Rupee. A risk-on environment can lead to greater inflows of Foreign Direct and Indirect Investment (FDI and FII), which also benefit the Rupee.
Higher inflation, particularly, if it is comparatively higher than India’s peers, is generally negative for the currency as it reflects devaluation through oversupply. Inflation also increases the cost of exports, leading to more Rupees being sold to purchase foreign imports, which is Rupee-negative. At the same time, higher inflation usually leads to the Reserve Bank of India (RBI) raising interest rates and this can be positive for the Rupee, due to increased demand from international investors. The opposite effect is true of lower inflation.
| Raw materials | Closed | Change, % |
|---|---|---|
| Silver | 29.528 | -3.88 |
| Gold | 232.107 | -1.63 |
| Palladium | 940.5 | 1.69 |
Japanese Finance Minister Shunichi Suzuki said on Monday that it is “desirable for currencies to move in a stable manner reflecting fundamentals.”
Additional comments
Won't comment on forex levels.
Excessive FX change undesirable.
Want to respond appropriately as needed.
No comment, when asked if current FX moves are excessive.
Market reaction
The Japanese Yen is recovering ground on these intervention warnings, as USD/JPY mires near intraday lows of 159.63, down 0.05% so far.
- The Japanese Yen may continue its losing streak as the US Dollar remains stronger due to the hawkish Fed.
- Japan's Masato Kanda said to intervene in the FX market around the clock if necessary.
- The US Dollar edges higher as Fed officials keep delaying the timing of the first interest rate cut in 2024.
The Japanese Yen (JPY) may continue its losing streak for the eighth consecutive session on Monday. On Friday, a stronger-than-expected US Purchasing Managers Index (PMI) boosted the US Dollar (USD), influencing the USD/JPY pair.
Japan's top currency diplomat, Masato Kanda, stated on Monday that he would take appropriate measures if there were excessive movements in the foreign exchange market. Kanda cautioned against the negative economic effects of such movements and emphasized his readiness to intervene around the clock if necessary, per Reuters.
The US Dollar Index (DXY), meanwhile, which measures the value of the US Dollar (USD) against six major currencies, edges higher due to the Federal Reserve (Fed) officials delaying the timing of the first interest rate cut this year. According to the CME FedWatch Tool, investors are pricing in nearly 65.9% odds of a Fed rate cut in September, compared to 70.2% a week earlier.
Daily Digest Market Movers: Japanese Yen declines due to the hawkish Fed
- BoJ’s Summary of Opinions from its June monetary policy meeting noted that underlying inflation, measured by the consumer price index (CPI), is expected to increase gradually. In the second half of the projection period, it is likely to be at a level that is generally consistent with the price stability target.
- On Friday, the US Composite PMI for June surpassed expectations, rising to 54.6 from May’s reading of 54.5. This figure marked the highest level since April 2022. The Manufacturing PMI increased to a reading of 51.7 from a 51.3 figure, exceeding the forecast of 51.0. Similarly, the Services PMI rose to 55.1 from 54.8 in May, beating the consensus estimate of 53.7.
- Reuters reported that Bank of Japan Deputy Governor Shinichi Uchida stated on Friday that the central bank would "adjust the degree of monetary support" if the economy and prices align with its forecasts. This signals the bank's readiness to raise interest rates further.
- Japan reaffirmed its commitment on Friday to achieve a primary budget surplus by the next fiscal year. This decision reflects concerns that exiting the ultra-low interest rate environment could increase the government's debt burden, according to Reuters.
- As per a Bloomberg report, Fed Bank of Richmond President Tom Barkin said on Thursday that the central bank is well-positioned with the necessary firepower for the job, but will learn a lot more over the next several months. Meanwhile, Fed Bank of Minneapolis President Neel Kashkari noted that it will probably take a year or two to get inflation back to 2%.
Technical Analysis: USD/JPY remains above 159.50
USD/JPY trades around 159.70 on Monday. Analyzing the daily chart shows a bullish bias, with the pair testing the upper boundary of an ascending channel pattern. Moreover, the 14-day Relative Strength Index (RSI) is above the 50 level, suggesting a tendency for upward momentum.
The surpassing of the upper threshold of the ascending channel pattern will reinforce the bullish sentiment and lead the pair to approach he level of 160.32, marked in April as the highest level in over thirty years, which represents a major resistance.
On the downside, the immediate support appears at the nine-day Exponential Moving Average (EMA) at 158.42. A breach below this level could intensify downward pressure on the USD/JPY pair, potentially driving it toward the lower boundary of the ascending channel around the level of 155.60. A break below this level could exert pressure on the pair to test the throwback support around the 152.80 level.
USD/JPY: Daily Chart
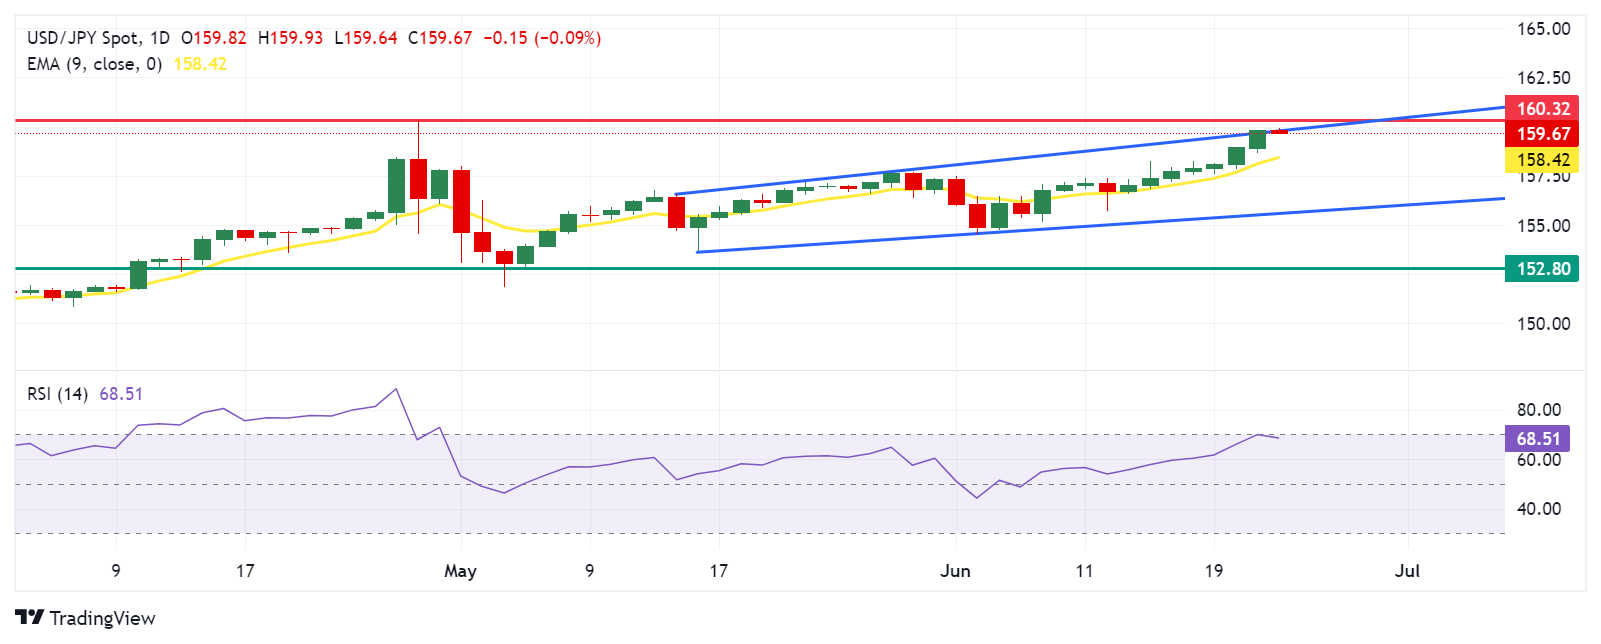
Japanese Yen price today
The table below shows the percentage change of the Japanese Yen (JPY) against listed major currencies today. Japanese Yen was the weakest against the Swiss Franc.
| USD | EUR | GBP | CAD | AUD | JPY | NZD | CHF | |
| USD | -0.03% | 0.02% | 0.01% | -0.01% | -0.12% | 0.03% | -0.11% | |
| EUR | 0.02% | 0.04% | 0.03% | 0.03% | -0.10% | 0.05% | -0.10% | |
| GBP | -0.02% | -0.03% | -0.01% | 0.00% | -0.14% | 0.02% | -0.13% | |
| CAD | -0.01% | -0.04% | 0.01% | 0.00% | -0.13% | 0.02% | -0.12% | |
| AUD | 0.01% | -0.03% | 0.01% | -0.02% | -0.13% | 0.02% | -0.08% | |
| JPY | 0.13% | 0.12% | 0.13% | 0.15% | 0.13% | 0.17% | 0.03% | |
| NZD | -0.03% | -0.06% | -0.02% | -0.02% | -0.02% | -0.15% | -0.14% | |
| CHF | 0.12% | 0.09% | 0.13% | 0.12% | 0.11% | 0.00% | 0.14% |
The heat map shows percentage changes of major currencies against each other. The base currency is picked from the left column, while the quote currency is picked from the top row. For example, if you pick the Euro from the left column and move along the horizontal line to the Japanese Yen, the percentage change displayed in the box will represent EUR (base)/JPY (quote).
Japanese Yen FAQs
The Japanese Yen (JPY) is one of the world’s most traded currencies. Its value is broadly determined by the performance of the Japanese economy, but more specifically by the Bank of Japan’s policy, the differential between Japanese and US bond yields, or risk sentiment among traders, among other factors.
One of the Bank of Japan’s mandates is currency control, so its moves are key for the Yen. The BoJ has directly intervened in currency markets sometimes, generally to lower the value of the Yen, although it refrains from doing it often due to political concerns of its main trading partners. The current BoJ ultra-loose monetary policy, based on massive stimulus to the economy, has caused the Yen to depreciate against its main currency peers. This process has exacerbated more recently due to an increasing policy divergence between the Bank of Japan and other main central banks, which have opted to increase interest rates sharply to fight decades-high levels of inflation.
The BoJ’s stance of sticking to ultra-loose monetary policy has led to a widening policy divergence with other central banks, particularly with the US Federal Reserve. This supports a widening of the differential between the 10-year US and Japanese bonds, which favors the US Dollar against the Japanese Yen.
The Japanese Yen is often seen as a safe-haven investment. This means that in times of market stress, investors are more likely to put their money in the Japanese currency due to its supposed reliability and stability. Turbulent times are likely to strengthen the Yen’s value against other currencies seen as more risky to invest in.
- GBP/USD struggles near its lowest level since mid-May touched on Friday.
- Bets for a rate cut by the BoE in August continue to undermine the GBP.
- The USD climbs to its highest level since May 9 and also exerts pressure.
The GBP/USD pair kicks off the new week on a subdued note and remains well within the striking distance of its lowest level since mid-May touched on Friday. Spot prices currently trade around the 1.2635 area, with bears awaiting a sustained break and acceptance below the 100-day Simple Moving Average (SMA) before positioning for an extension of the recent pullback from a multi-month peak.
The British Pound (GBP) continues to be undermined by the Bank of England's (BoE) dovish pause last week, which lifted bets for an interest rate cut at the August monetary policy meeting. Adding to this, the flash UK PMIs released on Friday showed that private sector business activity expanded in June at its slowest rate since last November. This, along with some follow-through US Dollar (USD) buying, turns out to be another factor weighing on the GBP/USD pair.
Against the backdrop of the Federal Reserve's (Fed) hawkish surprise earlier this month, forecasting only one rate cut this year, data released on Friday showed the US business activity crept up to a 26-month high in June. Apart from this, a cautious market mood lifts the safe-haven buck to its highest level since May 9 and further contributes to the offered tone surrounding the GBP/USD pair, though the lack of follow-through selling warrants caution for bearish traders.
Market participants are still pricing in the possibility of two interest rate cuts by the Fed in 2024 amid signs of easing inflationary pressures in the US. This might keep a lid on any further appreciating move for the Greenback and help limit the downside for the GBP/USD pair. Traders might also refrain from placing aggressive directional bets ahead of the UK general election on July 4 and in the absence of any relevant market-moving macroeconomic released on Monday.
The People’s Bank of China (PBoC) set the USD/CNY central rate for the trading session ahead on Monday at 7.1201, as against the previous day's fix of 7.1196 and 7.2647 Reuters estimates.
- NZD/USD remains on the defensive around 0.6110 in Monday’s early Asian session.
- New Zealand’s Trade Balance arrived at NZD $-10.05B YoY in May from the previous reading of $-10.22B. A
- The RBNZ’s hawkish bias could limit the downside for the Kiwi.
The NZD/USD pair extends the downside near 0.6110 on Monday during the early Asian trading hours. New Zealand has been the weakest currency in this session amid the lack of catalysts. Meanwhile, the stronger US Dollar (USD) after the encouraging US Purchasing Managers Index (PMI) data might weigh on the NZD/USD for the time being.
Data released from Statistics New Zealand on Monday showed that New Zealand’s Trade Balance arrived at NZD $-10.05B YoY in May from the previous reading of $-10.22B. Additionally, Exports rose to $7.16B in the same month versus $6.31B prior whereas Imports increased to $6.95B in May compared to $6.32B in April.
The Reserve Bank of New Zealand (RBNZ) forecast during its last policy meeting in May that the central bank wouldn’t start cutting its Official Cash Rate from 5.5% until the third quarter of next year. Nonetheless, many analysts expect the beginning of the rate cut in early 2025
US business activity expanded in June at the fastest pace in more than two years, according to the S&P surveys released on Friday. The flash US S&P Composite PMI climbed to 54.6 in June from a final reading of 54.5 in May. The Manufacturing PMI rose to 51.7 in the same reported period from 51.3 in May and was stronger than the expected 51. The Services PMI improved to 55.1 in June from 54.8 prior, beating the estimation of 53.7. The Greenback gains ground after stronger US PMI data.
Meanwhile, Federal Reserve (Fed) officials remain cautious, emphasizing that the central bank needs to see more progress on inflation before considering a rate cut. The market continues to price in nearly 65% chance of a cut in September, according to CME FedWatch Tool. The higher-for-longer US rate narrative continues to underpin the US Dollar (USD) in the near term against the New Zealand Dollar (NZD).
- EUR/USD struggles to attract any meaningful buyers and is undermined by a combination of factors.
- Political uncertainty in Europe, along with Friday’s dismal Eurozone PMIs, seems to weigh on the Euro.
- The Fed’s relatively hawkish stance lifts the USD to a multi-week top and further acts as a headwind.
The EUR/USD pair remains depressed for the third straight day on Monday and trades around the 1.0690-1.0685 region during the Asian session, just above its lowest level since early May.
The shared currency continues to be undermined by uncertainties about the outcome of a snap election in France, which has been fueling concerns that a new government will worsen the fiscal situation in the Eurozone's second-largest economy. Furthermore, the flash PMIs released on Friday indicated that the growth of business activity in the Eurozone slowed sharply in June. This, along with some follow-through US Dollar (USD) buying, turns out to be key factors exerting downward pressure on the EUR/USD pair.
The USD Index (DXY), which tracks the Greenback against a basket of currencies, advances to its highest level since May 9 in the wake of Friday's flash PMI, which showed the US business activity crept up to a 26-month high in June. The data backs the case for the Federal Reserve's (Fed) patient approach, though signs of easing inflationary pressure keep a September rate cut on the table. This might hold back the USD bulls from placing aggressive bets and help limit any further depreciating move for the EUR/USD pair.
Traders might also prefer to wait for this week's release of the US Personal Consumption Expenditures (PCE) Price Index data on Friday for cues about the Fed's rate-cut path. This, in turn, will play a key role in influencing the near-term USD price dynamics and provide some meaningful impetus to the EUR/USD pair. Traders now look to the release of German IFO Business Climate and speeches by influential FOMC members to grab short-term opportunities in the absence of any relevant macroeconomic releases from the US.
| Index | Change, points | Closed | Change, % |
|---|---|---|---|
| NIKKEI 225 | -36.55 | 38596.47 | -0.09 |
| Hang Seng | -306.8 | 18028.52 | -1.67 |
| KOSPI | -23.37 | 2784.26 | -0.83 |
| ASX 200 | 26.6 | 7796 | 0.34 |
| DAX | -90.66 | 18163.52 | -0.5 |
| CAC 40 | -42.77 | 7628.57 | -0.56 |
| Dow Jones | 15.57 | 39150.33 | 0.04 |
| S&P 500 | -8.55 | 5464.62 | -0.16 |
| NASDAQ Composite | -32.23 | 17689.36 | -0.18 |
- Gold price trades on a weaker note near $2,320 in Monday’s early Asian session.
- The stronger US PMI data and Fed’s hawkish stance create headwinds for yellow metal.
- Safe-haven flows amid the Middle East geopolitical tensions might cap the Gold price’s downside.
Gold price (XAU/USD) edges lower to $2,320 after retreating from two-week highs around $2,368 during the early Asian session on Monday. The stronger-than-expected US Purchasing Managers Index (PMI) released on Friday weighs on the yellow metal. The final reading of the US Gross Domestic Product (GDP) and Core Personal Consumption Expenditures (PCE) Price Index will be in the spotlight this week.
The US economic data continues to show mixed signals in June. The recent S&P Global showed on Friday that the advanced US Composite PMI for June came in better than expected, rising to 54.6 in June from a final reading of 54.5 in May. The figure registered the highest level since April 2022. The Manufacturing PMI climbed to 51.7 in June from 51.3 in May, beating the estimation of 51.0. Finally, the Services PMI increased to 55.1 from 54.8 in May, above the consensus of 53.7.
The Fed officials pushed out the timing of the first interest rate cut this year. Fed Bank of Richmond President Tom Barkin said on Thursday that the central bank is well-positioned with the necessary firepower for the job, but will learn a lot more over the next several months. Meanwhile, Fed Bank of Minneapolis President Neel Kashkari noted that it will probably take a year or two to get inflation back to 2%. The stronger US economic data and the hawkish tone of US Federal Reserve (Fed) policymakers continue to support the Greenback and drag the precious metal lower. It’s worth noting that a higher interest rate generally weighs on the Gold price as it increases the opportunity cost of holding non-yielding assets.
On the other hand, the safe-haven flows on the back of geopolitical and economic uncertainty might lift the yellow metal in the near term. The UN Secretary-General said on Sunday that “full-scale war between Israel and Hezbollah would be "a catastrophe," per the BBC. Several Palestinian children and women were killed and injured overnight Saturday in Israeli air strikes that targeted two homes in Gaza City, Anadolu news agency reported.
| Pare | Closed | Change, % |
|---|---|---|
| AUDUSD | 0.66412 | -0.22 |
| EURJPY | 170.89 | 0.48 |
| EURUSD | 1.0693 | -0.1 |
| GBPJPY | 202.008 | 0.43 |
| GBPUSD | 1.26401 | -0.14 |
| NZDUSD | 0.61179 | 0 |
| USDCAD | 1.3693 | 0.02 |
| USDCHF | 0.89421 | 0.3 |
| USDJPY | 159.812 | 0.57 |
Bank of Japan (BoJ) published the Summary of Opinions from its June monetary policy meeting on June 13 and 14, with the key findings noted below.
Key quotes
One member said BOJ expected to raise interest rate if underlying inflation rises as projected.
One member said given chance of upside risk to inflation, must consider further adjustment to degree of monetary easing
One member said must raise interest rate in timely fashion without delay in accordance to heightening chance of achieving price target.
One member said BOJ can wait in shifting level of interest rate until it can confirm through data clear uptrend in inflation, inflation expectations.
One member said it is appropriate to keep easy policy for the time being due to lack of strength in consumption, some disruption to auto shipments.
One member said weak yen could lead to overshoot in inflation, which means appropriate level of policy rate would be pushed up.
One member said FX volatility affects a wide range of economic activity, and levels that deviate from fundamentals would hurt the economy.
One member said monetary policy isn't swayed by short-term FX volatility.
One member said BOJ must trim bond buying by a sizable amount in a predictable fashion.
One member said must diminish BOJ's presence in the bond market by trimming its bond buying.
One member said must normalise BOJ's balance sheet at appropriate, timely fashion while staying in close dialogue with market participants.
One member said BOJ should spend time and cautiously proceed with bond tapering.
One member said no change to BOJ's baseline scenario on economy, price data also on track.
One member said consumption lacks momentum, watching to what degree wage hikes, government steps will push up consumption.
One member said risk of inflation overshoot behind worsening consumer sentiment.
One member said underlying inflation yet to reach 2%.
One member said Japan making steady progress toward achieving price target, when looking at corporate wholesale, service price data.
Market reaction
Following the BoJ’s Summary of Opinions, the USD/JPY pair is adding 0.03% on the day to trade at 159.86, as of writing.
Bank of Japan FAQs
The Bank of Japan (BoJ) is the Japanese central bank, which sets monetary policy in the country. Its mandate is to issue banknotes and carry out currency and monetary control to ensure price stability, which means an inflation target of around 2%.
The Bank of Japan has embarked in an ultra-loose monetary policy since 2013 in order to stimulate the economy and fuel inflation amid a low-inflationary environment. The bank’s policy is based on Quantitative and Qualitative Easing (QQE), or printing notes to buy assets such as government or corporate bonds to provide liquidity. In 2016, the bank doubled down on its strategy and further loosened policy by first introducing negative interest rates and then directly controlling the yield of its 10-year government bonds.
The Bank’s massive stimulus has caused the Yen to depreciate against its main currency peers. This process has exacerbated more recently due to an increasing policy divergence between the Bank of Japan and other main central banks, which have opted to increase interest rates sharply to fight decades-high levels of inflation. The BoJ’s policy of holding down rates has led to a widening differential with other currencies, dragging down the value of the Yen.
A weaker Yen and the spike in global energy prices have led to an increase in Japanese inflation, which has exceeded the BoJ’s 2% target. Still, the Bank judges that the sustainable and stable achievement of the 2% target has not yet come in sight, so any sudden change in the current policy looks unlikely.


© 2000-2024. Sva prava zaštićena.
Sajt je vlasništvo kompanije Teletrade D.J. LLC 2351 LLC 2022 (Euro House, Richmond Hill Road, Kingstown, VC0100, St. Vincent and the Grenadines).
Svi podaci koji se nalaze na sajtu ne predstavljaju osnovu za donošenje investicionih odluka, već su informativnog karaktera.
The company does not serve or provide services to customers who are residents of the US, Canada, Iran, The Democratic People's Republic of Korea, Yemen and FATF blacklisted countries.
Izvršenje trgovinskih operacija sa finansijskim instrumentima upotrebom marginalne trgovine pruža velike mogućnosti i omogućava investitorima ostvarivanje visokih prihoda. Međutim, takav vid trgovine povezan je sa potencijalno visokim nivoom rizika od gubitka sredstava. Проведение торговых операций на финанcовых рынках c маржинальными финанcовыми инcтрументами открывает широкие возможноcти, и позволяет инвеcторам, готовым пойти на риcк, получать выcокую прибыль, но при этом неcет в cебе потенциально выcокий уровень риcка получения убытков. Iz tog razloga je pre započinjanja trgovine potrebno odlučiti o izboru odgovarajuće investicione strategije, uzimajući u obzir raspoložive resurse.
Upotreba informacija: U slučaju potpunog ili delimičnog preuzimanja i daljeg korišćenja materijala koji se nalazi na sajtu, potrebno je navesti link odgovarajuće stranice na sajtu kompanije TeleTrade-a kao izvora informacija. Upotreba materijala na internetu mora biti praćena hiper linkom do web stranice teletrade.org. Automatski uvoz materijala i informacija sa stranice je zabranjen.
Ako imate bilo kakvih pitanja, obratite nam se pr@teletrade.global.
транcфери