- Analiza
- Novosti i instrumenti
- Vesti sa tržišta
Forex-novosti i prognoze od 24-01-2018
(raw materials / closing price /% change)
Oil 65.88 +2.19%
Gold 1,357.80 +1.58%
(index / closing price / change items /% change)
Nikkei -183.37 23940.78 -0.76%
TOPIX -9.84 1901.23 -0.51%
Hang Seng +27.99 32958.69 +0.08%
CSI 300 +7.28 4389.89 +0.17%
Euro Stoxx 50 -29.07 3643.22 -0.79%
FTSE 100 -88.40 7643.43 -1.14%
DAX -144.86 13414.74 -1.07%
CAC 40 -40.10 5495.16 -0.72%
DJIA +41.31 26252.12 +0.16%
S&P 500 -1.59 2837.54 -0.06%
NASDAQ -45.23 7415.06 -0.61%
S&P/TSX -73.34 16284.21 -0.45%
(pare/closed(GMT +2)/change, %)
EUR/USD $1,2406 +0,88%
GBP/USD $1,4234 +1,66%
USD/CHF Chf0,94541 -1,29%
USD/JPY Y109,21 -0,99%
EUR/JPY Y135,49 -0,10%
GBP/JPY Y155,458 +0,69%
AUD/USD $0,8065 +0,82%
NZD/USD $0,7338 -0,19%
USD/CAD C$1,23431 -0,61%
00:00 Australia Bank holiday
07:00 Germany Gfk Consumer Confidence Survey February 10.8 10.8
09:00 Germany IFO - Current Assessment January 125.4 125.4
09:00 Germany IFO - Expectations January 109.5 109.4
09:00 Germany IFO - Business Climate January 117.2 117.1
09:30 United Kingdom BBA Mortgage Approvals December 39.507
11:00 United Kingdom CBI retail sales volume balance January 20 12
12:45 Eurozone Deposit Facilty Rate -0.4% -0.4%
12:45 Eurozone ECB Interest Rate Decision 0.0% 0%
13:30 Eurozone ECB Press Conference
13:30 Canada Retail Sales YoY November 6.7%
13:30 Canada Retail Sales, m/m November 1.5% 0.7%
13:30 Canada Retail Sales ex Autos, m/m November 0.8% 0.8%
13:30 U.S. Goods Trade Balance, $ bln. December -69.68 -68.6
13:30 U.S. Continuing Jobless Claims January 1952 1925
13:30 U.S. Initial Jobless Claims January 220 240
14:00 Belgium Business Climate January 0.1 0.4
15:00 U.S. Leading Indicators December 0.4% 0.5%
15:00 U.S. New Home Sales December 0.733 0.679
23:30 Japan Tokyo CPI ex Fresh Food, y/y January 0.8% 0.8%
23:30 Japan Tokyo Consumer Price Index, y/y January 1% 1.1%
23:30 Japan National CPI Ex-Fresh Food, y/y December 0.9% 0.9%
23:30 Japan National Consumer Price Index, y/y December 0.6% 1.1%
23:50 Japan Monetary Policy Meeting Minutes
Major US stock indexes ended the session in different directions after US Secretary of Commerce Wilber Ross called China's technological strategy in 2025 a "direct threat" and hinted at actions against Beijing.
A certain pressure on the indices was also provided by the US data. Data for January indicated another solid expansion of business activity in the private sector in the US, supported by the fastest growth in new orders within 5 months. At the same time, production continued to grow much faster than the activity of the service sector. The combined PMI index from IHS Markit for the US was 53.8 in January, compared with 54.1 in December, and showed the least noticeable pace of business expansion since May 2017. Nevertheless, the index for today remains above the threshold level of 50.0 for 23 consecutive months.
Meanwhile, home sales in the US fell more than expected in December, as housing supply in the market fell to a record low, pushing up prices and probably alienating some buyers. The National Association of Realtors (NAR) said that home sales in the secondary market declined in December by 3.6%, to 5.57 million units (seasonally adjusted and in annual terms). Meanwhile, the November sales were revised from 5.81 million to 5.78 million units, which is still the highest since February 2007. Economists predicted that housing sales in December will decrease only to 5.70 million units.
Most components of the DOW index recorded a rise (19 out of 30). The leader of growth was the shares of The Goldman Sachs Group, Inc. (GS, + 2.05%). Outsider were shares of General Electric Company (GE, -2.22%).
Most sectors of S & P showed an increase. The commodities sector grew most (+ 1.0%). The largest decrease was shown by the sector of conglomerates (-0.6%).
At closing:
DJIA + 0.16% 26.252.19 +41.38
Nasdaq -0.61% 7,415.06 -45.23
S & P -0.05% 2.837.59 -1.54
U.S. commercial crude oil inventories (excluding those in the Strategic Petroleum Reserve) decreased by 1.1 million barrels from the previous week. At 411.6 million barrels, U.S. crude oil inventories are in the middle of the average range for this time of year.
Total motor gasoline inventories increased by 3.1 million barrels last week, and are in the middle of the average range. Finished gasoline inventories decreased while blending components inventories increased last week.
Distillate fuel inventories increased by 0.6 million barrels last week but are in the lower half of the average range for this time of year. Propane/propylene inventories decreased by 4.0 million barrels last week, and are in the lower half of the average range. Total commercial petroleum inventories decreased by 2.9 million barrels last week.
-
Says Europe also needs to find ways to shield itself from future crises
-
Europe needs a capital markets union, completion of banking union
-
Digital single market is major priority for Europe
-
Brexit decision has given Europe the courage to move forward
-
Europe must forge common foreign policy, send single message to China, U.S., India and other countries
-
Wants good partnership with UK in future
-
Says pursuit of nationalist solutions risks creating spiral that makes it difficult for countries to talk to each other
January data indicated another solid expansion of U.S. private sector business activity, underpinned by the fastest rise in new work for five months. Manufacturing production continued to increase at a much faster pace than service sector activity.
At 53.8 in January, down from 54.1 in December, the seasonally adjusted IHS Markit Flash U.S. Composite PMI Output Index signalled the least marked rate of business activity expansion since May 2017. Nonetheless, the headline index has now posted above the 50.0 no-change threshold for 23 consecutive months.
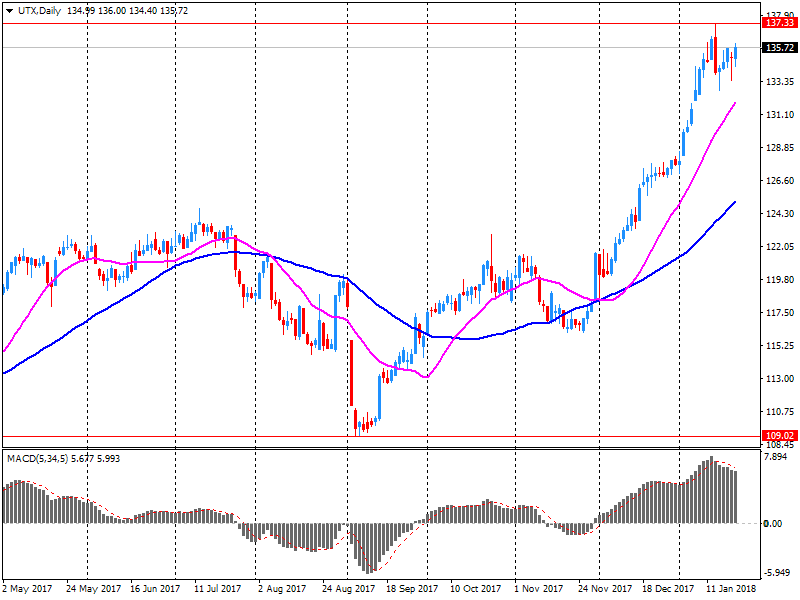
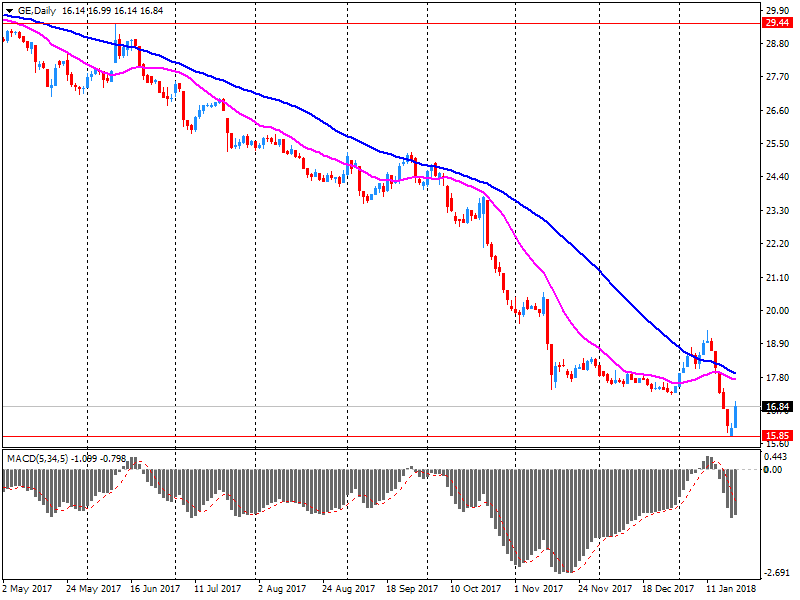
U.S. stock-index futures rose on Wednesday following as a string of earnings from industrial giants buoyed market sentiment. Particular attention was paid to the financials of General Electric (GE) and United Technologies (UTX).
Global Stocks:
Nikkei 23,940.78 -183.37 -0.76%
Hang Seng 32,958.69 +27.99 +0.08%
Shanghai 3,560.73 +14.23 +0.40%
S&P/ASX 6,054.70 +17.70 +0.29%
FTSE 7,694.04 -37.79 -0.49%
CAC 5,529.79 -5.47 -0.10%
DAX 13,556.78 -2.82 -0.02%
Crude $64.70 (+0.36%)
Gold $1,351.60 (+1.11%)
U.S. house prices rose in November, up 0.4 percent from the previous month, according to the Federal Housing Finance Agency (FHFA) seasonally adjusted monthly House Price Index (HPI). The previously reported 0.5 percent increase in October was revised upward to 0.6 percent. The FHFA monthly HPI is calculated using home sales price information from mortgages sold to, or guaranteed by, Fannie Mae and Freddie Mac.
From November 2016 to November 2017, house prices were up 6.5 percent. For the nine census divisions, seasonally adjusted monthly price changes from October 2017 to November 2017 ranged from -1.1 percent in the East South Central division to +0.9 percent in the West North Central division. The 12-month changes were all positive, ranging from +4.2 percent in the Middle Atlantic division to +8.9 percent in the Mountain division.
(company / ticker / price / change ($/%) / volume)
| Amazon.com Inc., NASDAQ | AMZN | 1,379.05 | 16.51(1.21%) | 98938 |
| American Express Co | AXP | 98 | 0.02(0.02%) | 833 |
| Apple Inc. | AAPL | 177.83 | 0.79(0.45%) | 196533 |
| AT&T Inc | T | 37.29 | 0.10(0.27%) | 8852 |
| Barrick Gold Corporation, NYSE | ABX | 15.11 | 0.28(1.89%) | 75191 |
| Boeing Co | BA | 337.16 | 1.57(0.47%) | 8251 |
| Caterpillar Inc | CAT | 170.3 | 0.87(0.51%) | 14565 |
| Chevron Corp | CVX | 131 | -0.02(-0.02%) | 1646 |
| Cisco Systems Inc | CSCO | 42.28 | 0.18(0.43%) | 2839 |
| Citigroup Inc., NYSE | C | 79 | 0.45(0.57%) | 16076 |
| Deere & Company, NYSE | DE | 169.49 | 0.83(0.49%) | 1002 |
| Exxon Mobil Corp | XOM | 88.4 | 0.10(0.11%) | 1996 |
| Facebook, Inc. | FB | 190.21 | 0.86(0.45%) | 131884 |
| Ford Motor Co. | F | 12.02 | 0.06(0.50%) | 40467 |
| Freeport-McMoRan Copper & Gold Inc., NYSE | FCX | 19.85 | 0.30(1.53%) | 20486 |
| General Electric Co | GE | 17.78 | 0.89(5.27%) | 5886527 |
| Goldman Sachs | GS | 260.22 | 0.13(0.05%) | 4024 |
| Google Inc. | GOOG | 1,179.34 | 9.37(0.80%) | 6109 |
| Hewlett-Packard Co. | HPQ | 23.93 | 0.12(0.50%) | 2137 |
| Home Depot Inc | HD | 205.5 | 0.60(0.29%) | 1785 |
| Intel Corp | INTC | 45.85 | -0.21(-0.46%) | 20097 |
| International Business Machines Co... | IBM | 166.7 | 0.45(0.27%) | 8858 |
| Johnson & Johnson | JNJ | 142.7 | 0.87(0.61%) | 37732 |
| JPMorgan Chase and Co | JPM | 114.79 | 0.58(0.51%) | 18758 |
| Microsoft Corp | MSFT | 92.39 | 0.49(0.53%) | 43058 |
| Nike | NKE | 67.01 | -0.13(-0.19%) | 1886 |
| Pfizer Inc | PFE | 36.95 | 0.13(0.35%) | 3588 |
| Procter & Gamble Co | PG | 89.3 | 0.25(0.28%) | 4460 |
| Starbucks Corporation, NASDAQ | SBUX | 61.65 | -0.04(-0.06%) | 6439 |
| Tesla Motors, Inc., NASDAQ | TSLA | 355.55 | 2.76(0.78%) | 24472 |
| Twitter, Inc., NYSE | TWTR | 22.86 | 0.11(0.48%) | 73728 |
| United Technologies Corp | UTX | 135.3 | -0.73(-0.54%) | 57819 |
| UnitedHealth Group Inc | UNH | 246.02 | 0.81(0.33%) | 195 |
| Verizon Communications Inc | VZ | 53.25 | 0.02(0.04%) | 3230 |
| Visa | V | 125.15 | 0.50(0.40%) | 8794 |
| Wal-Mart Stores Inc | WMT | 106.27 | 0.37(0.35%) | 14491 |
| Walt Disney Co | DIS | 110.83 | 0.42(0.38%) | 504 |
| Yandex N.V., NASDAQ | YNDX | 38.01 | -0.02(-0.05%) | 310 |
Microsoft (MSFT) initiated with a Buy at Nomura; target $102
Caterpillar (CAT) target raised to $180 from $162 at Barclays
Home Depot (HD) target raised to $222 from $183 at Credit Suisse
Chevron (CVX) target raised to $145 from $130 at Morgan Stanley
Johnson & Johnson (JNJ) target raised to $145 at Stifel
Amazon (AMZN) target raised to $1475 from $1350 at JMP Securities
United Tech (UTX) reported Q4 FY 2017 earnings of $1.60 per share (versus $1.56 in Q4 FY 2016), beating analysts' consensus estimate of $1.56.
The company's quarterly revenues amounted to $15.680 bln (+7.0% y/y), beating analysts' consensus estimate of $15.344 bln.
The company also issued in-line guidance for FY 2018, projecting EPS of $6.85-7.10 (versus analysts' consensus estimate of $6.97) and revenues of $62.5-64.0 bln (versus analysts' consensus estimate of $62.97 bln).
UTX fell to $136.00 (-0.02%) in pre-market trading.
General Electric (GE) reported Q4 FY 2017 earnings of $0.27 per share (versus $0.46 in Q4 FY 2016), missing analysts' consensus estimate of $0.28.
The company's quarterly revenues amounted to $31.402 bln (-5.1% y/y), missing analysts' consensus estimate of $33.927 bln.
The company reaffirmed guidance for FY 2018, projecting EPS of $1.00-1.07 versus analysts' consensus estimate of $1.01.
GE rose to $17.06 (+1.01%) in pre-market trading.
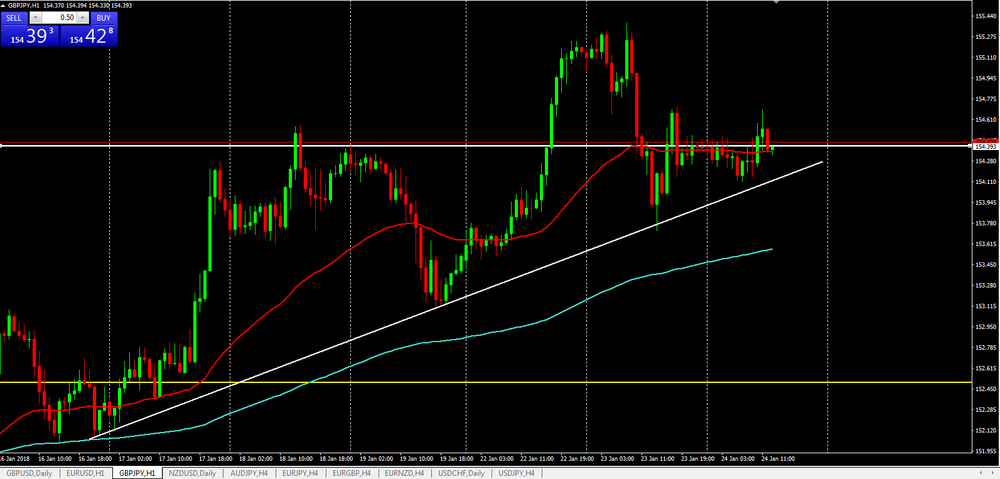
GBP/JPY has been respecting quite well the upside trend line and the price has been forming higher highs.
At this moment, we can see that the price is close to the trend line which can become interesting to understand whether the price will start a new bullish or bearish movement on GB/JPY.
Therefor, if the price keeps rejecting the trend line above then we can expect a further bullish movement.
On the other hand, if the price breaks the upside trend line then we can expect a further bearish movement on this pair.
-
There is no question vote from the market is very positive on tax reform
-
We are focused on autos as part of NAFTA negotiations
-
Says U.S delegation to Davos summit is largest ever
-
'We are committed to economic growth of 3 percent or higher'
-
Expects all the substance of a future relationship to be agreed with the EU before the start of any transition
-
Says government may well publish a position paper on financial services
-
We did not have a specific plan to publish a position paper on financial services
Estimates from the Labour Force Survey show that, between June to August 2017 and September to November 2017, the number of people in work increased, the number of unemployed people was little changed, and the number of people aged from 16 to 64 not working and not seeking or available to work (economically inactive) decreased.
The unemployment rate (the proportion of those in work plus those unemployed, that were unemployed) was 4.3%, down from 4.8% for a year earlier and the joint lowest since 1975.
Latest estimates show that average weekly earnings for employees in Great Britain in nominal terms (that is, not adjusted for price inflation) increased by 2.5% including bonuses and by 2.4% excluding bonuses, compared with a year earlier.
The eurozone started 2018 with a further acceleration of growth to a near 12-year high, accompanied by the largest payroll gain since 2000 and the highest price pressures for nearly seven years. The headline IHS Markit Eurozone PMI rose to 58.6 in January, according to the 'flash' estimate (based on approximately 85% of final replies), up from 58.1 December and its highest since June 2006.
An acceleration of service sector growth to the fastest since August 2007 was partly countered by a slowdown in manufacturing output growth, though the latter remained very buoyant. The latest three months have seen the strongest factory output increase since 2000.
Germany's economy maintained strong growth momentum at the start of 2018 thanks to the fastest rise in service sector business activity for nearly seven years, according to January's flash PMI survey from IHS Markit. Growth in the manufacturing sector was meanwhile below the record level seen at the end of 2017 but still among the highest seen over the past two decades.
The IHS Markit Flash Germany Composite Output Index registered a reading of 58.8 in January, little-changed from December's 80-month high of 58.9, with the quickest growth of services businesses activity since March 2011 offsetting a slower, but still-strong, increase in goods production.
At 59.7, the IHS Markit Flash France Composite Output Index signalled a rate of expansion that was broadly unchanged from the prior survey period and only just shy of November's six-and-a-half year peak (60.3).
Encouragingly, the expansion was broad-based across both the manufacturing and services sectors. A fractional pick-up in the rate of increase at service providers was partially offset by a slight moderation at their manufacturing counterparts. The rates of growth remained historically marked in each case nonetheless.
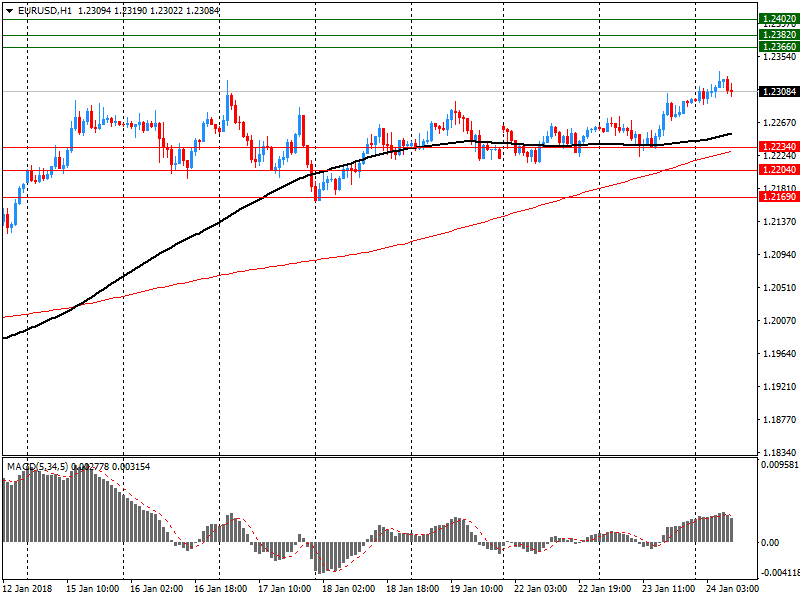
EUR/USD
Resistance levels (open interest**, contracts)
$1.2402 (3784)
$1.2382 (3163)
$1.2366 (4126)
Price at time of writing this review: $1.2308
Support levels (open interest**, contracts):
$1.2234 (1511)
$1.2204 (2075)
$1.2169 (1850)
Comments:
- Overall open interest on the CALL options and PUT options with the expiration date February, 9 is 116773 contracts (according to data from January, 23) with the maximum number of contracts with strike price $1,1850 (7085);
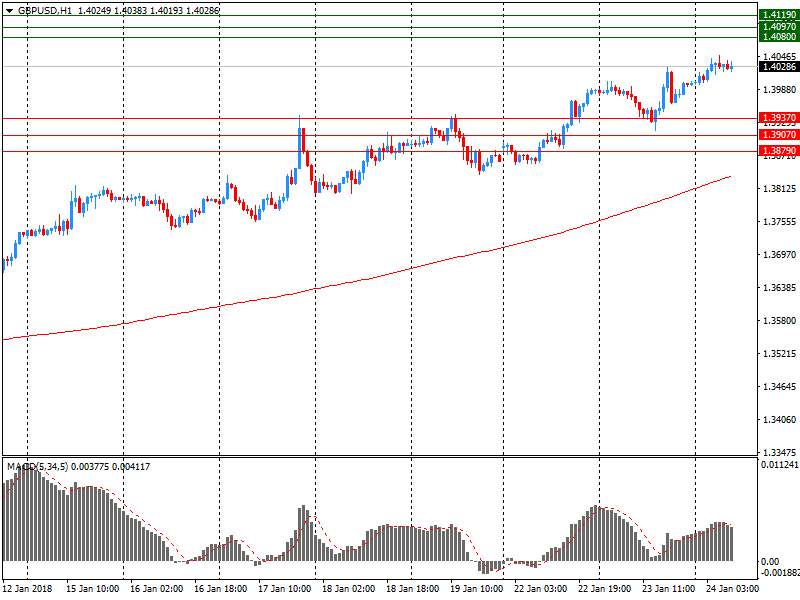
GBP/USD
Resistance levels (open interest**, contracts)
$1.4119 (1741)
$1.4097 (2071)
$1.4080 (2267)
Price at time of writing this review: $1.4029
Support levels (open interest**, contracts):
$1.3937 (50)
$1.3907 (321)
$1.3879 (458)
Comments:
- Overall open interest on the CALL options with the expiration date February, 9 is 38408 contracts, with the maximum number of contracts with strike price $1,3600 (3482);
- Overall open interest on the PUT options with the expiration date February, 9 is 33978 contracts, with the maximum number of contracts with strike price $1,3400 (3057);
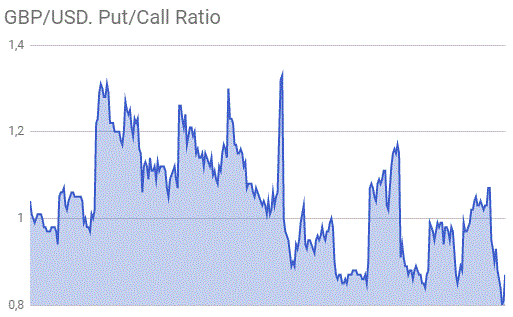
- The ratio of PUT/CALL was 0.88 versus 0.87 from the previous trading day according to data from January, 23
* - The Chicago Mercantile Exchange bulletin (CME) is used for the calculation.
** - Open interest takes into account the total number of option contracts that are open at the moment.
-
Flash Japan Manufacturing PMI rises to 54.4 in January (54.0 in December).
-
Output expands at quickest rate in 47 months.
-
New orders continue to rise sharply. Inflationary pressures intensify.
Commenting on the Japanese Manufacturing PMI survey data, Joe Hayes, Economist at IHS Markit, which compiles the survey, said: "The sector has observed accelerated rates of improvement in each of the past three months. "The strongest reading in the PMI since February 2014 was supported by quickened rates of output and employment growth, in addition to a relatively sharp expansion in new orders. "Strikingly, output price inflation accelerated to the fastest rate since October 2008 amid sharper rises to input costs. With a low rate of unemployment and sustained growth in official GDP data, inflationary pressures should continue to mount."
Europeans stocks pushed higher Monday, with Spanish and Greek shares gaining in the wake of sovereign ratings upgrades and closing at a 5-month and almost three-year highs, respectively. The Stoxx Europe 600 index SXXP, +0.17% ended up 0.3% at 402.11, closing at its highest since August 2015. Last week, the pan-European gauge rose for a third consecutive week.
U.S. stocks mostly rose on Tuesday, with the S&P 500 and the Nasdaq ending at an all-time highs, a day after a partial shutdown of the government came to an end. The S&P 500 index SPX, +0.22% closed up 0.2% at 2,839, the Nasdaq Composite Index COMP, +0.71% closed up 0.7% at 7,460.
Asia's blazing stock rally took a pause on Wednesday as investors took stock of the best start to a year for the region since 2006. A strengthening yen hit Japanese shares, and a record winning streak for Chinese stocks in Hong Kong was at risk of finally ending.
© 2000-2026. Sva prava zaštićena.
Sajt je vlasništvo kompanije Teletrade D.J. LLC 2351 LLC 2022 (Euro House, Richmond Hill Road, Kingstown, VC0100, St. Vincent and the Grenadines).
Svi podaci koji se nalaze na sajtu ne predstavljaju osnovu za donošenje investicionih odluka, već su informativnog karaktera.
The company does not serve or provide services to customers who are residents of the US, Canada, Iran, The Democratic People's Republic of Korea, Yemen and FATF blacklisted countries.
Izvršenje trgovinskih operacija sa finansijskim instrumentima upotrebom marginalne trgovine pruža velike mogućnosti i omogućava investitorima ostvarivanje visokih prihoda. Međutim, takav vid trgovine povezan je sa potencijalno visokim nivoom rizika od gubitka sredstava. Проведение торговых операций на финанcовых рынках c маржинальными финанcовыми инcтрументами открывает широкие возможноcти, и позволяет инвеcторам, готовым пойти на риcк, получать выcокую прибыль, но при этом неcет в cебе потенциально выcокий уровень риcка получения убытков. Iz tog razloga je pre započinjanja trgovine potrebno odlučiti o izboru odgovarajuće investicione strategije, uzimajući u obzir raspoložive resurse.
Upotreba informacija: U slučaju potpunog ili delimičnog preuzimanja i daljeg korišćenja materijala koji se nalazi na sajtu, potrebno je navesti link odgovarajuće stranice na sajtu kompanije TeleTrade-a kao izvora informacija. Upotreba materijala na internetu mora biti praćena hiper linkom do web stranice teletrade.org. Automatski uvoz materijala i informacija sa stranice je zabranjen.
Ako imate bilo kakvih pitanja, obratite nam se pr@teletrade.global.

