- Analiza
- Novosti i instrumenti
- Vesti sa tržišta
Forex-novosti i prognoze od 23-05-2024
New Zealand’s Trade Balance came in at NZD $-10.11B YoY in April versus $-9.98B prior, according to the latest data released by Statistics New Zealand on Friday.
Further details suggest that Exports increased to $6.42B during the said month versus $6.38B prior whereas Imports rose to $6.32B compared to $5.90B in previous readings.
Market reaction
At the press time, the NZD/USD pair is up 0.01% on the day to trade at 0.6099.
New Zealand Dollar FAQs
The New Zealand Dollar (NZD), also known as the Kiwi, is a well-known traded currency among investors. Its value is broadly determined by the health of the New Zealand economy and the country’s central bank policy. Still, there are some unique particularities that also can make NZD move. The performance of the Chinese economy tends to move the Kiwi because China is New Zealand’s biggest trading partner. Bad news for the Chinese economy likely means less New Zealand exports to the country, hitting the economy and thus its currency. Another factor moving NZD is dairy prices as the dairy industry is New Zealand’s main export. High dairy prices boost export income, contributing positively to the economy and thus to the NZD.
The Reserve Bank of New Zealand (RBNZ) aims to achieve and maintain an inflation rate between 1% and 3% over the medium term, with a focus to keep it near the 2% mid-point. To this end, the bank sets an appropriate level of interest rates. When inflation is too high, the RBNZ will increase interest rates to cool the economy, but the move will also make bond yields higher, increasing investors’ appeal to invest in the country and thus boosting NZD. On the contrary, lower interest rates tend to weaken NZD. The so-called rate differential, or how rates in New Zealand are or are expected to be compared to the ones set by the US Federal Reserve, can also play a key role in moving the NZD/USD pair.
Macroeconomic data releases in New Zealand are key to assess the state of the economy and can impact the New Zealand Dollar’s (NZD) valuation. A strong economy, based on high economic growth, low unemployment and high confidence is good for NZD. High economic growth attracts foreign investment and may encourage the Reserve Bank of New Zealand to increase interest rates, if this economic strength comes together with elevated inflation. Conversely, if economic data is weak, NZD is likely to depreciate.
The New Zealand Dollar (NZD) tends to strengthen during risk-on periods, or when investors perceive that broader market risks are low and are optimistic about growth. This tends to lead to a more favorable outlook for commodities and so-called ‘commodity currencies’ such as the Kiwi. Conversely, NZD tends to weaken at times of market turbulence or economic uncertainty as investors tend to sell higher-risk assets and flee to the more-stable safe havens.
- EUR/USD eases lower as risk-off flows bolster the Greenback.
- A spike in US Services PMIs reignite fears of sticky inflation.
- Fed rate cut hopes hinging in easing services inflation stumble.
EUR/USD headed lower on Thursday, driven closer to the 1.0800 handle after an unexpected upswing in US Services Purchasing Managers Index (PMI) figures sparked renewed fears of fewer Federal Reserve (Fed) rate cuts. This sent investors into the safe-haven US Dollar and deflated the Euro despite better-than-expected HCOB PMI figures earlier in the day.
European and US PMI figures on Thursday both beat market expectations, with figures broadly printing above expectations and improving on previous figures, but a higher-than-forecast upswing in US Services PMIs from 51.3 to 54.8 pummeled broad-market expectations for a Fed rate cut in September.
Forex Today: Data continues to rule the sentiment
According to the CME’s FedWatch Tool, rate traders are pricing in barely even odds of at least a quarter-point cut at the September Federal Open Market Committee (FOMC) meeting. Significantly lower than the 70% odds that were priced in at the beginning of the trading week, investors are grappling with the possibility of no Fed cuts in 2024.
Traders’ broad hopes for Fed rate trims have been slowly ground to a paste through 2024. In December, markets were broadly pricing in at least six rate cuts from the Fed through the end of the year. Fast forward to late May, and investors are scrambling to hold onto hopes of a single cut, potentially as late as December.
Friday brings a Gross Domestic Product (GDP) update for Germany, which is expected to hold steady at 0.2% for the first quarter. US Durable Goods Orders in April are slated to print during Friday’s US market session, and are forecast to backslide -0.8% MoM compared to the previous month’s 2.6%.
Euro PRICE This week
The table below shows the percentage change of Euro (EUR) against listed major currencies this week. Euro was the weakest against the US Dollar.
| USD | EUR | GBP | JPY | CAD | AUD | NZD | CHF | |
|---|---|---|---|---|---|---|---|---|
| USD | 0.51% | 0.05% | 0.88% | 0.83% | 1.34% | 0.56% | 0.58% | |
| EUR | -0.51% | -0.50% | 0.41% | 0.32% | 0.86% | 0.08% | 0.07% | |
| GBP | -0.05% | 0.50% | 0.76% | 0.82% | 1.34% | 0.56% | 0.55% | |
| JPY | -0.88% | -0.41% | -0.76% | -0.06% | 0.47% | -0.27% | -0.29% | |
| CAD | -0.83% | -0.32% | -0.82% | 0.06% | 0.47% | -0.24% | -0.25% | |
| AUD | -1.34% | -0.86% | -1.34% | -0.47% | -0.47% | -0.79% | -0.78% | |
| NZD | -0.56% | -0.08% | -0.56% | 0.27% | 0.24% | 0.79% | -0.01% | |
| CHF | -0.58% | -0.07% | -0.55% | 0.29% | 0.25% | 0.78% | 0.01% |
The heat map shows percentage changes of major currencies against each other. The base currency is picked from the left column, while the quote currency is picked from the top row. For example, if you pick the Euro from the left column and move along the horizontal line to the US Dollar, the percentage change displayed in the box will represent EUR (base)/USD (quote).
EUR/USD technical outlook
EUR/USD is waffling into reach of the 1.0800 handle, trading on the south side of the 200-hour Exponential Moving Average (EMA) at 1.0833. The Euro took an early run at a high bid on Thursday of 1.0860, but short pressure quickly dragged the Fiber down into fresh lows for the trading week.
On daily candlesticks, EUR/USD is getting dragged back into consolidation at the 200-day EMA at 1.0801, and the pair has declined for all but one of the last five trading days.
EUR/USD hourly chart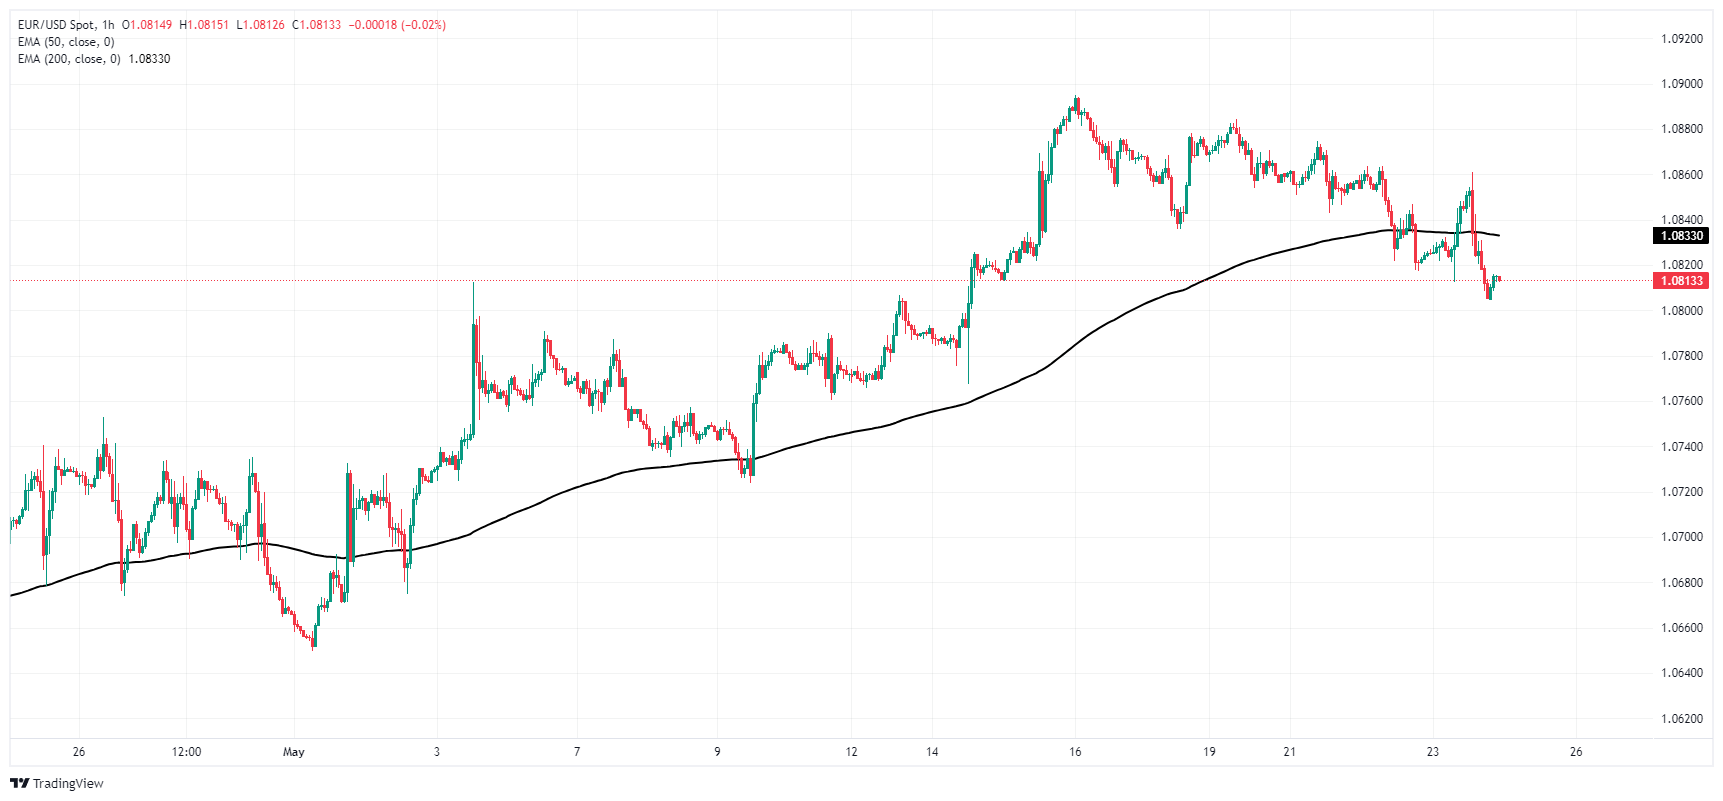
EUR/USD daily chart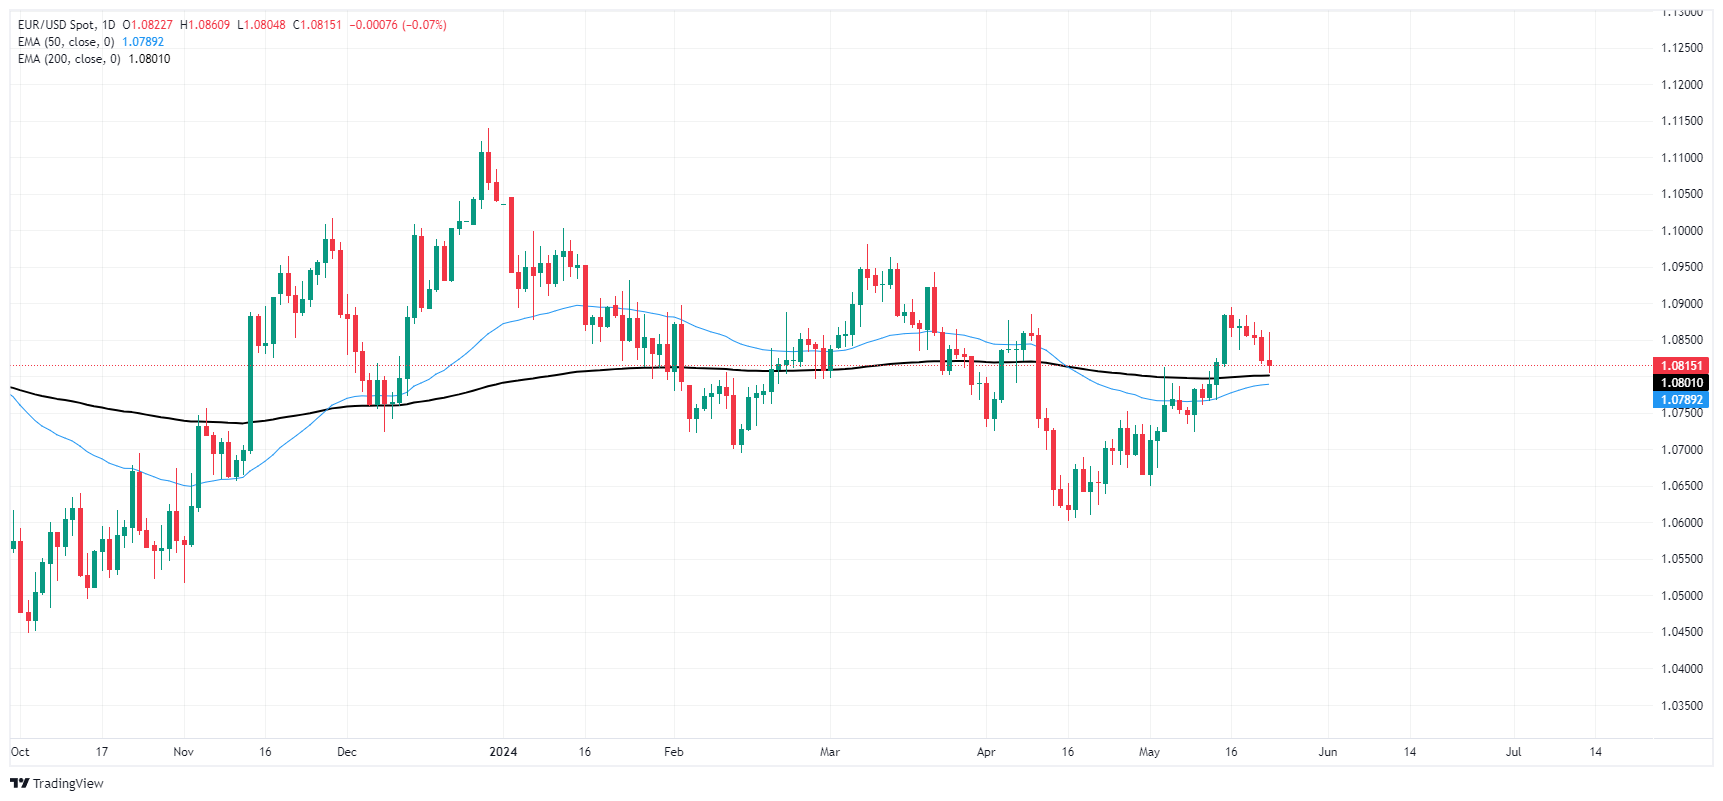
- GBP/USD weakens to 1.2695 on the firmer USD on Friday.
- The US PMI accelerated to the highest level in just over two years in May.
- The UK inflation data dashed hopes of BoE rate cuts in June.
The GBP/USD pair loses its recovery momentum near 1.2695 during the early Asian session on Friday. The major pair edges lower after retracing from the recent top around 1.2760 amid renewed US Dollar (USD) demand. Later on Friday, the UK Retail Sales, US Durable Goods Orders, and Michigan Consumer Sentiment Index will be due.
On Thursday, the flash US S&P Global Composite PMI climbed to 54.4 in May from 51.3 in April, above the market consensus of 51.1. This figure registered the highest level since April 2022. Meanwhile, the Manufacturing PMI rose to 50.9 in April from the previous reading of 50.0. The Services PMI improved to 54.8 in the same period from 51.3 prior. Both figures came in better than market expectations.
A surge in prices of inputs in the manufacturing sector suggested that inflation could pick up in the months ahead, which might prompt the US Federal Reserve (Fed) to delay the interest rate cut this year. This, in turn, provides some support to the Greenback and creates a headwind for the GBP/USD pair.
On the other hand, the UK CPI inflation report earlier this week prompted investors to lower their bets on the Bank of England (BoE) rate cut next month. Investors see nearly 50% odds of a first-rate cut in August, and a quarter-point move is not fully priced in until November.
- AUD/USD falls 0.20% to 0.6605, continuing its third day of losses.
- US economic resurgence evident with S&P Global Composite PMI at a 12-month high of 54.4.
- Strong US Services PMI at 54.8 and Manufacturing PMI at 50.9 dampen hopes for a Fed rate cut.
The Australian Dollar lost 0.20% against the US Dollar for the third straight day on Thursday as investors digested the latest S&P Global PMI report in the US, hinting the economy is reaccelerating. Consequently, Federal Reserve rate cut hopes were hurt, with traders expecting 27 basis points of easing toward the end of the year. The AUD/USD trades at 0.6605, virtually unchanged.
Aussie Dollar slumped as the Greenback got underpinned by strong PMIs
Wall Street ended the session with losses. US Treasury bond yields jumped following the release of the S&P Global Composite PMI, rising to 54.4, its highest level in twelve months. The Services PMI rose to 54.8, its highest level since October 2022, while the Manufacturing PMI expanded by 50.9, exceeding estimates and forecasts of 50.0.
The data propelled the AUD/USD from around 0.6650 toward 0.6618 on the data release. Earlier, the US Department of Labor (DOL) revealed that Initial Jobless Claims rose less than expected, to 215K, below 220K, and much less than the 223K of the previous reading.
Thursday data, along with the latest FOMC minutes, revealed that Fed officials are ready to tighten policy “should risks to outlook materialize and make such action appropriate.” They added that the disinflation process “would take longer than previously anticipated,” warranting higher rates for longer.
On the Aussie’s front, Thursday’s economic docket featured the release of the Judo Bank Manufacturing and Services PMIs final readings for May. The Services PMI came at 49.6, unchanged while the Manufacturing PMI stood at 53.1, lower than the 53.6 on its preliminary release.
AUD/USD Price Analysis: Technical outlook
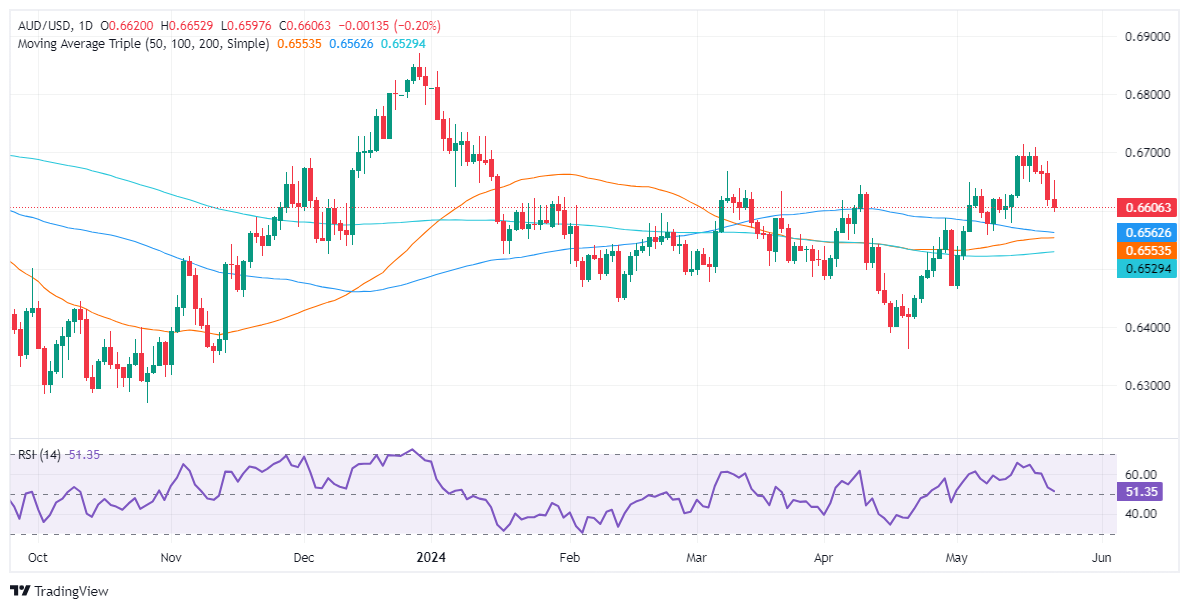
After trading within a narrow range of 0.6640-0.6700, the AUD/USD broke below the bottom of the range and extended its losses towards the 0.6610 region. Buyers appear to be losing momentum, as indicated by the Relative Strength Index (RSI) flattening out despite being in bullish territory, suggesting potential for lower price levels.
The first support for AUD/USD is at 0.6600. If this level is breached, it will expose the 100-day moving average (DMA) at 0.6562, followed by the 50 and 200-DMAs at 0.6553 and 0.6526, respectively. Conversely, if buyers regain control and push prices above 0.6640, it could pave the way towards 0.6700.
Australian Dollar PRICE This week
The table below shows the percentage change of Australian Dollar (AUD) against listed major currencies this week. Australian Dollar was the strongest against the Japanese Yen.
| USD | EUR | GBP | JPY | CAD | AUD | NZD | CHF | |
|---|---|---|---|---|---|---|---|---|
| USD | 0.51% | 0.04% | 0.88% | 0.82% | 1.33% | 0.59% | 0.58% | |
| EUR | -0.51% | -0.50% | 0.42% | 0.31% | 0.86% | 0.07% | 0.07% | |
| GBP | -0.04% | 0.50% | 0.78% | 0.82% | 1.35% | 0.56% | 0.56% | |
| JPY | -0.88% | -0.42% | -0.78% | -0.08% | 0.45% | -0.29% | -0.30% | |
| CAD | -0.82% | -0.31% | -0.82% | 0.08% | 0.47% | -0.24% | -0.24% | |
| AUD | -1.33% | -0.86% | -1.35% | -0.45% | -0.47% | -0.79% | -0.78% | |
| NZD | -0.59% | -0.07% | -0.56% | 0.29% | 0.24% | 0.79% | -0.01% | |
| CHF | -0.58% | -0.07% | -0.56% | 0.30% | 0.24% | 0.78% | 0.00% |
The heat map shows percentage changes of major currencies against each other. The base currency is picked from the left column, while the quote currency is picked from the top row. For example, if you pick the Australian Dollar from the left column and move along the horizontal line to the US Dollar, the percentage change displayed in the box will represent AUD (base)/USD (quote).
- NZD/USD eased to the bottom of a sideways pattern on Thursday.
- Resurging fears of fewer Fed cuts bolstered Greenback.
- NZ Consumer Confidence, Inflation Expectations recover ground but remain low.
NZD/USD descended to the bottom of recent consolidation as broad-market risk appetite turned sour on Thursday after rising US Purchasing Manager Index (PMI) figures re-ignited concerns that sticky inflation from the services sector could keep price growth elevated for much longer than rate-cut-hungry investors had initially hoped. Rate cut expectations knocked lower through the day, dragging risk assets lower and bumping the US Dollar into higher bids on the day.
Forex Today: Data continues to rule the sentiment
The Kiwi is heading into the early Friday market session on the low end, but could find thin support from a slight improvement in New Zealand Consumer Confidence figures. ANZ Roy Morgan Consumer Confidence in May rose to 84.9 from April’s 81.9. Despite the rebound, New Zealand consumer confidence remains on the low side in the aggregate, sticking close to values seen during the pandemic response.
Read more: ANZ Roy Morgan Consumer Confidence rebounds to 84.9 in May
Consumer Inflation Expectations in May also eased further, declining to 3.8% compared to April’s 4.4%. On the other hand, Consumer House Price Inflation rose further to 3.5% from 3.2%.
NZD/USD technical outlook
The Kiwi has been churning sideways recently, with a technical ceiling hardening from 0.6140. Bids are catching technical support from the 200-hour Exponential Moving Average (EMA) near 0.6089.
Daily candlesticks are catching a squeeze pattern into the midrange with the pair trading just north of the 200-day EMA at 0.6070.
NZD/USD hourly chart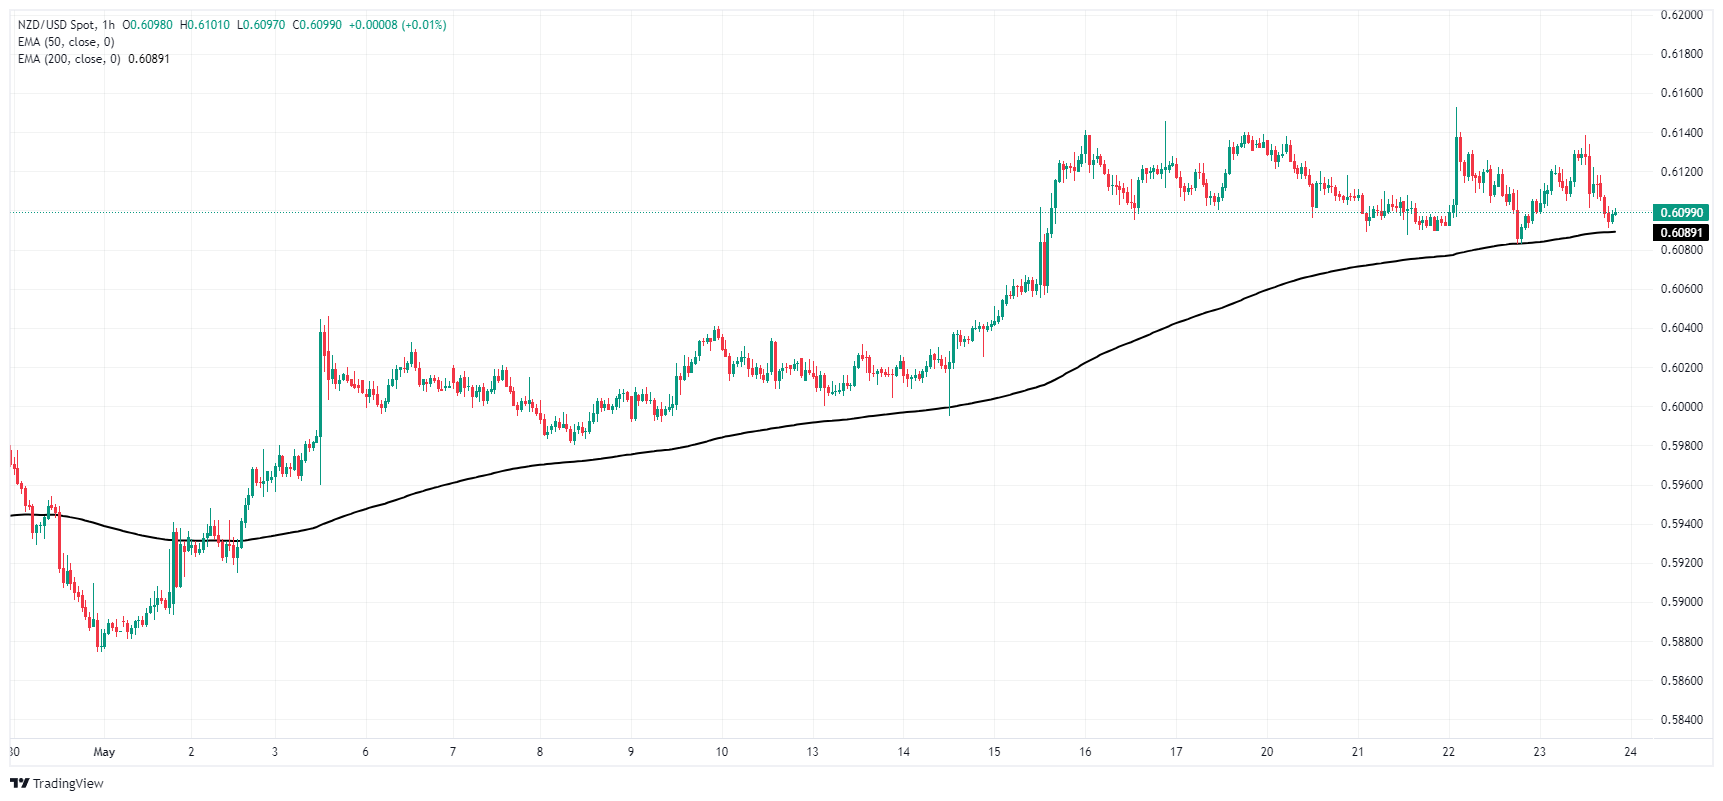
NZD/USD daily chart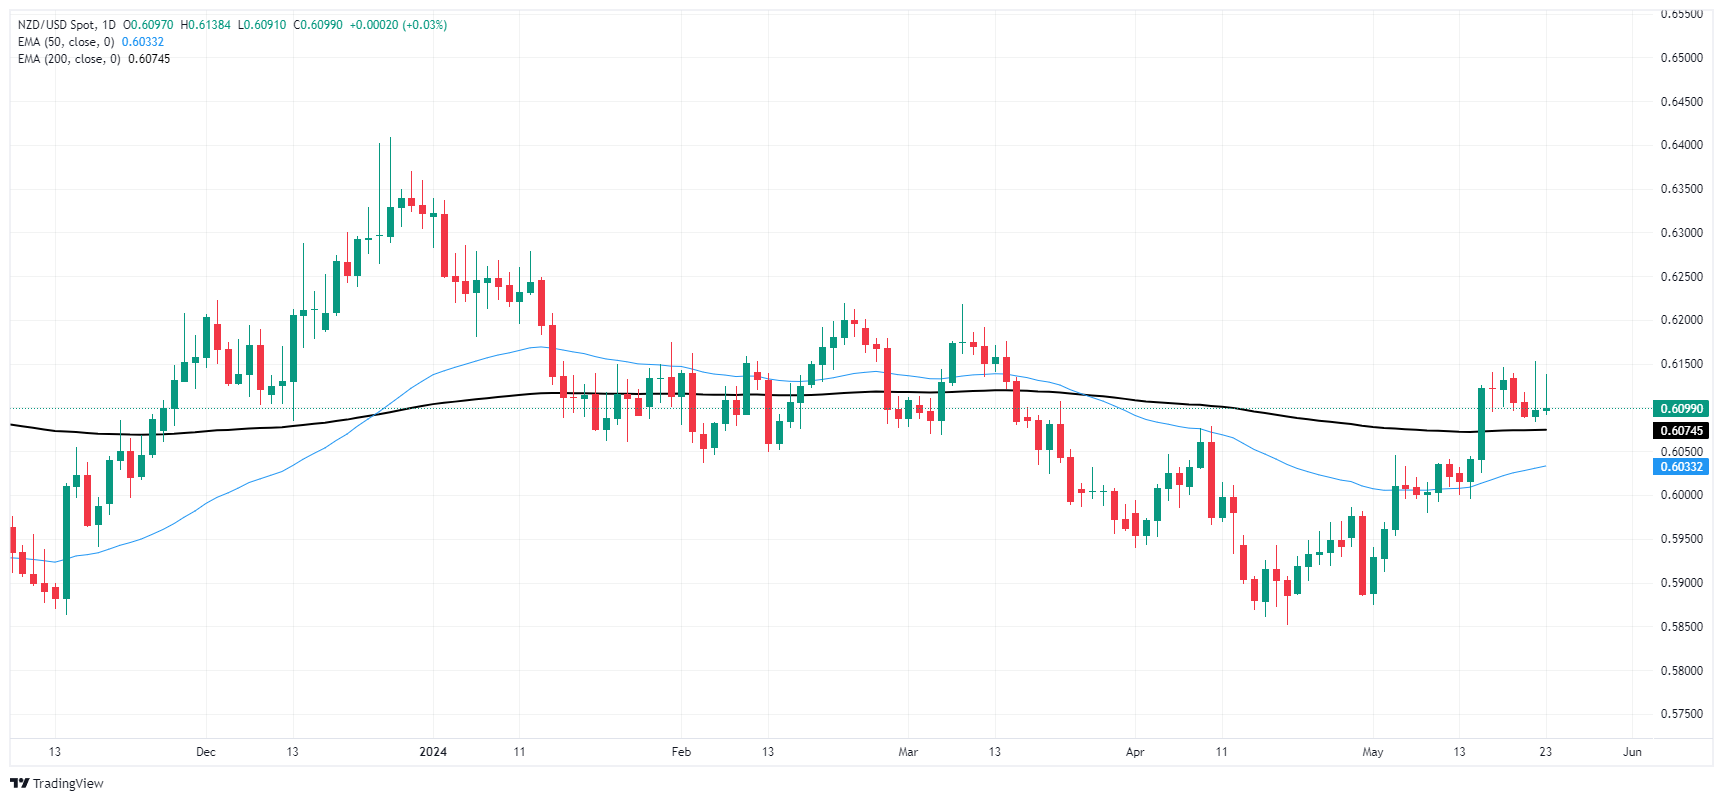
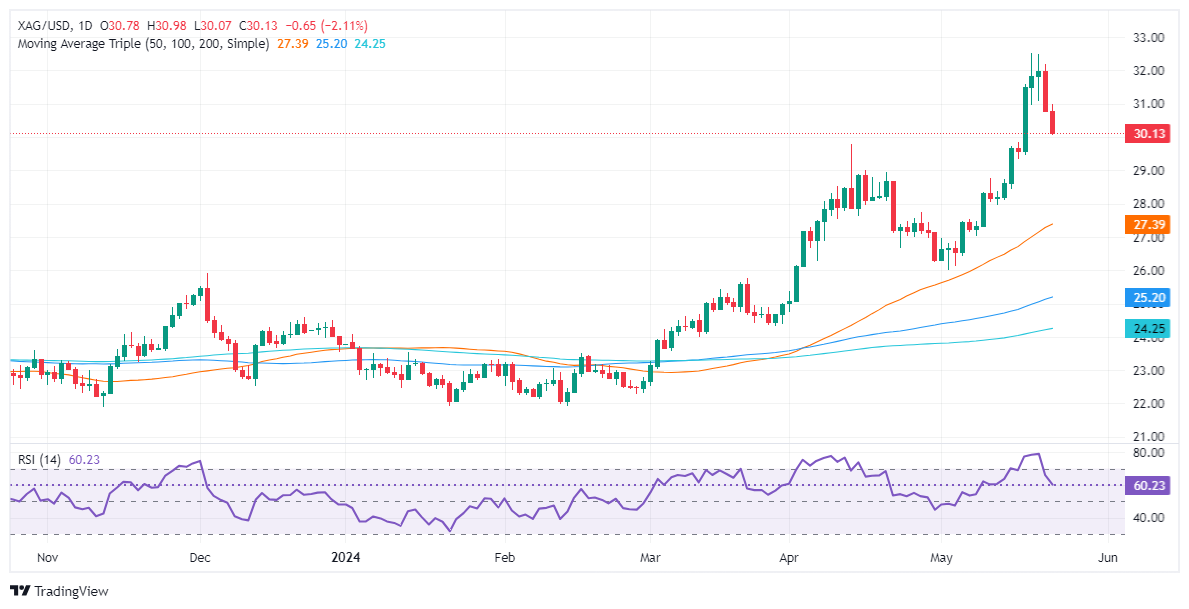
- Silver falls 2.18%, trading at $30.10, as strong US business activity data impacts the market.
- Key support levels: $30.00 psychological level, April 12 high at $29.79, and $29.00.
- Additional support at May 18, 2021, high of $28.74 and June 10, 2021, high of $28.28.
Silver price tumbled more than 2% on Thursday as economic data from the United States showed that business activity is faring well amid a high interest rates economy. At the time of writing, the XAG/USD trades at $30.10, down 2.18%.
XAG/USD Price Analysis: Technical outlook
Silver’s uptrend remains intact, but the rapid and strong movement has led to a mean reversion. The buyer’s momentum is fading, as hinted by the Relative Strength Index (RSI) falling below the 70.00 level, aiming toward the 50-midline. This suggests that sellers are gathering control.
Given this context, the first support level for XAG/USD would be the $30.00 psychological level. If further weakness occurs, the next support level would be the April 12 high, now turned support, at $29.79, followed by $29.00. Additional key support levels include the May 18, 2021, high at $28.74, and the June 10, 2021, high at $28.28.
XAG/USD Price Action – Daily Chart
New Zealand's ANZ Roy Morgan Consumer Confidence in May rebounded to 84.9 from the previous 11-month low of 81.9. May's thin rebound still leaves aggregate consumer confidence near pandemic lows, but consumer inflation expectations also eased to 3.8% from 4.4%, printing at its lowest level since October of 2020.
Market reaction
The Kiwi (NZD/USD) is trading on the low side of near-term consolidation in the early Friday market session, pushed to an intraday bottom as broad-market flows bolster the Greenback. NZD/USD is trading near 0.6100 amidst a stubborn sideways pattern.
About ANZ Roy Morgan Consumer Confidence
The Consumer Confidence released by the ANZ is a leading index that measures the level of consumer confidence in economic activity. A high level of consumer confidence stimulates economic expansion while a low level drives to economic downturn. A high reading is seen as positive (or bullish) for the NZD, while a low reading is seen as negative (or bearish).
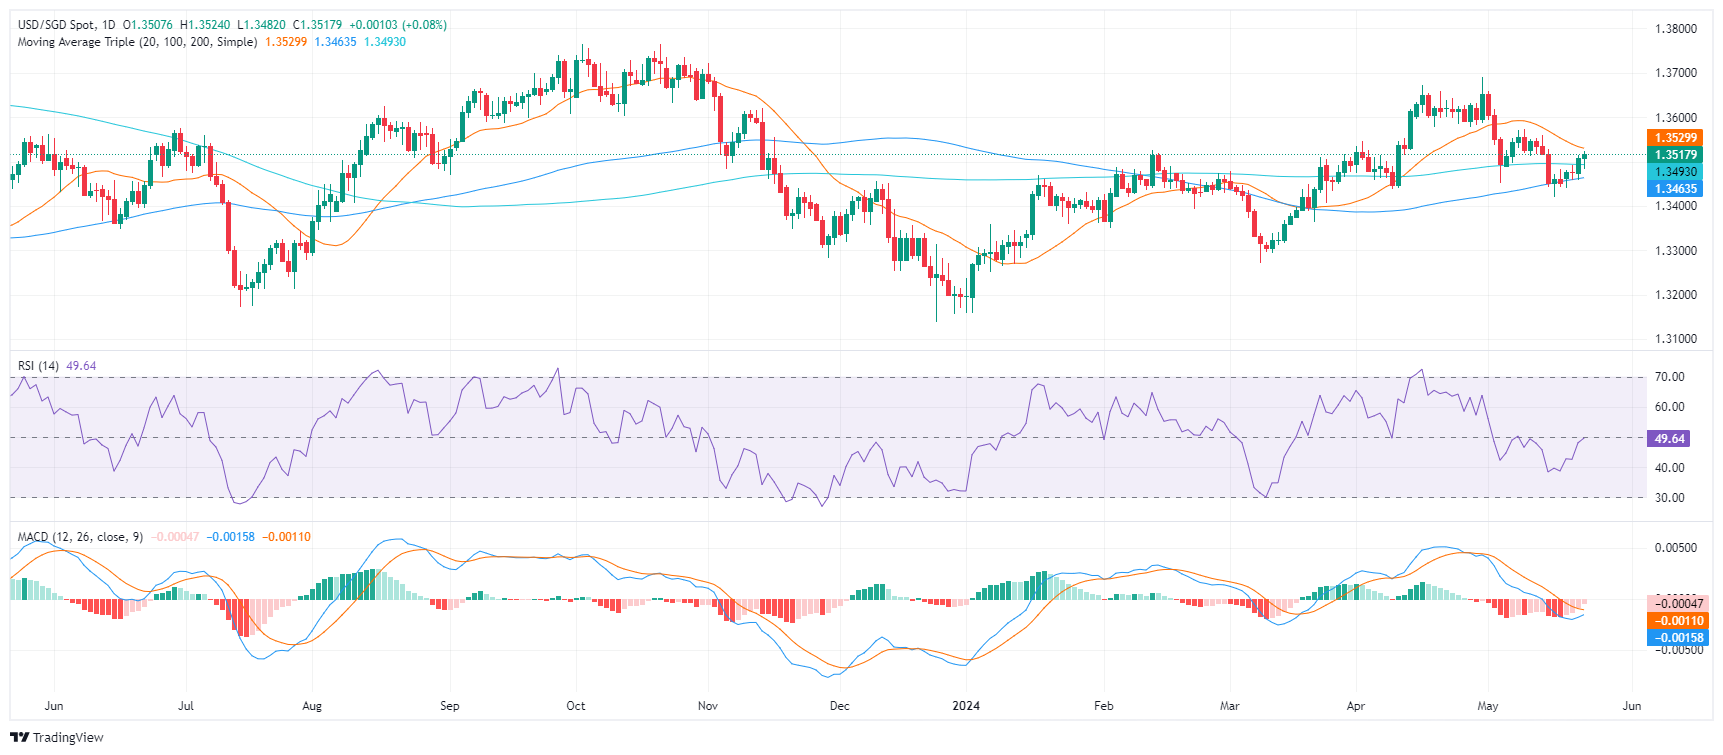
- USD/SGD rose to 1.3515 and managed to clear all of its daily losses.
- The US saw an uptick in manufacturing and services PMI data which bolstered the Dollar.
- Strong Jobless Claims figures are also painting a resilient US economy which justifies the delay of rate cuts by the Fed.
The USD/SGD recovered from daily lows, and ahead of the Asian session is trading with slight gains. The pair's movements have been influenced primarily by the cautious posture of the Federal Open Market Committee (FOMC) seen in Wednesday’s minutes, and the strong US Manufacturing and Services PMI figures. Strong Unemployment data released during the European session contributed to the recovery.
While the US Federal Reserve maintains its cautious approach towards monetary easing, strong manufacturing and service sector data seem to justify the bank’s stance. May's S&P Global Manufacturing PMI surpassed market expectations, increasing to 50.9 compared to April's figure of 50.0. Furthermore, a robust increase was also seen in the services PMI, which accelerated to 54.8 from 51.3, undermining market expectations. Additionally, the US Department of Labor reported a rise in Jobless Claims, which was below the expected estimates, suggesting that the labor market remains strong.
The strong economic figures fueled a rise in US Treasury yields which seems to be signalling that markets are delaying the start of the easing cycle. This is corroborated by the CME FedWatch Tool which indicated that the odds of a cut in September declined just below 40%. Next week, the US will release April’s Personal Consumption Expenditures (PCE) data which will provide additional insights into the US economy..
USD/SGD technical analysis
Within the daily overview, the Relative Strength Index (RSI) is treading in negative territory, inclining slightly towards a neutral trend while oscillating around the 50 mark. However, a recovery was seen after bottoming at 44 which may imply that the buyers are gaining ground. The decreasing red bars of the Moving Average Convergence Divergence (MACD) histogram reveals a decreasing selling momentum, providing a signal that the bear's time might be over.
USD/SGD daily chart
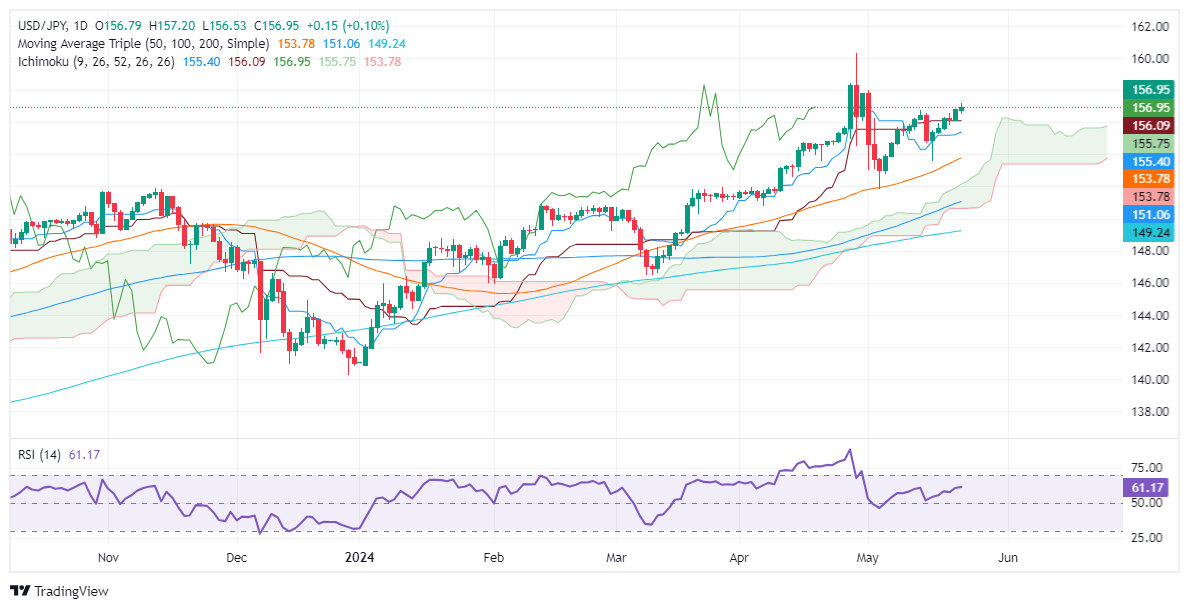
- USD/JPY rises, trading at 156.86, nearing the key psychological resistance at 157.00.
- U.S. economic data showing rapid business growth since 2022 bolsters the pair.
- Technical analysis: Resistance at 157.00, 158.44 (April 26 high), and YTD high of 160.32.
- Supports identified at Tenkan-Sen (156.05), Senkou Span A (155.61), and Kijun-Sen (155.18).
The USD/JPY registered gains for the second consecutive trading day but were marginal. The pair trades at 156.86, up by 0.03%, as economic indicators in the United States showed that business activity remains resilient, growing at the fastest pace since 2022.
USD/JPY Price Analysis: Technical outlook
The USD/JPY uptrend is persisting, but it is encountering strong resistance at the psychological 157.00 after clearing the May 14 high of 156.76. If buyers manage to surpass 157.00. that could lead to further gains. The next resistance emerges at 158.44, the April 26 high, and eventually challenges the year-to-date (YTD) high of 160.32.
On the downside, if the pair falls below the Tenkan-Sen at 156.05, it will expose the Senkou Span A at 155.61, followed by the Kijun-Sen at 155.18.
USD/JPY Price Action – Daily Chart
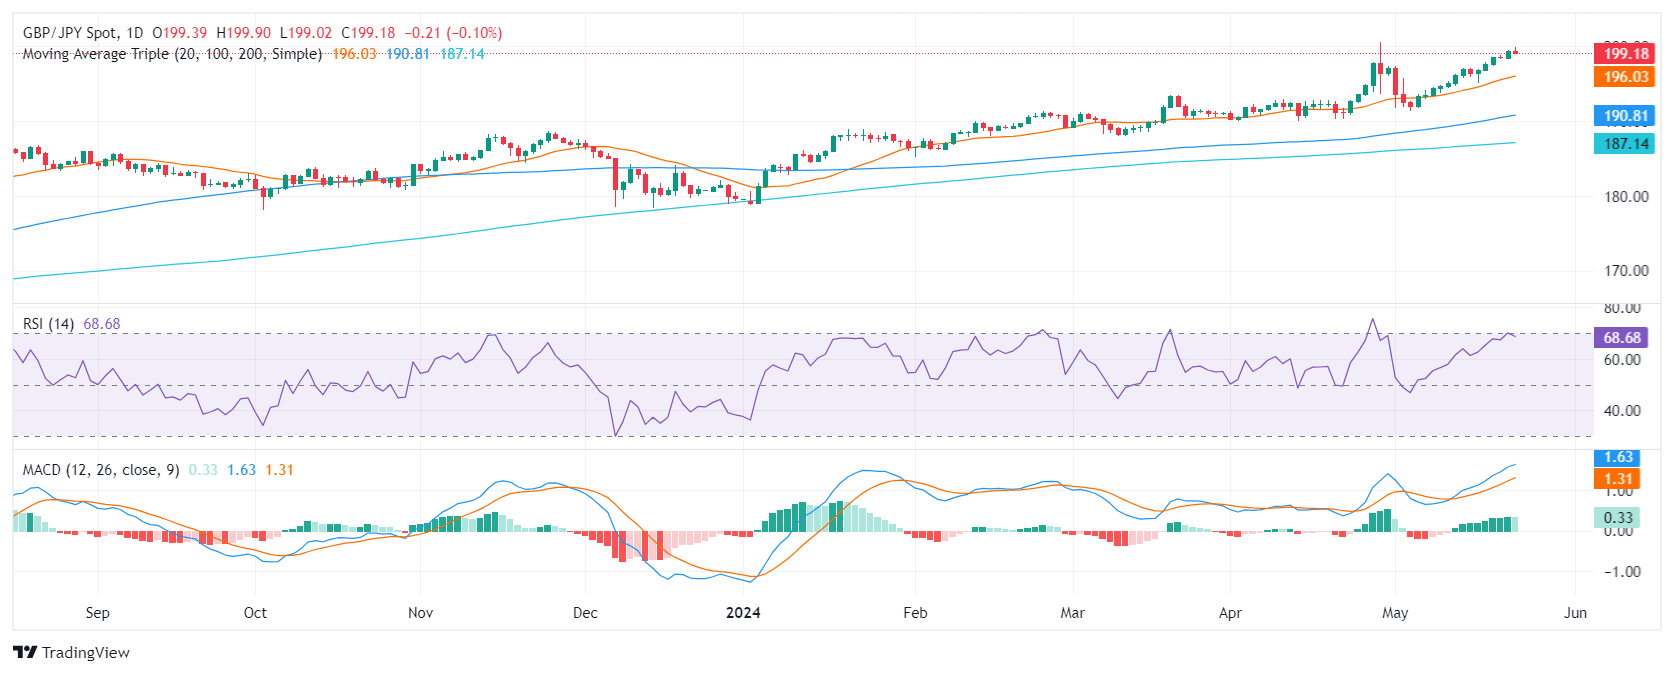
- The daily chart shows that the bulls are taking their foot off the gas and started to take profits.
- The hourly chart shows signs of short-term selling pressure ahead of the Asian session.
- The main support to hold is the 20-day SMA at 196.00.
On Thursday's session, the GBP/JPY declined to 199.20 but holds an overall positive outlook. This theory is backed up by the pair approaching near-cycle highs. If the cross holds the 20-day Simple Moving Average (SMA) at 196.00, the downward movements could be considered corrective.
In the daily chart, the Relative Strength Index (RSI) exhibits heightened bullish momentum as it comfortably resides in positive territory nearing overbought conditions but seems to be flattening. Simultaneously, the Moving Average Convergence Divergence (MACD) reveals a decreasing bullish momentum, distinguished by falling green bars. This indicates that while buyers currently hold the reins, their influence may be abating.
GBP/JPY daily chart
Switching to the hourly chart, the RSI portrays a contrasting bearish tendency, with the latest reading of approximately 44, dipping into negative territory. A declining trend is corroborated by the MACD's ascending red bars, suggesting a surge in negative momentum as sellers gain influence in the short term.
GBP/JPY hourly chart
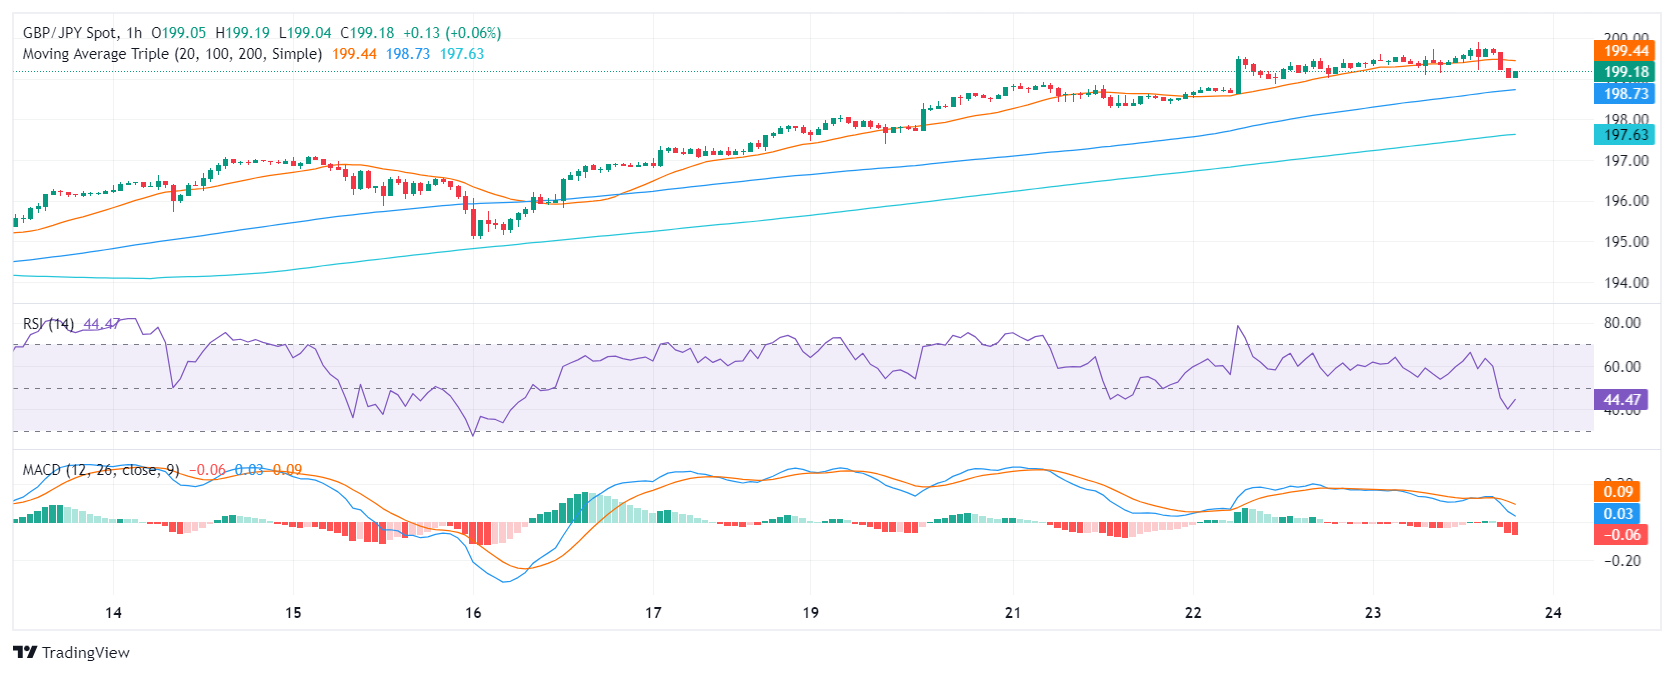
To conclude, the GBP/JPY pair rose near cycle highs, and indicators reached overbought conditions which may trigger a corrective phase. Ahead of the Asian session, investors are taking profits, evident in the hourly chart where indicators are in the red. However, as long as the pair holds above the 20,100 and 200-day SMAs, the outlook will be bullish.
- Gold price declines for third straight day, now at $2,332, down from high of $2,383.
- Strong US economic data boosts Treasury yields and US Dollar, impacting Gold prices.
- Fed minutes suggest more rate hikes possible if inflation continues, rate cut expectations reduced to 27 basis points by end of 2024.
- Emerging market central banks have acquired 2,200 tons of gold since Q3 2022, influenced by sanctions on Russia.
Gold price tanks for the third straight day on Thursday, refreshing one-week lows after economic data from the United States spurred a jump in US Treasury yields and boosted the American Dollar. That hurt the Federal Reserve's (Fed) rate cut hopes with investors expecting just 27 basis points of easing toward the end of 2024, based on Chicago Board of Trade (CBOT) data.
At the time of writing, the XAU/USD trades at $2,332, plunging 1.90% after reaching a high of $2,383.
US business activity is gathering pace, revealed S&P Global on its May final reading of the Manufacturing, Services, and Composite PMIs. Earlier, the US Bureau of Labor Statistics (BLS) showed that the number of Americans filing for unemployment benefits was shy of estimates and less than the previous reading, indicating strength in the labor market.
The data boosted the Greenback, which, according to the US Dollar Index (DXY), gained 0.18% and is back above 105.00. In addition, the Fed Minutes revealed on Wednesday showed that some officials were ready to raise rates if inflation warranted, a headwind for the non-yielding metal.
Gold prices were underpinned by emerging markets' central bank buying, according to an article in The Wall Street Journal. The catalyst that sparked the buying was Western sanctions on Russia after its invasion of Ukraine.
The World Gold Council revealed that central banks added around 2,200 tons of the golden metal since Q3 2022.
Daily digest market movers: Gold price falls as US yields climbed following upbeat US PMIs
- Gold prices are undermined by the rise in US Treasury yields. The US 10-year Treasury note yield edges up five basis points to 4.477%, a headwind for the yellow metal.
- Initial Jobless Claims in the US reached 215K for the week ending May 18, which was lower than the estimated 220K and the previous week's reading of 223K.
- S&P Global released the final US PMI readings for May. The Manufacturing PMI rose to 50.9, surpassing both estimates and April's figure of 50.0. The Services PMI significantly outperformed forecasts and April's 51.3, increasing to 54.8.
- S&P Global Composite PMI also improved, climbing from 51.3 to 54.4, and exceeded the forecast of 51.1.
- The FOMC Minutes showed that Fed officials remained uncertain about the degree of policy restrictiveness. They added that “it would take longer than previously anticipated to gain greater confidence in inflation moving sustainably to 2%.”
- Data from the Chicago Board of Trade shows investors are expecting 27 basis points of Fed easing toward the end of the year.
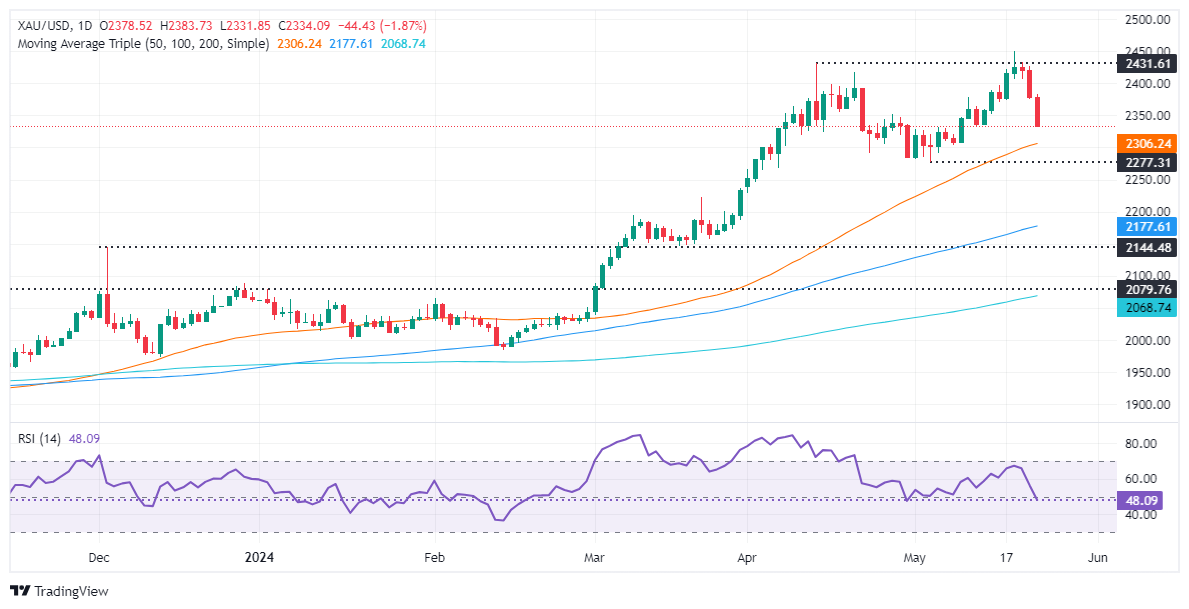
Technical analysis: Gold price slides below $2,350 as bears target $2,300
Gold price remains upwardly biased despite posting losses for the third straight day. In the short term, momentum has shifted negatively. This is shown by the Relative Strength Index (RSI), which dropped below the 50-midline, an indication that sellers are in charge.
That said, the XAU/USD’s first support would be the May 13 low at $2,332, followed by the May 8 low of $2,303. Once those levels are surpassed, the 50-day Simple Moving Average (SMA) at $2,307 will be up next.
On the other hand, if buyers push prices above $2,350, the $2,400 mark could be exposed. Gold prices could rally and, on further strength, retest the year-to-date (YTD) high at $2,450.
Gold FAQs
Gold has played a key role in human’s history as it has been widely used as a store of value and medium of exchange. Currently, apart from its shine and usage for jewelry, the precious metal is widely seen as a safe-haven asset, meaning that it is considered a good investment during turbulent times. Gold is also widely seen as a hedge against inflation and against depreciating currencies as it doesn’t rely on any specific issuer or government.
Central banks are the biggest Gold holders. In their aim to support their currencies in turbulent times, central banks tend to diversify their reserves and buy Gold to improve the perceived strength of the economy and the currency. High Gold reserves can be a source of trust for a country’s solvency. Central banks added 1,136 tonnes of Gold worth around $70 billion to their reserves in 2022, according to data from the World Gold Council. This is the highest yearly purchase since records began. Central banks from emerging economies such as China, India and Turkey are quickly increasing their Gold reserves.
Gold has an inverse correlation with the US Dollar and US Treasuries, which are both major reserve and safe-haven assets. When the Dollar depreciates, Gold tends to rise, enabling investors and central banks to diversify their assets in turbulent times. Gold is also inversely correlated with risk assets. A rally in the stock market tends to weaken Gold price, while sell-offs in riskier markets tend to favor the precious metal.
The price can move due to a wide range of factors. Geopolitical instability or fears of a deep recession can quickly make Gold price escalate due to its safe-haven status. As a yield-less asset, Gold tends to rise with lower interest rates, while higher cost of money usually weighs down on the yellow metal. Still, most moves depend on how the US Dollar (USD) behaves as the asset is priced in dollars (XAU/USD). A strong Dollar tends to keep the price of Gold controlled, whereas a weaker Dollar is likely to push Gold prices up.
- WTI falls back below $77 per barrel as investor sentiment sours.
- Broad-market risk appetite evaporates, dragging broader markets lower.
- US production continues to threaten hopes of supply shortage.
West Texas Intermediate (WTI) US Crude Oil slid to fresh lows on Thursday in a risk-off bid sparked by rate cut hopes drying up on the back of fresh concerns that services-side inflation will continue to run hotter than hoped. US Crude Oil production has once again threatened to outpace demand, leading to a fresh buildup in week-on-week barrel counts and renewing concerns that a US-led overhang of Crude Oil could push barrel prices paid even lower.
US Services Purchasing Managers Index (PMI) figures rebounded to a 12-month high in May, printing at 50.9 MoM compared to the forecast steady hold at 50.0. A climbing services activity outlook mixes poorly with a fresh warning from Fitch Ratings on Wednesday that services-side inflation will remain higher for much longer than broadly anticipated. With services activity possibly sparking further services inflation, investors are seeing fresh concerns that interest rates will remain higher for longer, sapping risk appetite on Thursday.
According to the CME’s FedWatch Tool, rate markets are now pricing in roughly equal odds of at least a quarter-point cut in September. This is down sharply from nearly 70% at the beginning of the trading week.
According to the American Petroleum Institute (API) and the Energy Information Administration (EIA), US Crude Oil barrel counts have risen once again week-on-week, eating away at the previous week’s declines. API Crude Oil Stocks for the week ended May 17 rose 2.48 million barrels, well above the forecast -3.1 million drawdown and refilling most of the previous week’s -3.104 million decline. EIA Crude Oil Stocks change also climbed over the same weekly period, adding 1.825 million barrels and snubbing the forecast -3.1 million drawdown. The previous week had seen a -2.508 million barrel decline.
WTI technical outlook
Crude Oil is sharply lower on Thursday, falling into negative territory after reaching an intraday peak with WTI testing $78.50. US Crude Oil has fallen to its lowest bids in over a week, knocking into $76.50 after backsliding through the $77.00 handle.
Thursday’s bearish reversal sends WTI into the red for a fourth consecutive trading day, and US Crude Oil is extending a bearish rejection from the 200-day Exponential Moving Average (EMA) at $79.22.
WTI hourly chart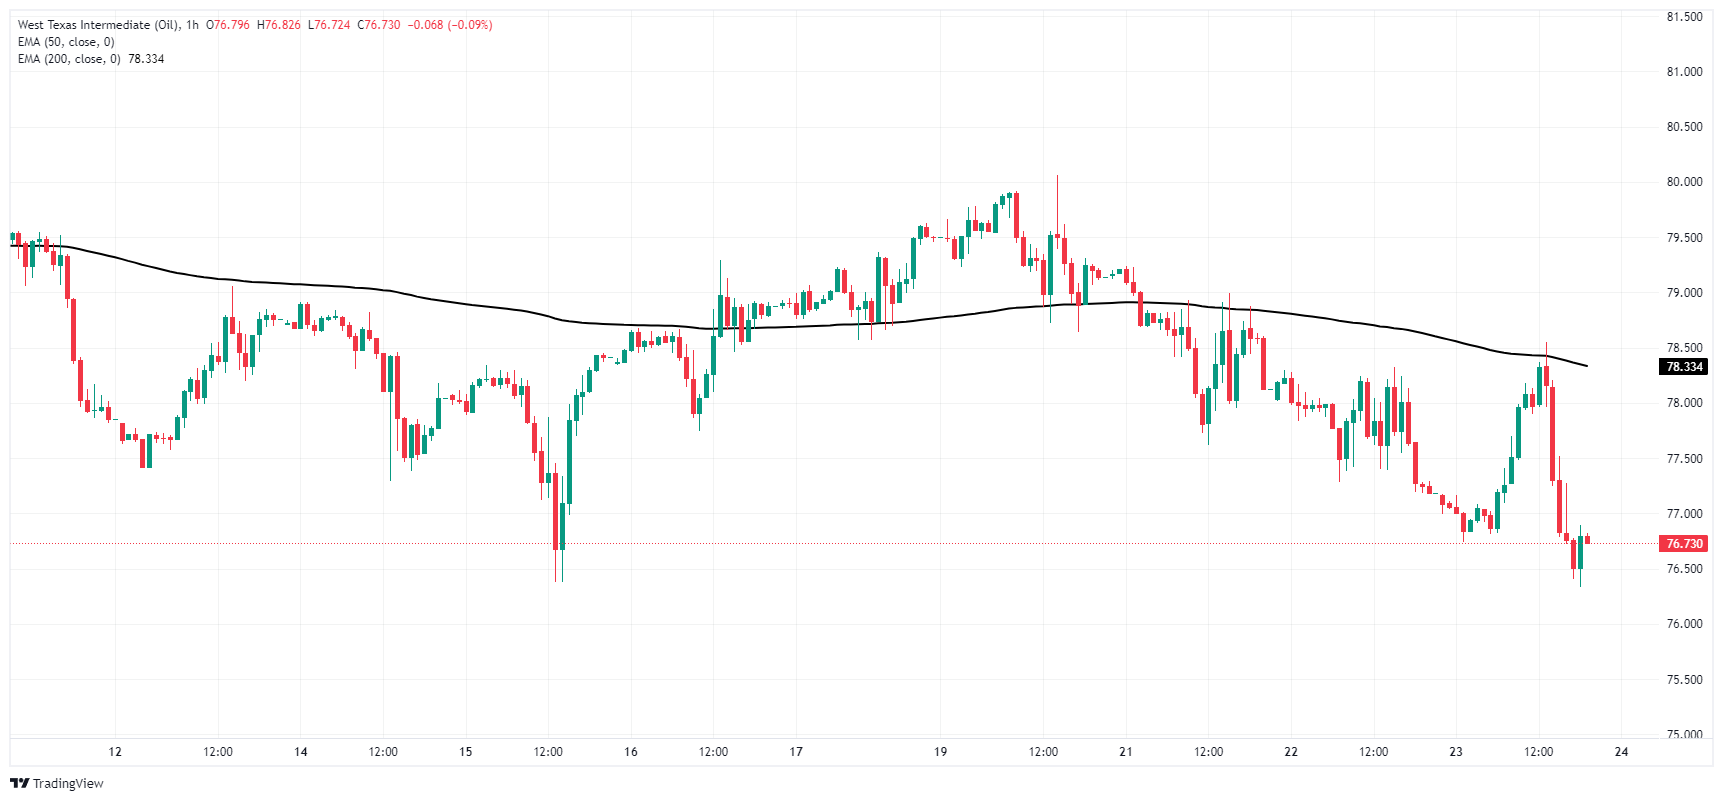
WTI daily chart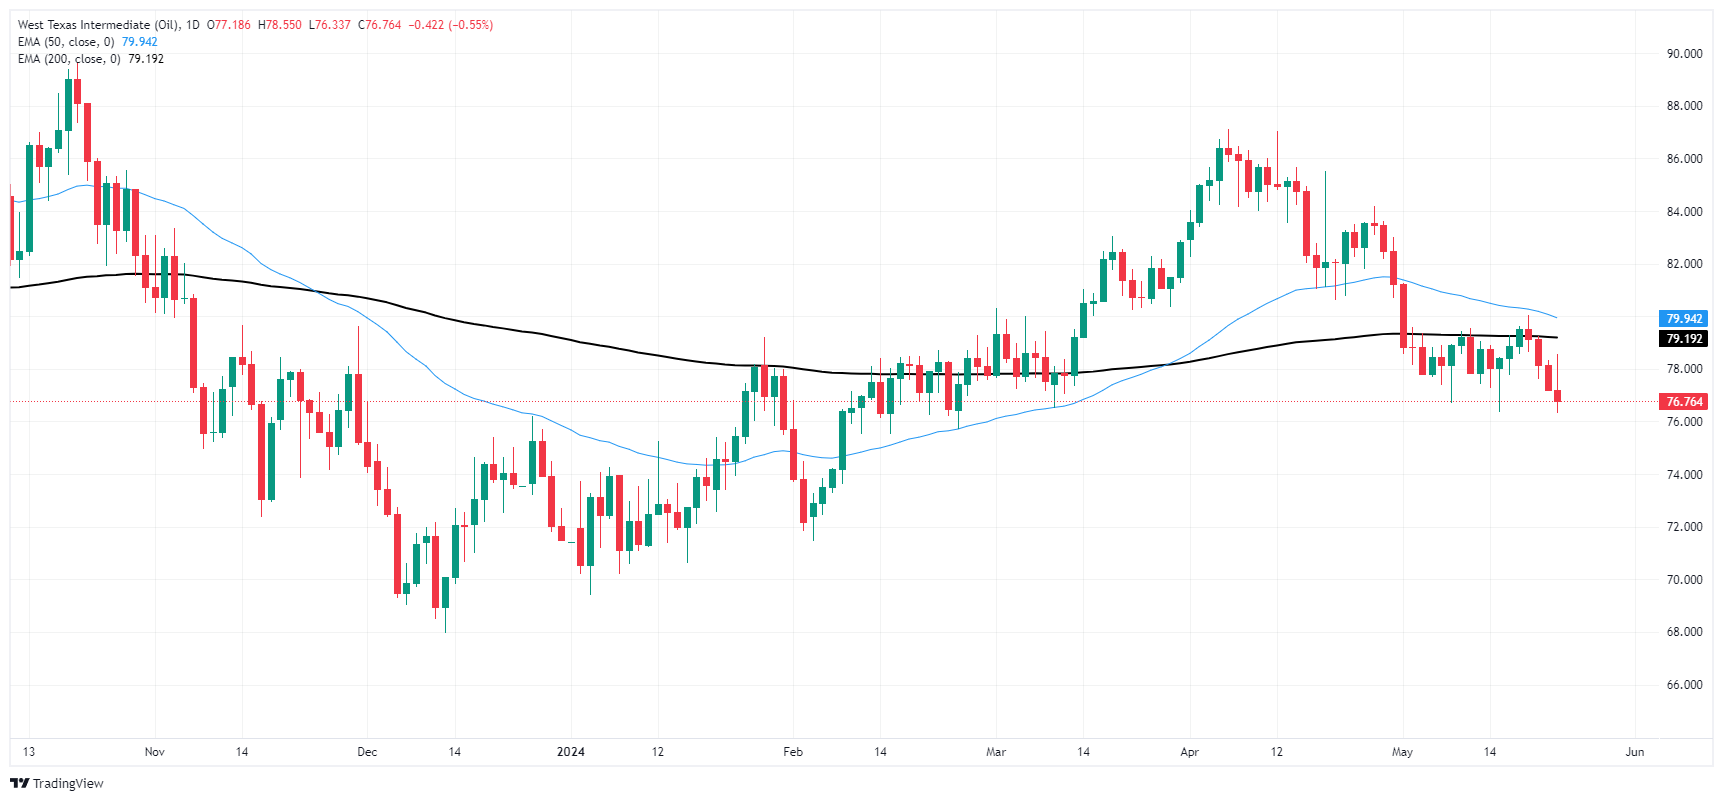
Federal Reserve (Fed) Bank of Atlanta President Raphael Bostic hit newswires on Thursday cautioning that the inflation outlook may not ease as quickly as market participants continue to hope for.
Key highlights
It would not surprise me if it took longer to get to 2% inflation in the US than elsewhere.
There is considerable upward pressure on prices, we're not past the worry point.
We may need to be more patient to avoid heating the economy.
We are not in danger of falling into a more contractionary environment.
Job growth has been robust, which gives me comfort in staying at more restrictive levels.
Low-cost debt makes people less sensitive to rate hikes.
Households and homeowners have locked in low rates, this limits the sensitivity of the economy to Fed policy rate hikes.
The post-pandemic economy may be less sensitive to rates.
The couple of inflation numbers suggest it's going back to 2%, but going slow.
The US Dollar climbed to multi-day highs on the back of diminishing bets of a rate cut in September, strong data from US business activity in May and a hawkish tilt from the FOMC Minutes.
Here is what you need to know on Friday, May 24:
The USD Index (DXY) rose to multi-session tops north of the 105.00 hurdle underpinned by the tighter-for-longer narrative around the Fed and higher yields. On May 24, Durable Goods Orders will take centre stage along with the final Michigan Consumer Sentiment and the speech by FOMC’s Waller.
EUR/USD clocked its fourth consecutive session of losses and challenged the 1.0800 support. The final Q1 GDP Growth Rate in Germany will be in the spotlight on May 24.
GBP/USD reversed four daily advances in a row and retreated from recent peaks near 1.2760. On May 24, the Consumer Confidence tracked by GfK comes in the first turn seconded by Retail Sales.
USD/JPY surpassed the 157.00 barrier and printed two-week tops amidst the dollar’s rebound and rising US yields. In Japan, the Inflation Rate, Core Inflation Rate and Inflation Rate Ex-Food and Energy for the month of April are due on May 24.
Further weakness saw AUD/USD add to the ongoing weekly retracement and breach the 0.6600 support on the back of the stronger Dollar and the generalized sour sentiment in the risk complex.
WTI prices remained on the back foot and reached new lows near the $76.00 mark per barrel following further buying pressure in the greenback and renewed speculation that the Fed might keep its restrictive stance for longer.
Prices of Gold charted heavy losses and revisited the $2,330 zone per troy ounce following the Dollar’s bounce and increasing yields. By the same token, prices of the ounce of Silver extended the drop to the boundaries of the $30.00 mark.
- The USD/THB bulls gain momentum, with the pair showing a 0.56% spike.
- Favorable PMI data and stable unemployment figures, coupled with the Federal Reserve's unwavering stance favor the USD.
- Markets are giving up their hopes of a cut in September by the Fed.
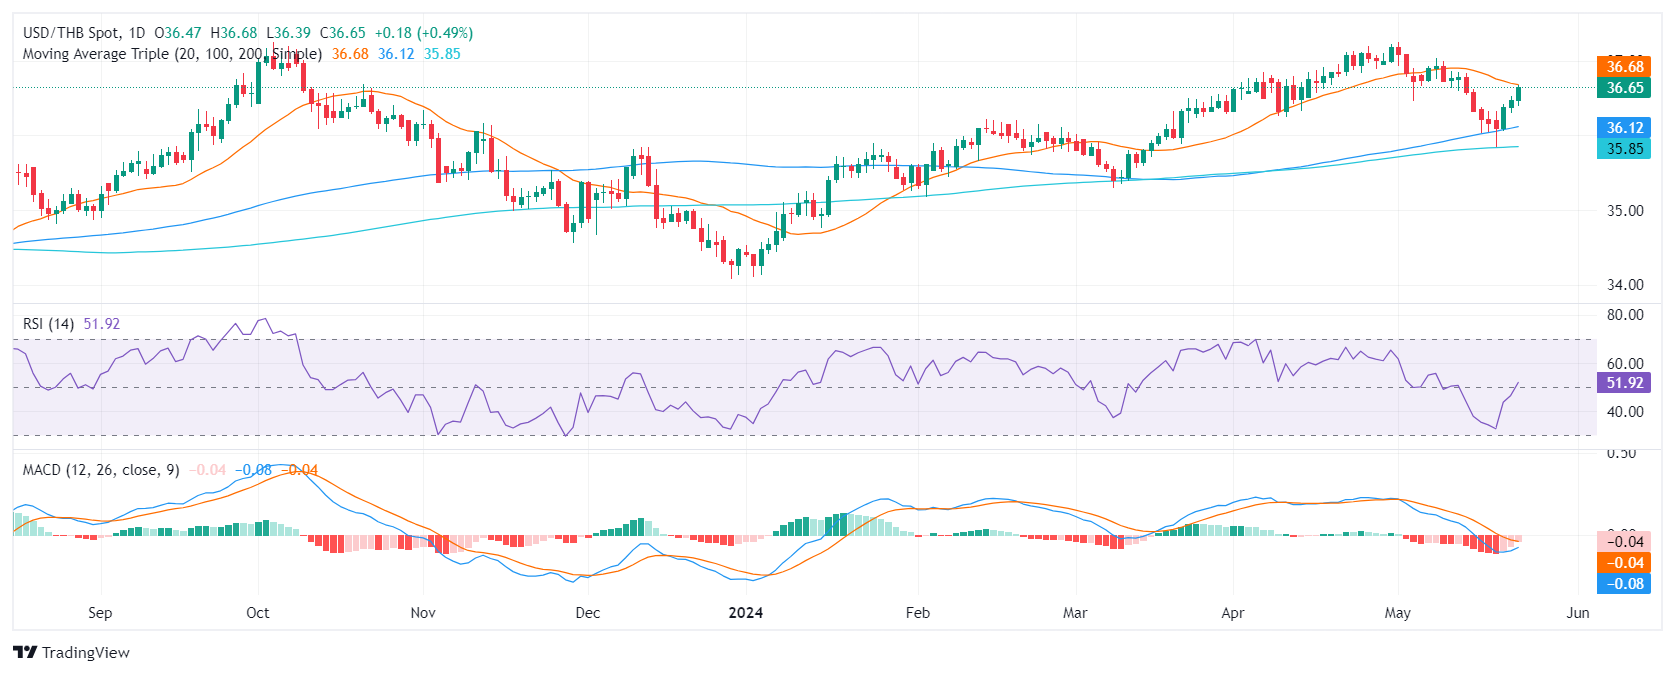
The USD/THB pair is gaining strength rising to 36.60 on Thursday due to the Federal Reserve's (Fed) persistent hawkish stance on maintaining high interest rates. This is backed by better-than-expected Manufacturing PMI data and low unemployment claims in the US, providing a favorable economic environment.
The latest US data showed a robust PMI reading for May, exceeding expectations with manufacturing PMI at 50.9, up from April's 50.0, and outpacing the forecast of 50.0. The Services PMI also saw an impressive surge, reaching 54.8 from April’s figure of 51.3, significantly beating a 51.3 forecast.
In addition, the US Labor Department declared a smaller-than-anticipated rise in unemployment benefits, which marked another positive note for the US economy. All these factors, combined with the Federal Reserve's steadfast commitment to high interest rates, benefited the Greenback against its peers on Thursday. In that sense, according to the CME FedWatch tool, markets have practically given up the hopes of a cut by the Fed until September. In that month’s meeting, investors now see just a 40% chance of the easing cycle starting.
USD/THB technical analysis
Within the daily view, the Relative Strength Index (RSI) shows a transition from negative to positive territory. The market dynamics quickly flipped from an oversold to a positive trend with the latest RSI reading standing above the mid-line. The buyers appear to have gained control, offsetting prior losses and establishing a more optimistic outlook.
Supporting this is the trend witnessed in the Moving Average Convergence Divergence (MACD) histogram, which displays declining red bars. This indicates a diminishing negative momentum, aligning with the bullish context presented by the RSI above.
USD/THB daily chart
- Mexican Peso drops versus US Dollar amid GDP slowdown and Banxico Minutes highlighting inflationary pressure.
- Banxico revises inflation outlook and expects convergence to 3% target by Q4 2025.
- Mexico's quarterly GDP exceeds expectations but slowed down; mid-month inflation data reflects ongoing disinflation.
- US economic data shows resilience with fewer unemployment claims and strong activity in manufacturing and service sectors.
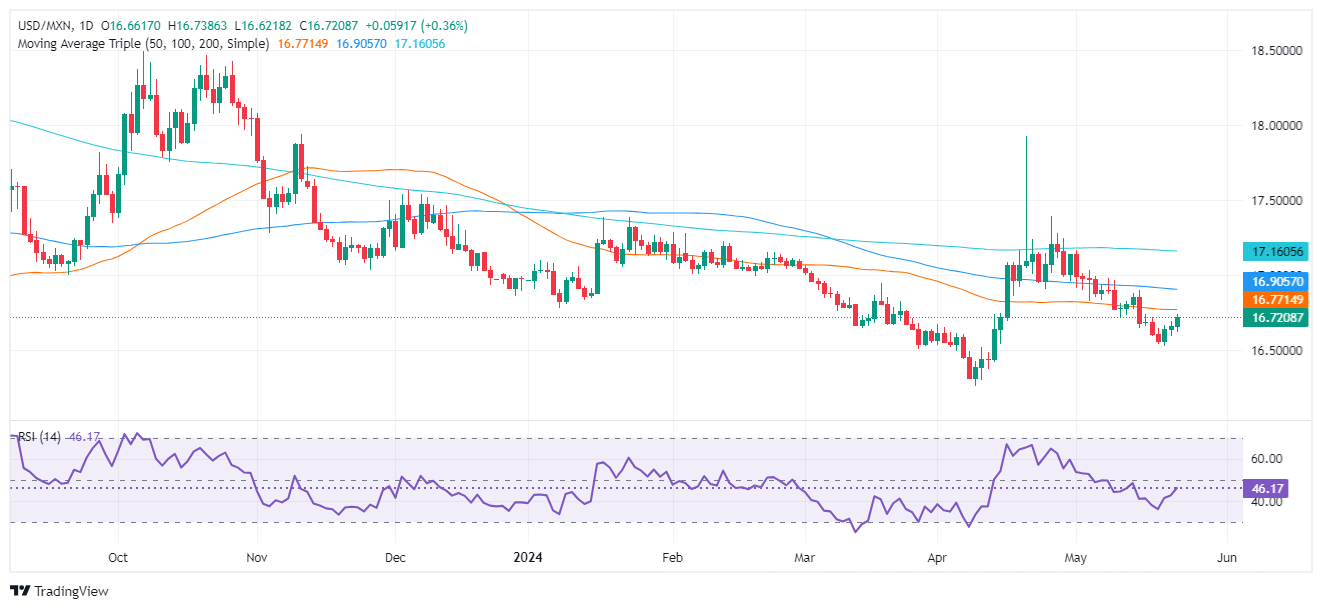
The Mexican Peso tumbles against the US Dollar on Thursday amid a busy economic docket in Mexico and the United States. Mexico's Gross Domestic Product (GDP) shows the economy slowing, while business activity in the US improved. That, alongside the release of Banxico’s Meeting Minutes, exerts pressure on the Mexican currency. The USD/MXN trades at 16.68, up 0.17%.
The Bank of Mexico revealed its latest Meeting Minutes. The board revealed that headline inflation most likely edged up due to persistent inflationary pressure in the services sector. Regarding underlying prices, “Most members noted that core inflation continued decreasing at the margin, having declined from 4.64[%] to 4.37% between February and April.”
In the minutes, all the members expect inflation to converge to Banxico’s target of 3% in the fourth quarter of 2025. Alongside that, "All members highlighted that, considering that inflationary shocks are foreseen to take longer to dissipate, the forecasts for headline and core inflation have been revised upwards.”
Earlier, the National Statistics Agency (INEGI for its acronym in Spanish) revealed that GDP figures exceeded forecasts on a quarterly basis, but on a yearly basis they decelerated as expected in the first quarter of 2024.
At the same time, headline inflation for the first half of May slowed on a monthly basis but increased on an annual basis, compared to the last reading. Mid-month core inflation was aligned with the consensus in monthly and yearly numbers, depicting the evolution of the disinflation process.
Across the border, the US economic docket was also busy. Unemployment claims came in below estimates, while business activity in the manufacturing and services segments smashed the consensus, expanding sharply and showing the US economy’s resilience.
Daily digest market movers: Mexican Peso depreciates as core inflation slows and US business activity reaccelerates
- Mexico’s Gross Domestic Product (GDP) for the first quarter of 2024 was 1.6% YoY as expected, down from Q4 2023’s 2.5% growth. On a quarterly basis, the country expanded 0.3% above estimates and the previous reading of 0.1%.
- Mid-month inflation for May was 4.78% YoY, up from 4.63% estimate. On a monthly basis, it decreased from 0.09% to -0.21%. Core inflation for the same period dipped from 4.39% to 4.31% YoY, as expected, and edged down from 0.16% to 0.15% MoM, in line with consensus.
- Across the border, the May Citibanamex survey showed that 26 analysts estimate Banxico will lower rates at the upcoming meeting on June 27. Eight estimate the Mexican central bank will lower rates until the second half of 2024. Inflation expectations for 2024 were revised upward from 4.17% to 4.21%, while underlying prices are expected to fall from 4.10% to 4.07%.
- Initial Jobless Claims in the US reached 215K in the week ending May 18, below the estimate and the previous reading of 220K and 223K, respectively.
- S&P Global revealed May’s final readings of US PMIs. The Manufacturing PMI expanded to 50.9, exceeding estimates and April’s 50.0, while the Services PMI crushed forecasts and April’s 51.3, improving to 54.8. The Composite PMI improved from 51.3 to 54.4, exceeding forecasts of 51.1.
- The latest Federal Open Market Committee minutes highlighted, "Various participants mentioned willingness to tighten policy further should risks to outlook materialize and make such action appropriate.” Regarding the tightness of the monetary policy, officials remained uncertain, adding that “it would take longer than previously anticipated to gain greater confidence in inflation moving sustainably to 2%.”
- Data from the Chicago Board of Trade shows investors are expecting 27 basis points (bps) of Fed easing, down from 31 bps estimated on Wednesday toward the end of 2024.
Technical analysis: Mexican Peso loses ground as USD/MXN hovers near 16.70
Despite remaining downwardly biased, the USD/MXN has printed three days of consecutive gains, opening the door to challenging higher prices. Once the exotic pair breached 16.60, momentum showed that selling pressure was waning as the Relative Strength Index (RSI) aims for the 50-midline.
For a bullish continuation, USD/MXN must clear the 50-day Simple Moving Average (SMA) at 16.76. A breach of the latter would exacerbate a rally toward the 100-day SMA at 16.91, followed by the 17.00 psychological level. In that event, the next stop would be the 200-day SMA at 17.17.
Conversely, a drop below 16.52 could exacerbate a challenge of the 16.50 psychological level, ahead of the year-to-date low of 16.25.
Mexican Peso FAQs
The Mexican Peso (MXN) is the most traded currency among its Latin American peers. Its value is broadly determined by the performance of the Mexican economy, the country’s central bank’s policy, the amount of foreign investment in the country and even the levels of remittances sent by Mexicans who live abroad, particularly in the United States. Geopolitical trends can also move MXN: for example, the process of nearshoring – or the decision by some firms to relocate manufacturing capacity and supply chains closer to their home countries – is also seen as a catalyst for the Mexican currency as the country is considered a key manufacturing hub in the American continent. Another catalyst for MXN is Oil prices as Mexico is a key exporter of the commodity.
The main objective of Mexico’s central bank, also known as Banxico, is to maintain inflation at low and stable levels (at or close to its target of 3%, the midpoint in a tolerance band of between 2% and 4%). To this end, the bank sets an appropriate level of interest rates. When inflation is too high, Banxico will attempt to tame it by raising interest rates, making it more expensive for households and businesses to borrow money, thus cooling demand and the overall economy. Higher interest rates are generally positive for the Mexican Peso (MXN) as they lead to higher yields, making the country a more attractive place for investors. On the contrary, lower interest rates tend to weaken MXN.
Macroeconomic data releases are key to assess the state of the economy and can have an impact on the Mexican Peso (MXN) valuation. A strong Mexican economy, based on high economic growth, low unemployment and high confidence is good for MXN. Not only does it attract more foreign investment but it may encourage the Bank of Mexico (Banxico) to increase interest rates, particularly if this strength comes together with elevated inflation. However, if economic data is weak, MXN is likely to depreciate.
As an emerging-market currency, the Mexican Peso (MXN) tends to strive during risk-on periods, or when investors perceive that broader market risks are low and thus are eager to engage with investments that carry a higher risk. Conversely, MXN tends to weaken at times of market turbulence or economic uncertainty as investors tend to sell higher-risk assets and flee to the more-stable safe havens.
- Dow Jones sheds almost a full percent, falls further away from 40,000.00.
- US Services PMI rose to a 12-month high, in a cautionary reminder of services inflation.
- Investors will be hoping for good news from Friday’s US Durable Goods Orders.
The Dow Jones Industrial Average (DJIA) tumbled on Thursday, falling -380 points and tumbling below 39,300.00 as investors pullback in the face of declining hopes for a September interest rate cut from the Federal Reserve (Fed).
May’s S&P Global Services Purchasing Managers Index (PMI) rose to a 12-month high of 50.9 on Thursday, well above the forecast steady print at 50.0. Accelerating services activity bodes poorly for investors desperate for signs of a rate trim from the Fed. Fitch Ratings warned the entire market on Wednesday that services inflation will likely remain sticky for some time, keeping rates elevated for much longer than many investors have been hoping for.
Read more: US S&P Global Manufacturing PMI surprised to the upside in May
According to the CME’s FedWatch Tool, rate traders are pricing in barely 50% odds of at least a quarter-point cut from the Fed in September, down significantly from the 70% odds priced in at the beginning of the trading week. US data will have one last chance to throw investors a bone on Friday, with US Durable Goods on the table.
US Durable Goods in April are expected to decline -0.8% MoM, down sharply from the previous month’s 2.6%. The University of Michigan’s Consumer Sentiment Index in May is forecast to tick upwards to 67.5 from the previous period’s 67.4, while UoM 5-year Consumer Inflation Expectations are expected to remain pinned at 3.1% in May.
Dow Jones news
The Dow Jones is sharply lower on Thursday as the US market’s worst-performing equity index. All but two of the Dow Jones’ constituent securities are in the red, with Amgen Inc. (AMGN) rising less than half a percent to $310.78 per share as the single meaningful gainer for the day.
On the downside, Boeing Co. (BA) is getting absolutely shattered on Thursday, tumbling -6.75% to $173.68 per share after the company announced negative cash flow with no expectations of the battered airplane manufacturer’s deliveries recovering in the second quarter.
Dow Jones technical outlook
The Dow Jones sees accelerating losses as the index turns bearish, falling back from record highs above 40,000.00. Thursday has been incredibly one-sided intraday trading, tumbling from the day’s early peaks near 39,760.00.
The DJIA is slipping back towards the 50-day Exponential Moving Average (EMA) at 38,908.36. Despite near-term declines, the index is still buried deep in bull country, with the index trading well above the 200-day EMA at 37,141.05.
Dow Jones five minute chart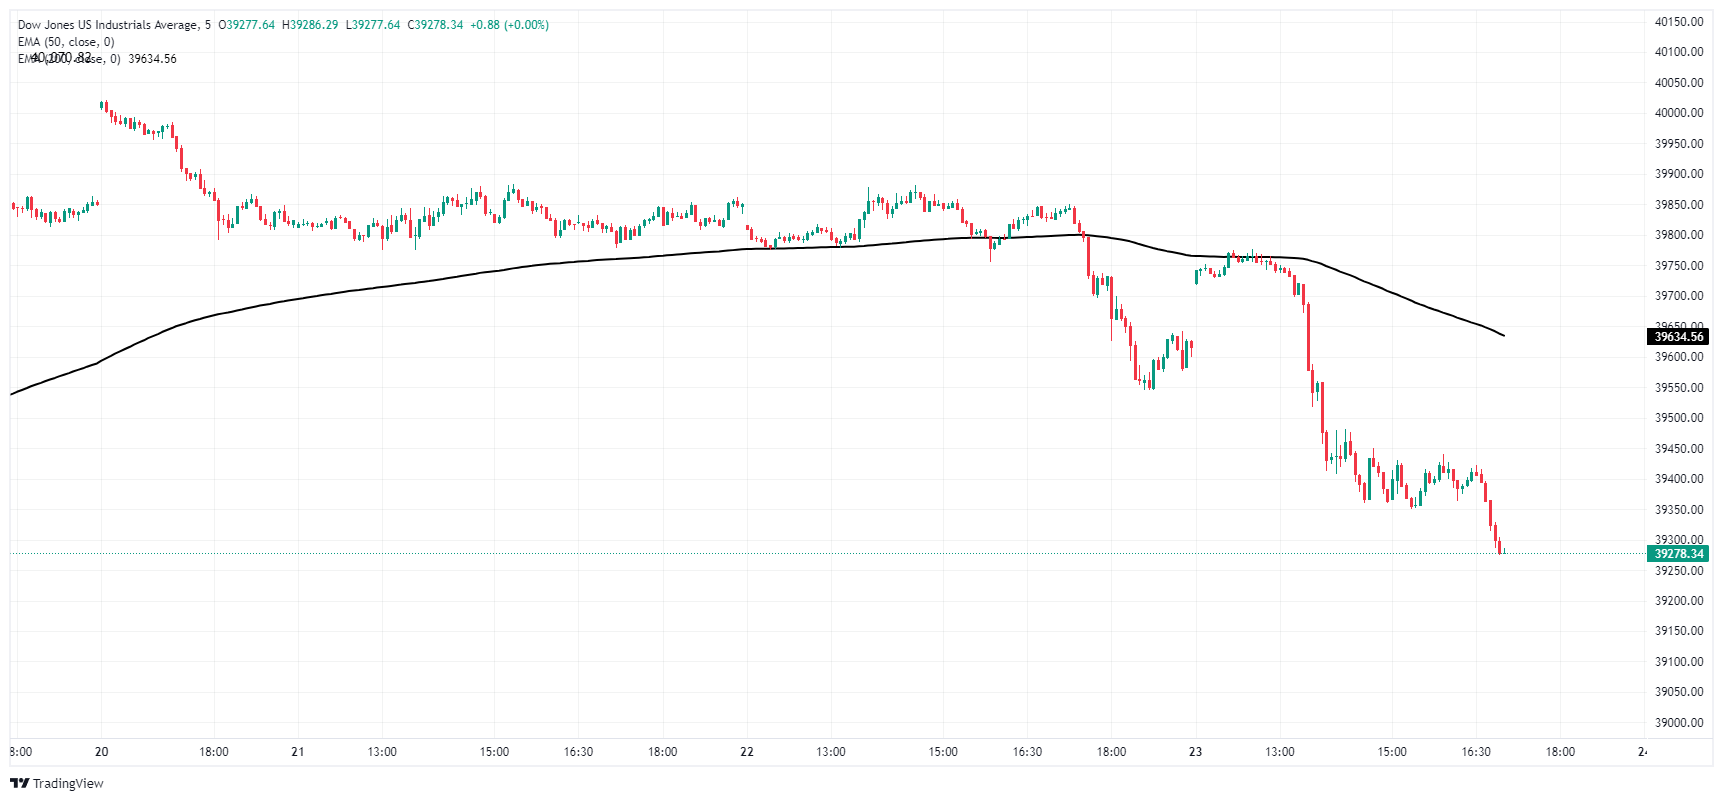
Dow Jones daily chart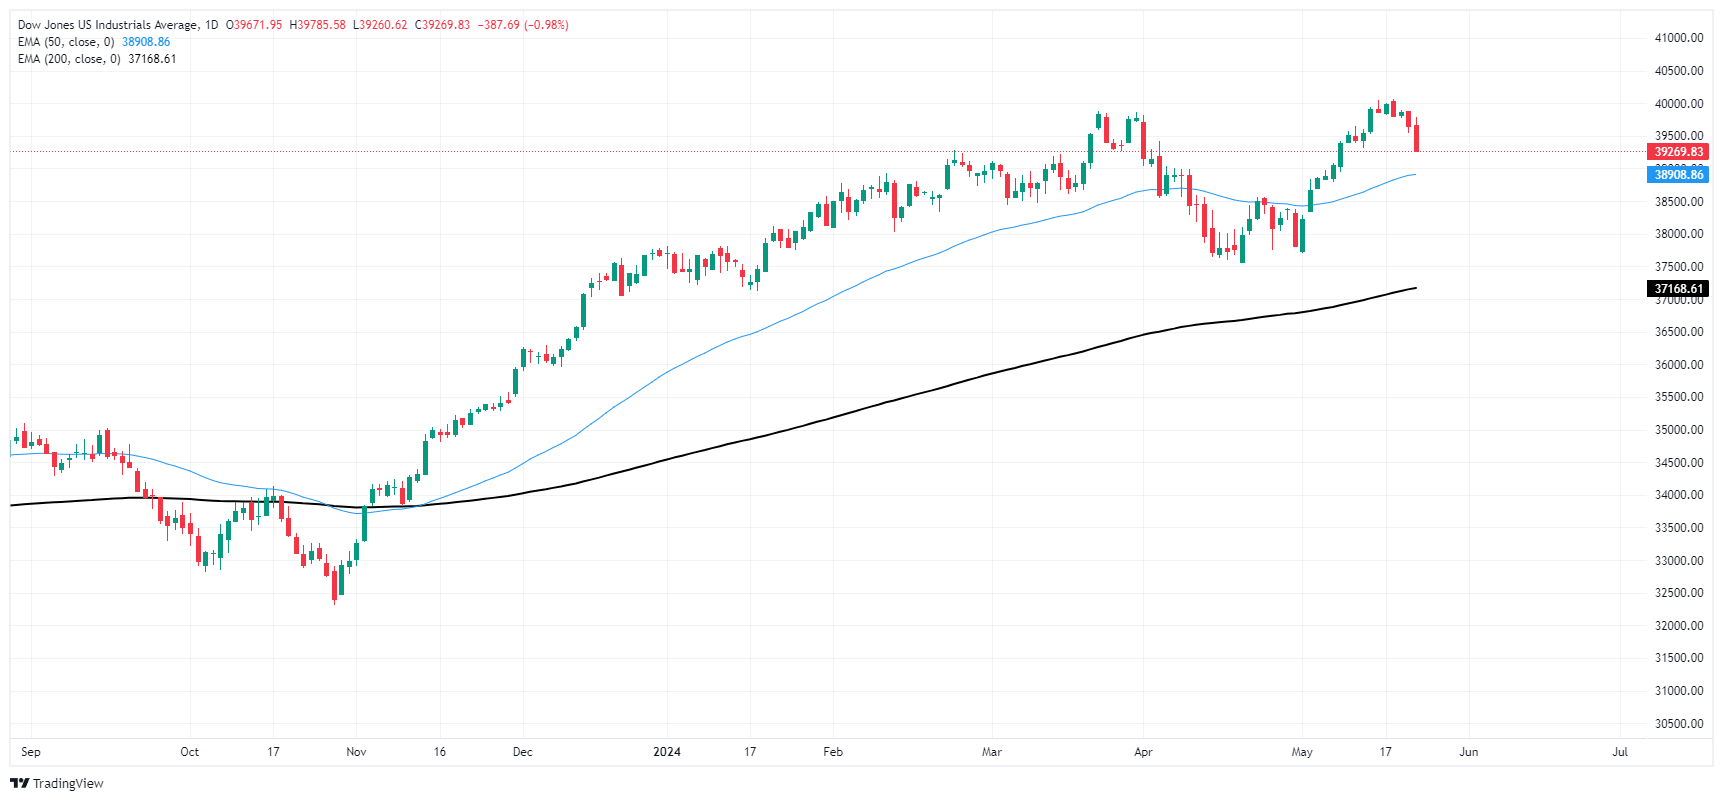
Dow Jones FAQs
The Dow Jones Industrial Average, one of the oldest stock market indices in the world, is compiled of the 30 most traded stocks in the US. The index is price-weighted rather than weighted by capitalization. It is calculated by summing the prices of the constituent stocks and dividing them by a factor, currently 0.152. The index was founded by Charles Dow, who also founded the Wall Street Journal. In later years it has been criticized for not being broadly representative enough because it only tracks 30 conglomerates, unlike broader indices such as the S&P 500.
Many different factors drive the Dow Jones Industrial Average (DJIA). The aggregate performance of the component companies revealed in quarterly company earnings reports is the main one. US and global macroeconomic data also contributes as it impacts on investor sentiment. The level of interest rates, set by the Federal Reserve (Fed), also influences the DJIA as it affects the cost of credit, on which many corporations are heavily reliant. Therefore, inflation can be a major driver as well as other metrics which impact the Fed decisions.
Dow Theory is a method for identifying the primary trend of the stock market developed by Charles Dow. A key step is to compare the direction of the Dow Jones Industrial Average (DJIA) and the Dow Jones Transportation Average (DJTA) and only follow trends where both are moving in the same direction. Volume is a confirmatory criteria. The theory uses elements of peak and trough analysis. Dow’s theory posits three trend phases: accumulation, when smart money starts buying or selling; public participation, when the wider public joins in; and distribution, when the smart money exits.
There are a number of ways to trade the DJIA. One is to use ETFs which allow investors to trade the DJIA as a single security, rather than having to buy shares in all 30 constituent companies. A leading example is the SPDR Dow Jones Industrial Average ETF (DIA). DJIA futures contracts enable traders to speculate on the future value of the index and Options provide the right, but not the obligation, to buy or sell the index at a predetermined price in the future. Mutual funds enable investors to buy a share of a diversified portfolio of DJIA stocks thus providing exposure to the overall index.
- Canadian Dollar broadly weaker, loses ground across board.
- Canada brings little meaningful data to the table.
- CAD traders forced to wait until Friday’s Retail Sales.
The Canadian Dollar (CAD) backslid once again on Thursday, piling on further weakness and dipping to 30-week lows. A lack of meaningful Canadian economic data is giving the CAD little support, and markets are focusing on an upside surprise in US Purchasing Managers Index (PMI) figures in May.
Canada will print March Retail Sales on Friday, alongside US Durable Goods Orders. The latest update from the University of Michigan’s Consumer Sentiment Index will also be delivered on Friday. Investors are broadly expecting Canadian Retail Sales to rebound slightly, while US Durable Goods are expected to soften slightly. Meanwhile, UoM Consumer Sentiment is expected to tick upwards, while Consumer Inflation Expectations are forecast to hold steady at 3.1%.
Daily digest market movers: Canadian Housing sees little impact against US PMI figures
- Canadian New Housing Price Index rises 0.2% MoM in April versus the previous 0.0%. Investors expected a print of 0.1%.
- US Initial Jobless Claims eased to 215K in the week ended May 17, down from the previous week’s 223K (revised from 222K) and below the forecast of 220K.
- US S&P Global Manufacturing PMI recovered to 50.9 in May, climbing over the forecasted hold of 50.0.
- The Services PMI component also rose to a 12-month high of 54.8.
- Market hopes for a September rate cut from the Federal Reserve (Fed) are evaporating. According to the CME FedWatch Tool, rate markets are pricing in barely over 50% odds of a quarter-point cut in September, down sharply from over 70% odds at the beginning of the week.
Canadian Dollar PRICE Today
The table below shows the percentage change of Canadian Dollar (CAD) against listed major currencies today. Canadian Dollar was the weakest against the New Zealand Dollar.
| USD | EUR | GBP | JPY | CAD | AUD | NZD | CHF | |
|---|---|---|---|---|---|---|---|---|
| USD | 0.04% | 0.04% | 0.16% | 0.10% | -0.00% | -0.15% | -0.08% | |
| EUR | -0.04% | 0.00% | 0.14% | 0.06% | -0.04% | -0.19% | -0.13% | |
| GBP | -0.04% | -0.00% | 0.14% | 0.05% | -0.04% | -0.20% | -0.13% | |
| JPY | -0.16% | -0.14% | -0.14% | -0.07% | -0.18% | -0.38% | -0.26% | |
| CAD | -0.10% | -0.06% | -0.05% | 0.07% | -0.10% | -0.25% | -0.19% | |
| AUD | 0.00% | 0.04% | 0.04% | 0.18% | 0.10% | -0.15% | -0.10% | |
| NZD | 0.15% | 0.19% | 0.20% | 0.38% | 0.25% | 0.15% | 0.07% | |
| CHF | 0.08% | 0.13% | 0.13% | 0.26% | 0.19% | 0.10% | -0.07% |
The heat map shows percentage changes of major currencies against each other. The base currency is picked from the left column, while the quote currency is picked from the top row. For example, if you pick the Canadian Dollar from the left column and move along the horizontal line to the US Dollar, the percentage change displayed in the box will represent CAD (base)/USD (quote).
Technical analysis: Softer CAD eases further, sends USD/CAD higher to 1.3700
The Canadian Dollar (CAD) is broadly weaker on Thursday, shedding weight across the board. The CAD is down three-tenths of one percent against the New Zealand Dollar (NZD) and a fifth of one percent against the Australian Dollar (AUD).
USD/CAD rose to the 1.3700 handle on Thursday as the mixed-performance Greenback outpaces the softening Canadian Dollar. The pair has risen into a two-week high and is on pace to close higher for a fourth straight day. Four of the last five daily candles have closed in the green.
USD/CAD is extending a bullish rebound from the 1.3600 handle as the pair rises further from the 200-day Exponential Moving Average (EMA) at 1.3551. However, the pair still remains down from the last major swing high into 1.2850 in mid-April.
USD/CAD hourly chart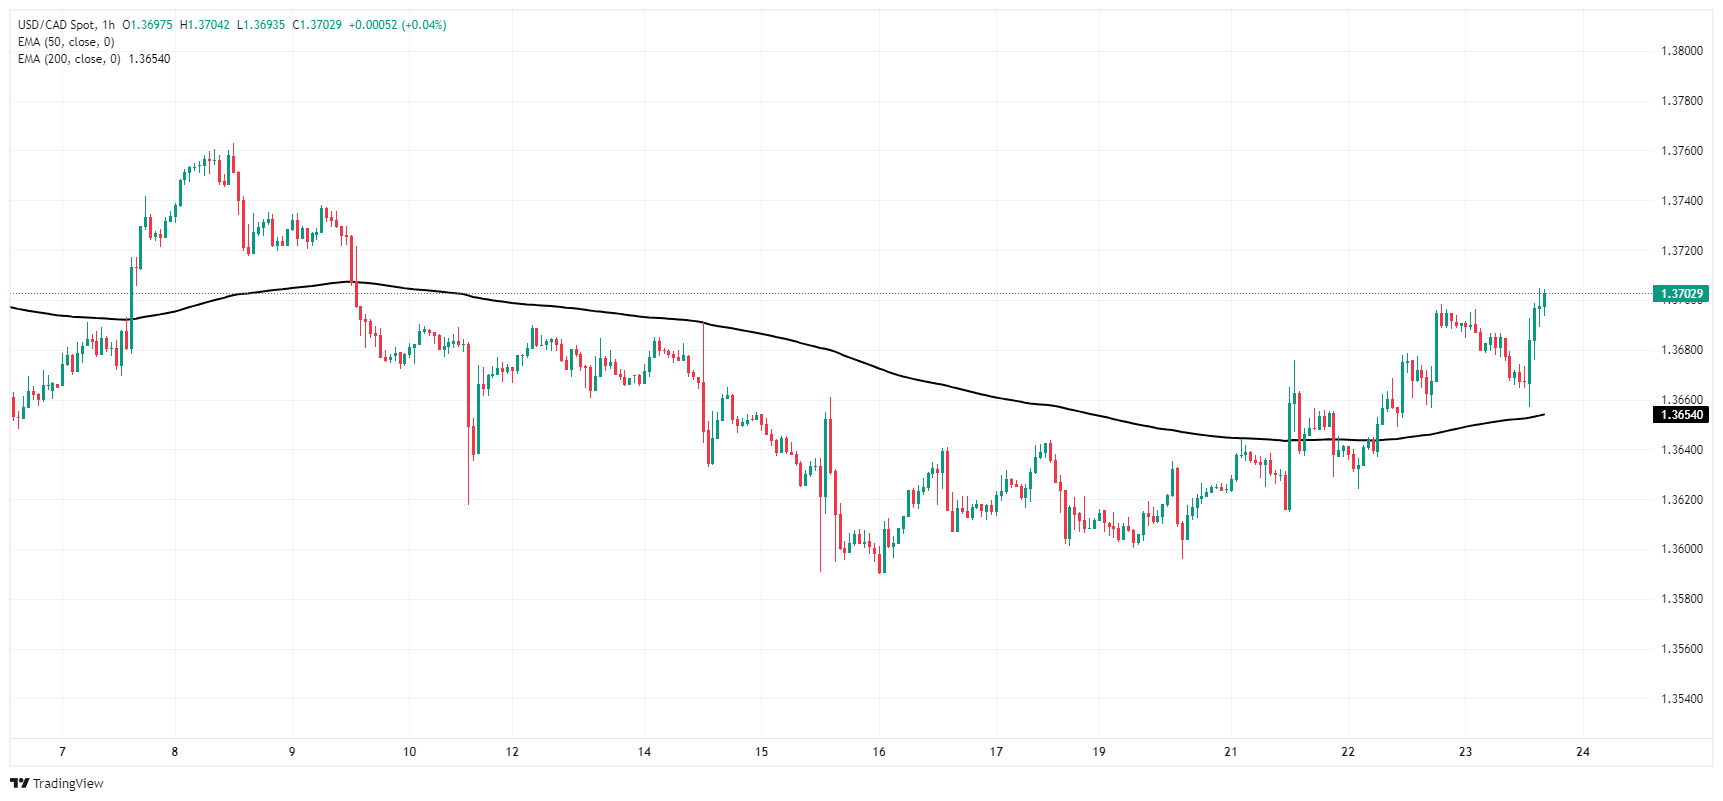
USD/CAD daily chart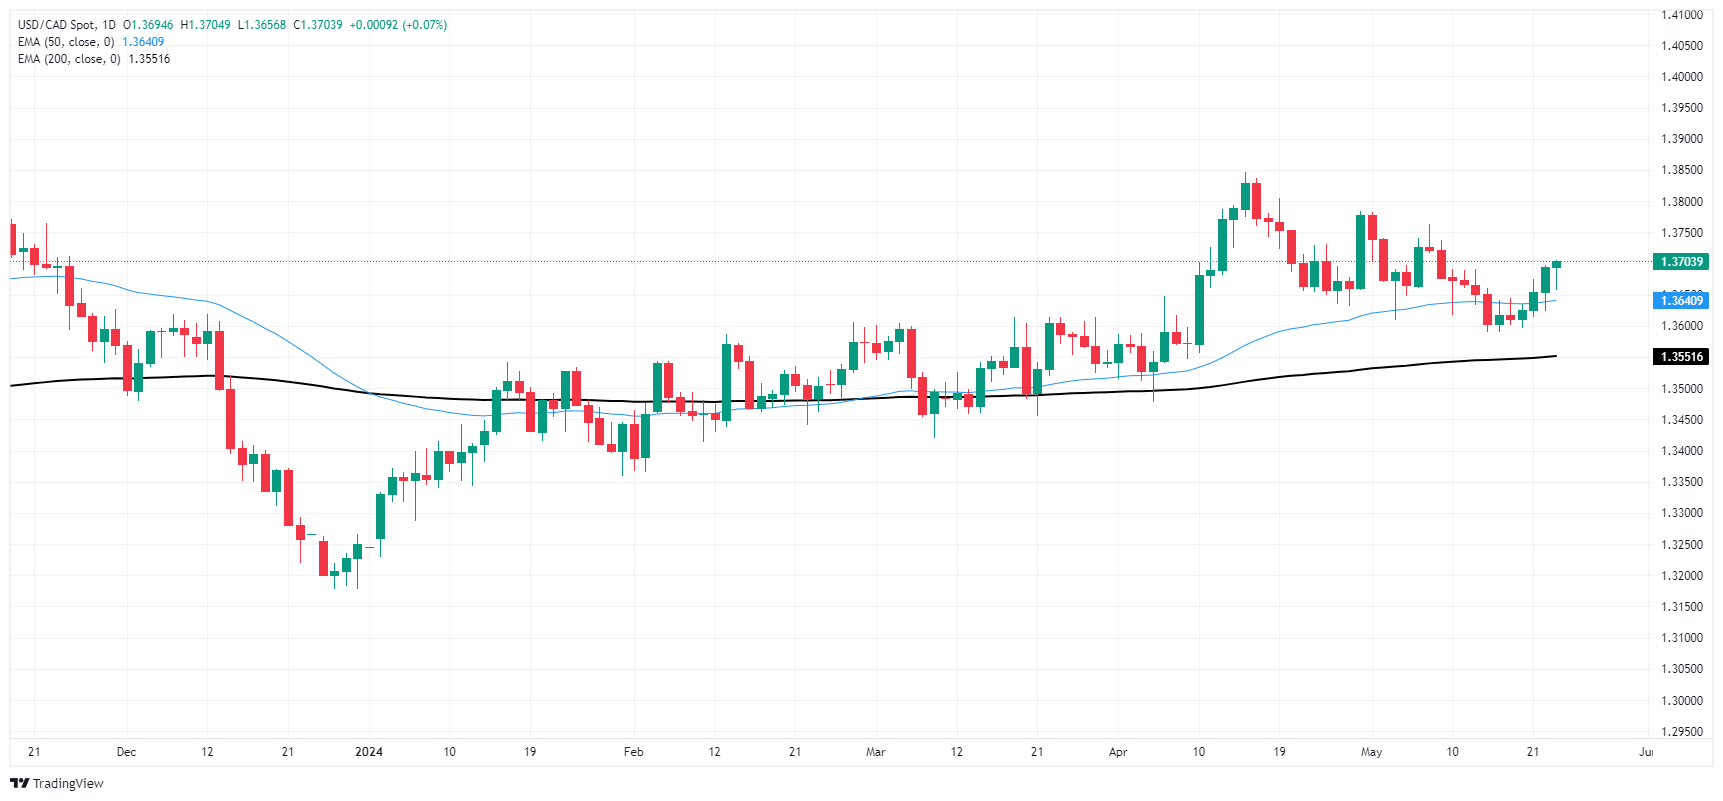
Canadian Dollar FAQs
The key factors driving the Canadian Dollar (CAD) are the level of interest rates set by the Bank of Canada (BoC), the price of Oil, Canada’s largest export, the health of its economy, inflation and the Trade Balance, which is the difference between the value of Canada’s exports versus its imports. Other factors include market sentiment – whether investors are taking on more risky assets (risk-on) or seeking safe-havens (risk-off) – with risk-on being CAD-positive. As its largest trading partner, the health of the US economy is also a key factor influencing the Canadian Dollar.
The Bank of Canada (BoC) has a significant influence on the Canadian Dollar by setting the level of interest rates that banks can lend to one another. This influences the level of interest rates for everyone. The main goal of the BoC is to maintain inflation at 1-3% by adjusting interest rates up or down. Relatively higher interest rates tend to be positive for the CAD. The Bank of Canada can also use quantitative easing and tightening to influence credit conditions, with the former CAD-negative and the latter CAD-positive.
The price of Oil is a key factor impacting the value of the Canadian Dollar. Petroleum is Canada’s biggest export, so Oil price tends to have an immediate impact on the CAD value. Generally, if Oil price rises CAD also goes up, as aggregate demand for the currency increases. The opposite is the case if the price of Oil falls. Higher Oil prices also tend to result in a greater likelihood of a positive Trade Balance, which is also supportive of the CAD.
While inflation had always traditionally been thought of as a negative factor for a currency since it lowers the value of money, the opposite has actually been the case in modern times with the relaxation of cross-border capital controls. Higher inflation tends to lead central banks to put up interest rates which attracts more capital inflows from global investors seeking a lucrative place to keep their money. This increases demand for the local currency, which in Canada’s case is the Canadian Dollar.
Macroeconomic data releases gauge the health of the economy and can have an impact on the Canadian Dollar. Indicators such as GDP, Manufacturing and Services PMIs, employment, and consumer sentiment surveys can all influence the direction of the CAD. A strong economy is good for the Canadian Dollar. Not only does it attract more foreign investment but it may encourage the Bank of Canada to put up interest rates, leading to a stronger currency. If economic data is weak, however, the CAD is likely to fall.
- May’s PMI and weekly Jobless Claims data outperformed expectations and provided the USD with a lift.
- The USD is also registering gains following Wednesday’s relatively hawkish FOMC minutes.
- The odds of a cut in September continue to decline.
The US Dollar Index (DXY) is currently trading at 104.90, modestly higher, and managed to clear all its daily losses. This upward trajectory is driven by robust S&P surveys known as the Purchasing Managers Index (PMI) and encouraging weekly Jobless Claims figures, both indicative of a healthier US economy.
The US economy displays strength, and the Fed's cautious approach keeps the Greenback afloat. Next week’s US Personal Consumption Expenditures (PCE) figures for April will determine the short-term trajectory.
Daily digest market movers: DXY strengthens on upbeat PMI data
- S&P Global Manufacturing PMI for the US increased to 50.9 in May, up on a monthly basis from 50.0 in April, surpassing economists' forecast of 50.0.
- Service sector PMI rose to 54.8 from 51.3 in the previous month, exceeding the prediction of 51.3 on a monthly basis.
- Composite PMI for May was reported at 54.4, a significant leap on a monthly basis from 51.3 in April, and surpassed the anticipated decline to 51.1.
- US Department of Labor reports 215K employment insurance beneficiaries in the week ending May 18, lower than the estimated 220K and the prior week's figure of 223K, implying a resilient labor market.
- Fed maintains a reserved approach toward monetary policy alterations while advocating for continued patience before starting cutting.
- Odds of a cut in the September meeting declined below 40%, according to the CME FedWatch Tool.
DXY technical analysis: DXY faces a conflicting medium-term outlook as bears and bulls tussle for dominance
The indicators on the daily chart reflect a sort of stalemate between bullish and bearish perspectives. Despite the bears working to gain ground, the index remains above the 100 and 200-day Simple Moving Averages (SMAs), a strong testament to the presence and resiliency of buying momentum. However, the Relative Strength Index (RSI) flirting with negative territory suggests that a bearish pinch may be on the way.
Moreover, the Moving Average Convergence Divergence (MACD) presents flat red bars, a neutral to bearish sign that could indicate a potential shift in momentum or continued sideways movement.
US Dollar FAQs
The US Dollar (USD) is the official currency of the United States of America, and the ‘de facto’ currency of a significant number of other countries where it is found in circulation alongside local notes. It is the most heavily traded currency in the world, accounting for over 88% of all global foreign exchange turnover, or an average of $6.6 trillion in transactions per day, according to data from 2022. Following the second world war, the USD took over from the British Pound as the world’s reserve currency. For most of its history, the US Dollar was backed by Gold, until the Bretton Woods Agreement in 1971 when the Gold Standard went away.
The most important single factor impacting on the value of the US Dollar is monetary policy, which is shaped by the Federal Reserve (Fed). The Fed has two mandates: to achieve price stability (control inflation) and foster full employment. Its primary tool to achieve these two goals is by adjusting interest rates. When prices are rising too quickly and inflation is above the Fed’s 2% target, the Fed will raise rates, which helps the USD value. When inflation falls below 2% or the Unemployment Rate is too high, the Fed may lower interest rates, which weighs on the Greenback.
In extreme situations, the Federal Reserve can also print more Dollars and enact quantitative easing (QE). QE is the process by which the Fed substantially increases the flow of credit in a stuck financial system. It is a non-standard policy measure used when credit has dried up because banks will not lend to each other (out of the fear of counterparty default). It is a last resort when simply lowering interest rates is unlikely to achieve the necessary result. It was the Fed’s weapon of choice to combat the credit crunch that occurred during the Great Financial Crisis in 2008. It involves the Fed printing more Dollars and using them to buy US government bonds predominantly from financial institutions. QE usually leads to a weaker US Dollar.
Quantitative tightening (QT) is the reverse process whereby the Federal Reserve stops buying bonds from financial institutions and does not reinvest the principal from the bonds it holds maturing in new purchases. It is usually positive for the US Dollar.
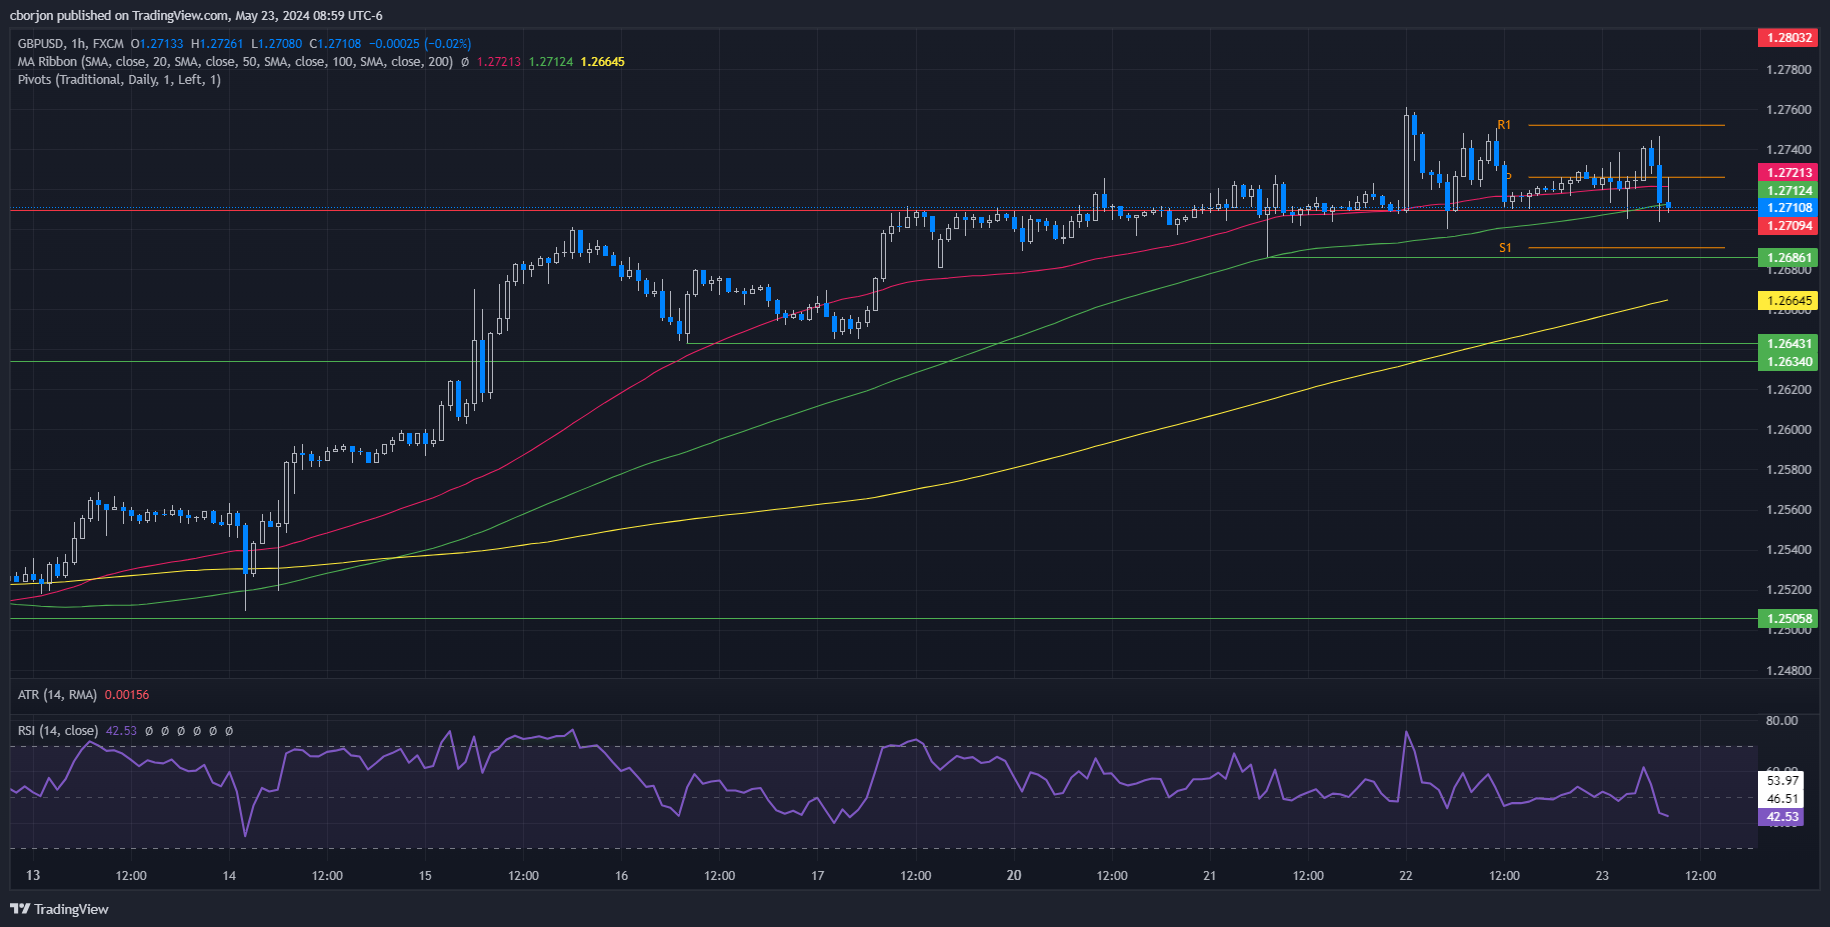
- GBP/USD slides 0.04%, peaking at 1.2746 in early North American trading.
- Technicals show a bearish trend with a 'shooting star' pattern and momentum with sellers.
- Support on May 21 low of 1.2686, May 16 low of 1.2643, and 1.2600 psychological level.
- Resistance at 50-hour SMA (1.2721), 100-hour SMA (1.2712), weekly high of 1.2761; potential target at 1.2800.
Early during the North American session, the British Pound dropped against the Greenback after data from the United States showed that business activity was picking up. Alongside that, inflationary pressures rose, sparking investors' fears that the Fed would delay cutting rates later during the year. The GBP/USD trades at 1.2711 after hitting a high of 1.2746, down 0.04%
GBP/USD Price Analysis: Technical outlook
The GBP/USD edges are lower after printing a ‘shooting star’ on Wednesday, a prelude to lower prices. Today’s price action witnessed a jump toward a high of 1.2750, but it still failed to crack the current week’s high of 1.2761, which opened the door for further losses.
In the short term, the GBP/USD one-hour chart suggests the pair is range-bound, capped on the upside by the 50-hour SMA at 1.2721 and the 100-hour SMA at 1.2712. However, momentum supports sellers, as shown by the Relative Strength Index (RSI), which remains bearish and hovers at its lowest level since May 17.
Therefore, if the major drops beneath 1.2700, the next support would be the May 21 low of 1.2686, followed by the May 16 low of 1.2643 and the psychological 1.2600 mark.
Conversely, if buyers lift the exchange rate above 1.2746, that will sponsor a test of the weekly high of 1.2761. Further strength and the pair could aim for 1.2800.
GBP/USD Price Action – Hourly Chart
- AUD/USD gives up majority of intraday gains as the US Dollar revives after upbeat US early PMI report for May.
- The pace at which the US PMI expanded was the fastest pace in more than two years.
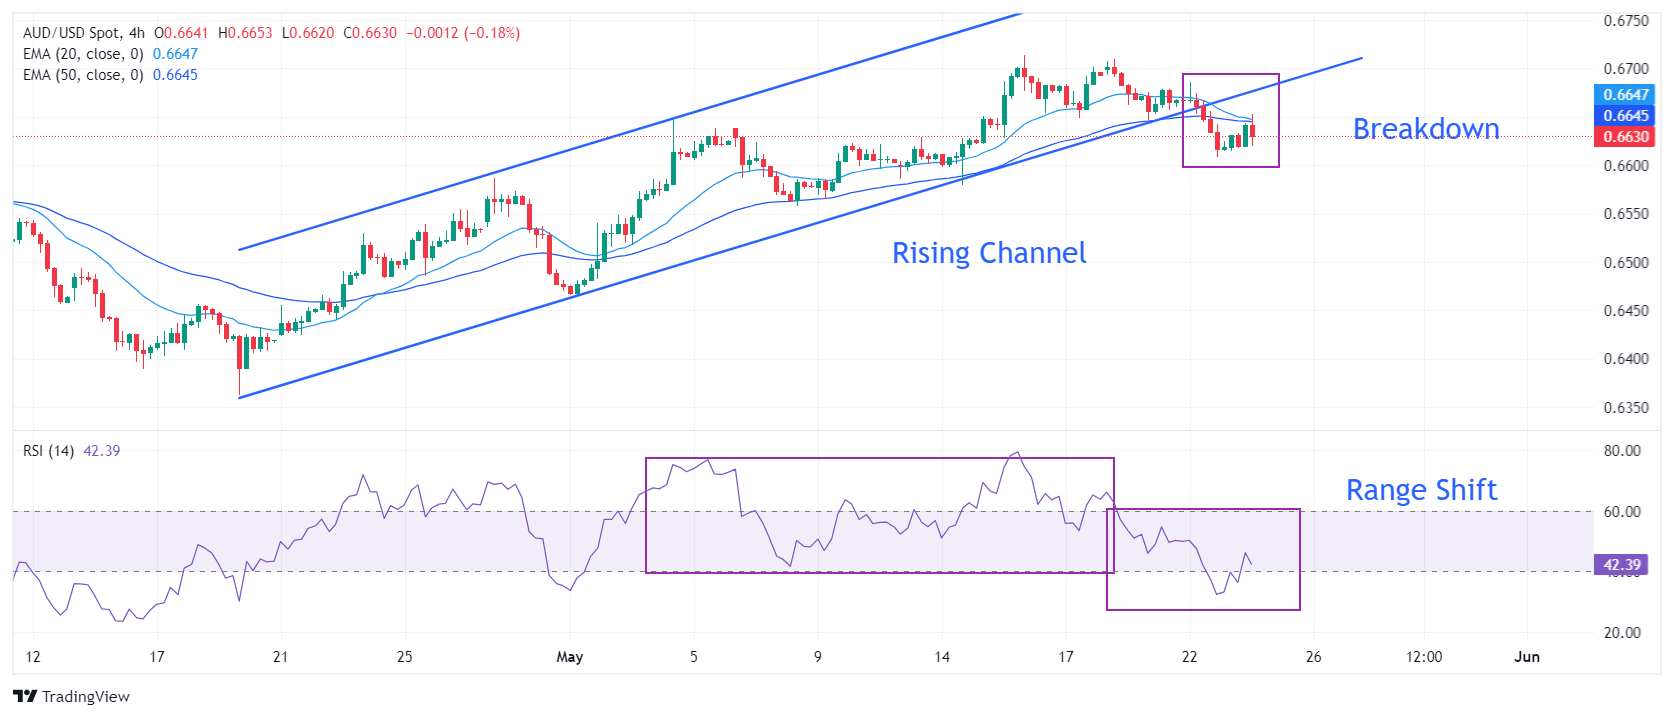
- AUD/USD turns volatile after a Rising Channel breakdown.
The AUD/USD pair retreats from the intraday high of 0.6650 in Thursday’s New York session. The Aussie asset comes under pressure as the US Dollar witnesses a strong buying interest after the S&P Global published an upbeat preliminary United States (US) PMI report for May. The US Dollar Index (DXY), which tracks the Greenback’s value against six major currencies, recovers entire intraday losses and jumps to 104.90.
According to the early US PMI report, Manufacturing PMI rose to 50.9, outperforming expectations and the prior reading of 50.0. The Services PMI also beat the consensus, jumped to 54.8 from the estimates and the former release of 51.3. The agency noted that the pace at which PMI increased was fastest in more than two years and the economy is on track to post a strong Gross Domestic Product (GDP) gain.
Strong preliminary PMI reading has dent investors’ confidence about the Federal Reserve (Fed) that it will begin reducing interest rates from their current levels in the September meeting. The CME FedWatch tool shows that traders see a 53% chance for the Fed lowering borrowing rates in September, which has come down from 58% after the release of the early PMI report.
Meanwhile, the Australian Dollar fails to maintain a firm-footing despite the communication from Reserve Bank of Australia (RBA) policymakers through May policy minutes was hawkish. The RBA minutes indicated that the board also discussed raising interest rates again.
AUD/USD has come under pressure after a breakdown of the Rising Channel chart pattern formed on a four-hour timeframe. A breakdown of the above-mentioned pattern suggests an establishment of a bearish reversal. The near-term outlook of the Aussie asset would worsen as the 20- and 50-period Exponential Moving Averages (EMAs) are on the verge of delivering a bearish crossover.
The 14-period Relative Strength Index (RSI) has shifted into the 20.00-60.00 range from the 40.00-80.00 zone, suggesting a bearish reversal.
More downside will appear if he major breaks below May 22 low at 0.6608, which will expose it to May 14 low at 0.6580, followed by May 1 high at 0.6540.
On the flip side, a decisive move above May’s high at 0.6714 will drive the asset towards January 3 high at 0.6771 and the round-level resistance of 0.6800
AUD/USD four-hour chart
Economic Indicator
S&P Global Composite PMI
The S&P Global Composite Purchasing Managers Index (PMI), released on a monthly basis, is a leading indicator gauging US private-business activity in the manufacturing and services sector. The data is derived from surveys to senior executives. Each response is weighted according to the size of the company and its contribution to total manufacturing or services output accounted for by the sub-sector to which that company belongs. Survey responses reflect the change, if any, in the current month compared to the previous month and can anticipate changing trends in official data series such as Gross Domestic Product (GDP), industrial production, employment and inflation. The index varies between 0 and 100, with levels of 50.0 signaling no change over the previous month. A reading above 50 indicates that the private economy is generally expanding, a bullish sign for the US Dollar (USD). Meanwhile, a reading below 50 signals that activity is generally declining, which is seen as bearish for USD.
Read more.Last release: Thu May 23, 2024 13:45 (Prel)
Frequency: Monthly
Actual: 54.4
Consensus: 51.1
Previous: 51.3
Source: S&P Global
- USD/CAD recovers from early weakness on Thursday after the release of US PMI data beats estimates in May.
- The Services PMI beat which may be critical to interest-rate expectations given the sector was singled out as an inflation hotspot by the Fed.
- The Bank of Canada is expected to cut interest rates in either June or July – the Fed not till September at the earliest.
USD/CAD is trading in the 1.3680s at the time of writing after a sharp rise following the release of preliminary US Purchasing Manager Index (PMI) data for both the Services and Manufacturing sector. The PMI survey data showed a higher-than-expected reading in May, indicating an expansion of economic activity that bodes well for the US Dollar (USD) and gives USD/CAD an extra boost.
US S&P Global Manufacturing PMI came out at 50.9 in May, up from the 50.0 in April and the 50.0 forecast by economists. Services PMI, meanwhile, rose to 54.8 from 51.3 in the previous month and 51.3 forecast. Composite PMI came out at 54.4 in May, up from 51.3 in April – and beating the decline to 51.1 economists had expected.
The higher-than-expected Services PMI data, in particular, will have supported the US Dollar (USD) as the Federal Reserve (Fed) has highlighted Services-sector inflation as a key hotspot in the economy that needs to cool down before it moves to cut interest rates. The maintenance of higher interest rates supports the USD since it attracts higher inflows of foreign capital compared to lower interest rates.
USD/CAD had been trading significantly down for the day prior to the data on the back of a mixture of higher Crude Oil prices (CAD positive), positive risk appetite (CAD positive), better-than-expected Canadian Housing data and technical chart resistance. Following the data, however, it made up a substantial portion of its earlier losses.
The Canadian Dollar (CAD) is likely to see limited upside against the US Dollar (USD) putting a floor under downside for the pair, as interest rate differentials, a key FX driver, remain favorable for USD. Recent Canadian inflation data for the month of April showed price pressures cooling in line with analysts’ estimates. The data brought the date when the Bank of Canada (BoC) is likely to cut interest rates closer. The money markets are pricing in a 53% chance of a 25 basis point (bps) cut in June, while the possibility of a July rate cut is fully priced in.
The US Federal Reserve (Fed) in contrast keeps delaying an expected cut in interest rates. Most recently, the Minutes from the Fed’s April-May meeting revealed that policymakers thought interest rates should remain at their current level “at least until September,” and even discussed the possibility that they might need to be increased. A key determining factor for the course of future policy would be the evolution of the labor market, they added.
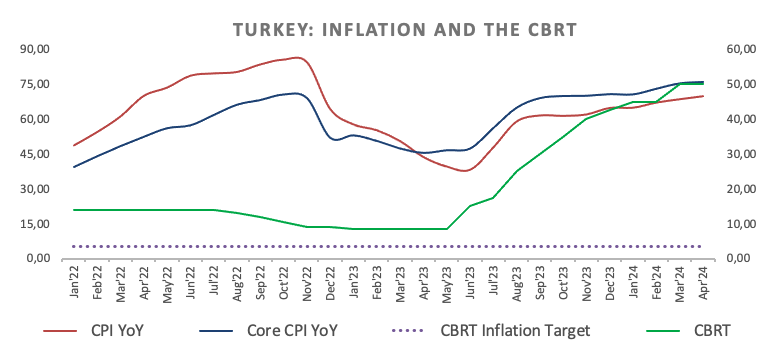
- The Turkish lira depreciates slightly around 32.20 vs. the Dollar.
- The CBRT kept the One-Week Repo Rate unchanged at 50.0%.
- The central bank sees a disinflationary scenario in H2 2024.
The Turkish lira maintains its consolidative phase well in place on Thursday, hovering around the low-32.00s in the wake of the CBRT’s interest rate decision.
USD/TRY faces extra consolidation in the near term
So far, there have been no changes to the side-lined theme around the Turkish currency, which has remained trapped within the 32.00–32.60 range since mid-March.
On Thursday, the Turkish central bank (CBRT) maintained its One-Week Repo Rate unchanged at 50.00%, as broadly anticipated.
The CBRT stated that its decision on rates came after taking into account the delayed impacts of monetary tightening, adding that it is closely monitoring the effects on credit conditions and domestic demand.
In the statement, the bank emphasized its vigilance regarding inflation risks, citing a "limited decline in the underlying trend of monthly inflation in April."
In addition, the bank also indicated that it would tighten its policy stance if a significant and persistent increase in inflation was anticipated.
Moving forward, market expectations see a nearly 72 bps increase at the bank’s next gathering on June 27.
It is worth noting that headline inflation in Türkiye rose by 69.80 in the year to April.
USD/TRY key levels to watch
So far, the pair is advancing 0.10% to 32.1950 and faces the next up barrier at the all-time high of 32.6461 (April 19). On the flip side, a break below the weekly low of 31.9722 (April 29) would expose another weekly bottom of 31.7390 (March 21) and finally the temporary 100-day SMA of 31.4788.
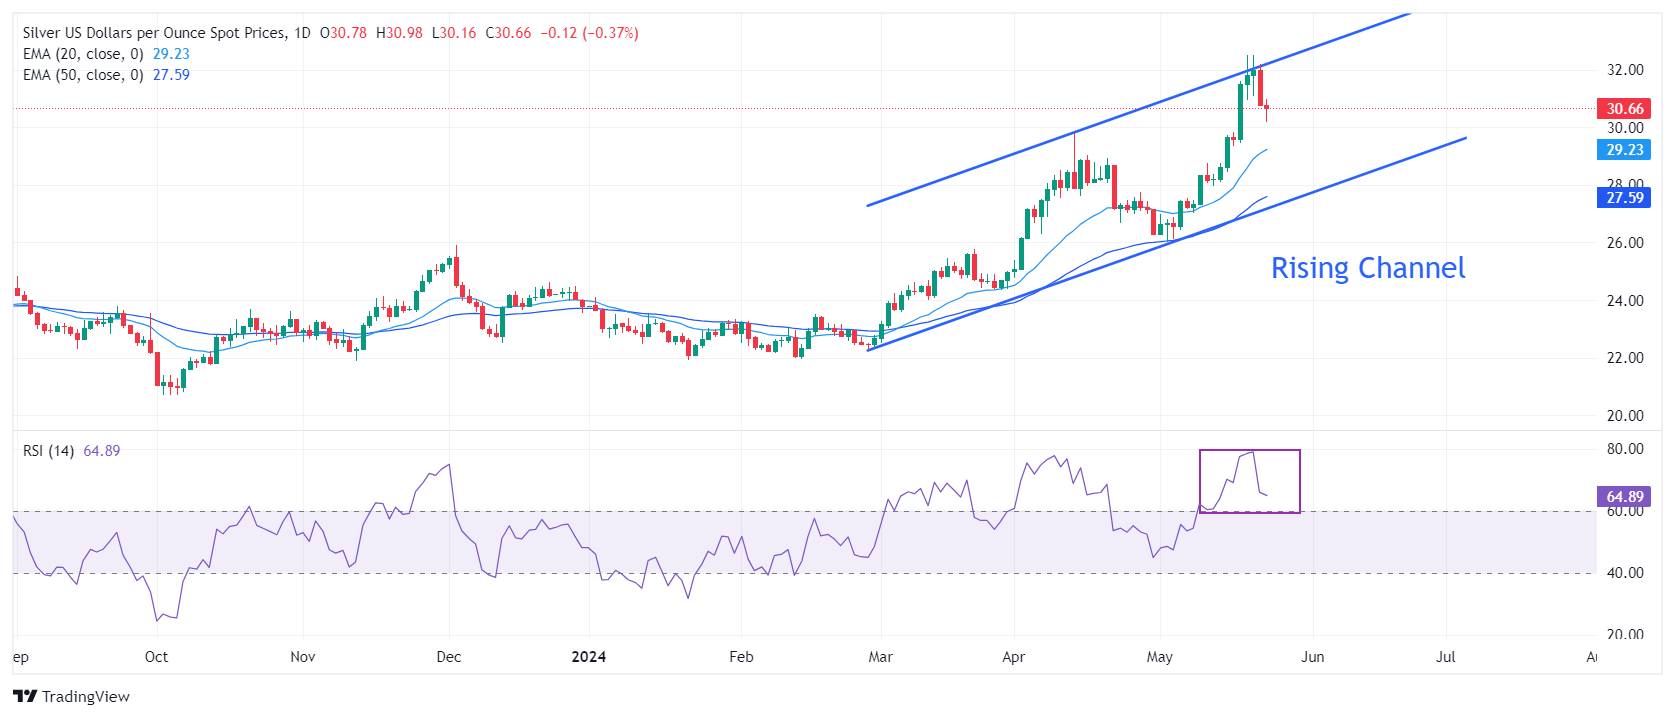
- Silver price finds cushion near $30.20 as investors had already priced in hawkish interest rate guidance in FOMC minutes.
- US weekly jobless claims were lower at 215K from the estimates of 220K in the week ending May 17.
- The US Dollar and bond yields remain under pressure on firm Fed rate-cut prospects.
Silver price (XAU/USD) stabilizes near $30.20 after a vertical downfall in Thursday’s New York session. The sharp downside in the white metal was driven by hawkish Federal Open market Committee (FOMC) minutes of the May policy meeting, which indicated that officials also discussed over hiking interest rates again as progress in the disinflation process stalled in the first quarter of the year.
However, the impact of the hawkish FOMC communication is supposed to be temporary on bullions as views of policymakers were based on stubborn higher inflation data of the first quarter of this year. The consumer price inflation data for April was declined as expected and indicated that price pressures are on course to return to the desired rate of 2%.
10-year US Treasury yields drop to 4.42% as soft inflation data is an unfavorable scenario for interest rates remaining higher for a longer period. A decline in yields on interest-bearing assets diminishes the opportunity cost of holding an investment in non-yielding assets such as Silver.
The US Dollar Index (DXY) is down by 0.2%, trades near 104.70 as investors remain firm that the Federal Reserve (Fed) will start reducing interest rates from the September meeting.
The USD Index struggles to stabilize despite the United States (US) Department of Labor has posted lower Initial Jobless Claims than estimates for the week ending May 17. Number of individuals claiming jobless benefits for the first time were lower at 215K from the estimates of 220K.
Silver technical analysis
Silver price trades in a Rising Channel chart pattern formed on a daily timeframe in which each pullback move is considered as a buying opportunity by the market participants. Upward-sloping 20 and 50-day Exponential Moving Averages (EMAs) suggest that the near-term trend is bullish.
The 14-period Relative Strength Index (RSI) oscillates in the bullish range of 60.00-80.00, indicating that momentum has leaned on the upside.
Silver daily chart
- Initial Jobless Claims rose by 215K vs. the previous week.
- Continuing Jobless Claims rose by almost 1.8M.
US citizens that applied for unemployment insurance benefits increased by 215K in the week ending May 18 according to the US Department of Labor (DoL) on Thursday. The prints came in short of initial estimates (220K) and below the previous weekly gain of 223K (revised from 232K).
Further details of the publication revealed that the advance seasonally adjusted insured unemployment rate was 1.2% and the 4-week moving average stood at 219.75, an increase of 1.75K from the previous week's revised average.
In addition, Continuing Claims increased by 8K to 1.794M in the week ended May 11.
Market reaction
The US Dollar Index (DXY) maintains its negative bias so far on Thursday, coming under pressure after hitting multi-day peaks near the 105.00 barrier in the previous session. The corrective decline in the Greenback also comes amidst a mixed performance of US yields across the curve.
- Oil is in a short-term downtrend but is showing signs that could be early evidence of a reversal.
- Oil has formed a bullish Doji candlestick reversal pattern at the day’s lows which could hail a stronger recovery.
- A break above the major trendline would be required for confirmation – as things stand the downtrend remains intact.
West Texas Intermediate (WTI) US Crude Oil is trading up over a percent at $78.01 on Thursday.
The commodity is in a short-term downtrend on the 4-hour chart (below) which given the old saying “the trend is your friend” would be expected to continue, favoring shorts over longs.
WTI Oil, however, is showing some early bullish reversal signs. It formed a Doji Japanese candle at Thursday’s 76.74 lows (shaded rectangle). This was followed by two bullish candles in a row. Although it is too early to say for sure, the candlestick formation could be an indication of a short-term change of trend.
Oil 4-hour Chart
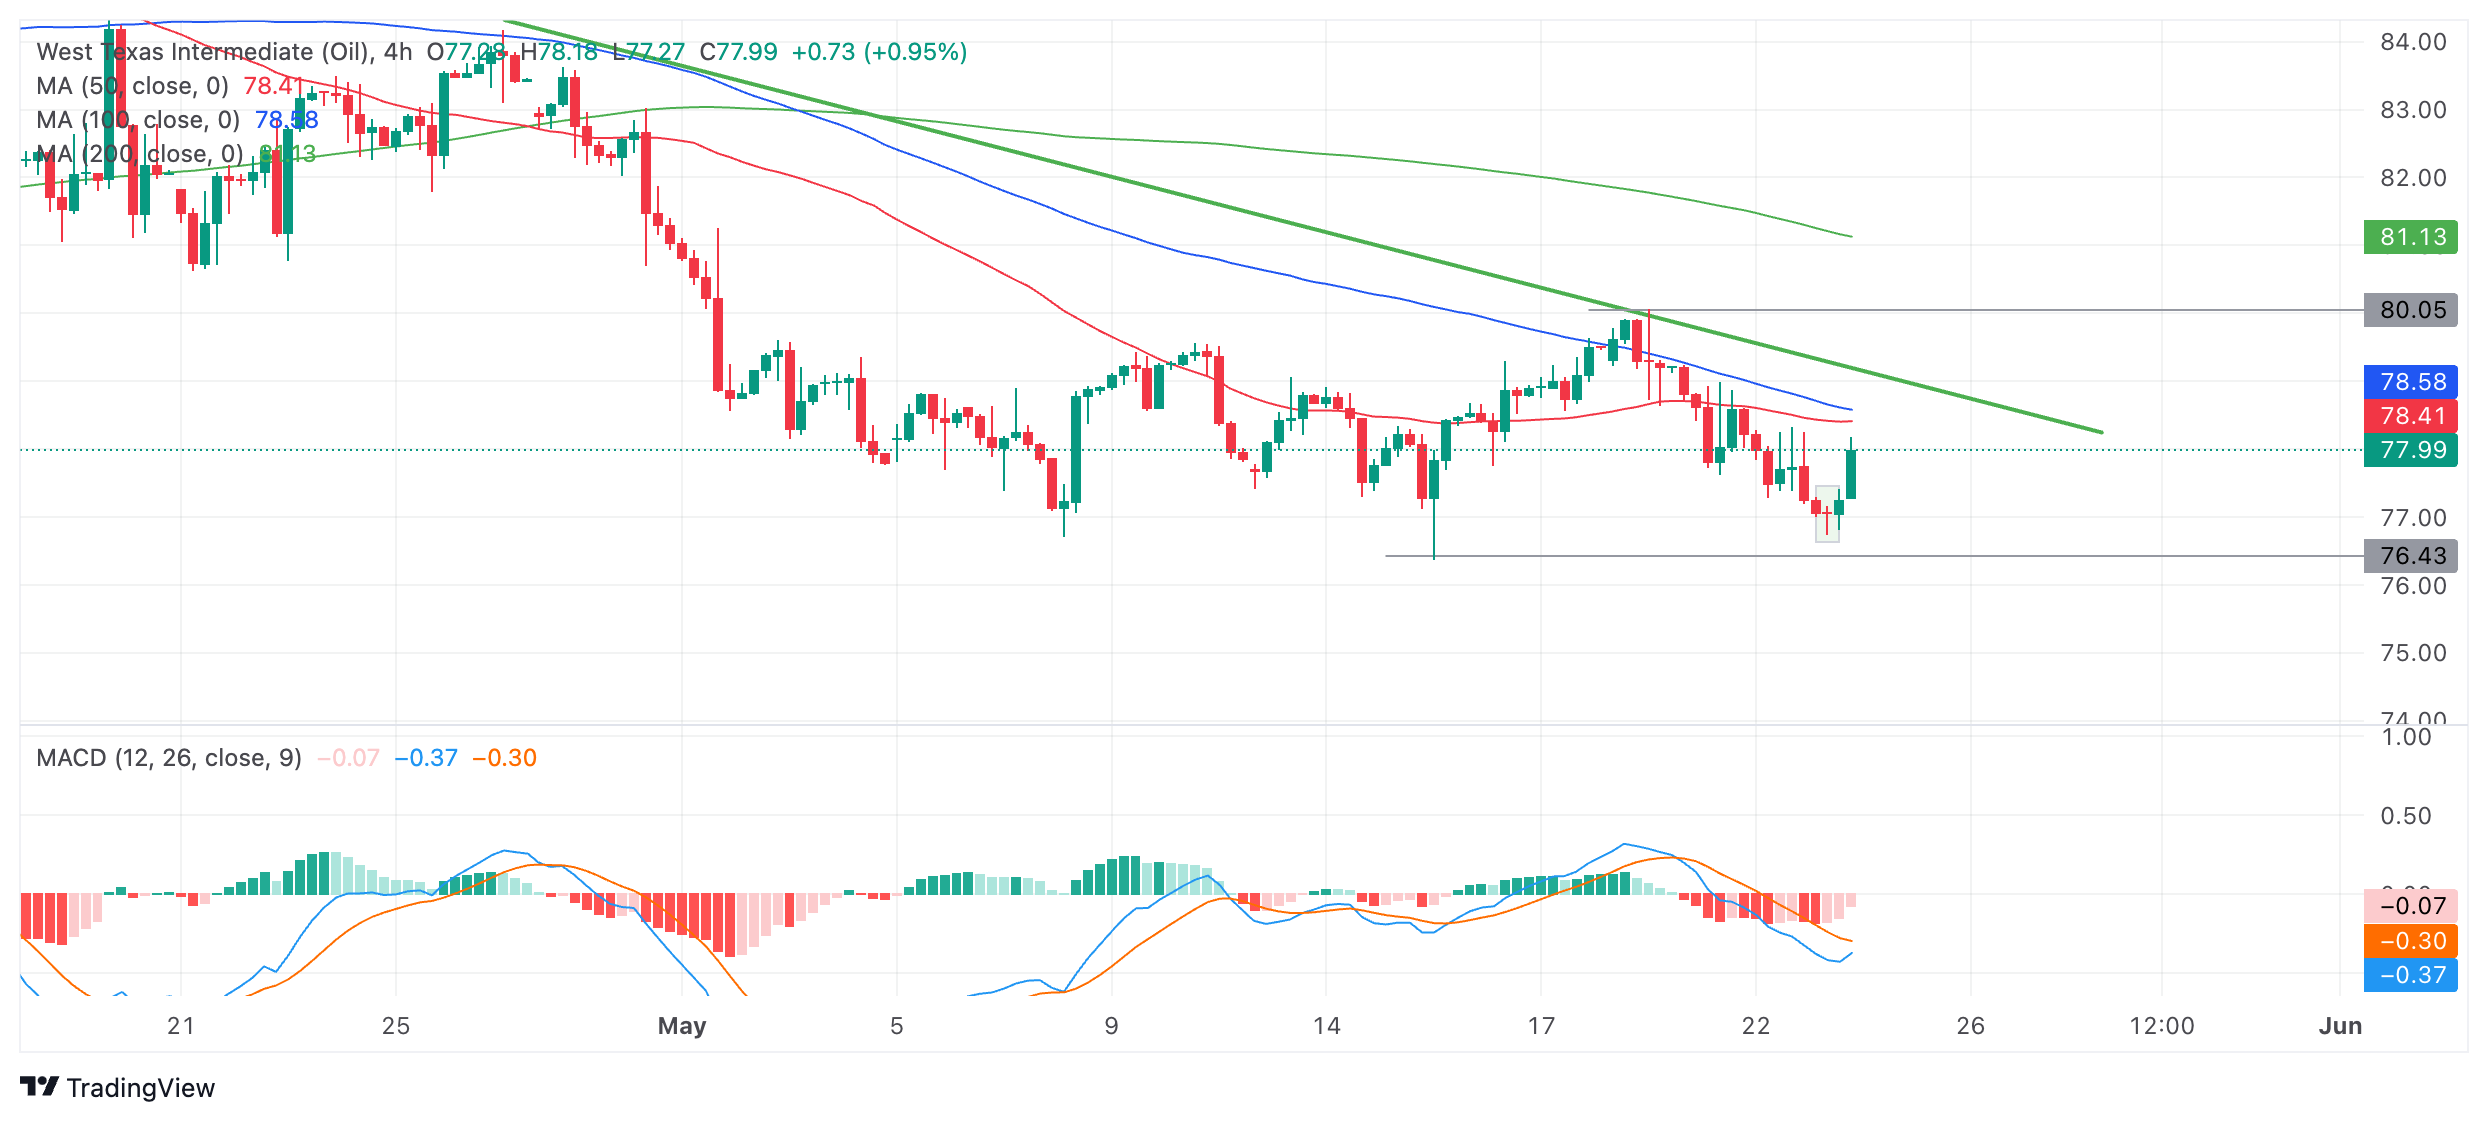
If Oil can continue rising up and definitively pierce above the green down trendline at roughly $79.00 it would be a sign that the short-term trend had reversed.
A definitive break above the trendline would be one accompanied by a longer-than-average green candle that closed near its highs or three green candles in a row that broke above the trendline.
Such a break would be expected to climb to a target at about $80.00, the resistance level of the May 20 lower high.
The Moving Average Convergence Divergence (MACD) momentum indicator is below the zero-line indicating a bearish environment. The blue MACD line is looking like it is about to cross above its red signal line, however, which would give a buy signal in line with the possibility of a reversal indicated by the Japanese candlestick pattern.
Alternatively, a capitulation and continuation of the still-intact downtrend would see WTI Oil price extend lower. A break below the May 15 monthly low at $76.38 would add confirmation to the bear trend and probably result in a move down to support from an older low at roughly $75.75 initially, with deeper declines attacking major historic support at $71.50.
- The US Dollar has entered a patch of volatility since the Fed Minutes release.
- Markets will be chasing PMI’s from several countries throughout the day.
- The US Dollar Index trades just below 105.00 and could snap above if US PMI surprises.
The US Dollar (USD) is in the red after earlier being in the green when it had gained momentum after the release of the US Federal Reserve (Fed) Minutes overnight, which frightened markets after several concerns were communicated on inflation by Fed officials in the paper. Markets got scared and started to head into safe havens like the Greenback. Although Nvidia earnings pushed the Nasdaq higher, a general wave of Risk On was not rippling through markets where even the Chinese semiconductor index crashed 2% in the Asia-Pacific session.
On the economic data front, a very packed agenda where markets can again revalue currencies next to each other with both European, United Kingdom’s and US Purchase Manager Index numbers for May. This will give traders a base of comparison and might see these currencies move against each other higher or lower. Besides that, weekly Jobless numbers and some Fed Activity indicators could add fuel to the fire.
Daily digest market movers: Comparing performances
- German Services Purchase Managers Index (PMI) surprised with an upbeat release of 53.9 against 53.2 for April, where 53.5 was expected for May. The move is particularly supportive for the Euro with Germany being labelled ‘the sick man in Europe’ these past few months.
- French Services PMI stole a bit of the boost from Germany’s outperformance, because it fell back into contraction from April’s 51.3 to 49.4 against an expected 51.7 for May.
- The US data kicks off at 12:30 GMT:
- Chicago Fed National Activity Index for April will be released. The March number was at 0.15.
- The weekly Jobless Claims are due to be released:
- Initial Jobless Claims expected to stay steady from 222,000 to 220,000.
- Continuing Jobless Claims were last week at 1.794 million, with no forecast pencilled in.
- The S&P Global preliminary PMI release for May is expected near 13:45 GMT:
- Manufacturing PMI should remain stable at 50.
- Services PMI should remain stable as well at 51.3.
- The Composite should ease a touch from 51.3 in the final April’s reading to 51.1.
- Near 14:00 GMT, New Home Sales are expected to ease a touch from 0.693 million to 0.680 million for April.
- The Kansas Fed Manufacturing Activity for May will come out at 15:00 GMT. The previous number was at -13, no consensus available.
- To close off this Thursday, Federal Reserve Bank of Atlanta President Raphael Bostic participates in a Q&A session with students in a MBA macroeconomic class at the Stanford Graduate School of Business near 19:00 GMT.
- Equities are very mixed with the Hong KongHang Seng down near 2% near its closing bell. The European equities are up near 0.50% while US equities are in the green ahead of the US opening bell.
- The CME Fedwatch Tool is pricing 95.8% for no change in the policy rate for June. September futures are now seeing a 49.7% chance for a 25-basis-points cut.
- The benchmark 10-year US Treasury Note trades around 4.44%, near the high for this week.
US Dollar Index Technical Analysis: Surge in volatility
The US Dollar Index (DXY) attempted to surge towards 105.00, though saw its rally stalling just ahead of the number. The move comes after markets got concerned when reading that several Fed members had issued concerns on current inflation levels in the recent Fed Minutes. Markets were disregarding the fact that these Minutes are already nearly a month old and in the meantime several data elements have proven that disinflation is back on track, which could mean that the DXY is set to ease further from here.
On the upside, the DXY Index has broken two technical elements which were keeping price action in check on the topside. The first level was the 55-day Simple Moving Average (SMA) at 104.78 and secondly that red descending trend line crossing at 104.79 on Wednesday . From now further up, the following levels to consider are 105.12 and 105.52.
On the downside, the 100-day SMA around 104.25 is the last man supporting the decline. Once that level snaps, an air pocket is placed between 104.11 and 103.00. Should the US Dollar decline persist, the low of March at 102.35 and the low from December at 100.62 are levels to consider.
US Dollar FAQs
The US Dollar (USD) is the official currency of the United States of America, and the ‘de facto’ currency of a significant number of other countries where it is found in circulation alongside local notes. It is the most heavily traded currency in the world, accounting for over 88% of all global foreign exchange turnover, or an average of $6.6 trillion in transactions per day, according to data from 2022. Following the second world war, the USD took over from the British Pound as the world’s reserve currency. For most of its history, the US Dollar was backed by Gold, until the Bretton Woods Agreement in 1971 when the Gold Standard went away.
The most important single factor impacting on the value of the US Dollar is monetary policy, which is shaped by the Federal Reserve (Fed). The Fed has two mandates: to achieve price stability (control inflation) and foster full employment. Its primary tool to achieve these two goals is by adjusting interest rates. When prices are rising too quickly and inflation is above the Fed’s 2% target, the Fed will raise rates, which helps the USD value. When inflation falls below 2% or the Unemployment Rate is too high, the Fed may lower interest rates, which weighs on the Greenback.
In extreme situations, the Federal Reserve can also print more Dollars and enact quantitative easing (QE). QE is the process by which the Fed substantially increases the flow of credit in a stuck financial system. It is a non-standard policy measure used when credit has dried up because banks will not lend to each other (out of the fear of counterparty default). It is a last resort when simply lowering interest rates is unlikely to achieve the necessary result. It was the Fed’s weapon of choice to combat the credit crunch that occurred during the Great Financial Crisis in 2008. It involves the Fed printing more Dollars and using them to buy US government bonds predominantly from financial institutions. QE usually leads to a weaker US Dollar.
Quantitative tightening (QT) is the reverse process whereby the Federal Reserve stops buying bonds from financial institutions and does not reinvest the principal from the bonds it holds maturing in new purchases. It is usually positive for the US Dollar.
- USD/CHF edges down as US Dollar drops despite hawkish FOMC minutes.
- Preliminary US Manufacturing and Services PMI are estimated to grown steadily.
- The market sentiment is bullish amid firm Fed rate-cut bets.
The USD/CHF pair dips after facing selling pressure near 0.9140 in Thursday’s European session. The Swiss Franc asset comes under pressure as the US Dollar edges down amid firm speculation that the Federal Reserve (Fed) will start reducing interest rates from the September meeting. The market sentiment has improved due to firm Fed rate-cut prospects.
S&P 500 futures have posted significant gains in the London session, suggesting a sharp increase in investors’ risk-appetite. US yields have slumped as firm Fed rate-cut bets is an unfavorable scenario for them. 10-year US Treasury yields have dropped to 4.42%.
Investors remain confident that the Fed will return to policy normalization in September despite the message from officials in the Federal Open Market Committee (FOMC) minutes was clear that interest rates will remain steady at their current levels until they get greater confidence that inflation will sustainably decline to the desired rate of 2%.
The reason behind strong investors’ confidence on rate cuts is that the commentary from officials was based on stubbornly higher inflation in the first quarter of this year. However, the Consumer Price Index (CPI) report for April showed that price pressures declined in line with estimates.
Meanwhile, investors await the US preliminary S&P Global PMI data for May, which will be published at 13:45 GMT. The Manufacturing and Services PMI are forecasted to have remained unchanged at 50.0 and 51.3, respectively.
- Gold has fallen to a key trendline after the release of the FOMC meeting minutes.
- The minutes showed little enthusiasm from Fed officials to lower interest rates – a negative outcome for Gold.
- Gold’s short-term trend is now bearish but it has reached a major trendline and is finding support.
Gold (XAU/USD) has fallen over a half a percent to $2,360s on Thursday, reaching a major trendline on the chart (see chart in section below) where it is currently finding support.
The precious metal weakened after the release of the Federal Reserve (Fed) meeting Minutes, which revealed policymakers were reluctant to lower interest rates – and even discussed hiking them – due to persistent inflationary pressures.
The expectation that interest rates will remain at their current level (or higher) for an extended amount of time was bearish for Gold. As a non-yielding asset, higher interest rates increase the opportunity cost of holding Gold, reducing its attractiveness to investors.
Gold price continues bearish reversal after Fed Minutes
Gold declined sharply after the release of the Federal Open Market Committee (FOMC) meeting Minutes for the April 29-May 1 policy meeting on Wednesday.
The Minutes revealed that although policymakers expected price pressures to ease eventually, they had not fallen quickly enough to warrant a cut in the fed funds rate target range, which would remain at its 5.25% - 5.50% level “at least until September,” according to FXStreet.
The strength of the labor market emerged as a key determining factor for future policy. The Fed’s rate-setters even discussed the possibility of raising interest rates to tackle inflation. This added a more hawkish twist to the proceedings and echoed similar discussions in the Reserve Bank of Australia’s (RBA) meeting Minutes.
The Minutes catalyzed a rally in the US Dollar, which has a negative correlation with Gold.
The next major release for Gold is the US Purchasing Manager Index (PMI) data for May at 13:45 GMT on Thursday. If the data is positive it could have a negative impact on Gold, and vice-versa if it is weaker.
Technical Analysis: Gold declines to key trendline
Gold price (XAU/USD) has fallen to support from the dark-grey major trendline which reflects the uptrend since February.
Since the decline from the all-time highs, it is now probably in a short-term downtrend favoring short positions over longs.
XAU/USD Daily Chart
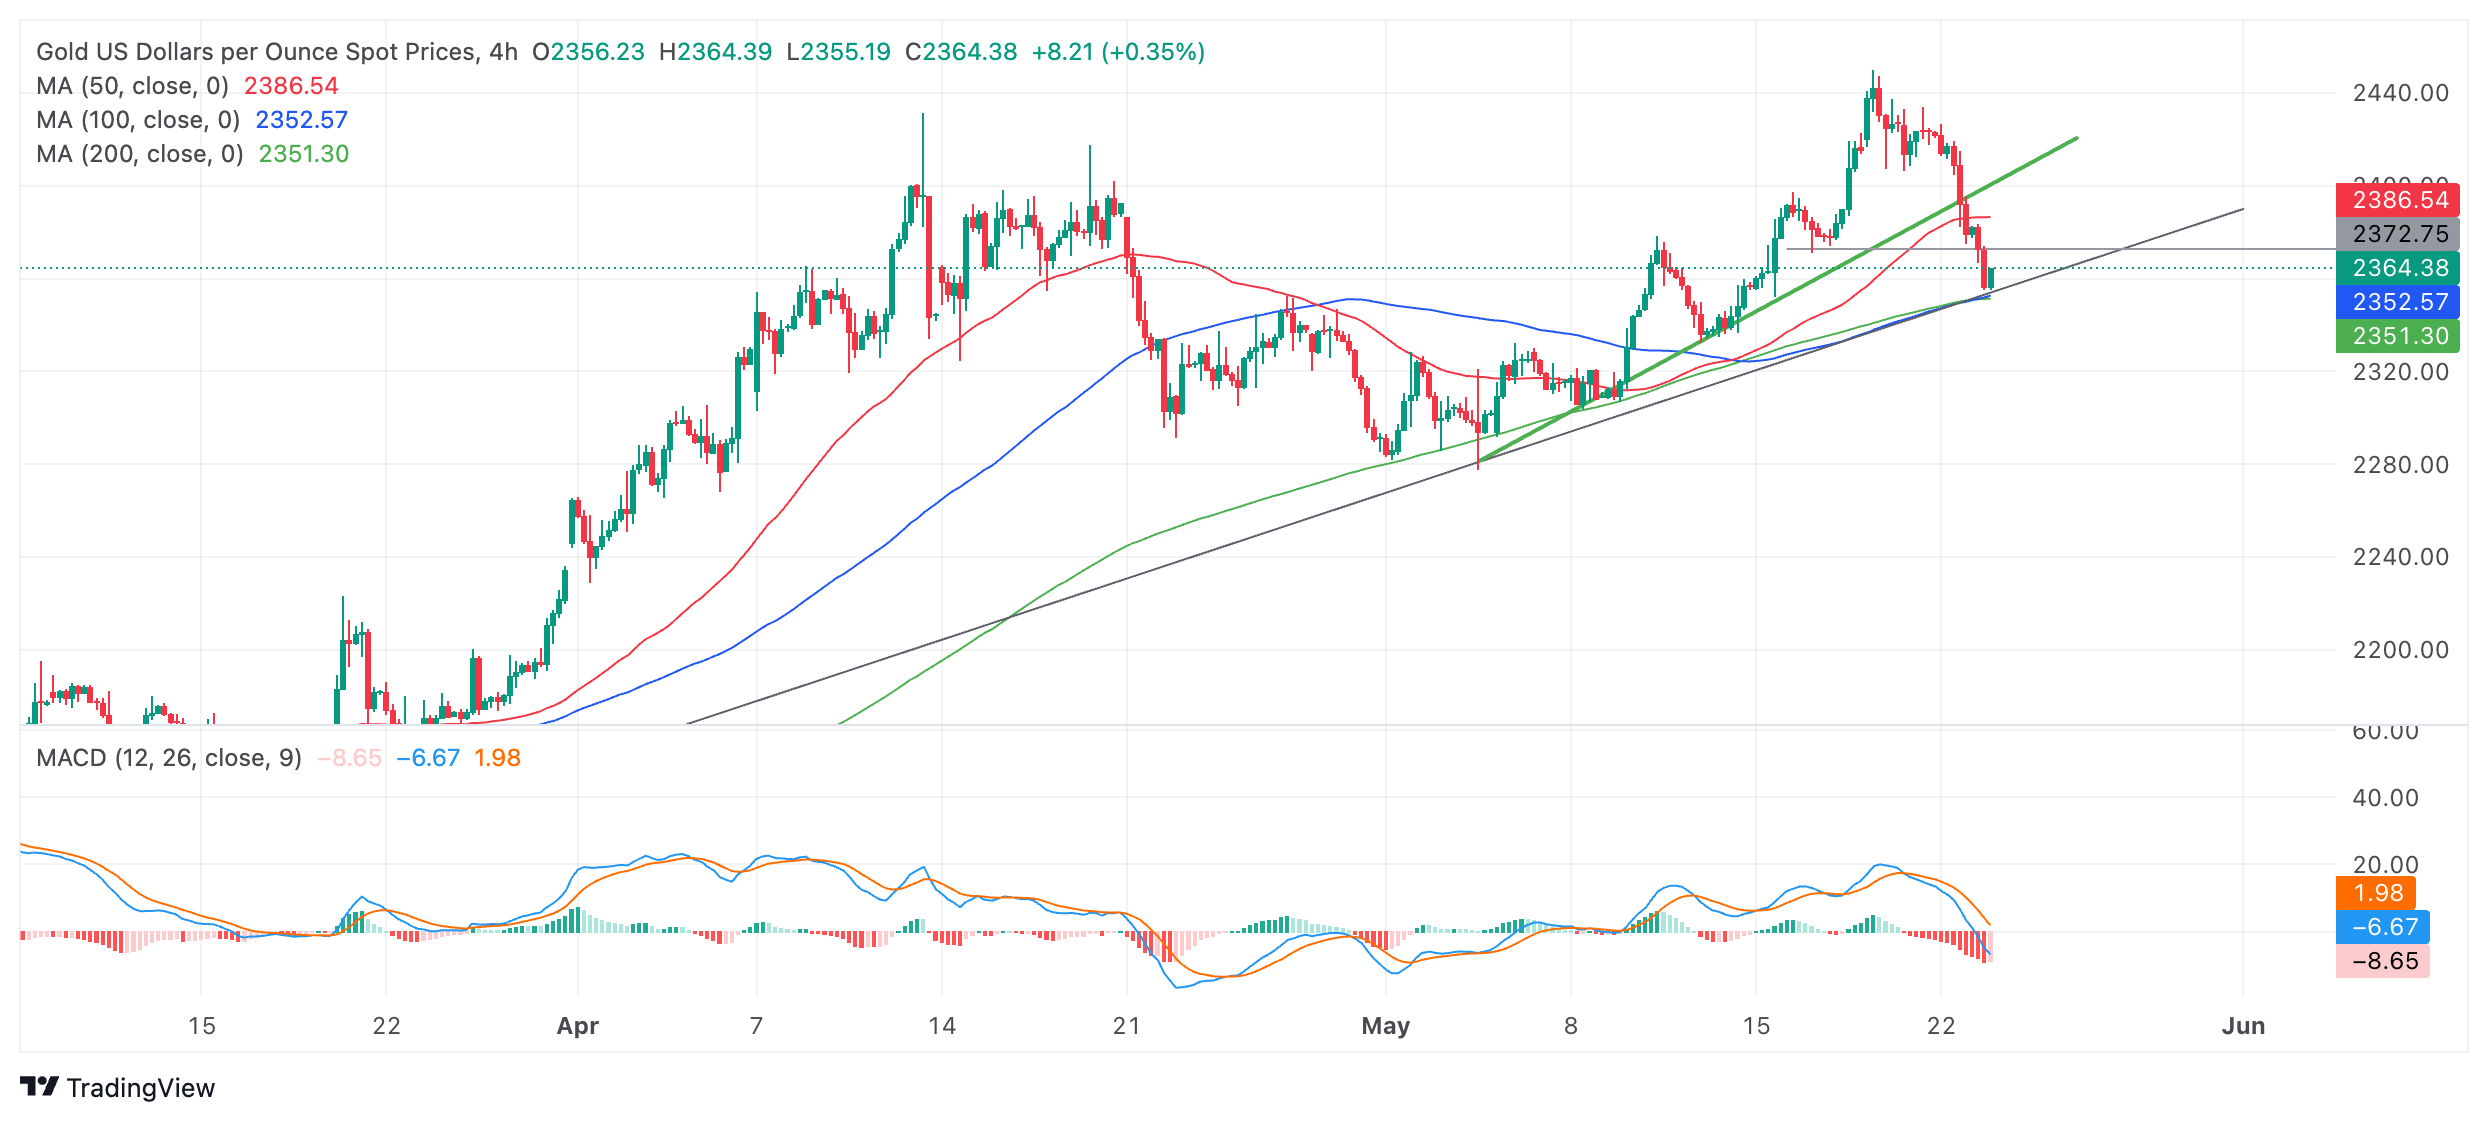
Gold price is currently pulling back from the trendline and if it continues higher, it could rise up to resistance at $2,371, the May 16 higher low. After that, however, it will probably roll over and continue falling in line with the short-term downtrend.
If Gold definitively breaks below the dark-grey trendline, it will be a very bearish sign. Such a move could then fall to a conservative target at $2,305 (Fibonacci 0.618 of the prior down move) or all the way down to $2,275 (100% of the prior down move).
A definitive break would be one accompanied by a long red candle that closes near its low or three red candles in a row that break below the trendline.
The precious metal’s medium and long-term trends are still bullish, however, and given the old adage that “the trend is your friend,” this suggests the risk of a recovery remains high. At the moment the only sign a recovery may evolve is that Gold has found support at a major trendline. There are no signs from price action, however, that a reversal is underway.
A break above the new $2,450 all-time high would confirm a continuation of the uptrend and a rally to the next target, probably at the psychologically significant $2,500 level.
Economic Indicator
FOMC Minutes
FOMC stands for The Federal Open Market Committee that organizes 8 meetings in a year and reviews economic and financial conditions, determines the appropriate stance of monetary policy and assesses the risks to its long-run goals of price stability and sustainable economic growth. FOMC Minutes are released by the Board of Governors of the Federal Reserve and are a clear guide to the future US interest rate policy.
Read more.Last release: Wed May 22, 2024 18:00
Frequency: Irregular
Actual: -
Consensus: -
Previous: -
Source: Federal Reserve
Minutes of the Federal Open Market Committee (FOMC) is usually published three weeks after the day of the policy decision. Investors look for clues regarding the policy outlook in this publication alongside the vote split. A bullish tone is likely to provide a boost to the greenback while a dovish stance is seen as USD-negative. It needs to be noted that the market reaction to FOMC Minutes could be delayed as news outlets don’t have access to the publication before the release, unlike the FOMC’s Policy Statement.
- Natural Gas prices extend rally on rumors of Russia displacing borders in Baltic Sea.
- Unforeseen Norwegian outage adds to concerns for European refueling.
- The US Dollar Index enters a volatility patch with a bulk release of data points set to this Thursday.
Natural Gas price (XNG/USD) has added another piece to its staggering performance for this year. Since the low of February 24th at $1.6290, gas prices have rallied near 90% to $3.08 on Wednesday. The recent surge comes after Russia communicated that it will redraw borders in the Baltic Sea for its exclave Kaliningrad and around a few Russian Islands near St-Petersburg, heightening tensions for all Baltic and Scandinavian countries in the region with risk that Russia could cut off and control the entrance to the Baltic Sea.
The US Dollar Index (DXY), which tracks the Greenback’s value against six major currencies, is trading higher after markets got spooked by concerns issued by several Federal Reserve members in the release of the Fed Minutes. The DXY had to give up those gains after European, and more specifically Germany’s, Purchase Managers Services Index (PMI) jumped above consensus and further advanced above 50 to 53.9. Later this Thursday US PMI’s are expected together with some regional Fed Activity trackers.
Natural Gas is trading at $3.00 per MMBtu at the time of writing.
Natural Gas news and market movers: Norway disruptions headaches
- Norway has reported that an unplanned outage at its Kollsnes gas processing plant is causing a supply disruption of around 8.6 million cubic meters per day. The duration of the outage is uncertain, Gassco reported.
- A recent court ruling in favor of an undisclosed European energy company ending payments to Gazprom PJSC, might see the last bit of Russian gas flowing into Europe ending. This would mean some issues for Austria, which is still depending on this flow.
- On Wednesday, the Russian Ministry of Defense released papers where it is said to be ready to redraw borders at the Baltic Sea for Kaliningrad and offshore near St-Petersburg. The move caused criticism from all Scandinavian and Baltic countries in the region. With the reshaping of the borders, Russia could try and occupy the Island Gotland, near the Swedish shores and by doing so control all access to the Baltic Sea region.
- The Energy Information Administration (EIA) is set to release the Gas Storage Changes for this week. Last week storage levels were at 70 billion cubic feet, with for this week storages expected to be near 84 billion cubic feet.
Natural Gas Technical Analysis: Take the money and run
Natural Gas is set to become the best performer for this year in terms of returns considering from its lowest level to where it is trading this week. With a very crucial pivotal level ahead, the question now is if it is not the right time to take some profit and re-enter once the pivotal level near $3.07 snaps. Should the recent concerns on the geopolitical front with Russia become reality soon, another 20% could be added towards $3.70 by the end of summer.
The $3.00 marker as a big figure was easily broken on Wednesday. The pivotal level near $3.07 (high of March 6, 2023) is now into play and has marked a new high for 2024 already. Further up, there is room for a quick crossing towards $3.69 should more geopolitical tensions be added.
On the downside, the 200-day Simple Moving Average (SMA) is acting as first support near $2.53. Should that support area fail to hold, then the pivotal level near $2.14 should do the trick ahead of the 55-day and 100-day SMA which both are trading at $2.11.
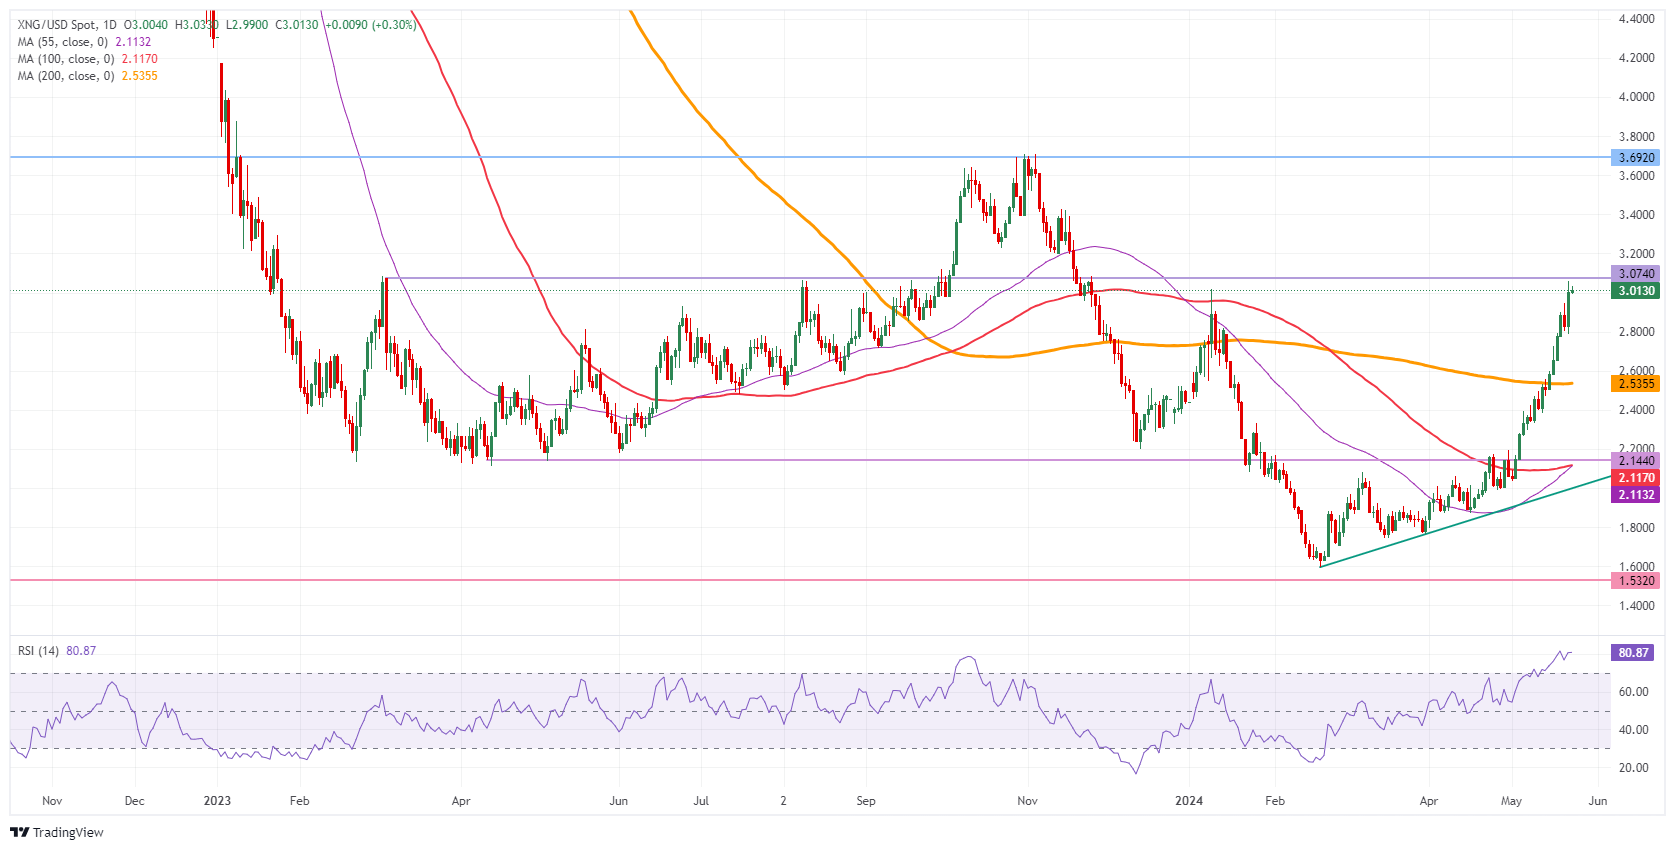
Natural Gas: Daily Chart
Natural Gas FAQs
Supply and demand dynamics are a key factor influencing Natural Gas prices, and are themselves influenced by global economic growth, industrial activity, population growth, production levels, and inventories. The weather impacts Natural Gas prices because more Gas is used during cold winters and hot summers for heating and cooling. Competition from other energy sources impacts prices as consumers may switch to cheaper sources. Geopolitical events are factors as exemplified by the war in Ukraine. Government policies relating to extraction, transportation, and environmental issues also impact prices.
The main economic release influencing Natural Gas prices is the weekly inventory bulletin from the Energy Information Administration (EIA), a US government agency that produces US gas market data. The EIA Gas bulletin usually comes out on Thursday at 14:30 GMT, a day after the EIA publishes its weekly Oil bulletin. Economic data from large consumers of Natural Gas can impact supply and demand, the largest of which include China, Germany and Japan. Natural Gas is primarily priced and traded in US Dollars, thus economic releases impacting the US Dollar are also factors.
The US Dollar is the world’s reserve currency and most commodities, including Natural Gas are priced and traded on international markets in US Dollars. As such, the value of the US Dollar is a factor in the price of Natural Gas, because if the Dollar strengthens it means less Dollars are required to buy the same volume of Gas (the price falls), and vice versa if USD strengthens.
- EUR/GBP gains ground as Eurozone Manufacturing PMI improved to 47.4 in May, reaching a 15-month high.
- The British Pound maintains its position after the release of mixed UK PMI.
- BoE may delay rate cuts as UK CPI softened at a slower pace than expected in April.
EUR/GBP advances to near 0.8520 during the European session on Thursday, as the Euro appreciates following the improved Eurozone Preliminary Manufacturing Purchasing Managers Index (PMI). The Eurozone manufacturing sector's downturn improved to 47.4 in May from April's 45.7, surpassing the expected reading of 46.2 and reaching a 15-month high.
Additionally, the bloc’s Services PMI remained steady at 53.3 in May, just below the estimate of 53.5. Meanwhile, the Composite PMI increased to 52.3 from 51.7, marking a 12-month high.
In Germany, the manufacturing sector's contraction slowed in May, while the services sector outperformed. The Manufacturing PMI rose to 45.4, its highest level in four months. At the same time, the Services PMI increased to 53.9, hitting an 11-month peak.
In the United Kingdom (UK), mixed PMI data helped the Pound Sterling (GBP) to hold its ground. The seasonally adjusted S&P Global/CIPS UK Manufacturing Purchasing Managers’ Index (PMI) improved to 51.3 in May, up from 49.1 in April, surpassing expectations of 49.5. However, the Preliminary UK Services PMI fell to 52.9 in May, missing the market consensus of 54.7 and down from the previous figure of 55.0.
Chief Business Economist at S&P Global Market Intelligence, Chris Williamson said “The flash PMI survey data for May signaled a further expansion of UK business activity, suggesting the economy continues to recover from the mild recession seen late last year.”
Additionally, the British Pound receives support as the Bank of England (BoE) might delay its shift to policy normalization due to the UK Consumer Price Index (CPI) report for April showing that inflation softened at a slower pace than expected.
Silver prices (XAG/USD) fell on Thursday, according to FXStreet data. Silver trades at $30.46 per troy ounce, down 1.03% from the $30.78 it cost on Wednesday.
Silver prices have increased by 19.59% since the beginning of the year.
| Unit measure | Today Price |
|---|---|
| Silver price per troy ounce | $30.46 |
| Silver price per gram | $0.98 |
The Gold/Silver ratio, which shows the number of troy ounces of Silver needed to equal the value of one troy ounce of Gold, stood at 77.53 on Thursday, up from 77.28 on Wednesday.
Investors might use this ratio to determine the relative valuation of Gold and Silver. Some may consider a high ratio as an indicator that Silver is undervalued – or Gold is overvalued – and might buy Silver or sell Gold accordingly. Conversely, a low ratio might suggest that Gold is undervalued relative to Silver.
(An automation tool was used in creating this post.)
Silver FAQs
Silver is a precious metal highly traded among investors. It has been historically used as a store of value and a medium of exchange. Although less popular than Gold, traders may turn to Silver to diversify their investment portfolio, for its intrinsic value or as a potential hedge during high-inflation periods. Investors can buy physical Silver, in coins or in bars, or trade it through vehicles such as Exchange Traded Funds, which track its price on international markets.
Silver prices can move due to a wide range of factors. Geopolitical instability or fears of a deep recession can make Silver price escalate due to its safe-haven status, although to a lesser extent than Gold's. As a yieldless asset, Silver tends to rise with lower interest rates. Its moves also depend on how the US Dollar (USD) behaves as the asset is priced in dollars (XAG/USD). A strong Dollar tends to keep the price of Silver at bay, whereas a weaker Dollar is likely to propel prices up. Other factors such as investment demand, mining supply – Silver is much more abundant than Gold – and recycling rates can also affect prices.
Silver is widely used in industry, particularly in sectors such as electronics or solar energy, as it has one of the highest electric conductivity of all metals – more than Copper and Gold. A surge in demand can increase prices, while a decline tends to lower them. Dynamics in the US, Chinese and Indian economies can also contribute to price swings: for the US and particularly China, their big industrial sectors use Silver in various processes; in India, consumers’ demand for the precious metal for jewellery also plays a key role in setting prices.
Silver prices tend to follow Gold's moves. When Gold prices rise, Silver typically follows suit, as their status as safe-haven assets is similar. The Gold/Silver ratio, which shows the number of ounces of Silver needed to equal the value of one ounce of Gold, may help to determine the relative valuation between both metals. Some investors may consider a high ratio as an indicator that Silver is undervalued, or Gold is overvalued. On the contrary, a low ratio might suggest that Gold is undervalued relative to Silver.
The European Central Bank (ECB) published its indicator of the Euro area’s negotiated wages data for the first quarter of 2024 on Thursday.
Data showed that the Euro area negotiated wages increased at an annual pace of 4.69% in Q1 2024 after recording a 4.50% growth in the final quarter of last year.
Market reaction to the EU negotiated wages data
The increase in the EU negotiated wages fails to move the needle around the Euro, as EUR/USD is keeping its rebound intact near 1.0835, adding 0.13% on the day.
About ECB indicator of negotiated wage growth
The ECB indicator of negotiated wage growth is computed for a subset of countries only. The euro area aggregate is based on nine countries: Germany, France, Italy, Spain, the Netherlands, Belgium, Finland, Austria and Portugal. The indicator relies on data for negotiated monthly earnings. The euro area indicator is based on a mixture of monthly and quarterly time series and is based on non-harmonised country data.
ECB FAQs
The European Central Bank (ECB) in Frankfurt, Germany, is the reserve bank for the Eurozone. The ECB sets interest rates and manages monetary policy for the region. The ECB primary mandate is to maintain price stability, which means keeping inflation at around 2%. Its primary tool for achieving this is by raising or lowering interest rates. Relatively high interest rates will usually result in a stronger Euro and vice versa. The ECB Governing Council makes monetary policy decisions at meetings held eight times a year. Decisions are made by heads of the Eurozone national banks and six permanent members, including the President of the ECB, Christine Lagarde.
In extreme situations, the European Central Bank can enact a policy tool called Quantitative Easing. QE is the process by which the ECB prints Euros and uses them to buy assets – usually government or corporate bonds – from banks and other financial institutions. QE usually results in a weaker Euro. QE is a last resort when simply lowering interest rates is unlikely to achieve the objective of price stability. The ECB used it during the Great Financial Crisis in 2009-11, in 2015 when inflation remained stubbornly low, as well as during the covid pandemic.
Quantitative tightening (QT) is the reverse of QE. It is undertaken after QE when an economic recovery is underway and inflation starts rising. Whilst in QE the European Central Bank (ECB) purchases government and corporate bonds from financial institutions to provide them with liquidity, in QT the ECB stops buying more bonds, and stops reinvesting the principal maturing on the bonds it already holds. It is usually positive (or bullish) for the Euro.
- EUR/USD bounces back from 1.0800 as preliminary Eurozone Composite PMI for May beats estimates.
- The ECB is anticipated to reduce interest rates three times by the year-end.
- The US Dollar edges down on firm Fed rate-cut prospects for September.
EUR/USD witnesses a stellar buying interest after posting a fresh weekly low near the crucial support of 1.0800 in Thursday’s European session. The major currency pair capitalizes on a decline in the US Dollar and strong Eurozone preliminary PMI numbers for May.
The US Dollar Index (DXY), which tracks the US Dollar’s value against six major currencies, edges down to 104.77 as the recovery move seems stalling just below the crucial resistance of 105.00. The recovery move in the US Dollar seems fading as investors remain confident that the Federal Reserve (Fed) will start reducing interest rates from the September meeting.
Traders didn’t pare bets supporting Fed rate cuts in September despite hawkish commentary on the interest rate outlook by Fed officials indicated by the Federal Open Market Committee (FOMC) minutes for the May meeting released on Wednesday.
The impact of the FOMC minutes was expected to be temporary on the US Dollar as officials were worried about stalling progress in the disinflation process on the basis of three hot inflation readings of the January-March period. While investors’ firm speculation on rate cuts in September is built on an expected decline in the inflation data indicated by the Consumer Price Index (CPI) report of April.
Daily digest market movers: EUR/USD capitalizes on strong preliminary Eurozone PMI
- EUR/USD recovers sharply as the S&P Global has published strong preliminary Purchasing Managers Index (PMI) data for May. The agency reported that the Manufacturing PMI rose at a faster pace to 47.4, from the estimates of 46.2 and the prior reading of 45.7. However, a figure below the 50.0 threshold is considered as contraction. The Composite PMI jumps to 52.3, beats the consensus of 52.0 and the former release of 51.7. The Services PMI that represents the service sector grew steadily by 53.3 but missed expectations of 53.5.
- Dr. Cyrus de la Rubia, Chief Economist at Hamburg Commercial Bank (HCB) commented on flash PMI data, “We are heading in the right direction. Considering the PMI numbers in our GDP nowcast, the Eurozone will probably grow at a rate of 0.3% during the second quarter, putting aside the spectre of recession. Growth is mainly driven by the service sector whose expansion was extended to four months. Manufacturing acts less and less as a stumbling block for the economy and optimism about future output has increased further in this sector. With all this in place it seems plausible that GDP growth of almost 1% could be reached this year, and there is even some upward risk.
- Going forward, the Euro will be guided by market expectations about the European Central Bank (ECB) reducing interest rates in the July meeting. The ECB is widely anticipated to start lowering key borrowing rate from the June meeting. Therefore, investors remain uncertain over subsequent rate cuts by the ECB.
- Many ECB policymakers want to remain data-dependent for follow-up rate-cut move in July as an aggressive monetary policy easing could revamp price pressures again. Also, ECB policymakers worry that follow-up rate cuts could impact the balance between monetary stimulus, inflation and other financial triggers.
- For the full year, financial markets anticipate that the ECB will cut interest rates three times. Leading financial services provider UBS said that according to their baseline scenario, after the initial cut in June, the ECB may embark on a prolonged and incremental sequence of rate reductions. These would consist of 25 basis point cuts each quarter, leading to a total decrease of 75 basis points in 2024 and an additional 100 basis points in 2025.
Technical Analysis: EUR/USD revives after testing triangle breakout region
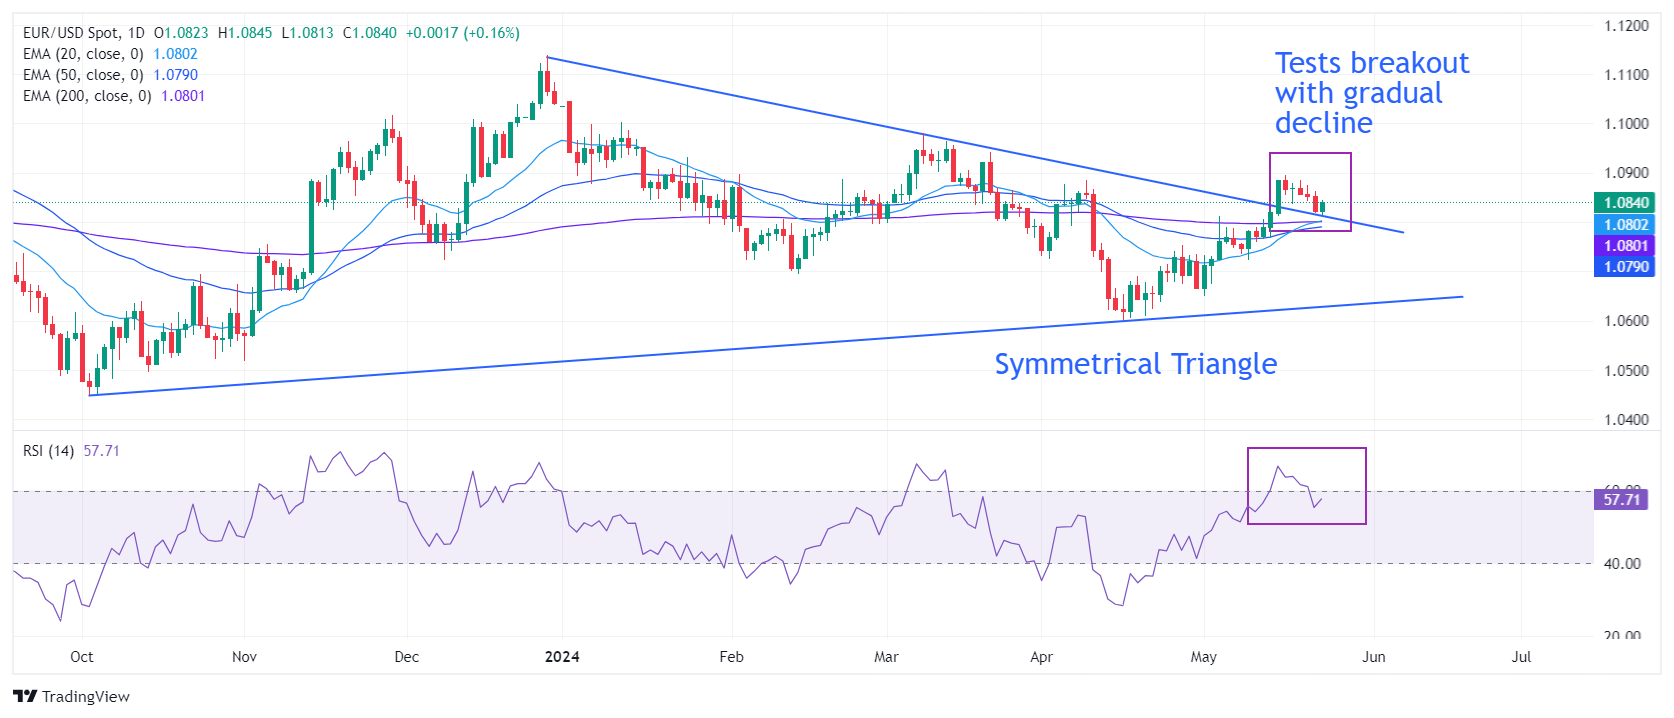
EUR/USD bounces back strongly after testing the breakout region of the Symmetrical Triangle formed on a daily timeframe. The near-term outlook of the shared currency pair remains firm as the 20-and 50-day Exponential Moving Averages (EMAs) have delivered a bullish crossover around 1.0780.
The 14-period Relative Strength Index (RSI) has shifted comfortably into the bullish range of 60.00-80.00, suggesting that the momentum has leaned toward the upside.
The major currency pair is expected to recapture two-month high around 1.0900. A decisive break above the same will drive the asset towards March 21 high around 1.0950 and the psychological resistance of 1.1000. However, a downside move by the major below the 200-day EMA at 1.0800 could push it inside the woods.
Euro FAQs
The Euro is the currency for the 20 European Union countries that belong to the Eurozone. It is the second most heavily traded currency in the world behind the US Dollar. In 2022, it accounted for 31% of all foreign exchange transactions, with an average daily turnover of over $2.2 trillion a day. EUR/USD is the most heavily traded currency pair in the world, accounting for an estimated 30% off all transactions, followed by EUR/JPY (4%), EUR/GBP (3%) and EUR/AUD (2%).
The European Central Bank (ECB) in Frankfurt, Germany, is the reserve bank for the Eurozone. The ECB sets interest rates and manages monetary policy. The ECB’s primary mandate is to maintain price stability, which means either controlling inflation or stimulating growth. Its primary tool is the raising or lowering of interest rates. Relatively high interest rates – or the expectation of higher rates – will usually benefit the Euro and vice versa. The ECB Governing Council makes monetary policy decisions at meetings held eight times a year. Decisions are made by heads of the Eurozone national banks and six permanent members, including the President of the ECB, Christine Lagarde.
Eurozone inflation data, measured by the Harmonized Index of Consumer Prices (HICP), is an important econometric for the Euro. If inflation rises more than expected, especially if above the ECB’s 2% target, it obliges the ECB to raise interest rates to bring it back under control. Relatively high interest rates compared to its counterparts will usually benefit the Euro, as it makes the region more attractive as a place for global investors to park their money.
Data releases gauge the health of the economy and can impact on the Euro. Indicators such as GDP, Manufacturing and Services PMIs, employment, and consumer sentiment surveys can all influence the direction of the single currency. A strong economy is good for the Euro. Not only does it attract more foreign investment but it may encourage the ECB to put up interest rates, which will directly strengthen the Euro. Otherwise, if economic data is weak, the Euro is likely to fall. Economic data for the four largest economies in the euro area (Germany, France, Italy and Spain) are especially significant, as they account for 75% of the Eurozone’s economy.
Another significant data release for the Euro is the Trade Balance. This indicator measures the difference between what a country earns from its exports and what it spends on imports over a given period. If a country produces highly sought after exports then its currency will gain in value purely from the extra demand created from foreign buyers seeking to purchase these goods. Therefore, a positive net Trade Balance strengthens a currency and vice versa for a negative balance.
Gold prices fell in India on Thursday, according to data from India's Multi Commodity Exchange (MCX).
Gold price stood at 72,561 Indian Rupees (INR) per 10 grams, down INR 1,319 compared with the INR 73,880 it cost on Wednesday.
As for futures contracts, Gold prices decreased to INR 72,280 per 10 gms from INR 73,045 per 10 gms.
Prices for Silver futures contracts decreased to INR 91,121 per kg from INR 93,013 per kg.
Global Market Movers: Comex Gold price bears the brunt of the Fed’s hawkish Minutes
- The Minutes from the recent policy meeting of the FOMC released Wednesday indicated that “participants observed that while inflation had eased over the past year, in recent months there had been a lack of further progress toward the Committee’s 2 percent objective.”
- The minutes further stated that “participants assessed that maintaining the current target range for the federal funds rate at this meeting was supported by data indicating continued solid economic growth.”
- Investors have priced in nearly a 60% chance of the first cut to happen in September and two reductions of a quarter percentage point before the end of the year, according to the CME FedWatch Tool.
- The preliminary of US S&P Global Manufacturing and Service PMI is expected to remain unchanged at 50.0 and 51.3 in May, respectively.
- The People's Bank of China (PBoC) has been the largest buyer among its worldwide counterparts over the past year. Its addition of 225 tonnes to its gold reserves last year was the highest on record since at least 1977.
(An automation tool was used in creating this post.)
Gold FAQs
Gold has played a key role in human’s history as it has been widely used as a store of value and medium of exchange. Currently, apart from its shine and usage for jewelry, the precious metal is widely seen as a safe-haven asset, meaning that it is considered a good investment during turbulent times. Gold is also widely seen as a hedge against inflation and against depreciating currencies as it doesn’t rely on any specific issuer or government.
Central banks are the biggest Gold holders. In their aim to support their currencies in turbulent times, central banks tend to diversify their reserves and buy Gold to improve the perceived strength of the economy and the currency. High Gold reserves can be a source of trust for a country’s solvency. Central banks added 1,136 tonnes of Gold worth around $70 billion to their reserves in 2022, according to data from the World Gold Council. This is the highest yearly purchase since records began. Central banks from emerging economies such as China, India and Turkey are quickly increasing their Gold reserves.
Gold has an inverse correlation with the US Dollar and US Treasuries, which are both major reserve and safe-haven assets. When the Dollar depreciates, Gold tends to rise, enabling investors and central banks to diversify their assets in turbulent times. Gold is also inversely correlated with risk assets. A rally in the stock market tends to weaken Gold price, while sell-offs in riskier markets tend to favor the precious metal.
The price can move due to a wide range of factors. Geopolitical instability or fears of a deep recession can quickly make Gold price escalate due to its safe-haven status. As a yield-less asset, Gold tends to rise with lower interest rates, while higher cost of money usually weighs down on the yellow metal. Still, most moves depend on how the US Dollar (USD) behaves as the asset is priced in dollars (XAU/USD). A strong Dollar tends to keep the price of Gold controlled, whereas a weaker Dollar is likely to push Gold prices up.
- UK Services PMI dropped to 52.9 in May.
- Manufacturing PMI in the UK expanded to 51.3. in May.
- GBP/USD holds higher ground near 1.2740 after mixed UK business PMIs.
The seasonally adjusted S&P Global/CIPS UK Manufacturing Purchasing Managers’ Index (PMI) rebounded from 49.1 in April to 51.3 in May, beating 49.5 expectations.
Meanwhile, the Preliminary UK Services Business Activity Index fell to 52.9 in May, missing the market consensus of 54.7. The previous figure stood at 55.0.
Commenting on the flash PMI data, Chris Williamson, Chief Business Economist at S&P Global Market Intelligence said: “The flash PMI survey data for May signaled a further expansion of UK business activity, suggesting the economy continues to recover from the mild recession seen late last year.”
“The survey data are consistent with GDP rising by around 0.3% in the second quarter, with an encouraging revival of manufacturing accompanied by sustained, but slower, service sector growth,” Chris added.
FX implications
GBP/USD is holding gains after mixed UK PMI data. The pair is adding 0.15% on the day to trade at 1.2734, as of writing.
British Pound PRICE Today
The table below shows the percentage change of British Pound (GBP) against listed major currencies today. British Pound was the strongest against the US Dollar.
| USD | EUR | GBP | JPY | CAD | AUD | NZD | CHF | |
|---|---|---|---|---|---|---|---|---|
| USD | -0.19% | -0.14% | -0.05% | -0.13% | -0.11% | -0.30% | -0.15% | |
| EUR | 0.19% | 0.06% | 0.15% | 0.09% | 0.09% | -0.09% | 0.03% | |
| GBP | 0.14% | -0.06% | 0.10% | -0.02% | 0.03% | -0.17% | -0.04% | |
| JPY | 0.05% | -0.15% | -0.10% | -0.09% | -0.07% | -0.32% | -0.13% | |
| CAD | 0.13% | -0.09% | 0.02% | 0.09% | 0.03% | -0.16% | -0.04% | |
| AUD | 0.11% | -0.09% | -0.03% | 0.07% | -0.03% | -0.19% | -0.08% | |
| NZD | 0.30% | 0.09% | 0.17% | 0.32% | 0.16% | 0.19% | 0.13% | |
| CHF | 0.15% | -0.03% | 0.04% | 0.13% | 0.04% | 0.08% | -0.13% |
The heat map shows percentage changes of major currencies against each other. The base currency is picked from the left column, while the quote currency is picked from the top row. For example, if you pick the British Pound from the left column and move along the horizontal line to the US Dollar, the percentage change displayed in the box will represent GBP (base)/USD (quote).
- Silver price continues to lose ground as FOMC Minutes suggest the Fed to be hawkish on policy stance.
- Fed policymakers are concerned as inflation has proven to be more persistent than expected at the start of 2024.
- The safe-haven asset, Silver, may receive support as tensions escalate between China and Taiwan.
Silver price extends its losses for the second consecutive session, trading around $30.30 per troy ounce during the early European hours on Thursday. The price of the grey metal plunged as non-yielding assets lost ground as the Federal Open Market Committee (FOMC) Meeting Minutes indicated hawkish sentiment surrounding the Federal Reserve (Fed) policy stance.
Fed policymakers expressed concerns about the lack of progress on inflation, which has proven to be more persistent than expected at the start of 2024. As a result, the Fed is hesitant to proceed with interest rate cuts. Traders' sentiment now indicates increasing uncertainty about the Fed making multiple rate cuts in 2024.
According to the CME FedWatch Tool, the probability of the Federal Reserve implementing a 25 basis-point rate cut in September has seen a slight downtick to 50.7%, compared to 51.6% a day ago. On Tuesday, Federal Reserve Bank of Boston President Susan Collins stated that progress toward interest rate adjustment will take longer and emphasized that patience is the right policy for the Fed, per Reuters.
The safe-haven asset, Silver, may experience an increase in demand as tensions escalate following Lai Ching-te's assumption of office as Taiwan's new president. Chinese state media reports indicate that China has deployed numerous fighter jets and conducted simulated strikes in the Taiwan Strait and around groups of Taiwan-controlled islands. Geopolitical tensions often lead to uncertainty and risk aversion, which typically drive investors toward precious metals, including Silver.
- Eurozone Manufacturing PMI rose to 47.4 in May, beating 46.2 forecast.
- Bloc’s Services PMI steadied at 53.3 in May vs. 53.5 estimate.
- EUR/USD holds the rebound near 1.0830 after German, Eurozone PMI data.
The Eurozone manufacturing sector downturn eased while the services sector activity steadied in May, according to the data from the HCOB's latest purchasing managers index survey published on Thursday.
The Eurozone Manufacturing Purchasing Managers Index (PMI) improved from 45.7 in April to 47.4 in May, bettering the market expectations of 46.2. The index jumped to a 15-month high.
The bloc’s Services PMI held steady at 53.3. The data came in below the estimate of 53.5.
The HCOB Eurozone PMI Composite increased to 52.3 in May vs. 52.0 expected and April’s 51.7 reading. The index reached a 12-month top.
EUR/USD reaction to the Eurozone PMI data
EUR/USD is keeping its recovery momentum intact near 1.0830 despite the mixed Eurozone PMIs. The spot is still up 0.11% on the day, at the press time.
- S&P Global PMIs are expected to indicate some loss of momentum in US economic activity in May.
- Manufacturing and Services prints are seen almost unchanged this month.
- EUR/USD remains on the back foot so far this week.
On Thursday, S&P Global will issue its flash estimates of the United States (US) Purchasing Managers Indexes (PMIs), a monthly survey of business activity. The survey is separated into services and manufacturing output and aggregated into a single statistic, the Composite PMI.
In April, economic activity in the US private sector contracted somewhat, with the S&P Global Composite PMI easing to 51.3, following a drop in manufacturing output to 50, while the services index slipped back to 51.3. All components, however, remained above the 50 threshold, the border between expansion and contraction.
From the press release: “Manufacturing production increased for the third consecutive month, albeit at the slowest pace in this sequence. With new orders down, output was often supported by work on previously received orders.”
With the US economy showing tepid signs of deceleration and the labour market cooling somewhat, market participants have been pencilling in the likelihood that the US Federal Reserve (Fed) might start reducing its Fed Funds Target Range (FFTR) in the next few months. However, sticky inflation continues to prompt caution regarding the potential timing of the commencement of the Fed’s easing programme, a view that has been further propped up by the equally prudent stance of many policymakers.
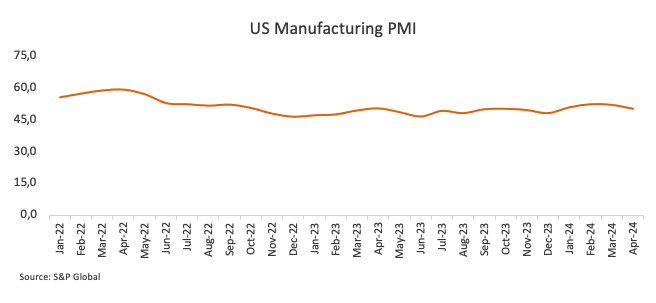
What can we expect from the next S&P Global PMI report?
The May S&P Global Manufacturing PMI is expected to be 50.0, unchanged from April’s figure, but still within the expansionary territory (>50). A similar outcome is forecast in terms of services production, with the index expected to print at 51.3, matching the previous month’s reading.
As long as the measurements are over 50.0, the impact of a decline should be minimal. However, a drop below the line that divides expansion and contraction might reinforce speculation about Fed rate reductions, most likely to begin at the September 18 meeting. Such a scenario could likely maintain the US Dollar (USD) under pressure, forcing the USD Index (DXY) to give away part of the weekly advance.
The opposite scenario, that is, a positive surprise, should underpin the Fed’s tighter-for-longer narrative, supporting a stronger Dollar and higher yields across the curve.
When will May flash US S&P Global PMIs be released and how could they affect EUR/USD?
The S&P Global PMI report will be issued on Thursday, May 23, at 13:45 GMT. So far, EUR/USD has been suffering the recovery in the Greenback and revisited the low-1.0800s after hitting fresh monthly peaks in levels just shy of 1.0900 the figure earlier in the month.
From the technical viewpoint, FXStreet’s Senior Analyst Pablo Piovano argues: “EUR/USD faces its initial up-barrier at the May peak of 1.0894 (May 6). The surpass of this region could prompt spot to embark on a potential visit to the March high of 1.0981 (March 8) seconded by the weekly top of 1.0998 (January 5, 2011), all followed by the psychological 1.1000 yardstick.”
Pablo adds: “On the downside, a sustainable breach of the key 200-day SMA at 1.0787 should shift the near-term outlook to bearish, allowing extra weakness to potentially retest the May low of 1.0649 (May 1) ahead of the 2024 bottom of 1.0601 (April 16).”
Economic Indicator
S&P Global Manufacturing PMI
The S&P Global Manufacturing Purchasing Managers Index (PMI), released on a monthly basis, is a leading indicator gauging business activity in the US manufacturing sector. The data is derived from surveys of senior executives at private-sector companies from the manufacturing sector. Survey responses reflect the change, if any, in the current month compared to the previous month and can anticipate changing trends in official data series such as Gross Domestic Product (GDP), industrial production, employment and inflation. A reading above 50 indicates that the manufacturing economy is generally expanding, a bullish sign for the US Dollar (USD). Meanwhile, a reading below 50 signals that activity in the manufacturing sector is generally declining, which is seen as bearish for USD.
Read more.Next release: Thu May 23, 2024 13:45 (Prel)
Frequency: Monthly
Consensus: 50
Previous: 50
Source: S&P Global
GDP FAQs
A country’s Gross Domestic Product (GDP) measures the rate of growth of its economy over a given period of time, usually a quarter. The most reliable figures are those that compare GDP to the previous quarter e.g Q2 of 2023 vs Q1 of 2023, or to the same period in the previous year, e.g Q2 of 2023 vs Q2 of 2022. Annualized quarterly GDP figures extrapolate the growth rate of the quarter as if it were constant for the rest of the year. These can be misleading, however, if temporary shocks impact growth in one quarter but are unlikely to last all year – such as happened in the first quarter of 2020 at the outbreak of the covid pandemic, when growth plummeted.
A higher GDP result is generally positive for a nation’s currency as it reflects a growing economy, which is more likely to produce goods and services that can be exported, as well as attracting higher foreign investment. By the same token, when GDP falls it is usually negative for the currency. When an economy grows people tend to spend more, which leads to inflation. The country’s central bank then has to put up interest rates to combat the inflation with the side effect of attracting more capital inflows from global investors, thus helping the local currency appreciate.
When an economy grows and GDP is rising, people tend to spend more which leads to inflation. The country’s central bank then has to put up interest rates to combat the inflation. Higher interest rates are negative for Gold because they increase the opportunity-cost of holding Gold versus placing the money in a cash deposit account. Therefore, a higher GDP growth rate is usually a bearish factor for Gold price.
- The Mexican Peso is at risk of a reversal versus the USD following the release of the FOMC meeting minutes.
- The minutes revealed a reluctance to lower interest rates, how the labor market was key, and the possibility of raising rates.
- USD/MXN threatens to reverse the trend after completing a bullish reversal over the last two days.
The Mexican Peso (MXN) steadies itself on Thursday after two days of declines against the US Dollar (USD), as traders stand back ahead of a slew of data out of Mexico.
The USD’s fightback gained momentum on Wednesday after the release of the Federal Reserve (Fed) meeting Minutes showed policymakers are reluctant to lower interest rates amid persistent inflationary pressures.
Their view that interest rates should remain higher for longer supported USD since higher interest rates attract greater foreign capital inflows.
USD/MXN is trading at 16.65 at the time of writing, whilst EUR/MXN is trading little changed at 18.03 and GBP/MXN is up due to Pound Sterling strength at 21.19.
Mexican Peso stalls in its uptrend post FOMC Minutes
The Mexican Peso lost more ground against the US Dollar on Wednesday, following the release of the Federal Open Market Committee (FOMC) meeting Minutes for the April 29-May 1 policy meeting.
The summary of discussions revealed that although policymakers expected price pressures to ease eventually, they had not fallen quickly enough and therefore the current policy rate of 5.25% - 5.50% should be maintained “at least until September,” according to FXStreet.
The strength of the labor market emerged as a key factor determining future policy.
The possibility of raising interest rates in order to bring inflation down in a sustainable manner was also discussed as an option. This added a new more hawkish element to the proceedings and echoed similar discussions in the Reserve Bank of Australia’s (RBA) meeting minutes.
The Minutes catalyzed a rally in the US Dollar, fueling a consequent rise in USD/MXN.
Mexican Day of the Data
Mexican Peso traders will now be preparing for a slew of economic data releases for Mexico scheduled to come out at 12:00 GMT on Thursday.
These include the final estimate of Mexican Gross Domestic Product (GDP) in Q1, Half-month Inflation for May and Economic Activity data for March.
Then at 15:00 GMT the Minutes of the Bank of Mexico’s (Banxico) May policy meeting will be released and could lead to further volatility.
In the US, the release of Purchasing Manager Index (PMI) data for May at 13:45 GMT could impact the US Dollar.
Technical Analysis: USD/MXN validates bullish reversal day
USD/MXN – or the number of Pesos that can be bought with one US Dollar – edges higher on Thursday after forming a bullish reversal day which gained confirmation from the bullish close on Wednesday (shaded rectangle on the chart below).
USD/MXN Daily Chart
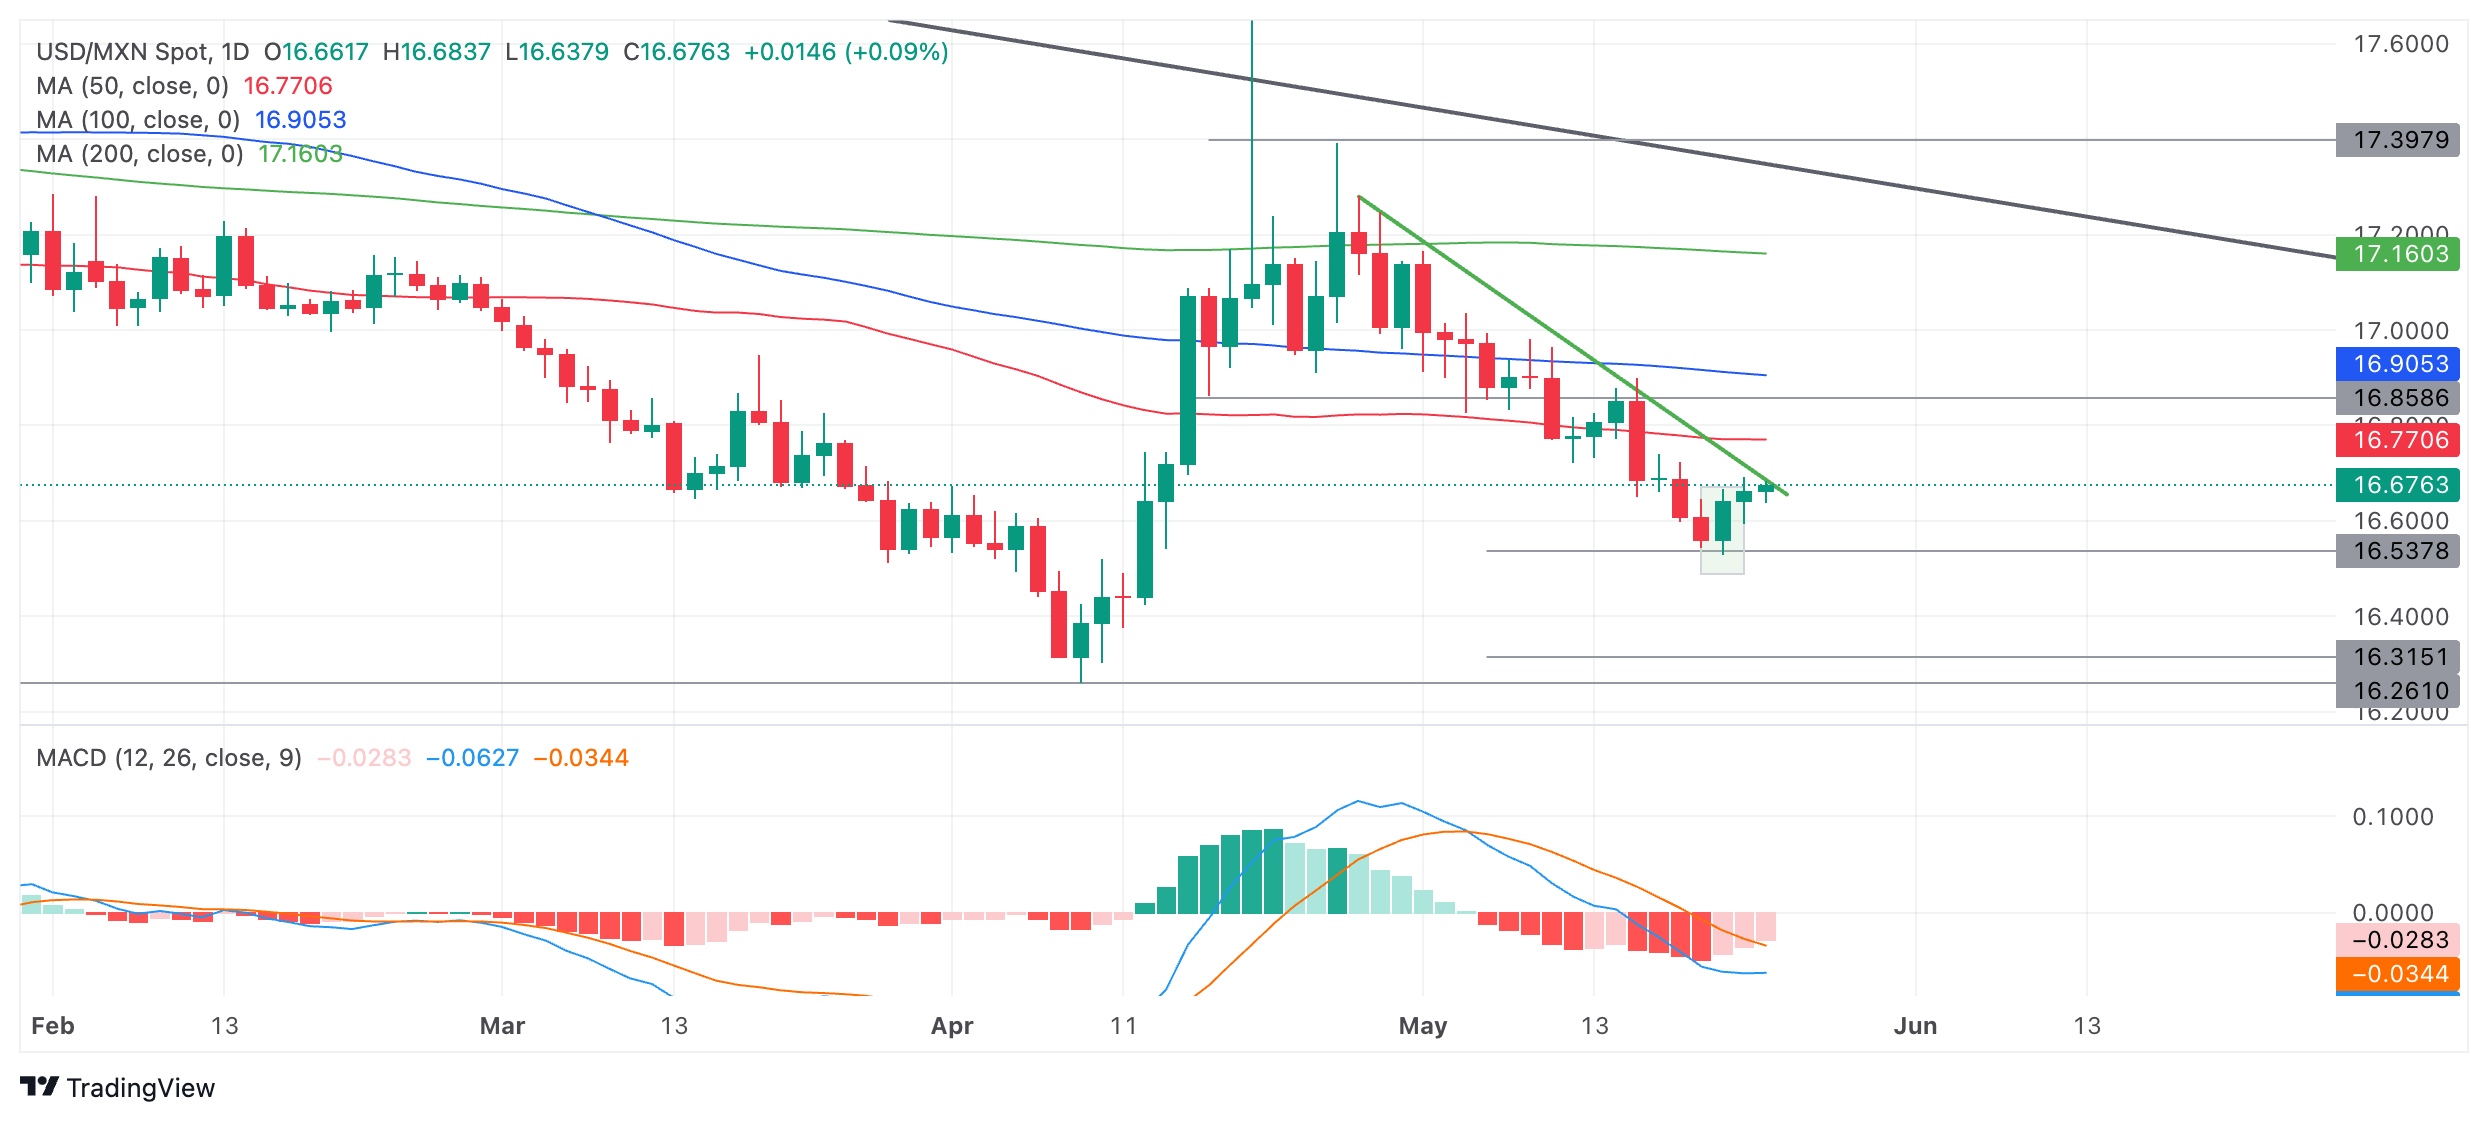
The reversal pattern was validated by Wednesday’s bullish close and could be a sign the trend may reverse. A break on a closing basis above the green down trendline would be required to confirm a reversal of the short-term trend.
On Tuesday USD/MXN reached the conservative target, at 16.54, for the breakdown out of the range that formed from mid-April to early May. The conservative estimate is calculated as the 0.618 Fibonacci ratio of the range's height extrapolated lower.
The pair remains in a downtrend and there is still a high risk of further bearishness taking it lower. The next downside target is 16.34, the full height of the range extrapolated lower. A break below the Tuesday low of 16.53 would signal a continuation of the downtrend.
Given the medium and long-term trends are also bearish, the odds further favor more downside.
Economic Indicator
FOMC Minutes
FOMC stands for The Federal Open Market Committee that organizes 8 meetings in a year and reviews economic and financial conditions, determines the appropriate stance of monetary policy and assesses the risks to its long-run goals of price stability and sustainable economic growth. FOMC Minutes are released by the Board of Governors of the Federal Reserve and are a clear guide to the future US interest rate policy.
Read more.Last release: Wed May 22, 2024 18:00
Frequency: Irregular
Actual: -
Consensus: -
Previous: -
Source: Federal Reserve
Minutes of the Federal Open Market Committee (FOMC) is usually published three weeks after the day of the policy decision. Investors look for clues regarding the policy outlook in this publication alongside the vote split. A bullish tone is likely to provide a boost to the greenback while a dovish stance is seen as USD-negative. It needs to be noted that the market reaction to FOMC Minutes could be delayed as news outlets don’t have access to the publication before the release, unlike the FOMC’s Policy Statement.
The German manufacturing sector’s pace of contraction slowed in May while the services sector outperformed, the preliminary business activity report published by the HCOB survey showed Thursday.
The HCOB Manufacturing PMI in the Eurozone’s economic powerhouse came in at 45.4 this month, improving from April’s 42.5 while much above the expected 43.1 print. The index climbed to the highest level in four months.
Meanwhile, Services PMI rose from 53.2 in April to 53.9 in May, above the market consensus of 53.5 in the reported period. The measure hit an 11-month peak.
The HCOB Preliminary German Composite Output Index stood at 52.2 in May vs. 51.0 expected and 50.6 recorded in April. The gauge clinched a yearly high.
FX implications
EUR/USD has bounced off intraday lows on the strong German data, currently trading 0.07% higher on the day at 1.0830.
Euro PRICE Today
The table below shows the percentage change of Euro (EUR) against listed major currencies today. Euro was the strongest against the US Dollar.
| USD | EUR | GBP | JPY | CAD | AUD | NZD | CHF | |
|---|---|---|---|---|---|---|---|---|
| USD | -0.05% | -0.09% | -0.09% | -0.11% | -0.04% | -0.20% | -0.13% | |
| EUR | 0.05% | -0.04% | -0.03% | -0.06% | 0.00% | -0.17% | -0.08% | |
| GBP | 0.09% | 0.04% | 0.02% | -0.02% | 0.05% | -0.12% | -0.04% | |
| JPY | 0.09% | 0.03% | -0.02% | -0.02% | 0.04% | -0.18% | -0.05% | |
| CAD | 0.11% | 0.06% | 0.02% | 0.02% | 0.07% | -0.09% | -0.03% | |
| AUD | 0.04% | -0.01% | -0.05% | -0.04% | -0.07% | -0.16% | -0.11% | |
| NZD | 0.20% | 0.17% | 0.12% | 0.18% | 0.09% | 0.16% | 0.07% | |
| CHF | 0.13% | 0.08% | 0.04% | 0.05% | 0.03% | 0.11% | -0.07% |
The heat map shows percentage changes of major currencies against each other. The base currency is picked from the left column, while the quote currency is picked from the top row. For example, if you pick the Euro from the left column and move along the horizontal line to the US Dollar, the percentage change displayed in the box will represent EUR (base)/USD (quote).
FX option expiries for May 23 NY cut at 10:00 Eastern Time, via DTCC, can be found below
- EUR/USD: EUR amounts
- 1.0755 563m
- 1.0775 435m
- 1.0885 441m
- 1.0900 1.8b
- GBP/USD: GBP amounts
- 1.2615 475m
- 1.2625 438m
- 1.2670 404m
- USD/JPY: USD amounts
- 155.50 335m
- USD/CAD: USD amounts
- 1.3600 690m
- 1.3675 880m
- 1.3755 500m
- NZD/USD: NZD amounts
- 0.6125 439m
- 0.6175 479m
- EUR/GBP: EUR amounts
- 0.8400 454m
- The Pound Sterling holds gains near 1.2750 as a slower-than-expected decline in UK inflation weakens the BoE rate-cut case.
- Investors await the UK/US preliminary S&P Global PMI data for May.
- The US Dollar stays firm as the Fed emphasize wait and watch approach on interest rates.
The Pound Sterling (GBP) clings to gains above the crucial support of 1.2700 in Thursday’s London session. The GBP/USD pair remains firm as traders pare bets that were leaned towards the Bank of England (BoE) shifting to policy-normalization in the June meeting after remaining hawkish for more than two years on interest rates.
The expectations favoring the BoE that it will start reducing interest rates from the June meeting have diminished as the Consumer Price Index (CPI) report for April showed that inflation softened at a slower pace than expected.
According to the CPI report, annual headline and core inflation declined to 2.3% and 3.9%, respectively. The inflation measure that dashed hopes of BoE rate cuts in June is the service price index, which declined modestly to 5.9% from the prior reading of 6.0%. UK’s stubborn service inflation has remained a major barrier in the progress of disinflation, which is driven by wage growth.
Daily digest market movers: Pound Sterling remains firm despite upbeat US Dollar
- The Pound Sterling exhibits strength against the US Dollar as investors expect that rate cuts from the BoE will be delayed due to a slower-than-expected decline in the UK inflation for April. Before the June meeting, the BoE will be having one more employment and inflation data, which could strengthen the case of a rate cut if it comes in line with the central bank’s forecasts.
- Meanwhile, investors await the UK preliminary S&P Global/CIPS PMI data for May that will provide cues about nations’ economic health, which will be published at 08:30 GMT. The Manufacturing PMI is forecasted to have improved to 49.5 from 49.1 but will remain the 50.0 thresholds, which separates expansion from contraction. The Services PMI is estimated to have declined to 54.4 from 55.0 in April.
- The Pound Sterling is expected to remain in action on Friday, too, as the UK Office for National Statistics (ONS) will report the Retail Sales data for April. The Retail Sales data represents household spending, which provides significant cues about the inflation outlook. On a month-on-month basis, Retail Sales are estimated to have declined by 0.4% after remaining stagnant last month. Annually, Retail Sales are expected to have contracted by 0.2% against a growth of 0.8% in March.
- On the other side of the Atlantic, the US Dollar holds gains induced by fears that progress in the United States inflation declining towards the 2% target has stalled. The Federal Open Market Committee (FOMC) minutes for the May meeting, released on Wednesday, suggested that the confidence needed for them to consider rate cuts has been dented due to disappointment from recent inflation data.
- Going forward, investors will focus on the preliminary S&P Global PMI for May and the Initial Jobless Claims data for the week ending May 17. For last two weeks, number of individuals claiming jobless benefits have remained more than expected, which have indicated that the labor market strength is easing.
Technical Analysis: Pound Sterling extends winning spree
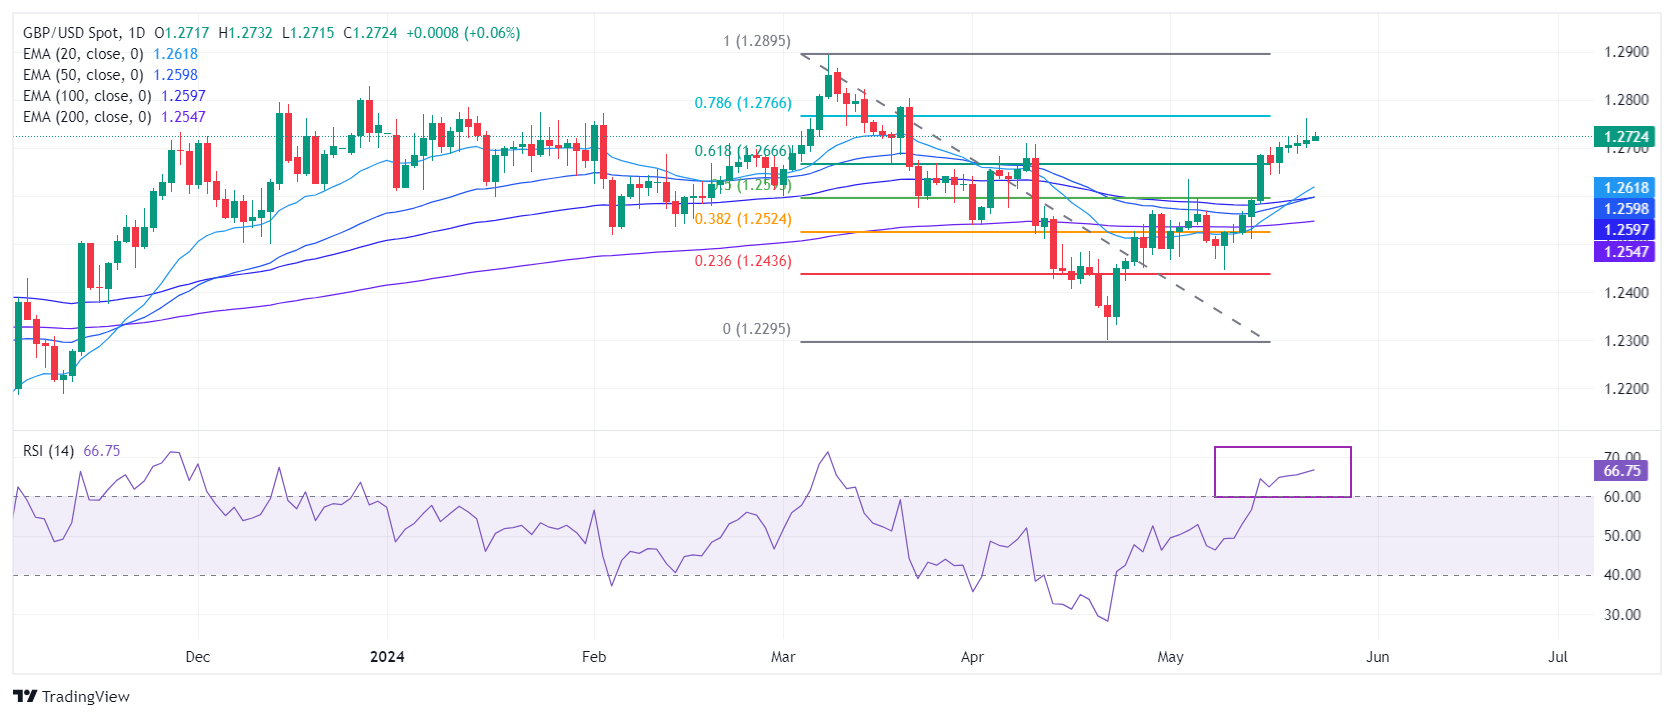
The Pound Sterling extends its winning spell for the fifth trading session on Thursday due to a sharp decline in the BoE rate cut bets for June. The GBP/USD pair has comfortably stabilized above the 61.8% Fibonacci retracement (plotted from the March 8 high of 1.2900 to the April 22 low at 1.2300) at 1.2667.
The Cable is expected to remain in the bullish trajectory as all short-to-long-term Exponential Moving Averages (EMAs) are sloping higher, suggesting a strong uptrend.
The 14-period Relative Strength Index (RSI) has shifted into the bullish range of 60.00-80.00, suggesting that the momentum has leaned toward the upside.
Pound Sterling FAQs
The Pound Sterling (GBP) is the oldest currency in the world (886 AD) and the official currency of the United Kingdom. It is the fourth most traded unit for foreign exchange (FX) in the world, accounting for 12% of all transactions, averaging $630 billion a day, according to 2022 data. Its key trading pairs are GBP/USD, aka ‘Cable’, which accounts for 11% of FX, GBP/JPY, or the ‘Dragon’ as it is known by traders (3%), and EUR/GBP (2%). The Pound Sterling is issued by the Bank of England (BoE).
The single most important factor influencing the value of the Pound Sterling is monetary policy decided by the Bank of England. The BoE bases its decisions on whether it has achieved its primary goal of “price stability” – a steady inflation rate of around 2%. Its primary tool for achieving this is the adjustment of interest rates. When inflation is too high, the BoE will try to rein it in by raising interest rates, making it more expensive for people and businesses to access credit. This is generally positive for GBP, as higher interest rates make the UK a more attractive place for global investors to park their money. When inflation falls too low it is a sign economic growth is slowing. In this scenario, the BoE will consider lowering interest rates to cheapen credit so businesses will borrow more to invest in growth-generating projects.
Data releases gauge the health of the economy and can impact the value of the Pound Sterling. Indicators such as GDP, Manufacturing and Services PMIs, and employment can all influence the direction of the GBP. A strong economy is good for Sterling. Not only does it attract more foreign investment but it may encourage the BoE to put up interest rates, which will directly strengthen GBP. Otherwise, if economic data is weak, the Pound Sterling is likely to fall.
Another significant data release for the Pound Sterling is the Trade Balance. This indicator measures the difference between what a country earns from its exports and what it spends on imports over a given period. If a country produces highly sought-after exports, its currency will benefit purely from the extra demand created from foreign buyers seeking to purchase these goods. Therefore, a positive net Trade Balance strengthens a currency and vice versa for a negative balance.
Here is what you need to know on Thursday, May 23:
The US Dollar (USD) Index seems to have entered a consolidation phase early Thursday after climbing to a weekly high near 105.00 on Tuesday. S&P Global will release preliminary May Manufacturing and Services PMI reports for Germany, the Eurozone, the UK and the US later in the day. The US economic docket will also feature weekly Initial Jobless Claims and April New Home Sales data.
US Dollar PRICE This week
The table below shows the percentage change of US Dollar (USD) against listed major currencies this week. US Dollar was the strongest against the Australian Dollar.
| USD | EUR | GBP | JPY | CAD | AUD | NZD | CHF | |
|---|---|---|---|---|---|---|---|---|
| USD | 0.41% | -0.17% | 0.66% | 0.48% | 1.08% | 0.36% | 0.67% | |
| EUR | -0.41% | -0.61% | 0.31% | 0.08% | 0.70% | -0.04% | 0.26% | |
| GBP | 0.17% | 0.61% | 0.76% | 0.69% | 1.31% | 0.55% | 0.86% | |
| JPY | -0.66% | -0.31% | -0.76% | -0.19% | 0.43% | -0.28% | 0.02% | |
| CAD | -0.48% | -0.08% | -0.69% | 0.19% | 0.55% | -0.12% | 0.18% | |
| AUD | -1.08% | -0.70% | -1.31% | -0.43% | -0.55% | -0.75% | -0.42% | |
| NZD | -0.36% | 0.04% | -0.55% | 0.28% | 0.12% | 0.75% | 0.31% | |
| CHF | -0.67% | -0.26% | -0.86% | -0.02% | -0.18% | 0.42% | -0.31% |
The heat map shows percentage changes of major currencies against each other. The base currency is picked from the left column, while the quote currency is picked from the top row. For example, if you pick the US Dollar from the left column and move along the horizontal line to the Japanese Yen, the percentage change displayed in the box will represent USD (base)/JPY (quote).
The negative shift seen in risk mood helped the USD stay resilient against its rivals in the American session on Wednesday. The minutes of the Federal Reserve's (Fed) April 30-May 1 policy meeting showed that policymakers still believed price pressures would ease, while seeing the need to maintain the restrictive policy at least until September. The benchmark 10-year US Treasury bond yield registered small gains on Wednesday and stabilized above 4.4% early Thursday. Meanwhile, US stock index futures trade in positive territory in the European morning, reflecting an improving risk sentiment.
The data from Australia showed early in the day that the Judo Bank Composite PMI declined to 52.6 in early May from 53 in April. AUD/USD showed no reaction to this report and was last seen trading modestly higher on the day above 0.6600.
Statistics New Zealand reported in the Asian session that Retail Sales grew by 0.5% on a quarterly basis in the first quarter. This reading followed the 1.6% contraction recorded in the previous quarter and came in better than the market expectation for a decline of 0.3%. NZD/USD edged higher after this report and was last seen rising more than 0.3% on the day near 0.6120.
Jibun Bank Manufacturing PMI in Japan improved to 50.5 in May from 49.6 and the Services PMI retreated to 53.6 from 54.3. After rising 0.4% on Wednesday, USD/JPY lost its bullish momentum and started to decline toward 156.50.
Following the choppy action seen earlier in the week, EUR/USD turned south and closed in negative territory on Wednesday. The pair, however, managed to stabilize above 1.0800.
GBP/USD lost its traction and erased a large portion of its daily gains after climbing to a new two-month high above 1.2750 early Wednesday, boosted by the stronger-than-forecast inflation data from the UK. The pair holds steady above 1.2700 in the European morning.
Gold came under heavy selling pressure after breaking below $2,400 and lost more than 1.5% on a daily basis on Wednesday. XAU/USD extends its slide early Thursday and was last seen trading below $2,370, losing over 0.5% on the day.
Economic Indicator
S&P Global Composite PMI
The S&P Global Composite Purchasing Managers Index (PMI), released on a monthly basis, is a leading indicator gauging US private-business activity in the manufacturing and services sector. The data is derived from surveys to senior executives. Each response is weighted according to the size of the company and its contribution to total manufacturing or services output accounted for by the sub-sector to which that company belongs. Survey responses reflect the change, if any, in the current month compared to the previous month and can anticipate changing trends in official data series such as Gross Domestic Product (GDP), industrial production, employment and inflation. The index varies between 0 and 100, with levels of 50.0 signaling no change over the previous month. A reading above 50 indicates that the private economy is generally expanding, a bullish sign for the US Dollar (USD). Meanwhile, a reading below 50 signals that activity is generally declining, which is seen as bearish for USD.
Read more.Last release: Fri May 03, 2024 13:45
Frequency: Monthly
Actual: 51.3
Consensus: 50.9
Previous: 50.9
Source: S&P Global
- USD/CAD trades on a weaker note near 1.3682 in Thursday’s early European session.
- The Fed minutes indicated worries over a lack of progress on inflation.
- The Bank of Canada (BoC) may dampen hopes of a June interest rate cut.
The USD/CAD pair weakens to 1.3682 on Thursday during the early European session. The pair edges lower despite the weaker Greenback and the lower crude oil prices. Investors await the advanced reading of the US S&P Global PMI for May, which is due on Thursday. On Friday, the Canadian Retail Sales will be released.
The US Federal Reserve (Fed) decided to keep its benchmark interest rate in a range of 5.25%–5.50% on May 1. According to the FOMC Minutes statement, the committee acknowledged that inflation remains more sticky than they would have thought. Therefore, the Fed officials prefer to be cautious and wait for more data to gain confidence that inflation will get down to its goal of 2%. Investors are pricing in a nearly 50% chance of a September rate cut, according to the CME FedWatch tool. The higher-for-longer mantra is likely to boost the US Dollar (USD) and cap the pair’s downside in the near term.
On the Loonie front, investors lowered their bets on the June interest rate cut and instead moved to July as the Bank of Canada (BoC) might need to see more sets of inflation, GDP, and jobs data before deciding to cut the interest rate. This, in turn, provides some support to the Canadian Dollar (CAD) and creates a headwind for USD/CAD. The money markets are pricing in a 53% chance of a 25 basis point (bps) cut in June, while the possibility of a July rate cut is fully priced in.
- EUR/USD holds its position ahead of the releases of PMI data from the Eurozone and Germany.
- Eurozone Manufacturing Services PMIs are expected to tick upwards slightly in May.
- FOMC Minutes suggested a hawkish sentiment surrounding the Fed policy stance.
EUR/USD treads water to halt its three-day losing streak, hovering around 1.0820 during the Asian session on Thursday. The Euro's appreciation against the US Dollar (USD) can be attributed to a corrective move for the latter. Investors are likely to await Purchasing Managers Index (PMI) data from both the Eurozone and Germany, with subsequent attention turning to the US PMI later in the North American session on Thursday.
Projections suggest that Eurozone Manufacturing PMI in May is anticipated to rise to 46.2 from 45.7, while the Services PMI is expected to show a slight uptick to 53.5 from 53.3. Meanwhile, in the United States (US), both Manufacturing and Services PMIs are expected to remain unchanged at 50.0 and 51.3, respectively.
The Euro could face challenges ahead as the European Central Bank (ECB) is expected to consider reducing borrowing costs in its June meeting. This anticipation stems from the current inflation rate in the Euro Area, which stands at 2.4%, very close to the ECB's target of 2.0%. President Christine Lagarde recently indicated a high probability of such action in June if data continues to support the confidence that inflation will eventually align with the ECB's target in the medium term.
On Wednesday, the US Dollar (USD) strengthened as the minutes from the latest Federal Open Market Committee (FOMC) policy meeting indicated hawkish sentiment surrounding the Federal Reserve (Fed) policy stance. Fed policymakers expressed concerns about the lack of progress on inflation, which has proven to be more persistent than expected at the start of 2024. As a result, the Fed is hesitant to proceed with interest rate cuts.
- The Japanese Yen remains flat ahead of the US PMI release on Thursday.
- Japan's Manufacturing PMI climbed to 50.5 in May from April's 49.6, suggesting the first expansion since May 2023.
- The US Dollar gained ground after the FOMC Minutes cast doubt on the Fed's willingness to proceed with rate cuts.
The Japanese Yen (JPY) remains flat despite the Bank of Japan (BoJ) announcing on Thursday that it left the Japanese government bonds (JGB) amounts unchanged compared to the previous operation. Over a month ago, the BoJ trimmed the amount of 5-10 years it bought in a scheduled operation.
The JPY avoided to cheer the Purchasing Managers Index (PMI) data from Japan that showed that private sector growth hit a nine-month high in May as manufacturing activity returned to expansion.
The US Dollar (USD) remains slightly tepid ahead of the US PMI data due on Thursday. However, the Greenback gained ground on Wednesday, with the release of minutes from the latest Federal Open Market Committee (FOMC) policy meeting on Wednesday.
Federal Reserve (Fed) policymakers have voiced worries regarding the slow progress on inflation, which has demonstrated greater persistence than initially anticipated at the beginning of 2024. Consequently, the Fed is cautious about moving forward with interest rate cuts.
Daily Digest Market Movers: Japanese Yen remains calm amid US PMI
- Tensions are escalating following Lai Ching-te's assumption of office as Taiwan's new president. Chinese state media reports indicate that China has deployed numerous fighter jets and conducted simulated strikes in specific areas in the region, including actions from naval vessels.
- Japan’s Manufacturing Purchasing Managers Index (PMI), released monthly by Jibun Bank and S&P Global, rose to 50.5 in May from April’s 49.6, surpassing market expectations of 49.7. This marks the first growth since May 2023. Meanwhile, the Services PMI fell to 53.6 from the previous 54.3, still indicating the fastest expansion in eight months.
- On Wednesday, Japan's Merchandise Trade Balance showed that the trade deficit increased to ¥462.5 billion in April, swinging from the previous surplus of ¥387.0 billion. This outcome exceeded market expectations of a deficit of ¥339.5 billion. The deficit was mainly driven by the recent depreciation of the JPY, which led to an increase in the value of imports, outweighing gains from a rise in exports.
- Japan’s 10-year government bond yield surpassed 1% on Wednesday for the first time since May 2013, fueled by traders' increasing bets that the Bank of Japan would tighten policy further in 2024
- According to the CME FedWatch Tool, the probability of the Federal Reserve implementing a 25 basis-point rate cut in September has seen a slight downtick to 50.7%, compared to 51.6% a day ago.
- Federal Reserve Bank of Boston President Susan Collins spoke at the event titled "Central Banking in the Post-Pandemic Financial System" on Tuesday. Collins stated that progress toward interest rate adjustment will take longer and emphasized that patience is the right policy for the Fed, per Reuters.
Technical Analysis: USD/JPY remains above the level of 156.50
The USD/JPY pair trades around 156.70 on Thursday. A rising wedge on a daily chart indicates a bearish turn as the price of the USD/JPY pair moves toward the wedge’s tip. However, the momentum indicator 14-day Relative Strength Index (RSI) is still positioned slightly above the 50 mark. A further decline would be considered as the momentum shift.
The USD/JPY pair could retest the upper boundary of the rising wedge near the psychological barrier at 157.00. A break above this level could propel the pair toward the recent high of 160.32.
On the downside, the lower threshold of the rising wedge would act as immediate support, followed by the 21-day Exponential Moving Average (EMA) at 155.49. A break below this level could exert downward pressure on the USD/JPY pair, potentially moving it toward the throwback support at 151.86.
USD/JPY: Daily Chart
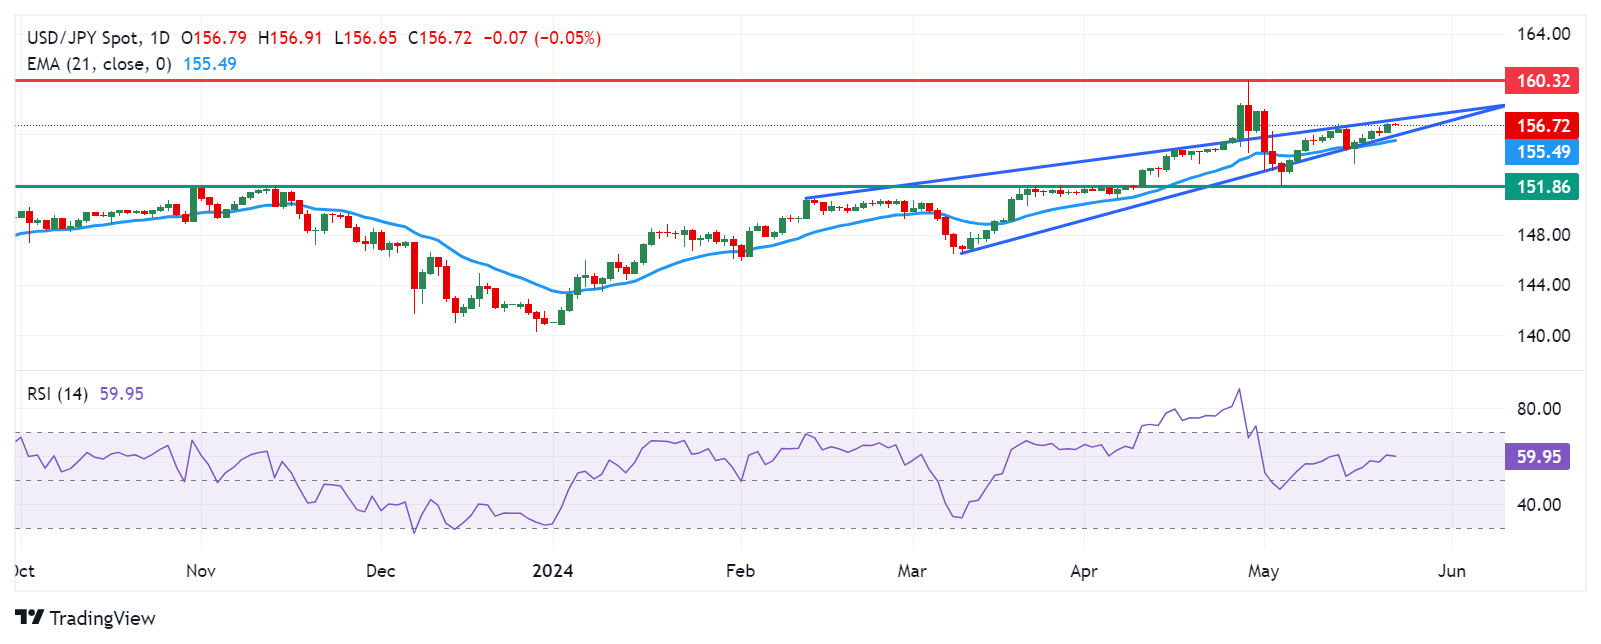
Japanese Yen price today
The table below shows the percentage change of the Japanese Yen (JPY) against listed major currencies today. Japanese Yen was the weakest against the New Zealand Dollar.
| USD | EUR | GBP | CAD | AUD | JPY | NZD | CHF | |
| USD | -0.03% | -0.03% | -0.07% | -0.09% | 0.02% | -0.28% | -0.06% | |
| EUR | 0.01% | -0.03% | -0.05% | -0.09% | 0.04% | -0.27% | -0.06% | |
| GBP | 0.03% | 0.01% | -0.02% | -0.06% | 0.06% | -0.25% | -0.03% | |
| CAD | 0.05% | 0.02% | 0.01% | -0.05% | 0.07% | -0.24% | -0.02% | |
| AUD | 0.10% | 0.07% | 0.07% | 0.03% | 0.11% | -0.19% | 0.03% | |
| JPY | -0.01% | -0.03% | -0.07% | -0.07% | -0.13% | -0.34% | -0.10% | |
| NZD | 0.29% | 0.27% | 0.25% | 0.24% | 0.19% | 0.30% | 0.23% | |
| CHF | 0.07% | 0.04% | 0.03% | 0.01% | -0.03% | 0.09% | -0.21% |
The heat map shows percentage changes of major currencies against each other. The base currency is picked from the left column, while the quote currency is picked from the top row. For example, if you pick the Euro from the left column and move along the horizontal line to the Japanese Yen, the percentage change displayed in the box will represent EUR (base)/JPY (quote).
Japanese Yen FAQs
The Japanese Yen (JPY) is one of the world’s most traded currencies. Its value is broadly determined by the performance of the Japanese economy, but more specifically by the Bank of Japan’s policy, the differential between Japanese and US bond yields, or risk sentiment among traders, among other factors.
One of the Bank of Japan’s mandates is currency control, so its moves are key for the Yen. The BoJ has directly intervened in currency markets sometimes, generally to lower the value of the Yen, although it refrains from doing it often due to political concerns of its main trading partners. The current BoJ ultra-loose monetary policy, based on massive stimulus to the economy, has caused the Yen to depreciate against its main currency peers. This process has exacerbated more recently due to an increasing policy divergence between the Bank of Japan and other main central banks, which have opted to increase interest rates sharply to fight decades-high levels of inflation.
The BoJ’s stance of sticking to ultra-loose monetary policy has led to a widening policy divergence with other central banks, particularly with the US Federal Reserve. This supports a widening of the differential between the 10-year US and Japanese bonds, which favors the US Dollar against the Japanese Yen.
The Japanese Yen is often seen as a safe-haven investment. This means that in times of market stress, investors are more likely to put their money in the Japanese currency due to its supposed reliability and stability. Turbulent times are likely to strengthen the Yen’s value against other currencies seen as more risky to invest in.
- Indian Rupee trades softer on Thursday.
- Foreign outflows in India and the Fed’s hawkish remarks exert some selling pressure on the INR.
- Investors will closely monitor the preliminary May PMI data from India and the US, which is due on Thursday.
Indian Rupee (INR) struggles to gain ground on Thursday. The hawkish stance from the FOMC Minutes and the Federal Reserve (Fed) policymakers boosts the Greenback and creates a tailwind for the pair. Additionally, the foreign outflows ahead of India's upcoming election outcome weigh on the INR. However, the potential foreign exchange intervention from the Reserve Bank of India (RBI) might cap the INR’s weakness in the near term.
Market players will keep an eye on the preliminary India’s HSBC Purchasing Managers Index (PMI) for May on Thursday. Also, the first reading of the US S&P Global PMI will be due later in the day. In case the report shows a stronger-than-estimated reading, this might delay the timing of a rate cut cycle, underpinning the US Dollar (USD).
Daily Digest Market Movers: Indian Rupee weakens amid foreign outflows and the Fed’s hawkish stance
- Food prices remain high in India and may keep inflation elevated, according to the Reserve Bank of India's (RBI) latest ‘state of the economy’ report.
- Foreign investors sold Indian equities worth more than $3 billion in May, the biggest monthly outflow since January 2023.
- The FOMC released the minutes of the April 30 - May 1 policy meeting on Wednesday, indicating that inflation in recent months had shown a lack of further progress toward the Fed’s 2% objective.”
- The Fed Policymakers are likely to keep its benchmark rate unchanged at least until September after their confidence in lowering price pressures was eroded by higher-than-expected inflation in the first three months of the year.
- Financial markets continue to adjust their expectations for rate cuts this year, with nearly a 60% chance of the first reduction in September, according to the CME FedWatch tool.
Technical analysis: USD/INR’s positive stance seems fragile on the daily chart
The Indian Rupee trades on a weaker note on the day. The USD/INR pair has formed the Head and Shoulders pattern since March 21. The bullish outlook of the pair seems vulnerable as the pair hovers around the key 100-day Exponential Moving Average (EMA) and the neckline on the daily chart. A cross below this level will resume its downtrend, with the 14-day Relative Strength Index (RSI) holding below the 50-midline.
The 83.20–83.25 regions act as a crucial support level for USD/INR, portraying the confluence of the 100-day EMA and the neckline. A breach of this level will see a drop to the 83.00 psychological mark, followed by a low of January 15 at 82.78.
On the bright side, the first upside target will emerge at the right shoulder of the Head and Shoulders pattern of 83.54 (high of May 13). A bullish breakout above the mentioned level would end up invalidating the chart pattern and see a rally to a high of April 17 at 83.72, en route to 84.00.
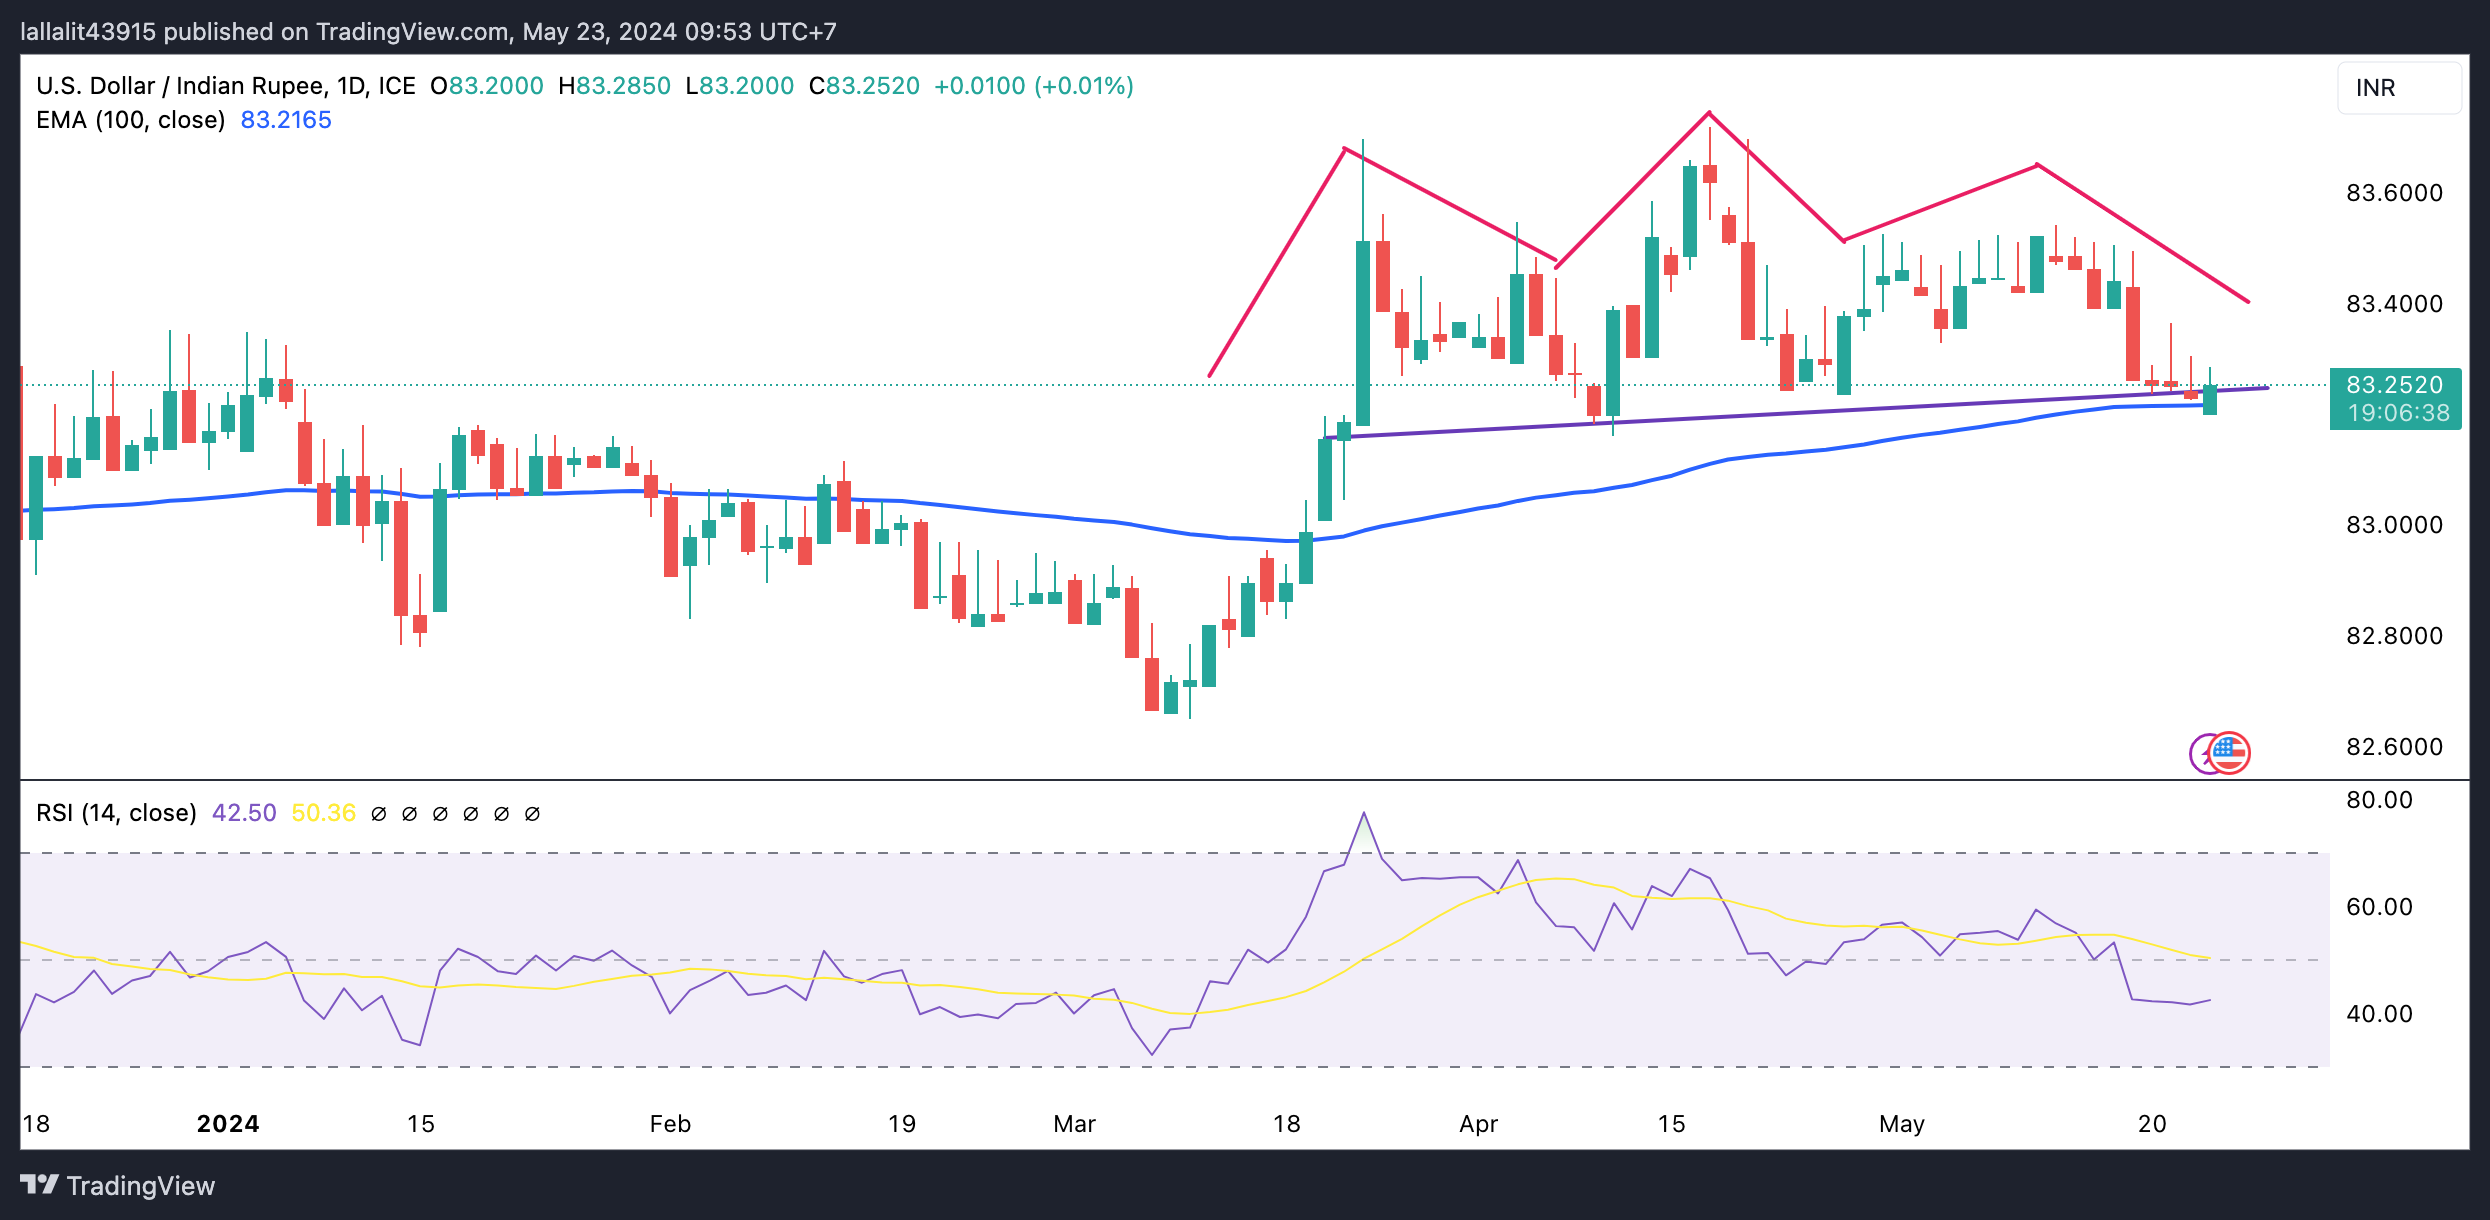
US Dollar price today
The table below shows the percentage change of US Dollar (USD) against listed major currencies today. US Dollar was the strongest against the Japanese Yen.
| USD | EUR | GBP | CAD | AUD | JPY | NZD | CHF | |
| USD | -0.04% | -0.06% | -0.08% | -0.18% | 0.01% | -0.32% | -0.08% | |
| EUR | 0.04% | -0.02% | -0.02% | -0.14% | 0.06% | -0.28% | -0.05% | |
| GBP | 0.06% | 0.03% | 0.00% | -0.12% | 0.09% | -0.25% | -0.03% | |
| CAD | 0.06% | 0.02% | -0.01% | -0.12% | 0.08% | -0.26% | -0.03% | |
| AUD | 0.19% | 0.14% | 0.12% | 0.10% | 0.19% | -0.14% | 0.09% | |
| JPY | -0.01% | -0.06% | -0.10% | -0.08% | -0.20% | -0.35% | -0.13% | |
| NZD | 0.32% | 0.28% | 0.26% | 0.25% | 0.14% | 0.33% | 0.24% | |
| CHF | 0.10% | 0.05% | 0.03% | 0.03% | -0.09% | 0.11% | -0.23% |
The heat map shows percentage changes of major currencies against each other. The base currency is picked from the left column, while the quote currency is picked from the top row. For example, if you pick the Euro from the left column and move along the horizontal line to the Japanese Yen, the percentage change displayed in the box will represent EUR (base)/JPY (quote).
Indian Rupee FAQs
The Indian Rupee (INR) is one of the most sensitive currencies to external factors. The price of Crude Oil (the country is highly dependent on imported Oil), the value of the US Dollar – most trade is conducted in USD – and the level of foreign investment, are all influential. Direct intervention by the Reserve Bank of India (RBI) in FX markets to keep the exchange rate stable, as well as the level of interest rates set by the RBI, are further major influencing factors on the Rupee.
The Reserve Bank of India (RBI) actively intervenes in forex markets to maintain a stable exchange rate, to help facilitate trade. In addition, the RBI tries to maintain the inflation rate at its 4% target by adjusting interest rates. Higher interest rates usually strengthen the Rupee. This is due to the role of the ‘carry trade’ in which investors borrow in countries with lower interest rates so as to place their money in countries’ offering relatively higher interest rates and profit from the difference.
Macroeconomic factors that influence the value of the Rupee include inflation, interest rates, the economic growth rate (GDP), the balance of trade, and inflows from foreign investment. A higher growth rate can lead to more overseas investment, pushing up demand for the Rupee. A less negative balance of trade will eventually lead to a stronger Rupee. Higher interest rates, especially real rates (interest rates less inflation) are also positive for the Rupee. A risk-on environment can lead to greater inflows of Foreign Direct and Indirect Investment (FDI and FII), which also benefit the Rupee.
Higher inflation, particularly, if it is comparatively higher than India’s peers, is generally negative for the currency as it reflects devaluation through oversupply. Inflation also increases the cost of exports, leading to more Rupees being sold to purchase foreign imports, which is Rupee-negative. At the same time, higher inflation usually leads to the Reserve Bank of India (RBI) raising interest rates and this can be positive for the Rupee, due to increased demand from international investors. The opposite effect is true of lower inflation.
- The Australian Dollar appreciates ahead of US PMI data on Thursday.
- Australia's Consumer inflation expectations dropped to 4.1% in May from 4.6% in April, hitting the lowest point since October 2021.
- FOMC Minutes suggested the lack of progress on inflation, casting doubt on the Fed's potential to proceed with rate cuts.
The Australian Dollar (AUD) halts its three-day losing streak on Thursday, possibly driven by the improved risk appetite. However, the Aussie Dollar came under pressure following the Consumer Inflation Expectation, released by the Melbourne Institute. Consumer expectations of future inflation over the next 12 months fell to 4.1% in May from 4.6% in April, marking the lowest level since October 2021.
Australian private sector activity remained expansionary for the fourth straight month in May. The preliminary Judo Bank Composite Purchasing Managers Index (PMI) decreased to 52.6 in May from April’s reading of 53.0, indicating a slight moderation in growth. The growth was mainly fueled by an expansion in the services sector, while the decline in manufacturing output slowed down.
The US Dollar (USD) remains strong following recent gains, as the minutes from the latest Federal Open Market Committee (FOMC) policy meeting were released on Wednesday. Federal Reserve (Fed) policymakers expressed concerns about the lack of progress on inflation, which has proven to be more persistent than expected at the start of 2024. As a result, the Fed is hesitant to proceed with interest rate cuts.
Daily Digest Market Movers: Australian Dollar inches higher due to risk-on mood
- The Judo Bank Australia Services PMI was 53.1 in May, down from April’s reading of 53.6. This marks the fourth consecutive month of expansion, albeit at a slower yet still solid pace. The Manufacturing PMI remained unchanged at 49.6 in May, indicating that manufacturing conditions continued to deteriorate for the fourth consecutive month.
- The ASX 200 Index moves below 7,800 on Thursday due to declines in mining and energy stocks following a significant drop in commodity prices. Additionally, Australian shares were influenced by a weak performance on Wall Street overnight, after FOMC meeting minutes suggested concerns about the slow progress on inflation.
- According to the CME FedWatch Tool, the probability of the Federal Reserve implementing a 25 basis-point rate cut in September has seen a slight downtick to 50.7%, compared to 51.6% a day ago.
- Federal Reserve Bank of Boston President Susan Collins spoke at the event titled "Central Banking in the Post-Pandemic Financial System" on Tuesday. Collins stated that progress toward interest rate adjustment will take longer and emphasized that patience is the right policy for the Fed, per Reuters. Fed Governor Christopher Waller stated that he needs to see several more months of favorable inflation data before he would be comfortable supporting an easing in policy.
- Minutes from the RBA meeting in May 2024 showed that the board considered raising rates but ultimately judged the case for maintaining a steady policy to be stronger. Policymakers agreed that it was challenging to either rule in or rule out future changes in the cash rate. They noted that the flow of data had increased the risk of inflation remaining above the target for an extended period.
Technical Analysis: Australian Dollar remains below a key level of 0.6650
The Australian Dollar trades around 0.6620 on Thursday. The Analysis of the daily chart indicates a weakening of a bullish bias as the AUD/USD pair has breached below the lower boundary of the ascending triangle. Despite this, the 14-day Relative Strength Index (RSI) remains slightly above the 50 level. However, a further decline in this momentum indicator could confirm a bearish bias.
The psychological support level of 0.6600 is significant. A continued decline may increase pressure on the AUD/USD pair, potentially leading it toward the throwback support region at 0.6470.
Conversely, the nine-day Exponential Moving Average (EMA) at 0.6639 could pose immediate resistance, followed by the major level of 0.6650. Breaking above the lower boundary of the ascending triangle could reinforce the prevailing bullish bias for the AUD/USD pair.
AUD/USD: Daily Chart
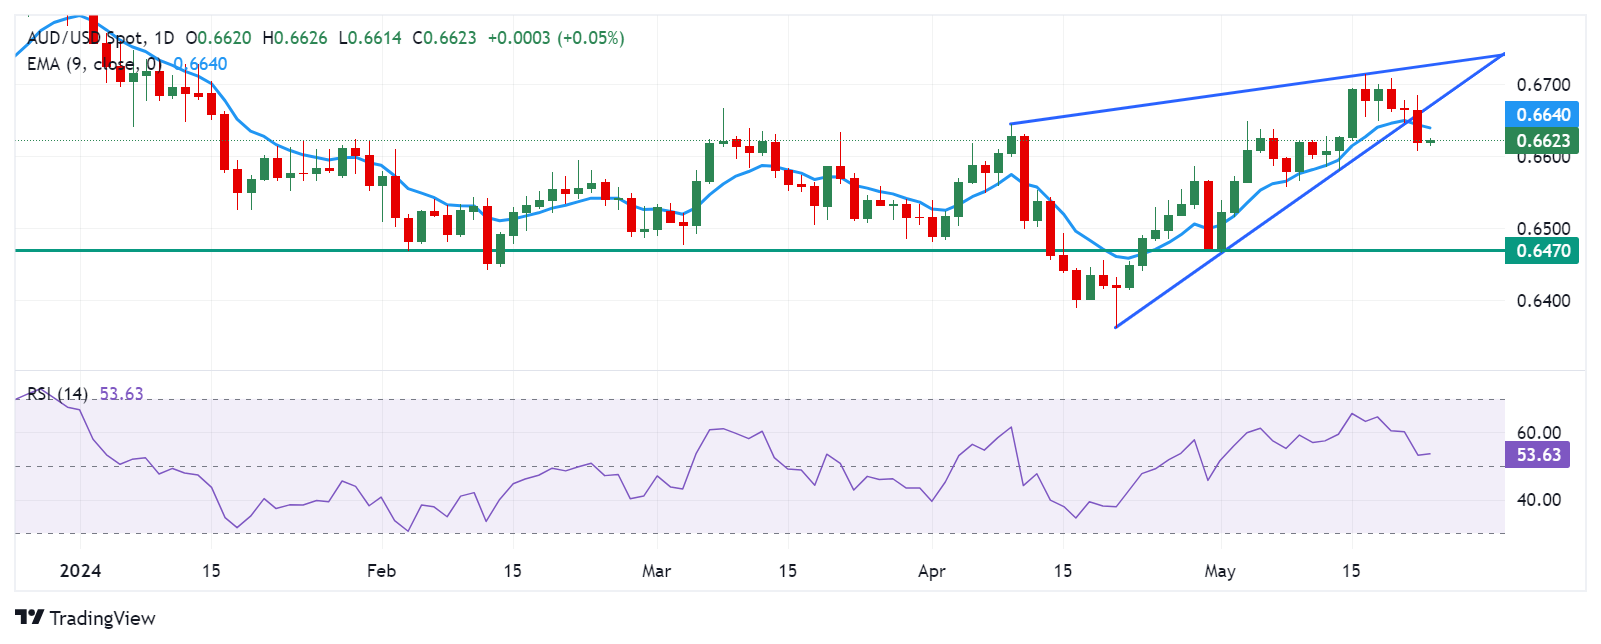
Australian Dollar price today
The table below shows the percentage change of the Australian Dollar (AUD) against listed major currencies today. The Australian Dollar was the strongest against the Japanese Yen.
| USD | EUR | GBP | CAD | AUD | JPY | NZD | CHF | |
| USD | -0.03% | -0.04% | -0.03% | -0.07% | 0.03% | -0.18% | -0.07% | |
| EUR | 0.03% | -0.01% | 0.01% | -0.04% | 0.07% | -0.14% | -0.05% | |
| GBP | 0.04% | 0.01% | 0.02% | -0.02% | 0.06% | -0.12% | -0.04% | |
| CAD | 0.02% | -0.01% | -0.02% | -0.04% | 0.06% | -0.15% | -0.06% | |
| AUD | 0.07% | 0.04% | 0.04% | 0.04% | 0.09% | -0.11% | -0.01% | |
| JPY | -0.01% | -0.05% | -0.08% | -0.04% | -0.10% | -0.19% | -0.10% | |
| NZD | 0.18% | 0.14% | 0.14% | 0.16% | 0.11% | 0.20% | 0.11% | |
| CHF | 0.09% | 0.05% | 0.05% | 0.07% | 0.02% | 0.12% | -0.09% |
The heat map shows percentage changes of major currencies against each other. The base currency is picked from the left column, while the quote currency is picked from the top row. For example, if you pick the Euro from the left column and move along the horizontal line to the Japanese Yen, the percentage change displayed in the box will represent EUR (base)/JPY (quote).
Australian Dollar FAQs
One of the most significant factors for the Australian Dollar (AUD) is the level of interest rates set by the Reserve Bank of Australia (RBA). Because Australia is a resource-rich country another key driver is the price of its biggest export, Iron Ore. The health of the Chinese economy, its largest trading partner, is a factor, as well as inflation in Australia, its growth rate, and Trade Balance. Market sentiment – whether investors are taking on more risky assets (risk-on) or seeking safe havens (risk-off) – is also a factor, with risk-on positive for AUD.
The Reserve Bank of Australia (RBA) influences the Australian Dollar (AUD) by setting the level of interest rates that Australian banks can lend to each other. This influences the level of interest rates in the economy as a whole. The main goal of the RBA is to maintain a stable inflation rate of 2-3% by adjusting interest rates up or down. Relatively high interest rates compared to other major central banks support the AUD, and the opposite for relatively low. The RBA can also use quantitative easing and tightening to influence credit conditions, with the former AUD-negative and the latter AUD-positive.
China is Australia’s largest trading partner so the health of the Chinese economy is a major influence on the value of the Australian Dollar (AUD). When the Chinese economy is doing well it purchases more raw materials, goods and services from Australia, lifting demand for the AUD, and pushing up its value. The opposite is the case when the Chinese economy is not growing as fast as expected. Positive or negative surprises in Chinese growth data, therefore, often have a direct impact on the Australian Dollar and its pairs.
Iron Ore is Australia’s largest export, accounting for $118 billion a year according to data from 2021, with China as its primary destination. The price of Iron Ore, therefore, can be a driver of the Australian Dollar. Generally, if the price of Iron Ore rises, AUD also goes up, as aggregate demand for the currency increases. The opposite is the case if the price of Iron Ore falls. Higher Iron Ore prices also tend to result in a greater likelihood of a positive Trade Balance for Australia, which is also positive of the AUD.
The Trade Balance, which is the difference between what a country earns from its exports versus what it pays for its imports, is another factor that can influence the value of the Australian Dollar. If Australia produces highly sought after exports, then its currency will gain in value purely from the surplus demand created from foreign buyers seeking to purchase its exports versus what it spends to purchase imports. Therefore, a positive net Trade Balance strengthens the AUD, with the opposite effect if the Trade Balance is negative.
New Zealand's (NZ) Finance Minister Nicola Willis said in a speech on Thursday that The (government's) deficit is expected to be larger next year than it is this year, before starting to improve."
Additional quotes
Treasury estimates structural operating deficit of around 1.5% of GDP in current financial year.
Expect an uplift in capital funding in the budget.
The NZ governemnt is set to release the release its budget and fiscal forecasts on May 30.
Market reaction
NZD/USD is defending 0.6100 despite the discouraging comments from the NZ official. The pair is up 0.20% on the day, as of writing.
New Zealand Dollar FAQs
The New Zealand Dollar (NZD), also known as the Kiwi, is a well-known traded currency among investors. Its value is broadly determined by the health of the New Zealand economy and the country’s central bank policy. Still, there are some unique particularities that also can make NZD move. The performance of the Chinese economy tends to move the Kiwi because China is New Zealand’s biggest trading partner. Bad news for the Chinese economy likely means less New Zealand exports to the country, hitting the economy and thus its currency. Another factor moving NZD is dairy prices as the dairy industry is New Zealand’s main export. High dairy prices boost export income, contributing positively to the economy and thus to the NZD.
The Reserve Bank of New Zealand (RBNZ) aims to achieve and maintain an inflation rate between 1% and 3% over the medium term, with a focus to keep it near the 2% mid-point. To this end, the bank sets an appropriate level of interest rates. When inflation is too high, the RBNZ will increase interest rates to cool the economy, but the move will also make bond yields higher, increasing investors’ appeal to invest in the country and thus boosting NZD. On the contrary, lower interest rates tend to weaken NZD. The so-called rate differential, or how rates in New Zealand are or are expected to be compared to the ones set by the US Federal Reserve, can also play a key role in moving the NZD/USD pair.
Macroeconomic data releases in New Zealand are key to assess the state of the economy and can impact the New Zealand Dollar’s (NZD) valuation. A strong economy, based on high economic growth, low unemployment and high confidence is good for NZD. High economic growth attracts foreign investment and may encourage the Reserve Bank of New Zealand to increase interest rates, if this economic strength comes together with elevated inflation. Conversely, if economic data is weak, NZD is likely to depreciate.
The New Zealand Dollar (NZD) tends to strengthen during risk-on periods, or when investors perceive that broader market risks are low and are optimistic about growth. This tends to lead to a more favorable outlook for commodities and so-called ‘commodity currencies’ such as the Kiwi. Conversely, NZD tends to weaken at times of market turbulence or economic uncertainty as investors tend to sell higher-risk assets and flee to the more-stable safe havens.
| Raw materials | Closed | Change, % |
|---|---|---|
| Silver | 30.773 | -3.99 |
| Gold | 2378.09 | -1.78 |
| Palladium | 996.27 | -2.84 |
- NZD/USD trades in positive territory near 0.6108 in Thursday’s Asian session.
- The RBNZ’s hawkish hold has boosted the Kiwi.
- Fed minutes offered the cautious tine, indicating worries over the lack of progress on inflation.
The NZD/USD pair gains momentum around 0.6108 during the Asian trading hours on Thursday. The New Zealand Dollar (NZD) edges higher as the Reserve Bank of New Zealand (RBNZ) kept interest rates steady and signaled the potential delay in interest rate cuts due to headwinds from sticky inflation.
The RBNZ decided to keep the policy rate steady at 5.50% for the seventh meeting in a row at its May meeting on Wednesday. The central bank noted in the statement that “the welcome decline in inflation in part reflects lower inflation for goods and services imported into New Zealand. However, service inflation is receding slowly, and expected policy interest rate cuts continue to be delayed.” The RBNZ added that it expects inflation to ease within its target range by the end of 2024. The hawkish hold of the New Zealand central bank provides some support to the Kiwi and creates a tailwind for the NZD/USD pair.
On the USD’s front, the Federal Reserve (Fed) released the minutes of the April 30-May 1 policy meeting on Wednesday, indicating that inflation in recent months has been a lack of further progress toward the Fed’s 2 percent objective.” Investors continue to adjust their expectations for rate cuts this year, with nearly 60% odds of the first reduction in September, according to the CME FedWatch tool. The attention will shift to the advanced reading of the US Purchasing Managers Index (PMI) for May. In the case of a stronger reading, this might lift the Greenback and cap the pair’s upside in the near term.
The Bank of Japan (BoJ) announced on Thursday that it left the Japanese government bonds (JGB) amounts unchanged compared to the previous operation.
Key details
The BoJ offers to buy:
JPY375 billion (bn) 1-3 Year.
JPY425 bn 3-5 Year.
JPY425 bn 5-10 Year.
Over a month ago, the BoJ trimmed the amount of 5-10 years it bought in a scheduled operation.
Market reaction
USD/JPY tested the 157.00 level before retracing to 156.75 following the above headlines, currently flat on the day.
Bank of Japan FAQs
The Bank of Japan (BoJ) is the Japanese central bank, which sets monetary policy in the country. Its mandate is to issue banknotes and carry out currency and monetary control to ensure price stability, which means an inflation target of around 2%.
The Bank of Japan has embarked in an ultra-loose monetary policy since 2013 in order to stimulate the economy and fuel inflation amid a low-inflationary environment. The bank’s policy is based on Quantitative and Qualitative Easing (QQE), or printing notes to buy assets such as government or corporate bonds to provide liquidity. In 2016, the bank doubled down on its strategy and further loosened policy by first introducing negative interest rates and then directly controlling the yield of its 10-year government bonds.
The Bank’s massive stimulus has caused the Yen to depreciate against its main currency peers. This process has exacerbated more recently due to an increasing policy divergence between the Bank of Japan and other main central banks, which have opted to increase interest rates sharply to fight decades-high levels of inflation. The BoJ’s policy of holding down rates has led to a widening differential with other currencies, dragging down the value of the Yen.
A weaker Yen and the spike in global energy prices have led to an increase in Japanese inflation, which has exceeded the BoJ’s 2% target. Still, the Bank judges that the sustainable and stable achievement of the 2% target has not yet come in sight, so any sudden change in the current policy looks unlikely.
- Gold price trades with a negative bias on Thursday.
- The hawkish stance of the FOMC minutes from last month's meeting might cap the precious metal’s upside.
- Investors will focus on the first reading of US PMI data for May, due on Thursday.
Gold price (XAU/USD) extends the decline on Wednesday. The further upside of the yellow metal might be limited, as the FOMC minutes were interpreted as significantly more hawkish than previous releases. The cautious approach of the US Fed to hold its restrictive policy for longer boosts the Greenback broadly and exerts some selling pressure on the gold price.
Gold traders will closely watch the preliminary reading of the US Manufacturing and Services Purchasing Managers Index (PMI) for May. A weaker reading might trigger hope for Fed rate cuts and support gold. Additionally, geopolitical tensions, uncertainties, and sticky inflation could support the precious metal and cap the downside in the near term. Apart from this, the Chicago Fed National Activity Index, weekly Initial Jobless Claims, New Home Sales, and Fed’s Bostic will be in focus.
Daily Digest Market Movers: Gold price remains sensitive to the Fed’s hawkish remarks
- The minutes from the recent policy meeting of the FOMC released Wednesday indicated that “participants observed that while inflation had eased over the past year, in recent months there had been a lack of further progress toward the Committee’s 2 percent objective.”
- The minutes further stated that “participants assessed that maintaining the current target range for the federal funds rate at this meeting was supported by data indicating continued solid economic growth.”
- Investors have priced in nearly a 60% chance of the first cut to happen in September and two reductions of a quarter percentage point before the end of the year, according to the CME FedWatch Tool.
- The preliminary of US S&P Global Manufacturing and Service PMI is expected to remain unchanged at 50.0 and 51.3 in May, respectively.
- The People's Bank of China (PBoC) has been the largest buyer among its worldwide counterparts over the past year. Its addition of 225 tonnes to its gold reserves last year was the highest on record since at least 1977.
Technical Analysis: Gold price keeps the bullish vibe on the daily chart, eyes are on a Bearish Divergence
Gold price trades softer on the day. The constructive view of the yellow metal remains intact as it is above the key 100-period Exponential Moving Average (EMA) on the daily timeframe. The 14-day Relative Strength Index (RSI) holds above the bullish zone near 56.10, supporting the buyers for the time being. Nonetheless, XAU/USD has formed a bearish divergence as the price has moved to an all-time high on May 20, but the RSI indicator has formed lower highs, suggesting the momentum is slowing and there will likely be a correction or consolidation in price in the near term.
The key resistance level for the precious metal will emerge near the the upper boundary of Bollinger Band and an all-time high of $2,450. A break above this level will expose the $2,500 psychological round mark.
On the downside, a low of May 13 at $2,332 acts as an initial support level for gold. The additional downside filter to watch is the lower limit of the Bollinger Band at $2,270. A breach of the mentioned level will see a drop to the 100-period EMA of $2,216.
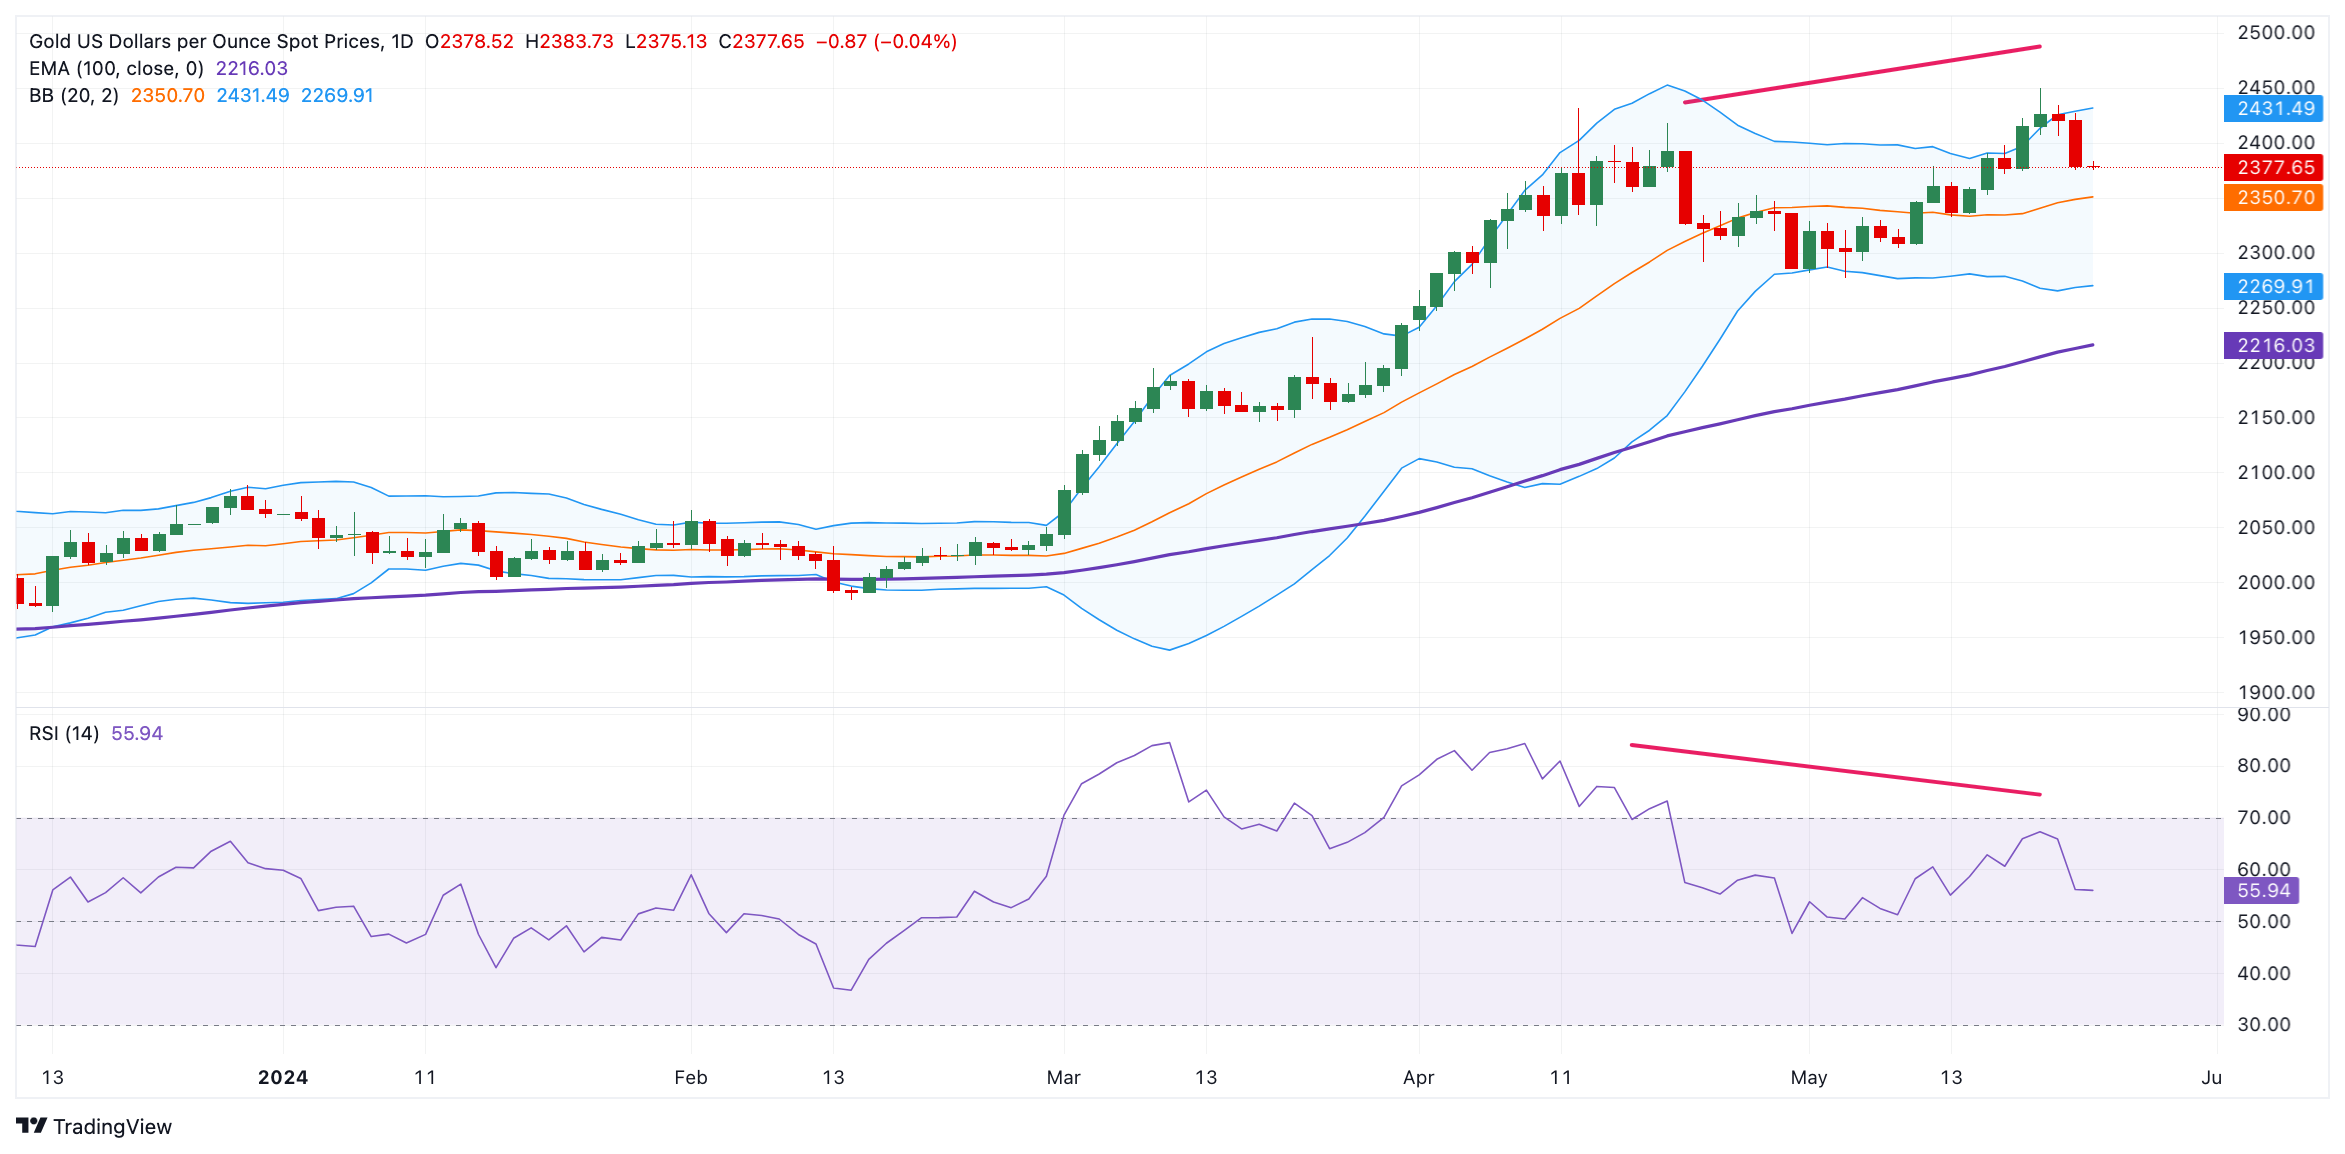
US Dollar price today
The table below shows the percentage change of US Dollar (USD) against listed major currencies today. US Dollar was the weakest against the .
| USD | EUR | GBP | CAD | AUD | JPY | NZD | CHF | |
| USD | -0.02% | -0.01% | 0.00% | -0.02% | 0.09% | -0.12% | 0.00% | |
| EUR | 0.02% | 0.00% | 0.03% | -0.01% | 0.12% | -0.10% | 0.01% | |
| GBP | 0.01% | 0.00% | 0.03% | -0.01% | 0.12% | -0.10% | 0.01% | |
| CAD | -0.01% | -0.03% | -0.03% | -0.05% | 0.09% | -0.13% | -0.02% | |
| AUD | 0.04% | 0.01% | 0.02% | 0.03% | 0.12% | -0.09% | 0.02% | |
| JPY | -0.08% | -0.10% | -0.12% | -0.07% | -0.16% | -0.22% | -0.10% | |
| NZD | 0.12% | 0.10% | 0.11% | 0.13% | 0.09% | 0.20% | 0.12% | |
| CHF | 0.02% | -0.01% | -0.01% | 0.03% | -0.02% | 0.11% | -0.11% |
The heat map shows percentage changes of major currencies against each other. The base currency is picked from the left column, while the quote currency is picked from the top row. For example, if you pick the Euro from the left column and move along the horizontal line to the Japanese Yen, the percentage change displayed in the box will represent EUR (base)/JPY (quote).
Gold FAQs
Gold has played a key role in human’s history as it has been widely used as a store of value and medium of exchange. Currently, apart from its shine and usage for jewelry, the precious metal is widely seen as a safe-haven asset, meaning that it is considered a good investment during turbulent times. Gold is also widely seen as a hedge against inflation and against depreciating currencies as it doesn’t rely on any specific issuer or government.
Central banks are the biggest Gold holders. In their aim to support their currencies in turbulent times, central banks tend to diversify their reserves and buy Gold to improve the perceived strength of the economy and the currency. High Gold reserves can be a source of trust for a country’s solvency. Central banks added 1,136 tonnes of Gold worth around $70 billion to their reserves in 2022, according to data from the World Gold Council. This is the highest yearly purchase since records began. Central banks from emerging economies such as China, India and Turkey are quickly increasing their Gold reserves.
Gold has an inverse correlation with the US Dollar and US Treasuries, which are both major reserve and safe-haven assets. When the Dollar depreciates, Gold tends to rise, enabling investors and central banks to diversify their assets in turbulent times. Gold is also inversely correlated with risk assets. A rally in the stock market tends to weaken Gold price, while sell-offs in riskier markets tend to favor the precious metal.
The price can move due to a wide range of factors. Geopolitical instability or fears of a deep recession can quickly make Gold price escalate due to its safe-haven status. As a yield-less asset, Gold tends to rise with lower interest rates, while higher cost of money usually weighs down on the yellow metal. Still, most moves depend on how the US Dollar (USD) behaves as the asset is priced in dollars (XAU/USD). A strong Dollar tends to keep the price of Gold controlled, whereas a weaker Dollar is likely to push Gold prices up.
The People’s Bank of China (PBoC) set the USD/CNY central rate for the trading session ahead on Thursday at 7.1098, as against the previous day's fix of 7.1077 and 7.2451 Reuters estimates.
| Index | Change, points | Closed | Change, % |
|---|---|---|---|
| NIKKEI 225 | -329.83 | 38617.1 | -0.85 |
| Hang Seng | -25.02 | 19195.6 | -0.13 |
| KOSPI | -0.72 | 2723.46 | -0.03 |
| ASX 200 | -3.6 | 7848.1 | -0.05 |
| DAX | -46.56 | 18680.2 | -0.25 |
| CAC 40 | -49.35 | 8092.11 | -0.61 |
| Dow Jones | -201.95 | 39671.04 | -0.51 |
| S&P 500 | -14.4 | 5307.01 | -0.27 |
| NASDAQ Composite | -31.08 | 16801.54 | -0.18 |
| Pare | Closed | Change, % |
|---|---|---|
| AUDUSD | 0.66186 | -0.75 |
| EURJPY | 169.637 | 0.06 |
| EURUSD | 1.08232 | -0.3 |
| GBPJPY | 199.312 | 0.41 |
| GBPUSD | 1.27176 | 0.05 |
| NZDUSD | 0.6094 | -0.01 |
| USDCAD | 1.36905 | 0.37 |
| USDCHF | 0.9152 | 0.49 |
| USDJPY | 156.724 | 0.36 |
The Reserve Bank of New Zealand (RBNZ) Governor Orr said on Thursday that the central bank can start to ease before inflation hits 2%, per Bloomberg.
Key quotes
Avoiding the risk of inflation expectations blowout.
Patience on inflation not exhausted.
Policy will not hinge on any single piece of data.
Can begin easing measures before inflation reaches 2%.
Market reaction
The NZD/USD pair is trading higher by 0.04% on the day to trade at 0.6099, as of writing.
RBNZ FAQs
The Reserve Bank of New Zealand (RBNZ) is the country’s central bank. Its economic objectives are achieving and maintaining price stability – achieved when inflation, measured by the Consumer Price Index (CPI), falls within the band of between 1% and 3% – and supporting maximum sustainable employment.
The Reserve Bank of New Zealand’s (RBNZ) Monetary Policy Committee (MPC) decides the appropriate level of the Official Cash Rate (OCR) according to its objectives. When inflation is above target, the bank will attempt to tame it by raising its key OCR, making it more expensive for households and businesses to borrow money and thus cooling the economy. Higher interest rates are generally positive for the New Zealand Dollar (NZD) as they lead to higher yields, making the country a more attractive place for investors. On the contrary, lower interest rates tend to weaken NZD.
Employment is important for the Reserve Bank of New Zealand (RBNZ) because a tight labor market can fuel inflation. The RBNZ’s goal of “maximum sustainable employment” is defined as the highest use of labor resources that can be sustained over time without creating an acceleration in inflation. “When employment is at its maximum sustainable level, there will be low and stable inflation. However, if employment is above the maximum sustainable level for too long, it will eventually cause prices to rise more and more quickly, requiring the MPC to raise interest rates to keep inflation under control,” the bank says.
In extreme situations, the Reserve Bank of New Zealand (RBNZ) can enact a monetary policy tool called Quantitative Easing. QE is the process by which the RBNZ prints local currency and uses it to buy assets – usually government or corporate bonds – from banks and other financial institutions with the aim to increase the domestic money supply and spur economic activity. QE usually results in a weaker New Zealand Dollar (NZD). QE is a last resort when simply lowering interest rates is unlikely to achieve the objectives of the central bank. The RBNZ used it during the Covid-19 pandemic.


© 2000-2024. Sva prava zaštićena.
Sajt je vlasništvo kompanije Teletrade D.J. LLC 2351 LLC 2022 (Euro House, Richmond Hill Road, Kingstown, VC0100, St. Vincent and the Grenadines).
Svi podaci koji se nalaze na sajtu ne predstavljaju osnovu za donošenje investicionih odluka, već su informativnog karaktera.
The company does not serve or provide services to customers who are residents of the US, Canada, Iran, The Democratic People's Republic of Korea, Yemen and FATF blacklisted countries.
Izvršenje trgovinskih operacija sa finansijskim instrumentima upotrebom marginalne trgovine pruža velike mogućnosti i omogućava investitorima ostvarivanje visokih prihoda. Međutim, takav vid trgovine povezan je sa potencijalno visokim nivoom rizika od gubitka sredstava. Проведение торговых операций на финанcовых рынках c маржинальными финанcовыми инcтрументами открывает широкие возможноcти, и позволяет инвеcторам, готовым пойти на риcк, получать выcокую прибыль, но при этом неcет в cебе потенциально выcокий уровень риcка получения убытков. Iz tog razloga je pre započinjanja trgovine potrebno odlučiti o izboru odgovarajuće investicione strategije, uzimajući u obzir raspoložive resurse.
Upotreba informacija: U slučaju potpunog ili delimičnog preuzimanja i daljeg korišćenja materijala koji se nalazi na sajtu, potrebno je navesti link odgovarajuće stranice na sajtu kompanije TeleTrade-a kao izvora informacija. Upotreba materijala na internetu mora biti praćena hiper linkom do web stranice teletrade.org. Automatski uvoz materijala i informacija sa stranice je zabranjen.
Ako imate bilo kakvih pitanja, obratite nam se pr@teletrade.global.
транcфери