- Analiza
- Novosti i instrumenti
- Vesti sa tržišta
Forex-novosti i prognoze od 21-08-2024
- EUR/USD crossed into new highs for the year as markets sell off the US Dollar.
- Investors are broadly anticipating further signs pointing to a September rate cut.
- US PMI figures still loom ahead alongside the impending kickoff of Jackson Hole.
EUR/USD breached into a fresh 13-month peak on Wednesday, testing north of 1.1150 as the pair continues to grind its way toward 1.1200. Markets are selling off the Greenback across the board as investor confidence in a September rate cut rises to dizzying highs. The Federal Reserve (Fed) is broadly expected to deliver at least a quarter-point rate cut on September 18, with markets hoping for the possibility of a double cut.
According to the Fed’s latest Meeting Minutes, policymakers noted that discussions of when to deliver rate cuts to pleading market participants had already begin in July, further firming up odds of at least a quarter-point trim on September 18. In true market participant fashion, rate markets bolstered their bets of a double cut from the Federal Open Market Committee’s (FOMC) September meeting, with rate traders pricing in nearly 40% odds of a 50 bps trim on September 18.
Pan-European Purchasing Managers Index (PMI) activity survey results are expected early Thursday, with the EU Manufacturing and Services PMIs for August both expected to hold steady, at 45.8 and 51.9, respectively.
US Purchasing Manager Index (PMI) business activity survey results are slated for release on Thursday, as well as the kickoff of the annual Jackson Hole Symposium which is set to run through the weekend. Wednesday will deliver the Federal Reserve’s (Fed) latest Meeting Minutes, but market forces will broadly be looking ahead to Thursday’s outings for reasons to move.
US S&P Global Manufacturing PMI activity expectations are forecast to hold steady at 49.6 in August, while the Services PMI component is expected to tick down a full point to 54.0 from 55.0. The kickoff of the Jackson Hole Symposium is expected to draw plenty of investor attention on Thursday, but Friday’s appearance from Fed Chairman Jerome Powell can be expected to set the overall tone of market sentiment heading into next week.
EUR/USD price forecast
Fiber claimed a fourth straight bullish candle on Wednesday, tipping into 1.1174 for the first time in over a year. The pair has closed in the green for all but one of the last eight straight trading days, with EUR/USD chalking in over 3.5% in gains since the pair’s last swing low into the 1.0800 handle before catching a bullish bounce off of the 200-day Exponential Moving Average (EMA), which is now rising into 1.0825.
With the pair continuing to defy gravity, the way is clear to the 1.1200 handle, with bidding pressure supported by a fresh high-low pattern baked into the daily candlesticks from 2024’s April lows near 1.0600.
EUR/USD daily chart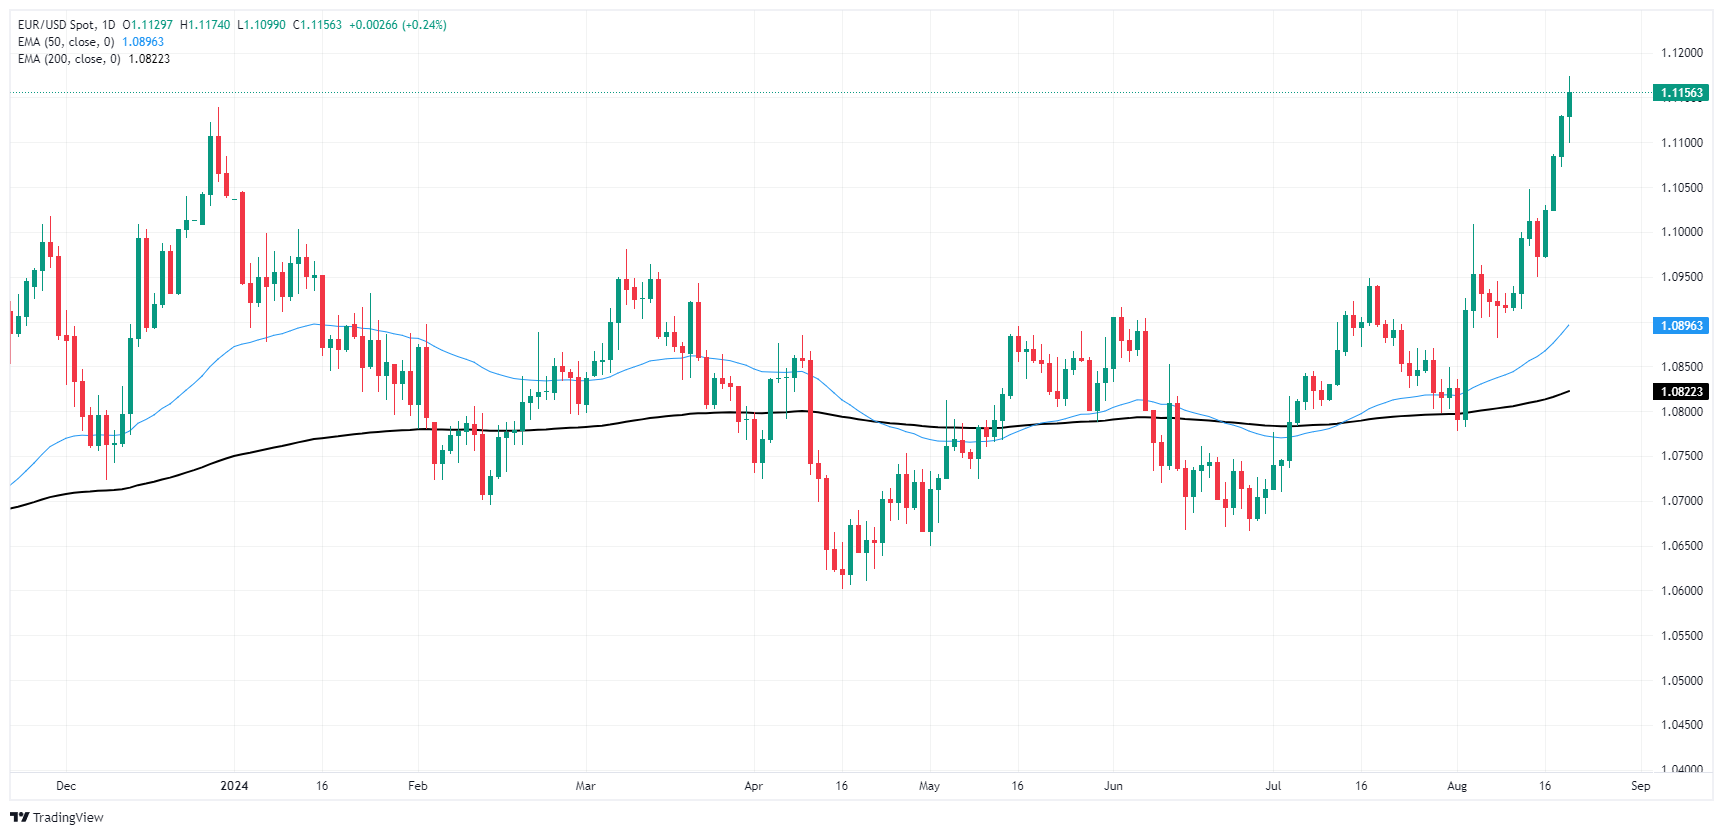
Euro FAQs
The Euro is the currency for the 20 European Union countries that belong to the Eurozone. It is the second most heavily traded currency in the world behind the US Dollar. In 2022, it accounted for 31% of all foreign exchange transactions, with an average daily turnover of over $2.2 trillion a day. EUR/USD is the most heavily traded currency pair in the world, accounting for an estimated 30% off all transactions, followed by EUR/JPY (4%), EUR/GBP (3%) and EUR/AUD (2%).
The European Central Bank (ECB) in Frankfurt, Germany, is the reserve bank for the Eurozone. The ECB sets interest rates and manages monetary policy. The ECB’s primary mandate is to maintain price stability, which means either controlling inflation or stimulating growth. Its primary tool is the raising or lowering of interest rates. Relatively high interest rates – or the expectation of higher rates – will usually benefit the Euro and vice versa. The ECB Governing Council makes monetary policy decisions at meetings held eight times a year. Decisions are made by heads of the Eurozone national banks and six permanent members, including the President of the ECB, Christine Lagarde.
Eurozone inflation data, measured by the Harmonized Index of Consumer Prices (HICP), is an important econometric for the Euro. If inflation rises more than expected, especially if above the ECB’s 2% target, it obliges the ECB to raise interest rates to bring it back under control. Relatively high interest rates compared to its counterparts will usually benefit the Euro, as it makes the region more attractive as a place for global investors to park their money.
Data releases gauge the health of the economy and can impact on the Euro. Indicators such as GDP, Manufacturing and Services PMIs, employment, and consumer sentiment surveys can all influence the direction of the single currency. A strong economy is good for the Euro. Not only does it attract more foreign investment but it may encourage the ECB to put up interest rates, which will directly strengthen the Euro. Otherwise, if economic data is weak, the Euro is likely to fall. Economic data for the four largest economies in the euro area (Germany, France, Italy and Spain) are especially significant, as they account for 75% of the Eurozone’s economy.
Another significant data release for the Euro is the Trade Balance. This indicator measures the difference between what a country earns from its exports and what it spends on imports over a given period. If a country produces highly sought after exports then its currency will gain in value purely from the extra demand created from foreign buyers seeking to purchase these goods. Therefore, a positive net Trade Balance strengthens a currency and vice versa for a negative balance.
The preliminary reading of Australia's Judo Bank Manufacturing Purchasing Managers Index (PMI) rose to 48.7 in August from 47.5 in July, the latest data published by Judo Bank and S&P Global showed on Thursday.
The Judo Bank Australian Services PMI improved to 52.2 in August from the previous reading of 50.4, while the Composite PMI climbed to 51.4 in August versus 49.9 prior.
Market reaction
At the press time, the AUD/USD pair was up 0.12% on the day to trade at 0.6752.
Australian Dollar FAQs
One of the most significant factors for the Australian Dollar (AUD) is the level of interest rates set by the Reserve Bank of Australia (RBA). Because Australia is a resource-rich country another key driver is the price of its biggest export, Iron Ore. The health of the Chinese economy, its largest trading partner, is a factor, as well as inflation in Australia, its growth rate and Trade Balance. Market sentiment – whether investors are taking on more risky assets (risk-on) or seeking safe-havens (risk-off) – is also a factor, with risk-on positive for AUD.
The Reserve Bank of Australia (RBA) influences the Australian Dollar (AUD) by setting the level of interest rates that Australian banks can lend to each other. This influences the level of interest rates in the economy as a whole. The main goal of the RBA is to maintain a stable inflation rate of 2-3% by adjusting interest rates up or down. Relatively high interest rates compared to other major central banks support the AUD, and the opposite for relatively low. The RBA can also use quantitative easing and tightening to influence credit conditions, with the former AUD-negative and the latter AUD-positive.
China is Australia’s largest trading partner so the health of the Chinese economy is a major influence on the value of the Australian Dollar (AUD). When the Chinese economy is doing well it purchases more raw materials, goods and services from Australia, lifting demand for the AUD, and pushing up its value. The opposite is the case when the Chinese economy is not growing as fast as expected. Positive or negative surprises in Chinese growth data, therefore, often have a direct impact on the Australian Dollar and its pairs.
Iron Ore is Australia’s largest export, accounting for $118 billion a year according to data from 2021, with China as its primary destination. The price of Iron Ore, therefore, can be a driver of the Australian Dollar. Generally, if the price of Iron Ore rises, AUD also goes up, as aggregate demand for the currency increases. The opposite is the case if the price of Iron Ore falls. Higher Iron Ore prices also tend to result in a greater likelihood of a positive Trade Balance for Australia, which is also positive of the AUD.
The Trade Balance, which is the difference between what a country earns from its exports versus what it pays for its imports, is another factor that can influence the value of the Australian Dollar. If Australia produces highly sought after exports, then its currency will gain in value purely from the surplus demand created from foreign buyers seeking to purchase its exports versus what it spends to purchase imports. Therefore, a positive net Trade Balance strengthens the AUD, with the opposite effect if the Trade Balance is negative.
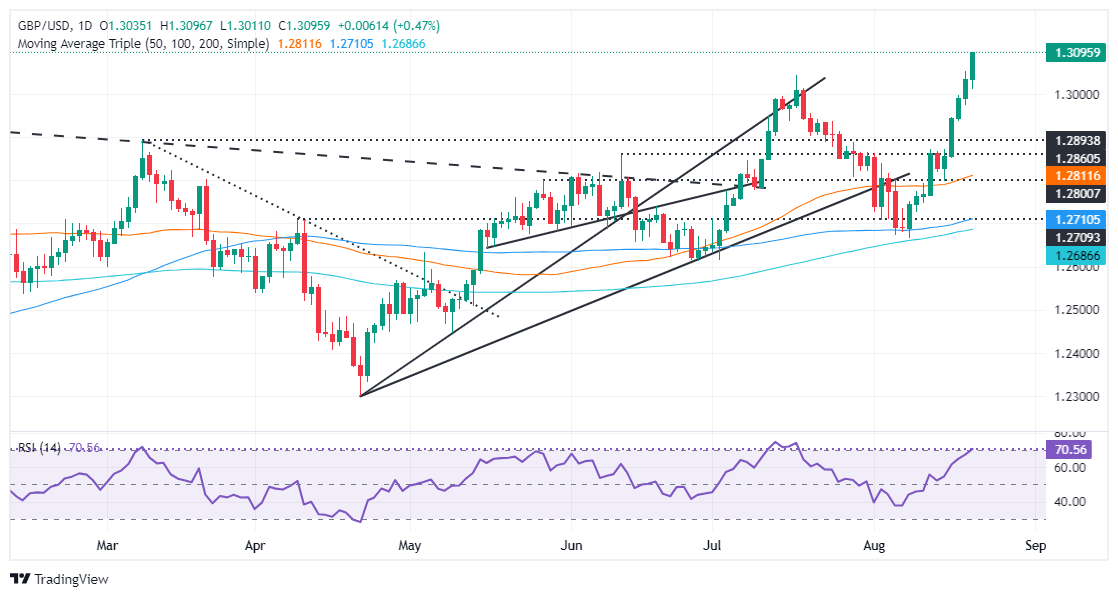
- GBP/USD breached 1.3100 on Wednesday as the bull march continues.
- The Pound Sterling is enjoying a healthy bid as the US Dollar recedes.
- Jackson Hole, PMI data dump still loom ahead.
GBP/USD briefly tested chart paper on the high side of 1.3100 on Wednesday as Cable continues to push deeper into bull country. The pair is marching into fresh 13-month highs, setting a peak intraday bid of 1.3112, and the Sterling is threatening to cross into its highest prices against the Greenback since April of 2022.
The US Bureau of Labor Statistics announced a steep cut of over 800K jobs to March’s Nonfarm Payrolls (NFP) jobs print, sharply revising previous job growth figures to the low side. The tilt in hiring numbers prompted markets to add to bets of a double cut from the Federal Reserve (Fed) in September. Rate cut bets pinned even higher on Wednesday after the Fed’s latest Meeting Minutes revealed policymakers in the US central bank had already begun discussions about when to begin cutting interest rates as early as July.
UK Purchasing Managers Index (PMI) figures for August are expected to drift upwards slightly on Thursday, with the UK Services PMI component forecast to tick up to 52.8 from 52.5. The Manufacturing section is expected to hold steady at 52.1.
US PMI business activity survey results are also slated for release on Thursday, as well as the kickoff of the annual Jackson Hole Symposium which is set to run through the weekend. Wednesday will deliver the Federal Reserve’s (Fed) latest Meeting Minutes, but market forces will broadly be looking ahead to Thursday’s outings for reasons to move.
US S&P Global Manufacturing PMI activity expectations are forecast to hold steady at 49.6 in August, while the Services PMI component is expected to tick down a full point to 54.0 from 55.0. The kickoff of the Jackson Hole Symposium is expected to draw plenty of investor attention on Thursday, but Friday’s appearance from Fed Chairman Jerome Powell can be expected to set the overall tone of market sentiment heading into next week.
GBP/USD technical outlook
With Cable chalking in a fifth straight gain, GBP/USD is poised for a breach into multi-year highs, provided buyers can maintain pressure long enough to keep prices climbing beyond 2023’s July peak of 1.3142. Odds favor the buyers as GBP/USD has closed in the green for all but one of the last ten consecutive trading days.
GBP/USD daily chart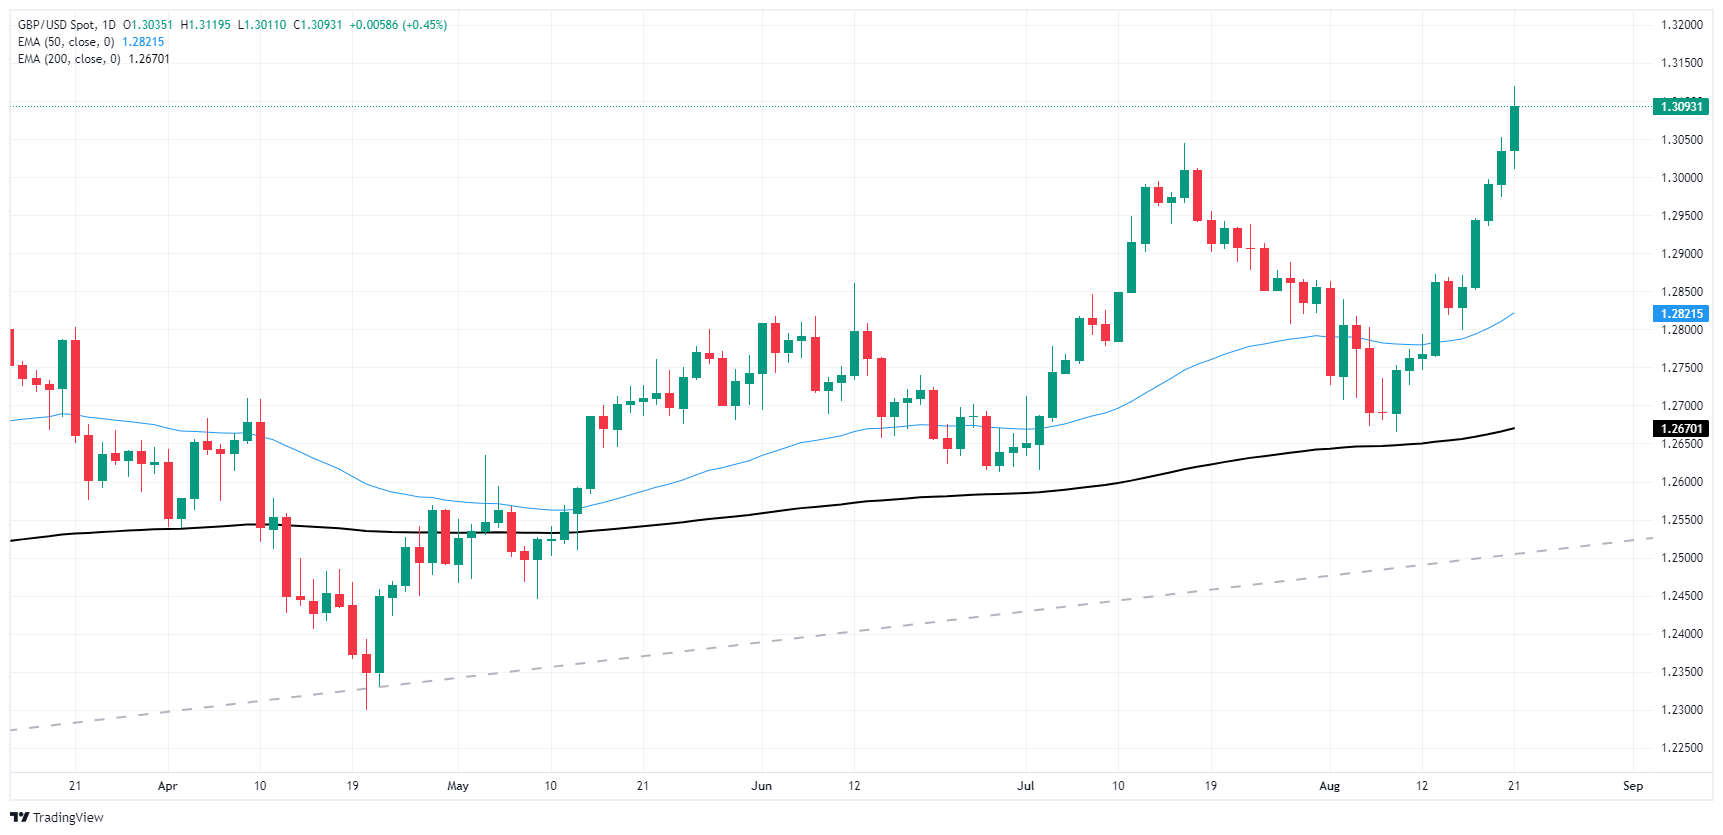
Pound Sterling FAQs
The Pound Sterling (GBP) is the oldest currency in the world (886 AD) and the official currency of the United Kingdom. It is the fourth most traded unit for foreign exchange (FX) in the world, accounting for 12% of all transactions, averaging $630 billion a day, according to 2022 data. Its key trading pairs are GBP/USD, aka ‘Cable’, which accounts for 11% of FX, GBP/JPY, or the ‘Dragon’ as it is known by traders (3%), and EUR/GBP (2%). The Pound Sterling is issued by the Bank of England (BoE).
The single most important factor influencing the value of the Pound Sterling is monetary policy decided by the Bank of England. The BoE bases its decisions on whether it has achieved its primary goal of “price stability” – a steady inflation rate of around 2%. Its primary tool for achieving this is the adjustment of interest rates. When inflation is too high, the BoE will try to rein it in by raising interest rates, making it more expensive for people and businesses to access credit. This is generally positive for GBP, as higher interest rates make the UK a more attractive place for global investors to park their money. When inflation falls too low it is a sign economic growth is slowing. In this scenario, the BoE will consider lowering interest rates to cheapen credit so businesses will borrow more to invest in growth-generating projects.
Data releases gauge the health of the economy and can impact the value of the Pound Sterling. Indicators such as GDP, Manufacturing and Services PMIs, and employment can all influence the direction of the GBP. A strong economy is good for Sterling. Not only does it attract more foreign investment but it may encourage the BoE to put up interest rates, which will directly strengthen GBP. Otherwise, if economic data is weak, the Pound Sterling is likely to fall.
Another significant data release for the Pound Sterling is the Trade Balance. This indicator measures the difference between what a country earns from its exports and what it spends on imports over a given period. If a country produces highly sought-after exports, its currency will benefit purely from the extra demand created from foreign buyers seeking to purchase these goods. Therefore, a positive net Trade Balance strengthens a currency and vice versa for a negative balance.
- USD/CAD weakens near 1.3585 in Wednesday’s early Asian session.
- Firmer expectations of a Fed rate cut in September after the FOMC Minutes have exerted some selling pressure on the USD.
- The recent Canadian CPI supported the case for another rate cut by the BoC.
The USD/CAD pair edges lower to 1.3585 during the early Asian session on Thursday. The Greenback remains under selling pressure as the Minutes of the US Federal Reserve (Fed) opened the door for an interest rate cut at its September meeting,
According to the minutes of the Fed’s July meeting, “the vast majority” of participants observed that, if the data continued to come in about as expected, it would likely be appropriate to cut the interest rate at the next meeting.
Markets are now fully pricing in a September cut, which would be the first reduction since the emergency easing in the early days of the Covid crisis. A full percentage point worth of rate cuts is expected by the end of this year. The growing expectation of a Fed rate cut continues to undermine the US Dollar and US Treasury bond yields.
Elsewhere, the US Bureau of Labor Statistics announced on Wednesday that Nonfarm-Payrolls (NFP) growth revised down by 818,000 from March 2023 to March 2024, fewer than previously estimated.
On the Loonie front, the softer Canadian Consumer Price Index (CPI) inflation reports have triggered the speculation of another rate cut by the Bank of Canada (BoC). Traders continue to fully price in a 25 basis points (bps) cut in September, while an additional 50 bps of easing is priced in for the final two meetings of the year. This, in turn, might weigh on the Canadian Dollar (CAD) and help limit USD/CAD’s losses.
Canadian Dollar FAQs
The key factors driving the Canadian Dollar (CAD) are the level of interest rates set by the Bank of Canada (BoC), the price of Oil, Canada’s largest export, the health of its economy, inflation and the Trade Balance, which is the difference between the value of Canada’s exports versus its imports. Other factors include market sentiment – whether investors are taking on more risky assets (risk-on) or seeking safe-havens (risk-off) – with risk-on being CAD-positive. As its largest trading partner, the health of the US economy is also a key factor influencing the Canadian Dollar.
The Bank of Canada (BoC) has a significant influence on the Canadian Dollar by setting the level of interest rates that banks can lend to one another. This influences the level of interest rates for everyone. The main goal of the BoC is to maintain inflation at 1-3% by adjusting interest rates up or down. Relatively higher interest rates tend to be positive for the CAD. The Bank of Canada can also use quantitative easing and tightening to influence credit conditions, with the former CAD-negative and the latter CAD-positive.
The price of Oil is a key factor impacting the value of the Canadian Dollar. Petroleum is Canada’s biggest export, so Oil price tends to have an immediate impact on the CAD value. Generally, if Oil price rises CAD also goes up, as aggregate demand for the currency increases. The opposite is the case if the price of Oil falls. Higher Oil prices also tend to result in a greater likelihood of a positive Trade Balance, which is also supportive of the CAD.
While inflation had always traditionally been thought of as a negative factor for a currency since it lowers the value of money, the opposite has actually been the case in modern times with the relaxation of cross-border capital controls. Higher inflation tends to lead central banks to put up interest rates which attracts more capital inflows from global investors seeking a lucrative place to keep their money. This increases demand for the local currency, which in Canada’s case is the Canadian Dollar.
Macroeconomic data releases gauge the health of the economy and can have an impact on the Canadian Dollar. Indicators such as GDP, Manufacturing and Services PMIs, employment, and consumer sentiment surveys can all influence the direction of the CAD. A strong economy is good for the Canadian Dollar. Not only does it attract more foreign investment but it may encourage the Bank of Canada to put up interest rates, leading to a stronger currency. If economic data is weak, however, the CAD is likely to fall.
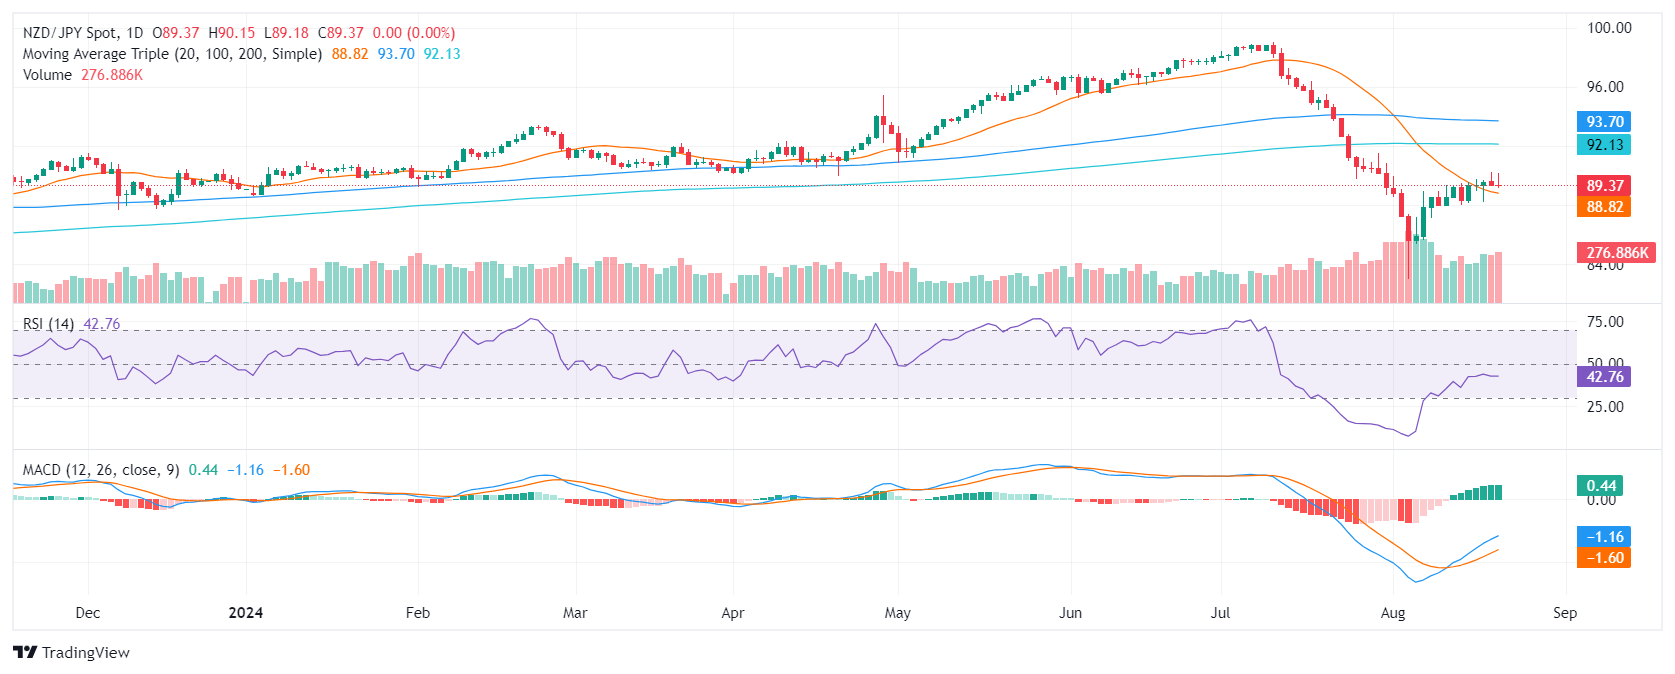
- NZD/JPY was flat on Wednesday, trading at 89.40.
- The RSI remains below 50, indicating a subdued buying pressure.
- The pair is currently trading within a range between the 88.50 and 89.50 support and resistance levels.
The NZD/JPY currency pair traded flat on Wednesday around the 89.40 zone. Technical indicators provide contrasting signals, with the Relative Strength Index (RSI) and the Moving Average Convergence Divergence (MACD) offering contrasting perspectives.
The RSI, a measure of momentum, has flattened and is currently at 45, below the neutral level of 50. This indicates decreasing buying pressure and suggests that the bulls are losing some of their recent momentum. However, the MACD continues to show flat green bars. Green bars generally indicate upward momentum, but the flatness suggests that the upward thrust is not strong enough at the moment.
Volume has been relatively low, indicating a lack of conviction in the recent price movements. The pair is currently trading within a range between the 88.50 and 89.50 support and resistance levels. The 88.50 is a significant support level that has been held since the beginning of August, while the 90.00 resistance is a barrier that the bulls struggle to tackle. A break below 88.50 could lead to further declines towards 86.00, while a break above 89.50 could push the pair up to 91.00.
NZD/JPY daily chart
.
- NZD/USD failed to extend its gains and consolidated in a narrow range around 0.6160.
- The RSI has fallen back to 64, while the MACD is now showing flat green bars, indicating that the bullish momentum is slowing down.
- A break below 0.6130 could lead to a further decline towards 0.6100.
On Wednesday's session, the NZD/USD retreated to 0.6160 after hitting a high above 0.6200, as it failed to sustain its gains and consolidated in a narrow range around that level.
On the daily chart, the Relative Strength Index (RSI) has fallen back to 64, while the Moving Average Convergence Divergence (MACD) is now showing flat green bars. These indicators suggest that the bullish momentum is slowing down. The volume has been decreasing over the past few sessions, suggesting that the current consolidation is likely to continue.
NZD/USD daily chart
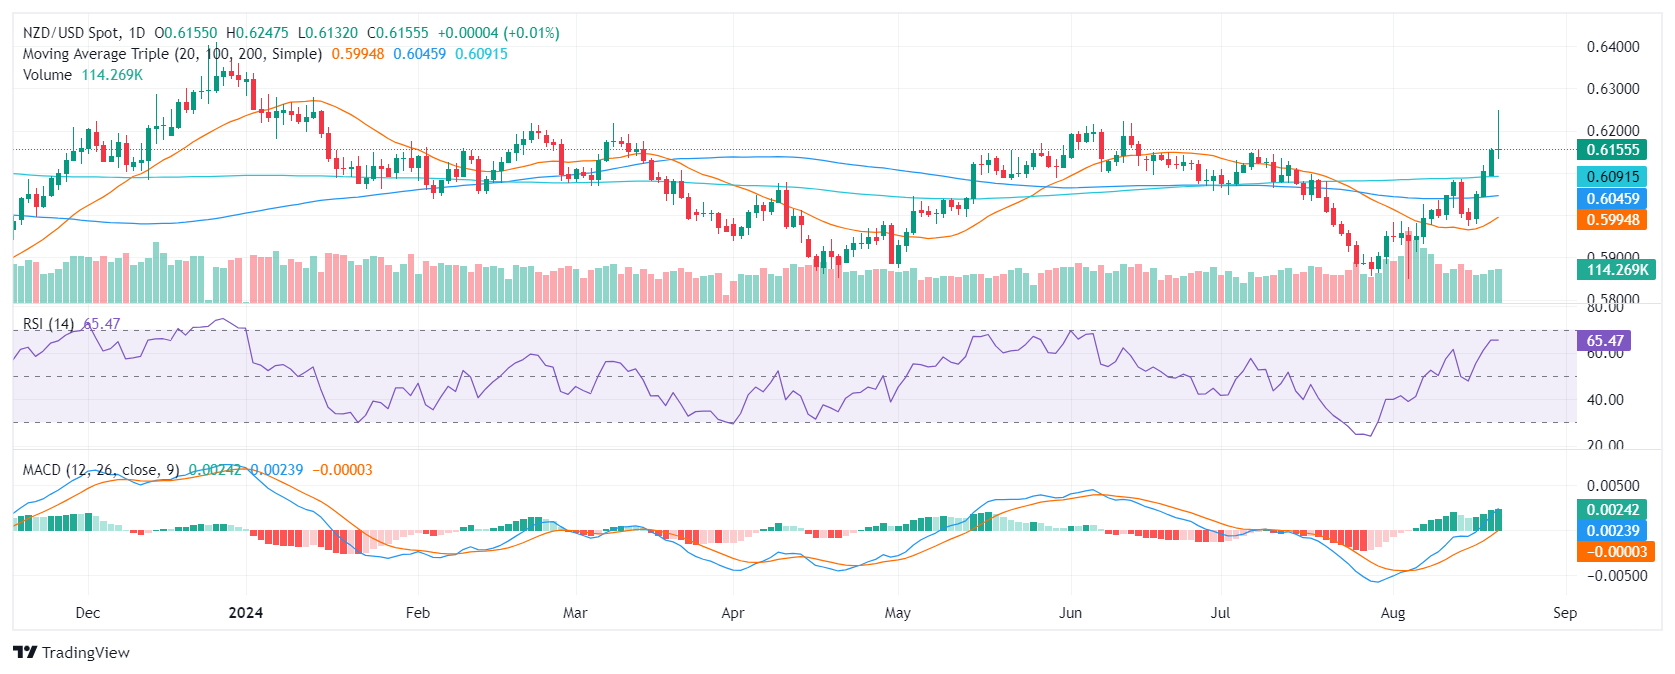
The NZD/USD pair is facing immediate resistance at 0.6170. A consolidation above this level could open the door for a further rally to retest the 0.6200 zone. On the downside, immediate support lies in the range of 0.6130 and 0.6150. A break below 0.6130 could lead to a further decline towards 0.6100.
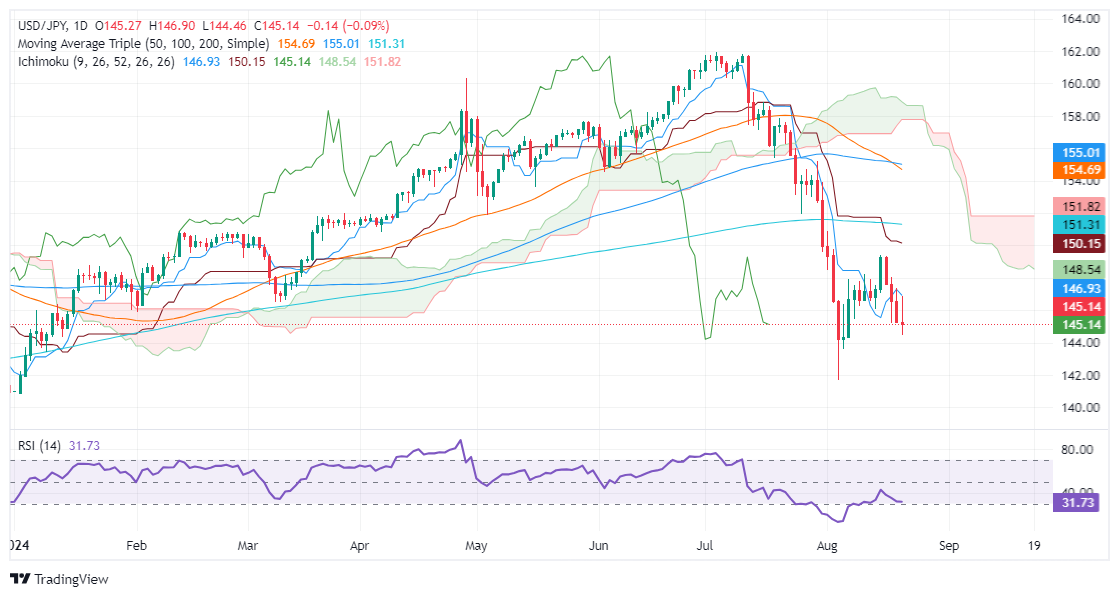
- USD/JPY steady as Fed minutes hint at easing, lowering US 10-year yields.
- Selling momentum persists; RSI indicates more downside potential.
- Below 145.00 targets 143.61, then 141.69; resistance at 146.00 could extend to 146.92, 149.39.
The USD/JPY trims some of its earlier gains after July’s Federal Reserve’s meeting minutes hinted the US central bank could ease policy as soon as September. Therefore, US Treasury bond yields, particularly the 10-year yield, slumped and weighed on the major due to its positive correlation. At the time of writing, the USD/JPY trades at 145.21, virtually unchanged.
USD/JPY Price Forecast: Technical outlook
After falling to a seven-month low of 141.69, the USD/JPY recovered some ground and hit a two-week high of 149.39 before resuming its ongoing downtrend. Momentum backs sellers as depicted by the Relative Strength Index (RSI).
If USD/JPY drops below 145.00, the August 6 daily low of 143.61 will be exposed. Once cleared, the next support would be 141.69, followed by December’s 28 low of 140.25.
On the other hand, if prices climb above 146.00, this can pave the way for further upside. The next resistance would be the Tenkan-Sen at 146.92, followed by 149.39, ahead of the Kijun-Sen at 149.78.
USD/JPY Price Action – Daily Chart
Japanese Yen FAQs
The Japanese Yen (JPY) is one of the world’s most traded currencies. Its value is broadly determined by the performance of the Japanese economy, but more specifically by the Bank of Japan’s policy, the differential between Japanese and US bond yields, or risk sentiment among traders, among other factors.
One of the Bank of Japan’s mandates is currency control, so its moves are key for the Yen. The BoJ has directly intervened in currency markets sometimes, generally to lower the value of the Yen, although it refrains from doing it often due to political concerns of its main trading partners. The current BoJ ultra-loose monetary policy, based on massive stimulus to the economy, has caused the Yen to depreciate against its main currency peers. This process has exacerbated more recently due to an increasing policy divergence between the Bank of Japan and other main central banks, which have opted to increase interest rates sharply to fight decades-high levels of inflation.
The BoJ’s stance of sticking to ultra-loose monetary policy has led to a widening policy divergence with other central banks, particularly with the US Federal Reserve. This supports a widening of the differential between the 10-year US and Japanese bonds, which favors the US Dollar against the Japanese Yen.
The Japanese Yen is often seen as a safe-haven investment. This means that in times of market stress, investors are more likely to put their money in the Japanese currency due to its supposed reliability and stability. Turbulent times are likely to strengthen the Yen’s value against other currencies seen as more risky to invest in.
- The Canadian Dollar rose on Wednesday, buoyed by Greenback weakness.
- Canada reported an upswing in housing prices, bolstering the CAD further.
- Broader markets are pivoting to the start of this year’s Jackson Hole economic summit.
The Canadian Dollar (CAD) found some legroom on Wednesday, rising against key counter-currencies through the US market session and extended a recent win streak against the US Dollar as broad market sentiment pins on the high end with investors anticipating a shift in the Federal Reserve’s (Fed) rate cut stance.
Canada reported a slight upswing in recent housing price figures, prompting a thin bullish bid in the Canadian Dollar. The CAD has eased into a multi-month high against the Greenback, and is clawing back recent losses against other major currencies in recent days.
Daily digest market movers: Canadian Dollar finds the high side on higher housing prices
- The Canadian New Housing Price Index rose 0.1% YoY in July, over and above the previous -0.2% contraction.
- The Canadian Raw Material Price Index also rose in July, accelerating 0.7% versus the forecast -0.9% and improving from the previous month’s -1.4% backslide.
- The US Bureau of Labor Statistics introduced a sharp revision to March’s Nonfarm Payrolls (NFP), cutting the initial print by over 800K jobs.
- The Fed’s latest Meeting Minutes revealed that the US central bank had already begun discussions about when to deliver rate cuts as early as July.
- The out-of-cycle NFP adjustment and dovish Fed print help to drive market bets of a September rate cut even higher.
- Nearly half of all rate traders now expect a double cut for 50 bps from the Fed on September 18.
Canadian Dollar price forecast: USD/CAD bulls set to run out of steam below 1.3600
The Canadian Dollar (CAD) rose one-fifth of one percent against the US Dollar on Wednesday, chalking in a fourth straight gain against the Greenback. The CAD has closed higher against the USD for all but three of the last 14 straight trading days, and has recovered 2.66% bottom-to-top against the Greenback after hitting a 22-month low earlier this month.
USD/CAD pierced below the 1.3600 handle, and has extended a decline below the 200-day Exponential Moving Average (EMA) at 1.3640. The pair is running into oversold territory, but a sharp pullback from April’s technical range prices could see a topside draw in the coming days.
USD/CAD daily chart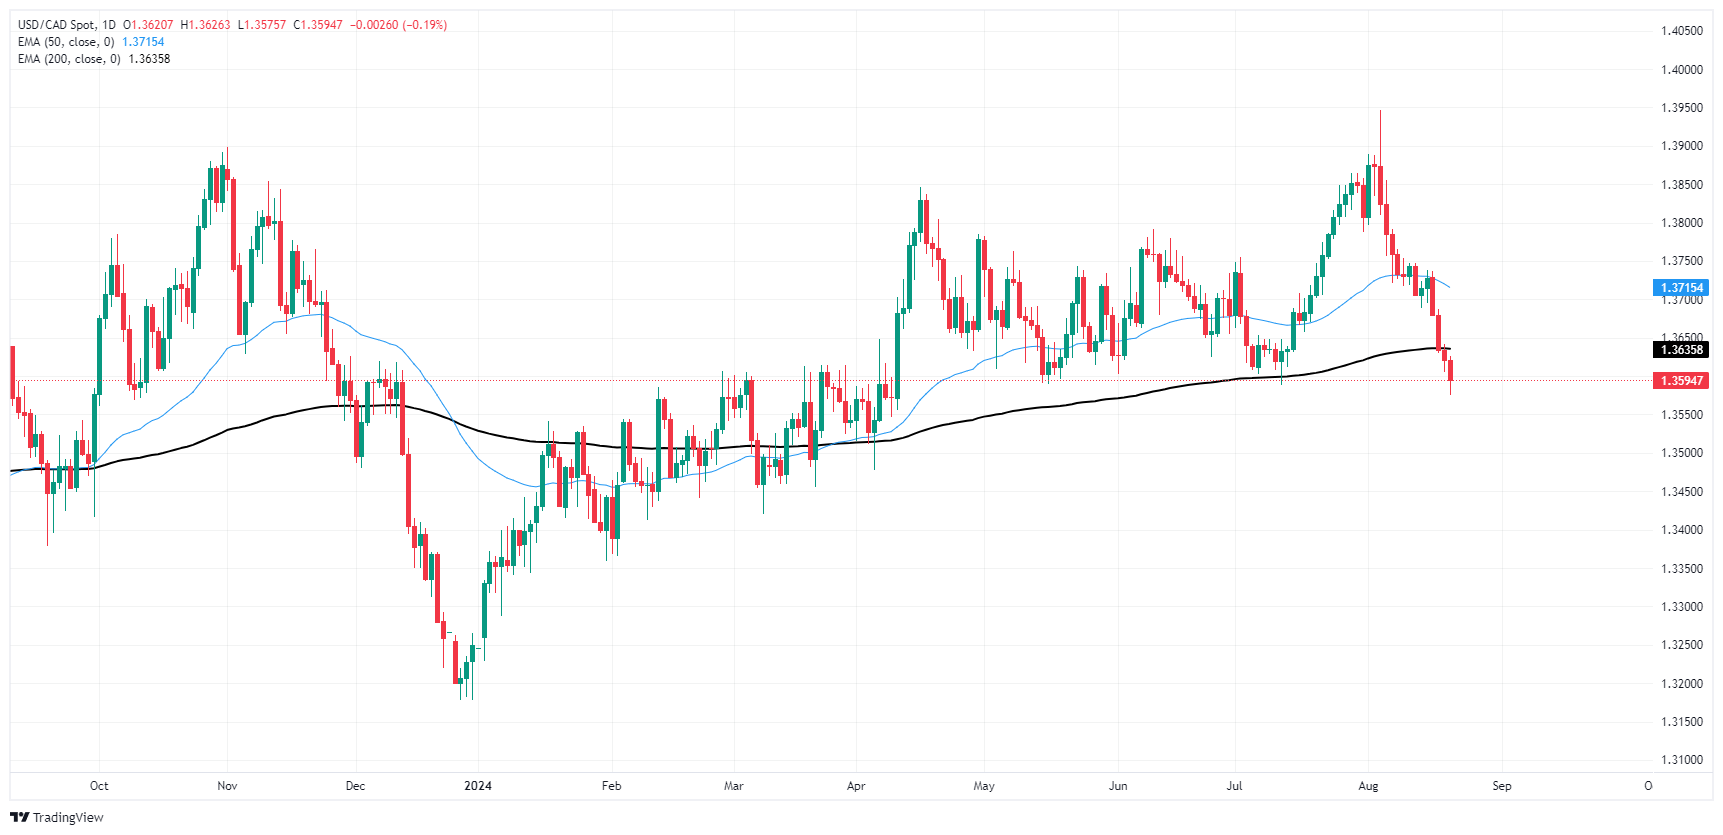
Canadian Dollar FAQs
The key factors driving the Canadian Dollar (CAD) are the level of interest rates set by the Bank of Canada (BoC), the price of Oil, Canada’s largest export, the health of its economy, inflation and the Trade Balance, which is the difference between the value of Canada’s exports versus its imports. Other factors include market sentiment – whether investors are taking on more risky assets (risk-on) or seeking safe-havens (risk-off) – with risk-on being CAD-positive. As its largest trading partner, the health of the US economy is also a key factor influencing the Canadian Dollar.
The Bank of Canada (BoC) has a significant influence on the Canadian Dollar by setting the level of interest rates that banks can lend to one another. This influences the level of interest rates for everyone. The main goal of the BoC is to maintain inflation at 1-3% by adjusting interest rates up or down. Relatively higher interest rates tend to be positive for the CAD. The Bank of Canada can also use quantitative easing and tightening to influence credit conditions, with the former CAD-negative and the latter CAD-positive.
The price of Oil is a key factor impacting the value of the Canadian Dollar. Petroleum is Canada’s biggest export, so Oil price tends to have an immediate impact on the CAD value. Generally, if Oil price rises CAD also goes up, as aggregate demand for the currency increases. The opposite is the case if the price of Oil falls. Higher Oil prices also tend to result in a greater likelihood of a positive Trade Balance, which is also supportive of the CAD.
While inflation had always traditionally been thought of as a negative factor for a currency since it lowers the value of money, the opposite has actually been the case in modern times with the relaxation of cross-border capital controls. Higher inflation tends to lead central banks to put up interest rates which attracts more capital inflows from global investors seeking a lucrative place to keep their money. This increases demand for the local currency, which in Canada’s case is the Canadian Dollar.
Macroeconomic data releases gauge the health of the economy and can have an impact on the Canadian Dollar. Indicators such as GDP, Manufacturing and Services PMIs, employment, and consumer sentiment surveys can all influence the direction of the CAD. A strong economy is good for the Canadian Dollar. Not only does it attract more foreign investment but it may encourage the Bank of Canada to put up interest rates, leading to a stronger currency. If economic data is weak, however, the CAD is likely to fall.
- Gold remains stable above $2,500, buoyed by Fed Minutes suggesting a possible rate cut at the next meeting.
- The US Dollar Index (DXY) falls 0.20% to 101.10, weakening the Greenback and supporting Gold prices.
- Investors focus on upcoming US economic data and Fed Chair Powell's speech at the Jackson Hole Symposium on Friday.
Gold stayed firm above $2,500 for the third straight day after Minutes of the US Federal Reserve (Fed) opened the door for an interest rate cut at the upcoming September meeting, weakening the Greenback. The XAU/USD trades at $2,511, virtually unchanged.
Investors cheered the content of the Fed's July meeting Minutes as Wall Street continued to trade in green territory. The Greenback tumbled sharply over 0.20%, as reflected by the US Dollar Index (DXY), which hovers around 101.10.
The Minutes revealed that most Fed participants said that “it would likely be appropriate to ease policy at the next meeting if data continued to come in as expected,” adding that the progress on inflation and the increase in the unemployment rate opened the door for a quarter or a percentage point rate cut at the July meeting.
Although Fed officials voted unanimously to hold rates unchanged at the July meeting, many officials saw rates as restrictive. Regarding the Fed’s dual mandate, risks have become more balanced, with most policymakers growing more concerned about achieving the maximum employment mandate, while inflation risks have diminished slightly.
In addition, traders will be eyeing a light economic docket, with the release of Initial Jobless Claims, S&P Global PMIs and housing data on Thursday.
On Friday, traders will watch Fed Chair Jerome Powell's speech at the beginning of the Jackson Hole Symposium, hosted by the Kansas City Fed in Wyoming.
Daily digest market movers: Gold price is firm after FOMC Minutes
- Gold prices advanced as US Treasury bond yields slumped. The US 10-year Treasury note is down 1.5 basis points (bps) at 3.792%.
- Following the release of the last FOMC minutes, traders expect 102 basis points of easing, according to the Chicago Board of Trade (CBOT) December 2024 fed funds futures contract.
- US Initial Jobless Claims data for the week ending August 17 are expected to rise to 230K, up from 227K a week before.
- Business activity revealed by S&P Global is expected to show a slight decrease in the Services PMI from 55 to 54. The Manufacturing PMI is foreseen remaining unchanged at 49.6.
- Existing Home Sales are expected to grow from 3.89 million to 3.93 million.
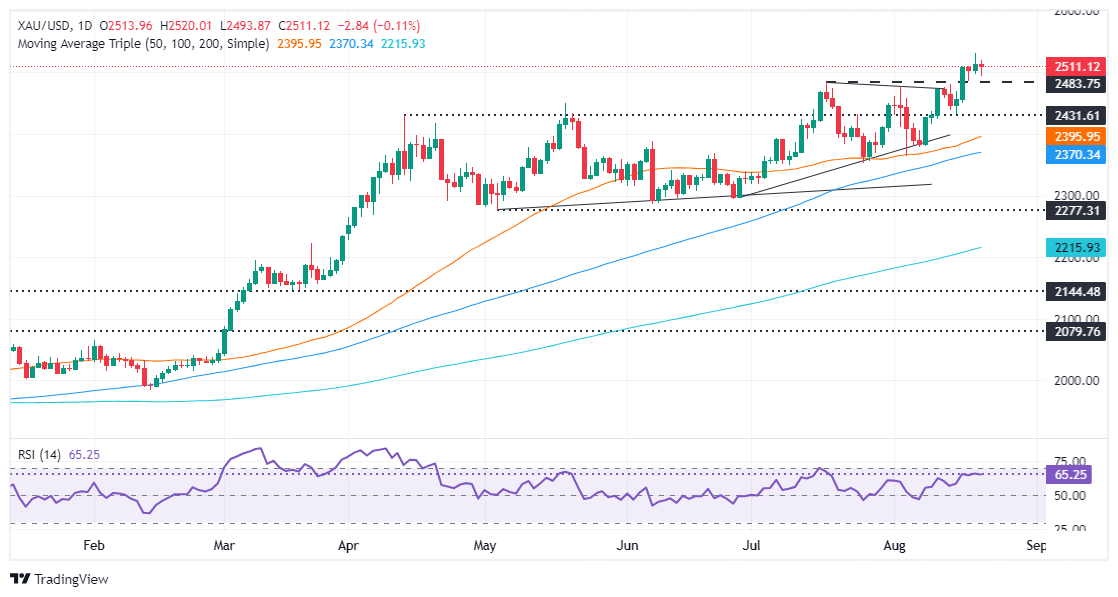
Technical analysis: Gold price to test $2,550 once it clears $2,530
Gold’s daily chart suggests that the yellow metal is expected to rise further if buyers breach the all-time high at $2,531. Momentum suggests that bulls are in charge, as portrayed by the Relative Strength Index (RSI).
Therefore, XAU/USD first resistance would be the $2,550 area, followed by the $2,600 mark. Nevertheless, Gold’s weakness and the non-yielding metal could retrace below the $2,500 figure.
In that outcome, the next support would be the July 17 peak at $2,483, followed by the May 20 high at $2,450. Once cleared, the next stop would be the 50-day Simple Moving Average (SMA) at $2,395.
Gold FAQs
Gold has played a key role in human’s history as it has been widely used as a store of value and medium of exchange. Currently, apart from its shine and usage for jewelry, the precious metal is widely seen as a safe-haven asset, meaning that it is considered a good investment during turbulent times. Gold is also widely seen as a hedge against inflation and against depreciating currencies as it doesn’t rely on any specific issuer or government.
Central banks are the biggest Gold holders. In their aim to support their currencies in turbulent times, central banks tend to diversify their reserves and buy Gold to improve the perceived strength of the economy and the currency. High Gold reserves can be a source of trust for a country’s solvency. Central banks added 1,136 tonnes of Gold worth around $70 billion to their reserves in 2022, according to data from the World Gold Council. This is the highest yearly purchase since records began. Central banks from emerging economies such as China, India and Turkey are quickly increasing their Gold reserves.
Gold has an inverse correlation with the US Dollar and US Treasuries, which are both major reserve and safe-haven assets. When the Dollar depreciates, Gold tends to rise, enabling investors and central banks to diversify their assets in turbulent times. Gold is also inversely correlated with risk assets. A rally in the stock market tends to weaken Gold price, while sell-offs in riskier markets tend to favor the precious metal.
The price can move due to a wide range of factors. Geopolitical instability or fears of a deep recession can quickly make Gold price escalate due to its safe-haven status. As a yield-less asset, Gold tends to rise with lower interest rates, while higher cost of money usually weighs down on the yellow metal. Still, most moves depend on how the US Dollar (USD) behaves as the asset is priced in dollars (XAU/USD). A strong Dollar tends to keep the price of Gold controlled, whereas a weaker Dollar is likely to push Gold prices up.
- AUD/USD experienced a slight drop, adjusting to 0.6745 on Wednesday.
- The persistent hawkish views of the RBA keep backing the Aussie versus its peers.
- Dovish bets on the Fed weaken the USD.
On Wednesday, the AUD/USD is seeing a slight decline as traders digest the nearly 2% rally from the last sessions. The discourse on monetary policy divergence between the Federal Reserve (Fed), considering a less aggressive approach toward interest rates, and the unwavering position of the Reserve Bank of Australia (RBA) remains the mover of the pair, which put the Aussie ahead of the Greenback.
Despite the mixed Australian economic outlook and the RBA's hawkish stance driven by high inflation, markets are projecting only a 25-basis-point easing for 2024, maintaining some support for the Aussie.
Daily digest market movers: Aussie's rally tempered, softer stance by Fed opens the upside
- Softening US labor market data suggests that the Fed may adopt a less aggressive stance, leading to a potential weakening of the USD.
- In addition, the July Federal Open Market Committee (FOMC) Minutes showed that most of the participants were open to a September cut, which adds ammunition to the argument that the Fed will turn dovish at its next meeting.
- On the other hand, the RBA has clearly mentioned that the bank is not considering cuts for the moment, and this divergence is pushing the pair upwards.
- However, incoming data from both countries will continue to guide the pair’s trajectory.
- Markets are seeing high odds of a 100 bps cut by the Fed by year-end, while investors see little probability of a 25 bps cut by the RBA.
AUD/USD technical outlook: AUD/USD uptrend persists but with lower momentum
Technical analysis suggests that the AUD/USD pair has maintained its upward trajectory over the last few sessions. The Relative Strength Index (RSI), which indicates market momentum, has risen near the 70 benchmark. This hints at overbought conditions in recent sessions.
Additionally, the Moving Average Convergence Divergence (MACD) indicator confirms this bullish tone with the rise of green bars, an indication of prevailing bullish sentiment.
Looking ahead, the pair is likely to encounter resistance around the 0.6750 level. For any significant push through this level, traders should monitor volume and RSI closely. Supports are seen within the 0.6700-0.6650 zone.
Australian Dollar FAQs
One of the most significant factors for the Australian Dollar (AUD) is the level of interest rates set by the Reserve Bank of Australia (RBA). Because Australia is a resource-rich country another key driver is the price of its biggest export, Iron Ore. The health of the Chinese economy, its largest trading partner, is a factor, as well as inflation in Australia, its growth rate and Trade Balance. Market sentiment – whether investors are taking on more risky assets (risk-on) or seeking safe-havens (risk-off) – is also a factor, with risk-on positive for AUD.
The Reserve Bank of Australia (RBA) influences the Australian Dollar (AUD) by setting the level of interest rates that Australian banks can lend to each other. This influences the level of interest rates in the economy as a whole. The main goal of the RBA is to maintain a stable inflation rate of 2-3% by adjusting interest rates up or down. Relatively high interest rates compared to other major central banks support the AUD, and the opposite for relatively low. The RBA can also use quantitative easing and tightening to influence credit conditions, with the former AUD-negative and the latter AUD-positive.
China is Australia’s largest trading partner so the health of the Chinese economy is a major influence on the value of the Australian Dollar (AUD). When the Chinese economy is doing well it purchases more raw materials, goods and services from Australia, lifting demand for the AUD, and pushing up its value. The opposite is the case when the Chinese economy is not growing as fast as expected. Positive or negative surprises in Chinese growth data, therefore, often have a direct impact on the Australian Dollar and its pairs.
Iron Ore is Australia’s largest export, accounting for $118 billion a year according to data from 2021, with China as its primary destination. The price of Iron Ore, therefore, can be a driver of the Australian Dollar. Generally, if the price of Iron Ore rises, AUD also goes up, as aggregate demand for the currency increases. The opposite is the case if the price of Iron Ore falls. Higher Iron Ore prices also tend to result in a greater likelihood of a positive Trade Balance for Australia, which is also positive of the AUD.
The Trade Balance, which is the difference between what a country earns from its exports versus what it pays for its imports, is another factor that can influence the value of the Australian Dollar. If Australia produces highly sought after exports, then its currency will gain in value purely from the surplus demand created from foreign buyers seeking to purchase its exports versus what it spends to purchase imports. Therefore, a positive net Trade Balance strengthens the AUD, with the opposite effect if the Trade Balance is negative.
Further decline saw the Greenback recede to levels last traded in late December 2023 in the sub-101.00 zone, as bets for a rate cut in September were boosted by the FOMC Minutes of the July gathering.
Here is what you need to know on Thursday, August 22:
The USD Index (DXY) retreated to the 100.90 zone against the backdrop of extra losses in US yields across the curve and firmer expectations of a rate cut in September. The Jackson Hole Symposium kicks in on August 22, while on the US docket are expected the usual weekly Initial Jobless Claims, the Chicago Fed National Activity Index, Existing Home Sales, and the advanced S&P Global Manufacturing and Services PMIs for the month of August.
EUR/USD accelerated its bullish impulse and hit new YTD peaks past 1.1170, always in response to the pronounced sell-off in the US Dollar. On August 22, the ECB will publish its Meeting Accounts, along with the release of preliminary HCOB Manufacturing and Services PMIs for the current month in both Germany and the broader euro area and the flash Consumer Confidence gauge in the bloc tracked by the European Commission.
Following its risky peers, GBP/USD reached fresh 2024 tops north of the 1.3100 barrier amidst the exacerbated selling pressure in the Greenback. The advanced S&P Global Manufacturing and Services PMIs for the month of August will be unveiled on August 22, seconded by the CBI Industrial Trends Orders.
USD/JPY added to the weekly leg lower and broke below the 145.00 support with certain conviction following lower yields and the sharp retracement in the Dollar. The preliminary Jibun Bank Manufacturing and Services PMIs are due on August 22, seconded by weekly Foreign Bond Investment figures.
Further gains saw AUD/USD clinch multi-day peaks near 0.6760 on the back of the continuation of the downward bias in the US Dollar. The flash Judo Bank Manufacturing and Services PMIs are expected on August 22.
Recession fears and omnipresent demand concerns coming from the sluggish Chinese economy weighed further on traders and dragged WTI prices to nearly seven-month lows around $71.50 per barrel.
Gold prices rose marginally, although enough to keep the trade above the key $2,500 mark per ounce troy. Silver left behind Tuesday’s irresolute day and advanced past the $29.00 mark per ounce.
- EUR/USD drove further into fresh highs for the year on Wednesday.
- FOMC looks more likely to lean into September rate cuts after Meeting Minutes release.
- EU, US PMI figures still loom ahead on Thursday, as well as Jackson Hole.
EUR/USD pushed further into the high end on Wednesday, breaching 1.1150 and finding fresh 13-month highs on approach to 1.1200 as Fiber bids surges on broad Greenback weakness. The US Dollar is softer across the board in the midweek market session as investors continue to pile into bets that the Federal Reserve (Fed) will be forced to kick off a rate-cutting cycle in September.
Read more: Fed Minutes to give insight on policymakers’ views
According to the Fed’s latest Meeting Minutes, policymakers noted that discussions of when to deliver rate cuts to pleading market participants had already begin in July, further firming up odds of at least a quarter-point trim on September 18. In true market participant fashion, rate markets bolstered their bets of a double cut from the Federal Open Market Committee’s (FOMC) September meeting, with rate traders pricing in nearly 40% odds of a 50 bps trim on September 18.
Pan-European Purchasing Managers Index (PMI) activity survey results are expected early Thursday, with the EU Manufacturing and Services PMIs for August both expected to hold steady, at 45.8 and 51.9, respectively.
US Purchasing Manager Index (PMI) business activity survey results are slated for release on Thursday, as well as the kickoff of the annual Jackson Hole Symposium which is set to run through the weekend. Wednesday will deliver the Federal Reserve’s (Fed) latest Meeting Minutes, but market forces will broadly be looking ahead to Thursday’s outings for reasons to move.
US S&P Global Manufacturing PMI activity expectations are forecast to hold steady at 49.6 in August, while the Services PMI component is expected to tick down a full point to 54.0 from 55.0. The kickoff of the Jackson Hole Symposium is expected to draw plenty of investor attention on Thursday, but Friday’s appearance from Fed Chairman Jerome Powell can be expected to set the overall tone of market sentiment heading into next week.
EUR/USD price forecast
Fiber found yet another peak bid for 2024 on Wednesday as bulls race toward 1.1200. EUR/USD is up over 3% in August alone, and the pair is poised for it’s best single-week performance since November of 2022.
Bullish momentum has broken the price action mold, with the pair up nearly 3.7% and climbing fast from the last swing low into 1.0777 at the beginning of August. The pair launched off of a technical floor at the 200-day Exponential Moving Average (EMA) which is currently rising into 1.0825.
EUR/USD daily chart
Euro FAQs
The Euro is the currency for the 20 European Union countries that belong to the Eurozone. It is the second most heavily traded currency in the world behind the US Dollar. In 2022, it accounted for 31% of all foreign exchange transactions, with an average daily turnover of over $2.2 trillion a day. EUR/USD is the most heavily traded currency pair in the world, accounting for an estimated 30% off all transactions, followed by EUR/JPY (4%), EUR/GBP (3%) and EUR/AUD (2%).
The European Central Bank (ECB) in Frankfurt, Germany, is the reserve bank for the Eurozone. The ECB sets interest rates and manages monetary policy. The ECB’s primary mandate is to maintain price stability, which means either controlling inflation or stimulating growth. Its primary tool is the raising or lowering of interest rates. Relatively high interest rates – or the expectation of higher rates – will usually benefit the Euro and vice versa. The ECB Governing Council makes monetary policy decisions at meetings held eight times a year. Decisions are made by heads of the Eurozone national banks and six permanent members, including the President of the ECB, Christine Lagarde.
Eurozone inflation data, measured by the Harmonized Index of Consumer Prices (HICP), is an important econometric for the Euro. If inflation rises more than expected, especially if above the ECB’s 2% target, it obliges the ECB to raise interest rates to bring it back under control. Relatively high interest rates compared to its counterparts will usually benefit the Euro, as it makes the region more attractive as a place for global investors to park their money.
Data releases gauge the health of the economy and can impact on the Euro. Indicators such as GDP, Manufacturing and Services PMIs, employment, and consumer sentiment surveys can all influence the direction of the single currency. A strong economy is good for the Euro. Not only does it attract more foreign investment but it may encourage the ECB to put up interest rates, which will directly strengthen the Euro. Otherwise, if economic data is weak, the Euro is likely to fall. Economic data for the four largest economies in the euro area (Germany, France, Italy and Spain) are especially significant, as they account for 75% of the Eurozone’s economy.
Another significant data release for the Euro is the Trade Balance. This indicator measures the difference between what a country earns from its exports and what it spends on imports over a given period. If a country produces highly sought after exports then its currency will gain in value purely from the extra demand created from foreign buyers seeking to purchase these goods. Therefore, a positive net Trade Balance strengthens a currency and vice versa for a negative balance.
- Gold remains stable at around $2,500 after FOMC minutes suggest potential easing if economic data aligns.
- Fed officials express growing confidence in inflation control, eyeing a 25 bps cut at the next meeting.
- US Dollar weakens, DXY down 0.30%, with 10-year Treasury yields falling to 3.769%, supporting gold prices.
Gold price remains steady at around $2,500 after the Federal Reserve revealed its latest meeting monetary policy minutes, which hinted the US central bank could cut interest rates. At the time of writing, XAU/USD has trimmed its earlier losses, and its virtually unchanged.
XAU/USD holds firm as FOMC hints at rate cuts, trimming earlier losses
The Federal Open Market Committee (FOMC) minutes showed that most participants said, “it would likely be appropriate to ease policy at the next meeting if data continued to come in as expected.” Furthermore, the minutes added that the recent progress on inflation and the increase in the unemployment rate warranted a 25-basis point (bps) rate cut at the July meeting.
The minutes showed that officials are gaining confidence that inflation is moving toward the 2% goal and that risks to the employment goal have increased.
The golden metal reacted upwards on the release, while the Greenback’s sustaind losses of over 0.30%, as the US Dollar Index (DXY) sits at 100.99. In the meantime, US Treasury bond yields are falling, with the US 10-year Treasury note yield down four basis points to 3.769%.
Gold FAQs
Gold has played a key role in human’s history as it has been widely used as a store of value and medium of exchange. Currently, apart from its shine and usage for jewelry, the precious metal is widely seen as a safe-haven asset, meaning that it is considered a good investment during turbulent times. Gold is also widely seen as a hedge against inflation and against depreciating currencies as it doesn’t rely on any specific issuer or government.
Central banks are the biggest Gold holders. In their aim to support their currencies in turbulent times, central banks tend to diversify their reserves and buy Gold to improve the perceived strength of the economy and the currency. High Gold reserves can be a source of trust for a country’s solvency. Central banks added 1,136 tonnes of Gold worth around $70 billion to their reserves in 2022, according to data from the World Gold Council. This is the highest yearly purchase since records began. Central banks from emerging economies such as China, India and Turkey are quickly increasing their Gold reserves.
Gold has an inverse correlation with the US Dollar and US Treasuries, which are both major reserve and safe-haven assets. When the Dollar depreciates, Gold tends to rise, enabling investors and central banks to diversify their assets in turbulent times. Gold is also inversely correlated with risk assets. A rally in the stock market tends to weaken Gold price, while sell-offs in riskier markets tend to favor the precious metal.
The price can move due to a wide range of factors. Geopolitical instability or fears of a deep recession can quickly make Gold price escalate due to its safe-haven status. As a yield-less asset, Gold tends to rise with lower interest rates, while higher cost of money usually weighs down on the yellow metal. Still, most moves depend on how the US Dollar (USD) behaves as the asset is priced in dollars (XAU/USD). A strong Dollar tends to keep the price of Gold controlled, whereas a weaker Dollar is likely to push Gold prices up.
- GBP/USD extends its uptrend after bouncing off the 50-DMA at 1.2809, with RSI indicating strong bullish momentum.
- A break above 1.3100 targets the 2023 peak at 1.3142, with further gains possible toward 1.3200.
- If the pair retreats, support lies at the July 17 high of 1.3044, followed by the psychological 1.3000 level and August 13 high at 1.2872.
The GBP/USD advanced steadily for the fifth straight day and is eyeing the 1.3100 figure after data from the US Bureau of Labor Statistics (BLS) revealed that the US economy added 800K fewer Americans to the workforce. At the time of writing, the pair trades at 1.308 and gains 0.42%.
GBP/USD Price Forecast: Technical outlook
The GBP/USD uptrend remains intact after bouncing off the 50-day moving average (DMA) at 1.2809 on August 15. The Relative Strength Index (RSI) shows momentum favoring buyers, though the pair could consolidate soon as the RSI approaches overbought levels.
If GBP/USD climbs above 1.3100, the next stop would be the t 2023 peak at 1.3142. On further strength, the next stop would be 1.3200.
Conversely, if GBP/USD retreats below the July 17 high of 1.3044, that would pave the way for a pullback. The psychological 1.3000 figure would be the next support, followed by the August 13 high at 1.2872.
GBP/USD Price Action – Daily Chart
British Pound PRICE Today
The table below shows the percentage change of British Pound (GBP) against listed major currencies today. British Pound was the strongest against the Australian Dollar.
| USD | EUR | GBP | JPY | CAD | AUD | NZD | CHF | |
|---|---|---|---|---|---|---|---|---|
| USD | -0.21% | -0.46% | -0.16% | -0.20% | 0.02% | -0.12% | -0.40% | |
| EUR | 0.21% | -0.26% | 0.03% | 0.00% | 0.26% | 0.08% | -0.19% | |
| GBP | 0.46% | 0.26% | 0.32% | 0.29% | 0.49% | 0.35% | 0.09% | |
| JPY | 0.16% | -0.03% | -0.32% | -0.04% | 0.20% | 0.00% | -0.22% | |
| CAD | 0.20% | -0.01% | -0.29% | 0.04% | 0.24% | 0.06% | -0.21% | |
| AUD | -0.02% | -0.26% | -0.49% | -0.20% | -0.24% | -0.18% | -0.41% | |
| NZD | 0.12% | -0.08% | -0.35% | -0.00% | -0.06% | 0.18% | -0.25% | |
| CHF | 0.40% | 0.19% | -0.09% | 0.22% | 0.21% | 0.41% | 0.25% |
The heat map shows percentage changes of major currencies against each other. The base currency is picked from the left column, while the quote currency is picked from the top row. For example, if you pick the British Pound from the left column and move along the horizontal line to the US Dollar, the percentage change displayed in the box will represent GBP (base)/USD (quote).
- Dow Jones continues to churn just below 41,000.00.
- Equities continue to look for further signs of rate cuts from Fed.
- NFP payroll adjustments have bolstered bets of 100 bps in 2024.
The Dow Jones Industrial Average is churning in the midrange on Wednesday as markets buckle down for the wait to the kickoff of this year’s annual Jackson Hole Economic Summit on Thursday. Markets continue to look for firmer signs of the Federal Reserve (Fed) getting pushed into a rate cutting cycle in September, with bets on the rise of a 100 bps rate trim on September 18.
According to the CME’s FedWatch Tool, rate markets kicked up their bets of a double rate cut from the Fed in September after the Bureau of Labor Statistics (BLS) reported a steep downside revision to Nonfarm Payroll (NFP) figures initially released in March. The BLS knocked over 800K jobs off of the March jobs report retroactively, sending rate trader bets of a 100 bps initial cut on September 18 up to roughly a third, with the remainder of the rate markets still expecting at least a 25 bps trim.
Dow Jones news
Despite testing middling waters, most of the Dow Jones is finding gains on Wednesday, with less than a third of the equity board declining during the midweek market session. American Express Co. (AXP) is down 3.3% to $244.62 per share, while 3M Co. (MMM) climbed around 1.5% to test $130.00 per share.
Read more: American Express suffers as Bank of America downgrades AXP on slower growth
Dow Jones price forecast
The Dow Jones is set to price in another middling day on Wednesday, and is poised to pop a spinning top candlestick after chalking in one of the index’s best weeks of the year. This week’s price action snapped a five-day winning streak, but bidding pressure continues to simmer as a pullback has yet to materialize.
Dow Jones daily chart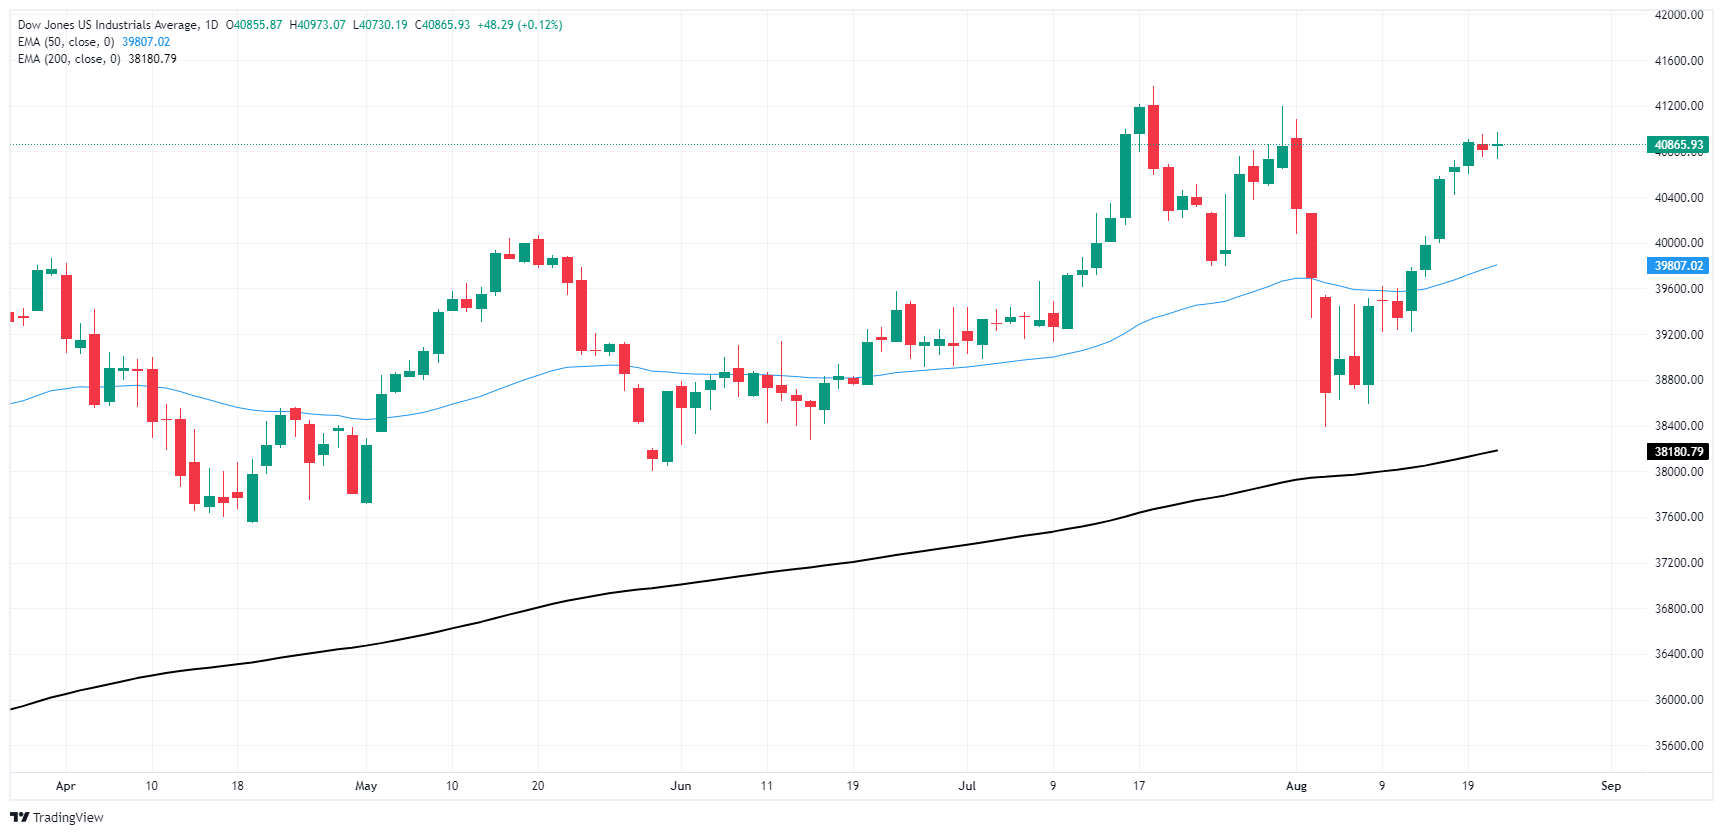
Dow Jones FAQs
The Dow Jones Industrial Average, one of the oldest stock market indices in the world, is compiled of the 30 most traded stocks in the US. The index is price-weighted rather than weighted by capitalization. It is calculated by summing the prices of the constituent stocks and dividing them by a factor, currently 0.152. The index was founded by Charles Dow, who also founded the Wall Street Journal. In later years it has been criticized for not being broadly representative enough because it only tracks 30 conglomerates, unlike broader indices such as the S&P 500.
Many different factors drive the Dow Jones Industrial Average (DJIA). The aggregate performance of the component companies revealed in quarterly company earnings reports is the main one. US and global macroeconomic data also contributes as it impacts on investor sentiment. The level of interest rates, set by the Federal Reserve (Fed), also influences the DJIA as it affects the cost of credit, on which many corporations are heavily reliant. Therefore, inflation can be a major driver as well as other metrics which impact the Fed decisions.
Dow Theory is a method for identifying the primary trend of the stock market developed by Charles Dow. A key step is to compare the direction of the Dow Jones Industrial Average (DJIA) and the Dow Jones Transportation Average (DJTA) and only follow trends where both are moving in the same direction. Volume is a confirmatory criteria. The theory uses elements of peak and trough analysis. Dow’s theory posits three trend phases: accumulation, when smart money starts buying or selling; public participation, when the wider public joins in; and distribution, when the smart money exits.
There are a number of ways to trade the DJIA. One is to use ETFs which allow investors to trade the DJIA as a single security, rather than having to buy shares in all 30 constituent companies. A leading example is the SPDR Dow Jones Industrial Average ETF (DIA). DJIA futures contracts enable traders to speculate on the future value of the index and Options provide the right, but not the obligation, to buy or sell the index at a predetermined price in the future. Mutual funds enable investors to buy a share of a diversified portfolio of DJIA stocks thus providing exposure to the overall index.
- DXY index falls to its lowest level since January.
- Markets continue to aggressively bet on a dovish Fed.
- Powell’s words on Friday at the Jackson Hole Symposium will guide the markets.
The US Dollar (USD), as measured by the US Dollar Index (DXY), exhibits no signs of recovery and declined near 101.15 during Wednesday's trading session. This is due to intense dovish bets on the Federal Reserve (Fed) and with US Treasury yields continuing to struggle.
The US economic outlook continues to project growth above trend, providing ample indication that the market may be overly optimistic about quick and aggressive rate cuts.
Daily digest market movers: US Dollar weak in anticipation of FOMC minutes and Jackson Hole Symposium
- The release of the FOMC Minutes from the July 30-31 meeting remains the focal market mover today.
- The Fed specified in its statement that it will not consider a rate reduction until it gains greater confidence in sustainable inflation movement toward the 2% target.
- Additionally, the Fed has raised concerns about the state of the labor market.
- These remarks set the stage for a cautious tone from Powell at the Jackson Hole meeting this Friday, suggesting a possible 25 bps cut in September.
DXY T]technical outlook: Bearish dominance persists, index at yearly lows
The DXY technical outlook remains predominantly bearish. Current analysis shows that the index broke the sideways trading regime in the 102.50-103.30 band and fell to a yearly low, which offers a good case for sellers.
The DXY index remains under significantly bearish domination as indicated by the oversold status of the Relative Strength Index (RSI) and the rising red bars shown by the Moving Average Convergence Divergence (MACD).
Support Levels: 101.00, 100.80, 100.50 Resistance Levels: 101.50, 101.80, 102.00
US Dollar FAQs
The US Dollar (USD) is the official currency of the United States of America, and the ‘de facto’ currency of a significant number of other countries where it is found in circulation alongside local notes. It is the most heavily traded currency in the world, accounting for over 88% of all global foreign exchange turnover, or an average of $6.6 trillion in transactions per day, according to data from 2022. Following the second world war, the USD took over from the British Pound as the world’s reserve currency. For most of its history, the US Dollar was backed by Gold, until the Bretton Woods Agreement in 1971 when the Gold Standard went away.
The most important single factor impacting on the value of the US Dollar is monetary policy, which is shaped by the Federal Reserve (Fed). The Fed has two mandates: to achieve price stability (control inflation) and foster full employment. Its primary tool to achieve these two goals is by adjusting interest rates. When prices are rising too quickly and inflation is above the Fed’s 2% target, the Fed will raise rates, which helps the USD value. When inflation falls below 2% or the Unemployment Rate is too high, the Fed may lower interest rates, which weighs on the Greenback.
In extreme situations, the Federal Reserve can also print more Dollars and enact quantitative easing (QE). QE is the process by which the Fed substantially increases the flow of credit in a stuck financial system. It is a non-standard policy measure used when credit has dried up because banks will not lend to each other (out of the fear of counterparty default). It is a last resort when simply lowering interest rates is unlikely to achieve the necessary result. It was the Fed’s weapon of choice to combat the credit crunch that occurred during the Great Financial Crisis in 2008. It involves the Fed printing more Dollars and using them to buy US government bonds predominantly from financial institutions. QE usually leads to a weaker US Dollar.
Quantitative tightening (QT) is the reverse process whereby the Federal Reserve stops buying bonds from financial institutions and does not reinvest the principal from the bonds it holds maturing in new purchases. It is usually positive for the US Dollar.
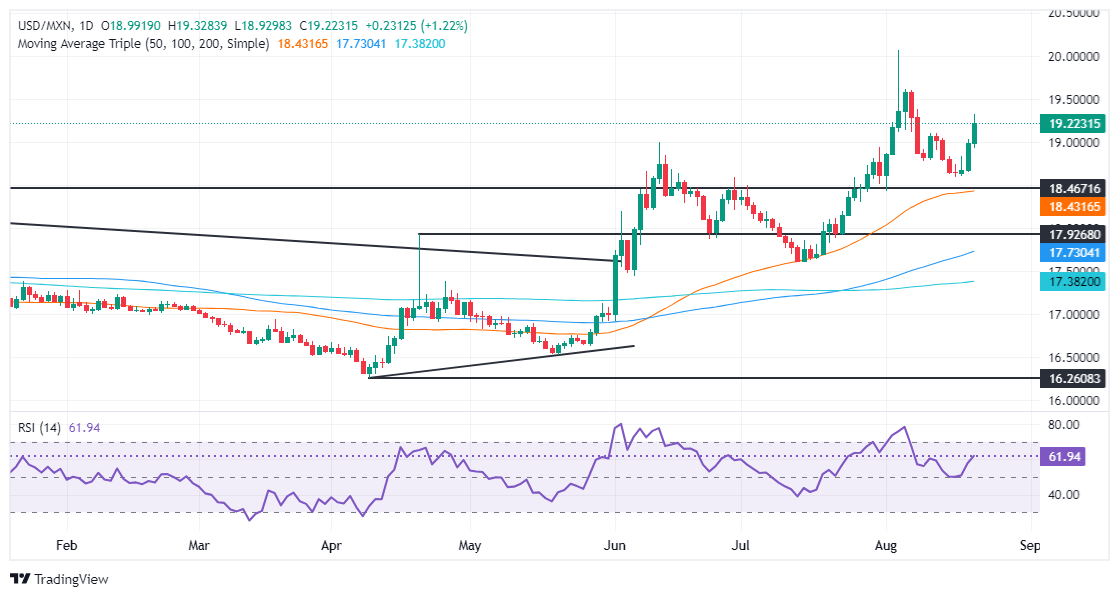
- Mexican Peso weakens after INEGI reports sharp declines in June Retail Sales with inflation concerns looming.
- US Dollar strengthens following downward revision of Nonfarm Payrolls by 800K.
- Fitch warns of rising debt risks for Mexico’s next administration with potential impacts on sovereign rating amid judicial reform controversy.
The Mexican Peso depreciated over 1.20% against the US Dollar in early trading on Wednesday as traders digested Mexico’s dismal Retail Sales report and awaited the release of a revision of US employment figures. The USD/MXN trades at 19.21 after bouncing off a daily low of 18.92.
Wall Street traded in the green, portraying optimism among investors. The Greenback advanced as the Bureau of Labor Statistics (BLS) revised the Nonfarm Payrolls (NFP) figures downward by 800K.
Meanwhile, on Tuesday, the Instituto Nacional de Estadistica Geografia e Informatica (INEGI) revealed that Retail Sales in June plunged in monthly and annual figures. In addition to this data, August’s mid-month inflation data is expected to tick up in core figures, while the headline is foreseen edging lower.
In the meantime, Fitch’s rating said that Mexico’s upcoming administration will face a growing debt above 51% of the Gross Domestic Product (GDP), which could affect the country’s sovereign rating.
The agency noted, “The fiscal strategy and governance reforms of the Sheinbaum government will be key factors for Mexico's rating.”
Fitch analysts added that judiciary reform “would negatively affect Mexico’s overall institutional profile, but the severity of their impact could become clearer once approved and implemented.”
Meanwhile, unions representing Mexico’s judicial workers launched an indefinite nationwide strike last Monday against President Andres Manuel Lopez Obrador's proposed judiciary reform.
According to Reuters, “The unions criticized the reform push in a statement as rushed and a danger to the "only counterweight" to the ruling Morena party's dominance of both the presidency and Congress.”
Juana Fuentes, the national director of Mexico’s Association of Federal Judges and Magistrates, which organized the strike vote on Tuesday, said, “If this bill passes, we will be creating a regime of absolute power concentrated in one single person.”
In addition, USD/MXN traders will be eyeing the release of the latest Federal Reserve (Fed) monetary policy meeting.
Daily digest market movers: Mexican Peso weakens as data hints at economic slowdown
- Mexico’s Retail Sales for June dived -3.9% YoY, below expectations for a contraction of -1.7%. Every month, sales plunged -0.5%, below estimates of a 0.2% increase.
- Mid-month inflation in August is expected to drop from 5.61% YoY to 5.31%, while core figures are estimated to rise from 4.02% to 4.06%.
- Meanwhile, Mexico’s economy is expected to grow by 2.2% YoY, according to the Gross Domestic Product (GDP) final figures for the second quarter, which is against preliminary readings of 1.65%.
- The USD/MXN is also driven by interest rate differentials between the two countries. Although the spread has narrowed as the Bank of Mexico (Banxico) lowered rates at the August meeting, traders estimate the Fed will cut rates by at least 98 basis points, according to the CBOT fed funds rate December 2024 futures contract.
Technical analysis: Mexican Peso extends losses as USD/MXN climbs above 19.20
The USD/MXN uptrend remains intact and might continue, but stir resistance lies ahead. Momentum favors buyers with the Relative Strength Index (RSI) remaining bullish.
If the exotic pair extends its gains, the first resistance it would face would be 19.50. A breach of the latter will expose the psychological 20.00 figure, ahead of the year-to-date (YTD) high of 20.22.
On the flip side, on USD/MXN, there is further weakness. Peso’s buyers could drive the pair beneath the psychological 19.00 figure. Once cleared, the next stop would be the latest cycle low of 18.59, hit on August 19.
Mexican Peso FAQs
The Mexican Peso (MXN) is the most traded currency among its Latin American peers. Its value is broadly determined by the performance of the Mexican economy, the country’s central bank’s policy, the amount of foreign investment in the country and even the levels of remittances sent by Mexicans who live abroad, particularly in the United States. Geopolitical trends can also move MXN: for example, the process of nearshoring – or the decision by some firms to relocate manufacturing capacity and supply chains closer to their home countries – is also seen as a catalyst for the Mexican currency as the country is considered a key manufacturing hub in the American continent. Another catalyst for MXN is Oil prices as Mexico is a key exporter of the commodity.
The main objective of Mexico’s central bank, also known as Banxico, is to maintain inflation at low and stable levels (at or close to its target of 3%, the midpoint in a tolerance band of between 2% and 4%). To this end, the bank sets an appropriate level of interest rates. When inflation is too high, Banxico will attempt to tame it by raising interest rates, making it more expensive for households and businesses to borrow money, thus cooling demand and the overall economy. Higher interest rates are generally positive for the Mexican Peso (MXN) as they lead to higher yields, making the country a more attractive place for investors. On the contrary, lower interest rates tend to weaken MXN.
Macroeconomic data releases are key to assess the state of the economy and can have an impact on the Mexican Peso (MXN) valuation. A strong Mexican economy, based on high economic growth, low unemployment and high confidence is good for MXN. Not only does it attract more foreign investment but it may encourage the Bank of Mexico (Banxico) to increase interest rates, particularly if this strength comes together with elevated inflation. However, if economic data is weak, MXN is likely to depreciate.
As an emerging-market currency, the Mexican Peso (MXN) tends to strive during risk-on periods, or when investors perceive that broader market risks are low and thus are eager to engage with investments that carry a higher risk. Conversely, MXN tends to weaken at times of market turbulence or economic uncertainty as investors tend to sell higher-risk assets and flee to the more-stable safe havens.
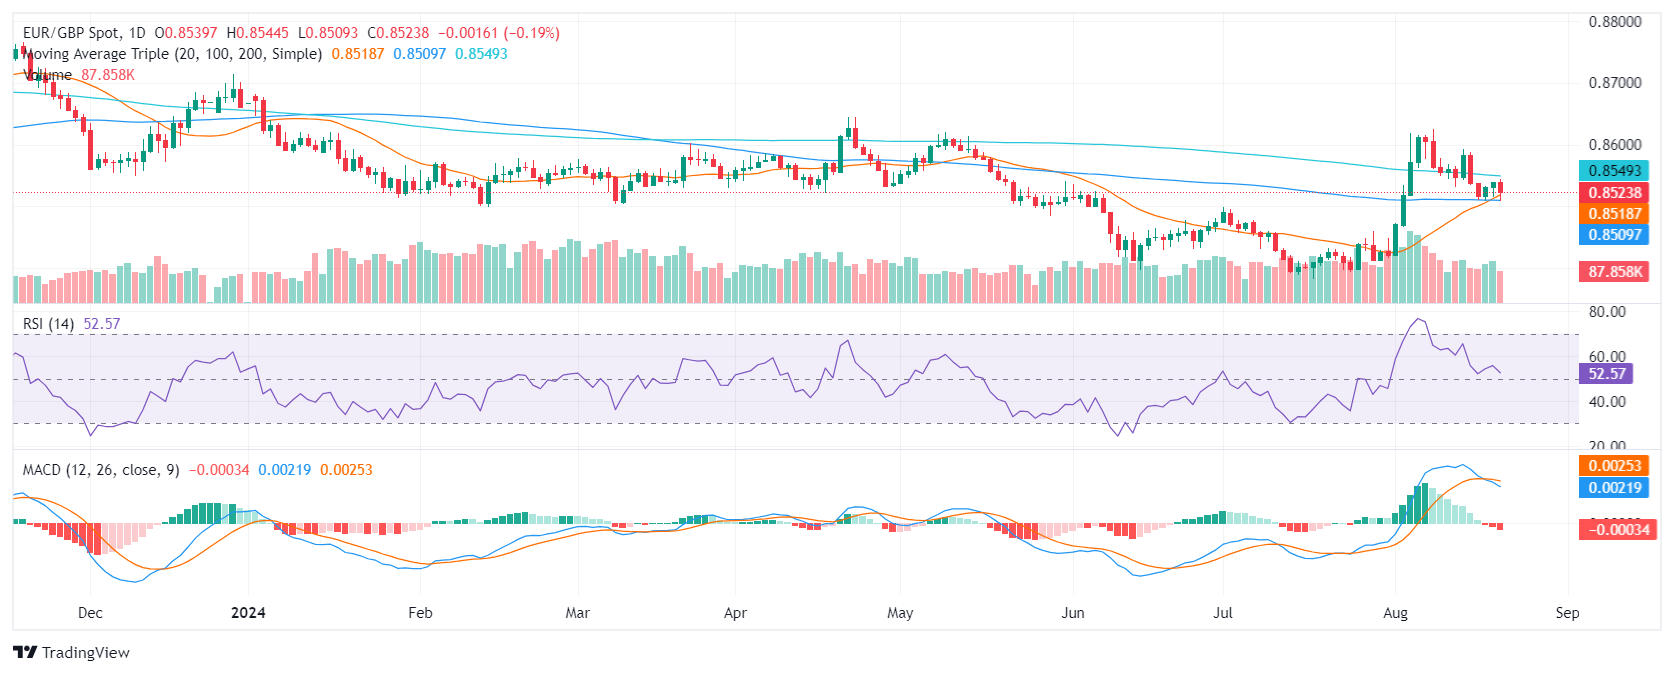
- The EUR/GBP declined towards reaching 0.852 and bears threatened the 0.8500 area.
- Bearish indicators signal the potential for a downside move.
- The 0.8500 (20 and 100-day SMA crossover) level remains a critical support to watch.
In Wednesday's session, the EUR/GBP resumed its losses, to settle at 0.8520. Technical indicators paint a mixed picture but the sellers appear to be threatening with breaking the 0.8500 support.
The Relative Strength Index (RSI) has fallen to 55, suggesting a decrease in buying pressure, while the Moving Average Convergence Divergence (MACD) is forming rising red bars, indicating growing bearish momentum. Volume patterns have been mixed, with a flat trend in recent sessions.
In summary, the EUR/GBP pair is facing a potential bearish trend, with selling pressure likely to persist. A break below the key 0.8500 support would reinforce the bearish bias and open up the possibility for further downside. On the positive side, the bullish crossover between the 20 and 100-day Simple Moving Averages (SMA) provides strong support
EUR/GBP daily chart
When Platinum Group Metals are on the front foot, analysts are watching Palladium, TDS Senior Commodity Strategist Daniel Ghali notes.
Short positions may start to unwind
“Recall, there are scenarios where the large net short position held by CTAs could be nearly completely unwound should prices continue to rise in a big uptape. These risks to algo positions are particularly acute in Palladium, as we also note that discretionary traders have reaccumulated their epic net short position over the last months.”
“In this context, a squeeze on CTA positioning could morph into a squeeze on discretionary positions, even as we acknowledge that discretionary traders have thus far managed to withstand pain in similar episodes over the last months.”
The US Bureau of Labor Statistics announced on Wednesday that the preliminary estimate of the benchmark revision indicates an adjustment to March 2024 total Nonfarm employment of -818,000 (-0.5%).
"The final benchmark revision will be issued in February 2025 with the publication of the January 2025 Employment Situation news release," the BLS noted in its press release.
Market reaction
This announcement doesn't seem to be having a noticeable impact on the US Dollar's (USD) valuation against its major rivals. At the time of press, the USD Index was up 0.15% on a daily basis at 101.53.
Nonfarm Payrolls FAQs
Nonfarm Payrolls (NFP) are part of the US Bureau of Labor Statistics monthly jobs report. The Nonfarm Payrolls component specifically measures the change in the number of people employed in the US during the previous month, excluding the farming industry.
The Nonfarm Payrolls figure can influence the decisions of the Federal Reserve by providing a measure of how successfully the Fed is meeting its mandate of fostering full employment and 2% inflation. A relatively high NFP figure means more people are in employment, earning more money and therefore probably spending more. A relatively low Nonfarm Payrolls’ result, on the either hand, could mean people are struggling to find work. The Fed will typically raise interest rates to combat high inflation triggered by low unemployment, and lower them to stimulate a stagnant labor market.
Nonfarm Payrolls generally have a positive correlation with the US Dollar. This means when payrolls’ figures come out higher-than-expected the USD tends to rally and vice versa when they are lower. NFPs influence the US Dollar by virtue of their impact on inflation, monetary policy expectations and interest rates. A higher NFP usually means the Federal Reserve will be more tight in its monetary policy, supporting the USD.
Nonfarm Payrolls are generally negatively-correlated with the price of Gold. This means a higher-than-expected payrolls’ figure will have a depressing effect on the Gold price and vice versa. Higher NFP generally has a positive effect on the value of the USD, and like most major commodities Gold is priced in US Dollars. If the USD gains in value, therefore, it requires less Dollars to buy an ounce of Gold. Also, higher interest rates (typically helped higher NFPs) also lessen the attractiveness of Gold as an investment compared to staying in cash, where the money will at least earn interest.
Nonfarm Payrolls is only one component within a bigger jobs report and it can be overshadowed by the other components. At times, when NFP come out higher-than-forecast, but the Average Weekly Earnings is lower than expected, the market has ignored the potentially inflationary effect of the headline result and interpreted the fall in earnings as deflationary. The Participation Rate and the Average Weekly Hours components can also influence the market reaction, but only in seldom events like the “Great Resignation” or the Global Financial Crisis.
High deficits, slowing growth, fears of sticky inflation, currency devaluation, and an imminent cutting cycle worldwide are all reasons to explain the current spike in Gold prices. But traders might be going too far, TDS Senior Commodity Strategist Daniel Ghali notes.
Downside risks have grown got Gold
“What if we argued these narratives had already attracted significant inflows into Gold markets? Our gauge of macro fund positioning in Gold has scarcely been higher than it is today. In fact, it is statistically consistent with 370bps of Fed cuts.”
“Commodity Trading Advisors (CTAs) are 'max long', and Shanghai trader positioning has reverted to record highs. Few visible shorts remain in the market. Positioning cues are flashing red in Gold markets. And while the fundamental narratives that drive Gold are bullish, narratives ultimately chase prices.”
“Downside risks have grown, and while positioning tells us nothing about timing, Jackson Hole and the next nonfarm payrolls report appear to be consequential catalysts for a possible washout in positioning.”
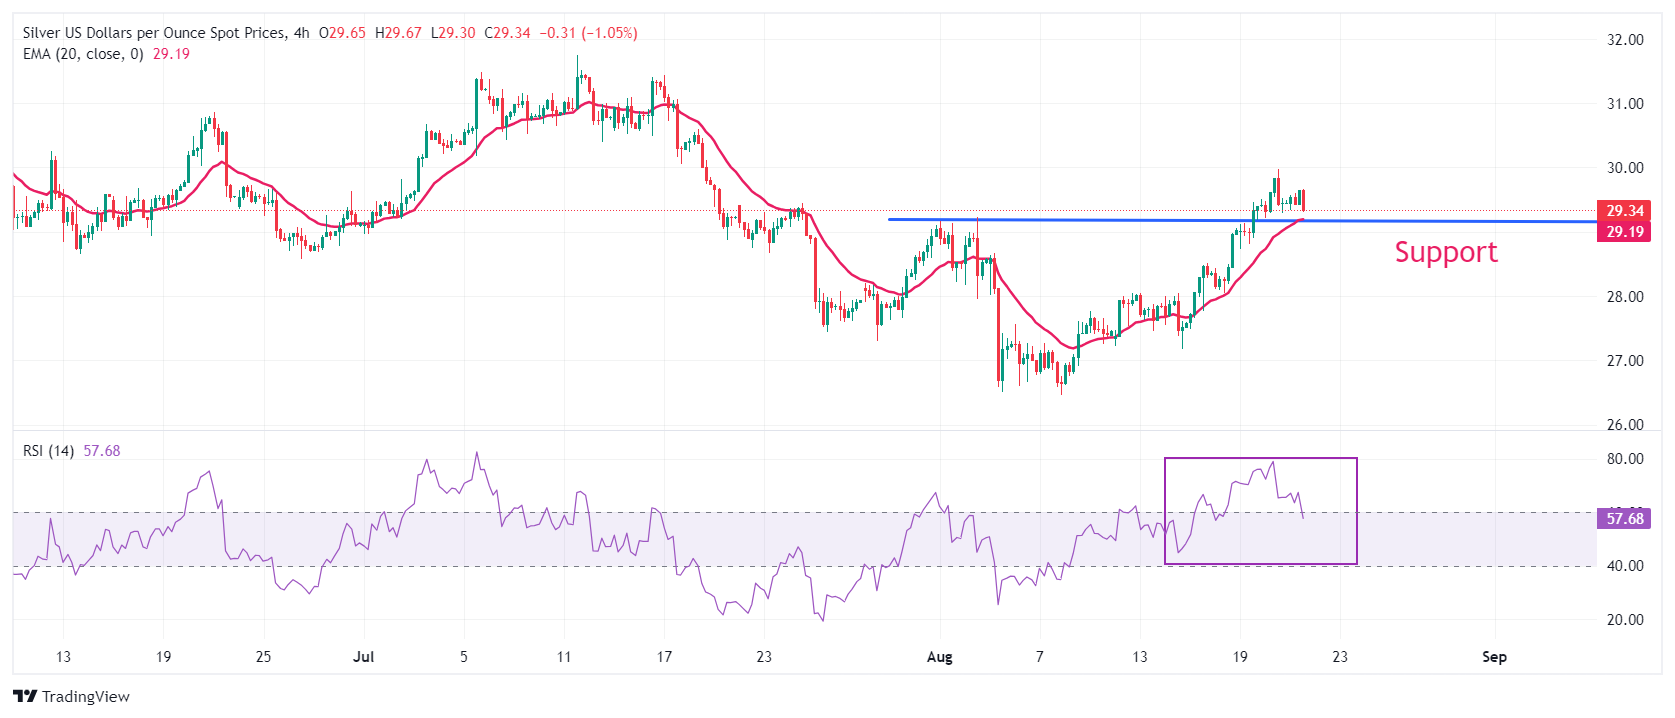
- Silver price trades sideways below $30.00 with FOMC minutes in focus.
- The US Dollar and bond yields remain in a bearish trajectory on Fed rate-cut optimism.
- Fed Powell’s speech at the JH symposium will be the key event this week.
Silver price (XAG/USD) trades in a tight range below the psychological resistance of $30.00, with investors focusing on the Federal Open Market Committee (FOMC) minutes for the July monetary policy, which will be published at 18:00 GMT.
Investors await the FOMC minutes release as it will provide fresh cues about the interest rate path this year. In the July meeting, the Fed left interest rates unchanged in the range of 5.25%-5.50% but assured that policymakers are prepared to adjust the monetary policy stance in case risks emerge that could delay the attainment of banks’ goals, such as inflation at 2% along with the maintenance of full employment.
Ahead of the FOMC minutes, the US Dollar (USD) exhibits a subdued performance and remains near seven-month lows. The US Dollar Index (DXY), which tracks the Greenback’s value against six major currencies, hovers near 101.40. 10-year US Treasury yields decline to near 3.80%. Lower yields on interest-bearing assets reduce the opportunity cost of holding an investment in non-yielding assets, such as Silver.
This week, the US Dollar is expected to remain volatile as Fed Chair Jerome Powell is scheduled to speak at the Jackson Hole (JH) Symposium on Friday. Fed Powell would indicate how much the central bank could cut interest rates this year.
Silver technical analysis
Silver price delivers a bullish reversal as a decisive break above August 2 high of $29.20 has faltered the lower high lower low formation on a four-hour timeframe. An upward-sloping 20-period Exponential Moving Average (EMA) near $29.20 is expected to act as a cushion for Silver price bulls.
The 14-period Relative Strength Index (RSI) falls to near 60.00, suggesting that the bullish momentum has concluded for now. However, the bullish bias remains intact.
Silver four-hour chart
Silver FAQs
Silver is a precious metal highly traded among investors. It has been historically used as a store of value and a medium of exchange. Although less popular than Gold, traders may turn to Silver to diversify their investment portfolio, for its intrinsic value or as a potential hedge during high-inflation periods. Investors can buy physical Silver, in coins or in bars, or trade it through vehicles such as Exchange Traded Funds, which track its price on international markets.
Silver prices can move due to a wide range of factors. Geopolitical instability or fears of a deep recession can make Silver price escalate due to its safe-haven status, although to a lesser extent than Gold's. As a yieldless asset, Silver tends to rise with lower interest rates. Its moves also depend on how the US Dollar (USD) behaves as the asset is priced in dollars (XAG/USD). A strong Dollar tends to keep the price of Silver at bay, whereas a weaker Dollar is likely to propel prices up. Other factors such as investment demand, mining supply – Silver is much more abundant than Gold – and recycling rates can also affect prices.
Silver is widely used in industry, particularly in sectors such as electronics or solar energy, as it has one of the highest electric conductivity of all metals – more than Copper and Gold. A surge in demand can increase prices, while a decline tends to lower them. Dynamics in the US, Chinese and Indian economies can also contribute to price swings: for the US and particularly China, their big industrial sectors use Silver in various processes; in India, consumers’ demand for the precious metal for jewellery also plays a key role in setting prices.
Silver prices tend to follow Gold's moves. When Gold prices rise, Silver typically follows suit, as their status as safe-haven assets is similar. The Gold/Silver ratio, which shows the number of ounces of Silver needed to equal the value of one ounce of Gold, may help to determine the relative valuation between both metals. Some investors may consider a high ratio as an indicator that Silver is undervalued, or Gold is overvalued. On the contrary, a low ratio might suggest that Gold is undervalued relative to Silver.
CTA buying activity in base metals is grinding to a halt, with our estimates suggesting that algos are already likely back on the offer in Aluminium this session, TDS Senior Commodity Strategist Daniel Ghali notes.
Shanghai traders are still adding to their net length in Aluminium
“Under the hood, however, a recovery in demand sentiment embedded within the commodities complex is simultaneously occurring alongside a rise in supply risk premia embedded within the base metals complex.”
“These tailwinds are still supportive of higher prices, particularly given signs that macro funds have already capitulated on their length, but metals markets will need to find support from these cohorts for prices to continue rising now that CTA buying activity has wound down.”
“For the time being, Shanghai traders are still adding to their net length in Aluminium, and the scope for CTAs to sell has diminished with the sharp rally in prices, but the set-up for flows is now significantly less asymmetric.”
- The Minutes of the Fed’s July 30-31 policy meeting will be published on Wednesday.
- Details of Jerome Powell and Co’s discussions about policy easing will be scrutinized.
- Markets wager a roughly 27% chance of a 50 bps Fed interest rate cut in September.
The Minutes of the US Federal Reserve’s (Fed) July 30-31 monetary policy meeting will be published on Wednesday at 18:00 GMT. Investors will scout for details in the Fed policymakers’ discussions about its policy easing strategy and the economic outlook.
Jerome Powell admits officials discussed a rate cut at July meeting
The Fed maintained its monetary policy settings for the eighth consecutive meeting in July, as widely expected. In its policy statement, the US central bank said that it is attentive to risks on both sides of its dual mandate, a change from the June statement, in which it said it was 'highly attentive' to inflation risks.
Although the Fed repeated that it does not expect it will be appropriate to lower rates until it has gained greater confidence that inflation is moving sustainably toward 2%, Fed Chair Jerome Powell’s remarks in the post-meeting press conference all but confirmed a rate cut in September.
"We are getting closer to being at the point to reduce rates," Powell said and added that a rate cut could be on the table in September. Furthermore, he noted that there was a “real discussion” about the case for reducing rates at the July meeting.
Two days after the Fed announced monetary policy decisions, the monthly report published by the Bureau of Labor Statistics (BLS) showed a further cooling of the labor market in July. Nonfarm Payrolls (NFP) in the US rose by 114,000 in July and the 206,000 increase recorded in June got revised lower to 179,000. Additionally, the Unemployment Rate rose to 4.3% from 4.1%.
Powell’s dovish remarks and the soft jobs report allowed markets to fully price in a 25 bps rate cut in September. According to the CME FedWatch Tool the probability of a 50 bps rate reduction nearly reached 50% earlier in August. With upbeat July Retail Sales and weekly Jobless Claims data easing fears over an economic downturn in the US, the odds of a large rate cut retreated toward 25%.
Fed FAQs
Monetary policy in the US is shaped by the Federal Reserve (Fed). The Fed has two mandates: to achieve price stability and foster full employment. Its primary tool to achieve these goals is by adjusting interest rates. When prices are rising too quickly and inflation is above the Fed’s 2% target, it raises interest rates, increasing borrowing costs throughout the economy. This results in a stronger US Dollar (USD) as it makes the US a more attractive place for international investors to park their money. When inflation falls below 2% or the Unemployment Rate is too high, the Fed may lower interest rates to encourage borrowing, which weighs on the Greenback.
The Federal Reserve (Fed) holds eight policy meetings a year, where the Federal Open Market Committee (FOMC) assesses economic conditions and makes monetary policy decisions. The FOMC is attended by twelve Fed officials – the seven members of the Board of Governors, the president of the Federal Reserve Bank of New York, and four of the remaining eleven regional Reserve Bank presidents, who serve one-year terms on a rotating basis.
In extreme situations, the Federal Reserve may resort to a policy named Quantitative Easing (QE). QE is the process by which the Fed substantially increases the flow of credit in a stuck financial system. It is a non-standard policy measure used during crises or when inflation is extremely low. It was the Fed’s weapon of choice during the Great Financial Crisis in 2008. It involves the Fed printing more Dollars and using them to buy high grade bonds from financial institutions. QE usually weakens the US Dollar.
Quantitative tightening (QT) is the reverse process of QE, whereby the Federal Reserve stops buying bonds from financial institutions and does not reinvest the principal from the bonds it holds maturing, to purchase new bonds. It is usually positive for the value of the US Dollar.
When will FOMC Minutes be released and how could it affect the US Dollar?
The Fed will release the minutes of the July 30-31 policy meeting at 18:00 GMT on Wednesday. Investors will scrutinize discussions surrounding interest rate cuts and the economic outlook.
In case the Minutes show that policymakers who advocated for a July rate cut also voiced their willingness for another rate reduction in September, investors could restart pricing in a large rate cut in September. In this scenario, the immediate market reaction could cause the US Dollar (USD) to weaken against its major rivals. Additionally, the USD is likely to stay on the back foot if the report shows that officials are now more concerned about the negative impact of tight policy on the economic outlook and the labor market rather than inflation.
On the other hand, the USD could gather strength if the publication reveals that officials who preferred to lower the policy rate in July wanted to skip a rate cut in September to have more time to assess incoming data.
Eren Sengezer, European Session Lead Analyst, shares a brief technical outlook for the US Dollar Index (DXY):
“The US Dollar Index remains bearish in the near term, with the Relative Strength Index (RSI) indicator on the daily chart pushing lower toward 30. On the downside, 101.70 (static level from December 2023) aligns as interim support before 100.60 (December 28 low).”
“On the flip side, the 20-day Simple Moving Average aligns as dynamic resistance at 103.50 ahead of 104.10 (200-day SMA). A daily close above the latter could attract technical buyers and open the door for another leg higher toward 104.75 (100-day SMA).”
Economic Indicator
FOMC Minutes
FOMC stands for The Federal Open Market Committee that organizes 8 meetings in a year and reviews economic and financial conditions, determines the appropriate stance of monetary policy and assesses the risks to its long-run goals of price stability and sustainable economic growth. FOMC Minutes are released by the Board of Governors of the Federal Reserve and are a clear guide to the future US interest rate policy.
Read more.Next release: Wed Aug 21, 2024 18:00
Frequency: Irregular
Consensus: -
Previous: -
Source: Federal Reserve
Minutes of the Federal Open Market Committee (FOMC) is usually published three weeks after the day of the policy decision. Investors look for clues regarding the policy outlook in this publication alongside the vote split. A bullish tone is likely to provide a boost to the greenback while a dovish stance is seen as USD-negative. It needs to be noted that the market reaction to FOMC Minutes could be delayed as news outlets don’t have access to the publication before the release, unlike the FOMC’s Policy Statement.
When evaluating the outlook for a currency pair, it is often the case that the newsflow and market focus on one side of the exchange rate dominates the other over a period of time. That has not been the case in USD/JPY this summer, Rabobank’s Senior FX Strategist Jane Foley notes.
USD/JPY to soften to the 142 area
“Indeed, the market panic earlier this month was triggered by abrupt and coincident changes in market expectations about both BoJ and Fed policy. Other factors, such as strained market positioning, also had a huge impact. While there has been a significant adjustment in positioning since then, the sharp moves in asset prices yesterday demonstrates that market sentiment remains nervous, although thinned holiday trading is likely exacerbating these moves.”
“Most activity in the last couple of weeks has been within the 145 to 147 area and there is a solid chance that this will continue to broadly hold USD/JPY in the near-term. This morning the USD is fighting back after yesterday’s sell off and we see scope for this to continue ahead of Fed Chair Powell’s testimony on Friday, suggesting scope for further upticks in USD/JPY.”
“That said, on a 6-month view, we continue to expect USD/JPY c assuming another BoJ rate hike, potentially around the turn of the year.”
- USD/CAD extends its losing streak for the fourth trading session on Wednesday.
- Investors await the FOMC minutes for fresh interest rate cues.
- The Canadian Dollar outperforms despite multiple headwinds.
The USD/CAD pair tests territory below the round-level support of 1.3600 in Wednesday’s North American session. The Loonie asset weakens as the Canadian Dollar (CAD) outperforms the US Dollar (USD) despite multiple headwinds.
Investors underpin the Canadian Dollar even though the Oil price has fallen on the backfoot amid growing speculation of a ceasefire between Iran and Israel and easing price pressures have prompted expectations of more interest rate cuts by the Bank of Canada (BoC).
Meanwhile, the US Dollar Index (DXY), which tracks the Greenback’s value against six major currencies, hovers near 101.30, the lowest level seen in more than seven months. Going forward, the US Dollar will be influenced by the Federal Open Market Committee (FOMC) minutes, which will be published at 18:00 GMT.
Later this week, Fed Chair Jerome Powell’s speech at the Jackson Hole Symposium will be keenly watched by investors to get fresh cues about the interest rate path. Fed Powell will less likely provide a pre-defined rate cut path but might show comfort to market expectations, pointing to a move towards policy-normalization in September.
USD/CAD exhibits vulnerability near the horizontal support plotted from February 28 high near 1.3600. The asset is under pressure as the 20-day Exponential Moving Average (EMA) near 1.3714 is sloping downwards.
The 14-day Relative Strength Index (RSI) oscillates in the bearish range of 20.00-40.00, suggesting a firm downside momentum.
More downside would appear if the asset breaks below April 9 low of 1.3540. This would drag the asset towards the psychological support of 1.3500, followed by March 21 low of 1.3456.
In an alternate scenario, a recovery move above August 12 high of 1.3750 would drive the asset toward the round-level resistance of 1.3800 and April 17 high near 1.3840.
USD/CAD daily chart
Canadian Dollar FAQs
The key factors driving the Canadian Dollar (CAD) are the level of interest rates set by the Bank of Canada (BoC), the price of Oil, Canada’s largest export, the health of its economy, inflation and the Trade Balance, which is the difference between the value of Canada’s exports versus its imports. Other factors include market sentiment – whether investors are taking on more risky assets (risk-on) or seeking safe-havens (risk-off) – with risk-on being CAD-positive. As its largest trading partner, the health of the US economy is also a key factor influencing the Canadian Dollar.
The Bank of Canada (BoC) has a significant influence on the Canadian Dollar by setting the level of interest rates that banks can lend to one another. This influences the level of interest rates for everyone. The main goal of the BoC is to maintain inflation at 1-3% by adjusting interest rates up or down. Relatively higher interest rates tend to be positive for the CAD. The Bank of Canada can also use quantitative easing and tightening to influence credit conditions, with the former CAD-negative and the latter CAD-positive.
The price of Oil is a key factor impacting the value of the Canadian Dollar. Petroleum is Canada’s biggest export, so Oil price tends to have an immediate impact on the CAD value. Generally, if Oil price rises CAD also goes up, as aggregate demand for the currency increases. The opposite is the case if the price of Oil falls. Higher Oil prices also tend to result in a greater likelihood of a positive Trade Balance, which is also supportive of the CAD.
While inflation had always traditionally been thought of as a negative factor for a currency since it lowers the value of money, the opposite has actually been the case in modern times with the relaxation of cross-border capital controls. Higher inflation tends to lead central banks to put up interest rates which attracts more capital inflows from global investors seeking a lucrative place to keep their money. This increases demand for the local currency, which in Canada’s case is the Canadian Dollar.
Macroeconomic data releases gauge the health of the economy and can have an impact on the Canadian Dollar. Indicators such as GDP, Manufacturing and Services PMIs, employment, and consumer sentiment surveys can all influence the direction of the CAD. A strong economy is good for the Canadian Dollar. Not only does it attract more foreign investment but it may encourage the Bank of Canada to put up interest rates, leading to a stronger currency. If economic data is weak, however, the CAD is likely to fall.
European Central Bank (ECB) executive board member Fabio Panetta said on Wednesday that he hopes that the ECB cuts key rates in September, as reported by ANSA news agency.
"The end of the tightening has already started," Panetta noted and added:
"I think it's reasonable to expect that from here on we will be going into a phase of easing monetary conditions because inflation is falling and the world economy is slowing down."
Market reaction
These comments failed to trigger a noticeable market reaction. At the time of press, EUR/USD was trading at 1.1125, where it was virtually unchanged on a daily basis.
- NZD/USD has formed a bearish reversal candlestick at its range highs and declined.
- This suggests the possibility it could be about to move down towards the range lows.
- The pair may be entering a sideways trend with odds favoring an extension of the range.
NZD/USD may be entering a sideways trend after touching the top of a multi-week range and rolling over. If it is in a sideways trend and given “the trend is your friend” it is more likely than not to continue oscillating within the confines of the range.
NZD/USD surged to a high of 0.6248 on August 20 before falling back down just as rapidly. The swift change in price led to the formation of a bearish Gravestone Doji Japanese candlestick formation (circled) which was followed by a red candlestick in the subsequent period providing added bearish confirmation. Such a pattern signals a short-term reversal.
NZD/USD 4-hour Chart
Forming as it did at the top of the range, the Gravestone Doji suggests a move back down towards the range lows of around 0.5852 is on the horizon. A close below 0.6130 would provide added confirmation of more downside.
The Moving Average Convergence Divergence (MACD) line has nearly crossed below the red signal line. If it does – which looks likely – it will provide further bearish confirmation.
The Pound Sterling (GBP) is little changed—but looking relatively comfortable—above 1.30, Scotiabank’s Chief FX Strategist Shaun Osborne notes.
GBP set to remain on track for 1.3150
“UK government finances data showed a significantly larger than forecast borrowing requirement in July (GBP19.2bn) but the data had no impact on the GBP’s performance. Near-term direction hinges on the USD’s reaction to US jobs data revisions, the FOMC minutes and Powell’s Jackson Hole comments Friday.”
GBP remains firm, just below yesterday’s peak which was the highest print for Cable since mid-2023. Trend momentum signals are aligned bullishly for the GBP on the intraday and daily DMIs and have room to allow this move up in the GBP to develop and keep the GBP on track for 1.3150. Dips to the mid/upper 1.29s should attract support.
- EUR/GBP edges lower ahead of potentially market-moving PMI data on Thursday.
- The pair has been rising since July when monetary policy expectations shifted in favor of the Euro.
- Recent data shows a rise in the Eurozone Current Account surplus and Construction Output but an increase in UK government borrowing.
EUR/GBP is marginally lower, in the 0.8520s on Wednesday as traders await key releases in the form of Purchasing Manager Indexes (PMI) – surveys gauging levels of activity in major industry sectors – for both the Eurozone and the UK, out on Thursday.
EUR/GBP started trending higher in July after the Euro (EUR) appreciated against the Pound Sterling (GBP) due to shifting monetary policy expectations.
Whilst the European Central Bank (ECB) adopted a data-driven approach amid still-high inflation in the Euro Area, the Bank of England (BoE) became much more open to the idea of cutting interest rates after inflation in the UK kept down at the BoE’s 2.0% target level. This can be seen on the comparison graph below.
-638598402665520932.png)
The consistently lower inflation in the UK indicates the BoE will probably cut interest rates more than the ECB going forward, and because lower interest rates are negative for the currency this has led to a depreciation of the Pound Sterling (GBP) against the Euro – resulting in a rise in EUR/GBP.
EUR/GBP and recent macroeconomic data
The latest data out of the Eurozone showed a rise in the Current Account surplus to €52.4 billion in June 2024 from €32.4 billion a year earlier. The data is overall positive for the Euro (EUR) since consistent Current Account surpluses are indicative of higher exports than imports which increases net demand for a currency.
Moreover, on a seasonally adjusted basis, the Current Account surplus in the Eurozone beat estimates, rising to €50.5B surplus in June when economists had expected only €37.0B, from €37.6B in May, according to data from Eurostat.
Other data from the Eurozone revealed that building work is on the rise, with the Construction Output rising 1.0% YoY in July after declining 2.4% in June and by 1.7% on a seasonally adjusted basis after registering a 0.9% decline in June.
The monthly report on the German economy from the Bundesbank, meanwhile, revealed an optimistic outlook with German economic output likely to “increase slightly in Q3.”
UK data, meanwhile, showed a greater-than-expected rise in government borrowing in July, which is overall negative for the UK’s fiscal position. Much depends on how the government reacts to the data but continued borrowing can erode the value of a country’s currency.
Public Sector Net Borrowing in the UK (excluding public sector banks) climbed to £3.1 billion in July 2024 from £1.3 billion in the same month the previous year and significantly exceeding market expectations of £1.5 billion, according to Trading Economics.
“July’s public finances figures continued the recent run of bad news on the fiscal position, with public borrowing on track to overshoot the OBR’s 2024/25 forecast of £87.2 billion by £4.7 billion. Even if this overshoot does not persist, we expect the Chancellor to raise taxes and increase borrowing at the Budget on 30th October,” says Alex Kerr, UK economist at Capital Economics.
EUR/USD is consolidating above 1.11 after three solid days’ worth of gains to reach its highest since December, Scotiabank’s Chief FX Strategist Shaun Osborne notes.
A push above 1.1140/50 to see a test of low 1.12s
“There were no major data reports this morning and tomorrow’s Eurozone negotiated wages data for Q2 are still awaited to possibly provide some guidance on ECB policy risks.”
“Spot is consolidating just under minor resistance at 1.1140 (December’s peak). Very stretched intraday and daily oscillator signals suggest a pause—at least—in the EUR’s recent bull run in the near-term.”
“Minor dips to the mid/upper 1.10s should meet firm support, however. A push above 1.1140/50 targets a drop to the low 1.12s.”
- Oil price trades broadly unchanged, trying to snap a three-day losing streak.
- The UK Marine reported that a vessel has been hit in the Red Sea by Houthi rebels.
- The US Dollar Index hits rock bottom before bouncing a touch.
Oil trades sideways on Wednesday, following three sessions of sharp selloffs, after several news outlets reported that a tanker got hit in the Red Sea by Houthi rebels. Delta Tankers has confirmed that one of its vessels, Sounion, has been attacked and is suffering minor damage. This element is very unwelcome at the moment Hamas is considering the ceasefire proposal in Gaza that both Israel and the US have put on the table.
The US Dollar Index (DXY), which tracks the performance of the US Dollar against six major currencies, is in a similar pattern as Crude Oil as it tries to snap this week’s losing streak. However, the DXY had to hit rock bottom in order to do so, giving up all gains for 2024 and literally falling flat on the year before a small bounce could occur. The main event this Wednesday is the Federal Open Market Committee (FOMC) Minutes release ahead of Jackson Hole on Friday, together with the Nonfarm Payrolls Benchmark Revision that will possibly change nonfarm data over one year up until March of this year.
At the time of writing, Crude Oil (WTI) trades at $73.07 and Brent Crude at $76.79.
Oil news and market movers: Red Sea attacks on the spotlight
- OPEC+ doesn’t seem to have not much room, if any, to boost production as that would put further pressure on Oil prices given the increased supply from the US and Brazil, according to BP Chief Economist Spencer Dale, Bloomberg reports.
- Uganda Minister of Energy Ruth Nankabirwa communicated that the country is moving forward with TotalEnergies and Cnooc to bring a $20 billion Crude development project to the country.
- Delta Tankers has reported that its tanker, Sounion, has been attacked at least three times. It is still assessing whether the ship is adrift or not and continues its course, Reuters reports.
- The overnight Crude stockpile change from the American Petroleum Institute (API) posted a small build of just 347,000 barrels. Still, this was way above the 2.8 million drawdown expected by analysts.
- This Wednesday, the weekly Crude stockpile numbers from the Energy Information Administration (EIA) will be released. The previous number was a build of 1.357 million, with a drawdown of 2.8 million barrels expected.
Economic Indicator
EIA Crude Oil Stocks Change
The EIA Crude Oil stockpiles report is a weekly measure of the change in the number of barrels in stock of crude oil and its derivates, and it's released by the Energy Information Administration. This report tends to generate large price volatility, as oil prices impact on worldwide economies, affecting the most, commodity related currencies such as the Canadian dollar. Despite it has a limited impact among currencies, this report tends to affect the price of oil itself, and, therefore, had a more notorious impact on WTI crude futures.
Read more.Next release: Wed Aug 21, 2024 14:30
Frequency: Weekly
Consensus: -2.8M
Previous: 1.357M
Oil Technical Analysis: Hand in hand
Oil tries to snap its losing streak and boot-start a recovery, although this looks rather bleak.. Still, the recent surge in attacks in the Red Sea could mean headaches ahead for the ceasefire deal that is on the table for Hamas to consider at the moment, and could quickly see a surge in violence again if the situation escalates further.
On the upside, it becomes very difficult to be bullish with a lot of resistance levels nearby. The first element to look out for is the pivotal $75.27. Next up is the double level at $77.65, which aligns with both a descending trendline and the 200-day Simple Moving Average (SMA). In case bulls are able to break above it, the 100-day SMA at $78.45 could trigger another rejection as it did last week.
On the downside, the low from August 5 at $71.17 is the best level for a bounce. It might not be bad to start considering levels below $70.00, particularly if ceasefire talks bear fruit and hedge funds start selling their speculative stake in Oil contracts. The $68.00 big figure level is the first level to watch followed by $67.11, which is the lowest point from the triple bottom seen back in June 2023.
US WTI Crude Oil: Daily Chart
WTI Oil FAQs
WTI Oil is a type of Crude Oil sold on international markets. The WTI stands for West Texas Intermediate, one of three major types including Brent and Dubai Crude. WTI is also referred to as “light” and “sweet” because of its relatively low gravity and sulfur content respectively. It is considered a high quality Oil that is easily refined. It is sourced in the United States and distributed via the Cushing hub, which is considered “The Pipeline Crossroads of the World”. It is a benchmark for the Oil market and WTI price is frequently quoted in the media.
Like all assets, supply and demand are the key drivers of WTI Oil price. As such, global growth can be a driver of increased demand and vice versa for weak global growth. Political instability, wars, and sanctions can disrupt supply and impact prices. The decisions of OPEC, a group of major Oil-producing countries, is another key driver of price. The value of the US Dollar influences the price of WTI Crude Oil, since Oil is predominantly traded in US Dollars, thus a weaker US Dollar can make Oil more affordable and vice versa.
The weekly Oil inventory reports published by the American Petroleum Institute (API) and the Energy Information Agency (EIA) impact the price of WTI Oil. Changes in inventories reflect fluctuating supply and demand. If the data shows a drop in inventories it can indicate increased demand, pushing up Oil price. Higher inventories can reflect increased supply, pushing down prices. API’s report is published every Tuesday and EIA’s the day after. Their results are usually similar, falling within 1% of each other 75% of the time. The EIA data is considered more reliable, since it is a government agency.
OPEC (Organization of the Petroleum Exporting Countries) is a group of 13 Oil-producing nations who collectively decide production quotas for member countries at twice-yearly meetings. Their decisions often impact WTI Oil prices. When OPEC decides to lower quotas, it can tighten supply, pushing up Oil prices. When OPEC increases production, it has the opposite effect. OPEC+ refers to an expanded group that includes ten extra non-OPEC members, the most notable of which is Russia.
The Pound Sterling (GBP) has come under some pressure as a result of recent concerns about the global economy and the fact that the Bank of England began the cycle of interest rate cuts at the beginning of August. However, we continue to expect GBP to strengthen in the coming months on the back of continuing inflation, a recovering real economy and the prospect of a more stable government. But it remains to be seen whether the hopes associated with the change of government will be realised, Commerzbank’s FX Analyst Michael Pfister notes.
GBP to strengthen in the coming months
“As concerns about the global economy peaked in late July/early August, GBP came under significant pressure, giving up much of its gains for the year. This was not surprising, as part of GBP's strength was based on the fact that the UK economy had recently recovered somewhat. Logically, when concerns about the economy arise, some of this strength is lost.”
“In addition, the Bank of England (BoE) cut interest rates for the first time at the beginning of August, which certainly did not help the pound in this environment. GBP has since recovered at least some of its losses. And we see further upside potential in the coming months. Although we have increased our EUR/GBP forecast by one cent over the forecast horizon to reflect our expectation of a stronger euro, we continue to believe that GBP should outperform the Euro for the time being.”
“We also see risks. Growth in the UK does not yet appear to be on as firm a footing as would be desirable. The underlying trend is likely to be somewhat lower than recent growth figures. Moreover, the UK still has a lot of catching up to do with other countries that have grown much more strongly in recent years. And the political situation still leaves us wondering whether the optimism will actually materialise.”
The Canadian Dollar (CAD) is tracking marginally higher against a generally stronger USD on the session so far but gains are marginal and essentially, spot is holding a tight range just above 1.36—a six week high for the CAD, Scotiabank’s Chief FX Strategist Shaun Osborne notes.
May test a major support in the upper 1.34s
“On expectations to marginally weaker than expected CPI data yesterday has cemented market expectations that the BoC will cut rates 25bps on September 4th but do not add much to the broader outlook for rates.”
“Spot is trading bang on our fair value estimate (1.3605) this morning. Recent CAD gains look fundamentally justified but there may be little scope for USD/CAD losses to extend at this point from a fundamental point of view. Short-covering could give the CAD some added positive momentum, however, if USD/CAD losses extend deeper below 1.36.”
“The trend lower in USDCAD is well entrenched on the intraday and daily chart but USD losses are holding a little above major support at 1.3595, defined by the 200-day MA and recent (May/July) range lows for spot. A push lower looks possible as broader momentum behind recent USD losses picks up. A clear push under 1.3595 targets a drop to 1.3550 and puts a test of major support in the upper 1.34s on the radar. Resistance is 1.3640/50.”
- AUD/USD has established an uptrend which continues extending.
- The RSI is overbought but has not yet given a sell signal.
AUD/USD has established a sequence of higher highs and higher lows on the 4-hour chart since it started rising off of the August 5 lows. This indicates the pair is in a short-term uptrend, and given “the trend is your friend” suggests a bias to further upside.
AUD/USD 4-hour Chart
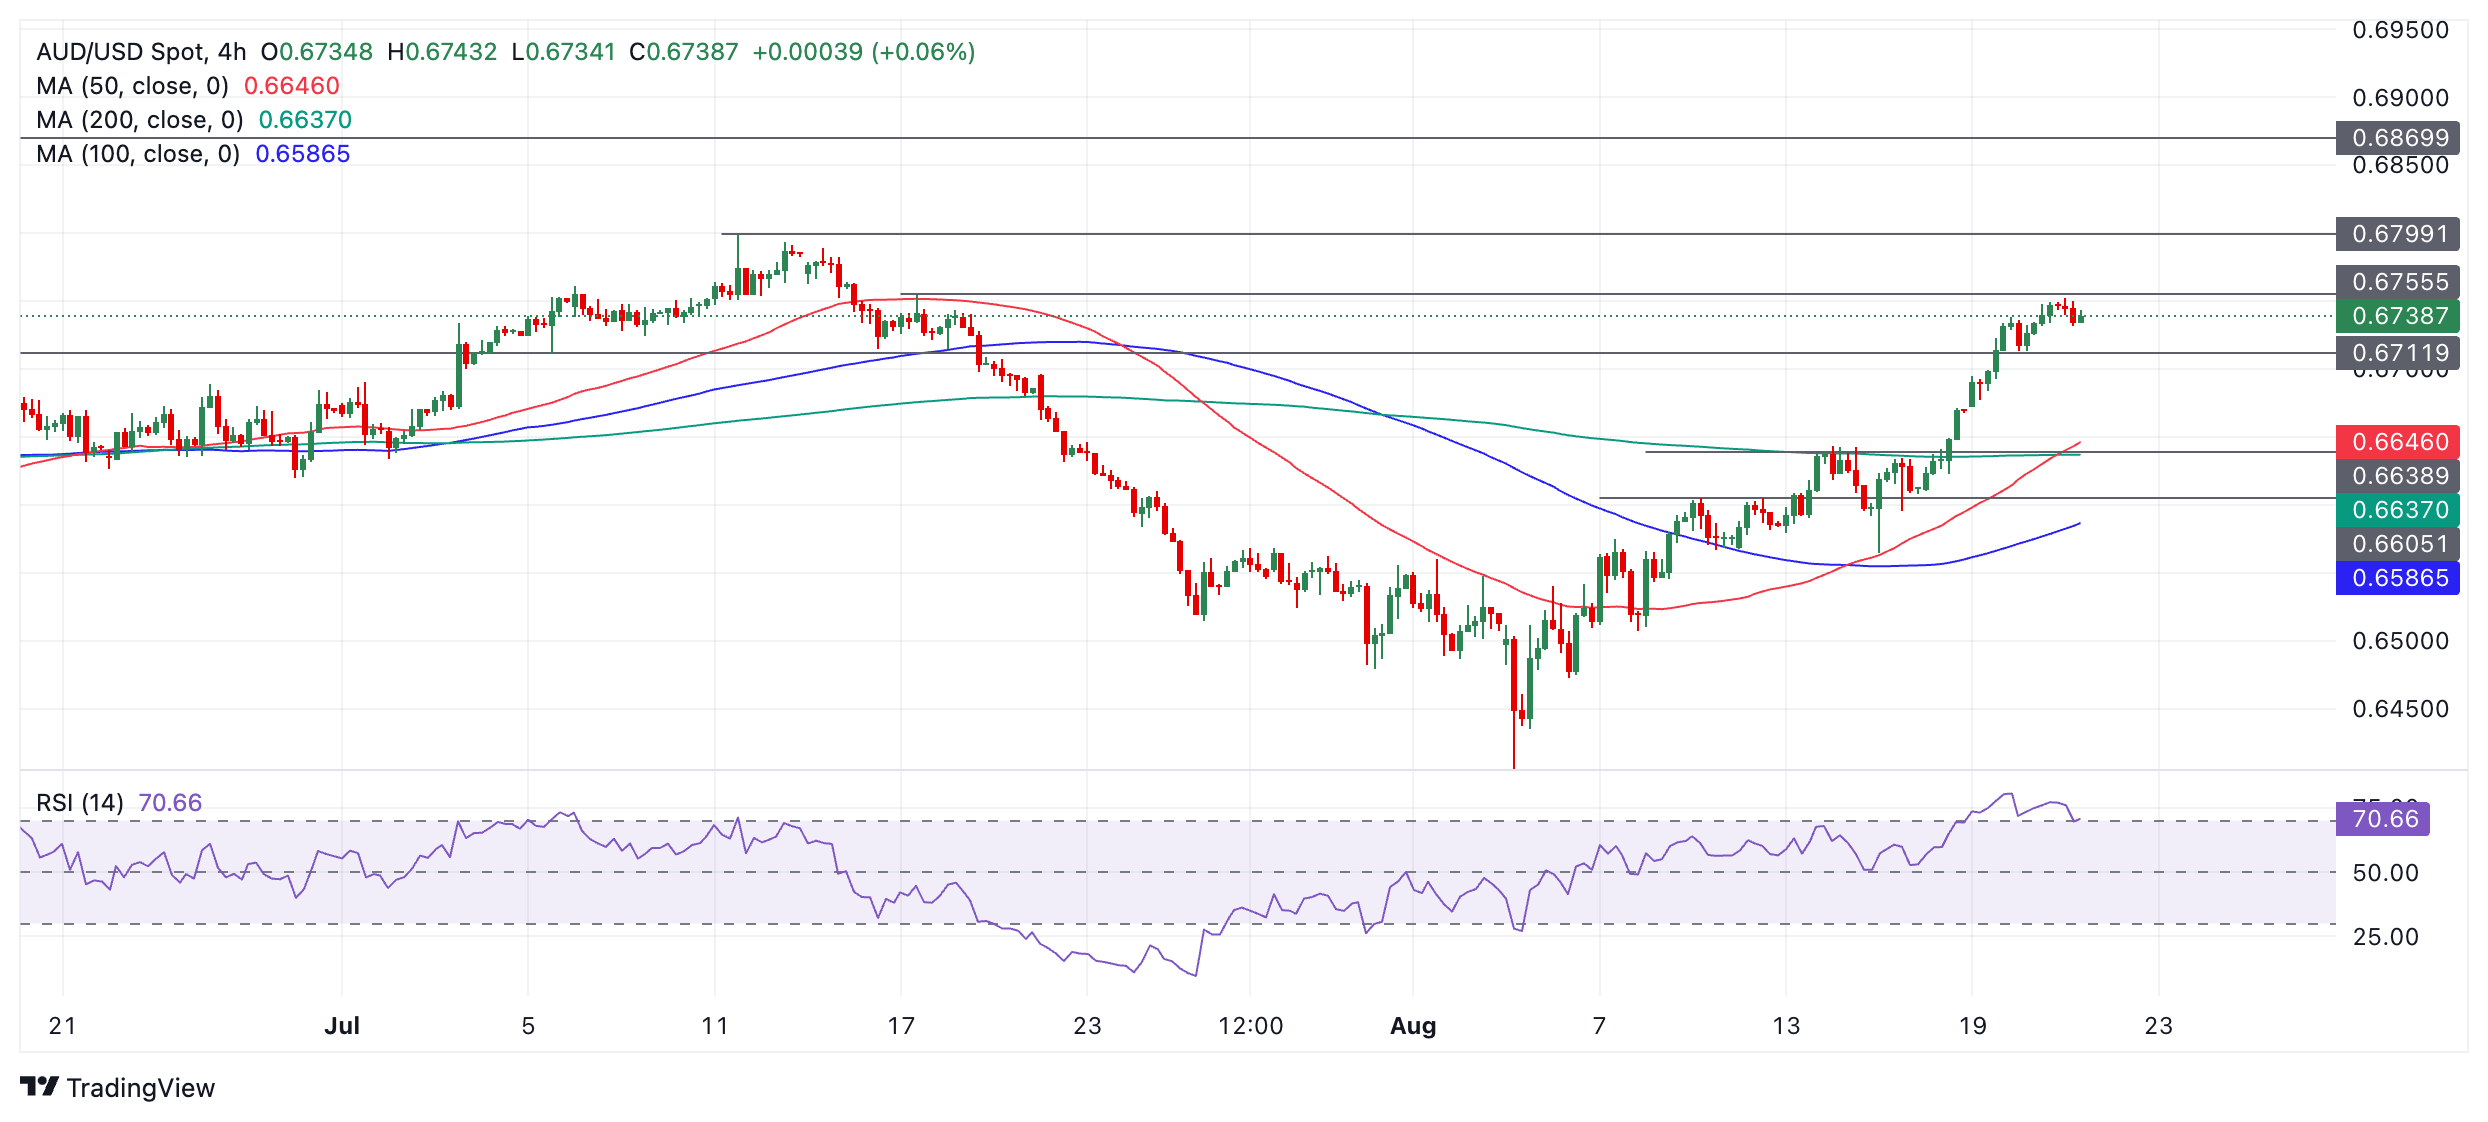
The pair consolidated briefly in the 0.6730s before continuing higher to the 0.6750s.
AUD/USD will probably continue up to the next line of resistance at 0.6760, followed by 0.6799, the July 11 high.
The Relative Strength Index (RSI) is in overbought territory, increasing the chances of a pull back. However, it would have to exit overbought territory and fall back below 70 on a closing basis to provide confirmation of a sell signal. Such a move would probably coincide with a pull back.
Despite the overbought RSI, AUD/USD could still go higher, although long holders would not be advised to add to their existing positions whilst RSI remains above 70.
The market turbulence of a few weeks ago led to a strong demand for safety, which naturally benefited the Swiss franc (CHF). In EUR/CHF terms, we narrowly missed an all-time low. The situation has since calmed down somewhat. We expect moderate CHF weakness in the coming months as the SNB is likely to cut interest rates further. However, this is unlikely to go too far, i.e. to parity, Commerzbank’s FX Analyst Michael Pfister notes.
EUR/CHF to weaken only slightly
“Concerns about the global economy came to a sudden peak a few weeks ago when the US labour market disappointed. As a result, investors moved out of riskier assets and safe-haven assets - including the CHF - benefited significantly. However, this was only the tip of a trend that had begun several weeks earlier. In mid-July, the EUR/CHF was still trading at just under 0.98, and only two weeks later it was close to its all-time low of just under 0.93.”
“The CHF is likely to suffer from such an outcome. We therefore continue to expect slightly higher EUR/CHF levels in the coming months. This may not look like a very pronounced move at first glance. However, it is important to bear in mind that the increased global demand for safe-haven assets is unlikely to disappear completely due to the current uncertainties.”
“These uncertainties are also likely to delay the peak in EUR/CHF. Specifically, we do not expect to see a peak until the first half of 2025, when global uncertainties about the economic cycle are likely to fade and the ECB will cut rates less than expected. The tide is likely to turn in the second half of the year, as it becomes clearer that euro area inflation will remain slightly above target. However, we expect EUR/CHF to weaken only slightly as the SNB is likely to keep a close eye on the CHF.”
- The US Dollar in an attempt to snap a three-day losing streak.
- The Greenback experiences a technical bounce after testing key support levels.
- The US Dollar index trades near 101.50, with a long road to recovery ahead.
The US Dollar (USD) is catching up again, trading in slightly positive territory on Wednesday, after three consecutive sessions of sharp drops. The bounce appears to be a pure technical one after the US Dollar Index (DXY) hit 101.30 in early Asian trading, the low for 2024.
On the economic data front, the Federal Open Market Committee (FOMC) Meeting Minutes for July will be published, although these are not expected to move the needle ahead of Jackson Hole on Friday. Besides the FOMC Minutes, the Nonfarm Payrolls Benchmark revision could become interesting. Markets were rattled by the latest US Nonfarm Payrolls number on the first Friday of August, a data point that triggered the unwinding of the carry trade which had spillover effects in equities and caused recession concerns for the US economy. Although the revisions are not going to cover August, any big change on earlier numbers might still bear some importance.
Daily digest market movers: Vacuum until Friday
- At 14:00 GMT, the Nonfarm Payrolls Benchmark revision is due to come out. The revisions will cover 12 months up to March of this year.
- The US Treasury is set to allocate a 20-year Bond at 17:00 GMT.
- At 18:00 GMT, the Fed will release its Minutes from July’s meeting.
- Asian equity markets are facing a bit of pressure and are in the red, which helps the US Dollar strengthen a touch. European and US equities are on the rise.
- The CME Fedwatch Tool shows a 69.5% chance of a 25 basis points (bps) interest rate cut by the Fed in September against a 30.5% chance for a 50 bps cut. Another 25 bps cut (if September is a 25 bps cut) is expected in November by 50.9%, while there is a 40.9% chance that rates will be 75 bps below the current levels and an 8.2% probability of rates being 100 basis points lower.
- The US 10-year benchmark rate trades at 3.81%, printing a fresh low for the week.
Economic Indicator
FOMC Minutes
FOMC stands for The Federal Open Market Committee that organizes 8 meetings in a year and reviews economic and financial conditions, determines the appropriate stance of monetary policy and assesses the risks to its long-run goals of price stability and sustainable economic growth. FOMC Minutes are released by the Board of Governors of the Federal Reserve and are a clear guide to the future US interest rate policy.
Read more.Next release: Wed Aug 21, 2024 18:00
Frequency: Irregular
Consensus: -
Previous: -
Source: Federal Reserve
Minutes of the Federal Open Market Committee (FOMC) is usually published three weeks after the day of the policy decision. Investors look for clues regarding the policy outlook in this publication alongside the vote split. A bullish tone is likely to provide a boost to the greenback while a dovish stance is seen as USD-negative. It needs to be noted that the market reaction to FOMC Minutes could be delayed as news outlets don’t have access to the publication before the release, unlike the FOMC’s Policy Statement.
US Dollar Index Technical Analysis: Back to the drawing board
The US Dollar Index (DXY) is trying to snap the losing streak with some conviction. The bounce comes after the DXY hit the low seen on January 2, which is the low of this year as well. The question is if this has room to go higher considering there are no real significant data elements or market movers ahead of Jackson Hole on Friday.
Defining pivotal levels becomes very important in order to avoid any dead-cat bounces, in which traders pile in too quickly in a trade and get caught on the wrong side of the fence once the course reverses. First up is 103.18, a level that traders were unable to hold last week. Next up, a heavy resistance level is at 103.99-104.00, and inches above there is the 200-day Simple Moving Average (SMA) at 104.07.
On the downside, 101.30 (low from January 2) is trying to hold for now and has triggered a bounce thus far. Should it break, the low of December 28 at 100.62 will be the ultimate level to look out for.
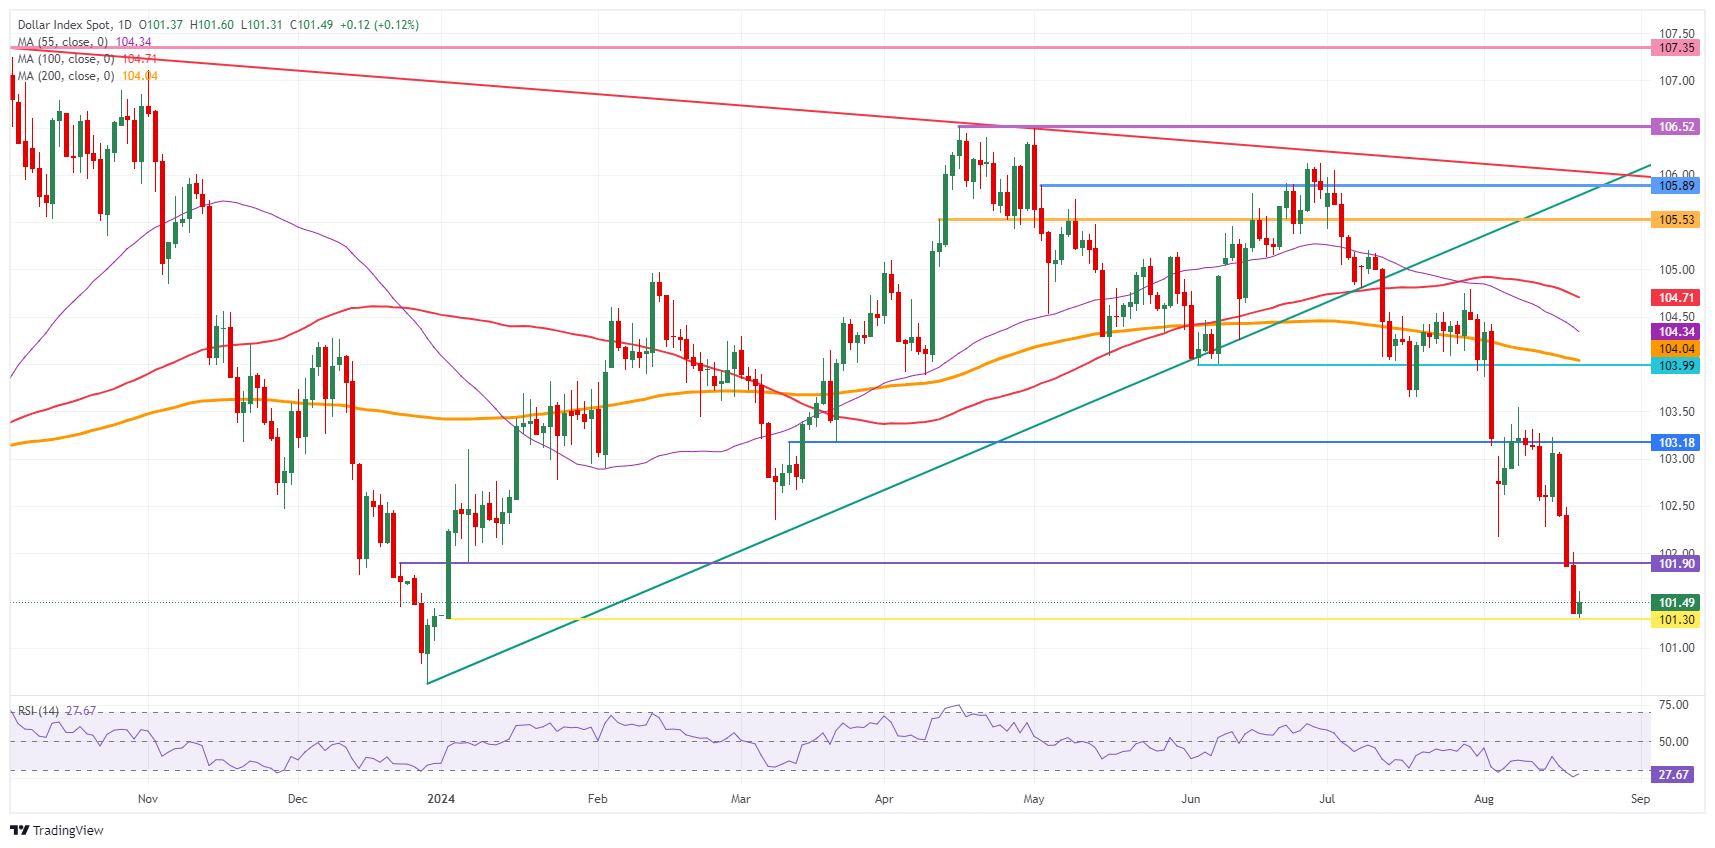
US Dollar Index: Daily Chart
US Dollar FAQs
The US Dollar (USD) is the official currency of the United States of America, and the ‘de facto’ currency of a significant number of other countries where it is found in circulation alongside local notes. It is the most heavily traded currency in the world, accounting for over 88% of all global foreign exchange turnover, or an average of $6.6 trillion in transactions per day, according to data from 2022. Following the second world war, the USD took over from the British Pound as the world’s reserve currency. For most of its history, the US Dollar was backed by Gold, until the Bretton Woods Agreement in 1971 when the Gold Standard went away.
The most important single factor impacting on the value of the US Dollar is monetary policy, which is shaped by the Federal Reserve (Fed). The Fed has two mandates: to achieve price stability (control inflation) and foster full employment. Its primary tool to achieve these two goals is by adjusting interest rates. When prices are rising too quickly and inflation is above the Fed’s 2% target, the Fed will raise rates, which helps the USD value. When inflation falls below 2% or the Unemployment Rate is too high, the Fed may lower interest rates, which weighs on the Greenback.
In extreme situations, the Federal Reserve can also print more Dollars and enact quantitative easing (QE). QE is the process by which the Fed substantially increases the flow of credit in a stuck financial system. It is a non-standard policy measure used when credit has dried up because banks will not lend to each other (out of the fear of counterparty default). It is a last resort when simply lowering interest rates is unlikely to achieve the necessary result. It was the Fed’s weapon of choice to combat the credit crunch that occurred during the Great Financial Crisis in 2008. It involves the Fed printing more Dollars and using them to buy US government bonds predominantly from financial institutions. QE usually leads to a weaker US Dollar.
Quantitative tightening (QT) is the reverse process whereby the Federal Reserve stops buying bonds from financial institutions and does not reinvest the principal from the bonds it holds maturing in new purchases. It is usually positive for the US Dollar.
The zloty weakened against the euro and against other CE3 peers yesterday after Poland’s controversial Constitutional Court ruled that NBP governor Adam Glapinski could not be brought before a parliamentary committee, nor State Tribunal, nor assessed in a report by such bodies because that would go against constitutional guarantees of central bank independence. Indeed, this is the language, which the previous ruling party (PiS) has used, from the very beginning, to frame this particular dispute Commerzbank’s FX Analyst Tatha Ghose notes.
Zloty weakens against the Euro
“We do not think that the argument makes sense or that parliament will take the Constitutional Court’s ruling as binding. Poland’s Constitutional Court, itself, has been tainted since the rule of law dispute days (versus the EU), and lacks legitimacy. Other principal courts are also dominated by right wing PiS affiliates. Accusations by both sides are purely ideological and not based on good faith.”
“On balance, it indeed appears that Glapinski’s ‘emergency’ rate cuts – just before the elections – but steadfast refusal to cut rates further once an opponent political party had taken over government, were politically motivated. After not upholding its own constitutional responsibility to remain apolitical, NBP cannot now simply appeal to ‘CB independence’.”
“The KO government will most likely proceed with the planned Sejm procedures regardless of the latest ruling, and push for an outcome where Glapinski is suspended. Glapinski, in turn, will use the ruling to defy interrogation. All in all, this drama will continue in parliament for the next year without clear resolution. And chances are that monetary policy will remain wholly political and ‘frozen’ through this timeframe.”
- EUR/JPY recovers to near 162.50 as Japan’s Trade Deficit weighs on the Yen.
- The BoJ is expected to tighten its monetary policy further this year.
- Investors await flash Eurozone PMI for August.
The EUR/JPY pair rebounds sharply from the intraday low of 161.40 to near 162.50 in Wednesday’s European session. The cross bounces back strongly as the Japanese Yen (JPY) corrects after the release of the weak Trade Balance data for July.
The data came in early Wednesday showed that Japan’s Merchandise Trade Balance fell into a deficit of ¥621.84 billion after remaining surplus in June as imports grew at a faster than expected pace.
However, the near-term outlook of the Yen remains firm on expectations that the Bank of Japan (BoJ) could tighten its monetary policy further this year. The expectations for more interest rate hikes by the BoJ strengthened after the robust Q2 Gross Domestic Product (GDP) growth.
This week, investors will focus on the Japan’s National Consumer Price Index (CPI) data for July, which will be published on Friday. The CPI report is expected to show that price pressures excluding fresh food rose by 2.7%, higher than the former release of 2.6%.
Meanwhile, the Euro (EUR) performs strongly on expectations that the European Central Bank (ECB) will cut interest rates gradually. The ECB is expected to reduce its key borrowing rates in September and one more time in the last quarter this year.
On the economic front, investors await the flash Eurozone HCOB PMI data for August, which will be published on Thursday. Economists estimated that the Composite PMI barely improved.
Economic Indicator
National CPI ex Fresh Food (YoY)
Japan’s National Consumer Price Index (CPI), released by the Statistics Bureau of Japan on a monthly basis, measures the price fluctuation of goods and services purchased by households nationwide excluding fresh food, whose prices often fluctuate depending on the weather. The YoY reading compares prices in the reference month to the same month a year earlier. Generally, a high reading is seen as bullish for the Japanese Yen (JPY), while a low reading is seen as bearish.
Read more.Next release: Thu Aug 22, 2024 23:30
Frequency: Monthly
Consensus: 2.7%
Previous: 2.6%
Source: Statistics Bureau of Japan
The Riksbank delivered at its meeting yesterday and cut the key interest rate by 25 basis points to 3.50%. The big question was how many further rate cuts it would signal for the rest of the year. It became somewhat more dovish and spoke of somewhat faster rate cuts than in June, Commerzbank’s FX Analyst Antje Praefcke notes.
Krona gains slightly after the Riksbank
“This means that after yesterday's interest rate cut, the Riksbank still considers two to three more cuts (i.e. 50 to 75 bp) by the end of the year. It has thus implicitly included a further rate cut for this year in its considerations. The main reason for this is that inflation is likely to stabilize close to the target and the outlook for the Swedish economy and abroad has deteriorated.”
“The market had expected a further 75 basis points by the end of the year anyway. So the Riksbank has almost completely got in line with this view. I think that as soon as the next price and economic data indicate it, the Riksbank will switch fully to 75 basis points. It could then adjust the interest rate path a little further downwards at its meeting in September when the new forecasts are published.”
“What does the krona make of the interest rate decision? The market's expectations were already somewhat higher than those of the Riksbank. There was basically no potential for negative surprises. In this respect, it is not surprising that the krona was able to gain slightly after the Riksbank did not signal quite as many interest rate cuts as the market had expected.”
The quiet day in the region yesterday was disrupted at the end of the day by headlines from an interview with the Governor of the National Bank of Poland (NBP) after the non-monetary decision meeting. The NBP is on summer break in August and the next monetary meeting is not until the end of September, ING’s FX strategist Frantisek Taborsky notes.
PLN's rally over the last 10 days is over
“Governor Adam Glapiński seems to have taken the opportunity to express his views after some of his colleagues downplayed his recent comments about rate cuts as late as 2026. In yesterday's interview, the governor acknowledges the possibility of the economy and inflation surprising to the downside next year, but it seems his base case scenario is still more of a rate cut in 2026 given the upside risks to inflation in his view.”
“Our economists still see the first rate cut in the second quarter of 2025, which seems like the best decision given the inflation profile for the coming months. There is a chance we could see a rate cut in the first quarter of 2025 if the numbers surprise on the downside. Therefore, we believe that lower market rate levels would again be followed by new pay flow later.”
“While the rates picture is mixed in the short term, we see FX more clearly. PLN reacted by weakening yesterday and we expect to see more today. In our view, this concludes the PLN's rally over the last 10 days and our bias turns bearish with EUR/PLN 4.290 as the first stop indicated by yesterday's fall in the rate differential.”
One might have thought that in a world of lower US interest rates and a broadly weaker dollar, the Latin currencies could have started to do a little better. But no, both USD/MXN and USD/BRL bucked the USD trend yesterday and rallied, ING’s FX strategist Chris Turner notes.
More pain for the Peso, stay bearish on the Real
We had mentioned previously that we thought USD/MXN would struggle to trade under 18.50 because of constitutional reforms being discussed in September. However, it also seems that the Peso is still very much driven by USD/JPY trends. Instead of seeing the weaker dollar, USD/MXN sees the stronger JPY – i.e. carry trade dynamics still dominate. Given we're bearish USD/JPY into September, this suggests more pain for the Peso.
For the Brazilian Real, comments from the central bank that it might not deliver on the market's pricing of rate hikes was a key driver yesterday. Additionally, we are still waiting on the government's 2025 budget plans on 31 August. Doubts remain as to whether the government is prepared to cut spending enough to stabilise the debt trajectory. And we would stay bearish on the Real unless the government surprises with some fiscal consolidation.
Why is our job as a currency analyst so exciting? The market often likes to focus on different events that it considers interesting and relevant for exchange rates. This is why otherwise boring facts such as statistical revisions, which are usually only of interest to those who are obsessed with detail and otherwise cannot draw anyone out from behind the stove, suddenly become the focus of everyone's attention and can even be market-moving. Like the revision of the US labor market data, which is on the agenda today and on everyone's lips, Commerzbank’s FX Analyst Antje Praefcke notes.
US labor data may shake the market
“Once a year, the survey-based labor market data is revised. The reference month is always March. It is foreseeable that the payrolls data since summer last year up to March 2024 slightly overstated job creation. As our experts estimate, instead of an average of 246 thousand jobs, only 190 thousand new jobs could have been created per month, i.e. a total of around 700 thousand fewer jobs extrapolated to the year in question.”
“This would be the biggest revision since 2009, i.e. since the financial crisis, which is why the market is focusing so much on it. So, if the revision shows that the labor market data had been overstated since last summer, the market could feel more confident in its assumption that the Fed will have to cut the key interest rate quickly and sharply, as the labor market has already cooled longer and more sharply than everyone had previously assumed.”
“In the event of a significant downward revision, USD losses could be expected accordingly. But, we continue to expect that the US economy will avoid a recession and will ‘only’ expand more slowly than the long-term trend over the next few quarters. Of course, if the US growth advantage turns out not to be as strong and sustainable as previously thought, there are certainly reasons why the USD should no longer benefit as much from this advantage in the medium term or should lose part of it. But massive, panicked interest rate cuts and hasty dollar sales are unjustified.”
Following the unwinding of carry trades, the Japanese Yen (JPY) has reduced this year’s losses to -2.8% ytd on Tuesday vs. -13% in early July, DBS Senior FX Strategist Philip Wee notes.
JPY stays positive
“On August 23, Japan’s parliament will hold a special session regarding the Bank of Japan’s monetary policy decisions on July 31. BOJ Governor Kazuo Ueda should stand by the plan to raise rates again if the median forecasts set out on July 31 are met or exceeded.”
“Ueda will unlikely expect the ‘Black Monday’ sell-off in early August to derail the upgrades to the BOJ’s economic and inflation forecasts announced on July 31.”
“The Nikkei 225 has recovered to around 38,000, or near the level at which it plunged to the 31,156 low on August 5. The 10Y yield differential between the US and Japanese bonds sees USD/JPY closer to 140 instead of 150.”
- USD/CHF finds a temporary cushion near 0.8520 with investors focusing on the FOMC minutes.
- Market sentiment seems quiet with FOMC minutes in focus.
- Fed Powell may not provide a preset rate cut path in his speech at the Jackson Hole Symposium.
The USD/CHF pair discovers an interim support near 0.8520 in Wednesday’s European session after a three-day losing streak. The Swiss Franc asset finds cushion as the US Dollar (USD) edges higher after posting a fresh seven-month low. The US Dollar Index (DXY), which tracks the Greenback’s value against six major currencies, rises slightly to near 101.50 from 101.31.
Market sentiment remains quiet, with investors focusing on the Federal Open Market Committee (FOMC) minutes for the July policy meeting, which will be published at 18:00 GMT. S&P 500 futures have posted any gains in the European session. 10-year US Treasury yields remain subdued near 3.81%.
Investors will look for fresh cues about how much the Federal Reserve (Fed) will cut interest rates in September and by the year-end. In the July policy meeting, the Fed left interest rates unchanged in the range of 5.25%-5.50% but opened doors for rate cuts in September.
This week, the Jackson Hole Symposium will be the crucial event for the US Dollar as Fed Chair Jerome Powell will provide fresh interest rate guidance. Fed Powell might refrain from committing a pre-defined rate-cut path but is expected to highlight that risks have now emerged in both aspects of the dual mandate (inflation and employment).
Meanwhile, the Swiss currency will be guided by market speculation for the Swiss National Bank’s (SNB) interest rate path this year amid an absence of top-tier economic events. Currently, financial markets expect that the SNB could cut interest rates again in September as price pressures continue to abate.
Swiss Franc FAQs
The Swiss Franc (CHF) is Switzerland’s official currency. It is among the top ten most traded currencies globally, reaching volumes that well exceed the size of the Swiss economy. Its value is determined by the broad market sentiment, the country’s economic health or action taken by the Swiss National Bank (SNB), among other factors. Between 2011 and 2015, the Swiss Franc was pegged to the Euro (EUR). The peg was abruptly removed, resulting in a more than 20% increase in the Franc’s value, causing a turmoil in markets. Even though the peg isn’t in force anymore, CHF fortunes tend to be highly correlated with the Euro ones due to the high dependency of the Swiss economy on the neighboring Eurozone.
The Swiss Franc (CHF) is considered a safe-haven asset, or a currency that investors tend to buy in times of market stress. This is due to the perceived status of Switzerland in the world: a stable economy, a strong export sector, big central bank reserves or a longstanding political stance towards neutrality in global conflicts make the country’s currency a good choice for investors fleeing from risks. Turbulent times are likely to strengthen CHF value against other currencies that are seen as more risky to invest in.
The Swiss National Bank (SNB) meets four times a year – once every quarter, less than other major central banks – to decide on monetary policy. The bank aims for an annual inflation rate of less than 2%. When inflation is above target or forecasted to be above target in the foreseeable future, the bank will attempt to tame price growth by raising its policy rate. Higher interest rates are generally positive for the Swiss Franc (CHF) as they lead to higher yields, making the country a more attractive place for investors. On the contrary, lower interest rates tend to weaken CHF.
Macroeconomic data releases in Switzerland are key to assessing the state of the economy and can impact the Swiss Franc’s (CHF) valuation. The Swiss economy is broadly stable, but any sudden change in economic growth, inflation, current account or the central bank’s currency reserves have the potential to trigger moves in CHF. Generally, high economic growth, low unemployment and high confidence are good for CHF. Conversely, if economic data points to weakening momentum, CHF is likely to depreciate.
As a small and open economy, Switzerland is heavily dependent on the health of the neighboring Eurozone economies. The broader European Union is Switzerland’s main economic partner and a key political ally, so macroeconomic and monetary policy stability in the Eurozone is essential for Switzerland and, thus, for the Swiss Franc (CHF). With such dependency, some models suggest that the correlation between the fortunes of the Euro (EUR) and the CHF is more than 90%, or close to perfect.
- Gold has pulled back from new all-time highs above $2,530 on Wednesday.
- Changing perceptions about the outlook for the US economy could be impacting demand.
- Positioning remains overbought, although China demand is a key bullish driver.
Gold (XAU/USD) pulls back to the $2,510s on Wednesday after touching a new all-time high of $2,531 on the previous day. The correction coincides with a slight bounce in the US Dollar (USD), to which Gold is negatively correlated.
The US Dollar Index (DXY) made a new year-to-date low of 101.31 early on Wednesday before rebounding to the 101.50s as the European session progresses.
Gold impacted by interest rate expectations, outlook for US economy
Gold’s correction and the rebound in the US Dollar could be due to changing perceptions regarding the outlook for the US economy, which in turn impact the future course of interest rates in the country, a key driver of both assets.
Traders in interest rate futures are pricing in around a 30% chance the Federal Reserve (Fed) will cut interest rates by an unusually big 0.50% in September, whilst a regular 0.25% is now fully priced in.
Although this is lower than the 50% chances last week, the likelihood of a jumbo rate cut remains relatively high. The expectation of lower interest rates is positive for Gold as it lowers the opportunity cost of holding the non-interest paying asset.
The extent to which the market is pricing in Fed rate cuts has been criticized as reflective of an overly pessimistic outlook, according to some strategists – it supposes a hard landing for the US economy which is far from assured.
“Market pricing for Fed cuts is more consistent with a recessionary scenario than it is with normalization cuts,” says Daniel Ghali, Senior Commodity Strategist TD Securities.
Data out on Wednesday could impact expectations with the publication of the US Quarterly Census of Employment and Wages (QCEW) for March. The census data is used as a benchmark to assess the Nonfarm Payrolls (NFP) report. If it differs markedly – as it has in the past – it may lead to revisions in NFPs. Although the data will only cover the period to March 2024, avoiding the July number which caused the upset in early August, a big downward revision could still revive fears that the US economy is heading for a hard landing, with upside implications for Gold.
Gold is overbought – TD Securities
Gold futures and options market positioning data shows the market is extremely overbought, which may limit the precious metal’s upside potential, according to Ghali.
“With macro fund positioning in Gold already consistent with 370 bps of cuts, forward returns will be weighed down by frothy positioning. Macro fund positioning has scarcely been higher than it is today, whereas in this scenario, Shanghai trader positioning has also reverted towards record highs, and CTAs are also holding onto their 'max long',” adds the strategists.
On the other side of the trade, China demand remains strong, according to Jim Wyckoff of Kitco News, who cites a note from broker SP Angel that continues highlighting robust demand from the Chinese market.
“Broker SP Angel said this morning in an email dispatch: ‘Chinese exporters and traders have been seen rushing to buy Yuan and probably Gold in anticipation of further US Dollar weakness. The metal has also been buoyed by Chinese buying after China’s central bank cracked down on local government bond buying. Troubles in the Chinese property sector have caused Gold to become a preferred instrument for individual savings in China,’” said Wyckoff.
Gold may also continue seeing inflows as a safe-haven with the news that US Secretary of State Antony Blinken has returned home without successfully brokering a Middle East peace deal. An Iranian all-out attack against Israel also remains a background risk factor.
Technical Analysis: Gold stalls in uptrend
Gold (XAU/USD) pulls back after extending to new all-time highs. That said, it is in a short-term uptrend and given “the trend is your friend” is likely to continue rising eventually.
On August 16, Gold decisively broke out of a range it had been stuck in since July. The breakout generated an upside target at roughly $2,550, calculated using the usual method of taking the 0.618 Fibonacci ratio of the range’s height and extrapolating it higher. The target is a minimum expectation based on technical analysis.
XAU/USD 4-hour Chart
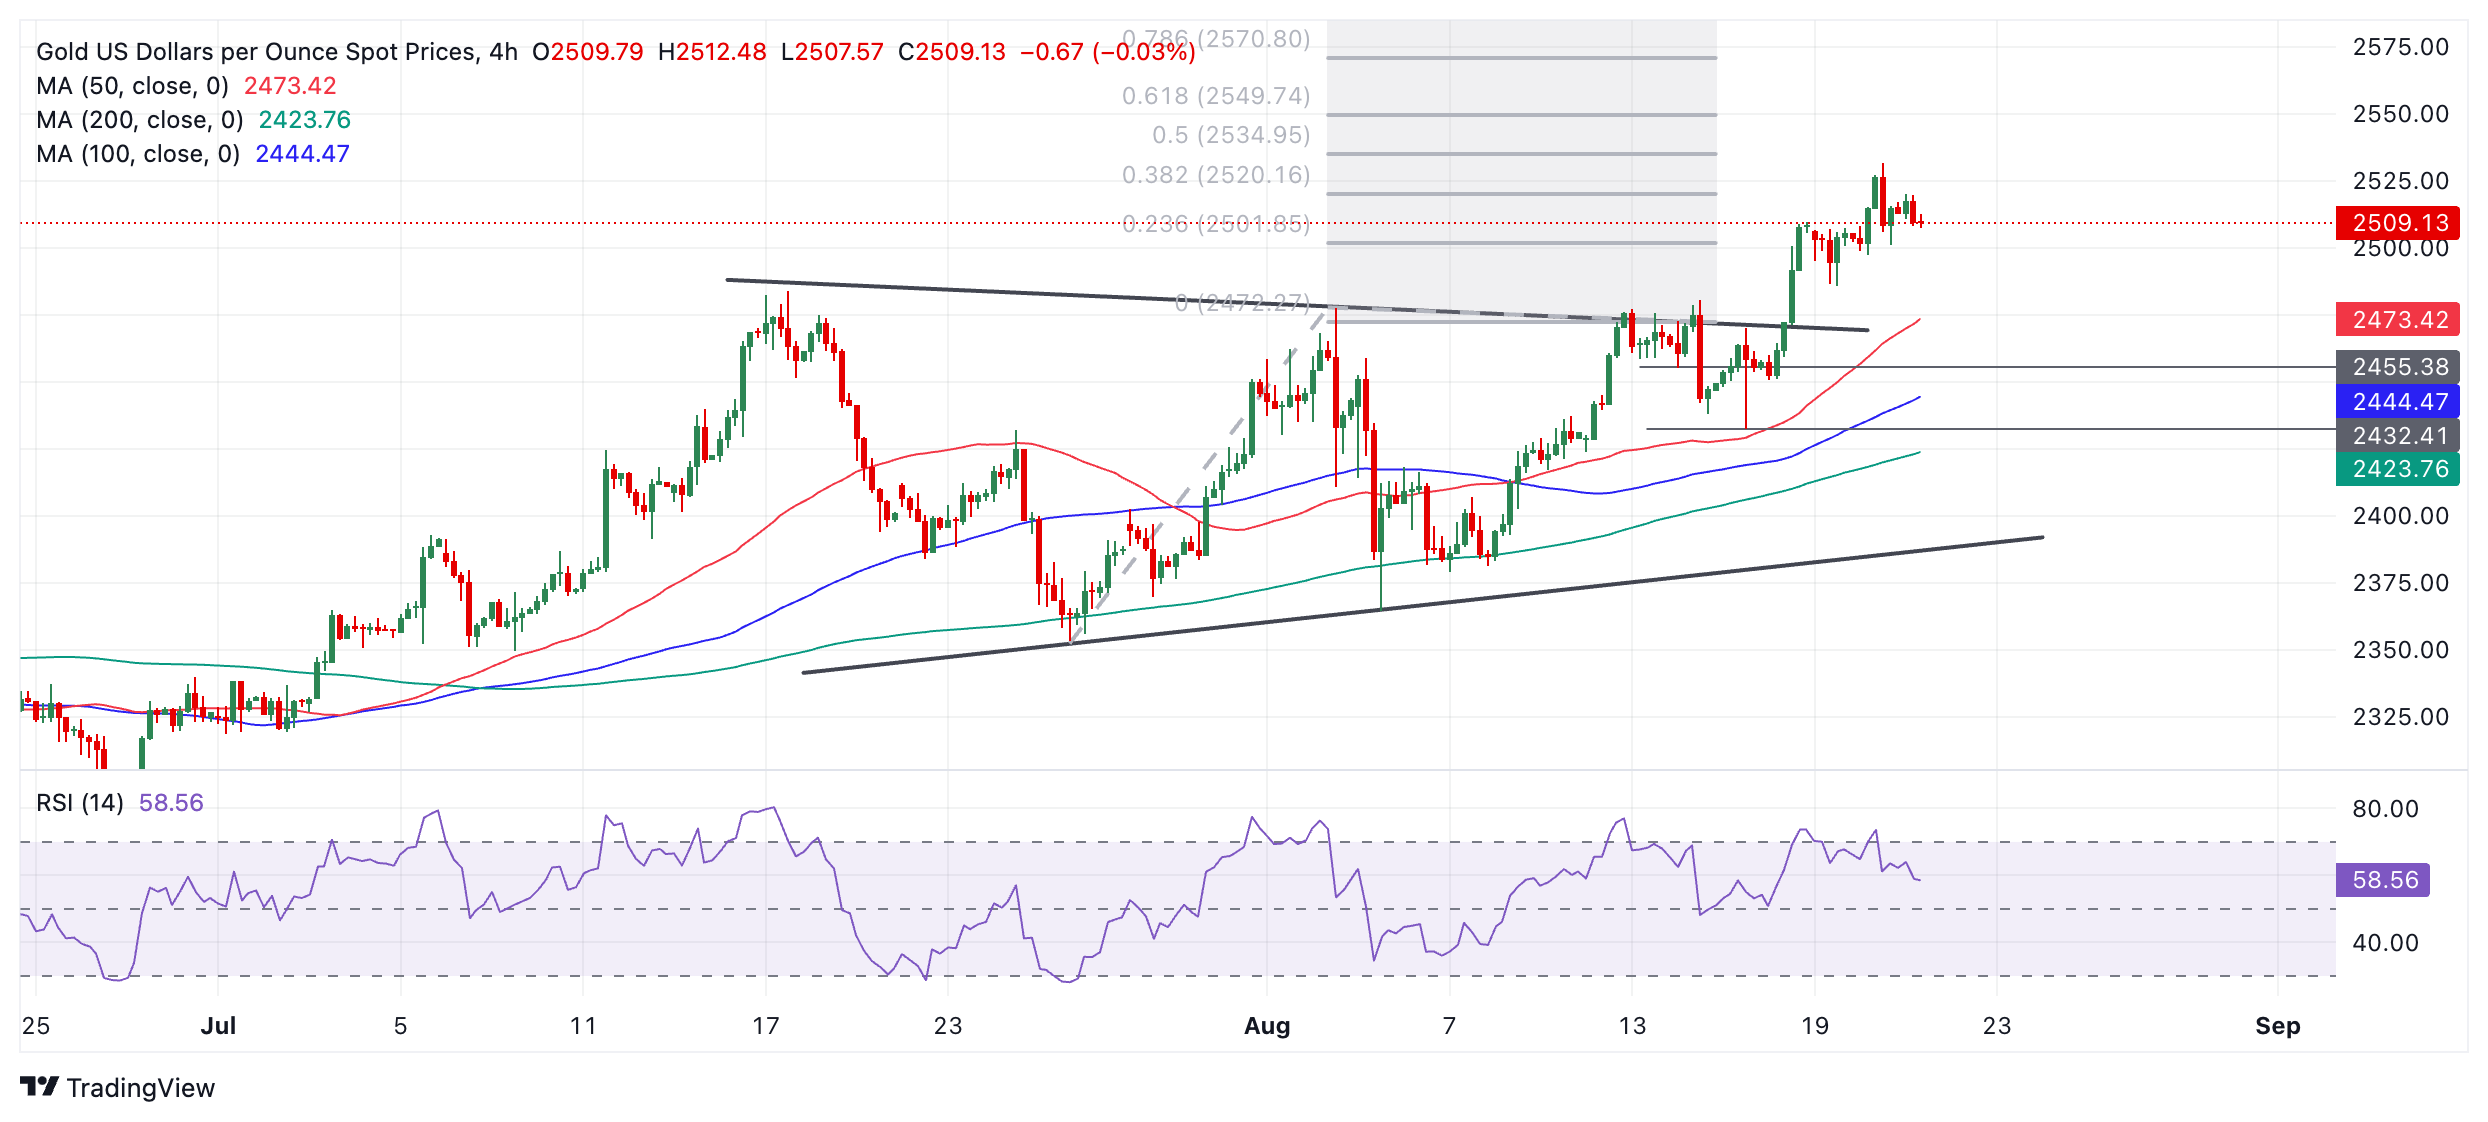
The Relative Strength Index (RSI) has just exited overbought territory, providing a sell signal as Gold is pulling back. This corroborates the correction but does not give any clues as to how far it will extend. It is possible it could find support at $2,500. A deeper correction could fall all the way to the top of the range at circa $2,475.
Gold is in a broad uptrend on a medium and long-term time frames, however, which further supports an overall bullish outlook for the precious metal.
Gold FAQs
Gold has played a key role in human’s history as it has been widely used as a store of value and medium of exchange. Currently, apart from its shine and usage for jewelry, the precious metal is widely seen as a safe-haven asset, meaning that it is considered a good investment during turbulent times. Gold is also widely seen as a hedge against inflation and against depreciating currencies as it doesn’t rely on any specific issuer or government.
Central banks are the biggest Gold holders. In their aim to support their currencies in turbulent times, central banks tend to diversify their reserves and buy Gold to improve the perceived strength of the economy and the currency. High Gold reserves can be a source of trust for a country’s solvency. Central banks added 1,136 tonnes of Gold worth around $70 billion to their reserves in 2022, according to data from the World Gold Council. This is the highest yearly purchase since records began. Central banks from emerging economies such as China, India and Turkey are quickly increasing their Gold reserves.
Gold has an inverse correlation with the US Dollar and US Treasuries, which are both major reserve and safe-haven assets. When the Dollar depreciates, Gold tends to rise, enabling investors and central banks to diversify their assets in turbulent times. Gold is also inversely correlated with risk assets. A rally in the stock market tends to weaken Gold price, while sell-offs in riskier markets tend to favor the precious metal.
The price can move due to a wide range of factors. Geopolitical instability or fears of a deep recession can quickly make Gold price escalate due to its safe-haven status. As a yield-less asset, Gold tends to rise with lower interest rates, while higher cost of money usually weighs down on the yellow metal. Still, most moves depend on how the US Dollar (USD) behaves as the asset is priced in dollars (XAU/USD). A strong Dollar tends to keep the price of Gold controlled, whereas a weaker Dollar is likely to push Gold prices up.
There was some supportive current account data for the eurozone. In fact, June's current account surplus was a monthly record at over EUR50bn, ING’s FX strategist Chris Turner notes.
EUR/USD may as well move sharply higher
“Eurozone balance of payments data has swung very much in favour of the Euro over the last two years and the basic balance now looks the highest on record. The European Central Bank's trade-weighted Euro is now the highest on record too. Apologies for the obvious comment, but were it not for the mighty dollar, EUR/USD would now be a lot higher.”
“EUR/USD is now running into some serious medium-term resistance in the 1.1110/1140 area. Maybe this proves the top of the range before elections in November. All we are saying is that if resistance breaks, very low realised volatility levels warn that EUR/USD could move sharply higher.”
“And we are reluctant to fight this EUR/USD bull trend ahead of a slowing US economy and the first Fed cut in September.”
The US will be revising last year’s non-farm payrolls data. Markets have a heightened interest in the labor market, and these revisions are likely to be negative. However, this does not change anything about the economy. Making payrolls marginally less inaccurate is about spin, not substance. Consumers have been spending this year based on the labor market they experience, not the labour market that was reported, UBS macro analyst Paul Donovan notes.
Buoyant tax revenues suggest better economic growth
“The Federal Reserve minutes are due—with investors presuming that the period of policy error is about to end in September, with a rate cut. The Fed is late in cutting rates, but the relative stability of real borrowing rates means it is not a catastrophic error. The revisions to labor market data do emphasize the risks around Fed Chair Powell’s ‘data dependency’ approach.”
“Early August export data from South Korea showed ongoing strength in semiconductor exports. However, this is probably more about the hype around artificial intelligence than any strong signal about global consumer demand for goods.”
“UK fiscal data showed strength in tax revenues (which the government was quick to spend). Tax revenue data matters because as structural change accelerates, traditional economic statistics may miss economic activity. Tax collectors rarely miss anything, so buoyant tax revenues suggest better economic growth.”
The Euro (EUR) joined the Pound Sterling (GBP) in reversing this year’s losses on Monday, DBS Senior FX Strategist Philip Wee notes.
EUR back to best closing level since July 2023
“EUR/USD appreciated a third session by 0.4% to 1.1130, its best closing level since July 2023. GBP remained the best-performing component this year, appreciating 2.4% ytd vs. the 0.8% ytd gain in the EUR. The CHF has significantly narrowed this year’s losses to -1.4% ytd from -8.5% at the end of April.”
“Although the European Central Bank, Bank of England, and Swiss National Bank lowered rates before the Fed, they did not provide a trajectory on their easing intentions. In its June Summary of Economic Projections, the Fed projected 100 bps of rate cuts in 2025, followed by another 100 bps reduction in 2026.”
“We reckon the CAD, the least volatile DXY unit, will not be left behind if the weakest components (JPY and CHF) continue to recover more of this year’s losses.”
Silver prices (XAG/USD) rose on Wednesday, according to FXStreet data. Silver trades at $29.53 per troy ounce, up 0.32% from the $29.44 it cost on Tuesday.
Silver prices have increased by 24.11% since the beginning of the year.
| Unit measure | Silver Price Today in USD |
|---|---|
| Troy Ounce | 29.53 |
| 1 Gram | 0.95 |
The Gold/Silver ratio, which shows the number of ounces of Silver needed to equal the value of one ounce of Gold, stood at 84.88 on Wednesday, down from 85.40 on Tuesday.
Silver FAQs
Silver is a precious metal highly traded among investors. It has been historically used as a store of value and a medium of exchange. Although less popular than Gold, traders may turn to Silver to diversify their investment portfolio, for its intrinsic value or as a potential hedge during high-inflation periods. Investors can buy physical Silver, in coins or in bars, or trade it through vehicles such as Exchange Traded Funds, which track its price on international markets.
Silver prices can move due to a wide range of factors. Geopolitical instability or fears of a deep recession can make Silver price escalate due to its safe-haven status, although to a lesser extent than Gold's. As a yieldless asset, Silver tends to rise with lower interest rates. Its moves also depend on how the US Dollar (USD) behaves as the asset is priced in dollars (XAG/USD). A strong Dollar tends to keep the price of Silver at bay, whereas a weaker Dollar is likely to propel prices up. Other factors such as investment demand, mining supply – Silver is much more abundant than Gold – and recycling rates can also affect prices.
Silver is widely used in industry, particularly in sectors such as electronics or solar energy, as it has one of the highest electric conductivity of all metals – more than Copper and Gold. A surge in demand can increase prices, while a decline tends to lower them. Dynamics in the US, Chinese and Indian economies can also contribute to price swings: for the US and particularly China, their big industrial sectors use Silver in various processes; in India, consumers’ demand for the precious metal for jewellery also plays a key role in setting prices.
Silver prices tend to follow Gold's moves. When Gold prices rise, Silver typically follows suit, as their status as safe-haven assets is similar. The Gold/Silver ratio, which shows the number of ounces of Silver needed to equal the value of one ounce of Gold, may help to determine the relative valuation between both metals. Some investors may consider a high ratio as an indicator that Silver is undervalued, or Gold is overvalued. On the contrary, a low ratio might suggest that Gold is undervalued relative to Silver.
(An automation tool was used in creating this post.)
- The downside of the EUR/CAD cross would be retrained due to the dovish mood surrounding the BoC.
- Canada's Consumer Price Index eased to 2.5% YoY in July, which has marked the slowest increase since March 2021.
- ECB officials adopt caution about committing to a rate-cut path amid inflation concerns.
EUR/CAD halts its gains, trading around 1.5130 during the European session on Wednesday. The Canadian Dollar (CAD) strengthens against its peers despite soft inflation data that supports a dovish stance from the Bank of Canada (BoC). Furthermore, the commodity-linked CAD managed to hold its ground, even as crude Oil prices declined. Given the fact that Canada is the largest Oil exporter to the United States (US).
Canada's Consumer Price Index (CPI) eased to 2.5% year-on-year in July, down from 2.7% in the previous month, aligning with market expectations. This marks the slowest increase in consumer prices since March 2021. Additionally, the closely watched BoC Consumer Price Index Core fell to 1.7% YoY, from the previous 1.9% reading, reinforcing dovish expectations for the Bank of Canada.
West Texas Intermediate (WTI) Oil price extends its losing streak for the fourth successive session, trading around $73.00 per barrel at the time of writing, amid hopes for a ceasefire in the Middle East. US Secretary of State Antony Blinken concluded a trip to the region aimed at facilitating a ceasefire in Gaza. Blinken, along with mediators from Egypt and Qatar, has raised hopes for a US "bridging proposal" that could narrow the gaps between the conflicting parties in the 10-month-old war, per Reuters.
The EUR/CAD cross received support as traders expect the European Central Bank (ECB) to gradually lower interest rates. However, ECB officials have been cautious about committing to a specific rate-cut schedule, given concerns that inflationary pressures might pick up again.
Traders are likely to observe Purchasing Managers Index (PMI) data from the Eurozone and Germany scheduled for release on Thursday. HCOB Composite PMI for the Eurozone is expected to report a 50.1 reading, falling short of the previous reading of 50.2 reading.
Euro FAQs
The Euro is the currency for the 20 European Union countries that belong to the Eurozone. It is the second most heavily traded currency in the world behind the US Dollar. In 2022, it accounted for 31% of all foreign exchange transactions, with an average daily turnover of over $2.2 trillion a day. EUR/USD is the most heavily traded currency pair in the world, accounting for an estimated 30% off all transactions, followed by EUR/JPY (4%), EUR/GBP (3%) and EUR/AUD (2%).
The European Central Bank (ECB) in Frankfurt, Germany, is the reserve bank for the Eurozone. The ECB sets interest rates and manages monetary policy. The ECB’s primary mandate is to maintain price stability, which means either controlling inflation or stimulating growth. Its primary tool is the raising or lowering of interest rates. Relatively high interest rates – or the expectation of higher rates – will usually benefit the Euro and vice versa. The ECB Governing Council makes monetary policy decisions at meetings held eight times a year. Decisions are made by heads of the Eurozone national banks and six permanent members, including the President of the ECB, Christine Lagarde.
Eurozone inflation data, measured by the Harmonized Index of Consumer Prices (HICP), is an important econometric for the Euro. If inflation rises more than expected, especially if above the ECB’s 2% target, it obliges the ECB to raise interest rates to bring it back under control. Relatively high interest rates compared to its counterparts will usually benefit the Euro, as it makes the region more attractive as a place for global investors to park their money.
Data releases gauge the health of the economy and can impact on the Euro. Indicators such as GDP, Manufacturing and Services PMIs, employment, and consumer sentiment surveys can all influence the direction of the single currency. A strong economy is good for the Euro. Not only does it attract more foreign investment but it may encourage the ECB to put up interest rates, which will directly strengthen the Euro. Otherwise, if economic data is weak, the Euro is likely to fall. Economic data for the four largest economies in the euro area (Germany, France, Italy and Spain) are especially significant, as they account for 75% of the Eurozone’s economy.
Another significant data release for the Euro is the Trade Balance. This indicator measures the difference between what a country earns from its exports and what it spends on imports over a given period. If a country produces highly sought after exports then its currency will gain in value purely from the extra demand created from foreign buyers seeking to purchase these goods. Therefore, a positive net Trade Balance strengthens a currency and vice versa for a negative balance.
- EUR/USD exhibits strength near 1.1130 ahead of the FOMC minutes of its monetary policy meeting in July.
- The Fed kept interest rates steady for the eighth time in a row in July, but Jerome Powell acknowledged discussions over cuts.
- The ECB is expected to resume its policy-easing cycle in September.
EUR/USD hovers near 1.1130 in Wednesday’s European session, the highest level seen this year. The major currency pair aims to revisit 2024 highs of 1.1140 as the US Dollar (USD) remains under pressure amid growing optimism over Federal Reserve (Fed) interest rate cuts in September.
The US Dollar Index (DXY), which tracks the Greenback’s value against six major currencies, hovers near a fresh seven-month low at around 101.30.
Consistently easing United States (US) inflationary pressures and cooling labor market conditions have convinced investors that the Fed will reduce interest rates in September. However, traders remain split on whether this first interest rate reduction will be a jumbo or a gradual one. The CME FedWatch tool shows that the likelihood of a 50-basis-point (bps) interest-rate cut is at 30.5%. The rest expects a more nuanced 25-basis-point cut.
In Wednesday’s session, investors will focus on the Federal Open Market Committee (FOMC) minutes for the July policy meeting, which will be published at 18:00 GMT. In the July meeting, the Fed left its key borrowing rates unchanged in the range of 5.25%-5.50% for the eighth straight time. The Fed acknowledged that the scope of risks has widened to both aspects of dual mandate (inflation and employment).
This week, the Fed Chair Jerome Powell’s speech on Friday at the Jackson Hole (JH) Symposium – which will be held from Thursday to Saturday – will be the major event as it will provide fresh cues about rate cuts in September. In the press conference after July’s monetary policy announcement, Jerome Powell said: "If we were to see inflation moving down more or less in line with expectations, growth remains reasonably strong, and the labor market remains consistent with current conditions, then I think a rate cut could be on the table at the September meeting.”
Daily digest market movers: EUR/USD clings to gains above 1.1100 amid weak US Dollar
- EUR/USD stabilizes above the round-level support of 1.1100 as investors have underpinned the Euro (EUR) against the US Dollar. The Euro performs strongly against its major peers amid expectations that the European Central Bank (ECB) will not cut its key borrowing rates aggressively.
- ECB policymakers refrained from committing to a preset course for interest rate reduction as they see inflation in the Eurozone hovering near its current levels, still above target, for the entire year. However, market participants expect that the ECB will cut interest rates again in September, with investors betting on an uncertain economic outlook as Germany, the Eurozone’s largest economy, is going through a rough phase.
- Meanwhile, slower growth in Q2 Negotiated Wage growth in Germany has provided relief to ECB officials, further bolstering optimism over rate cuts in September. The data, released by the Bundesbank – Germany's central bank – on Tuesday, showed that Negotiated Wages rose by 3.1%, half the pace seen in the first quarter of this year.
- Going forward, investors will keenly focus on preliminary Eurozone HCOB Purchasing Managers’ Index (PMI) data for August and Q2 Negotiated Wage Rates, which will be published on Thursday. The Composite PMI is estimated to have barely improved amid a consistent decline in activities in the manufacturing sector. As for the Negotiated Wage Rate, a key measure of wage growth, it rose by 4.69% in the first quarter of this year and ECB officials would be pleased with a lower reading for the second quarter.
Technical Analysis: EUR/USD aims to recapture year-to-date high of 1.1140
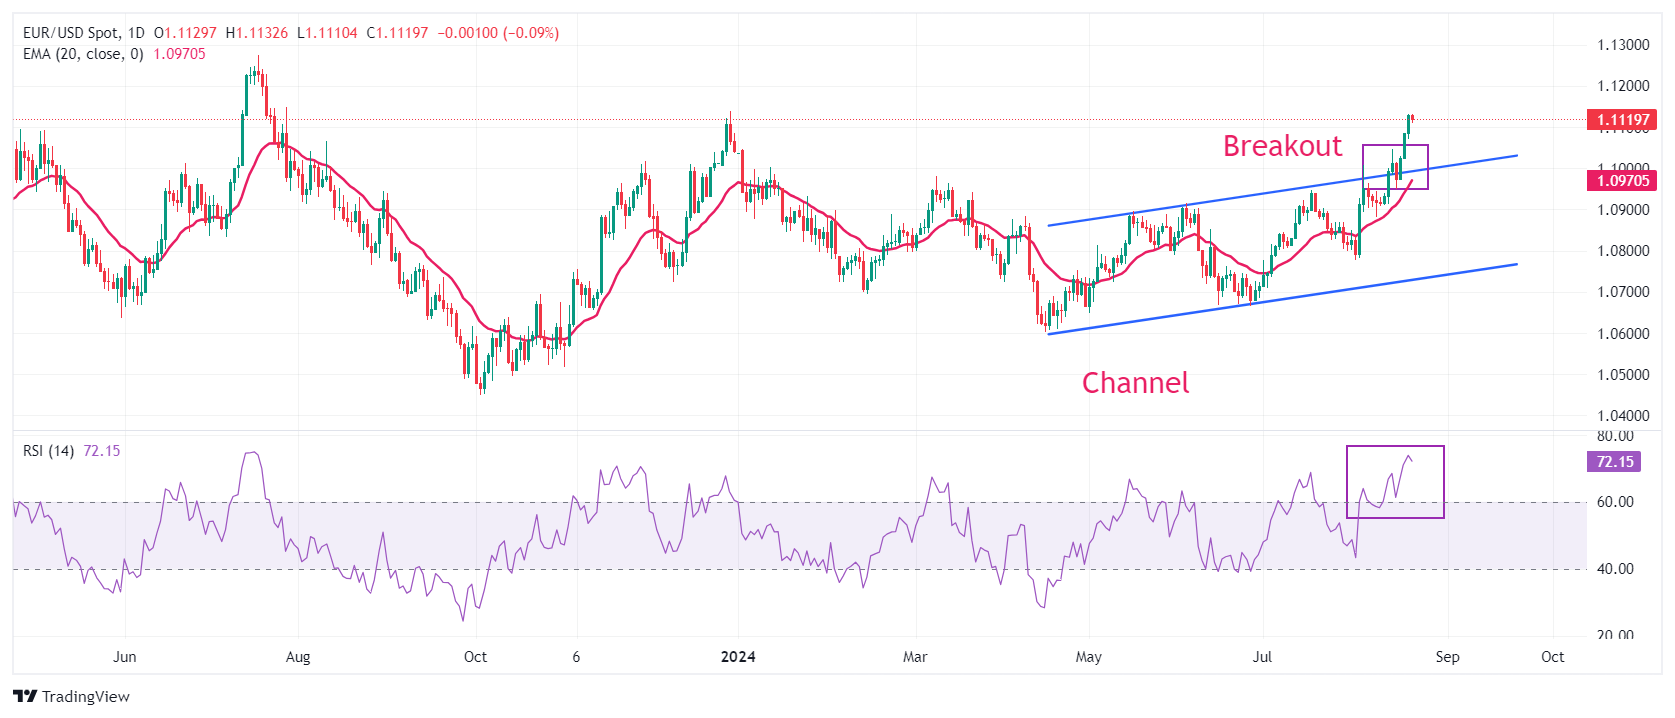
EUR/USD approaches a year-to-date high of 1.1140 ahead of the release of the FOMC minutes. The major currency pair strengthened after a breakout of a channel formation on the daily time frame. Upward-sloping 20-day and 50-day Exponential Moving Averages (EMAs) near 1.0970 and 1.0900, respectively, suggest that the broad trend is bullish.
The 14-day Relative Strength Index (RSI) oscillates in the bullish range of 60.00-80.00, suggesting a strong upside momentum.
Euro bulls would approach the round-level resistance of 1.1200 after breaking above the December 28, 2023, high at 1.1140 decisively. On the downside, the August 15 low at 1.0950 will be a key support area.
Euro FAQs
The Euro is the currency for the 20 European Union countries that belong to the Eurozone. It is the second most heavily traded currency in the world behind the US Dollar. In 2022, it accounted for 31% of all foreign exchange transactions, with an average daily turnover of over $2.2 trillion a day. EUR/USD is the most heavily traded currency pair in the world, accounting for an estimated 30% off all transactions, followed by EUR/JPY (4%), EUR/GBP (3%) and EUR/AUD (2%).
The European Central Bank (ECB) in Frankfurt, Germany, is the reserve bank for the Eurozone. The ECB sets interest rates and manages monetary policy. The ECB’s primary mandate is to maintain price stability, which means either controlling inflation or stimulating growth. Its primary tool is the raising or lowering of interest rates. Relatively high interest rates – or the expectation of higher rates – will usually benefit the Euro and vice versa. The ECB Governing Council makes monetary policy decisions at meetings held eight times a year. Decisions are made by heads of the Eurozone national banks and six permanent members, including the President of the ECB, Christine Lagarde.
Eurozone inflation data, measured by the Harmonized Index of Consumer Prices (HICP), is an important econometric for the Euro. If inflation rises more than expected, especially if above the ECB’s 2% target, it obliges the ECB to raise interest rates to bring it back under control. Relatively high interest rates compared to its counterparts will usually benefit the Euro, as it makes the region more attractive as a place for global investors to park their money.
Data releases gauge the health of the economy and can impact on the Euro. Indicators such as GDP, Manufacturing and Services PMIs, employment, and consumer sentiment surveys can all influence the direction of the single currency. A strong economy is good for the Euro. Not only does it attract more foreign investment but it may encourage the ECB to put up interest rates, which will directly strengthen the Euro. Otherwise, if economic data is weak, the Euro is likely to fall. Economic data for the four largest economies in the euro area (Germany, France, Italy and Spain) are especially significant, as they account for 75% of the Eurozone’s economy.
Another significant data release for the Euro is the Trade Balance. This indicator measures the difference between what a country earns from its exports and what it spends on imports over a given period. If a country produces highly sought after exports then its currency will gain in value purely from the extra demand created from foreign buyers seeking to purchase these goods. Therefore, a positive net Trade Balance strengthens a currency and vice versa for a negative balance.
Tuesday saw another day of US Dollar (USD) selling. Short-dated US rates came off – perhaps as speculation grew over today's release of benchmark revisions to US jobs data, ING’s FX strategist Chris Turned notes.
DXY might just fall to the 101.00 level
“The Bureau of Labour Statistics will today release revisions, using more accurate tax records, for employment growth in the year to March 2024. Some estimate that it could result in job gains during that period being cut by anywhere between 500,000 and 1,000,000. If so, the Federal Reserve might have seen the jobs market as overly tight during that period and perhaps might now be underestimating the amount of slack that is about to emerge as the economy cools. This data is released at 1600CET and presents a downside risk to the USD.”
“Later in the day, the Fed releases the minutes of the FOMC meeting on 31 July. Recall this was the meeting when the Fed shifted its focus to its dual mandate. Perhaps we can expect to hear a discussion in the minutes of how the Fed was increasingly comfortable on the inflation side and a little uncomfortable on the employment side.”
“The DXY sell-off is starting to pick up a little momentum as traders look to jump on possibly an important new market trend. Let's see how it performs around the 101.00 level.”
- AUD/USD attracts some sellers following an intraday uptick to over a one-month peak.
- A softer risk tone drives some haven flows towards the USD and exerts some pressure.
- Traders look to FOMC minutes for a fresh impetus ahead of Powell’s speech on Friday.
The AUD/USD pair retreats after touching over a one-month high, around the 0.6750-0.6755 region earlier this Wednesday and remains depressed through the first half of the European session. Spot prices currently trade around the 0.6730-0.6735 region, down 0.15% for the day, and for now, seem to have snapped a three-day winning amid a modest US Dollar (USD) strength.
The USD Index (DXY), which tracks the Greenback against a basket of currencies, recovers from its lowest level since January amid some repositioning trade ahead of the July FOMC meeting minutes, due for release later during the US session. Apart from this, a slight deterioration in the global risk sentiment turns out to be another factor benefiting the safe-haven buck and driving flows away from the perceived riskier Australian Dollar (AUD).
The downside for the AUD/USD pair, meanwhile, seems limited amid the Reserve Bank of Australia's (RBA) hawkish stance. In fact, the central bank had signaled that it would not hesitate to hike rates in the face of more upside risks to inflation. This, along with increasing chatters regarding big economic stimulus measures from China's government, could act as a tailwind for the China-proxy Aussie and lend some support to the currency pair.
Furthermore, growing acceptance that the Federal Reserve (Fed) will start its policy easing cycle and announce a 25 basis points (bps) rate cut in September should cap gains for the USD. Traders might also prefer to wait for Fed Chair Jerome Powell's speech at the Jackson Hole Symposium on Friday for cues about the central bank's policy path. This, in turn, warrants some caution before confirming that the AUD/USD pair has topped out in the near term.
Even from a technical perspective, last week's breakout through the 0.6600 confluence hurdle – comprising the very important 200-day and the 100-day Simple Moving Averages (SMA) – favors bullish traders. Hence, any subsequent corrective decline could still be seen as a buying opportunity and is more likely to be limited.
US Dollar PRICE Today
The table below shows the percentage change of US Dollar (USD) against listed major currencies today. US Dollar was the strongest against the Japanese Yen.
| USD | EUR | GBP | JPY | CAD | AUD | NZD | CHF | |
|---|---|---|---|---|---|---|---|---|
| USD | 0.07% | 0.11% | 0.45% | -0.10% | 0.11% | 0.26% | 0.08% | |
| EUR | -0.07% | 0.02% | 0.37% | -0.17% | 0.08% | 0.16% | 0.00% | |
| GBP | -0.11% | -0.02% | 0.36% | -0.18% | 0.00% | 0.14% | -0.01% | |
| JPY | -0.45% | -0.37% | -0.36% | -0.55% | -0.32% | -0.25% | -0.36% | |
| CAD | 0.10% | 0.17% | 0.18% | 0.55% | 0.22% | 0.31% | 0.17% | |
| AUD | -0.11% | -0.08% | -0.01% | 0.32% | -0.22% | 0.09% | -0.04% | |
| NZD | -0.26% | -0.16% | -0.14% | 0.25% | -0.31% | -0.09% | -0.13% | |
| CHF | -0.08% | -0.00% | 0.00% | 0.36% | -0.17% | 0.04% | 0.13% |
The heat map shows percentage changes of major currencies against each other. The base currency is picked from the left column, while the quote currency is picked from the top row. For example, if you pick the US Dollar from the left column and move along the horizontal line to the Japanese Yen, the percentage change displayed in the box will represent USD (base)/JPY (quote).
The Dollar Index (DXY) is within striking distance of returning this year’s gains, DBS Senior FX Strategist Philip Wee notes.
Weak USD bias ahead of Jackson Hole
“In depreciating a third session by 0.4% to 101.44, the DXY is converging to 101.33 or level at the end of 2023. The DXY’s decline is consistent with the US Treasury 10Y yield dropping farther below 3.88% or 2023’s closing level. The 10Y yield eased for the third session by 6.5 bps to 3.807% overnight.”
“The Greenback has been under pressure from the Fed flagging a rate cut at the FOMC meeting this September. At its Jackson Hole Symposium on August 22-24, the Fed will likely push back recession fears in favour of a soft landing in the US economy.”
“We view the rate reduction as removing top-level restriction to support the Fed’s full employment mandate now that the inflation has fallen significantly from its peak and below the Fed Funds Rate. The shift towards generalised USD weakness was also evident in the appreciation of the AUD and GBP amid more unwinding of yen carry positions reported by the CFTC.”
- Silver price moves sideways as traders adopt a cautious stance before FOMC Minutes for July’s policy decision.
- The downside of the non-yielding Silver could be restrained as the Fed could reduce rates by 100 basis points in 2024.
- The safe-haven Silver may face challenges as the US "bridging proposal" could narrow the gaps between Israel and Hamas.
Silver price (XAG/USD) price consolidates around $29.50 per troy ounce during the European hours as traders assess the upcoming release of the FOMC Minutes on Wednesday. The Fed's Meeting Minutes for July’s policy decision could provide crucial insights into the Federal Reserve's (Fed) monetary policy direction. Furthermore, traders would likely shift their focus on the Fed Chair Jerome Powell's upcoming speech at Jackson Hole on Friday.
The downside risk for non-yielding Silver is expected to be limited, as the Federal Reserve is anticipated to deliver 100 basis points (bps) in rate cuts by the end of this year. However, there is division among market analysts on whether the Fed will implement a 25 or 50 bps cut at its September meeting.
CME FedWatch Tool suggests that the markets are now pricing in a nearly 67.5% odds of a 25 basis points (bps) Fed rate cut in its September meeting, down from 76% a day ago. The probability of a 50 basis points rate cut fell to 32.5% from 53.0% a week earlier.
Federal Reserve (Fed) Governor Michelle Bowman expressed caution on Tuesday about making any policy changes, citing ongoing upside risks to inflation. Bowman warned that overreacting to individual data points could undermine the progress already achieved, according to Reuters.
The safe-haven appeal of Silver is expected to decrease as tensions in the Middle East ease. US Secretary of State Antony Blinken concluded a trip to the region aimed at facilitating a ceasefire in Gaza. According to Reuters, Blinken, along with mediators from Egypt and Qatar, has raised hopes for a US "bridging proposal" that could narrow the gaps between the conflicting parties in the 10-month-old war.
Silver FAQs
Silver is a precious metal highly traded among investors. It has been historically used as a store of value and a medium of exchange. Although less popular than Gold, traders may turn to Silver to diversify their investment portfolio, for its intrinsic value or as a potential hedge during high-inflation periods. Investors can buy physical Silver, in coins or in bars, or trade it through vehicles such as Exchange Traded Funds, which track its price on international markets.
Silver prices can move due to a wide range of factors. Geopolitical instability or fears of a deep recession can make Silver price escalate due to its safe-haven status, although to a lesser extent than Gold's. As a yieldless asset, Silver tends to rise with lower interest rates. Its moves also depend on how the US Dollar (USD) behaves as the asset is priced in dollars (XAG/USD). A strong Dollar tends to keep the price of Silver at bay, whereas a weaker Dollar is likely to propel prices up. Other factors such as investment demand, mining supply – Silver is much more abundant than Gold – and recycling rates can also affect prices.
Silver is widely used in industry, particularly in sectors such as electronics or solar energy, as it has one of the highest electric conductivity of all metals – more than Copper and Gold. A surge in demand can increase prices, while a decline tends to lower them. Dynamics in the US, Chinese and Indian economies can also contribute to price swings: for the US and particularly China, their big industrial sectors use Silver in various processes; in India, consumers’ demand for the precious metal for jewellery also plays a key role in setting prices.
Silver prices tend to follow Gold's moves. When Gold prices rise, Silver typically follows suit, as their status as safe-haven assets is similar. The Gold/Silver ratio, which shows the number of ounces of Silver needed to equal the value of one ounce of Gold, may help to determine the relative valuation between both metals. Some investors may consider a high ratio as an indicator that Silver is undervalued, or Gold is overvalued. On the contrary, a low ratio might suggest that Gold is undervalued relative to Silver.
- NZD/USD struggles to capitalize on its modest intraday gains to over a two-month high.
- A softer risk tone pushes the USD away from a multi-month low and exerts pressure.
- Dovish Fed expectations might cap the USD recovery and help limit losses for the major.
The NZD/USD pair attracts some sellers following an intraday move up to the 0.6160-0.6165 region, or over a two-month peak and extends its steady descent through the early European session on Wednesday. Spot prices drop to a fresh daily low, around the 0.6130 area in the last hour and for now, seem to have snapped a three-day winning streak amid a modest US Dollar (USD) uptick.
A slight deterioration in the global risk sentiment – as depicted by a weaker tone around the equity markets – is seen benefiting the safe-haven Greenback and driving flows away from the perceived riskier Kiwi. Apart from this, the intraday USD recovery from its lowest level since January could further be attributed to some short-covering ahead of the July FOMC meeting minutes, due for release later today. This, along with Federal Reserve (Fed) Chair Jerome Powell's speech at the Jackson Hole Symposium, will play a key role in determining the next leg of a directional move for the buck.
Ahead of the key event risks, firming expectations that the US central bank will start its rate-cutting cycle in September keep the US Treasury bond depressed and might hold back the USD bulls from placing aggressive bets. Furthermore, hopes for additional economic stimulus from China's government might continue to lend support to antipodean currencies, including the New Zealand Dollar (NZD). This makes it prudent to wait for strong follow-through selling before confirming that the NZD/USD pair has already topped out in the near term and positioning for any meaningful corrective decline.
Even from a technical perspective, this week's sustained breakout through the very important 200-day Simple Moving Average (SMA) and the subsequent move up favors bullish traders. This, in turn, suggests that any further slide could be seen as a buying opportunity and is more likely to remain cushioned.
Economic Indicator
FOMC Minutes
FOMC stands for The Federal Open Market Committee that organizes 8 meetings in a year and reviews economic and financial conditions, determines the appropriate stance of monetary policy and assesses the risks to its long-run goals of price stability and sustainable economic growth. FOMC Minutes are released by the Board of Governors of the Federal Reserve and are a clear guide to the future US interest rate policy.
Read more.Next release: Wed Aug 21, 2024 18:00
Frequency: Irregular
Consensus: -
Previous: -
Source: Federal Reserve
Minutes of the Federal Open Market Committee (FOMC) is usually published three weeks after the day of the policy decision. Investors look for clues regarding the policy outlook in this publication alongside the vote split. A bullish tone is likely to provide a boost to the greenback while a dovish stance is seen as USD-negative. It needs to be noted that the market reaction to FOMC Minutes could be delayed as news outlets don’t have access to the publication before the release, unlike the FOMC’s Policy Statement.
- The Mexican Peso continues depreciating on Wednesday after Tuesday’s sell-off following weak retail sales data.
- Carry trade outflows and investor concerns regarding judicial reforms are also weighing on the MXN.
- Technically, USD/MXN may be starting a new leg higher within its rising channel.
The Mexican Peso (MXN) edges lower in its most heavily-traded pairs as the European session gets underway on Wednesday. The Peso fell between 1.50% and 2.00% in its key pairs on Tuesday after the release of Retail Sales data showed shoppers curtailed their spending in June.
The weak retail sales data could suggest inflation may be set to fall further, increasing the chances of the Banco de Mexico (Banxico) cutting interest rates further – a negative for the Peso, since lower interest rates attract less foreign capital inflows.
Lower interest rates could increase speculation investors are pulling out of their long Peso carry trade positions. With interest rates falling in Mexico and the Peso starting to trend lower too – whilst the opposite happens in Japan – the carry trade, which capitalizes from the interest rate differential between the two currencies, could see more outflows from the MXN.
Mexican Peso reverses trend after news of judicial reforms
The Mexican Peso reversed its temporary recovery rally from the August 5 lows after the Mexican government announced more details about their controversial judicial reforms on Friday, according to Commerzbank. These concerns, which some investors have interpreted as market unfriendly, led to a rapid depreciation in the currency after the June elections, and may have also contributed to the Peso’s generally weak tone over recent days.
USD/MXN in particular may see volatility on Wednesday with the publication in the US of the Quarterly Census of Employment and Wages (QCEW) for March. The data is benchmarked against US Nonfarm Payrolls (NFP) for comparison. If the census data differs from the NFPs it may lead to revisions in the latter.
Although the data will only cover the period to March 2024 (avoiding the latest and weakest payrolls), a big downward revision could revive fears that the US economy is heading for a hard landing. This, in turn, could weaken the US Dollar (USD). Additionally, the Federal Reserve will release the minutes from its July policy meeting.
For more macroeconomic news from Mexico, traders will have to wait for Thursday when 1st Half-Month Inflation for August and Q2 Gross Domestic Product (GDP) data will be published by INEGI.
At the time of writing, one US Dollar (USD) buys 19.06 Mexican Pesos, EUR/MXN trades at 21.21, and GBP/MXN at 24.82.
Technical Analysis: USD/MXN could be starting new up leg
USD/MXN gained over 1.7% on Tuesday, reversing the prior evolving down leg within the pair’s broader rising channel.
The long green up day posted on Tuesday means that the bearish Shooting Star candlestick pattern of the prior day failed to gain bearish confirmation. This could indicate the short-term trend is changing and the pair may be about to begin a new up leg within the channel.
USD/MXN Daily Chart
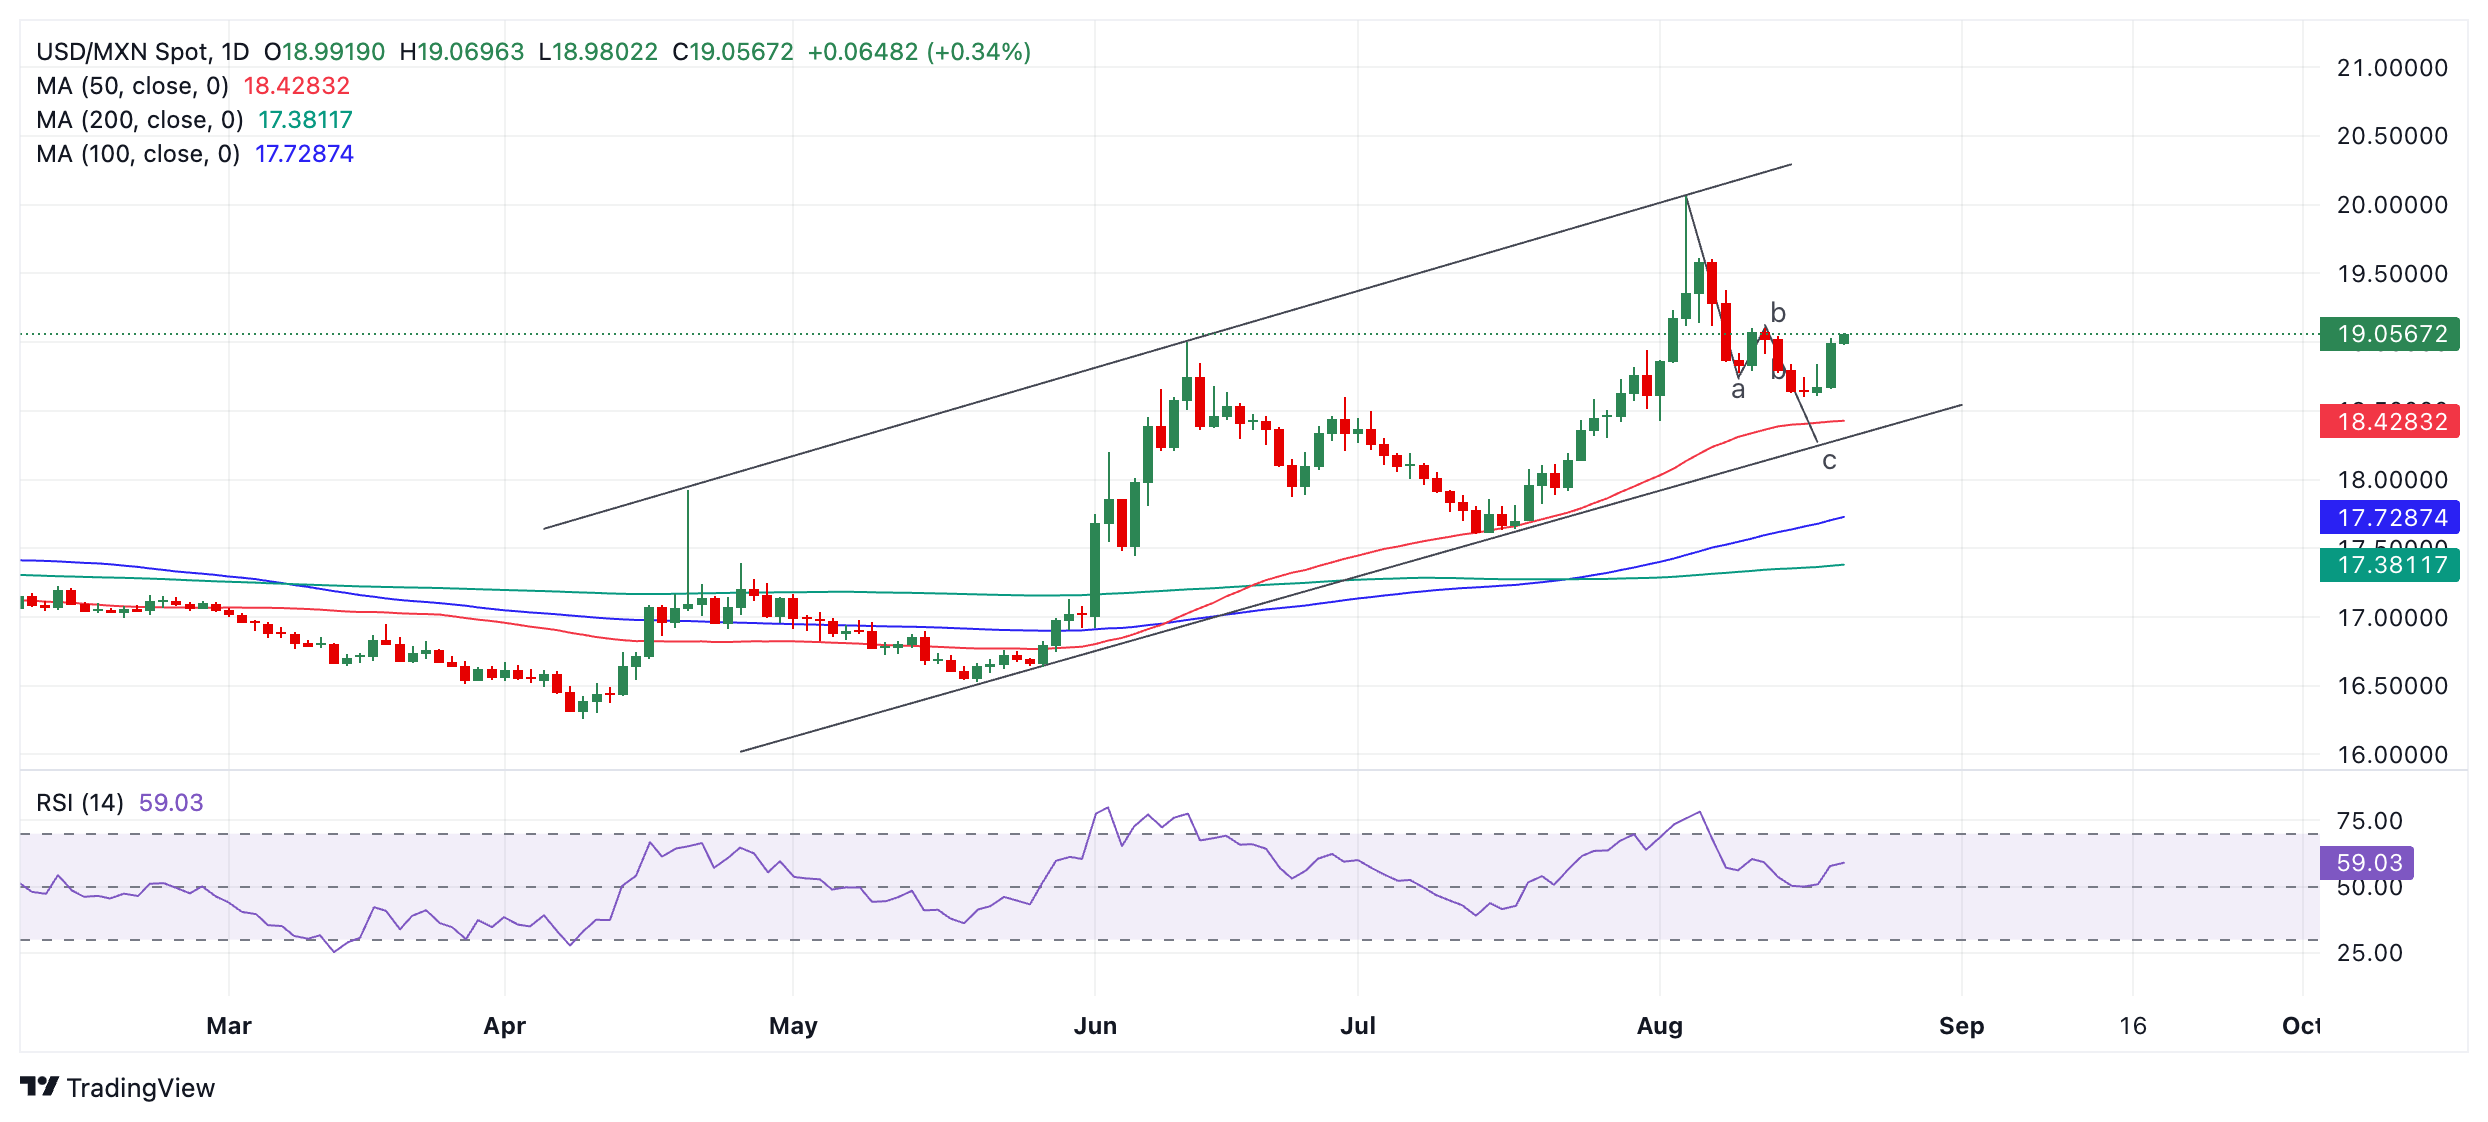
USD/MXN had been looking like it was unfolding in a bearish abc pattern within its rising channel, however, wave “c” has so far failed to extend all the way down to the lower channel line.
It is not clear what will happen next: it is possible the pair could recapitulate and start to move back down again, eventually reaching the lower channel line or at least the 50-day Simple Moving Average (SMA) lying just above at 18.43.
Alternatively wave “c” may have extended as far as it is going to go and the start of a new up leg is now unfolding. A break above the top of wave “b” at 19.10 would provide extra confirmation that a stronger up move was underway.
The overall trend on the medium and longer-term time frames is arguably up, suggesting a bullish backdrop that provides extra support to the view that a new upward move is underway.
Economic Indicator
1st half-month Inflation
The 1st half-month core inflation index released by the Bank of Mexico is a measure of price movements by the comparison between the retail prices of a representative shopping basket of goods and services. The purchase power of Mexican Peso is dragged down by inflation. The inflation index is a key indicator since it is used by the central bank to set interest rates. Generally speaking, a high reading is seen as positive (or bullish) for the Mexican Peso, while a low reading is seen as negative (or Bearish).
Read more.Next release: Thu Aug 22, 2024 12:00
Frequency: Monthly
Consensus: 0.12%
Previous: 0.71%
Source: National Institute of Statistics and Geography of Mexico
- The Pound Sterling exhibits strength against the US Dollar on Fed rate-cut optimism.
- Investors remain divided over the Fed rate-cut size in September.
- UK wage growth declines further in three-months ending July.
The Pound Sterling (GBP) clings to gains above the psychological support of 1.3000 against the US Dollar (USD) in Wednesday’s London session. The GBP/USD pair posted on Tuesday fresh year-to-date highs near 1.3050 amid sheer weakness in the US Dollar.
The US Dollar Index (DXY), which tracks the Greenback’s value against six major currencies, finds temporary support after sliding to near 101.30, the lowest level seen in more than seven months.
Market participants appear to be largely bearish on the Greenback amid firm speculation that the Federal Reserve (Fed) will start reducing interest rates in September. Investors seem to be convinced about the Fed pivoting to policy normalization next month, but are split over the size of its first interest rate cut after years of policy tightening.
For fresh cues over the interest rate path, investors await the Federal Open Market Committee (FOMC) minutes for the July meeting, which will be published at 18:00 GMT. In the monetary policy announcement, the Fed left its key borrowing rates unchanged in the range of 5.25%-5.50% but warned that the economic outlook is uncertain and that the Committee is vigilant to the risks to both sides of its dual mandate (inflation and employment).
Meanwhile, the major source for investors to get cues about the rate-cut path will the Fed Chair Jerome Powell’s speech at the Jackson Hole (JH) Symposium, which will take place from Thursday to Saturday (Powell’s speech is expected on Friday at 14:00 GMT). Fed Powell is less likely to provide a preset course but would confirm that the central bank is prepared to adjust the monetary policy stance if risks emerge that could delay the attainment of the banks’ goals.
Daily digest market movers: Pound Sterling to be guided by BoE Bailey’s speech in Jackson Hole
- The Pound Sterling exhibits a mixed performance against its major peers on Wednesday, with investors focusing on the Bank of England’s (BoE) Governor Andrew Bailey’s speech at the JH Symposium on Friday. Andrew Bailey is expected to provide cues about whether the BoE will cut interest rates again in September.
- Market expectations for BoE interest rate cuts in September have increased after July’s United Kingdom (UK) Consumer Price Index (CPI) report showed that core inflation, which excludes volatile items, decelerated at a faster-than-expected pace to 3.3% from the estimates of 3.4%. Also, UK service inflation, the most closely-watched inflation measure by BoE officials, fell sharply to 5.2% due to easing wage pressures.
- Meanwhile, human resources data provider Brightmine reported that pay awards in the three months to July came in lower at 4.5% from the prior release of 5%. "Employers that have made pay awards so far this year have already reacted to the falling inflation environment by putting in place lower pay awards than made last year," said Sheila Attwood, senior content manager at Brightmine, Reuters reported.
- On the economic data front, investors will look to the UK preliminary S&P Global Purchasing Managers’ Index (PMI) data for August, which will be published on Thursday. Economists estimate that flash Manufacturing PMI remained steady at 52.1, while activities in the service sector improved to 52.8 from the prior release of 52.5.
Technical Analysis: Pound Sterling refreshes annual high
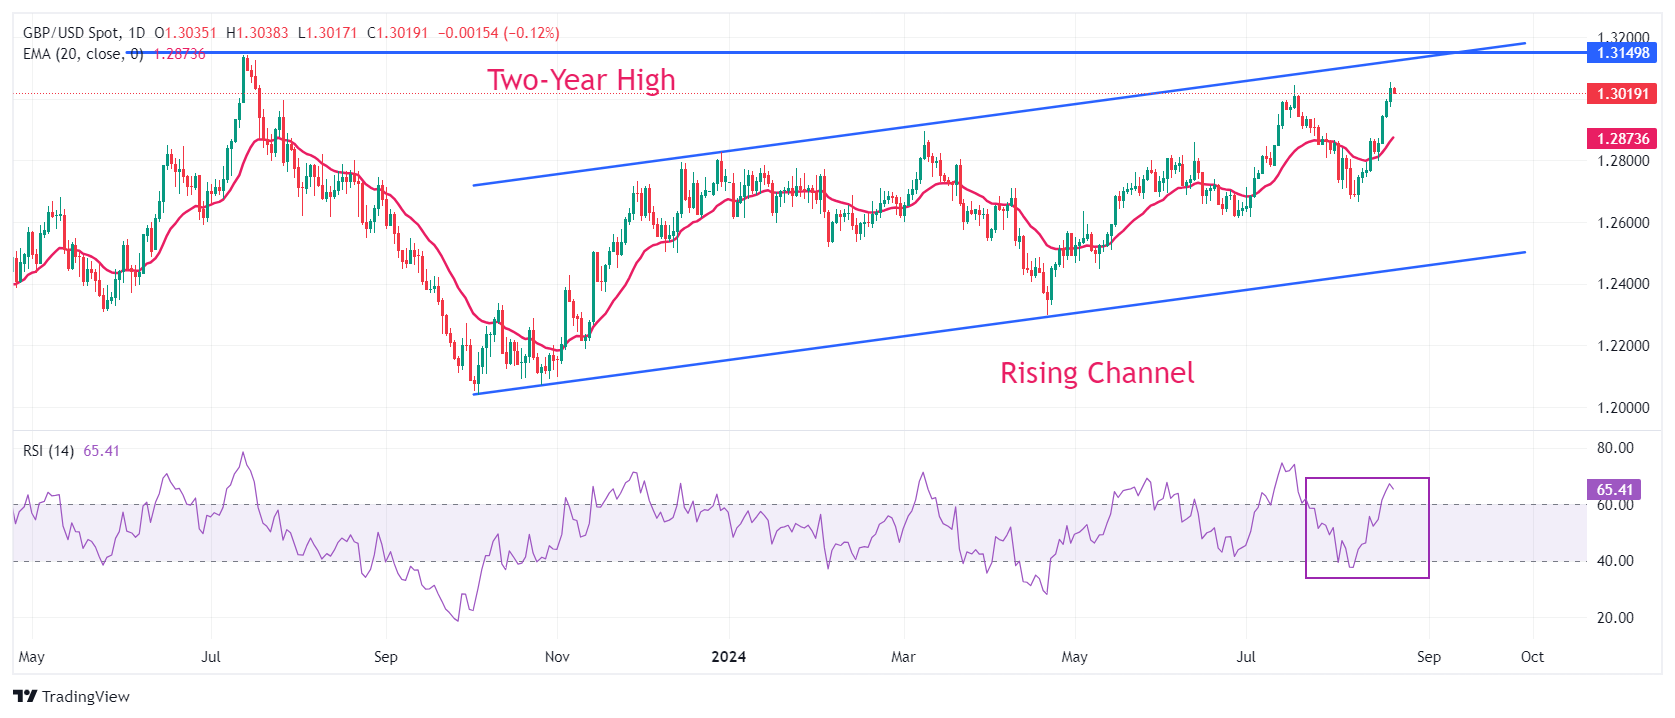
The Pound Sterling posts a fresh annual high at 1.3050 against the US Dollar. The GBP/USD pair moves higher in a Rising Channel chart pattern in which each pullback is considered a buying opportunity by market participants. Upward-sloping 20-day Exponential Moving Average (EMA) near 1.2875 suggests that the near-term trend is bullish.
The 14-period Relative Strength Index (RSI) oscillates in the bullish range of 60.00-80.00, suggesting a strong upside momentum.
Pound Sterling FAQs
The Pound Sterling (GBP) is the oldest currency in the world (886 AD) and the official currency of the United Kingdom. It is the fourth most traded unit for foreign exchange (FX) in the world, accounting for 12% of all transactions, averaging $630 billion a day, according to 2022 data. Its key trading pairs are GBP/USD, aka ‘Cable’, which accounts for 11% of FX, GBP/JPY, or the ‘Dragon’ as it is known by traders (3%), and EUR/GBP (2%). The Pound Sterling is issued by the Bank of England (BoE).
The single most important factor influencing the value of the Pound Sterling is monetary policy decided by the Bank of England. The BoE bases its decisions on whether it has achieved its primary goal of “price stability” – a steady inflation rate of around 2%. Its primary tool for achieving this is the adjustment of interest rates. When inflation is too high, the BoE will try to rein it in by raising interest rates, making it more expensive for people and businesses to access credit. This is generally positive for GBP, as higher interest rates make the UK a more attractive place for global investors to park their money. When inflation falls too low it is a sign economic growth is slowing. In this scenario, the BoE will consider lowering interest rates to cheapen credit so businesses will borrow more to invest in growth-generating projects.
Data releases gauge the health of the economy and can impact the value of the Pound Sterling. Indicators such as GDP, Manufacturing and Services PMIs, and employment can all influence the direction of the GBP. A strong economy is good for Sterling. Not only does it attract more foreign investment but it may encourage the BoE to put up interest rates, which will directly strengthen GBP. Otherwise, if economic data is weak, the Pound Sterling is likely to fall.
Another significant data release for the Pound Sterling is the Trade Balance. This indicator measures the difference between what a country earns from its exports and what it spends on imports over a given period. If a country produces highly sought-after exports, its currency will benefit purely from the extra demand created from foreign buyers seeking to purchase these goods. Therefore, a positive net Trade Balance strengthens a currency and vice versa for a negative balance.
- EUR/GBP treads water as markets take a breather ahead of PMI data from both economies.
- ECB officials adopt caution about committing to a rate-cut trajectory due to concerns over inflation rebound.
- The Pound Sterling receives support as last week's economic reports have increased the odds of BoE maintaining current rates.
EUR/GBP hovers around 0.8540 during the early European session on Wednesday, grappling to extend its winning streak. The EUR/GBP cross may appreciate further as traders expect the European Central Bank (ECB) to gradually lower interest rates. However, ECB officials have been cautious about committing to a specific rate-cut schedule, given concerns that inflationary pressures might pick up again.
On Tuesday, the Harmonized Index of Consumer Prices (HICP) data from the European Monetary Union (EMU) reported no month-on-month change for July, as anticipated. Meanwhile, the Core HICP fell by 0.2%, aligning with the decline seen in June.
In the United Kingdom (UK), Public Sector Net Borrowing (excluding public sector banks) rose to £3.1 billion in July, up from £1.3 billion in the same month the previous year and far surpassing market expectations of £1.5 billion.
The Pound Sterling (GBP) receives support as last week's UK inflation and employment reports have bolstered the argument for the Bank of England (BoE) to keep the interest rate at 5.0% during its upcoming September meeting. Rupert Thompson, Chief Economist at IBOSS, also noted, "The BoE is likely to leave rates unchanged at their September meeting, with the next rate cut probably postponed until November."
Traders are set to closely monitor the Purchasing Managers Index (PMI) data from the United Kingdom, the Eurozone, and Germany, scheduled for release on Thursday. These reports could offer deeper insights into the economic conditions across both the UK and the Eurozone, potentially influencing policy decisions by their respective central banks.
Interest rates FAQs
Interest rates are charged by financial institutions on loans to borrowers and are paid as interest to savers and depositors. They are influenced by base lending rates, which are set by central banks in response to changes in the economy. Central banks normally have a mandate to ensure price stability, which in most cases means targeting a core inflation rate of around 2%. If inflation falls below target the central bank may cut base lending rates, with a view to stimulating lending and boosting the economy. If inflation rises substantially above 2% it normally results in the central bank raising base lending rates in an attempt to lower inflation.
Higher interest rates generally help strengthen a country’s currency as they make it a more attractive place for global investors to park their money.
Higher interest rates overall weigh on the price of Gold because they increase the opportunity cost of holding Gold instead of investing in an interest-bearing asset or placing cash in the bank. If interest rates are high that usually pushes up the price of the US Dollar (USD), and since Gold is priced in Dollars, this has the effect of lowering the price of Gold.
The Fed funds rate is the overnight rate at which US banks lend to each other. It is the oft-quoted headline rate set by the Federal Reserve at its FOMC meetings. It is set as a range, for example 4.75%-5.00%, though the upper limit (in that case 5.00%) is the quoted figure. Market expectations for future Fed funds rate are tracked by the CME FedWatch tool, which shapes how many financial markets behave in anticipation of future Federal Reserve monetary policy decisions.
Here is what you need to know on Wednesday, August 21:
The US Dollar (USD) holds its ground against its major rivals early Wednesday as markets wait for the US Bureau of Labor Statistics to announce the preliminary benchmark revisions to Nonfarm Payrolls. Later in the American session, the Federal Reserve will release the minutes of its July 30-31 monetary policy meeting.
The USD Index clings to modest recovery gains near 101.50 early Wednesday after losing 1% since the beginning of the week. The benchmark 10-year US Treasury bond yield fluctuates at around 3.8% after losing nearly 2% this week and US stock index futures trade marginally higher following the mixed action seen in Wall Street on Tuesday.
US Dollar PRICE This week
The table below shows the percentage change of US Dollar (USD) against listed major currencies this week. US Dollar was the weakest against the New Zealand Dollar.
| USD | EUR | GBP | JPY | CAD | AUD | NZD | CHF | |
|---|---|---|---|---|---|---|---|---|
| USD | -0.85% | -0.59% | -1.20% | -0.46% | -1.09% | -1.60% | -1.22% | |
| EUR | 0.85% | 0.19% | -0.28% | 0.40% | -0.33% | -0.91% | -0.40% | |
| GBP | 0.59% | -0.19% | -0.63% | 0.18% | -0.52% | -1.03% | -0.59% | |
| JPY | 1.20% | 0.28% | 0.63% | 0.66% | 0.07% | -0.30% | -0.18% | |
| CAD | 0.46% | -0.40% | -0.18% | -0.66% | -0.65% | -1.06% | -0.79% | |
| AUD | 1.09% | 0.33% | 0.52% | -0.07% | 0.65% | -0.43% | -0.07% | |
| NZD | 1.60% | 0.91% | 1.03% | 0.30% | 1.06% | 0.43% | 0.39% | |
| CHF | 1.22% | 0.40% | 0.59% | 0.18% | 0.79% | 0.07% | -0.39% |
The heat map shows percentage changes of major currencies against each other. The base currency is picked from the left column, while the quote currency is picked from the top row. For example, if you pick the US Dollar from the left column and move along the horizontal line to the Japanese Yen, the percentage change displayed in the box will represent USD (base)/JPY (quote).
Gold benefited from the broad-based USD weakness on Tuesday and climbed to a new record-high of $2,531. XAU/USD seems to have entered a consolidation phase midweek and was last seen trading in a narrow channel slightly above $2,510.
Inflation in Canada, as measured by the change in the Consumer Price Index (CPI), softened to 2.5% on a yearly basis in July from 2.7% in June, as expected, Statistics Canada reported on Tuesday. USD/CAD's losses remained limited following this report and the pair closed the day modestly lower. Early Wednesday, USD/CAD holds steady above 1.3600.
AUD/USD extended its uptrend and closed the fourth consecutive trading day in positive territory on Tuesday. The pair stays relatively quiet and moves up and down in a narrow channel near 0.6750 in the European morning. In the Asian trading hours on Thursday, preliminary August Judo Bank Manufacturing and Services PMI data from Australia will be watched closely by market participants.
EUR/USD preserved its bullish momentum and rose above 1.1100 for the first time in 2024 on Tuesday. The pair stages a downward correction but manages to stay afloat above 1.1100 in the early European session on Wednesday.
GBP/USD advanced to its highest level in over a year, above 1.3050 on Tuesday. The pair edges lower in the European morning and was last seen trading near 1.3020.
USD/JPY registered losses for the third consecutive trading day on Tuesday before staging a rebound. At the time of press, the pair was up nearly 0.5% on the day, trading a few pips below 146.00.
Nonfarm Payrolls FAQs
Nonfarm Payrolls (NFP) are part of the US Bureau of Labor Statistics monthly jobs report. The Nonfarm Payrolls component specifically measures the change in the number of people employed in the US during the previous month, excluding the farming industry.
The Nonfarm Payrolls figure can influence the decisions of the Federal Reserve by providing a measure of how successfully the Fed is meeting its mandate of fostering full employment and 2% inflation. A relatively high NFP figure means more people are in employment, earning more money and therefore probably spending more. A relatively low Nonfarm Payrolls’ result, on the either hand, could mean people are struggling to find work. The Fed will typically raise interest rates to combat high inflation triggered by low unemployment, and lower them to stimulate a stagnant labor market.
Nonfarm Payrolls generally have a positive correlation with the US Dollar. This means when payrolls’ figures come out higher-than-expected the USD tends to rally and vice versa when they are lower. NFPs influence the US Dollar by virtue of their impact on inflation, monetary policy expectations and interest rates. A higher NFP usually means the Federal Reserve will be more tight in its monetary policy, supporting the USD.
Nonfarm Payrolls are generally negatively-correlated with the price of Gold. This means a higher-than-expected payrolls’ figure will have a depressing effect on the Gold price and vice versa. Higher NFP generally has a positive effect on the value of the USD, and like most major commodities Gold is priced in US Dollars. If the USD gains in value, therefore, it requires less Dollars to buy an ounce of Gold. Also, higher interest rates (typically helped higher NFPs) also lessen the attractiveness of Gold as an investment compared to staying in cash, where the money will at least earn interest.
Nonfarm Payrolls is only one component within a bigger jobs report and it can be overshadowed by the other components. At times, when NFP come out higher-than-forecast, but the Average Weekly Earnings is lower than expected, the market has ignored the potentially inflationary effect of the headline result and interpreted the fall in earnings as deflationary. The Participation Rate and the Average Weekly Hours components can also influence the market reaction, but only in seldom events like the “Great Resignation” or the Global Financial Crisis.
- USD/CAD trades in negative territory for the fourth consecutive day near 1.3620 in Wednesday’s Asian session.
- Markets are already expecting a 25 bps rate cut in September, with some anticipating a larger 50 bps cut.
- Canada’s annual CPI inflation rate fell to 2.5% in July, supporting a third straight BoC rate cut.
The USD/CAD pair trades with a bearish bias around 1.3620, the lowest level since July 12, during the early European session on Wednesday. The expectation that the US Federal Reserve (Fed) would start its easing cycle in September continues to weigh on the US Dollar (USD). Investors will monitor the FOMC Minutes on Wednesday for more cues about the Fed’s interest rate plans in the future.
The weakness of the Greenback has been fuelled by Fed rate cut expectations ahead of the key events and dovish comments from Fed officials. Chicago Fed President Austan Goolsbee said earlier this week that the US economy does not show signs of overheating, therefore, Fed officials should be vigilant about keeping the restrictive policy in place longer than necessary. Additionally, Minneapolis Fed President Neel Kashkari said on Monday that it was appropriate to discuss a potential US interest rate cut in September due to concerns about the weakening labor market.
Investors are now pricing in around 67.5% possibility of a 25 basis points (bps) Fed rate cut in its September meeting, while the chance of a 50 basis points rate cut fell to 32.5% from 53.0% a week earlier.
On the other hand, the softer Canadian Consumer Price Index (CPI) inflation reports support the case for another rate cut by the Bank of Canada (BoC). Traders continue to fully price in a 25 basis points (bps) cut in September, while an additional 50 bps of easing is priced in for the final two meetings of the year. This, in turn, might drag the Loonie lower and cap the downside for USD/CAD.
Data released by Statistics Canada on Tuesday revealed that the Canadian CPI inflation eased to 2.5% YoY in July from 2.7% in June, in line with market expectations. The closely watched underlying measure of inflation, BoC Consumer Price Index Core, fell to 1.7% YoY in July, from 1.9% in the previous reading.
Canadian Dollar FAQs
The key factors driving the Canadian Dollar (CAD) are the level of interest rates set by the Bank of Canada (BoC), the price of Oil, Canada’s largest export, the health of its economy, inflation and the Trade Balance, which is the difference between the value of Canada’s exports versus its imports. Other factors include market sentiment – whether investors are taking on more risky assets (risk-on) or seeking safe-havens (risk-off) – with risk-on being CAD-positive. As its largest trading partner, the health of the US economy is also a key factor influencing the Canadian Dollar.
The Bank of Canada (BoC) has a significant influence on the Canadian Dollar by setting the level of interest rates that banks can lend to one another. This influences the level of interest rates for everyone. The main goal of the BoC is to maintain inflation at 1-3% by adjusting interest rates up or down. Relatively higher interest rates tend to be positive for the CAD. The Bank of Canada can also use quantitative easing and tightening to influence credit conditions, with the former CAD-negative and the latter CAD-positive.
The price of Oil is a key factor impacting the value of the Canadian Dollar. Petroleum is Canada’s biggest export, so Oil price tends to have an immediate impact on the CAD value. Generally, if Oil price rises CAD also goes up, as aggregate demand for the currency increases. The opposite is the case if the price of Oil falls. Higher Oil prices also tend to result in a greater likelihood of a positive Trade Balance, which is also supportive of the CAD.
While inflation had always traditionally been thought of as a negative factor for a currency since it lowers the value of money, the opposite has actually been the case in modern times with the relaxation of cross-border capital controls. Higher inflation tends to lead central banks to put up interest rates which attracts more capital inflows from global investors seeking a lucrative place to keep their money. This increases demand for the local currency, which in Canada’s case is the Canadian Dollar.
Macroeconomic data releases gauge the health of the economy and can have an impact on the Canadian Dollar. Indicators such as GDP, Manufacturing and Services PMIs, employment, and consumer sentiment surveys can all influence the direction of the CAD. A strong economy is good for the Canadian Dollar. Not only does it attract more foreign investment but it may encourage the Bank of Canada to put up interest rates, leading to a stronger currency. If economic data is weak, however, the CAD is likely to fall.
- USD/CHF trades on a stronger note around 0.8545 in Wednesday’s Asian session.
- Rising Fed rate cut expectations might cap the pair’s upside.
- The Fed Chair Jerome Powell’s speech on Friday will be closely watched.
The USD/CHF pair holds positive ground near 0.8545 on Wednesday during the early European trading hours. The modest recovery of the Greenback provides some support to the major pair. However, the upside of the pair might be limited due to the rising expectation that the US Federal Reserve (Fed) will cut the interest rate in the September meeting. Traders await the July Federal Open Market Committee (FOMC) Minutes meeting minutes on Wednesday.
The monetary policy in the US is imminently approaching its inflection point. The pace and number of rate cuts in this easing cycle will be data-dependent. The markets are now pricing in a nearly 67.5% odds of a 25 basis points (bps) Fed rate cut in its September meeting, down from 76% a day ago, according to the CME FedWatch Tool. The probability of a 50 basis points rate cut dropped to 32.5% from 53.0% last week.
On Tuesday, Fed Governor Michelle Bowman noted that she will remain cautious in her approach to any change in the policy stance. She further stated that overreacting to any single data point could jeopardize the progress already made. The Fed Chair Jerome Powell’s speech at the Jackson Hole Symposium on Friday might offer more hints about further clues on the Fed’s plans. The rising bets of rate cuts and the dovish stance of the Fed are likely to undermine the USD against the Swiss Franc (CHF).
The Swiss National Bank (SNB) raised its policy rate to 1.75% before starting to cut its interest rate in March. A majority of economists surveyed by Bloomberg anticipated one more 25 bps cut in September, while traders are betting on more loosening. Meanwhile, the economic uncertainty and geopolitical tensions in the Middle East might boost the safe-haven flows, benefiting the Swiss Franc (CHF).
Swiss Franc FAQs
The Swiss Franc (CHF) is Switzerland’s official currency. It is among the top ten most traded currencies globally, reaching volumes that well exceed the size of the Swiss economy. Its value is determined by the broad market sentiment, the country’s economic health or action taken by the Swiss National Bank (SNB), among other factors. Between 2011 and 2015, the Swiss Franc was pegged to the Euro (EUR). The peg was abruptly removed, resulting in a more than 20% increase in the Franc’s value, causing a turmoil in markets. Even though the peg isn’t in force anymore, CHF fortunes tend to be highly correlated with the Euro ones due to the high dependency of the Swiss economy on the neighboring Eurozone.
The Swiss Franc (CHF) is considered a safe-haven asset, or a currency that investors tend to buy in times of market stress. This is due to the perceived status of Switzerland in the world: a stable economy, a strong export sector, big central bank reserves or a longstanding political stance towards neutrality in global conflicts make the country’s currency a good choice for investors fleeing from risks. Turbulent times are likely to strengthen CHF value against other currencies that are seen as more risky to invest in.
The Swiss National Bank (SNB) meets four times a year – once every quarter, less than other major central banks – to decide on monetary policy. The bank aims for an annual inflation rate of less than 2%. When inflation is above target or forecasted to be above target in the foreseeable future, the bank will attempt to tame price growth by raising its policy rate. Higher interest rates are generally positive for the Swiss Franc (CHF) as they lead to higher yields, making the country a more attractive place for investors. On the contrary, lower interest rates tend to weaken CHF.
Macroeconomic data releases in Switzerland are key to assessing the state of the economy and can impact the Swiss Franc’s (CHF) valuation. The Swiss economy is broadly stable, but any sudden change in economic growth, inflation, current account or the central bank’s currency reserves have the potential to trigger moves in CHF. Generally, high economic growth, low unemployment and high confidence are good for CHF. Conversely, if economic data points to weakening momentum, CHF is likely to depreciate.
As a small and open economy, Switzerland is heavily dependent on the health of the neighboring Eurozone economies. The broader European Union is Switzerland’s main economic partner and a key political ally, so macroeconomic and monetary policy stability in the Eurozone is essential for Switzerland and, thus, for the Swiss Franc (CHF). With such dependency, some models suggest that the correlation between the fortunes of the Euro (EUR) and the CHF is more than 90%, or close to perfect.
- EUR/JPY gains ground as Japan’s Trade Balance reported a deficit of ¥621.84 billion for July.
- Reuters poll showed that 31 out of 54 economists predicted that the BoJ would increase borrowing costs by year-end.
- The Euro receives support ahead of PMI data from the Eurozone and Germany scheduled for release on Wednesday.
EUR/JPY breaks its three-day losing streak, trading around 162.00 during the Asian hours on Wednesday. This upside of the EUR/JPY cross could be attributed to the tepid Japanese Yen (JPY) following the release of Trade Balance data on Wednesday.
Japan's Merchandise Trade Balance fell into a deficit of ¥621.84 billion in July, reversing the surplus of ¥224.0 billion reported in June and missing market estimates of a ¥330.7 billion shortfall. This marks the fifth deficit so far this year, as imports increased at a much faster pace than exports.
However, the downside of JPY could be restrained due to the growing likelihood of another near-term interest rate hike. Traders are also anticipating Bank of Japan (BoJ) Governor Kazuo Ueda's appearance in parliament on Friday, where he will discuss the central bank's decision last month to raise interest rates.
According to a Reuters poll published on Wednesday, more than half of the economists expect the Bank of Japan (BoJ) to raise interest rates again by the end of the year. In the August 13-19 survey, 31 out of 54 economists predicted that the BoJ would increase borrowing costs by year-end. The median forecast for the end-of-year rate is 0.50%, marking a 25 basis point increase.
In the Eurozone, traders expect the European Central Bank (ECB) to gradually lower interest rates. However, ECB officials have been cautious about committing to a specific rate-cut schedule, given concerns that inflationary pressures might pick up again.
On Tuesday, the Harmonized Index of Consumer Prices (HICP) data from the European Monetary Union (EMU) reported no month-on-month change for July, as anticipated. Meanwhile, the Core HICP fell by 0.2%, aligning with the decline seen in June.
Traders are likely to observe Purchasing Managers Index (PMI) data from the Eurozone and Germany scheduled for release on Wednesday. HCOB Composite PMI for the Eurozone is expected to report a 50.1 reading, falling short of the previous reading of 50.2 reading.
Economic Indicator
Merchandise Trade Balance Total
The Merchandise Trade Balance Total released by the Ministry of Finance is a measure of balance amount between import and export. A positive value shows a trade surplus while a negative value shows a trade deficit. Japan is so much dependant on exports that the Japanese economy heavily relies on a trade surplus. Therefore, any variation in the figures influences the domestic economy. If a steady demand in exchange for Japanese exports is seen, that would turn into a positive.
Read more.Last release: Tue Aug 20, 2024 23:50
Frequency: Monthly
Actual: ¥-621.8B
Consensus: ¥-330.7B
Previous: ¥224B
Source: Ministry of Finance of Japan
Gold prices rose in India on Wednesday, according to data compiled by FXStreet.
The price for Gold stood at 6,786.84 Indian Rupees (INR) per gram, up compared with the INR 6,779.94 it cost on Tuesday.
The price for Gold increased to INR 79,160.38 per tola from INR 79,079.85 per tola a day earlier.
| Unit measure | Gold Price in INR |
|---|---|
| 1 Gram | 6,786.84 |
| 10 Grams | 67,868.95 |
| Tola | 79,160.38 |
| Troy Ounce | 211,094.50 |
FXStreet calculates Gold prices in India by adapting international prices (USD/INR) to the local currency and measurement units. Prices are updated daily based on the market rates taken at the time of publication. Prices are just for reference and local rates could diverge slightly.
Gold FAQs
Gold has played a key role in human’s history as it has been widely used as a store of value and medium of exchange. Currently, apart from its shine and usage for jewelry, the precious metal is widely seen as a safe-haven asset, meaning that it is considered a good investment during turbulent times. Gold is also widely seen as a hedge against inflation and against depreciating currencies as it doesn’t rely on any specific issuer or government.
Central banks are the biggest Gold holders. In their aim to support their currencies in turbulent times, central banks tend to diversify their reserves and buy Gold to improve the perceived strength of the economy and the currency. High Gold reserves can be a source of trust for a country’s solvency. Central banks added 1,136 tonnes of Gold worth around $70 billion to their reserves in 2022, according to data from the World Gold Council. This is the highest yearly purchase since records began. Central banks from emerging economies such as China, India and Turkey are quickly increasing their Gold reserves.
Gold has an inverse correlation with the US Dollar and US Treasuries, which are both major reserve and safe-haven assets. When the Dollar depreciates, Gold tends to rise, enabling investors and central banks to diversify their assets in turbulent times. Gold is also inversely correlated with risk assets. A rally in the stock market tends to weaken Gold price, while sell-offs in riskier markets tend to favor the precious metal.
The price can move due to a wide range of factors. Geopolitical instability or fears of a deep recession can quickly make Gold price escalate due to its safe-haven status. As a yield-less asset, Gold tends to rise with lower interest rates, while higher cost of money usually weighs down on the yellow metal. Still, most moves depend on how the US Dollar (USD) behaves as the asset is priced in dollars (XAU/USD). A strong Dollar tends to keep the price of Gold controlled, whereas a weaker Dollar is likely to push Gold prices up.
(An automation tool was used in creating this post.)
- EUR/USD edges lower to near 1.1120 in Wednesday’s Asian session.
- The cautious sentiment lifts the US Dollar, but more dovish remarks from the Fed might cap its upside.
- Investors will closely watch the FOMC Minutes on Wednesday for fresh catalysts.
The EUR/USD pair loses momentum around 1.1120, snapping the three-day winning streak during the early European session on Wednesday. The cautious mood in the markets ahead of the July Federal Open Market Committee (FOMC) Minutes meeting minutes on Wednesday provides some support for the Greenback.
The FOMC kept the Federal Funds rate unchanged between 5.25%-5.50% at its July meeting. During the press conference, Fed Chair Jerome Powell noted that a rate cut could be on the table if inflation continues to ease. The dovish tone of the meeting drags the Greenback lower in the previous sessions. However, the cautious mood ahead of the key event boosts the safe-haven currency like the US Dollar (USD) and creates a headwind for EUR/USD.
On Friday, traders will shift their attention to Fed Chair Jerome Powell’s speech at the Jackson Hole Symposium about further clues on the Fed’s plans. Financial markets have priced in nearly a 67.5% possibility of the Fed cutting interest rates by 25 basis points (bps) in September, according to the CME FedWatch Tool.
Across the pond, the European Central Bank (ECB) policymaker Olli Rehn said on Monday that the ECB may need to lower interest rates again in September due to persistent economic weakness. Rehn emphasized that the recent increase in negative growth risks in the euro area has supported the case for ECB rate cuts in the September meeting. Traders see a 90% odds of a 25 bps cut in the deposit rate to 3.5% in September and see at least one more move before the end of the year.
Euro FAQs
The Euro is the currency for the 20 European Union countries that belong to the Eurozone. It is the second most heavily traded currency in the world behind the US Dollar. In 2022, it accounted for 31% of all foreign exchange transactions, with an average daily turnover of over $2.2 trillion a day. EUR/USD is the most heavily traded currency pair in the world, accounting for an estimated 30% off all transactions, followed by EUR/JPY (4%), EUR/GBP (3%) and EUR/AUD (2%).
The European Central Bank (ECB) in Frankfurt, Germany, is the reserve bank for the Eurozone. The ECB sets interest rates and manages monetary policy. The ECB’s primary mandate is to maintain price stability, which means either controlling inflation or stimulating growth. Its primary tool is the raising or lowering of interest rates. Relatively high interest rates – or the expectation of higher rates – will usually benefit the Euro and vice versa. The ECB Governing Council makes monetary policy decisions at meetings held eight times a year. Decisions are made by heads of the Eurozone national banks and six permanent members, including the President of the ECB, Christine Lagarde.
Eurozone inflation data, measured by the Harmonized Index of Consumer Prices (HICP), is an important econometric for the Euro. If inflation rises more than expected, especially if above the ECB’s 2% target, it obliges the ECB to raise interest rates to bring it back under control. Relatively high interest rates compared to its counterparts will usually benefit the Euro, as it makes the region more attractive as a place for global investors to park their money.
Data releases gauge the health of the economy and can impact on the Euro. Indicators such as GDP, Manufacturing and Services PMIs, employment, and consumer sentiment surveys can all influence the direction of the single currency. A strong economy is good for the Euro. Not only does it attract more foreign investment but it may encourage the ECB to put up interest rates, which will directly strengthen the Euro. Otherwise, if economic data is weak, the Euro is likely to fall. Economic data for the four largest economies in the euro area (Germany, France, Italy and Spain) are especially significant, as they account for 75% of the Eurozone’s economy.
Another significant data release for the Euro is the Trade Balance. This indicator measures the difference between what a country earns from its exports and what it spends on imports over a given period. If a country produces highly sought after exports then its currency will gain in value purely from the extra demand created from foreign buyers seeking to purchase these goods. Therefore, a positive net Trade Balance strengthens a currency and vice versa for a negative balance.
FX option expiries for Aug 21 NY cut at 10:00 Eastern Time, via DTCC, can be found below.
EUR/USD: EUR amounts
- 1.0890 847m
- 1.1000 1.4b
- 1.1025 911m
- 1.1100 1.1b
USD/JPY: USD amounts
- 146.60 742m
- 146.75 957m
- 148.00 780m
USD/CHF: USD amounts
- 0.8750 443m
AUD/USD: AUD amounts
- 0.6645 486m
USD/CAD: USD amounts
- 1.3720 410m
NZD/USD: NZD amounts
- 0.5950 650m
EUR/GBP: EUR amounts
- 0.8625 401m
- Asian stocks tack the overnight slide in the US equity markets and retreated on Wednesday.
- JD.com sinks on report of Walmart stake sale and weighs on Hong Kong’s Hang Seng index.
- China's economic woes and the recent appreciation in the JPY also dent investors' sentiment.
Asian equity markets edge lower on Wednesday, tracking the overnight pullback on Wall Street that snapped an eight-day winning streak. Hong Kong’s Hang Seng Index turned out to be the worst performer, falling 1% for the day amid heavy losses in the e-commerce major JD.com led by the report of Walmart's stake sale.
Adding to this, concerns over slowing growth in China continue to weigh on investors' sentiment and contribute to a decline of around 0.4% in the Shanghai Composite Index, which remains close to a six-month low. Furthermore, Japan's Nikkei 225 is weighed down by the recent appreciation in the Japanese Yen (JPY) and the political uncertainty led by Japanese Prime Minister Fumio Kishida's decision to step down. Meanwhile, Japan’s exports grew less than expected in July, while imports accelerated on improving local demand, with the trade deficit ballooning to ¥621.84 billion.
Meanwhile, US equity futures moved little in Asian trade as traders seem reluctant to place fresh bets following the recent strong rally and ahead of the key event risks. The July FOMC meeting minutes will be published later today, which, along with Federal Reserve (Fed) Chair Jerome Powell's speech at the Jackson Hole Symposium on Friday, will be scrutinized for fresh cues about the policy path. This, in turn, will drive investors' appetite for riskier assets and provide a fresh impetus.
AsianStocks FAQs
Asia contributes around 70% of global economic growth and hosts several key stock market indices. Among the region’s developed economies, the Japanese Nikkei – which represents 225 companies on the Tokyo stock exchange – and the South Korean Kospi stand out. China has three important indices: the Hong Kong Hang Seng, the Shanghai Composite and the Shenzhen Composite. As a big emerging economy, Indian equities are also catching the attention of investors, who increasingly invest in companies in the Sensex and Nifty indices.
Asia’s main economies are different, and each has specific sectors to pay attention to. Technology companies dominate in indices in Japan, South Korea, and increasingly, China. Financial services are leading stock markets such as Hong Kong or Singapore, considered key hubs for the sector. Manufacturing is also big in China and Japan, with a strong focus on automobile production or electronics. The growing middle class in countries like China and India is also giving more and more prominence to companies focused on retail and e-commerce.
Many different factors drive Asian stock market indices, but the main factor behind their performance is the aggregate results of the component companies revealed in their quarterly and annual earnings reports. The economic fundamentals of each country, as well as their central bank decisions or their government’s fiscal policies, are also important factors. More broadly, political stability, technological progress or the rule of law can also impact equity markets. The performance of US equity indices is also a factor as, more often than not, Asian markets take the lead from Wall Street stocks overnight. Finally, the broader risk sentiment in markets also plays a role as equities are considered a risky investment compared to other investment options such as fixed-income securities.
Investing in equities is risky by itself, but investing in Asian stocks comes along with region-specific risks to be taken into account. Asian countries have a wide range of political systems, from full democracies to dictatorships, so their political stability, transparency, rule of law or corporate governance requirements may diverge considerably. Geopolitical events such as trade disputes or territorial conflicts can lead to volatility in stock markets, as can natural disasters. Moreover, currency fluctuations can also have an impact on the valuation of Asian stock markets. This is particularly true in export-oriented economies, which tend to suffer from a stronger currency and benefit from a weaker one as their products become cheaper abroad.
- GBP/USD tests a yearly high of 1.3044 level, marked on July 17.
- The momentum indicator 14-day RSI is positioned slightly below 70 level, suggesting a potential correction soon.
- The pair may navigate the area around the lower boundary of the ascending channel at the 1.2950 level.
GBP/USD halts its four-day winning streak, trading around 1.3020 during Wednesday’s Asian session. The daily chart analysis shows the pair is trending upwards within an ascending channel pattern, suggesting a bullish bias.
The Moving Average Convergence Divergence (MACD) indicator suggests bullish momentum, as the MACD line is above the centreline and shows divergence above the signal line. Additionally, the 14-day Relative Strength Index (RSI) consolidates slightly below 70 level, suggesting a potential correction in the short term.
For resistance, the GBP/USD pair is testing a yearly high of 1.3044 level, reached on July 17. A break above this level could lead the pair to explore the region around the upper boundary of the ascending channel at 1.3100 level.
On the downside, the GBP/USD pair may navigate the area around the lower boundary of the ascending channel at the 1.2950 level, followed by the nine-day Exponential Moving Average (EMA) at the 1.2924 level. A break below the latter could guide the pair toward the throwback support at the 1.2615 level, noted in June.
GBP/USD: Daily Chart
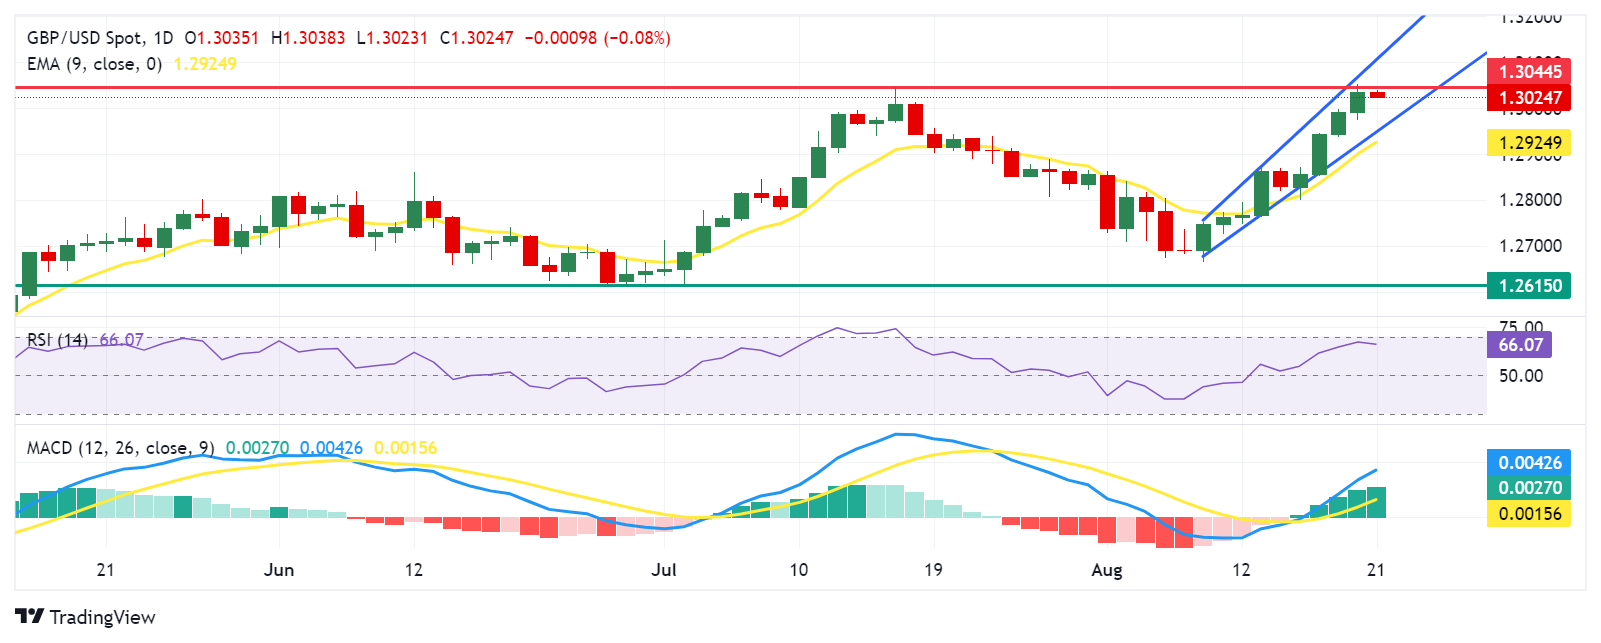
British Pound PRICE Today
The table below shows the percentage change of British Pound (GBP) against listed major currencies today. British Pound was the weakest against the Canadian Dollar.
| USD | EUR | GBP | JPY | CAD | AUD | NZD | CHF | |
|---|---|---|---|---|---|---|---|---|
| USD | 0.10% | 0.08% | 0.29% | -0.04% | 0.04% | 0.24% | 0.03% | |
| EUR | -0.10% | -0.03% | 0.16% | -0.13% | -0.04% | 0.12% | -0.09% | |
| GBP | -0.08% | 0.03% | 0.23% | -0.09% | -0.03% | 0.16% | -0.04% | |
| JPY | -0.29% | -0.16% | -0.23% | -0.33% | -0.24% | -0.11% | -0.27% | |
| CAD | 0.04% | 0.13% | 0.09% | 0.33% | 0.09% | 0.24% | 0.05% | |
| AUD | -0.04% | 0.04% | 0.03% | 0.24% | -0.09% | 0.15% | -0.03% | |
| NZD | -0.24% | -0.12% | -0.16% | 0.11% | -0.24% | -0.15% | -0.19% | |
| CHF | -0.03% | 0.09% | 0.04% | 0.27% | -0.05% | 0.03% | 0.19% |
The heat map shows percentage changes of major currencies against each other. The base currency is picked from the left column, while the quote currency is picked from the top row. For example, if you pick the British Pound from the left column and move along the horizontal line to the US Dollar, the percentage change displayed in the box will represent GBP (base)/USD (quote).
- AUD/JPY regains positive on Wednesday amid the emergence of some JPY selling.
- The RBA’s hawkish stance and the BoJ rate-hike uncertainty remain supportive.
- Geopolitical risks and a softer risk tone might keep a lid on any meaningful gains.
The AUD/JPY cross attracts some dip-buying during the Asian session on Wednesday and for now, seems to have stalled the previous day's rejection slide from the 99.00 mark, or a nearly three-week top. Spot prices, however, remain confined in a narrow band held over the past week or so and currently trade around the 98.20 area, up just over 0.20% for the day.
The Australian Dollar (AUD) continues to draw support from the Reserve Bank of Australia's (RBA) hawkish stance, showing readiness to hike interest rates in the face of more upside risks to inflation. This, along with increasing chatters regarding big economic stimulus measures from China's government, turns out to be another factor underpinning the China-proxy Aussie. Apart from this, the emergence of some selling around the Japanese Yen (JPY) assists the AUD/JPY cross to regain some positive traction.
Meanwhile, the political uncertainty led by Japanese Prime Minister Fumio Kishida's decision to step down could lead to a pause in the Bank of Japan's (BoJ) plan to raise interest rates steadily, which, in turn, is seen weighing on the JPY. Adding to this, government data released this Wednesday showed that Japan's trade deficit ballooned to ¥621.84 billion in July amid a smaller-than-expected, 10.3% increase in exports and a 16.6% jump in exports, pushed up by a weaker yen rather than a robust increase in volume.
Investors, however, seem convinced that an improving macroeconomic environment in Japan should encourage the BoJ to raise interest rates again later this year. This, along with persistent geopolitical risks and a slight deterioration in the global risk sentiment, should help limit any meaningful JPY downfall and keep a lid on the AUD/JPY cross. This makes it prudent to wait for a convincing breakout through the short-term range before positioning for an extension of the recovery from over a one-year low touched this August.
Bank of Japan FAQs
The Bank of Japan (BoJ) is the Japanese central bank, which sets monetary policy in the country. Its mandate is to issue banknotes and carry out currency and monetary control to ensure price stability, which means an inflation target of around 2%.
The Bank of Japan has embarked in an ultra-loose monetary policy since 2013 in order to stimulate the economy and fuel inflation amid a low-inflationary environment. The bank’s policy is based on Quantitative and Qualitative Easing (QQE), or printing notes to buy assets such as government or corporate bonds to provide liquidity. In 2016, the bank doubled down on its strategy and further loosened policy by first introducing negative interest rates and then directly controlling the yield of its 10-year government bonds.
The Bank’s massive stimulus has caused the Yen to depreciate against its main currency peers. This process has exacerbated more recently due to an increasing policy divergence between the Bank of Japan and other main central banks, which have opted to increase interest rates sharply to fight decades-high levels of inflation. The BoJ’s policy of holding down rates has led to a widening differential with other currencies, dragging down the value of the Yen.
A weaker Yen and the spike in global energy prices have led to an increase in Japanese inflation, which has exceeded the BoJ’s 2% target. With wage inflation becoming a cause of concern, the BoJ looks to move away from ultra loose policy, while trying to avoid slowing the activity too much.
- The Japanese Yen eases following the release of Trade Balance data on Wednesday.
- Japan's Merchandise Trade Balance reported a deficit of ¥621.84 billion in July, swinging from a ¥224.0 billion surplus in June.
- The US Dollar holds ground due to market caution ahead of the FOMC Meeting Minutes.
The Japanese Yen (JPY) halts its three-day winning streak against the US Dollar (USD) following the release of Trade Balance data on Wednesday. However, the JPY's decline might be limited due to the growing likelihood of another near-term interest rate hike. Traders are also anticipating Bank of Japan (BoJ) Governor Kazuo Ueda's appearance in parliament on Friday, where he will discuss the central bank's decision last month to raise interest rates.
Japan's Merchandise Trade Balance fell into a deficit of ¥621.84 billion in July, reversing the surplus of ¥224.0 billion reported in June and missing market estimates of a ¥330.7 billion shortfall. This marks the fifth deficit so far this year, as imports increased at a much faster pace than exports.
The US Dollar (USD) attempts to halt its three-day losing streak as traders turn cautious ahead of Wednesday’s FOMC Meeting Minutes for July’s policy decision. Furthermore, traders await Fed Chair Jerome Powell's upcoming speech at Jackson Hole on Friday.
CME FedWatch Tool suggests that the markets are now pricing in a nearly 67.5% odds of a 25 basis points (bps) Fed rate cut in its September meeting, down from 76% a day ago. The probability of a 50 basis points rate cut fell to 32.5% from 53.0% a week earlier.
Daily Digest Market Movers: Japanese Yen declines following Trade Balance data
- According to a Reuters poll published on Wednesday, more than half of the economists expect the Bank of Japan (BoJ) to raise interest rates again by the end of the year. In the August 13-19 survey, 31 out of 54 economists predicted that the BoJ would increase borrowing costs by year-end. The median forecast for the end-of-year rate is 0.50%, marking a 25 basis point increase.
- Japan's imports surged by 16.6% year-on-year in July, reaching a 19-month high of ¥10,241.01 billion, surpassing market expectations of 14.9% and significantly up from the 3.2% rise in June. This marks the strongest growth in imports since January 2023. Meanwhile, exports increased by 10.3% YoY to a seven-month high of ¥9,619.17 billion, accelerating from the previous month's 5.4% growth but falling short of market forecasts of 11.4%.
- Federal Reserve (Fed) Governor Michelle Bowman expressed caution on Tuesday about making any policy changes, citing ongoing upside risks to inflation. Bowman warned that overreacting to individual data points could undermine the progress already achieved, according to Reuters.
- According to Reuters, the Bank of Japan (BoJ) had projected that a strong economic recovery would help inflation reach its 2% target sustainably. This would justify further interest rate increases, following last month's hike as part of the BoJ's ongoing effort to unwind years of extensive monetary stimulus.
- Federal Reserve Bank of San Francisco President Mary Daly emphasized Sunday that the US central bank should take a gradual approach to reducing borrowing costs, according to the Financial Times. Additionally, Federal Reserve Bank of Chicago President Austan Goolsbee warned that central bank officials should be cautious about keeping a restrictive policy in place longer than necessary, per CNBC.
- On Thursday, Kazutaka Maeda, an economist at Meiji Yasuda Research Institute, said that the reports are simply positive overall and “it supports the BoJ’s view and bodes well for further rate hikes, although the central bank would remain cautious as the last rate increase had caused a sharp spike in the Yen.”
- Japan's Gross Domestic Product (GDP) grew by 0.8% quarter-on-quarter in Q2, surpassing market forecasts of 0.5% and rebounding from a 0.6% decline in Q1. This marked the strongest quarterly growth since Q1 of 2023. Meanwhile, the annualized GDP growth reached 3.1%, exceeding the market consensus of 2.1% and reversing a 2.3% contraction in Q1. This was the strongest yearly expansion since Q2 of 2023.
- Rabobank's senior FX strategist, Jane Foley, observes that this week's series of US data releases, along with next week's Jackson Hole event, should provide the market with clearer insights into the potential responses of US policymakers. However, their main expectation is that the Fed will reduce rates by 25 basis points in September and likely cut them again before the end of the year.
Technical Analysis: USD/JPY edges higher to near 145.50
USD/JPY trades around 145.50 on Wednesday. Analysis of the daily chart shows that the pair is consolidating under a downtrend line, suggesting a bearish bias. Furthermore, the 14-day Relative Strength Index (RSI) is slightly above 30, suggesting a potential correction for the pair.
For support levels, the USD/JPY pair might navigate the region around the round numbers at 144.00 before 143.00 before a seven-month low of 141.69, which was recorded on August 5. A further drop could drive the pair toward the next significant support level at 140.25.
On the upside, the USD/JPY pair could encounter an immediate resistance at the downtrend line around the nine-day Exponential Moving Average (EMA) at the 146.80 level. A breakthrough above this level could lead the pair to test the resistance level at 154.50, which has transitioned from previous support to current resistance.
USD/JPY: Daily Chart
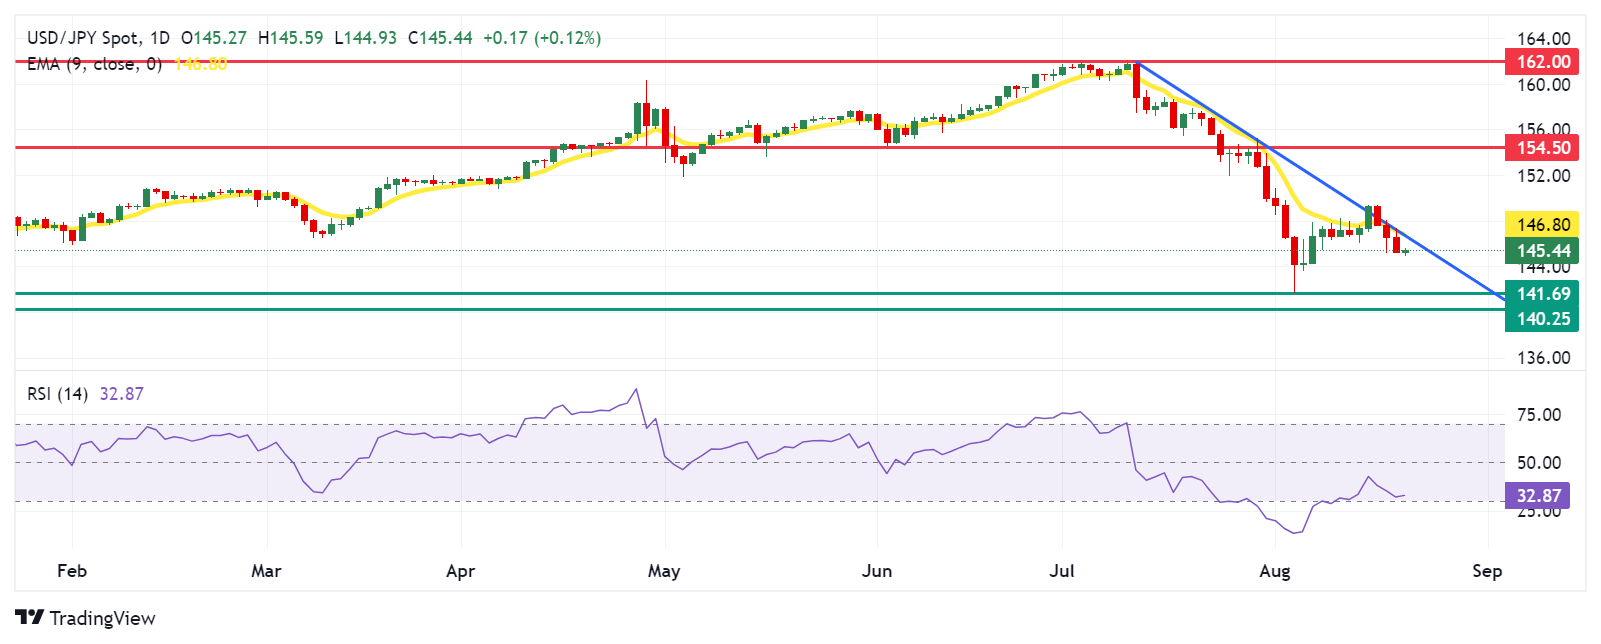
Japanese Yen PRICE Today
The table below shows the percentage change of Japanese Yen (JPY) against listed major currencies today. Japanese Yen was the strongest against the New Zealand Dollar.
| USD | EUR | GBP | JPY | CAD | AUD | NZD | CHF | |
|---|---|---|---|---|---|---|---|---|
| USD | 0.08% | 0.06% | 0.12% | -0.04% | -0.00% | 0.15% | -0.00% | |
| EUR | -0.08% | -0.04% | 0.05% | -0.12% | -0.06% | 0.05% | -0.09% | |
| GBP | -0.06% | 0.04% | 0.09% | -0.06% | -0.05% | 0.09% | -0.03% | |
| JPY | -0.12% | -0.05% | -0.09% | -0.16% | -0.10% | -0.02% | -0.11% | |
| CAD | 0.04% | 0.12% | 0.06% | 0.16% | 0.05% | 0.15% | 0.03% | |
| AUD | 0.00% | 0.06% | 0.05% | 0.10% | -0.05% | 0.11% | -0.00% | |
| NZD | -0.15% | -0.05% | -0.09% | 0.02% | -0.15% | -0.11% | -0.12% | |
| CHF | 0.00% | 0.09% | 0.03% | 0.11% | -0.03% | 0.00% | 0.12% |
The heat map shows percentage changes of major currencies against each other. The base currency is picked from the left column, while the quote currency is picked from the top row. For example, if you pick the Japanese Yen from the left column and move along the horizontal line to the US Dollar, the percentage change displayed in the box will represent JPY (base)/USD (quote).
Japanese Yen FAQs
The Japanese Yen (JPY) is one of the world’s most traded currencies. Its value is broadly determined by the performance of the Japanese economy, but more specifically by the Bank of Japan’s policy, the differential between Japanese and US bond yields, or risk sentiment among traders, among other factors.
One of the Bank of Japan’s mandates is currency control, so its moves are key for the Yen. The BoJ has directly intervened in currency markets sometimes, generally to lower the value of the Yen, although it refrains from doing it often due to political concerns of its main trading partners. The current BoJ ultra-loose monetary policy, based on massive stimulus to the economy, has caused the Yen to depreciate against its main currency peers. This process has exacerbated more recently due to an increasing policy divergence between the Bank of Japan and other main central banks, which have opted to increase interest rates sharply to fight decades-high levels of inflation.
The BoJ’s stance of sticking to ultra-loose monetary policy has led to a widening policy divergence with other central banks, particularly with the US Federal Reserve. This supports a widening of the differential between the 10-year US and Japanese bonds, which favors the US Dollar against the Japanese Yen.
The Japanese Yen is often seen as a safe-haven investment. This means that in times of market stress, investors are more likely to put their money in the Japanese currency due to its supposed reliability and stability. Turbulent times are likely to strengthen the Yen’s value against other currencies seen as more risky to invest in.
- The Indian Rupee edges lower in Wednesday’s Asian session.
- Persistent USD demand from importers weighs on the INR, while lower crude oil prices might limit its losses.
- Advanced August PMI data from India and the US will be released on Thursday.
The Indian Rupee (INR) weakens on Wednesday and remains the worst-performing Asian currency in August due to trade deficits and persistent USD demand from importers. Any significant weakening of INR is likely to be limited amid the possible intervention from the Reserve Bank of India (RBI) that might sell USD to prevent local currency from breaching the critical 84.00 mark. Additionally, the extended fall in crude oil prices might support the local currency in the near term.
Traders will monitor the preliminary of the Indian August HSBC Purchasing Managers Index (PMI) on Thursday for fresh impetus. The highlight this week will be Federal Reserve (Fed) Chair Jerome Powell at Jackson Hole on Friday. There is growing speculation that Powell will signal a potential interest rate cut in this event, which could exert some selling pressure on the Greenback.
Daily Digest Market Movers: Indian Rupee remains sensitive to global factors
- MUFG Bank analysts said in a note that "Asian currencies have continued to strengthen against the US dollar on the back of broad U.S. dollar weakness and risk-on sentiment.”
- Foreign investors have pulled out about $2.5 billion from Indian shares in August, according to stock depository data.
- India's Exports declined 6% in the current fiscal year through July compared to the same period in the previous year. In FY24, foreign direct investment in India dropped by 3.5%.
- Fed Governor Michelle Bowman stated on Tuesday that she will remain cautious in her approach to any change in the policy stance. She added that overreacting to any single data point could jeopardize the progress already made.
- Markets are pricing in about a 67.5% chance of the Fed cutting interest rates by 25 basis points (bps) in September, according to the CME FedWatch Tool.
Technical Analysis: USD/INR holds a positive stance in the longer term
Indian Rupee trades on a stronger note on the day. The positive outlook of the USD/INR pair remains in play as the price remains above the key 100-day Exponential Moving Average (EMA) on the daily chart. However, some selling pressure below the 11-week-old uptrend line in the previous sessions and the bearish 14-day Relative Strength Index (RSI) below the 50 midline indicate that further downside cannot be ruled out.
The key upside barrier for USD/INR appears near the 83.90-84.00 zone, the uptrend line and the psychological level. A break above the mentioned level could see a rally to the record high of 84.24 en route to 84.50.
In the bearish event, the initial target could be 83.70, the low of August 1. Further south, the next cushion level emerges near the 100-day EMA at 83.55, followed by 83.36, the low of June 28.
US Dollar price in the last 7 days
The table below shows the percentage change of US Dollar (USD) against listed major currencies in the last 7 days. US Dollar was the weakest against the Australian Dollar.
| USD | EUR | GBP | CAD | AUD | JPY | NZD | CHF | |
| USD | -1.11% | -1.25% | -0.68% | -1.62% | -1.06% | -1.22% | -1.33% | |
| EUR | 1.10% | -0.14% | 0.43% | -0.53% | 0.07% | -0.10% | -0.19% | |
| GBP | 1.23% | 0.15% | 0.57% | -0.39% | 0.22% | 0.04% | -0.06% | |
| CAD | 0.68% | -0.43% | -0.57% | -0.96% | -0.34% | -0.53% | -0.63% | |
| AUD | 1.63% | 0.51% | 0.37% | 0.93% | 0.56% | 0.40% | 0.29% | |
| JPY | 1.03% | -0.07% | -0.25% | 0.33% | -0.61% | -0.19% | -0.29% | |
| NZD | 1.21% | 0.10% | -0.04% | 0.53% | -0.43% | 0.19% | -0.10% | |
| CHF | 1.30% | 0.22% | 0.08% | 0.64% | -0.29% | 0.26% | 0.11% |
The heat map shows percentage changes of major currencies against each other. The base currency is picked from the left column, while the quote currency is picked from the top row. For example, if you pick the Euro from the left column and move along the horizontal line to the Japanese Yen, the percentage change displayed in the box will represent EUR (base)/JPY (quote).
Indian Rupee FAQs
The Indian Rupee (INR) is one of the most sensitive currencies to external factors. The price of Crude Oil (the country is highly dependent on imported Oil), the value of the US Dollar – most trade is conducted in USD – and the level of foreign investment, are all influential. Direct intervention by the Reserve Bank of India (RBI) in FX markets to keep the exchange rate stable, as well as the level of interest rates set by the RBI, are further major influencing factors on the Rupee.
The Reserve Bank of India (RBI) actively intervenes in forex markets to maintain a stable exchange rate, to help facilitate trade. In addition, the RBI tries to maintain the inflation rate at its 4% target by adjusting interest rates. Higher interest rates usually strengthen the Rupee. This is due to the role of the ‘carry trade’ in which investors borrow in countries with lower interest rates so as to place their money in countries’ offering relatively higher interest rates and profit from the difference.
Macroeconomic factors that influence the value of the Rupee include inflation, interest rates, the economic growth rate (GDP), the balance of trade, and inflows from foreign investment. A higher growth rate can lead to more overseas investment, pushing up demand for the Rupee. A less negative balance of trade will eventually lead to a stronger Rupee. Higher interest rates, especially real rates (interest rates less inflation) are also positive for the Rupee. A risk-on environment can lead to greater inflows of Foreign Direct and Indirect Investment (FDI and FII), which also benefit the Rupee.
Higher inflation, particularly, if it is comparatively higher than India’s peers, is generally negative for the currency as it reflects devaluation through oversupply. Inflation also increases the cost of exports, leading to more Rupees being sold to purchase foreign imports, which is Rupee-negative. At the same time, higher inflation usually leads to the Reserve Bank of India (RBI) raising interest rates and this can be positive for the Rupee, due to increased demand from international investors. The opposite effect is true of lower inflation.
- Silver attracts some dip-buying following the overnight pullback from a one-month peak.
- The technical setup seems tilted in favor of bulls and supports prospects for further gains.
- Dips towards the $29.20 confluence hurdle breakpoint could be seen as a buying opportunity.
Silver (XAG/USD) regains positive traction during the Asian session on Wednesday and stalls the overnight modest pullback from the vicinity of the $30.00 psychological mark or over a one-month high. The white metal currently trades around mid-$29.00s and seems poised to prolong its recent goodish recovery from the lowest level since May touched earlier this month.
From a technical perspective, the emergence of dip-buying near the $29.20 confluence hurdle breakpoint– comprising the 50-day Simple Moving Average (SMA) and the 50% Fibonacci retracement level of the July-August slide – validates the positive outlook. Moreover, oscillators on the daily chart have been gaining positive traction and are far from being in the overbought zone. This, in turn, suggests that the path of least resistance for the XAG/USD is to the upside.
That said, the overnight failure near the $30.00 round figure makes it prudent to wait for some follow-through buying before positioning for a further near-term appreciating move. The XAG/USD might then climb to the $30.55-$30.60 area, or the 78.6% Fibo. level. The momentum could extend beyond the $31.00 mark, towards the $31.30-$31.40 supply zone en route to the July swing high, around the $31.75 region, the $32.00 level and the $32.50 area, or the YTD peak.
On the flip side, the $29.20 area might continue to act as an immediate strong support ahead of the $29.00 round-figure mark. A convincing break below the latter could make the XAG/USD vulnerable to accelerate the slide towards the $28.55 region, or the 38.2% Fibo. level, before eventually dropping to the $28.00 round figure. Failure to defend the said support levels might expose the $27.25 support and the next relevant support near the $27.00 mark.
Silver daily chart
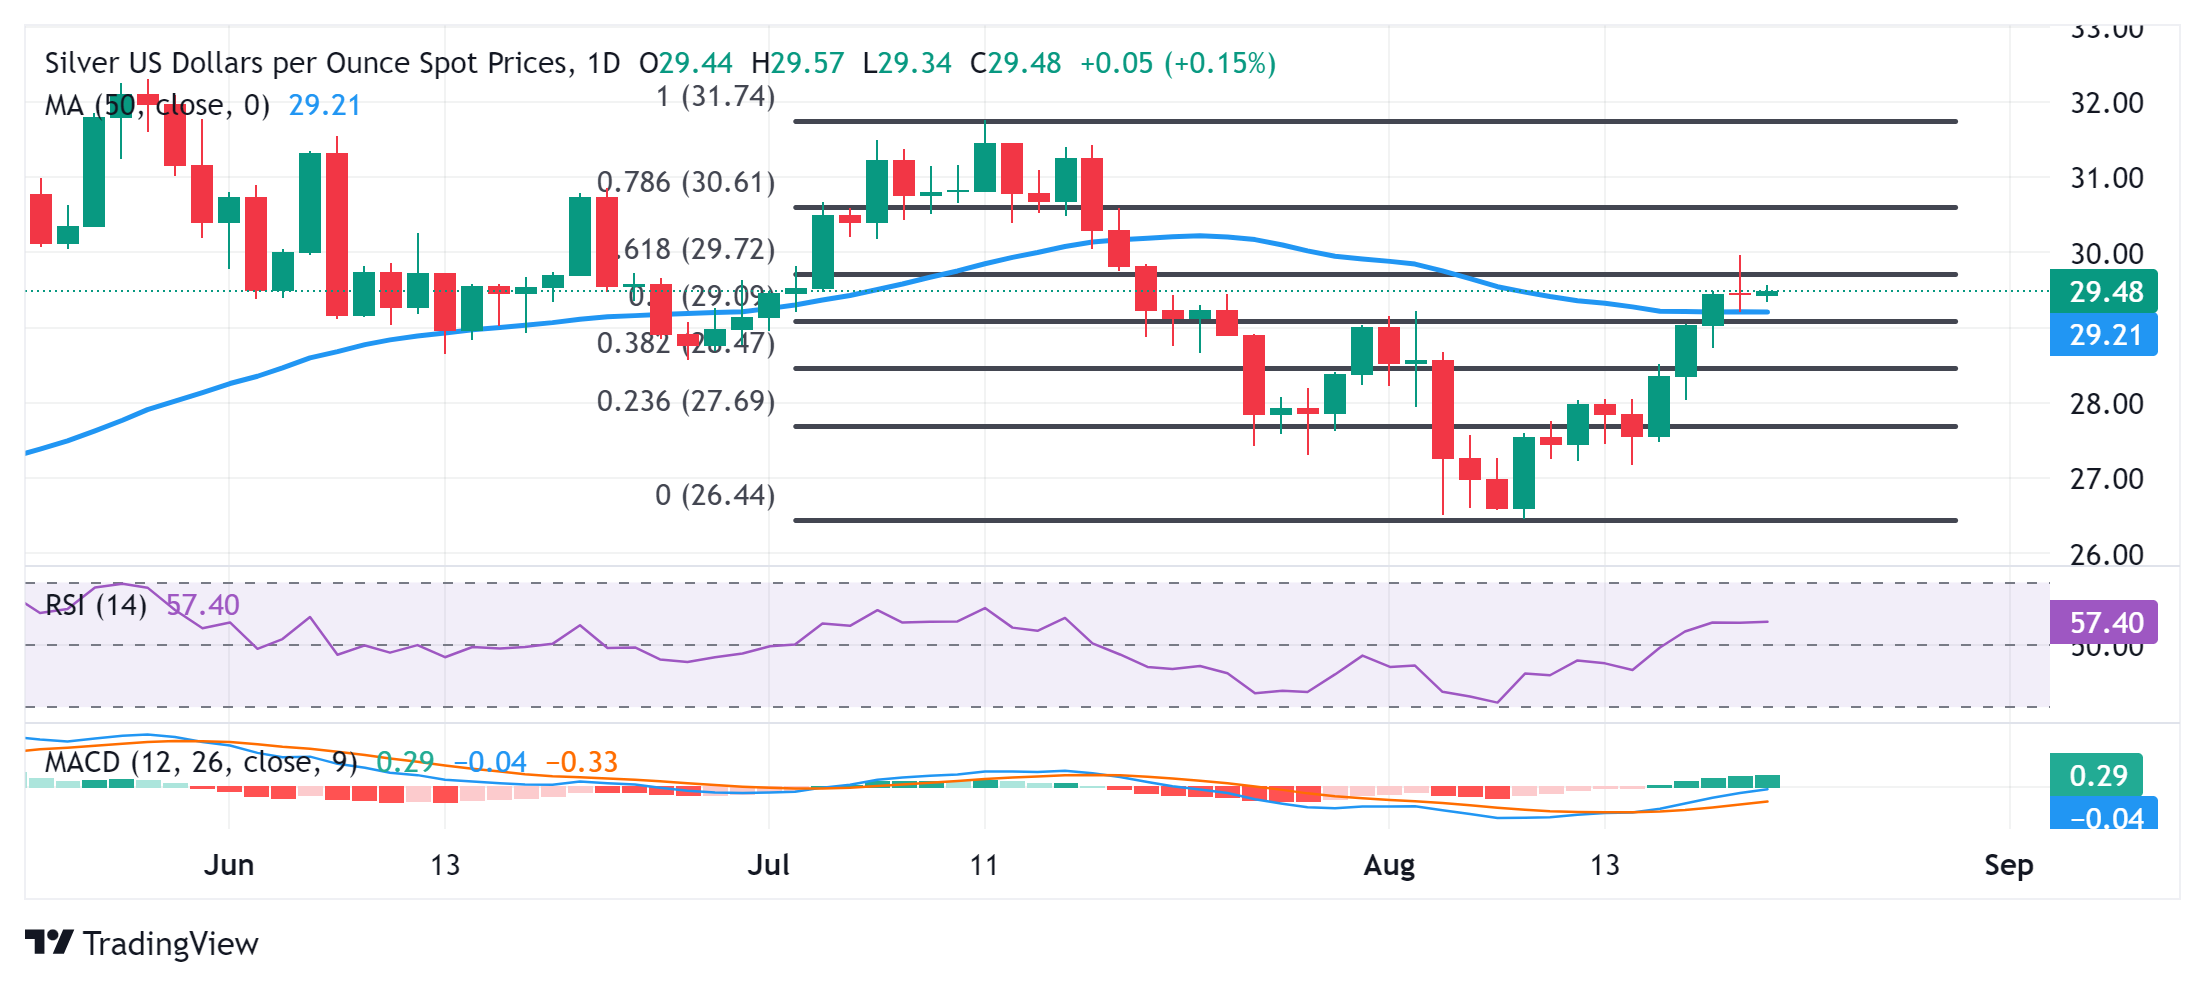
Silver FAQs
Silver is a precious metal highly traded among investors. It has been historically used as a store of value and a medium of exchange. Although less popular than Gold, traders may turn to Silver to diversify their investment portfolio, for its intrinsic value or as a potential hedge during high-inflation periods. Investors can buy physical Silver, in coins or in bars, or trade it through vehicles such as Exchange Traded Funds, which track its price on international markets.
Silver prices can move due to a wide range of factors. Geopolitical instability or fears of a deep recession can make Silver price escalate due to its safe-haven status, although to a lesser extent than Gold's. As a yieldless asset, Silver tends to rise with lower interest rates. Its moves also depend on how the US Dollar (USD) behaves as the asset is priced in dollars (XAG/USD). A strong Dollar tends to keep the price of Silver at bay, whereas a weaker Dollar is likely to propel prices up. Other factors such as investment demand, mining supply – Silver is much more abundant than Gold – and recycling rates can also affect prices.
Silver is widely used in industry, particularly in sectors such as electronics or solar energy, as it has one of the highest electric conductivity of all metals – more than Copper and Gold. A surge in demand can increase prices, while a decline tends to lower them. Dynamics in the US, Chinese and Indian economies can also contribute to price swings: for the US and particularly China, their big industrial sectors use Silver in various processes; in India, consumers’ demand for the precious metal for jewellery also plays a key role in setting prices.
Silver prices tend to follow Gold's moves. When Gold prices rise, Silver typically follows suit, as their status as safe-haven assets is similar. The Gold/Silver ratio, which shows the number of ounces of Silver needed to equal the value of one ounce of Gold, may help to determine the relative valuation between both metals. Some investors may consider a high ratio as an indicator that Silver is undervalued, or Gold is overvalued. On the contrary, a low ratio might suggest that Gold is undervalued relative to Silver.
- WTI struggles to gain traction and languishes near a two-week trough touched on Tuesday.
- A surprise rise in US crude inventories and easing Middle East tensions weigh on Oil prices.
- China’s economic woes keep bulls on the sidelines and act as a headwind for the commodity.
West Texas Intermediate (WTI) US crude Oil prices trade with a mild negative bias below the $73.00 mark during the Asian session on Wednesday and remain within the striking distance of a two-week low touched the previous day.
Concerns about supply disruptions from the Middle East eased after US Secretary of State Antony Blinken said on Monday that Israeli Prime Minister Benjamin Netanyahu had accepted a proposal to tackle disagreements blocking a ceasefire deal in Gaza. Apart from this, a surprise rise in US crude inventories continues undermining Crude Oil prices.
According to American Petroleum Institute figures released on Tuesday, US crude oil stocks rose by 347,000 barrels in the week ended August 16, which pointed to oversupply in the world's biggest consumer of oil. This comes on top of worries about a slowdown in China – the world's top Oil importer – and further acts as a headwind for the commodity.
Meanwhile, investors remain concerned about the ongoing clashes between Israel and Hamas, despite the ongoing ceasefire negotiations. Furthermore, Hamas said that the US-backed bridging proposal conveyed at the end of the talks in Doha on Friday was a reversal of what the parties had agreed on in early July, keeping investors on edge.
Apart from this, the prevalent US Dollar (USD) selling bias, fueled by the growing acceptance that the Federal Reserve (Fed) will begin its rate-cutting cycle in September, could lend some support to Crude Oil prices and help limit further losses. Traders now look to the official inventory data from the US Energy Information Administration (EIA) later today.
The focus, however, remains on geopolitical developments and the release of the July FOMC meeting minutes. The latter, along with Fed Chair Jerome Powell's speech at the Jackson Hole Symposium on Friday, should offer cues about the US central bank's policy path. This, in turn, will drive the USD and provide a fresh impetus to Crude Oil prices.
WTI Oil FAQs
WTI Oil is a type of Crude Oil sold on international markets. The WTI stands for West Texas Intermediate, one of three major types including Brent and Dubai Crude. WTI is also referred to as “light” and “sweet” because of its relatively low gravity and sulfur content respectively. It is considered a high quality Oil that is easily refined. It is sourced in the United States and distributed via the Cushing hub, which is considered “The Pipeline Crossroads of the World”. It is a benchmark for the Oil market and WTI price is frequently quoted in the media.
Like all assets, supply and demand are the key drivers of WTI Oil price. As such, global growth can be a driver of increased demand and vice versa for weak global growth. Political instability, wars, and sanctions can disrupt supply and impact prices. The decisions of OPEC, a group of major Oil-producing countries, is another key driver of price. The value of the US Dollar influences the price of WTI Crude Oil, since Oil is predominantly traded in US Dollars, thus a weaker US Dollar can make Oil more affordable and vice versa.
The weekly Oil inventory reports published by the American Petroleum Institute (API) and the Energy Information Agency (EIA) impact the price of WTI Oil. Changes in inventories reflect fluctuating supply and demand. If the data shows a drop in inventories it can indicate increased demand, pushing up Oil price. Higher inventories can reflect increased supply, pushing down prices. API’s report is published every Tuesday and EIA’s the day after. Their results are usually similar, falling within 1% of each other 75% of the time. The EIA data is considered more reliable, since it is a government agency.
OPEC (Organization of the Petroleum Exporting Countries) is a group of 13 Oil-producing nations who collectively decide production quotas for member countries at twice-yearly meetings. Their decisions often impact WTI Oil prices. When OPEC decides to lower quotas, it can tighten supply, pushing up Oil prices. When OPEC increases production, it has the opposite effect. OPEC+ refers to an expanded group that includes ten extra non-OPEC members, the most notable of which is Russia.
- USD/CAD extends its losses despite a market caution ahead of the FOMC Meeting Minutes release on Wednesday.
- Fed Governor Michelle Bowman expressed caution on any policy changes, citing ongoing upside risks to inflation.
- The Canadian dollar appreciates despite a dovish sentiment surrounding the Bank of Canada.
USD/CAD continues its losing streak, trading around 1.3620 during the Asian session on Wednesday. The US Dollar (USD) attempts to halt its three-day losing streak as traders turn cautious ahead of the release of the FOMC Minutes on Wednesday. Furthermore, traders await Fed Chair Jerome Powell's upcoming speech at Jackson Hole on Friday.
Federal Reserve (Fed) Governor Michelle Bowman expressed caution on Tuesday about making any policy changes, citing ongoing upside risks to inflation. Bowman warned that overreacting to individual data points could undermine the progress already achieved, according to Reuters.
CME FedWatch Tool suggests that the markets are now pricing in a nearly 67.5% odds of a 25 basis points (bps) Fed rate cut in its September meeting, down from 76% a day ago. The probability of a 50 basis points rate cut fell to 32.5% from 53.0% a week earlier.
The Canadian dollar strengthened despite soft domestic data that supports a dovish stance from the Bank of Canada (BoC). Furthermore, the commodity-linked CAD managed to hold its ground, even as crude Oil prices declined.
Canada's Consumer Price Index (CPI) eased to 2.5% year-on-year in July, down from 2.7% in the previous month, aligning with market expectations. This marks the slowest increase in consumer prices since March 2021. Additionally, the closely watched BoC Consumer Price Index Core fell to 1.7% YoY, from the previous 1.9% reading, reinforcing dovish expectations for the Bank of Canada.
West Texas Intermediate (WTI) Oil price extends its losing streak for the fourth successive session, trading around $72.90 per barrel at the time of writing, amid hopes for a ceasefire in the Middle East. US Secretary of State Antony Blinken confirmed that Israeli Prime Minister Benjamin Netanyahu accepted a proposal to resolve the issues delaying a Gaza ceasefire. However, tensions remain high as Hamas has threatened to resume suicide bombings, according to Reuters.
Canadian Dollar FAQs
The key factors driving the Canadian Dollar (CAD) are the level of interest rates set by the Bank of Canada (BoC), the price of Oil, Canada’s largest export, the health of its economy, inflation and the Trade Balance, which is the difference between the value of Canada’s exports versus its imports. Other factors include market sentiment – whether investors are taking on more risky assets (risk-on) or seeking safe-havens (risk-off) – with risk-on being CAD-positive. As its largest trading partner, the health of the US economy is also a key factor influencing the Canadian Dollar.
The Bank of Canada (BoC) has a significant influence on the Canadian Dollar by setting the level of interest rates that banks can lend to one another. This influences the level of interest rates for everyone. The main goal of the BoC is to maintain inflation at 1-3% by adjusting interest rates up or down. Relatively higher interest rates tend to be positive for the CAD. The Bank of Canada can also use quantitative easing and tightening to influence credit conditions, with the former CAD-negative and the latter CAD-positive.
The price of Oil is a key factor impacting the value of the Canadian Dollar. Petroleum is Canada’s biggest export, so Oil price tends to have an immediate impact on the CAD value. Generally, if Oil price rises CAD also goes up, as aggregate demand for the currency increases. The opposite is the case if the price of Oil falls. Higher Oil prices also tend to result in a greater likelihood of a positive Trade Balance, which is also supportive of the CAD.
While inflation had always traditionally been thought of as a negative factor for a currency since it lowers the value of money, the opposite has actually been the case in modern times with the relaxation of cross-border capital controls. Higher inflation tends to lead central banks to put up interest rates which attracts more capital inflows from global investors seeking a lucrative place to keep their money. This increases demand for the local currency, which in Canada’s case is the Canadian Dollar.
Macroeconomic data releases gauge the health of the economy and can have an impact on the Canadian Dollar. Indicators such as GDP, Manufacturing and Services PMIs, employment, and consumer sentiment surveys can all influence the direction of the CAD. A strong economy is good for the Canadian Dollar. Not only does it attract more foreign investment but it may encourage the Bank of Canada to put up interest rates, leading to a stronger currency. If economic data is weak, however, the CAD is likely to fall.
| Raw materials | Closed | Change, % |
|---|---|---|
| Silver | 29.435 | -0.13 |
| Gold | 251.408 | 0.41 |
| Palladium | 927.78 | -0.58 |
- Gold price shot to a fresh all-time peak on Tuesday amid dovish Fed-inspired USD selling bias.
- Geopolitical tensions further contributed to driving flows towards the safe-haven XAU/USD.
- Bulls take a pause and await more cues about the Fed’s rate-cut path before placing fresh bets.
Gold price (XAU/USD) climbed to a fresh record high, around the $2,531-2,532 area on Tuesday amid growing acceptance that the Federal Reserve (Fed) will soon start its policy easing cycle. The markets are currently pricing in a greater chance of a 25 basis points (bps) rate cut in September, which, in turn, boosted demand for the non-yielding yellow metal. Meanwhile, dovish Fed expectations continue to weigh on the US Treasury bond yields and the US Dollar (USD). In fact, the USD Index (DXY), which tracks the Greenback against a basket of currencies, dived to a fresh seven-month low and further underpinned the commodity.
Apart from this, the overnight modest pullback in the US equity markets turned out to be another factor that benefited the safe-haven Gold price. That said, the latest optimism that tensions in the Middle East were easing kept a lid on any further gains for the XAU/USD. Bulls also seemed reluctant and preferred to wait for the Fed Chair Jerome Powell's appearance at the Jackson Hole Symposium on Friday. This, along with the July FOMC meeting minutes, will be looked upon for cues about the Fed's policy path, which, in turn, will play a key role in driving the USD demand in the near term and provide some meaningful impetus to the metal.
Daily Digest Market Movers: Gold price remains supported by Fed rate cut bets, bearish USD and geopolitical risks
- Bets for an imminent start of the Federal Reserve's rate-cutting cycle in September have put the US Treasury bond yields and the US Dollar under pressure, which, in turn, lifted the Gold price to a fresh record high on Tuesday.
- According to the CME Group's FedWatch Tool, the markets are currently pricing in just over a 70% chance that the US central bank will lower borrowing costs by 25 basis points at the September FOMC monetary policy meeting.
- Moreover, a Reuters poll indicated that a slim majority of economists expect that the Fed will cut interest rates by 25 bps at each of the remaining three meetings of 2024, one more rate reduction than predicted last month.
- Fed Governor Michelle Bowman tried to temper expectations of a near-term rate cut and said that despite the recent progress, price growth levels remain well-elevated and still uncomfortably above the central bank's 2% goal.
- The People's Bank of China (PBOC) granted new gold import quotas to several Chinese banks last week in anticipation of reviving demand, suggesting that another Chinese gold buying spree could be on the horizon.
- Furthermore, holdings of SPDR Gold Trust, the world's largest gold-backed exchange-traded fund, jumped to their highest in seven months at 859 tons on Monday and pointed to improving financial investment demand.
- Meanwhile, geopolitical concerns, particularly in the Middle East and a potential ceasefire between Israel and Hamas, keep investors on edge and turn out to be another factor underpinning the safe-haven XAU/USD.
- Traders, however, turn cautious ahead of the release of the July FOMC meeting minutes later this Wednesday and Fed Chair Jerome Powell's speech on Friday, which will be looked for cues about the future policy path.
Technical Analysis: Gold price bulls retain control, last week’s breakout through the $2,480 level remains in play
From a technical perspective, last Friday's breakout through the triple top resistance, around the $2,479-2,480 region, and the subsequent strength beyond the $2,500 psychological mark was seen as a fresh trigger for bullish traders. Moreover, oscillators on the daily chart are holding comfortably in positive territory and are still away from being in the overbought zone. This, in turn, suggests that the path of least resistance for the Gold price is to the upside.
Hence, any meaningful pullback might still be seen as a buying opportunity near the $2,500 round figure, which should help the downside for the Gold price near the $2,480 resistance breakpoint. Some follow-through selling, however, could drag the XAU/USD towards the $2,455-2,453 horizontal support en route to the $2,430 region. A convincing break below the latter could drag the metal to the 50-day Simple Moving Average (SMA), currently pegged just below the $2,400 mark.
Gold FAQs
Gold has played a key role in human’s history as it has been widely used as a store of value and medium of exchange. Currently, apart from its shine and usage for jewelry, the precious metal is widely seen as a safe-haven asset, meaning that it is considered a good investment during turbulent times. Gold is also widely seen as a hedge against inflation and against depreciating currencies as it doesn’t rely on any specific issuer or government.
Central banks are the biggest Gold holders. In their aim to support their currencies in turbulent times, central banks tend to diversify their reserves and buy Gold to improve the perceived strength of the economy and the currency. High Gold reserves can be a source of trust for a country’s solvency. Central banks added 1,136 tonnes of Gold worth around $70 billion to their reserves in 2022, according to data from the World Gold Council. This is the highest yearly purchase since records began. Central banks from emerging economies such as China, India and Turkey are quickly increasing their Gold reserves.
Gold has an inverse correlation with the US Dollar and US Treasuries, which are both major reserve and safe-haven assets. When the Dollar depreciates, Gold tends to rise, enabling investors and central banks to diversify their assets in turbulent times. Gold is also inversely correlated with risk assets. A rally in the stock market tends to weaken Gold price, while sell-offs in riskier markets tend to favor the precious metal.
The price can move due to a wide range of factors. Geopolitical instability or fears of a deep recession can quickly make Gold price escalate due to its safe-haven status. As a yield-less asset, Gold tends to rise with lower interest rates, while higher cost of money usually weighs down on the yellow metal. Still, most moves depend on how the US Dollar (USD) behaves as the asset is priced in dollars (XAU/USD). A strong Dollar tends to keep the price of Gold controlled, whereas a weaker Dollar is likely to push Gold prices up.
- The Australian Dollar may advance its gains as RBA Minutes indicated current cash rates for longer.
- RBA’s August Meeting Minutes suggested that a rate cut is unlikely soon.
- The US Dollar may receive support from caution ahead of the FOMC Minutes release on Wednesday.
The Australian Dollar (AUD) holds ground, aiming to extend its gains against the US Dollar (USD) on Wednesday. The strength of the AUD/USD pair is reinforced after the Reserve Bank of Australia's (RBA) August Meeting Minutes indicated that the cash rate may remain unchanged for an extended period.
The RBA Minutes also showed that the board had considered a rate hike earlier this month before ultimately deciding that maintaining current rates would better balance the risks. Additionally, RBA members agreed that a rate cut is unlikely in the near future.
The US Dollar (USD) attempts to halt its losing streak as traders turn cautious ahead of the release of the FOMC Minutes on Wednesday. Furthermore, traders await Fed Chair Jerome Powell's upcoming speech at Jackson Hole on Friday.
Daily Digest Market Movers: Australian Dollar remains solid following RBA Minutes
- Federal Reserve (Fed) Governor Michelle Bowman expressed caution on Tuesday about making any policy changes, citing ongoing upside risks to inflation. Bowman warned that overreacting to individual data points could undermine the progress already achieved, according to Reuters.
- China is exploring a new approach to bolster its ailing real estate market by permitting local governments to use special bonds to purchase unsold properties. Local authorities have already utilized more than half of this year’s CNY 3.9 trillion ($546 billion) bond allocation, and it's unclear how much of the remaining funds could be redirected toward home purchases if the plan is implemented, according to Bloomberg.
- The People's Bank of China (PBoC) kept its one-year and five-year Loan Prime Rates (LPRs) unchanged at 3.35% and 3.85%, respectively, in August’s meeting on Tuesday. Any change in the Chinese economy may impact Australian markets as both are close trade partners.
- Minneapolis Fed President Neel Kashkari stated on Monday that it would be appropriate to discuss potential US interest rate cuts in September due to concerns about a weakening labor market, per Reuters.
- Federal Reserve Bank of San Francisco President Mary Daly emphasized Sunday that the US central bank should take a gradual approach to reducing borrowing costs, according to the Financial Times. Additionally, Federal Reserve Bank of Chicago President Austan Goolsbee warned that central bank officials should be cautious about keeping a restrictive policy in place longer than necessary, per CNBC.
- RBA Governor Michele Bullock expressed that the Australian central bank will not hesitate to raise rates again to combat inflation if needed. Those comments came just days after the RBA held rates steady at 4.35% for the sixth straight meeting.
Technical Analysis: Australian Dollar hovers near 0.6750, targets seven-month highs
The Australian Dollar trades around 0.6750 on Wednesday. Daily chart analysis shows the AUD/USD pair trending upwards within an ascending channel, reinforcing a bullish bias. Additionally, the 14-day Relative Strength Index (RSI) is slightly below the 70 mark, supporting the ongoing bullish momentum. However, further upward movement could indicate that the currency pair is overbought, potentially leading to a correction.
On the upside, the AUD/USD pair could test a seven-month high of 0.6798, followed by the upper boundary of the ascending channel at the 0.6820 level.
For support, the pair may find support around the lower boundary of the ascending channel, which is aligned with the nine-day Exponential Moving Average (EMA) at 0.6670 level. A drop below the nine-day EMA could see the pair test the throwback level at 0.6575, followed by the next throwback level at 0.6470.
AUD/USD: Daily Chart
Australian Dollar PRICE Today
The table below shows the percentage change of Australian Dollar (AUD) against listed major currencies today. Australian Dollar was the strongest against the Japanese Yen.
| USD | EUR | GBP | JPY | CAD | AUD | NZD | CHF | |
|---|---|---|---|---|---|---|---|---|
| USD | 0.08% | 0.06% | 0.15% | -0.00% | 0.01% | 0.06% | -0.03% | |
| EUR | -0.08% | -0.04% | 0.05% | -0.09% | -0.05% | -0.04% | -0.11% | |
| GBP | -0.06% | 0.04% | 0.11% | -0.03% | -0.04% | 0.00% | -0.06% | |
| JPY | -0.15% | -0.05% | -0.11% | -0.14% | -0.12% | -0.14% | -0.17% | |
| CAD | 0.00% | 0.09% | 0.03% | 0.14% | 0.03% | 0.03% | -0.02% | |
| AUD | -0.01% | 0.05% | 0.04% | 0.12% | -0.03% | 0.00% | -0.04% | |
| NZD | -0.06% | 0.04% | 0.00% | 0.14% | -0.03% | -0.00% | -0.05% | |
| CHF | 0.03% | 0.11% | 0.06% | 0.17% | 0.02% | 0.04% | 0.05% |
The heat map shows percentage changes of major currencies against each other. The base currency is picked from the left column, while the quote currency is picked from the top row. For example, if you pick the Australian Dollar from the left column and move along the horizontal line to the US Dollar, the percentage change displayed in the box will represent AUD (base)/USD (quote).
Australian Dollar FAQs
One of the most significant factors for the Australian Dollar (AUD) is the level of interest rates set by the Reserve Bank of Australia (RBA). Because Australia is a resource-rich country another key driver is the price of its biggest export, Iron Ore. The health of the Chinese economy, its largest trading partner, is a factor, as well as inflation in Australia, its growth rate and Trade Balance. Market sentiment – whether investors are taking on more risky assets (risk-on) or seeking safe-havens (risk-off) – is also a factor, with risk-on positive for AUD.
The Reserve Bank of Australia (RBA) influences the Australian Dollar (AUD) by setting the level of interest rates that Australian banks can lend to each other. This influences the level of interest rates in the economy as a whole. The main goal of the RBA is to maintain a stable inflation rate of 2-3% by adjusting interest rates up or down. Relatively high interest rates compared to other major central banks support the AUD, and the opposite for relatively low. The RBA can also use quantitative easing and tightening to influence credit conditions, with the former AUD-negative and the latter AUD-positive.
China is Australia’s largest trading partner so the health of the Chinese economy is a major influence on the value of the Australian Dollar (AUD). When the Chinese economy is doing well it purchases more raw materials, goods and services from Australia, lifting demand for the AUD, and pushing up its value. The opposite is the case when the Chinese economy is not growing as fast as expected. Positive or negative surprises in Chinese growth data, therefore, often have a direct impact on the Australian Dollar and its pairs.
Iron Ore is Australia’s largest export, accounting for $118 billion a year according to data from 2021, with China as its primary destination. The price of Iron Ore, therefore, can be a driver of the Australian Dollar. Generally, if the price of Iron Ore rises, AUD also goes up, as aggregate demand for the currency increases. The opposite is the case if the price of Iron Ore falls. Higher Iron Ore prices also tend to result in a greater likelihood of a positive Trade Balance for Australia, which is also positive of the AUD.
The Trade Balance, which is the difference between what a country earns from its exports versus what it pays for its imports, is another factor that can influence the value of the Australian Dollar. If Australia produces highly sought after exports, then its currency will gain in value purely from the surplus demand created from foreign buyers seeking to purchase its exports versus what it spends to purchase imports. Therefore, a positive net Trade Balance strengthens the AUD, with the opposite effect if the Trade Balance is negative.
The People’s Bank of China (PBOC) set the USD/CNY central rate for the trading session ahead on Wednesday at 7.1307, as against the previous day's fix of 7.1325 and 7.1303 Reuters estimates.
- USD/JPY weakens to 145.35 in Wednesday’s Asian session.
- Higher expectations of a Fed rate cut in September undermine the USD.
- The advanced US August S&P Global PMI will be due on Wednesday ahead of Fed Chair Powell’s speech.
The USD/JPY pair trades in negative territory near 145.35 for four consecutive days during the early Asian session on Wednesday. The softer US Dollar (USD) and expectation of a dovish message from Federal Reserve (Fed) Chair Jerome Powell at Jackson Hole drag the pair lower.
Investors are confident that the US Fed will cut interest rates this year, expecting three quarter-point Fed cuts in September, November and December. This, in turn, exerts some selling pressure on the Greenback. Some officials said a half-point Fed rate cut in September could not be ruled out if there were signs of a further slowdown in hiring.
Minneapolis Fed President Neel Kashkari said on Monday he would be open to cutting US interest rates in September because of the rising possibility that the labor market weakens too much. “The balance of risks has shifted, so the debate about potentially cutting rates in September is an appropriate one to have,” said Kashkari.
Meanwhile, Fed Governor Michelle Bowman said on Tuesday that she remains cautious about any shift in the policy because of what she sees as continued upside risks for inflation. She warned that overreacting to any single data point could jeopardize the progress already made.
The preliminary US S&P Global PMI for August will be due later on Wednesday. If the report shows a better than expected outcome, it could cap the downside for the USD. On Friday, Fed Chair Powell's speech at the Jackson Hole symposium will be in the spotlight.
On the JPY’s front, the upbeat Japanese Q2 Gross Domestic Product (GDP) growth might trigger the Bank of Japan (BoJ) to hike more rates this year, which boosts the Japanese Yen (JPY) broadly. The Japanese economy grew by 0.8% in the second quarter versus the forecast of 0.5%. Traders will take more cues from Japan’s National Consumer Price Index (CPI) for July, which is due on Friday.
Fed FAQs
Monetary policy in the US is shaped by the Federal Reserve (Fed). The Fed has two mandates: to achieve price stability and foster full employment. Its primary tool to achieve these goals is by adjusting interest rates. When prices are rising too quickly and inflation is above the Fed’s 2% target, it raises interest rates, increasing borrowing costs throughout the economy. This results in a stronger US Dollar (USD) as it makes the US a more attractive place for international investors to park their money. When inflation falls below 2% or the Unemployment Rate is too high, the Fed may lower interest rates to encourage borrowing, which weighs on the Greenback.
The Federal Reserve (Fed) holds eight policy meetings a year, where the Federal Open Market Committee (FOMC) assesses economic conditions and makes monetary policy decisions. The FOMC is attended by twelve Fed officials – the seven members of the Board of Governors, the president of the Federal Reserve Bank of New York, and four of the remaining eleven regional Reserve Bank presidents, who serve one-year terms on a rotating basis.
In extreme situations, the Federal Reserve may resort to a policy named Quantitative Easing (QE). QE is the process by which the Fed substantially increases the flow of credit in a stuck financial system. It is a non-standard policy measure used during crises or when inflation is extremely low. It was the Fed’s weapon of choice during the Great Financial Crisis in 2008. It involves the Fed printing more Dollars and using them to buy high grade bonds from financial institutions. QE usually weakens the US Dollar.
Quantitative tightening (QT) is the reverse process of QE, whereby the Federal Reserve stops buying bonds from financial institutions and does not reinvest the principal from the bonds it holds maturing, to purchase new bonds. It is usually positive for the value of the US Dollar.
| Index | Change, points | Closed | Change, % |
|---|---|---|---|
| NIKKEI 225 | 674.3 | 38062.92 | 1.8 |
| Hang Seng | -58.49 | 17511.08 | -0.33 |
| KOSPI | 22.27 | 2696.63 | 0.83 |
| ASX 200 | 17.3 | 7997.7 | 0.22 |
| DAX | -64.17 | 18357.52 | -0.35 |
| CAC 40 | 1.56 | 7485.73 | 0.02 |
| Dow Jones | -61.56 | 40834.97 | -0.15 |
| S&P 500 | -11.13 | 5597.12 | -0.2 |
| NASDAQ Composite | -59.83 | 17816.94 | -0.33 |
- Gold price holds steady near $2,515 in Wednesday’s early Asian session.
- The softer USD and bets of Fed easing monetary policy support the Gold price.
- The Fed Chair Powell's speech at the Jackson Hole symposium will take centre stage on Friday.
Gold price (XAU/USD) trades flat around $2,515 during the early Asian session on Wednesday. However, the weaker US Dollar (USD) and the expectation that the Federal Reserve (Fed) will likely cut interest rates in September might underpin the yellow metal.
The weaker US Dollar amid expectations of easing monetary policy by the Fed ahead of the Jackson Hole symposium might provide some support to the precious metal as it makes gold more attractive for other currency holders. Markets have priced in about a 67.5% possibility of the Fed cutting interest rates by 25 basis points (bps) in September, according to the CME FedWatch Tool.
"The primary drivers of the gold price move are financial investment demand, particularly with ETF buying improving and overall improved sentiment as the expectations of the Fed easing cycle begin in September," said Aakash Doshi, head of commodities, North America at Citi Research.
Traders will closely watch Fed Chair Powell's speech at the Jackson Hole symposium on Friday for more cues on rate cuts. Dovish comments from the Fed officials might further lift the yellow metal. Furthermore, the ongoing geopolitical tensions in the Middle East might boost the safe-haven asset demand, benefiting the Gold price.
On the other hand, signs of weaker physical demand in China might cap the upside for Gold. Data showed that the country’s Imports of the precious metal in July fell 24% to 44.6t, the lowest level in more than two years. The sluggish economy in China could weigh on the precious metal as China is the largest producer and consumer of gold.
Gold FAQs
Gold has played a key role in human’s history as it has been widely used as a store of value and medium of exchange. Currently, apart from its shine and usage for jewelry, the precious metal is widely seen as a safe-haven asset, meaning that it is considered a good investment during turbulent times. Gold is also widely seen as a hedge against inflation and against depreciating currencies as it doesn’t rely on any specific issuer or government.
Central banks are the biggest Gold holders. In their aim to support their currencies in turbulent times, central banks tend to diversify their reserves and buy Gold to improve the perceived strength of the economy and the currency. High Gold reserves can be a source of trust for a country’s solvency. Central banks added 1,136 tonnes of Gold worth around $70 billion to their reserves in 2022, according to data from the World Gold Council. This is the highest yearly purchase since records began. Central banks from emerging economies such as China, India and Turkey are quickly increasing their Gold reserves.
Gold has an inverse correlation with the US Dollar and US Treasuries, which are both major reserve and safe-haven assets. When the Dollar depreciates, Gold tends to rise, enabling investors and central banks to diversify their assets in turbulent times. Gold is also inversely correlated with risk assets. A rally in the stock market tends to weaken Gold price, while sell-offs in riskier markets tend to favor the precious metal.
The price can move due to a wide range of factors. Geopolitical instability or fears of a deep recession can quickly make Gold price escalate due to its safe-haven status. As a yield-less asset, Gold tends to rise with lower interest rates, while higher cost of money usually weighs down on the yellow metal. Still, most moves depend on how the US Dollar (USD) behaves as the asset is priced in dollars (XAU/USD). A strong Dollar tends to keep the price of Gold controlled, whereas a weaker Dollar is likely to push Gold prices up.
| Pare | Closed | Change, % |
|---|---|---|
| AUDUSD | 0.67438 | 0.18 |
| EURJPY | 161.526 | -0.61 |
| EURUSD | 1.11286 | 0.39 |
| GBPJPY | 189.129 | -0.7 |
| GBPUSD | 1.30308 | 0.3 |
| NZDUSD | 0.61521 | 0.67 |
| USDCAD | 1.36221 | -0.07 |
| USDCHF | 0.85395 | -1 |
| USDJPY | 145.144 | -0.98 |
- The New Zealand Dollar extends its upside in Wednesday’s early Asian session.
- The softer US Dollar and positive risk sentiment support NZD/USD.
- Investors will focus on the first reading of US August S&P Global PMI on Wednesday.
The New Zealand Dollar (NZD) edges higher on Wednesday as the USD Index (DXY) extended its decline to near yearly lows. The improved risk sentiment after China rolled out further measures to support the real estate sector boosts the Kiwi as China is New Zealand's largest trading partner.
On the other hand, the dovish remarks from the Reserve Bank of New Zealand (RBNZ) after a surprise rate cut last week might limit the pair’s upside. Investors will keep an eye on the preliminary US S&P Global PMI for August, which is due on Wednesday. All eyes will be on Fed Chair Powell's speech at the Jackson Hole symposium on Friday. Any dovish comments from Powell are likely to undermine the USD and create a tailwind for NZD/USD.
Daily Digest Market Movers: New Zealand Dollar remains strong amid a dovish Fed
- The People’s Bank of China (PBOC) decided to hold the one-year and five-year Loan Prime Rates (LPR) steady on Tuesday at 3.35% and 3.85%, respectively.
- China implemented further measures to boost the real estate sector. At least 10 city governments in China have relaxed or scrapped new-home price guidelines to allow market demand to play a bigger role, per Bloomberg.
- New Zealand’s Trade Balance arrived at NZD -$9.29B YoY in July versus $-9.5B prior. Exports decreased to $6.15B in July versus $6.17B in June, whereas Imports increased to $7.11B compared to $5.45B in previous readings.
- Federal Reserve (Fed) Governor Michelle Bowman said on Tuesday that she remains cautious about any shift in the policy because of what she sees as continued upside risks for inflation. She warned that overreacting to any single data point could jeopardize the progress already made, per Reuters.
- The markets are now pricing in a nearly 67.5% odds of a 25 basis points (bps) Fed rate cut in its September meeting, down from 77% on Tuesday, according to the CME FedWatch Tool.
Technical Analysis: New Zealand Dollar resumes its constructive outlook
The New Zealand Dollar trades on a stronger note on the day. The NZD/USD pair keeps the bullish vibe on the daily chart as the pair holds above the descending trendline and the key 100-day Exponential Moving Average (EMA). The upward momentum is bolstered by the 14-day Relative Strength Index (RSI), which stands above the midline near 65.60, suggesting that further upside looks favorable.
The immediate resistance level emerges at 0.6222, the high of June 12. Further north, the next hurdle is seen at 0.6279, a high of January 12. The additional upside filter to watch is 0.6360, a high of December 29, 2023.
On the downside, the 0.6130 psychological mark acts as an initial support level for the pair. The next contention level is located near the resistance-turned-support level at 0.6070. Sustained trading below this level could lead to a drop towards 0.5974, the low of August 15.

New Zealand Dollar FAQs
The New Zealand Dollar (NZD), also known as the Kiwi, is a well-known traded currency among investors. Its value is broadly determined by the health of the New Zealand economy and the country’s central bank policy. Still, there are some unique particularities that also can make NZD move. The performance of the Chinese economy tends to move the Kiwi because China is New Zealand’s biggest trading partner. Bad news for the Chinese economy likely means less New Zealand exports to the country, hitting the economy and thus its currency. Another factor moving NZD is dairy prices as the dairy industry is New Zealand’s main export. High dairy prices boost export income, contributing positively to the economy and thus to the NZD.
The Reserve Bank of New Zealand (RBNZ) aims to achieve and maintain an inflation rate between 1% and 3% over the medium term, with a focus to keep it near the 2% mid-point. To this end, the bank sets an appropriate level of interest rates. When inflation is too high, the RBNZ will increase interest rates to cool the economy, but the move will also make bond yields higher, increasing investors’ appeal to invest in the country and thus boosting NZD. On the contrary, lower interest rates tend to weaken NZD. The so-called rate differential, or how rates in New Zealand are or are expected to be compared to the ones set by the US Federal Reserve, can also play a key role in moving the NZD/USD pair.
Macroeconomic data releases in New Zealand are key to assess the state of the economy and can impact the New Zealand Dollar’s (NZD) valuation. A strong economy, based on high economic growth, low unemployment and high confidence is good for NZD. High economic growth attracts foreign investment and may encourage the Reserve Bank of New Zealand to increase interest rates, if this economic strength comes together with elevated inflation. Conversely, if economic data is weak, NZD is likely to depreciate.
The New Zealand Dollar (NZD) tends to strengthen during risk-on periods, or when investors perceive that broader market risks are low and are optimistic about growth. This tends to lead to a more favorable outlook for commodities and so-called ‘commodity currencies’ such as the Kiwi. Conversely, NZD tends to weaken at times of market turbulence or economic uncertainty as investors tend to sell higher-risk assets and flee to the more-stable safe havens.


© 2000-2026. Sva prava zaštićena.
Sajt je vlasništvo kompanije Teletrade D.J. LLC 2351 LLC 2022 (Euro House, Richmond Hill Road, Kingstown, VC0100, St. Vincent and the Grenadines).
Svi podaci koji se nalaze na sajtu ne predstavljaju osnovu za donošenje investicionih odluka, već su informativnog karaktera.
The company does not serve or provide services to customers who are residents of the US, Canada, Iran, The Democratic People's Republic of Korea, Yemen and FATF blacklisted countries.
Izvršenje trgovinskih operacija sa finansijskim instrumentima upotrebom marginalne trgovine pruža velike mogućnosti i omogućava investitorima ostvarivanje visokih prihoda. Međutim, takav vid trgovine povezan je sa potencijalno visokim nivoom rizika od gubitka sredstava. Проведение торговых операций на финанcовых рынках c маржинальными финанcовыми инcтрументами открывает широкие возможноcти, и позволяет инвеcторам, готовым пойти на риcк, получать выcокую прибыль, но при этом неcет в cебе потенциально выcокий уровень риcка получения убытков. Iz tog razloga je pre započinjanja trgovine potrebno odlučiti o izboru odgovarajuće investicione strategije, uzimajući u obzir raspoložive resurse.
Upotreba informacija: U slučaju potpunog ili delimičnog preuzimanja i daljeg korišćenja materijala koji se nalazi na sajtu, potrebno je navesti link odgovarajuće stranice na sajtu kompanije TeleTrade-a kao izvora informacija. Upotreba materijala na internetu mora biti praćena hiper linkom do web stranice teletrade.org. Automatski uvoz materijala i informacija sa stranice je zabranjen.
Ako imate bilo kakvih pitanja, obratite nam se pr@teletrade.global.
транcфери