- Analiza
- Novosti i instrumenti
- Vesti sa tržišta
Forex-novosti i prognoze od 21-05-2024
Federal Reserve Bank of Boston President Susan Collins spoke at “Central Banking in the Post-Pandemic Financial System” on Wednesday. Collins said that progress toward interest rate adjustment will take longer.
Fed policymakers stick to cautious script after April CPI inflation sparked rate cut hopes
Key quotes
Elevated uncertainty continues to be a feature of the economy, can't overreact to any data point.
Progress needed for interest rate adjustment will take longer.
Fed well positioned, time for patience.
Policy restrictions evident in some indicators.
Warns of potential longer policy lags due to special factors.
Medium-term underlying neutral rate could be higher.
Patience is the right policy for the Fed.
Market reaction
The US Dollar Index (DXY) is trading 0.04% lower on the day at 104.60, as of writing.
Fed FAQs
Monetary policy in the US is shaped by the Federal Reserve (Fed). The Fed has two mandates: to achieve price stability and foster full employment. Its primary tool to achieve these goals is by adjusting interest rates. When prices are rising too quickly and inflation is above the Fed’s 2% target, it raises interest rates, increasing borrowing costs throughout the economy. This results in a stronger US Dollar (USD) as it makes the US a more attractive place for international investors to park their money. When inflation falls below 2% or the Unemployment Rate is too high, the Fed may lower interest rates to encourage borrowing, which weighs on the Greenback.
The Federal Reserve (Fed) holds eight policy meetings a year, where the Federal Open Market Committee (FOMC) assesses economic conditions and makes monetary policy decisions. The FOMC is attended by twelve Fed officials – the seven members of the Board of Governors, the president of the Federal Reserve Bank of New York, and four of the remaining eleven regional Reserve Bank presidents, who serve one-year terms on a rotating basis.
In extreme situations, the Federal Reserve may resort to a policy named Quantitative Easing (QE). QE is the process by which the Fed substantially increases the flow of credit in a stuck financial system. It is a non-standard policy measure used during crises or when inflation is extremely low. It was the Fed’s weapon of choice during the Great Financial Crisis in 2008. It involves the Fed printing more Dollars and using them to buy high grade bonds from financial institutions. QE usually weakens the US Dollar.
Quantitative tightening (QT) is the reverse process of QE, whereby the Federal Reserve stops buying bonds from financial institutions and does not reinvest the principal from the bonds it holds maturing, to purchase new bonds. It is usually positive for the value of the US Dollar.
Federal Reserve Bank of Cleveland President Loretta Mester spoke at “Central Banking in the Post-Pandemic Financial System” on Wednesday. Mester said that keeping rates restrictive is not that concerning right now, given the strength of the jobs market.
Fed policymakers stick to cautious script after April CPI inflation sparked rate cut hopes
Key quotes
Expects economic growth above trend this year.
Unclear where inflation is headed.
Inflation will decrease, but it will take longer.
Keeping rates restrictive is not that big a risk right now given the strength of the jobs market.
Policy positioned well, will need to monitor data.
Holding steady now, healthy jobs market.
Market reaction
The US Dollar Index (DXY) is trading 0.05% lower on the day at 104.60, as of writing.
Fed FAQs
Monetary policy in the US is shaped by the Federal Reserve (Fed). The Fed has two mandates: to achieve price stability and foster full employment. Its primary tool to achieve these goals is by adjusting interest rates. When prices are rising too quickly and inflation is above the Fed’s 2% target, it raises interest rates, increasing borrowing costs throughout the economy. This results in a stronger US Dollar (USD) as it makes the US a more attractive place for international investors to park their money. When inflation falls below 2% or the Unemployment Rate is too high, the Fed may lower interest rates to encourage borrowing, which weighs on the Greenback.
The Federal Reserve (Fed) holds eight policy meetings a year, where the Federal Open Market Committee (FOMC) assesses economic conditions and makes monetary policy decisions. The FOMC is attended by twelve Fed officials – the seven members of the Board of Governors, the president of the Federal Reserve Bank of New York, and four of the remaining eleven regional Reserve Bank presidents, who serve one-year terms on a rotating basis.
In extreme situations, the Federal Reserve may resort to a policy named Quantitative Easing (QE). QE is the process by which the Fed substantially increases the flow of credit in a stuck financial system. It is a non-standard policy measure used during crises or when inflation is extremely low. It was the Fed’s weapon of choice during the Great Financial Crisis in 2008. It involves the Fed printing more Dollars and using them to buy high grade bonds from financial institutions. QE usually weakens the US Dollar.
Quantitative tightening (QT) is the reverse process of QE, whereby the Federal Reserve stops buying bonds from financial institutions and does not reinvest the principal from the bonds it holds maturing, to purchase new bonds. It is usually positive for the value of the US Dollar.
- GBP/USD trades sideways near 1.2710 in Wednesday’s early Asian session.
- Fed officials stick to cautious approach after April CPI inflation sparked rate cut hopes.
- BoE’s Bailey said the next move on rates will be a cut, adding he expected easing in April inflation data.
The GBP/USD pair remains confined around 1.2710 during the early Asian session on Wednesday. Financial markets await fresh impetus, with the release of the UK Consumer Price Index (CPI) and FOMC Minutes due on Wednesday.
Federal Reserve (Fed) Governor Christopher Waller, who has recently been hawkish, said on Tuesday that he does not think further rate hikes will be necessary, adding that he will need some convincing data before he backs cuts anytime soon. Meanwhile, Atlanta Fed President Raphael Bostic noted that the US central bank has to be cautious about the first-rate move. Bostic further stated that he would “rather wait longer for a rate cut to be sure inflation does not start to bounce around.”
Fed officials remain cautious about the timing of interest rate cuts as the hotter-than-expected inflation data dampens the hope of easing policy. Financial markets expect the first cut will happen in September at the earliest, with two reductions of a quarter percentage point before the end of the year, according to the CME Group’s FedWatch tool. This, in turn, might lift the Greenback and cap the upside of the pair’s upside in the near term.
On the other hand, Bank of England (BoE) Governor Andrew Bailey said that “the next move on rates will be a cut,” adding that he expected a fall in the April inflation data. The final reading of the headline UK Consumer Price Index is estimated to show an increase of 2.1% YoY in April, compared to 3.2% in the previous meeting. The core CPI inflation is projected to drop to 3.6% YoY in April from 4.2% in March. These reports could have greater relevance in determining when the cycle's first rate cut will occur. The hotter figures could delay the timing of a rate cut and provide some support to the Pound Sterling (GBP).
- AUD/USD remains virtually unchanged at 0.6668, following a 0.03% loss against the US Dollar.
- Fed officials Bostic, Waller, and Barr highlight the priority of achieving a 2% inflation goal, delaying rate cut hints.
- RBA meeting minutes reveal hawkish considerations, though ANZ economists predict a modest easing cycle with three rate cuts.
The Australian Dollar registered losses of 0.03% against the US Dollar as Federal Reserve officials hitting the wires were reluctant to hint at when rate cuts begin. Consequently, US Treasury bond yields fell, while the Greenback stood tall, flat at around 104.62. The AUD/USD trades at 0.6668, virtually unchanged as Wednesday’s Asian session begins.
AUD/USD falls despite hawkish RBA’s minutes, offset by Fed officials' focus on inflation
Wall Street finished the session with gains ahead of the release of NVIDIA’s earnings. Fed officials led by Atlanta’s Fed President Bostic and Governors Waller and Barr crossed the newswires.
Bostic stated he isn’t in a hurry to lower rates and emphasized the Fed’s job to achieve the 2% goal, saying that it’s the bank’s priority. Lately, Fed Governor Waller stated that despite seeing progress on inflation after April’s inflation data, he needs to see subsequent months of inflation trending lower. Lastly, Vice-Chair Barr remarked, "We still need to finish the job on inflation."
Even though Fed commentary was slightly “hawkish,” US Treasury yields dropped, but the US Dollar remained steady. That said, North American traders brace for the release of the Federal Open Market Committee (FOMC) minutes on Wednesday.
On the Australian side, the minutes of the Reserve Bank of Australia’s (RBA) last meeting were tilted hawkish as RBA board members considered a rate hike during their discussions. ANZ economists , in a note, wrote,“We continue to think that the economy is softening enough to deliver in target inflation and hence retain our view that the next move in the cash rate is down.” They estimate a modest easing cycle with just three rate cuts.
The US economic docket for the week before the latest Fed meeting minutes was released on Wednesday. On Thursday, US Initial Jobless Claims and the Chicago Fed National Activity Index are expected to show the labor market is cooling.
AUD/USD Price Analysis: Technical outlook
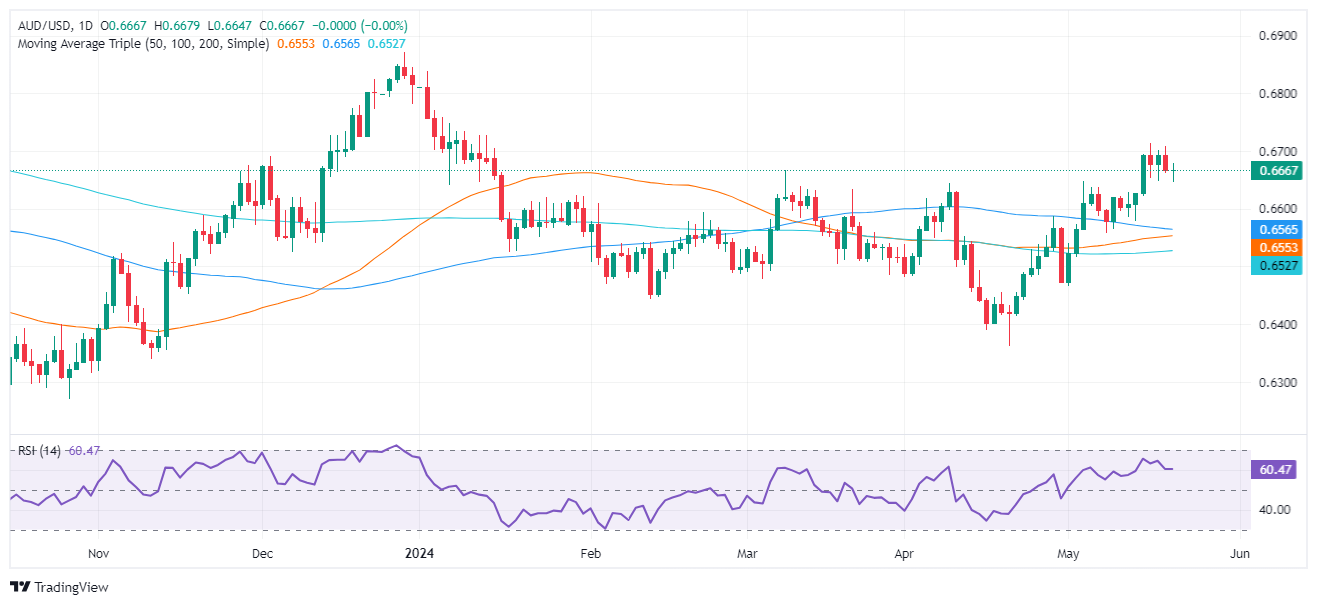
The AUD/USD is consolidating around the 0.6600-0.6714 area, with momentum favoring a continuation of the uptrend. The Relative Strength Index (RSI) hints buyers are in charge, though they are taking a breather as the RSI remains flat.
With that said, if buyers reclaim 0.6714, the next resistance level would be January 12 high at 0.6728. Once surpassed, the next stop would be the 0.6800 psychological level, followed by the December 28 high at 0.6871.
Conversely, if sellers drag the AUD/USD exchange rate below 0.6650, look for a retest of 0.6600. Further losses lie at the 100-day moving average (DMA) at 0.6563.
- EUR/USD cycled familiar levels on Tuesday as investors await a reason to move.
- Wednesday kicks off key date slated for the back half of the trading week.
- Fedspeak dominates headlines, tempering risk appetite.
EuR/USD stuck closely to familiar levels on a sedate Tuesday market session. Talking points from Federal Reserve (Fed) officials dominated headlines, but provided little new information for investors to digest, keeping risk appetite suppressed and stapling bids close to opening prices.
Forex Today: No progress ahead of FOMC Minutes
Read more: Fed policymakers stick to cautious script after April CPI inflation sparked rate cut hopes
The latest Meeting Minutes from the Federal Reserve (Fed) will be published on Wednesday, and investors will be looking for any signs of a structural shift in the Fed’s internal dialogue regarding rate cuts. Thursday follows up with Purchasing Managers Index (PMI) activity figures from both the EU and the US, and Friday will round out the trading week with US Durable Goods Orders.
EUR/USD technical outlook
The Euro (EUR) is close to flat against the US Dollar (USD) this week, trading within a fifth of a percent from Monday’s opening bids. EUR/USD is caught on the high side of a near-term upswing, and the pair is under threat of a bearish pullback to the 200-day Exponential Moving Average (EMA) at 1.0786 after failing to break north of the 1.0900 handle.
EUR/USD daily chart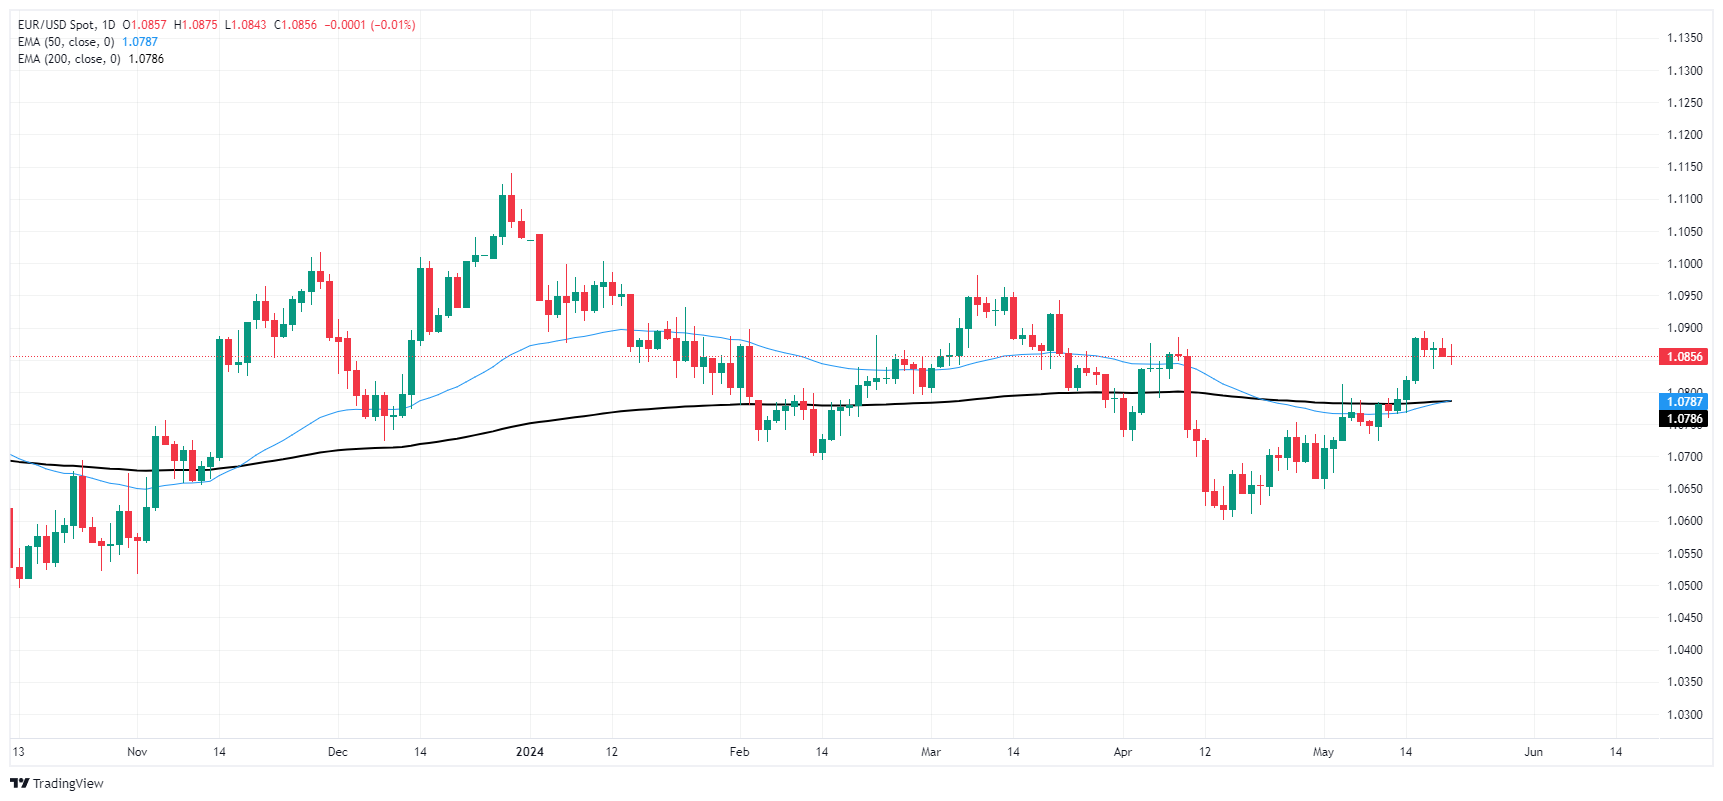
- Silver is up 0.47%, just below Monday's eight-year high of $32.51.
- Strong upward momentum continues; RSI suggests further gains possible despite overbought conditions.
- Resistance levels at $32.51, $33.00, and October 2012 high of $35.40.
- Supports at May 20 low of $30.95, April 12 high of $29.79, and $28.00 psychological level.
Silver's price advanced 0.47% on Tuesday but remains trading below a significant eight-year high reached on Monday at $32.51. At the time of writing, the XAG/USD is at $31.96 after hitting a daily low of $31.80.
XAG/USD Price Analysis: Technical outlook
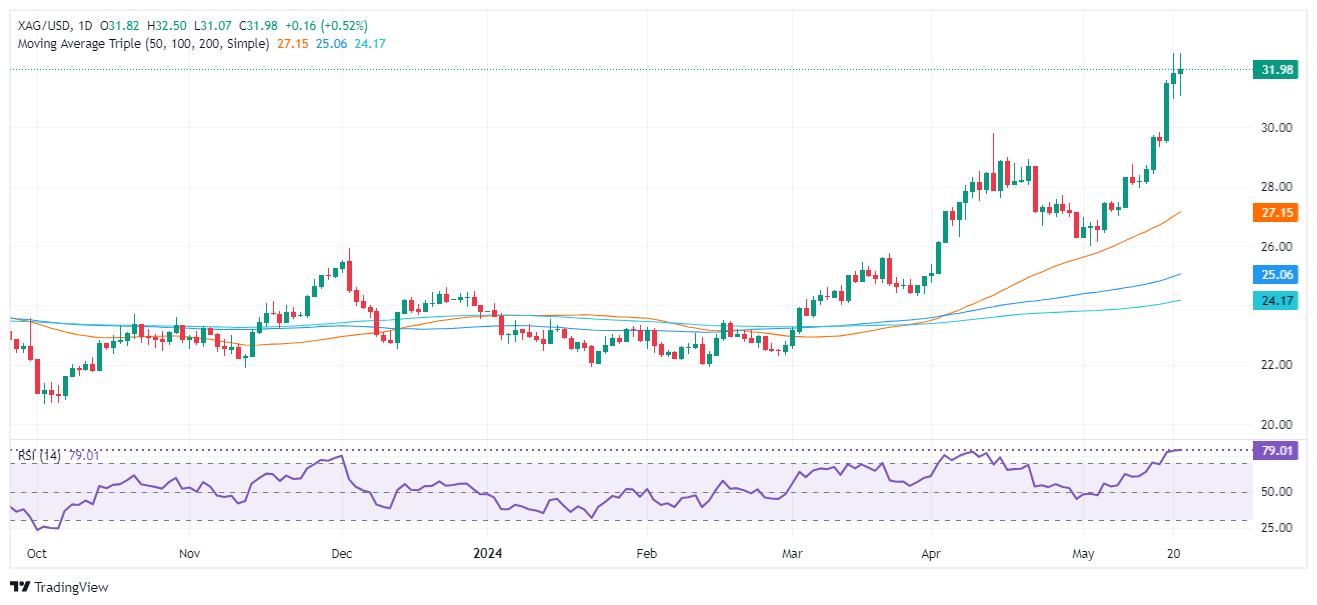
The grey metal remains upward biased even though it failed to crack the year-to-date (YTD) high of $32.51. Although the Relative Strength Index (RSI) is overbought, momentum is on the side of the buyers. Due to the uptrend's strength and speed, RSI remains shy of reaching overbought levels under strong trending conditions. In a strong uptrend, the RSI is considered overbought at 80.00.
With that said, if XAG/USD clears $32.51, further upside is seen as Silver’s next resistance emerges at $33.00. A breach of the latter could expose October’s 2012 high of $35.40.
Conversely, if Silver drops below the May 20 daily low of $30.95, further losses lie ahead. The next demand zone would be the April 12 high of $29.79, followed by the psychological figure of $28.00.
XAG/USD Price Action – Daily Chart
- The Reserve Bank of New Zealand is widely anticipated to maintain the OCR at 5.50%
- The language in the policy statement is expected to remain hawkish.
- The New Zealand Dollar has room to extend its bullish momentum against the US Dollar.
The Reserve Bank of New Zealand (RBNZ) will announce its monetary policy decision on Wednesday at 02:00 GMT and is widely expected to maintain the Official Cash Rate (OCR) at 5.50%.
Ahead of the announcement, the New Zealand Dollar (NZD) trades around the 0.6100 threshold against the United States Dollar (USD), consolidating last week's gains that drove NZD/USD to its highest level since mid-March.
What to expect from the RBNZ interest rate decision?
Market participants anticipate an on-hold decision, but given that the RBNZ holds monetary policy meetings only seven times per year, each announcement could vary from the previous and trigger sharp market reactions.
New Zealand policymakers look at quarterly inflation and employment data, and the latest available figures showed New Zealand's Consumer Price Index (CPI) increased 4.0% in the 12 months to the March 2024 quarter, according to figures released by Stats NZ, following a 4.7% increase in the 12 months to the December 2023 quarter. It was the lowest reading since the second quarter of 2021, although inflation held above the central bank’s goal of keeping it within 1% to 3%.
Regarding employment, March quarter data from Stats NZ showed the unemployment rate surged to 4.3% from 4% in the previous quarter, while the seasonally adjusted number of unemployed people rose to 134,000 (up 10,000) over the quarter. As it happens with other major economies, the labor market gave tepid signs of loosening, which are still far away from enough to abandon the tight monetary policy.
The central bank releases a Monetary Policy Review three times per year, the latest published in April 2024 and the next in mid-July, meaning the focus will be on the statement and any relevant change to the wording. Investors will pay close attention to Governor Adrian Orr's words, who previously noted that the local economy evolved broadly as anticipated by the committee, adding “core inflation and most measures of inflation expectations have declined, and the risks to the inflation outlook have become more balanced.” However, he also added that with headline inflation above the central bank’s target band, the Committee has limited ability to “tolerate upside inflation surprises.”
With that in mind, policymakers are widely anticipated to maintain the hawkish tilt, as they have little room to manoeuvre. As a result, the NZD/USD could jump to fresh multi-month highs.
How will the RBNZ interest decision impact the New Zealand Dollar?
The NZD/USD pair is undergoing a bearish correction, but the overall stance is bullish amid the broad US Dollar’s weakness. The Greenback has been on the back foot ever since market participants finally understood that the Federal Reserve (Fed) will maintain interest rates at record highs for most of 2024.
Valeria Bednarik, FXStreet’s Chief Analyst, says: “NZD/USD has room to extend gains beyond the recent multi-month high at 0.6146, facing the next hurdle in the 0.6170 price zone, as the daily chart shows multiple relevant highs and lows in the area. The pair can rally with no actual impact of the Committee’s wording, seen as hawkish, as previously noted. On the contrary, a dovish tilt could force NZD/USD to extend its bearish correction, with strong static support in the 0.6050 region.”
Bednarik adds: “Technical readings in the daily chart support the bullish case. NZD/USD develops above all its key moving averages, with the 20 Simple Moving Average (SMA) firmly advancing below the longer ones. A mildly bearish 100 SMA provides interim support around 0.6070 en route to the stronger one previously mentioned. Finally, technical indicators have barely retreated from near overbought levels, lacking downward strength, usually a sign of absent selling interest.”
Economic Indicator
RBNZ Interest Rate Decision
The Reserve Bank of New Zealand (RBNZ) announces its interest rate decision after its seven scheduled annual policy meetings. If the RBNZ is hawkish and sees inflationary pressures rising, it raises the Official Cash Rate (OCR) to bring inflation down. This is positive for the New Zealand Dollar (NZD) since higher interest rates attract more capital inflows. Likewise, if it reaches the view that inflation is too low it lowers the OCR, which tends to weaken NZD.
Read more.Next release: Wed May 22, 2024 02:00
Frequency: Irregular
Consensus: 5.5%
Previous: 5.5%
Source: Reserve Bank of New Zealand
The Reserve Bank of New Zealand (RBNZ) holds monetary policy meetings seven times a year, announcing their decision on interest rates and the economic assessments that influenced their decision. The central bank offers clues on the economic outlook and future policy path, which are of high relevance for the NZD valuation. Positive economic developments and upbeat outlook could lead the RBNZ to tighten the policy by hiking interest rates, which tends to be NZD bullish. The policy announcements are usually followed by Governor Adrian Orr’s press conference.
RBNZ FAQs
The Reserve Bank of New Zealand (RBNZ) is the country’s central bank. Its economic objectives are achieving and maintaining price stability – achieved when inflation, measured by the Consumer Price Index (CPI), falls within the band of between 1% and 3% – and supporting maximum sustainable employment.
The Reserve Bank of New Zealand’s (RBNZ) Monetary Policy Committee (MPC) decides the appropriate level of the Official Cash Rate (OCR) according to its objectives. When inflation is above target, the bank will attempt to tame it by raising its key OCR, making it more expensive for households and businesses to borrow money and thus cooling the economy. Higher interest rates are generally positive for the New Zealand Dollar (NZD) as they lead to higher yields, making the country a more attractive place for investors. On the contrary, lower interest rates tend to weaken NZD.
Employment is important for the Reserve Bank of New Zealand (RBNZ) because a tight labor market can fuel inflation. The RBNZ’s goal of “maximum sustainable employment” is defined as the highest use of labor resources that can be sustained over time without creating an acceleration in inflation. “When employment is at its maximum sustainable level, there will be low and stable inflation. However, if employment is above the maximum sustainable level for too long, it will eventually cause prices to rise more and more quickly, requiring the MPC to raise interest rates to keep inflation under control,” the bank says.
In extreme situations, the Reserve Bank of New Zealand (RBNZ) can enact a monetary policy tool called Quantitative Easing. QE is the process by which the RBNZ prints local currency and uses it to buy assets – usually government or corporate bonds – from banks and other financial institutions with the aim to increase the domestic money supply and spur economic activity. QE usually results in a weaker New Zealand Dollar (NZD). QE is a last resort when simply lowering interest rates is unlikely to achieve the objectives of the central bank. The RBNZ used it during the Covid-19 pandemic.
- GBP/JPY held steady in thin Tuesday markets.
- Japanese data remains strictly mid-tier this week.
- UK slated to bring key data through the back half of the trading week.
GBP/JPY remains in a tight holding pattern just south of the 199.00 handle as Pound Sterling (GBP) traders await key data prints from the UK to pick a direction. Japanese data remains thin this week, leaving Guppy traders to focus on UK Consumer Price Index (CPI) inflation and Purchasing Managers Index (PMI) figures.
At current tally, Japan is believed to have spent around 60 billion Yen trying to defend the battered Japanese currency recently. The Bank of Japan (BoJ) has not officially confirmed or denied outright market operations. Still, closely-watched financial reporting from the Japanese central bank have shown a much wider gap between market analyst expectations and actual reported financial operations.
Despite possible interventions in global FX markets on behalf of the Yen, GBP/JPY is steadily approaching record highs once more as the JPY slumps across broader markets with the BoJ staunchly holding interest rates near zero.
The UK’s latest CPI inflation print is due in the upcoming Wednesday session, and is expected to cool to 0.2% in April, compared to the previous month’s 0.6%. Investors are looking for signs of a summer rate cut from the Bank of England (BoE), and markets will be keeping a close eye on UK inflation updates.
GBP/JPY technical outlook
The Guppy has been grinding higher in recent days, but Tuesday saw the pair take a breather, holding steady just below 199.00. The pair is up 1.75% from the last near-term sewing low into 195.00, while recovering nearly 4% from bottom bids priced in near 191.50 after the suspected BoJ interventions.
GBP/JPY hourly chart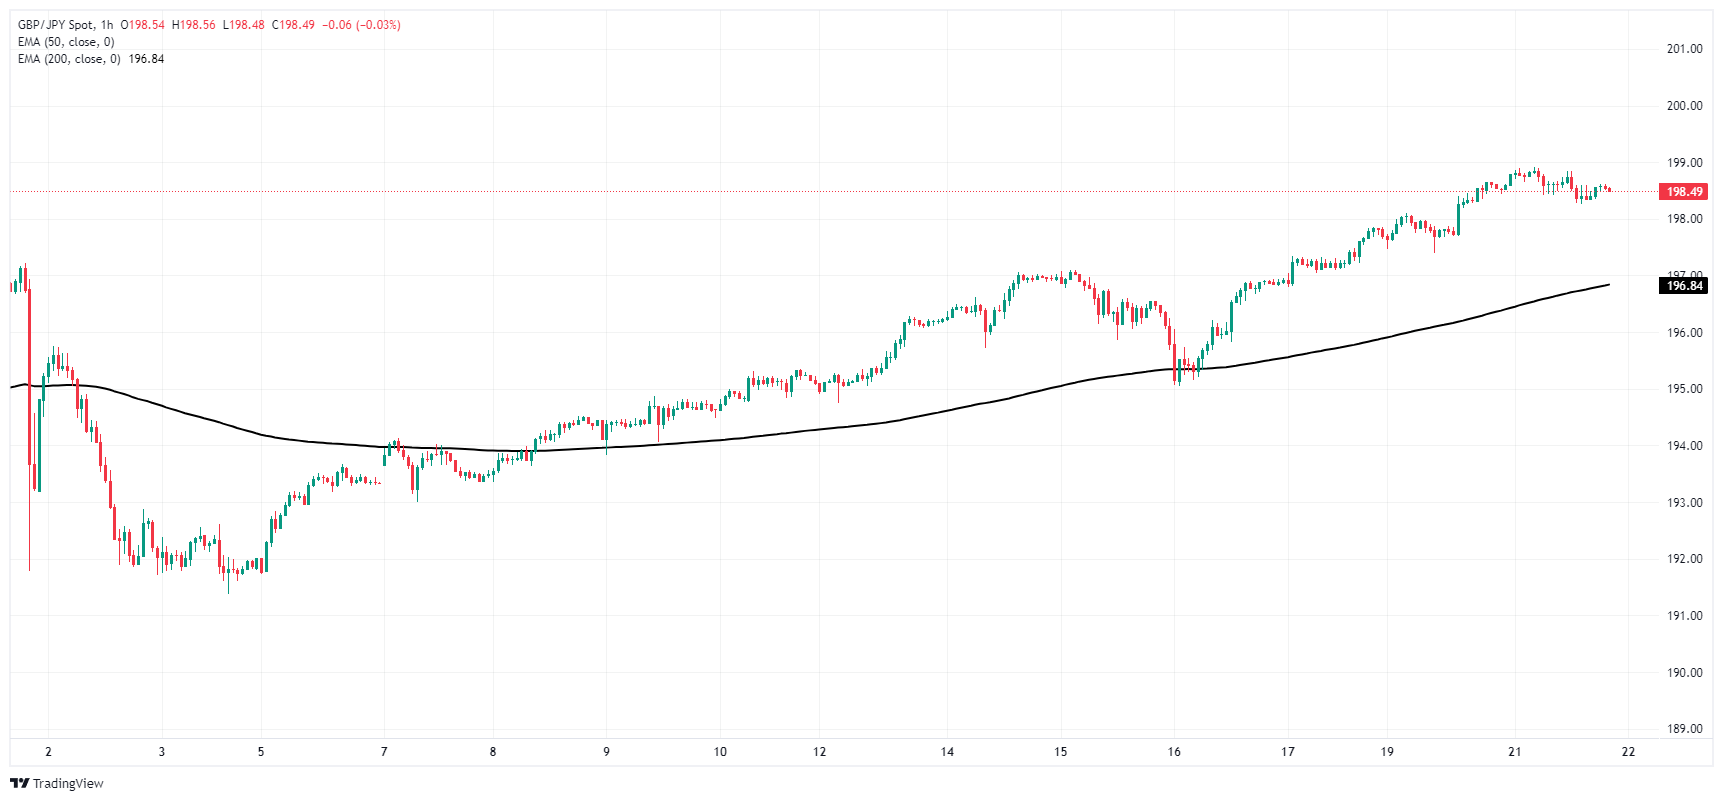
GBP/JPY daily chart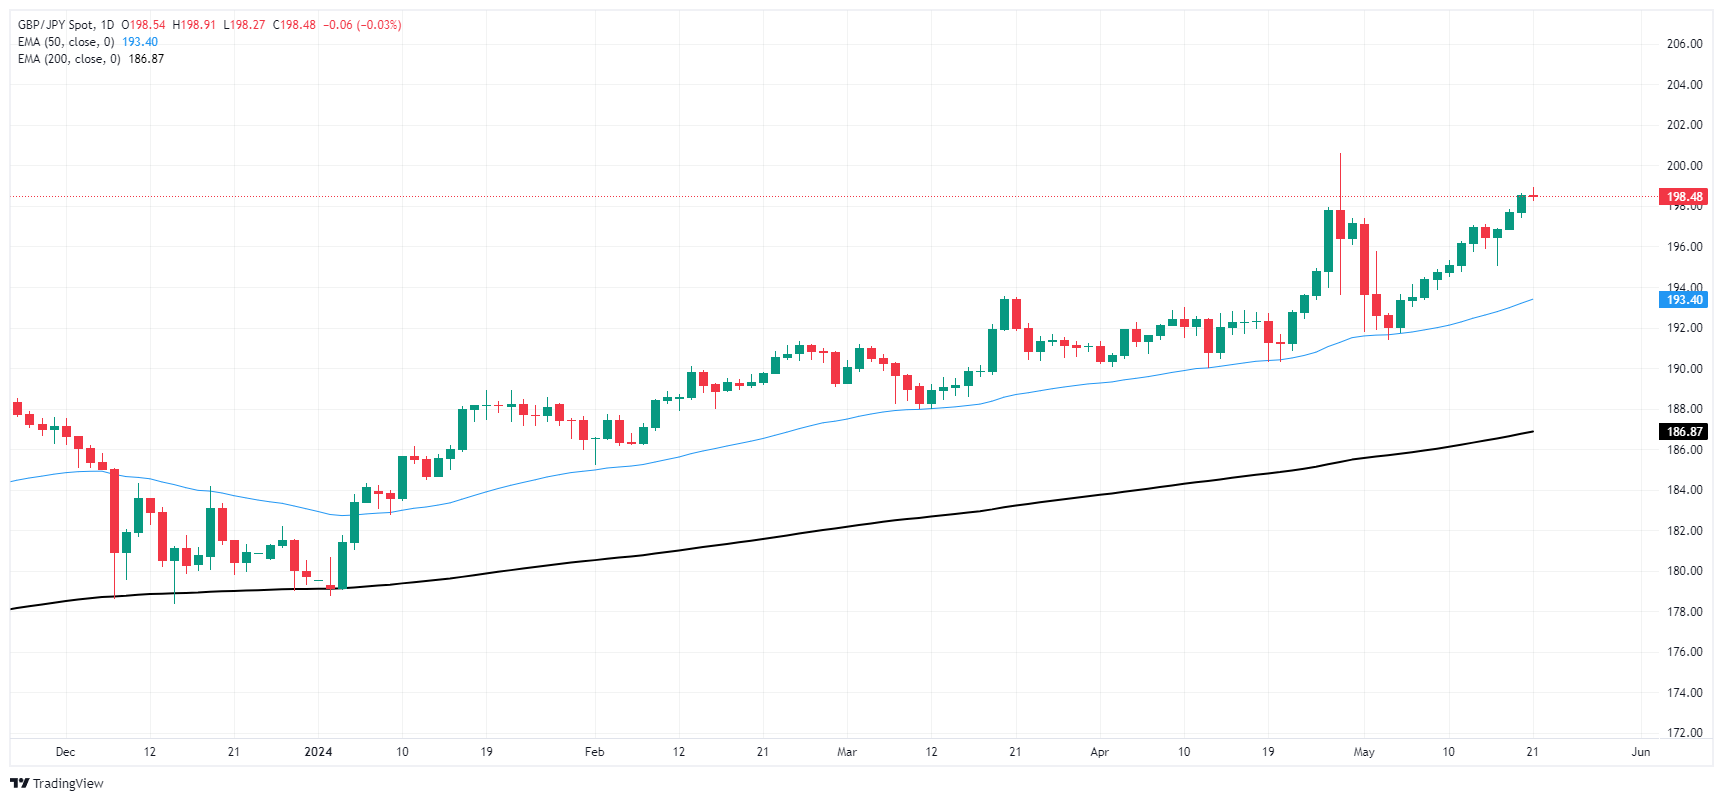
- USD/JPY faces resistance at 156.50 as 10-year Treasury yields decline.
- Bullish technical outlook with waning momentum; RSI under 50 could signal potential losses.
- Resistance levels lie at 156.76, 157.00, and YTD high of 160.32.
- Key support emerges at 156.00, Senkou Span A (155.61), and Kijun-Sen (155.18).
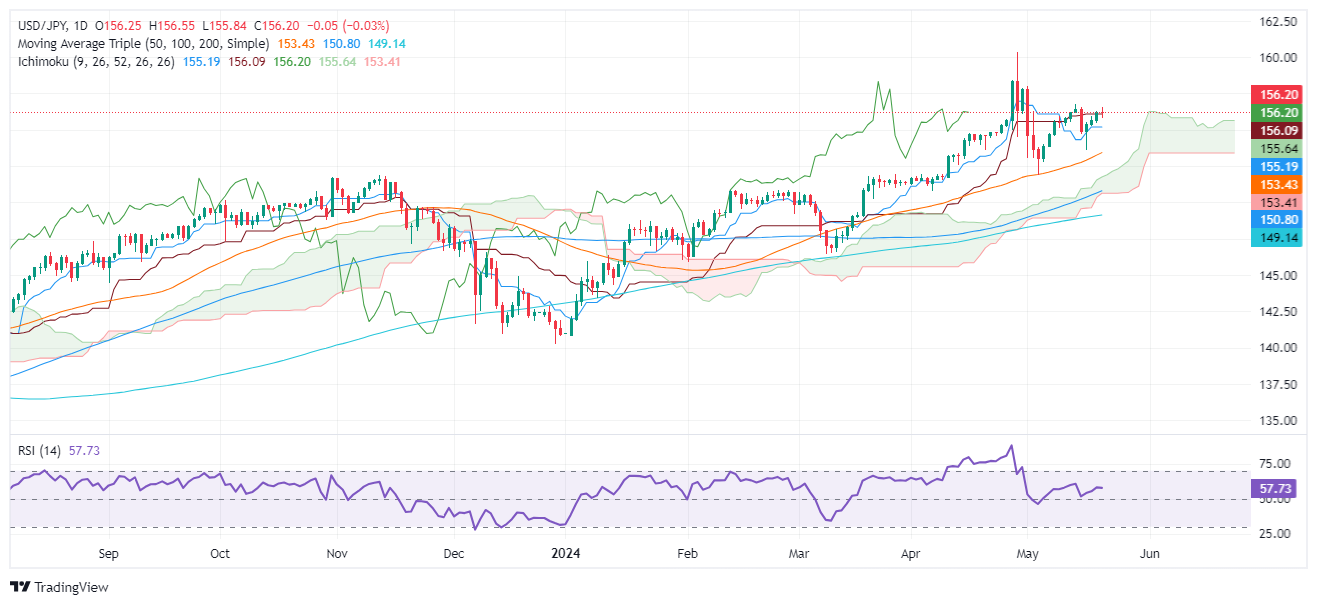
The USD/JPY pair faces stir resistance at around 156.50 retreats as the US 10-year Treasury note yield drops three and a half basis points, a headwind for the Greenback. The positive correlation between the major and the US 10-year note yield weighed on the pair, down 0.06%, and trades at 156.19.
USD/JPY Price Analysis: Technical outlook
The USD/JPY remains upward biased, but buyers seem to have lost some momentum. They remain unable to bring the pair upwards and challenge the latest cycle high of 156.76, the May 14 high. The Relative Strength Index (RSI) suggests that buying pressure is fading. Despite standing in bullish territory, if the RSI punches below the 50-midline, that could pave the way for USD/JPY losses.
For a bullish continuation, the USD/JPY first resistance would be 156.76, followed by 157.00. Up next would be the May 1 high at 157.98, ahead of challenging the year-to-date (YTD) high of 160.32.
On the flip side, and the most likely path in the near term, if USD/JPY tumbles below 156.00, the first support would be the Senkou Span A at 155.61. Once cleared, the next stop would be the Kijun-Sen at 155.18 ahead of 155.00.
USD/JPY Price Action – Daily Chart
- The USD/THB pair advanced nicely in Tuesday's session, standing at 36.36 with a rally of 0.80%.
- The USD is holding its ground due to the measured remarks from Fed officials.
- Wednesday's FOMC minutes, May's S&P PMIs, and April's Durable Goods Orders from the US are next in line in the economic calendar.
The USD/THB gathered significant traction on Tuesday and rallied by 0.80% as bears exhausted after failing to conquer the 100-day Simple Moving Average (SMA) at 36.05. Despite April's US Consumer Price Index (CPI) data reflecting stronger-than-expected inflation numbers, the USD is holding its ground as the Federal Reserve (Fed) continues to ask for patience for the rate cuts.
Given the cautious stance from the Fed officials and the wait-and-see approach perceived by the markets, any immediate movement other than technical swings for the USD/THB pair seems unlikely as it remains at a steady pace. Further insights regarding the health of the US economy could be gained from releasing US's May's S&P PMIs on Thursday and April's Durable Goods Orders on Friday which could trigger movements on the pair.
The Federal Open Market Committee (FOMC) minutes from the May meeting, will be released on Wednesday and may also trigger volatility. As for now, markets continue to discount higher odds of the easing starting in September.
USD/THB technical analysis
Examining the daily chart, the Relative Strength Index (RSI) reveals a minor strengthening trend for the USD/THB pair, moving away from the oversold conditions noted on Monday. The RSI has gained ground but is yet to escape the negative trend zone.
The Moving Average Convergence Divergence (MACD) histogram, appended to this analysis, sketches a decreasing negative momentum, signaled by the decrease in red bars. Sellers currently dominate the market. Yet, the decrease in negative momentum could hint at a potential shift in balance.
USD/THB daily chart
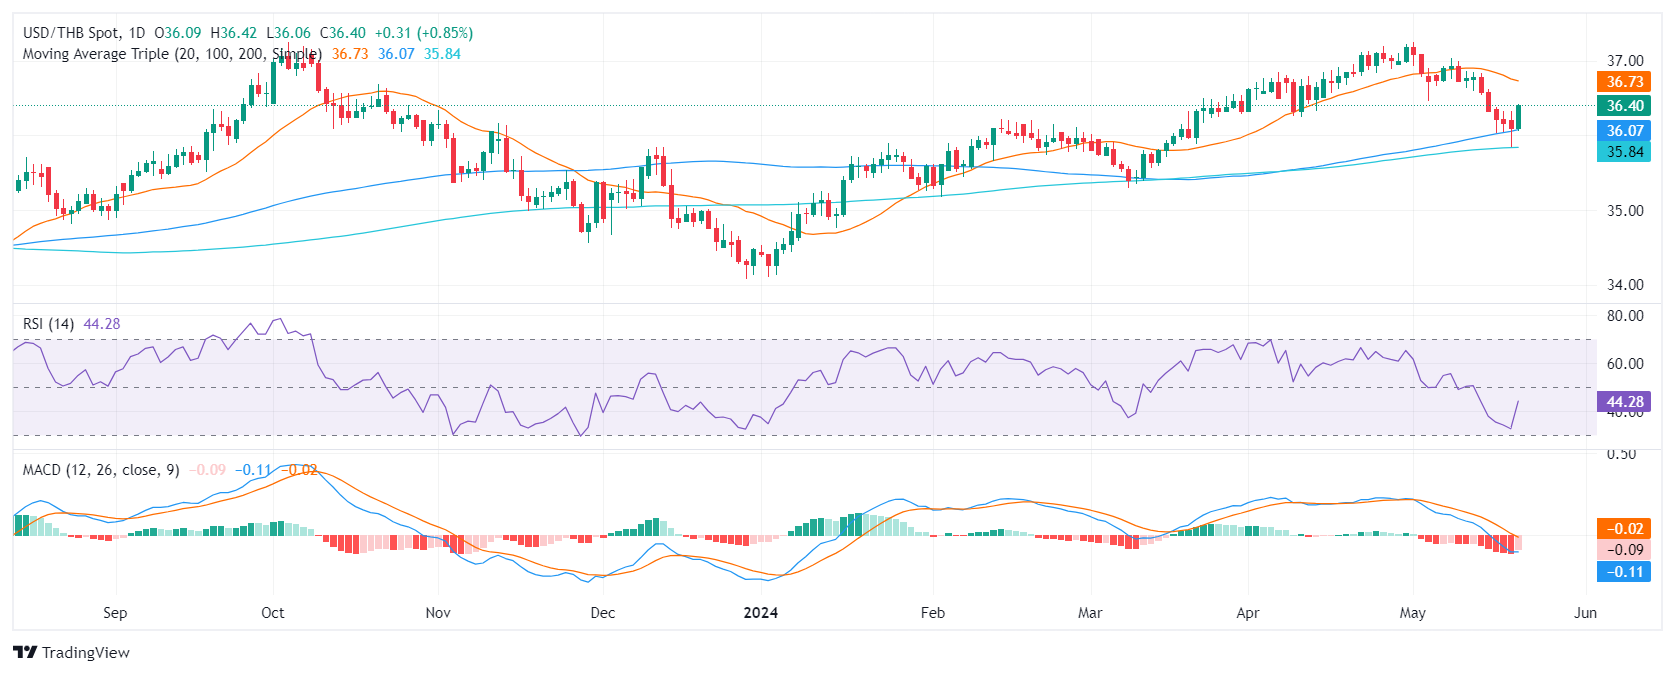
The broader outlook reveals critical insights into the USD/THB's position relative to its Simple Moving Averages (SMAs). The pair's steadfast defense of the 10, and 200-day SMAs reveals that the overall trend remains bullish. However, the loss of the 20-day SMA suggests a slightly negative short-term trend.
What you need to take care of on Wednesday, May 22:
Financial markets made no progress on Tuesday, with major pairs holding on to familiar levels and within tight ranges. The US Dollar saw a modest uptick amid a risk-averse environment, with Asian and European indexes closing in the red. Wall Street, however, managed to post modest gains ahead of the release of earnings reports after the close.
The EUR/USD pair held at around 1.0850, unaffected by minor European macroeconomic figures that were generally encouraging.
GBP/USD remained stuck to the 1.2700 price zone, although the United Kingdom (UK) will publish the Consumer Price Index (PPI) and other inflation-related figures on Wednesday, which may bring the pair back to life.
The Canadian Dollar edged sharply lower, sending USD/CAD to 1.3674 after Canadian inflation figures. The Consumer Price Index (CPI), declined to 2.7% on a yearly basis in April from 2.9% in March, while the Bank of Canada's core Consumer Price Index increased 1.6% on a yearly basis, down from the 2% growth recorded in March.
AUD/USD held around 0.6660 despite Australia's May Westpac Consumer Confidence, which improved to -0.3% from -2.4% in April. Additionally, the Reserve Bank of Australia (RBA) released the Minutes of its May monetary policy meeting, which maintained the overall hawkish stance adopted in the previous meeting.
The Fed Board issued its Economic Well-Being of US Households in 2023 report, which examines the financial circumstances of US adults and their families. The document showed that overall, “financial well-being was nearly unchanged from 2022 as higher prices remained a challenge for most households and workers continued to benefit from a strong labor market.” The news is quite discouraging, moreover after inflation picked up in the first quarter of the year, further diluting the odds for multiple rate cuts throughout the rest of the year.
US Dollar PRICE This week
The table below shows the percentage change of US Dollar (USD) against listed major currencies this week. US Dollar was the strongest against the New Zealand Dollar.
| USD | EUR | GBP | JPY | CAD | AUD | NZD | CHF | |
|---|---|---|---|---|---|---|---|---|
| USD | 0.12% | -0.11% | 0.34% | 0.27% | 0.40% | 0.62% | 0.18% | |
| EUR | -0.12% | -0.26% | 0.25% | 0.15% | 0.31% | 0.51% | 0.07% | |
| GBP | 0.11% | 0.26% | 0.40% | 0.42% | 0.57% | 0.76% | 0.33% | |
| JPY | -0.34% | -0.25% | -0.40% | -0.09% | 0.07% | 0.32% | -0.14% | |
| CAD | -0.27% | -0.15% | -0.42% | 0.09% | 0.09% | 0.35% | -0.08% | |
| AUD | -0.40% | -0.31% | -0.57% | -0.07% | -0.09% | 0.18% | -0.24% | |
| NZD | -0.62% | -0.51% | -0.76% | -0.32% | -0.35% | -0.18% | -0.43% | |
| CHF | -0.18% | -0.07% | -0.33% | 0.14% | 0.08% | 0.24% | 0.43% |
The heat map shows percentage changes of major currencies against each other. The base currency is picked from the left column, while the quote currency is picked from the top row. For example, if you pick the US Dollar from the left column and move along the horizontal line to the Japanese Yen, the percentage change displayed in the box will represent USD (base)/JPY (quote).
Looking ahead, the Reserve Bank of New Zealand will announce its decision on monetary policy early on Wednesday and could introduce some noise in commodity-linked currencies.
Also, the United States (US) Federal Open Market Committee (FOMC) will release the Minutes of its latest meeting on Wednesday. Market players hope for clarity over the timing of a monetary policy pivot, which policymakers have refused to provide so far.
- Gold slumps below $2,430, down 0.28% after reaching an all-time high of $2,450.
- US Treasury yields decline with 10-year TIPS yield dropping three basis points to 2.081%.
- Hedge funds increase bullish bets on Gold futures to a three-week high, capping XAU/USD’s losses.
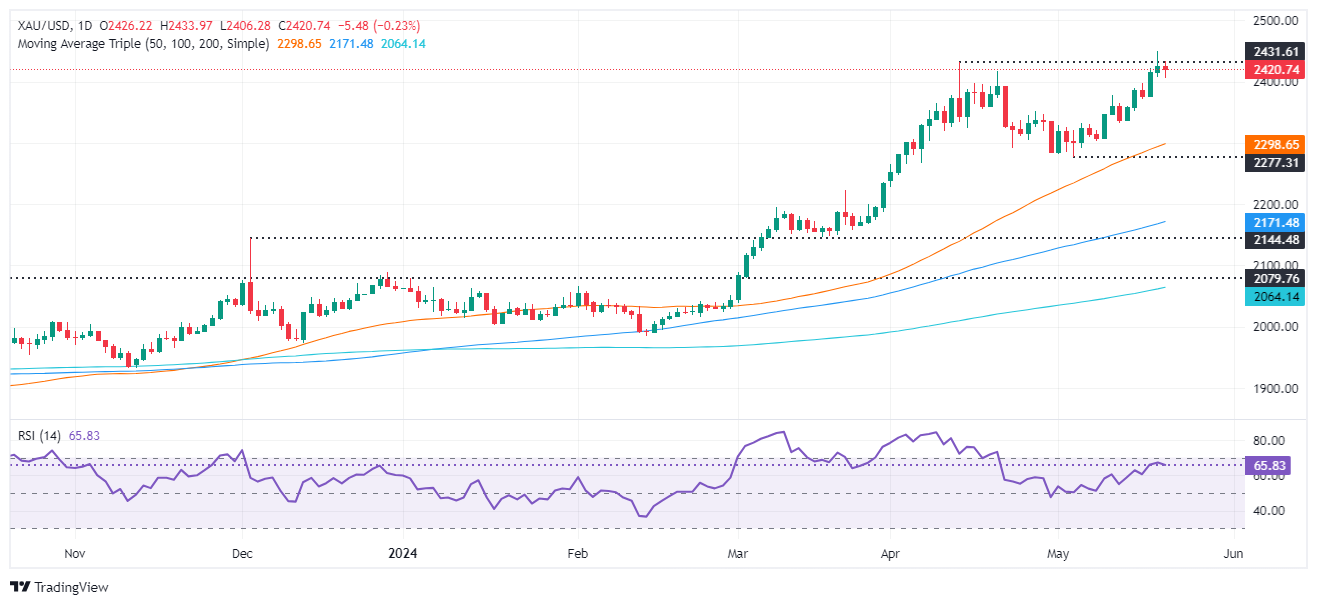
Gold price retraces during Tuesday’s North American session after hitting an all-time high of $2,450. Yet it retreated below the April 12 high of $2,431 as the Greenback recovers some ground. A scarce economic docket keeps traders leaning on Fedspeak, which remained cautious of signaling the beginning of rate cuts.
The XAU/USD trades at $2,418, down 0.28% after reaching a high of $2,433. Wall Street indices remain in the green, a headwind for the safe-haven status for the golden metal. Even though it’s sought as a “hedge” for inflation, investors seem reluctant to give away profits from the US stock market.
Additionally, officials of the Federal Reserve (Fed) continued to cross the wires and adhere to its stance of keeping interest rates on hold until the disinflationary process evolves.
Despite that, US Treasury bond yields edged lower. The US 10-year benchmark note dropped three-and-a-half basis points to 4.41%, while the 10-year yield on the Treasury Inflation-Protected Securities (TIPS), which correlates inversely to Gold prices, dropped three basis points to 2.081%.
Data from the Commodities Futures Trading Commission (CFTC) showed that hedge funds boosted bullish bets on Gold futures to a three-week high in the week ending May 14.
The US economic docket during the week before the latest Fed meeting minutes was released on Wednesday. On Thursday, US Initial Jobless Claims are expected to show the labor market is cooling, along with the Chicago Fed National Activity Index.
Daily digest market movers: Gold price falls despite falling US yields following hawkish Fed comments
- Gold price retreats amid falling US Treasury yields and a weaker US Dollar. The US Dollar Index (DXY), which tracks the Greenback’s performance against a basket of six other currencies, is virtually unchanged at 104.64, putting a lid on XAU/USD prices.
- Last week’s inflation data showed that underlying prices are easing. That reignited traders' expectations that the US central bank would resume easing policy. However, they must be cautious as Fed officials pushed back against just one reading that inflation is moderating.
- Atlanta Fed President Raphael Bostic stated that he is not in a hurry to reduce interest rates and prefers to keep them steady, emphasizing that the Fed's top priority is still addressing inflation.
- Fed Governor Christopher Waller acknowledged that April’s CPI showed progress but mentioned that he needs to see several months of favorable inflation data before he can support a rate cut. Meanwhile, Michael Barr, the vice-chair of supervision, remarked, "We still need to finish the job on inflation."
- On Monday, Vice-Chair Philip Jefferson said it’s too easy to tell when the disinflation process will resume while stating that the policy rate is restrictive. Cleveland Fed President Loretta Mester stated that inflation risks are tilted to the upside.
- Data from the Chicago Board of Trade shows investors are expecting 35 basis points of Fed easing toward the end of the year.
Technical analysis: Gold price slides below $2,450 as bears target $2,400
Gold’s uptrend remains intact, but a daily close below the May 20 low of $2,407 could pave the way for a pullback. That event could form a ‘dark cloud cover,’ a two-candle chart pattern that implies the XAU/USD can print a leg down before extending its rally.
Momentum is on the back of buyers as depicted by the Relative Strength Index (RSI) in bullish territory. However, the RSI is aiming lower, and once it clears the 50-midline, look for further declines.
On the upside, XAU/USD's first resistance would be the April 12 high of $2,431, followed by the all-time high of $2,450.
Conversely, if XAU/USD retreats below $2,400, that could expose the May 13 low at $2,332, followed by the May 8 low of $2,303. Once those levels are surpassed, the 50-day Simple Moving Average (SMA) at $2,284 will be up next.
Gold FAQs
Gold has played a key role in human’s history as it has been widely used as a store of value and medium of exchange. Currently, apart from its shine and usage for jewelry, the precious metal is widely seen as a safe-haven asset, meaning that it is considered a good investment during turbulent times. Gold is also widely seen as a hedge against inflation and against depreciating currencies as it doesn’t rely on any specific issuer or government.
Central banks are the biggest Gold holders. In their aim to support their currencies in turbulent times, central banks tend to diversify their reserves and buy Gold to improve the perceived strength of the economy and the currency. High Gold reserves can be a source of trust for a country’s solvency. Central banks added 1,136 tonnes of Gold worth around $70 billion to their reserves in 2022, according to data from the World Gold Council. This is the highest yearly purchase since records began. Central banks from emerging economies such as China, India and Turkey are quickly increasing their Gold reserves.
Gold has an inverse correlation with the US Dollar and US Treasuries, which are both major reserve and safe-haven assets. When the Dollar depreciates, Gold tends to rise, enabling investors and central banks to diversify their assets in turbulent times. Gold is also inversely correlated with risk assets. A rally in the stock market tends to weaken Gold price, while sell-offs in riskier markets tend to favor the precious metal.
The price can move due to a wide range of factors. Geopolitical instability or fears of a deep recession can quickly make Gold price escalate due to its safe-haven status. As a yield-less asset, Gold tends to rise with lower interest rates, while higher cost of money usually weighs down on the yellow metal. Still, most moves depend on how the US Dollar (USD) behaves as the asset is priced in dollars (XAU/USD). A strong Dollar tends to keep the price of Gold controlled, whereas a weaker Dollar is likely to push Gold prices up.
Bank of England (BoE) Governor Andrew Bailey commented on his inflation outlook fore the UK economy while outlining how the BoE plans to wind down its government bond holdings to a more manageable level by the second half of 2025.
According to reporting by Reuters, the BoE plans to sell off 1.11 trillion USD worth of government bonds on the UK central bank's balance sheet by the midpoint of next year.
Key comments
Bailey thinks the next move on rates will be a cut.
The question is how long we maintain this level of monetary policy restriction.
I expect quite a drop in April inflation data.
Bailey will consider the IMF's recommendation of more MPC press conferences.
- Dow Jones holding steady just below 39,900.00 as investors await meaningful data.
- Despite chilling Fedspeak, investor hopes for rate cuts remains high.
- US Home Sales, PMI, and Durable Goods Orders all still due this week.
The Dow Jones Industrial Average (DJIA) is holding steady above 39,800.00 on Tuesday as Federal Reserve (Fed) policymakers try to apply downward pressure to broad-market rate cut expectations. Fed officials noted on Tuesday that the Fed isn’t likely to cut rates until they get more data pointing to a consistent easing of inflation to the Fed’s 2% annual target. Despite an easing in inflation data for April, central planners remain spooked after inflation data from the overall first quarter failed to show disinflation has taken permanent hold.
USD economic data remains thin in the early half of the trading week, but investors will have an eye out for US Home Sales figures due in the midweek. US Purchasing Managers Index (PMI) figures are also due on Thursday, followed by Durable Goods Orders on Friday.
Dow Jones news
The Dow Jones is mixed on Tuesday, with about half of the index’s constituent securities in the green. 3M Co. (MMM) fell -1.9% to 103.25 per share, while International Business Machines Corp. (IBM) rose over 2% to trade into $173.44 per share.
Dow Jones technical outlook
The Dow Jones set a fresh all-time high of 40,070.82 on Monday, and the index is treading water just below 39,900.00 on Tuesday. DJIA traders couldn’t get the index back over 39,880.00 as bullish momentum remains thin, but selling pressure remains thin and a technical floor is priced in near 39,780.00.
Dow Jones five-minute chart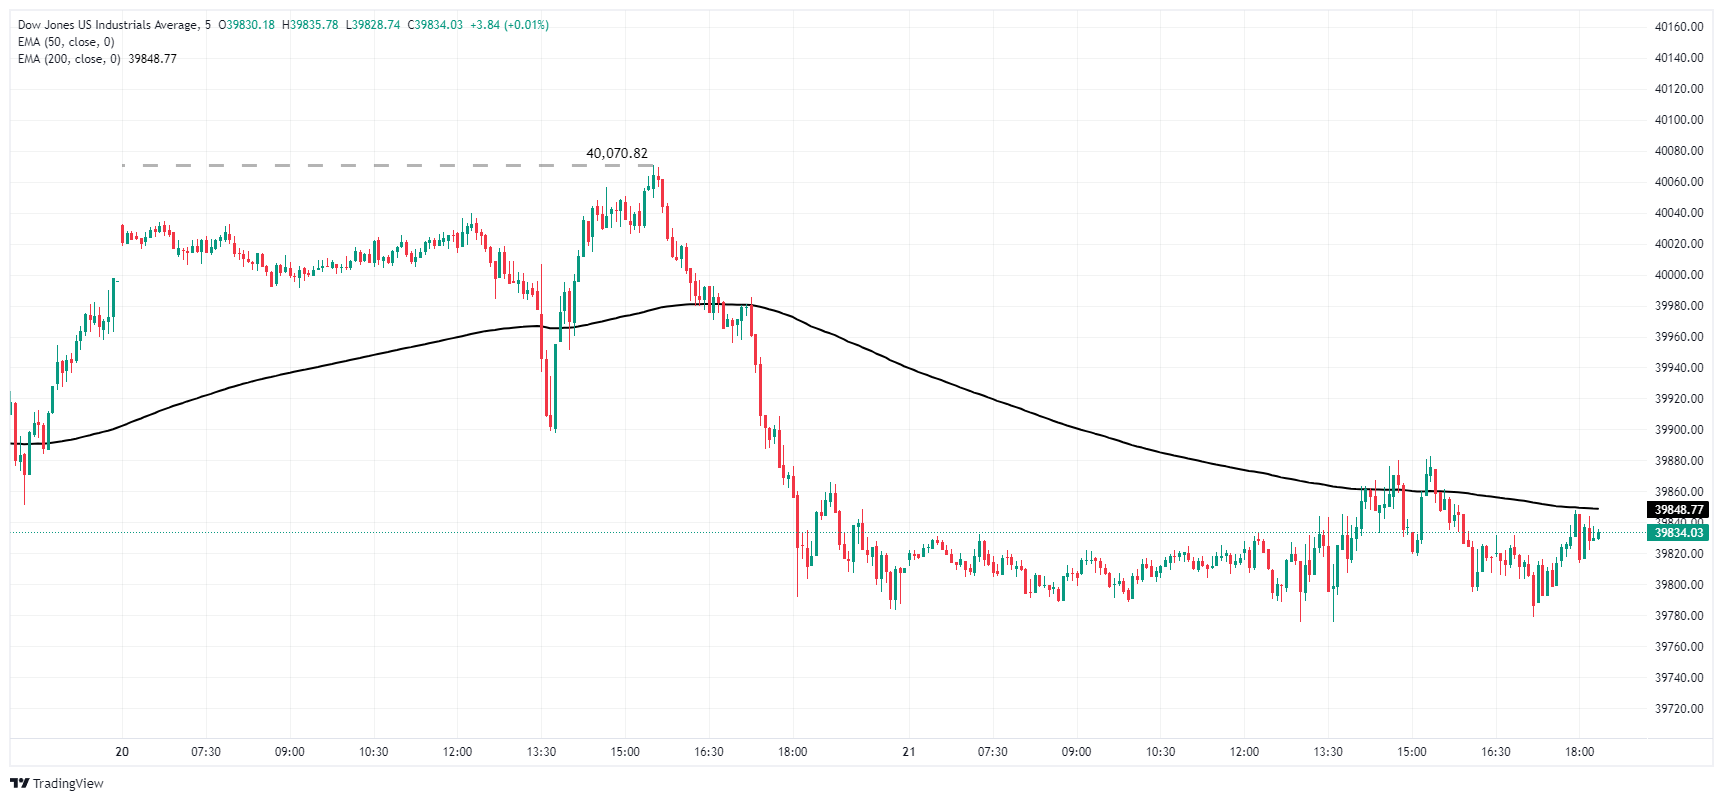
Dow Jones daily chart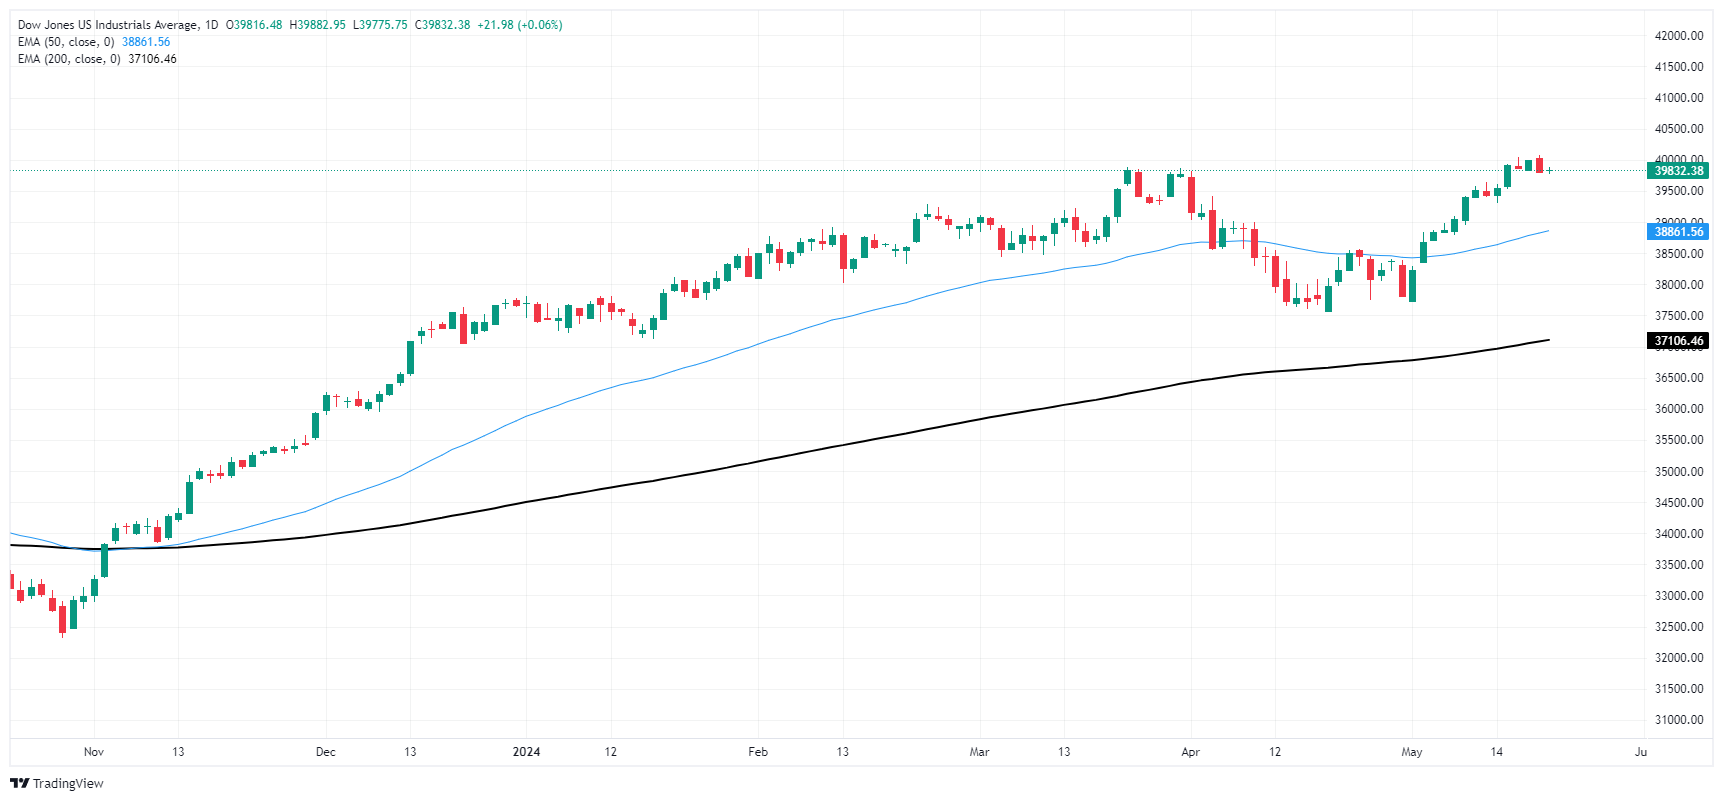
Dow Jones FAQs
The Dow Jones Industrial Average, one of the oldest stock market indices in the world, is compiled of the 30 most traded stocks in the US. The index is price-weighted rather than weighted by capitalization. It is calculated by summing the prices of the constituent stocks and dividing them by a factor, currently 0.152. The index was founded by Charles Dow, who also founded the Wall Street Journal. In later years it has been criticized for not being broadly representative enough because it only tracks 30 conglomerates, unlike broader indices such as the S&P 500.
Many different factors drive the Dow Jones Industrial Average (DJIA). The aggregate performance of the component companies revealed in quarterly company earnings reports is the main one. US and global macroeconomic data also contributes as it impacts on investor sentiment. The level of interest rates, set by the Federal Reserve (Fed), also influences the DJIA as it affects the cost of credit, on which many corporations are heavily reliant. Therefore, inflation can be a major driver as well as other metrics which impact the Fed decisions.
Dow Theory is a method for identifying the primary trend of the stock market developed by Charles Dow. A key step is to compare the direction of the Dow Jones Industrial Average (DJIA) and the Dow Jones Transportation Average (DJTA) and only follow trends where both are moving in the same direction. Volume is a confirmatory criteria. The theory uses elements of peak and trough analysis. Dow’s theory posits three trend phases: accumulation, when smart money starts buying or selling; public participation, when the wider public joins in; and distribution, when the smart money exits.
There are a number of ways to trade the DJIA. One is to use ETFs which allow investors to trade the DJIA as a single security, rather than having to buy shares in all 30 constituent companies. A leading example is the SPDR Dow Jones Industrial Average ETF (DIA). DJIA futures contracts enable traders to speculate on the future value of the index and Options provide the right, but not the obligation, to buy or sell the index at a predetermined price in the future. Mutual funds enable investors to buy a share of a diversified portfolio of DJIA stocks thus providing exposure to the overall index.
- USD/SEK is holding steady at 10.69 and cleared daily losses.
- High-ranking members of the Federal Reserve maintain a cautious stance, resisting rushing into rate cuts.
- Investors await FOMC's meeting minutes for May this Wednesday, which will provide deeper insights into the Federal Reserve's policy roadmap.
The USD/SEK pair trades at 10.69, after falling below the 100 and 200-day Simple Moving Averages (SMAs) clearing all of its daily losses. This is due to the USD holding its ground on the back of cautious comments of the Federal Reserve (Fed) officials which ask for patience on rate cuts.
In that sense, on a quiet week, Federal Reserve official's comments are the highlight of each session and they echoe caution in the face of robust growth and persistent inflation in the US, seeming to rule out immediate rate cuts. The expectation is that this Wednesday's FOMC meeting minutes might reveal deeper insight into the Fed's expected roadmap which could change the expectations of the easing cycle. Later this week, on Thursday, weekly Jobless Claims figures and S&P PMIs from May might trigger movements on the USD and Friday’s Durable Goods orders data from April as they might give further insights into the health of the US economy.
USD/SEK technical analysis
In the daily overview, the Relative Strength Index (RSI) for USD/SEK remains within negative zone. The latest reading is just below the 50 mark, thus projecting a slight inclination towards sellers. Concurrently, the Moving Average Convergence Divergence (MACD) demonstrates flat red bars, indicating a steady negative momentum for the pair.
USD/SEK daily chart
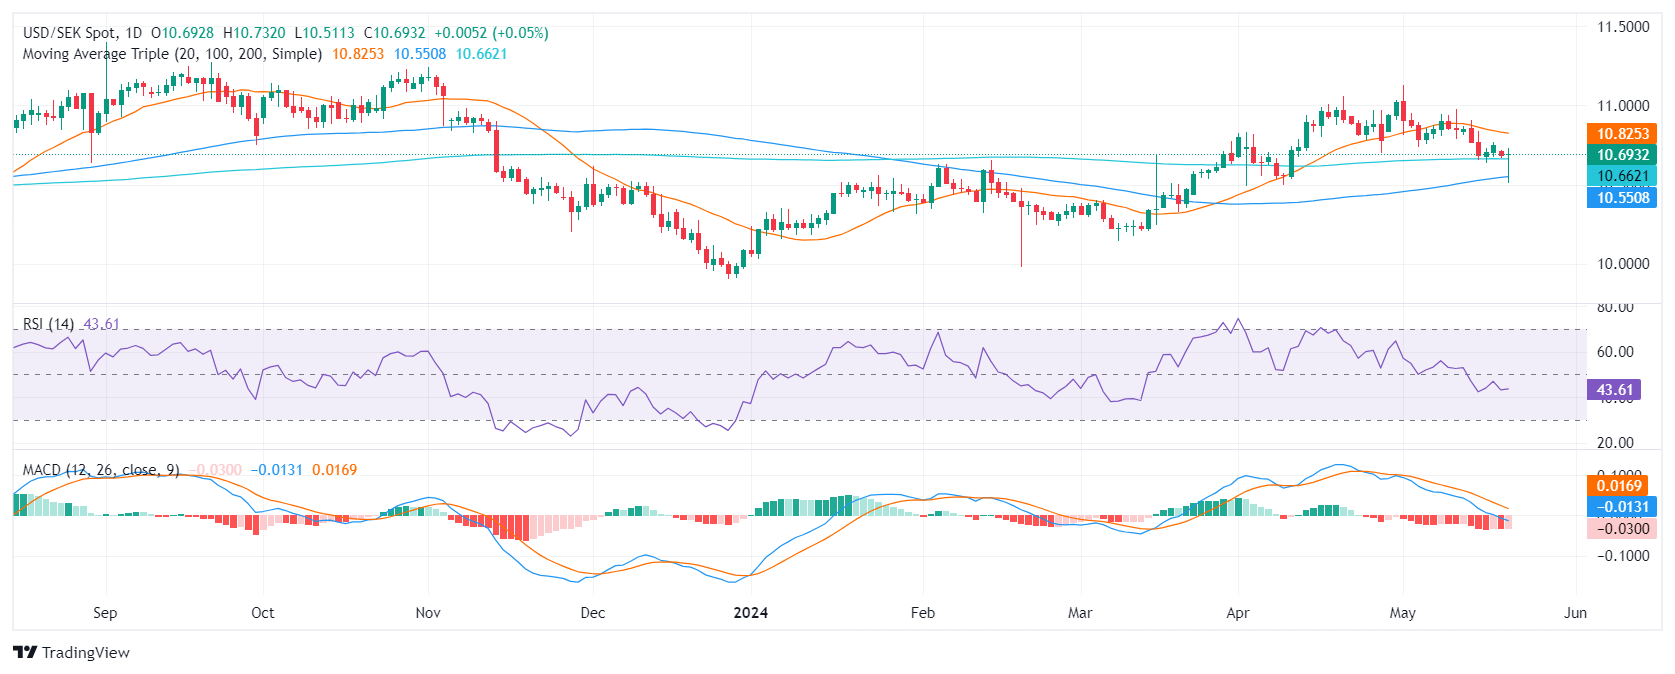 In relation to the overall trend, the pair is below the 20-day SMA but holds above the 100 and 200-day SMAs. This configuration implies a blend of long-term bullishness and short-term bearishness. Notably, on Tuesday, buyers successfully defended the 100 and 200-day SMA at both 10.55 and 10.62, indicating that the buyers remain resilient and that if the bears fail to breach these levels, a bullish flip might be seen in the next session.
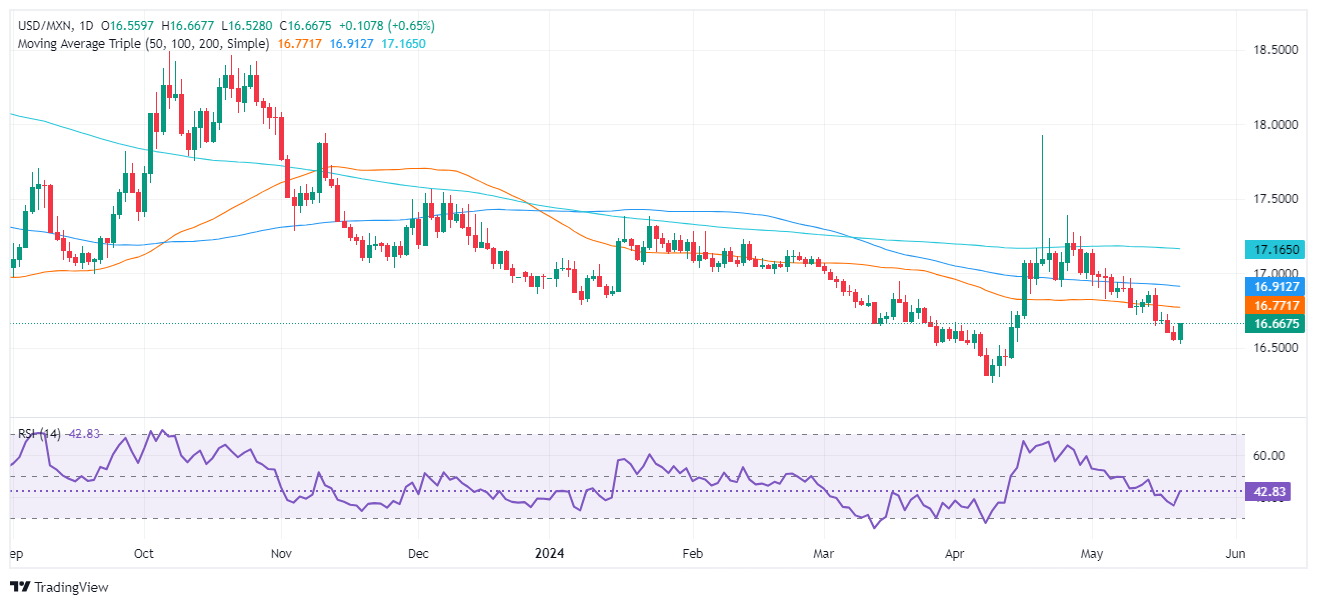
- Mexican Peso edges down 0.30% against US Dollar, trading at 16.64.
- Mexico's April Economic Activity Indicator shows minimal growth with Q1 2024 GDP expected to be downwardly revised.
- Gloomy economic outlook with falling Retail Sales may pressure Peso despite favorable interest rate differential.
Mexican Peso registers losses versus the US Dollar during the North American session amid a slew of Federal Reserve (Fed) officials hitting the wires. Data from Mexico suggests the economy barely grew in April, according to the Instituto Nacional de Estadistica Geografia e Informatica (INEGI), ahead of revealing the release of the Gross Domestic Product (GDP) figures on May 22. Therefore, the USD/MXN trades at 16.64, up 0.30%.
Mexico’s docket featured the Economic Activity Indicator for April, saying the economy slowed, according to non-seasonally adjusted figures on a yearly basis. It showed signs of a minuscule improvement on a monthly basis, yet compared to March’s contraction, the Mexican economy didn’t grow.
Citibanamex analysts anticipate an economic slowdown, suggesting that GDP Q1 2024 figures will be downwardly revised.
This data, along with the plunge in Retail Sales in March, paints a gloomy economic outlook for Mexico. This could depreciate the Mexican Peso, even though the currency is favored by the interest rate differential set by the Bank of Mexico (Banxico) and the Fed.
In the US, Fed officials remain cautious about their stance regarding monetary policy. Atlanta Fed President Raphael Bostic, Fed Governor Christopher Waller and Michael Barr have all hit the wires.
Daily digest market movers: Mexican Peso tumbles despite diverging views amid Banxico’s board
- Mexico’s Gross Domestic Product for Q1 2024 is expected to show the Mexican economy is slowing amid higher borrowing costs of 11.00% on fears of higher inflation and the risks of depreciation of the Peso.
- Retail Sales in March plunged -0.2% MoM, below February’s 0.5% increase. On a yearly basis, sales plummeted -1.7%, missed estimates of 0%, and trailed the previous month's 3% growth.
- Diverging views surface in Banxico as Governor Victoria Rodriguez Ceja said last Monday that the bank would discuss lowering rates in the upcoming meeting on June 29. Conversely, Deputy Governor Espinosa commented that lowering rates in March might have delayed inflation convergence toward the central bank’s target by two quarters.
- Atlanta Fed President Raphael Bostic said he isn’t in a hurry to reduce rates and prefers to keep them steady. The Fed’s higher priority remains tackling inflation.
- Fed Governor Christopher Waller said that April’s CPI showed progress but that he needs to see several months of good inflation data before supporting a rate cut. His colleague, the Vice-Chair of Supervision Michael Barr, commented, “We still need to finish the job on inflation.”
- Data from the Chicago Board of Trade shows investors are expecting 35 basis points (bps) of Fed easing toward the end of the year.
Technical analysis: Mexican Peso trips down as USD/MXN climbs above 16.60
The USD/MXN remains downwardly biased, an indication of the strength of the Mexican currency, yet it remains shy of challenging the year-to-date low of 16.25, which could pave the way to test the 16.00 psychological figure. The seller momentum has stalled as the Relative Strength Index (RSI) is bearish but flat.
On the other hand, if buyers lift the USD/MXN toward the 50-day Simple Moving Average (SMA) at 16.76, it could exacerbate a rally toward the 100-day SMA at 16.91. Once cleared, the next supply zone would be the 17.00 psychological level. In that event, the next stop would be the 200-day SMA at 17.17.
Mexican Peso FAQs
The Mexican Peso (MXN) is the most traded currency among its Latin American peers. Its value is broadly determined by the performance of the Mexican economy, the country’s central bank’s policy, the amount of foreign investment in the country and even the levels of remittances sent by Mexicans who live abroad, particularly in the United States. Geopolitical trends can also move MXN: for example, the process of nearshoring – or the decision by some firms to relocate manufacturing capacity and supply chains closer to their home countries – is also seen as a catalyst for the Mexican currency as the country is considered a key manufacturing hub in the American continent. Another catalyst for MXN is Oil prices as Mexico is a key exporter of the commodity.
The main objective of Mexico’s central bank, also known as Banxico, is to maintain inflation at low and stable levels (at or close to its target of 3%, the midpoint in a tolerance band of between 2% and 4%). To this end, the bank sets an appropriate level of interest rates. When inflation is too high, Banxico will attempt to tame it by raising interest rates, making it more expensive for households and businesses to borrow money, thus cooling demand and the overall economy. Higher interest rates are generally positive for the Mexican Peso (MXN) as they lead to higher yields, making the country a more attractive place for investors. On the contrary, lower interest rates tend to weaken MXN.
Macroeconomic data releases are key to assess the state of the economy and can have an impact on the Mexican Peso (MXN) valuation. A strong Mexican economy, based on high economic growth, low unemployment and high confidence is good for MXN. Not only does it attract more foreign investment but it may encourage the Bank of Mexico (Banxico) to increase interest rates, particularly if this strength comes together with elevated inflation. However, if economic data is weak, MXN is likely to depreciate.
As an emerging-market currency, the Mexican Peso (MXN) tends to strive during risk-on periods, or when investors perceive that broader market risks are low and thus are eager to engage with investments that carry a higher risk. Conversely, MXN tends to weaken at times of market turbulence or economic uncertainty as investors tend to sell higher-risk assets and flee to the more-stable safe havens.
- Canadian Dollar broadly lower as inflation tempers in April.
- Canada finds easing price pressures, odds of BoC June rate cut rise.
- Canadian Retail Sales due at the end of the week.
The Canadian Dollar (CAD) is broadly softer on Tuesday, falling across the board and deflating around a fifth of a percent against the US Dollar (USD) after Canadian Consumer Price Index (CPI) inflation eased further in April. Markets are increasing their bets of a rate cut from the Bank of Canada (BoC) in June.
Canadian CPI inflation eased broadly in line with expectations, but the BoC’s Core CPI print dropped to its lowest point since April of 2021. With price pressure easing, market bets of a June rate cut from the BoC have risen to 48%, from 40% prior to Canada’s CPI print.
Daily digest market movers: Canadian Dollar slides in the face of easing inflation
- Canadian headline CPI inflation in April ticked down to 0.5% MoM, matching forecasts and easing from the previous 0.6%.
- YoY Canadian CPI inflation also met market forecasts, printing at 2.7% versus the previous 2.9%.
- The BoC’s Core CPI for the year ended April eased to 1.6%, down from the previous 2.0% and hitting a three-year low.
- Elsewhere in the market, Fedspeak continues to dominate overall sentiment as policymakers from the US Federal Reserve (Fed) make a slew of appearances in an effort to inject verbal confidence in markets.
- Canadian Retail Sales are due at the end of the week. Median market forecasts are hoping for a slight rebound to a flat 0.0% from the previous -0.1%.
Canadian Dollar PRICE Today
The table below shows the percentage change of Canadian Dollar (CAD) against listed major currencies today. Canadian Dollar was the strongest against the New Zealand Dollar.
| USD | EUR | GBP | JPY | CAD | AUD | NZD | CHF | |
|---|---|---|---|---|---|---|---|---|
| USD | 0.00% | -0.04% | -0.08% | 0.16% | 0.01% | 0.16% | 0.00% | |
| EUR | -0.01% | -0.04% | -0.08% | 0.14% | 0.04% | 0.13% | 0.01% | |
| GBP | 0.04% | 0.04% | -0.06% | 0.20% | 0.05% | 0.19% | 0.04% | |
| JPY | 0.08% | 0.08% | 0.06% | 0.25% | 0.08% | 0.22% | 0.08% | |
| CAD | -0.16% | -0.14% | -0.20% | -0.25% | -0.15% | -0.01% | -0.16% | |
| AUD | -0.01% | -0.04% | -0.05% | -0.08% | 0.15% | 0.14% | 0.00% | |
| NZD | -0.16% | -0.13% | -0.19% | -0.22% | 0.01% | -0.14% | -0.15% | |
| CHF | -0.00% | -0.01% | -0.04% | -0.08% | 0.16% | 0.00% | 0.15% |
The heat map shows percentage changes of major currencies against each other. The base currency is picked from the left column, while the quote currency is picked from the top row. For example, if you pick the Canadian Dollar from the left column and move along the horizontal line to the US Dollar, the percentage change displayed in the box will represent CAD (base)/USD (quote).
Technical analysis: Canadian Dollar backslides but remains in familiar technical territory
The Canadian Dollar (CAD) is moving in one direction on Tuesday, heading lower against nearly all of its major currency peers. The CAD is down a third of a percent against the broadly-recovering Japanese Yen (JPY), and has shed a fifth of a percent against the USD.
USD/CAD rose to its highest bids in a week, threatening to solidify a bullish rejection from the 50-day Exponential Moving Average (EMA) from 1.3636. The pair is still down from last month’s peak bids near 1.3850, but a long-term technical floor is priced in at the 200-day EMA from 1.3549.
USD/CAD hourly chart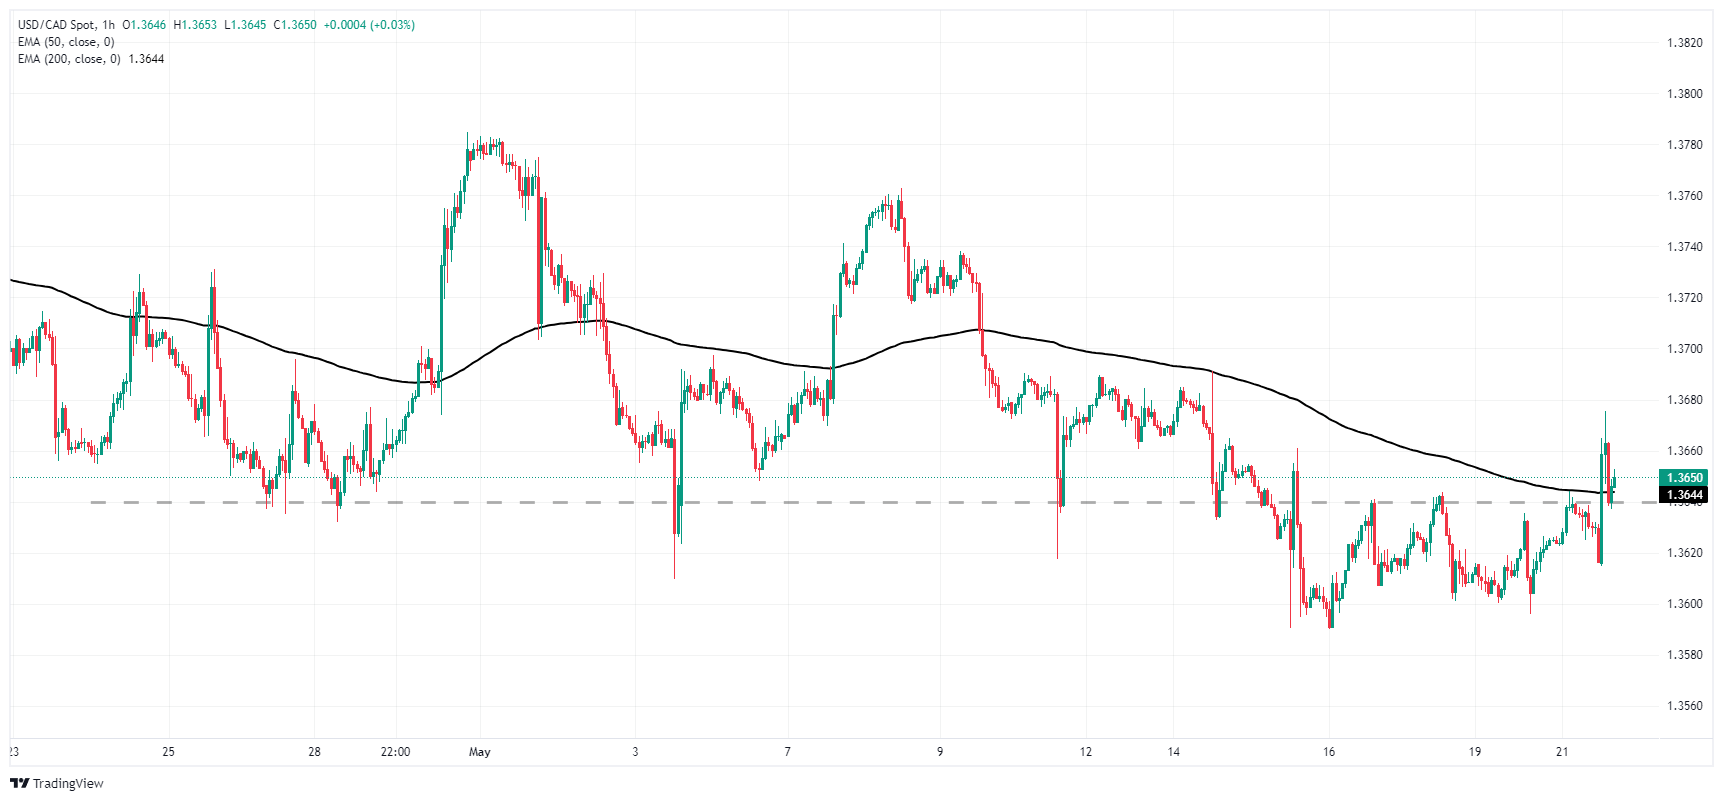
USD/CAD daily chart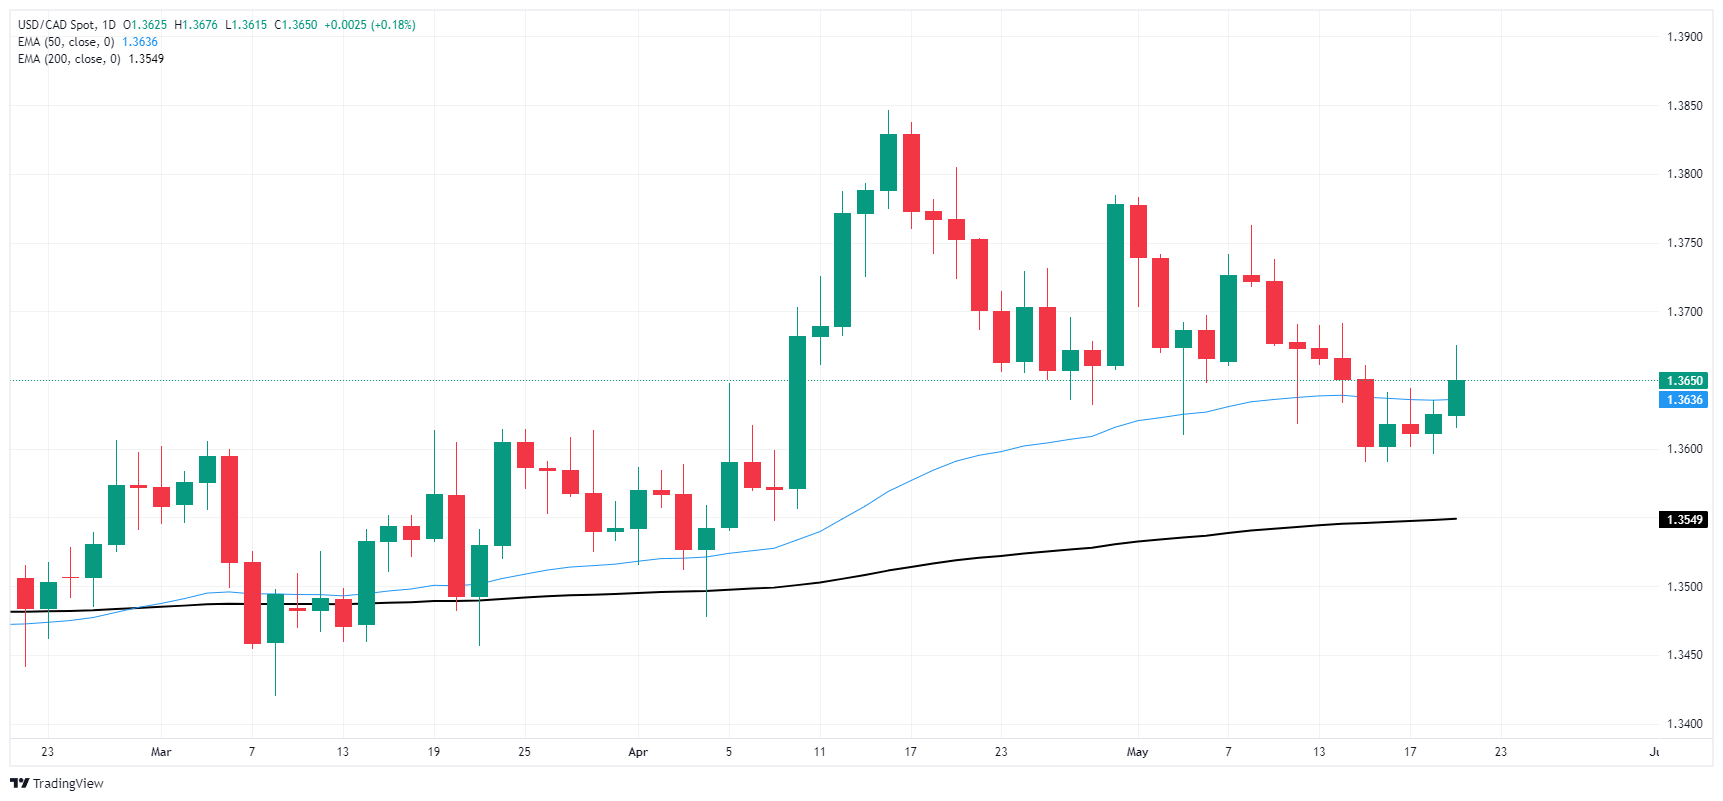
Canadian Dollar FAQs
The key factors driving the Canadian Dollar (CAD) are the level of interest rates set by the Bank of Canada (BoC), the price of Oil, Canada’s largest export, the health of its economy, inflation and the Trade Balance, which is the difference between the value of Canada’s exports versus its imports. Other factors include market sentiment – whether investors are taking on more risky assets (risk-on) or seeking safe-havens (risk-off) – with risk-on being CAD-positive. As its largest trading partner, the health of the US economy is also a key factor influencing the Canadian Dollar.
The Bank of Canada (BoC) has a significant influence on the Canadian Dollar by setting the level of interest rates that banks can lend to one another. This influences the level of interest rates for everyone. The main goal of the BoC is to maintain inflation at 1-3% by adjusting interest rates up or down. Relatively higher interest rates tend to be positive for the CAD. The Bank of Canada can also use quantitative easing and tightening to influence credit conditions, with the former CAD-negative and the latter CAD-positive.
The price of Oil is a key factor impacting the value of the Canadian Dollar. Petroleum is Canada’s biggest export, so Oil price tends to have an immediate impact on the CAD value. Generally, if Oil price rises CAD also goes up, as aggregate demand for the currency increases. The opposite is the case if the price of Oil falls. Higher Oil prices also tend to result in a greater likelihood of a positive Trade Balance, which is also supportive of the CAD.
While inflation had always traditionally been thought of as a negative factor for a currency since it lowers the value of money, the opposite has actually been the case in modern times with the relaxation of cross-border capital controls. Higher inflation tends to lead central banks to put up interest rates which attracts more capital inflows from global investors seeking a lucrative place to keep their money. This increases demand for the local currency, which in Canada’s case is the Canadian Dollar.
Macroeconomic data releases gauge the health of the economy and can have an impact on the Canadian Dollar. Indicators such as GDP, Manufacturing and Services PMIs, employment, and consumer sentiment surveys can all influence the direction of the CAD. A strong economy is good for the Canadian Dollar. Not only does it attract more foreign investment but it may encourage the Bank of Canada to put up interest rates, leading to a stronger currency. If economic data is weak, however, the CAD is likely to fall.
- Dollar Index trades at 104.6, registering mild losses in Tuesday's trading.
- USD is trading sideways as a cautious Fed is hesitant on premature easing.
- The odds of a cut in September slightly decrease but remain high.
The US Dollar Index (DXY) is seen at 104.6 level on Tuesday with mild losses. Amid signals of robust growth and persistent inflation in the US, Federal Reserve (Fed) officials continue to express caution about premature easing. The market's focus is steadily shifting toward the forthcoming release of the Federal Open Markets Committee (FOMC) Minutes on Wednesday and mid-tier data on Thursday and Friday including S&P PMIs and Durable Goods Orders.
As long as the US economy continues its robust growth while enduring inflation, Fed officials will lean toward caution, which could limit the downside for the USD.
Daily digest market movers: DXY mildly down as markets await FOMC Minutes
- Fed officials express concerns over rushing into easing amidst relaxed financial conditions and continuously advocate for a cautious approach toward rate cuts.
- Market predictions currently suggest a 75% chance of a rate decrease during the Fed's September meeting, odds that are mildly lower after being priced in last week.
- Any fresh clues on the May FOMC Meeting Minutes or the outcome of May’s S&P PMIs or April Durable Goods orders might generate volatility in the USD dynamics.
DXY technical analysis: DXY’s balance between bulls and bears persists, while investors await direction
The indicators on the daily chart reflect a state of equilibrium for the US Dollar Index. The Relative Strength Index (RSI) remains flat, indicating no clear dominance between buying and selling momentum. However, It remains in negative territory, which could suggest an overall bearish bias, but not decidedly so. The Moving Average Convergence Divergence (MACD) shows flat red bars, hinting at bearish sentiment remaining steady.
Despite the increased selling pressure pushing the pair below the 20-day Simple Moving Average (SMA), it continues to stay above the 100 and 200-day SMAs. While the market appears to await direction, the ability of the Index to maintain above the 100 and 200-day SMAs shows persistent demand each time the DXY dips, highlighting a bigger bullish picture.
US Dollar FAQs
The US Dollar (USD) is the official currency of the United States of America, and the ‘de facto’ currency of a significant number of other countries where it is found in circulation alongside local notes. It is the most heavily traded currency in the world, accounting for over 88% of all global foreign exchange turnover, or an average of $6.6 trillion in transactions per day, according to data from 2022. Following the second world war, the USD took over from the British Pound as the world’s reserve currency. For most of its history, the US Dollar was backed by Gold, until the Bretton Woods Agreement in 1971 when the Gold Standard went away.
The most important single factor impacting on the value of the US Dollar is monetary policy, which is shaped by the Federal Reserve (Fed). The Fed has two mandates: to achieve price stability (control inflation) and foster full employment. Its primary tool to achieve these two goals is by adjusting interest rates. When prices are rising too quickly and inflation is above the Fed’s 2% target, the Fed will raise rates, which helps the USD value. When inflation falls below 2% or the Unemployment Rate is too high, the Fed may lower interest rates, which weighs on the Greenback.
In extreme situations, the Federal Reserve can also print more Dollars and enact quantitative easing (QE). QE is the process by which the Fed substantially increases the flow of credit in a stuck financial system. It is a non-standard policy measure used when credit has dried up because banks will not lend to each other (out of the fear of counterparty default). It is a last resort when simply lowering interest rates is unlikely to achieve the necessary result. It was the Fed’s weapon of choice to combat the credit crunch that occurred during the Great Financial Crisis in 2008. It involves the Fed printing more Dollars and using them to buy US government bonds predominantly from financial institutions. QE usually leads to a weaker US Dollar.
Quantitative tightening (QT) is the reverse process whereby the Federal Reserve stops buying bonds from financial institutions and does not reinvest the principal from the bonds it holds maturing in new purchases. It is usually positive for the US Dollar.
- USD/CHF has been in a rising channel all year with a bullish bias.
- A break below the base of the channel on May 14 brought into doubt the uptrend.
- The pair is now at a critical point – further weakness confirms a reversal; strength a continuation back inside the channel.
USD/CHF is at a critical crossroads in its technical development. Whilst the uptrend remains intact the pair is vulnerable to a reversal if more weakness results in a significant downside move.
USD/CHF Daily Chart
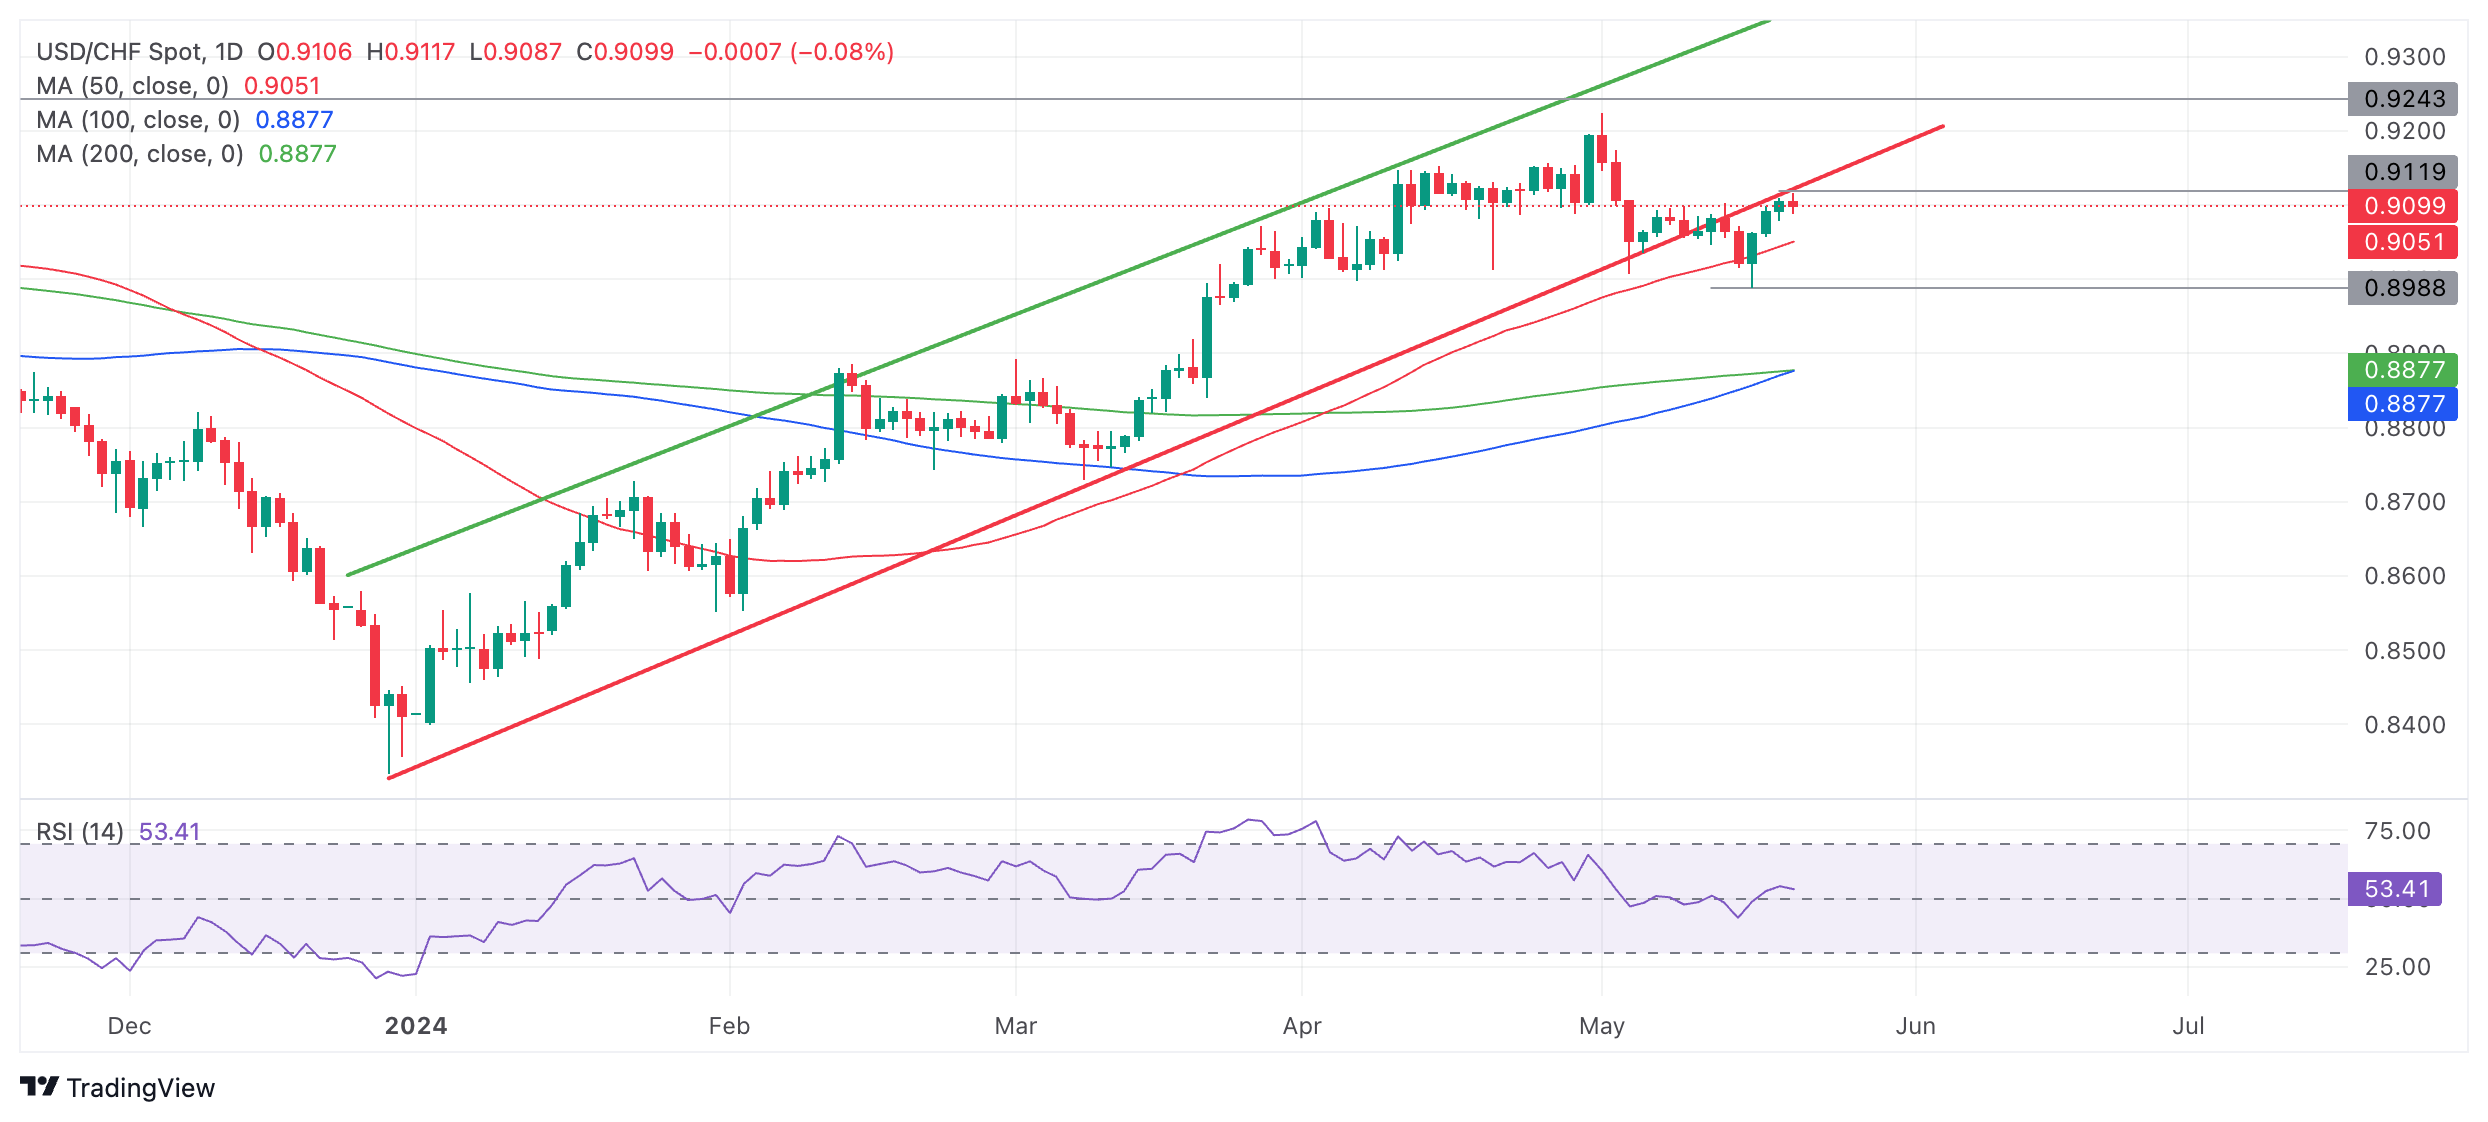
The pair has been rising in a channel since the start of 2024. It is in an uptrend on the daily chart, the time frame used to assess the medium-term trend. Given the received wisdom that “the trend is your friend” the uptrend should continue.
Short term the outlook is less clear since price broke on a closing basis below the red lower borderline of the ascending channel on May 14. It is now debatable whether the short-term uptrend is still intact or whether a new bearish trend is developed.
After the trendline break USD/CHF fell to a low of 0.8988 on May 16 before recovering and rising back up to the underside of the trendline at the current day’s highs of 0.9117.
It is possible this recovery represents what is known as a “throwback” in technical terms. If so, price will probably go lower after “air-kissing goodbye” the underside of the trendline – though this time with more vigor.
In such a scenario, a break below the 0.8988 lows would confirm a reversal of the short-term trend and result in a substantial extension lower, with an initial target most probably located at 0.8878 where the 100 and 200-day Simple Moving Averages (SMA) converge.
Alternatively a break back inside the channel would reassert the dominance of the bullish uptrend and negate the break down out of the channel that happened on May 14.
Such a move would need to break clearly and decisively back inside the channel on a closing basis, probably with a long green candle or three green candles in a row, the definition of “definitive” in technical terms.
If such a recovery evolves it will mean the break below the red trendline was probably a “false break” and the uptrend remains intact. Such a move would be expected to reach close to the 0.9225 highs of the year.
- GBP/USD edges up, with buyers eyeing a clear break of the weekly high.
- Key resistance levels lie at 1.2803, and YTD high at 1.2893.
- The major can turn bearish below, falling below 1.2681.
The Pound Sterling registered minuscule gains versus the US Dollar in early trading during the North American session. Investors’ sentiment is upbeat as most US equity indices are rising, US Treasury bond yields are falling, and the Greenback was virtually unchanged against a basket of its peers. Therefore, the GBP/USD trades at 1.2719, up 0.11%.
GBP/USD Price Analysis: Technical outlook
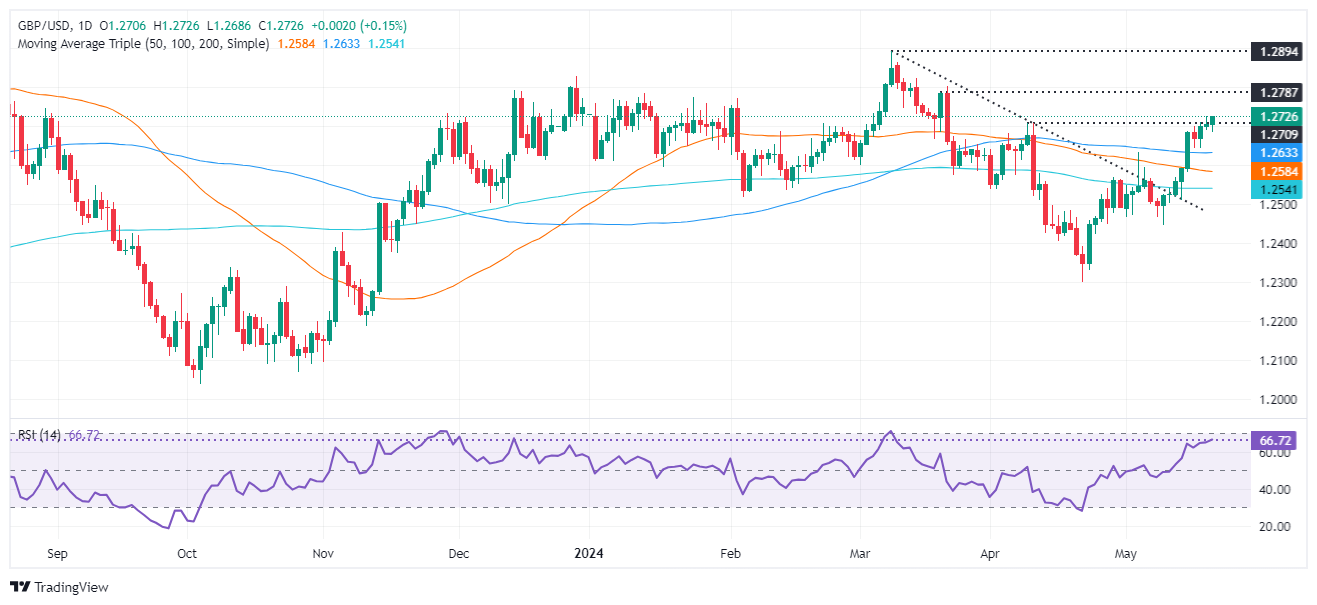
The GBP/USD pair shows a clear upward bias in the near term. While it has yet to print a new weekly high above Monday’s 1.2725, this could potentially pave the way for significant further gains.
Momentum is in favor of the buyers, as depicted by the Relative Strength Index (RSI), which is in bullish territory, though it’s about to turn overbought.
If GBP/USD buyers reclaim 1.2725, that could exacerbate a rally to the next pivot high at 1.2803, the March 21 high. Once surpassed, the next resistance would be the year-to-date (YTD) high at 1.2893.
Conversely, the pair could aim downwards if it registers a daily close below May 20’s low of 1.2681. That can expose the 100-day moving average (DMA) at 1.2634, followed by the 50-DMA at 1.2583.
GBP/USD Price Action – Daily Chart
British Pound PRICE Today
The table below shows the percentage change of British Pound (GBP) against listed major currencies today. British Pound was the strongest against the Canadian Dollar.
| USD | EUR | GBP | JPY | CAD | AUD | NZD | CHF | |
|---|---|---|---|---|---|---|---|---|
| USD | -0.02% | -0.14% | -0.17% | 0.13% | -0.10% | 0.07% | -0.09% | |
| EUR | 0.02% | -0.13% | -0.14% | 0.13% | -0.08% | 0.07% | -0.07% | |
| GBP | 0.14% | 0.13% | -0.04% | 0.28% | 0.04% | 0.20% | 0.05% | |
| JPY | 0.17% | 0.14% | 0.04% | 0.31% | 0.07% | 0.22% | 0.08% | |
| CAD | -0.13% | -0.13% | -0.28% | -0.31% | -0.23% | -0.07% | -0.23% | |
| AUD | 0.10% | 0.08% | -0.04% | -0.07% | 0.23% | 0.16% | 0.03% | |
| NZD | -0.07% | -0.07% | -0.20% | -0.22% | 0.07% | -0.16% | -0.15% | |
| CHF | 0.09% | 0.07% | -0.05% | -0.08% | 0.23% | -0.03% | 0.15% |
The heat map shows percentage changes of major currencies against each other. The base currency is picked from the left column, while the quote currency is picked from the top row. For example, if you pick the British Pound from the left column and move along the horizontal line to the US Dollar, the percentage change displayed in the box will represent GBP (base)/USD (quote).
- NZD/USD remains sideways with eyes on the RBNZ policy decision.
- The RBNZ is expected to keep interest rates steady.
- Fed officials are not confident in the progress of the disinflation process.
The NZD/USD pair consolidates in a tight range of 0.6100-0.6140 from the past three trading sessions. The Kiwi asset is expected to find direction after the announcement of the interest rate decision by the Reserve Bank of New Zealand (RBNZ), which is scheduled for Wednesday.
The RBNZ is widely expected to keep its Official Cash Rate (OCR) steady at 5.5%. Therefore, investors will focus on the interest rate guidance. Considering high inflation in the New Zealand region, the RBNZ is expected to hold interest rates steadily for a longer period. Currently, financial markets expect that the RBNZ will move to policy normalization in 2025.
Meanwhile, the US Dollar holds the crucial support of 104.50 as Federal Reserve (Fed) policymakers support for keeping interest rates at their current levels for a longer period. In the early American session, Atlanta Fed Bank President Raphael Bostic commented that he is not in a hurry for rate cuts and wants to be sure that inflation will not bounce again before considering rate cuts. When asked about the timing for rate cuts, Bostic said he doesn't see them before the fourth quarter of this year.
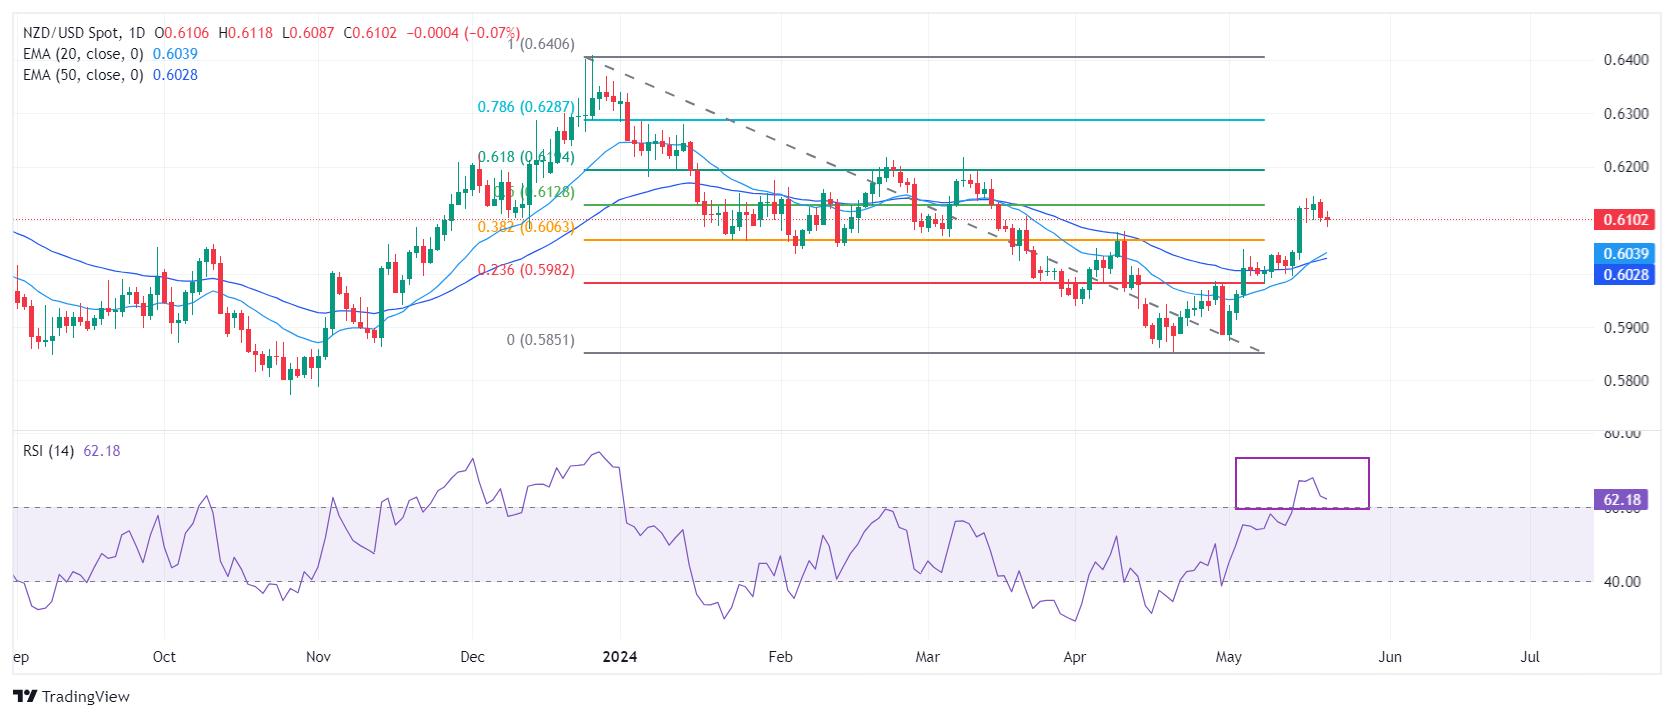
NZD/USD extends recovery to 50% Fibonacci retracement (plotted from December 26 high at 0.6410 to April 19 low around 0.5850) at 0.6130 on a daily timeframe. The near-term outlook of the Kiwi asset has improved as the 20- and 50-day Exponential Moving Averages (EMAs) around 0.6017. The 14-period Relative Strength Index (RSI) has shifted comfortably into the bullish range of 60.00-80.00, suggesting that the momentum has leaned toward the upside.
An upside move above February 9 high of 0.6160 will drive the asset towards 61.8% Fibo retracement at 0.6200, followed by January 15 high near 0.6250
On the contrary, fresh downside would appear if the asset breaks below April 4 high around 0.6050 This would drag the asset towards the psychological support of 0.6000 and April 25 high at 0.5969.
NZD/USD daily chart
- AUD/USD might be forming a bullish continuation pattern on the four-hour chart.
- A break above the 0.6714 high could confirm a continuation of the short-term uptrend.
- A break below the red trendline would bring into question the dominant uptrend.
AUD/USD is rising in a channel in a short-term uptrend that is biased to extend, given the old adage that “the trend is your friend”.
The Aussie is potentially forming a Bull Flag continuation pattern on the four-hour chart.
A break above the top of the consolidation that represents the “flag square” (shaded rectangle on chart below) and the 0.6714 May 16 highs, would confirm activation of the Bull Flag and a continuation of the short-term uptrend up to an initial target at 0.6728. Further bullishness could even see price rise to 0.6788.
AUD/USD 4-hour Chart
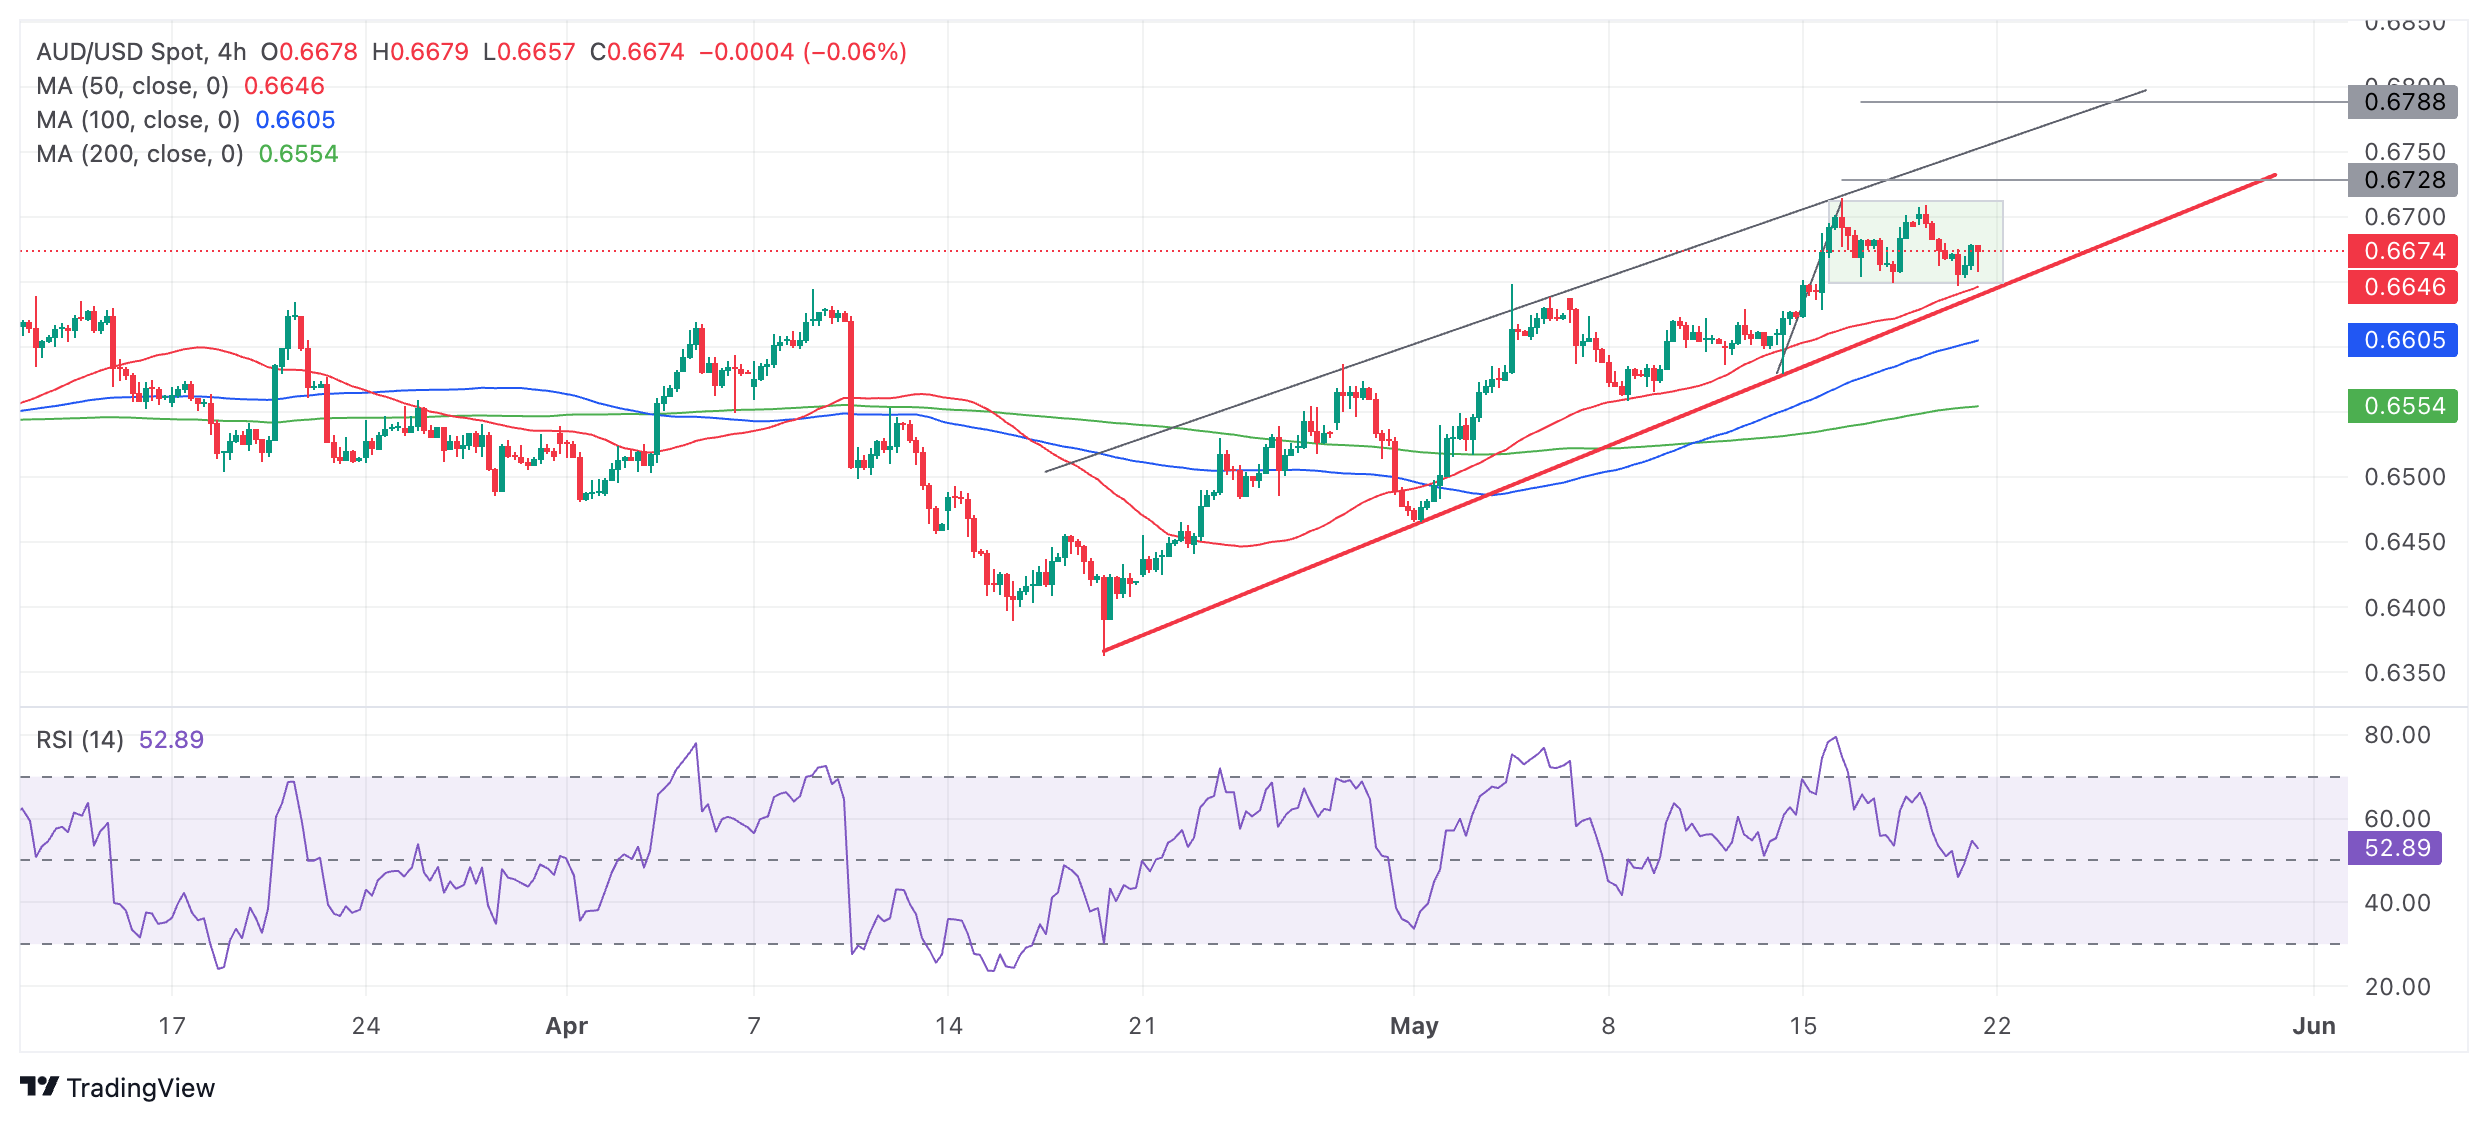
The Aussie is in a short-term uptrend indicated by the rising peaks and troughs on the four-hour chart since the April 19 lows.
A decisive break below the red trendline would be a bearish sign which could denote a change of the short-term trend.
Decisive would be characterized as a break that was accompanied by a long red candle that closed near its low or three red candles in a row that broke through the trendline.
- USD/JPY exhibits strength above 156.00 as the Fed maintains a hawkish tone on the interest rate outlook.
- Fed Bostic prefers to wait with current interest rates to be confident over the progress in disinflation.
- Japan’s officials remain worried over weak Yen-induced inflation.
The USD/JPY pair extends its winning spell for the fourth trading session on Tuesday. The asset strengthens as the US Dollar seems stabilizing due to endorsement for maintaining interest rates at their current levels for a longer period by Federal Reserve (Fed) officials.
Market sentiment turns slightly uncertain as Fed officials believe that a one-time decline in the United States inflation data is insufficient to build their confidence that price pressures will return to the desired rate of 2%. On Monday, Fed Vice Chair Philip Jefferson said it is too early to predict that the recent decline in inflationary pressures will be long-lasting.
In Tuesday’s early American session, the communication from Fed Governor Christopher Waller and Atlanta Fed Bank President Raphael Bostic was clear that they want to see more good inflation data before supporting policy normalization. Fed Bostic said he will wait longer for the rate cut to be sure that inflation will not bounce again.
Fed's Bostic: Fed has to be cautious about first rate move
When asked about a concrete timeframe for rate cuts, Bostic said he doesn’t expect before the fourth quarter of this year. On the inflation outlook, Bostic commented that business owners have experienced a decline in pricing power but are confident about economic prospects.
Considering overnight futures, the S&P 500 is expected to open on a flat-to-negative note. The US Dollar Index (DXY), which tracks the Greenback’s value against six major currencies, rises to 104.70. 10-year US Treasury yields have rebounded to 4.42%.
On the Tokyo front, Japan’s Finance Minister Shunichi Suzuki showed concerns over rising price pressures that are inspired by weak Japanese Yen. Suzuki said, "One of our major goals is to achieve wage increases that exceed the rise in prices," Suzuki said. "On the other hand, if prices continue to remain high, it will be difficult to reach this target even if wages rise."
This week, the USD/JPY pair will dance to the tunes of the Federal Open Market Committee (FOMC) minutes for the May meeting and Japan’s National Consumer Price Index (CPI) data for April, which will be published on Wednesday and Friday.
Federal Reserve Governor Christopher Waller said on Tuesday that he needs to see several more months of good inflation data before being comfortable to support an easing in policy, per Reuters.
Fed policymakers take on a cautious language on policy outlook.
Key takeaways
"Exception to that would be significant weakening in the labor market."
"Further increases in policy rate probably unnecessary."
"April inflation data suggests progress toward 2% target has likely resumed, but progress was modest."
"Data suggests inflation isn't accelerating."
"Economy seems to be evolving closer to what the Fed expected."
"Data on spending and labor market suggest monetary policy is at an appropriate setting to put downward pressure on inflation."
"Wage growth still a bit higher than desired, but not that high."
"Will be closely watching how private domestic final purchases fares into second quarter."
"Credit card and auto loan delinquency rates suggests some consumers under stress."
Market reaction
The US Dollar Index stays in its daily range slightly above 104.50 following these comments.
Atlanta Federal Reserve President Raphael Bostic said on Tuesday that the restrictive monetary policy is having an impact on rate-sensitive sectors and delaying investment, per Reuters.
Fed policymakers take on a cautious language on policy outlook.
Key takeaways
"Businesses are confident in underlying strength of the economy; next year or two should see continued solid performance."
"The efficacy of monetary policy may be weaker than in the past, but that doesn't mean it is having no impact at all."
"The Fed's highest priority is to get inflation back to 2%."
"Expecting inflation to decline but relatively slowly, would not expect a rate cut before the fourth quarter."
"No longer hearing about difficulties in supply chains; hope is that goods deflation continues."
"The upcoming framework review will be robust, given the number of open questions about the economy and policy."
"Though businesses are confident about the economy, they don't feel they have the same pricing power as even 6 months ago."
"Fed has to be cautious about the first rate move, may need to be later in order to not stoke pent-up exuberance for investment, other spending."
"Would rather wait longer for a rate cut to be sure inflation does not start to bounce around."
"Not in a hurry to cut rates; want to make sure that policy easing is unambiguous."
Market reaction
The US Dollar Index edged slightly higher following these comments and was last seen rising 0.1% on the day at 104.68.
Inflation in Canada, as measured by the change in the Consumer Price Index (CPI), declined to 2.7% on a yearly basis in April from 2.9% in March, Statistics Canada reported on Tuesday. This reading came in line with the market expectation.
On a monthly basis, the core CPI, which excludes volatile food and energy prices, remained unchanged while the CPI rose 0.5%. Meanwhile, the Bank of Canada's core Consumer Price Index increased 1.6% on a yearly basis, down from the 2% growth recorded in March.
Market reaction
USD/CAD edged higher with the immediate reaction and was last seen rising 0.1% on the day at 1.3638.
Canadian Dollar PRICE Today
The table below shows the percentage change of Canadian Dollar (CAD) against listed major currencies today. Canadian Dollar was the weakest against the Swiss Franc.
| USD | EUR | GBP | JPY | CAD | AUD | NZD | CHF | |
|---|---|---|---|---|---|---|---|---|
| USD | -0.03% | -0.06% | -0.02% | 0.09% | -0.10% | 0.05% | -0.12% | |
| EUR | 0.03% | -0.02% | 0.03% | 0.09% | -0.07% | 0.05% | -0.09% | |
| GBP | 0.06% | 0.02% | 0.06% | 0.14% | -0.05% | 0.09% | -0.07% | |
| JPY | 0.02% | -0.03% | -0.06% | 0.10% | -0.10% | 0.04% | -0.11% | |
| CAD | -0.09% | -0.09% | -0.14% | -0.10% | -0.18% | -0.05% | -0.21% | |
| AUD | 0.10% | 0.07% | 0.05% | 0.10% | 0.18% | 0.13% | 0.00% | |
| NZD | -0.05% | -0.05% | -0.09% | -0.04% | 0.05% | -0.13% | -0.16% | |
| CHF | 0.12% | 0.09% | 0.07% | 0.11% | 0.21% | -0.00% | 0.16% |
The heat map shows percentage changes of major currencies against each other. The base currency is picked from the left column, while the quote currency is picked from the top row. For example, if you pick the Canadian Dollar from the left column and move along the horizontal line to the US Dollar, the percentage change displayed in the box will represent CAD (base)/USD (quote).
Canadian Dollar FAQs
The key factors driving the Canadian Dollar (CAD) are the level of interest rates set by the Bank of Canada (BoC), the price of Oil, Canada’s largest export, the health of its economy, inflation and the Trade Balance, which is the difference between the value of Canada’s exports versus its imports. Other factors include market sentiment – whether investors are taking on more risky assets (risk-on) or seeking safe-havens (risk-off) – with risk-on being CAD-positive. As its largest trading partner, the health of the US economy is also a key factor influencing the Canadian Dollar.
The Bank of Canada (BoC) has a significant influence on the Canadian Dollar by setting the level of interest rates that banks can lend to one another. This influences the level of interest rates for everyone. The main goal of the BoC is to maintain inflation at 1-3% by adjusting interest rates up or down. Relatively higher interest rates tend to be positive for the CAD. The Bank of Canada can also use quantitative easing and tightening to influence credit conditions, with the former CAD-negative and the latter CAD-positive.
The price of Oil is a key factor impacting the value of the Canadian Dollar. Petroleum is Canada’s biggest export, so Oil price tends to have an immediate impact on the CAD value. Generally, if Oil price rises CAD also goes up, as aggregate demand for the currency increases. The opposite is the case if the price of Oil falls. Higher Oil prices also tend to result in a greater likelihood of a positive Trade Balance, which is also supportive of the CAD.
While inflation had always traditionally been thought of as a negative factor for a currency since it lowers the value of money, the opposite has actually been the case in modern times with the relaxation of cross-border capital controls. Higher inflation tends to lead central banks to put up interest rates which attracts more capital inflows from global investors seeking a lucrative place to keep their money. This increases demand for the local currency, which in Canada’s case is the Canadian Dollar.
Macroeconomic data releases gauge the health of the economy and can have an impact on the Canadian Dollar. Indicators such as GDP, Manufacturing and Services PMIs, employment, and consumer sentiment surveys can all influence the direction of the CAD. A strong economy is good for the Canadian Dollar. Not only does it attract more foreign investment but it may encourage the Bank of Canada to put up interest rates, leading to a stronger currency. If economic data is weak, however, the CAD is likely to fall.
- Silver price has reached a pivotal point in its technical development.
- There is a possibility of both a continuation to new highs and deeper correction.
- The trend broadly remains bullish, however, favoring an eventual resumption higher even if a correction unfolds.
Silver (XAG/USD) price is consolidating in the $31.60s on Tuesday after pulling back from Monday’s eleven-year high of $32.51.
The pair remains in a short-term uptrend which is biased to extend. It could be forming a Bull Flag continuation pattern (shaded rectangle on chart).
Silver 4-hour Chart
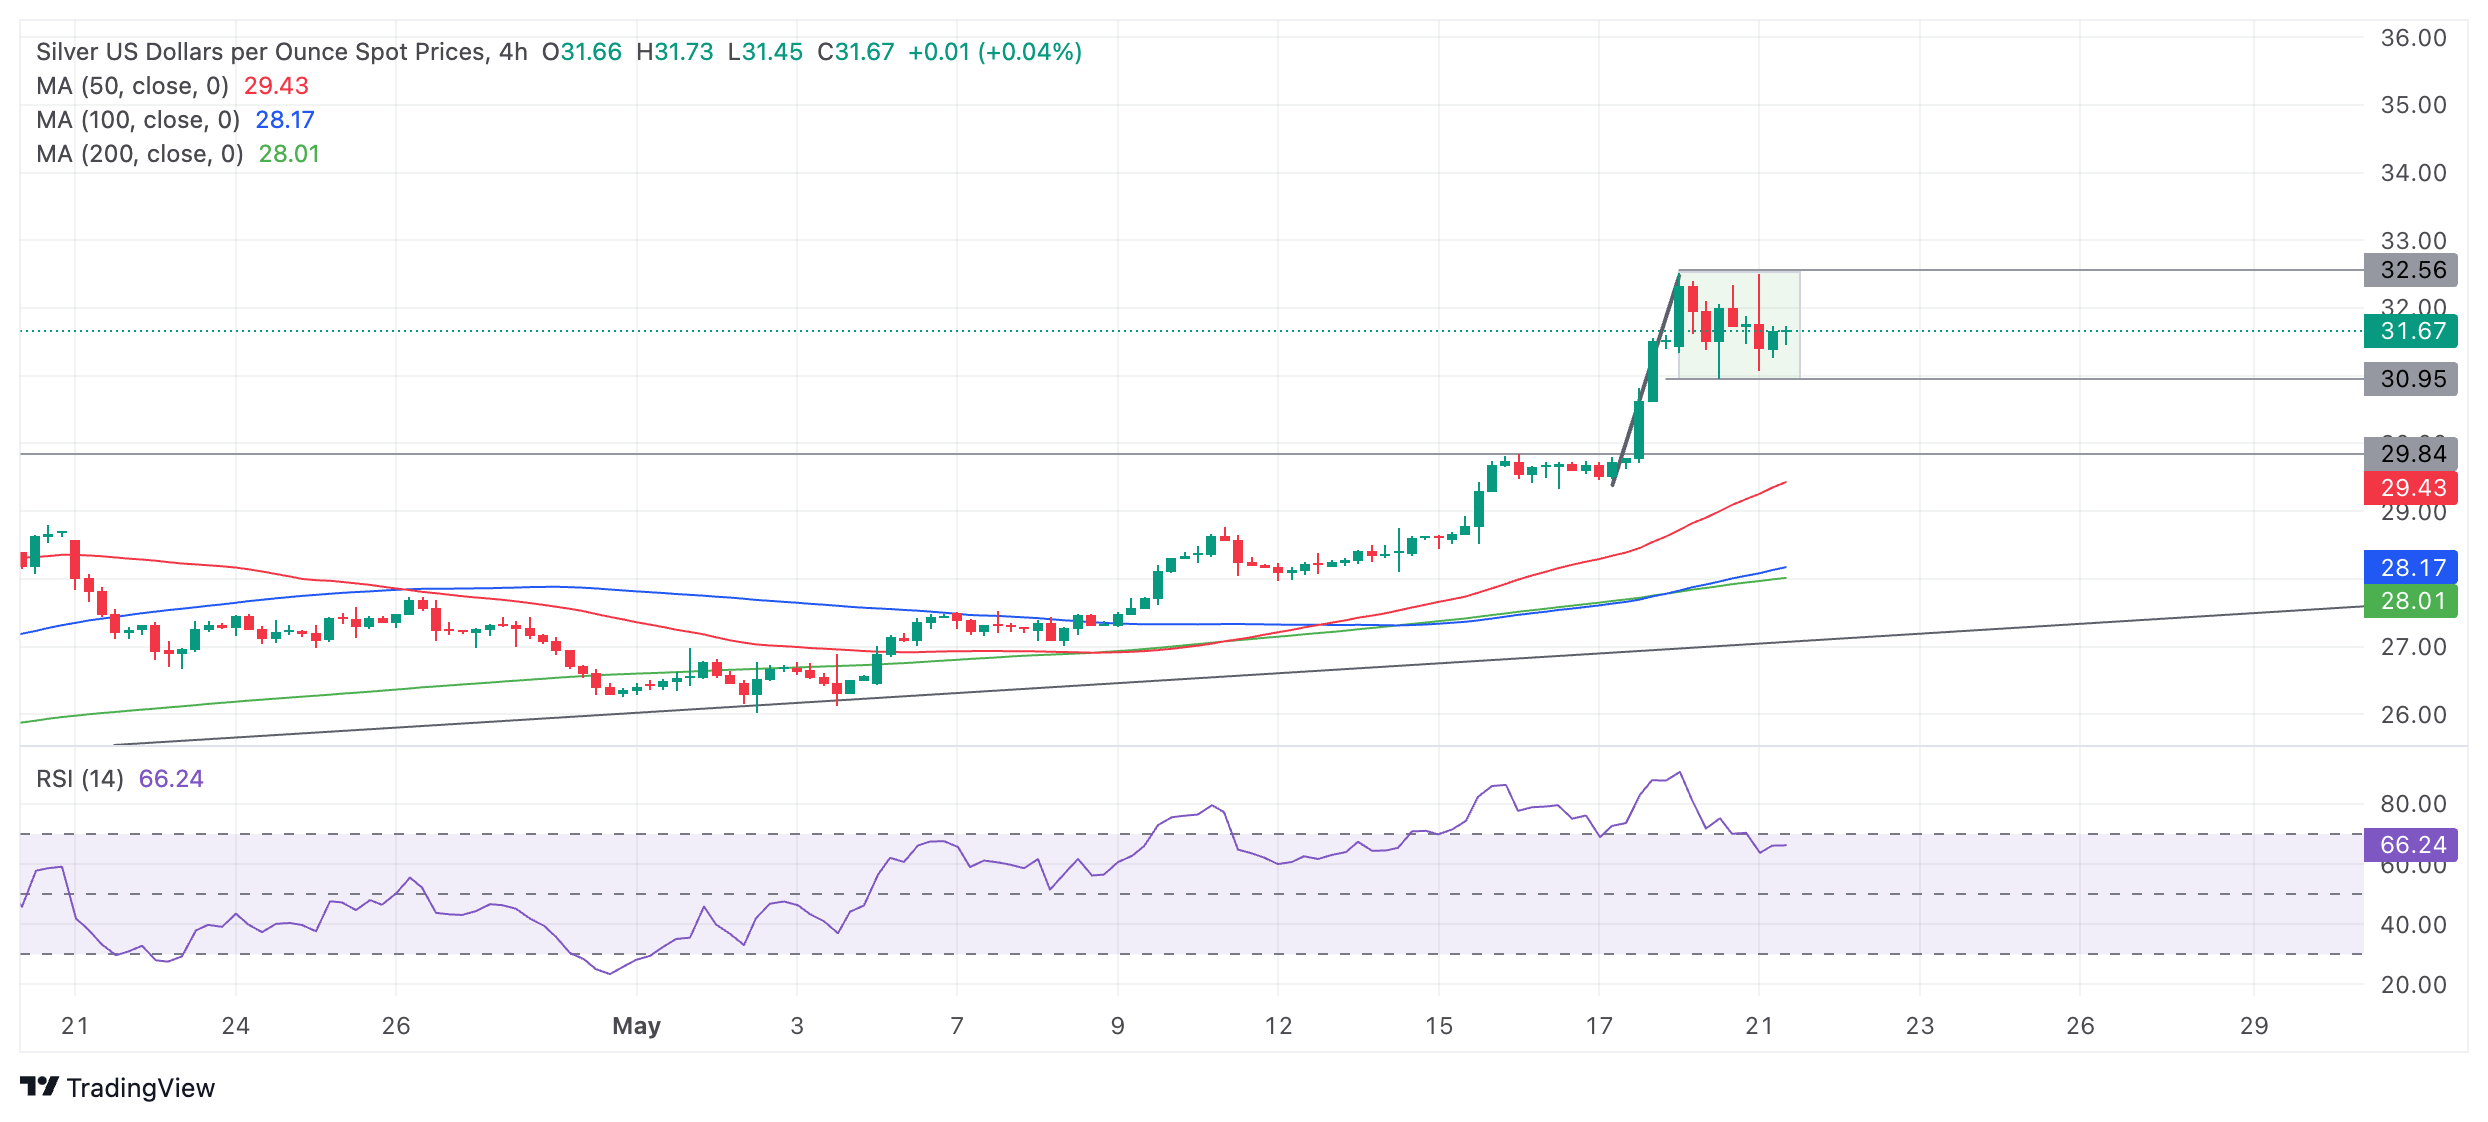
If Silver price breaks out above the consolidation rectangle on a closing basis it will activate the Bull Flag and continue the trend higher to the next target at $33.83-5. Further bullishness could even see Silver reach $35.34, a key former high.
A break on a closing basis below the current consolidation range’s lows at $30.95, however, would probably signal a deeper correction was unfolding.
Silver Daily Chart
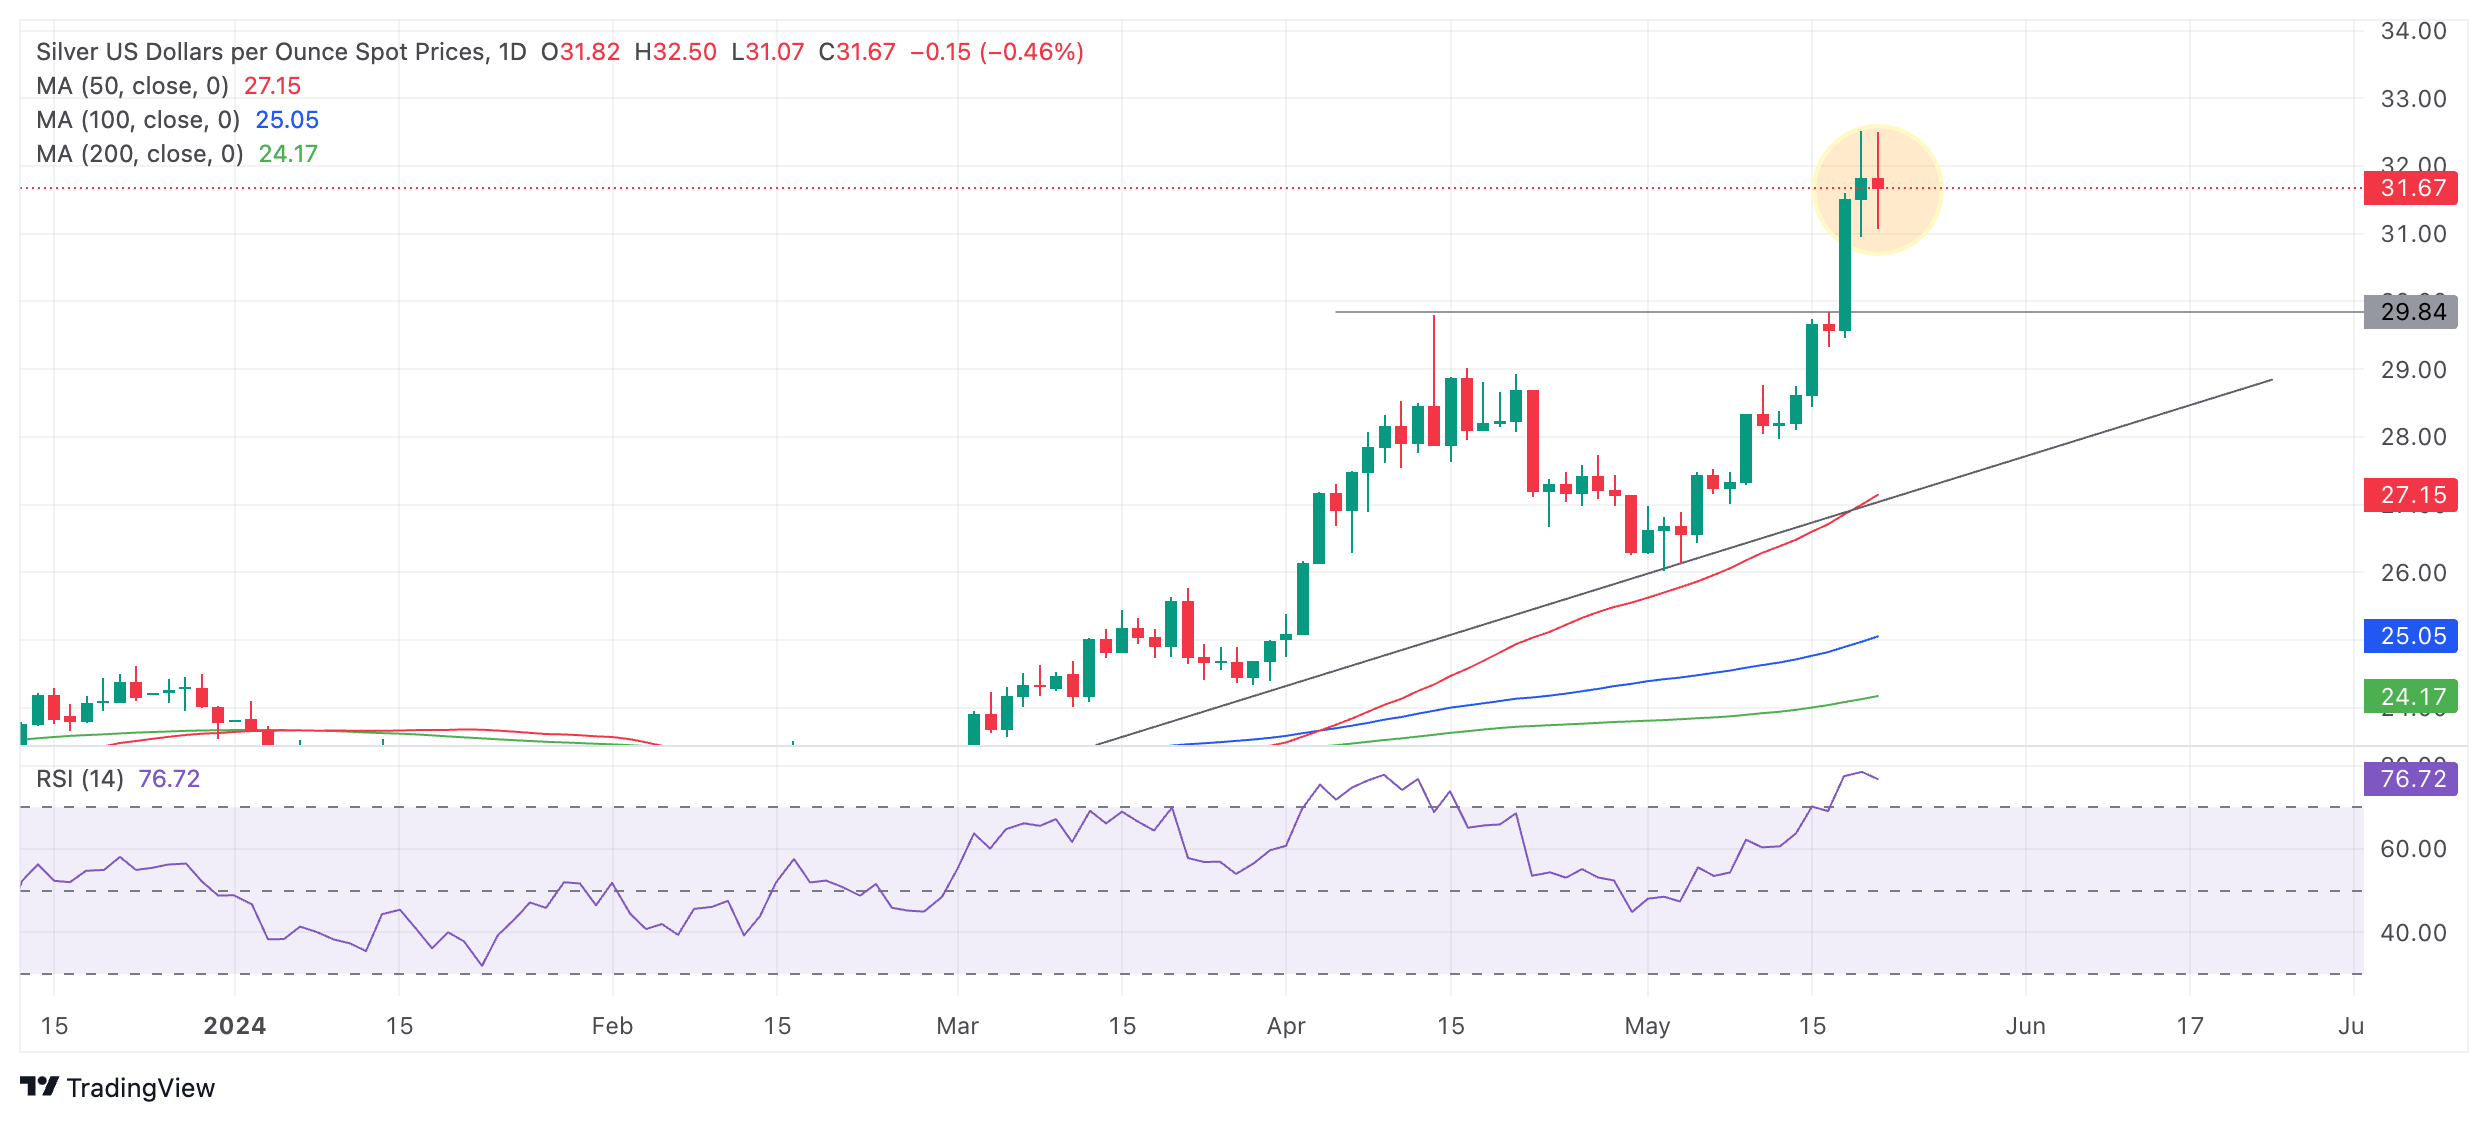
The daily chart is showing some bearish signs which could indicate the possibility of a deeper pull back evolving, however, it is still too early to say for sure.
A Tweezer Top Japanese candlestick pattern might be forming (shaded circle above) which if confirmed would be a bearish short-term reversal signal. Tweezer Top candlestick patterns occur where price reaches a peak and forms two consecutive days which have long upper wicks – the thin part of the candle from the shaded body up to the high – and whose highs are at a similar level. If Tuesday’s candle closes with a shape similar to the one at the time of writing it will be a signal a Tweezer Top has formed, with bearish connotations.
The Relative Strength Index (RSI) is also deeply in the overbought zone on the daily chart, suggesting traders should not add to their long holdings. If the RSI exits overbought on a closing basis it will signal a deeper correction is taking place.
A more bearish correction is likely to find support initially at the $30.00 level of the former range highs. Given the short and medium term trends are still bullish, however, Silver is likely to resume rallying after its correction finalizes.
It would require a decisive break below the $30.00 level to bring the uptrend into doubt.
A decisive break would be one accompanied by a long red candlestick that closed near its lows or three red candlesticks in a row.
- Fed policymakers' comments on policy outlook will be scrutinized by investors this week.
- Markets see a waning probability of a Fed policy hold in September.
- Fed rate outlook could influence the US Dollar's performance against its major rivals.
Federal Reserve (Fed) policymakers are scheduled to deliver speeches throughout this week as investors reassess the interest rate outlook following the April Consumer Price Index (CPI) data. According to the CME FedWatch Tool, the probability of a no change in the Fed's policy rate in September holds around 35%.
Richmond Fed President Thomas Barkin, Fed Governor Christopher Waller, NY Fed President John Williams, Boston Fed President Susan Collins and Cleveland Fed President Loretta Mester are among the Fed officials that are set to speak on Tuesday.
The Fed has adopted a cautious tone regarding the timing of the policy pivot following the stronger-than-expected inflation readings in the first quarter of the year. The US Bureau of Labor Statistics reported on May 15 that the core Consumer Price Index (CPI) rose 3.6% on a yearly basis in April. This reading followed the 3.8% increase recorded in March and came in line with the market expectation. On a monthly basis, the CPI and the core CPI both rose 0.3% after rising 0.4% in March. The US Dollar (USD) came under bearish pressure as market participants assessed the inflation data and the USD Index fell to its lowest level in over a month, losing over 0.7% on a weekly basis.
San Francisco Fed President Mary Daly noted on Monday that, while she expects shelter inflation to slowly improve, she said that she doesn't expect progress to be quick. Fed's Daly also noted that she is not confident that inflation is sustainably coming down to the Fed's 2% inflation target.
Fed Vice Chair for Supervision Michael Barr said that the Fed is in a good position to hold the policy steady and watch the economy, per Reuters. Meanwhile, Fed Vice Chair of the Board of Governors Phillip Jefferson acknowledged that April's better inflation reading was encouraging and added that it was too early to tell if the recent slowdown in disinflationary process will be long-lasting.
Last week, Fed Board of Governors member Michelle Bowman said that progress on inflation may not be as consistent as many hoped. Cleveland Fed President Mester emphasized that maintaining the current levels of Fed policy will aid in returning still-elevated inflation to the 2% target. Richmond Fed President Thomas Barkin told CNBC last Thursday that the latest Consumer Price Index (CPI) data showed that inflation was not where the Fed is trying to get. Finally, New York Fed President Williams argued that there was no need for a rate cut in the near term.
Fed FAQs
Monetary policy in the US is shaped by the Federal Reserve (Fed). The Fed has two mandates: to achieve price stability and foster full employment. Its primary tool to achieve these goals is by adjusting interest rates. When prices are rising too quickly and inflation is above the Fed’s 2% target, it raises interest rates, increasing borrowing costs throughout the economy. This results in a stronger US Dollar (USD) as it makes the US a more attractive place for international investors to park their money. When inflation falls below 2% or the Unemployment Rate is too high, the Fed may lower interest rates to encourage borrowing, which weighs on the Greenback.
The Federal Reserve (Fed) holds eight policy meetings a year, where the Federal Open Market Committee (FOMC) assesses economic conditions and makes monetary policy decisions. The FOMC is attended by twelve Fed officials – the seven members of the Board of Governors, the president of the Federal Reserve Bank of New York, and four of the remaining eleven regional Reserve Bank presidents, who serve one-year terms on a rotating basis.
In extreme situations, the Federal Reserve may resort to a policy named Quantitative Easing (QE). QE is the process by which the Fed substantially increases the flow of credit in a stuck financial system. It is a non-standard policy measure used during crises or when inflation is extremely low. It was the Fed’s weapon of choice during the Great Financial Crisis in 2008. It involves the Fed printing more Dollars and using them to buy high grade bonds from financial institutions. QE usually weakens the US Dollar.
Quantitative tightening (QT) is the reverse process of QE, whereby the Federal Reserve stops buying bonds from financial institutions and does not reinvest the principal from the bonds it holds maturing, to purchase new bonds. It is usually positive for the value of the US Dollar.
- The US Dollar trades mixed on Monday with no clear direction in the European session.
- The Greenback is not soaring despite the risk-off sentiment in markets.
- The US Dollar Index keeps hovering around 104.50 waiting for a fresh catalyst.
The US Dollar (USD) is afloat on Tuesday, holding around 104.50 as measured by the US Dollar Index (DXY), with no clear direction visible for the week after the standstill performance on Monday. Markets are a bit all over the place with recent polls indicating former US President Donald Trump would win if elections were held today, while equities are sliding lower ahead of Nvidia earnings on Wednesday. Add another fresh set of Fed speakers to the mix, and today’s trading could get bumpy.
On the economic data front, no first-tier indicators are scheduled for today, and the focus will be, as mentioned above, on the Federal Reserve (Fed). On Monday, markets already heard from many Fed members, though the message was very unified in line that the Fed could still do whatever it considered appropriate to tame inflationary pressures. Of course, markets are not buying into the idea that another rate hike is on the horizon, though a “steady for a bit longer” stance is now fully priced in.
Daily digest market movers: Fed members again
- The US Redbook Index for the week ending May 17 is due at 12:55 GMT. The previous number was 6.3%.
- No less than seven Fed members are due to speak:
- At 13:00 GMT, Federal Reserve Governor Christopher Waller delivers a speech about the US economic outlook at the Peterson Institute for International Economics.
- At the same time, Federal Reserve Bank of Richmond President Thomas Barkin delivers opening remarks at the bank's conference "Investing in Rural America".
- Federal Reserve Bank of New York President John Williams delivers opening remarks at the 2024 Governance and Cultural Reform Conference at 13:05 GMT.
- Fed Vice Chair for Supervision Michael Barr will discuss the economy, lessons learned from the 2023 liquidity crisis, and regional banking supervision in a fireside chat at the 2024 Regional State Member Bank Director and Executive Conference at 14:45 GMT.
- Near 23:00 GMT, Federal Reserve Bank of Atlanta President Raphael Bostic moderates a keynote speech at the Atlanta Fed's Financial Market Conference dinner. He will be joined by Federal Reserve Bank of Boston President Susan Collins and Federal Reserve Bank of Cleveland President Loretta Mester.
- Equities are on the back foot, with Asian equities erasing the positive vibe from Monday. The Hong Kong Hang Seng Index trades 2% lower near its closing bell, while European indices are struggling around 0.50% down. US equity futures are still looking for direction ahead of the US opening bell.
- The CME Fedwatch Tool suggests a 96.4% probability that June will still see no change to the Federal Reserve's fed fund rate. Odds have changed for September, with the tool showing a 49.6% chance that rates will be 25 basis points lower than current levels.
- The benchmark 10-year US Treasury Note trades around 4.31%, in the middle of this week's range.
US Dollar Index Technical Analysis: Can Fed officials support the DXY
The US Dollar Index (DXY) trades mixed on Tuesday, with markets holding their breath while waiting for Nvidia earnings on Wednesday. The fact that an earnings release of a single stock is the most important event shows that there are no big catalysts to deliver some sense of direction for markets. However, it is clear that since some weeks ago, markets have been happy again to head into risk-on, which amasses in an easing US Dollar overall.
On the upside, the DXY Index is already near a chunky resistance level. The first level to recover is the 55-day Simple Moving Average (SMA) at 104.72. Further up, the following levels to consider are 105.12 and 105.52.
On the downside, the 100-day SMA around 104.20 is the last man supporting the decline. Once that level snaps, an air pocket is placed between 104.11 and 103.00. Should the US Dollar decline persist, the low of March at 102.35 and the low from December at 100.62 are levels to consider.
US Dollar FAQs
The US Dollar (USD) is the official currency of the United States of America, and the ‘de facto’ currency of a significant number of other countries where it is found in circulation alongside local notes. It is the most heavily traded currency in the world, accounting for over 88% of all global foreign exchange turnover, or an average of $6.6 trillion in transactions per day, according to data from 2022. Following the second world war, the USD took over from the British Pound as the world’s reserve currency. For most of its history, the US Dollar was backed by Gold, until the Bretton Woods Agreement in 1971 when the Gold Standard went away.
The most important single factor impacting on the value of the US Dollar is monetary policy, which is shaped by the Federal Reserve (Fed). The Fed has two mandates: to achieve price stability (control inflation) and foster full employment. Its primary tool to achieve these two goals is by adjusting interest rates. When prices are rising too quickly and inflation is above the Fed’s 2% target, the Fed will raise rates, which helps the USD value. When inflation falls below 2% or the Unemployment Rate is too high, the Fed may lower interest rates, which weighs on the Greenback.
In extreme situations, the Federal Reserve can also print more Dollars and enact quantitative easing (QE). QE is the process by which the Fed substantially increases the flow of credit in a stuck financial system. It is a non-standard policy measure used when credit has dried up because banks will not lend to each other (out of the fear of counterparty default). It is a last resort when simply lowering interest rates is unlikely to achieve the necessary result. It was the Fed’s weapon of choice to combat the credit crunch that occurred during the Great Financial Crisis in 2008. It involves the Fed printing more Dollars and using them to buy US government bonds predominantly from financial institutions. QE usually leads to a weaker US Dollar.
Quantitative tightening (QT) is the reverse process whereby the Federal Reserve stops buying bonds from financial institutions and does not reinvest the principal from the bonds it holds maturing in new purchases. It is usually positive for the US Dollar.
(This story was corrected at 11:23 GMT to say that the earnings release for Nvidia is on Wednesday)
- Oil tests the support of its 2024 rally again on Tuesday.
- Markets disregard current events in the Middle East as there is no risk for output in the region.
- The US Dollar Index is looking for direction, caught in a tight range at the beginning of the week.
Oil prices edge lower and trade around $78.50 on Tuesday, testing market belief and support for further upside. Traders are not hanging any weight or importance of risk on the two main headlines that came out on Monday and today. On the one side, the funeral of the Iranian President who crashed in a helicopter accident. The second is the international arrest warrant from the International Criminal Court for Israeli leader Benjamin Netanyahu and the country’s defence minister on war crimes charges.
Meanwhile, the US Dollar Index (DXY), which tracks the performance of the US Dollar against a basket of six major currencies, is looking for direction, with markets flip-flopping between risk-on and risk-off ahead of Nvidia earnings later in the day. With another big batch of Federal Reserve (Fed) speakers scheduled on Tuesday, it almost feels like a ‘play and repeat’ from every Fed member. So, there is likely no new insights that could hint at the exact timing for the initial interest rate cut from the Fed.
At the time of writing, Crude Oil (WTI) trades at $78.52 and Brent Crude at $82.79.
Oil news and market movers: Despite headlines, no risk added
- Several countries have issued warnings and have asked to remain on high alert with possible retaliations in the wake of the helicopter accident in which the Iranian President died.
- US President Joe Biden has lashed out at the International Criminal Court in an attempt to stand by its ally Israel, Reuters reported.
- Bloomberg News reports that President Vladimir Putin said Russia’s Oil output declined by 1.8% at the start of 2024 compared to the same period last year.
- At 20:30 GMT, the American Petroleum Institute (API) will release the numbers for the US crude weekly stockpile change for the week ending May 17 on Tuesday. The previous number was a drawdown of 3.104 million barrels.
Oil Technical Analysis: How long can this support last?
Oil prices are again testing the upward-sloping trend line from the December low for nearly a third week in a row. Although a slew of headlines is coming out of the Middle East, traders are not labelling any of the events or headlines as a risk element that could cause disruptions to either oil supply out of the region or for global trade. This makes Oil an outlier, where Oil traders are missing out on the commodity rally that is taking place in precious metals and Gas futures.
On the upside, the line in the sand remains at the 200-day Simple Moving Average (SMA), currently at $79.62. Once above that level, a double layer comes up with the 100-day SMA at $78.58. In case of an upward extension above that zone, the road is open for $87.12 again.
On the downside, the pivotal level at $75.28 is the last solid line in the sand that could support the end this decline. If this level is unable to hold, investors could expect an accelerated sell-off towards $72.00 and $70.00,. That would erasinge all gains for 2024. Further down, and then Oil price could test $68, the December 13 low.
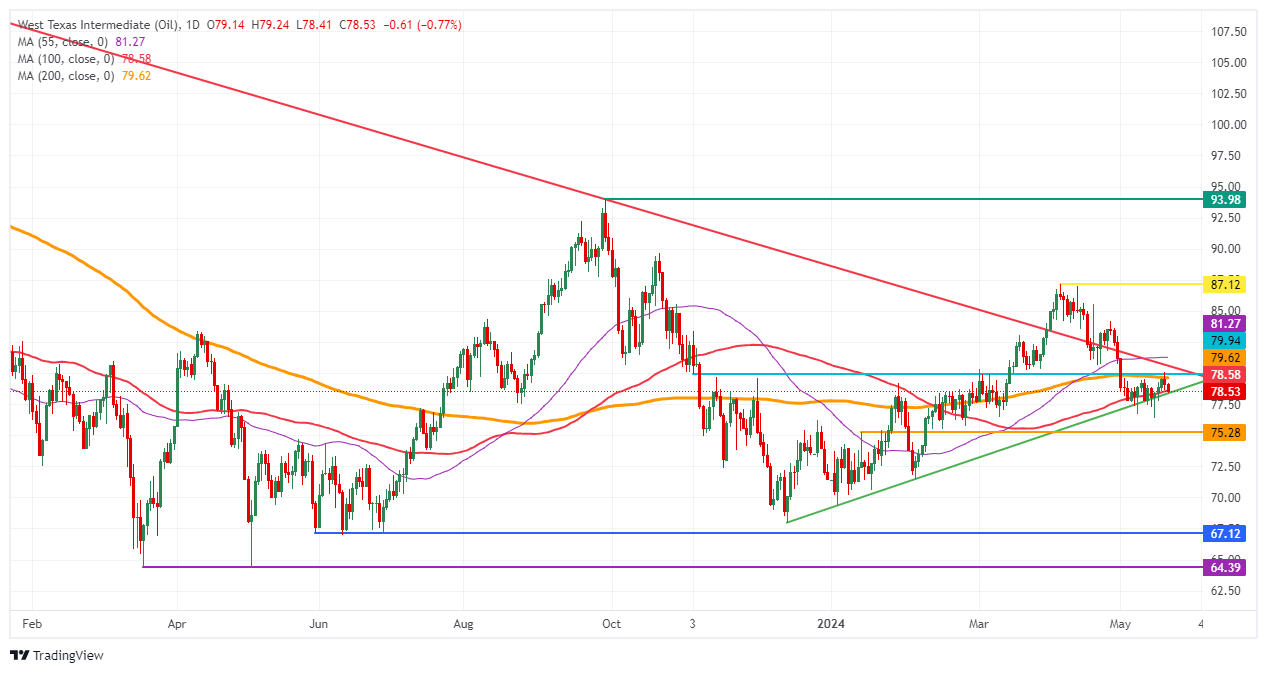
US WTI Crude Oil: Daily Chart
WTI Oil FAQs
WTI Oil is a type of Crude Oil sold on international markets. The WTI stands for West Texas Intermediate, one of three major types including Brent and Dubai Crude. WTI is also referred to as “light” and “sweet” because of its relatively low gravity and sulfur content respectively. It is considered a high quality Oil that is easily refined. It is sourced in the United States and distributed via the Cushing hub, which is considered “The Pipeline Crossroads of the World”. It is a benchmark for the Oil market and WTI price is frequently quoted in the media.
Like all assets, supply and demand are the key drivers of WTI Oil price. As such, global growth can be a driver of increased demand and vice versa for weak global growth. Political instability, wars, and sanctions can disrupt supply and impact prices. The decisions of OPEC, a group of major Oil-producing countries, is another key driver of price. The value of the US Dollar influences the price of WTI Crude Oil, since Oil is predominantly traded in US Dollars, thus a weaker US Dollar can make Oil more affordable and vice versa.
The weekly Oil inventory reports published by the American Petroleum Institute (API) and the Energy Information Agency (EIA) impact the price of WTI Oil. Changes in inventories reflect fluctuating supply and demand. If the data shows a drop in inventories it can indicate increased demand, pushing up Oil price. Higher inventories can reflect increased supply, pushing down prices. API’s report is published every Tuesday and EIA’s the day after. Their results are usually similar, falling within 1% of each other 75% of the time. The EIA data is considered more reliable, since it is a government agency.
OPEC (Organization of the Petroleum Exporting Countries) is a group of 13 Oil-producing nations who collectively decide production quotas for member countries at twice-yearly meetings. Their decisions often impact WTI Oil prices. When OPEC decides to lower quotas, it can tighten supply, pushing up Oil prices. When OPEC increases production, it has the opposite effect. OPEC+ refers to an expanded group that includes ten extra non-OPEC members, the most notable of which is Russia.
- AUD/USD revives intraday losses due to hawkish RBA minutes and a slight decline in the US Dollar.
- Fed officials remain worried over stalled progress in the process of disinflation.
- Investors await the FOMC minutes of the May meeting for fresh guidance.
The AUD/USD pair rebounds from the intraday low of 0.6650 in Tuesday’s European session. The Aussie asset finds strength as the Reserve Bank of Australia (RBA) minutes of the May meeting have suggested that policymakers discussed over raising interest rates further as risks of inflation remaining skewed on the upside for an extended period have deepened.
A mild recovery move in the Aussie asset is also driven by a slight decline in the US Dollar. The US Dollar struggles to come out of the woods despite hawkish guidance on interest rates by Federal Reserve (Fed) officials have weighed on traders’ bets that are in favor of rate cuts in September. The CME FedWatch tool shows a 61% chance that interest rates will come down from their desired levels. The probability has reduced from 65% recorded a week ago.
Cleveland Fed Bank President Loretta Mester said in an interview with Bloomberg on Monday cautioned that risks to inflation have skewed to the upside, which suggests that three rate-cut are not appropriate this year. She emphasized maintaining interest rates at their current levels. She added that they have additional time to gather more data.
Meanwhile, investors shift focus to the Federal Open Market Committee (FOMC) minutes for the May policy meeting, which will be published on Wednesday. Officials view on the interest rate outlook in the May meeting is expected to have remained hawkish as hotter-than-expected inflation in the January-March period indicated that the progress in the disinflation process has stalled.
- Gold price is correcting lower after touching an all-time high of $2,450 on Monday.
- Acute bearish divergence on the daily chart could indicate a deeper correction may follow.
- The pullback appears to be driven by central banks communicating a reluctance to lower interest rates.
Gold price (XAU/USD) retreats to the $2,410s on Tuesday as commentary from central bank policymakers around the globe reveals a reluctance to commit to lowering interest rates. The precious metal tends to perform more poorly in an environment of relatively higher interest rates because of the returns investors can reap by remaining in cash or bonds.
Persistent geopolitical concerns stemming from conflicts in the Middle East and Ukraine, however, are acting as a positive counterweight for Gold price. Gold hoarding by emerging markets and BRICS nations’ central banks as an insurance policy against Western sanctions that usually target US Dollar (USD) or Euro (EUR) reserves, is a further supporting factor.
Gold price retreats on shift in outlook for interest rates
Gold price pulls back on Tuesday after central bankers in the US and Australia not only refuse to commit to lowering interest rates but also discuss the possibility of raising them.
On Monday, Federal Reserve Bank of Cleveland President Loretta Mester said the Fed could “even raise them (rates)” if inflation rose, and that it was “no longer appropriate” to expect the Fed to make three cuts this year.
On Tuesday morning, the Reserve Bank of Australia (RBA) released the minutes from its May meeting, which revealed that the board of governors had discussed the possibility of raising interest rates. It was the first time in many months they had discussed policy tightening.
Technical Analysis: Gold price pulls back, RSI diverging
Gold price (XAU/USD) has pulled back from all-time highs at around $2,450 on Tuesday after forming a Shooting Star Japanese candlestick pattern on Monday. This candlestick pattern occurs when the price reaches a new high and then retreats to close near its low. It is a bearish sign after an uptrend, especially when followed by a red bearish candlestick on the next day, as is currently the case. If Tuesday ends as a red down day it could be a sign of a deeper correction to come.
However, if Tuesday ends as a green bullish day, it will reduce the significance of the Shooting Star and could be a sign that the dominant bullish trend is more likely to continue.
XAU/USD Daily Chart
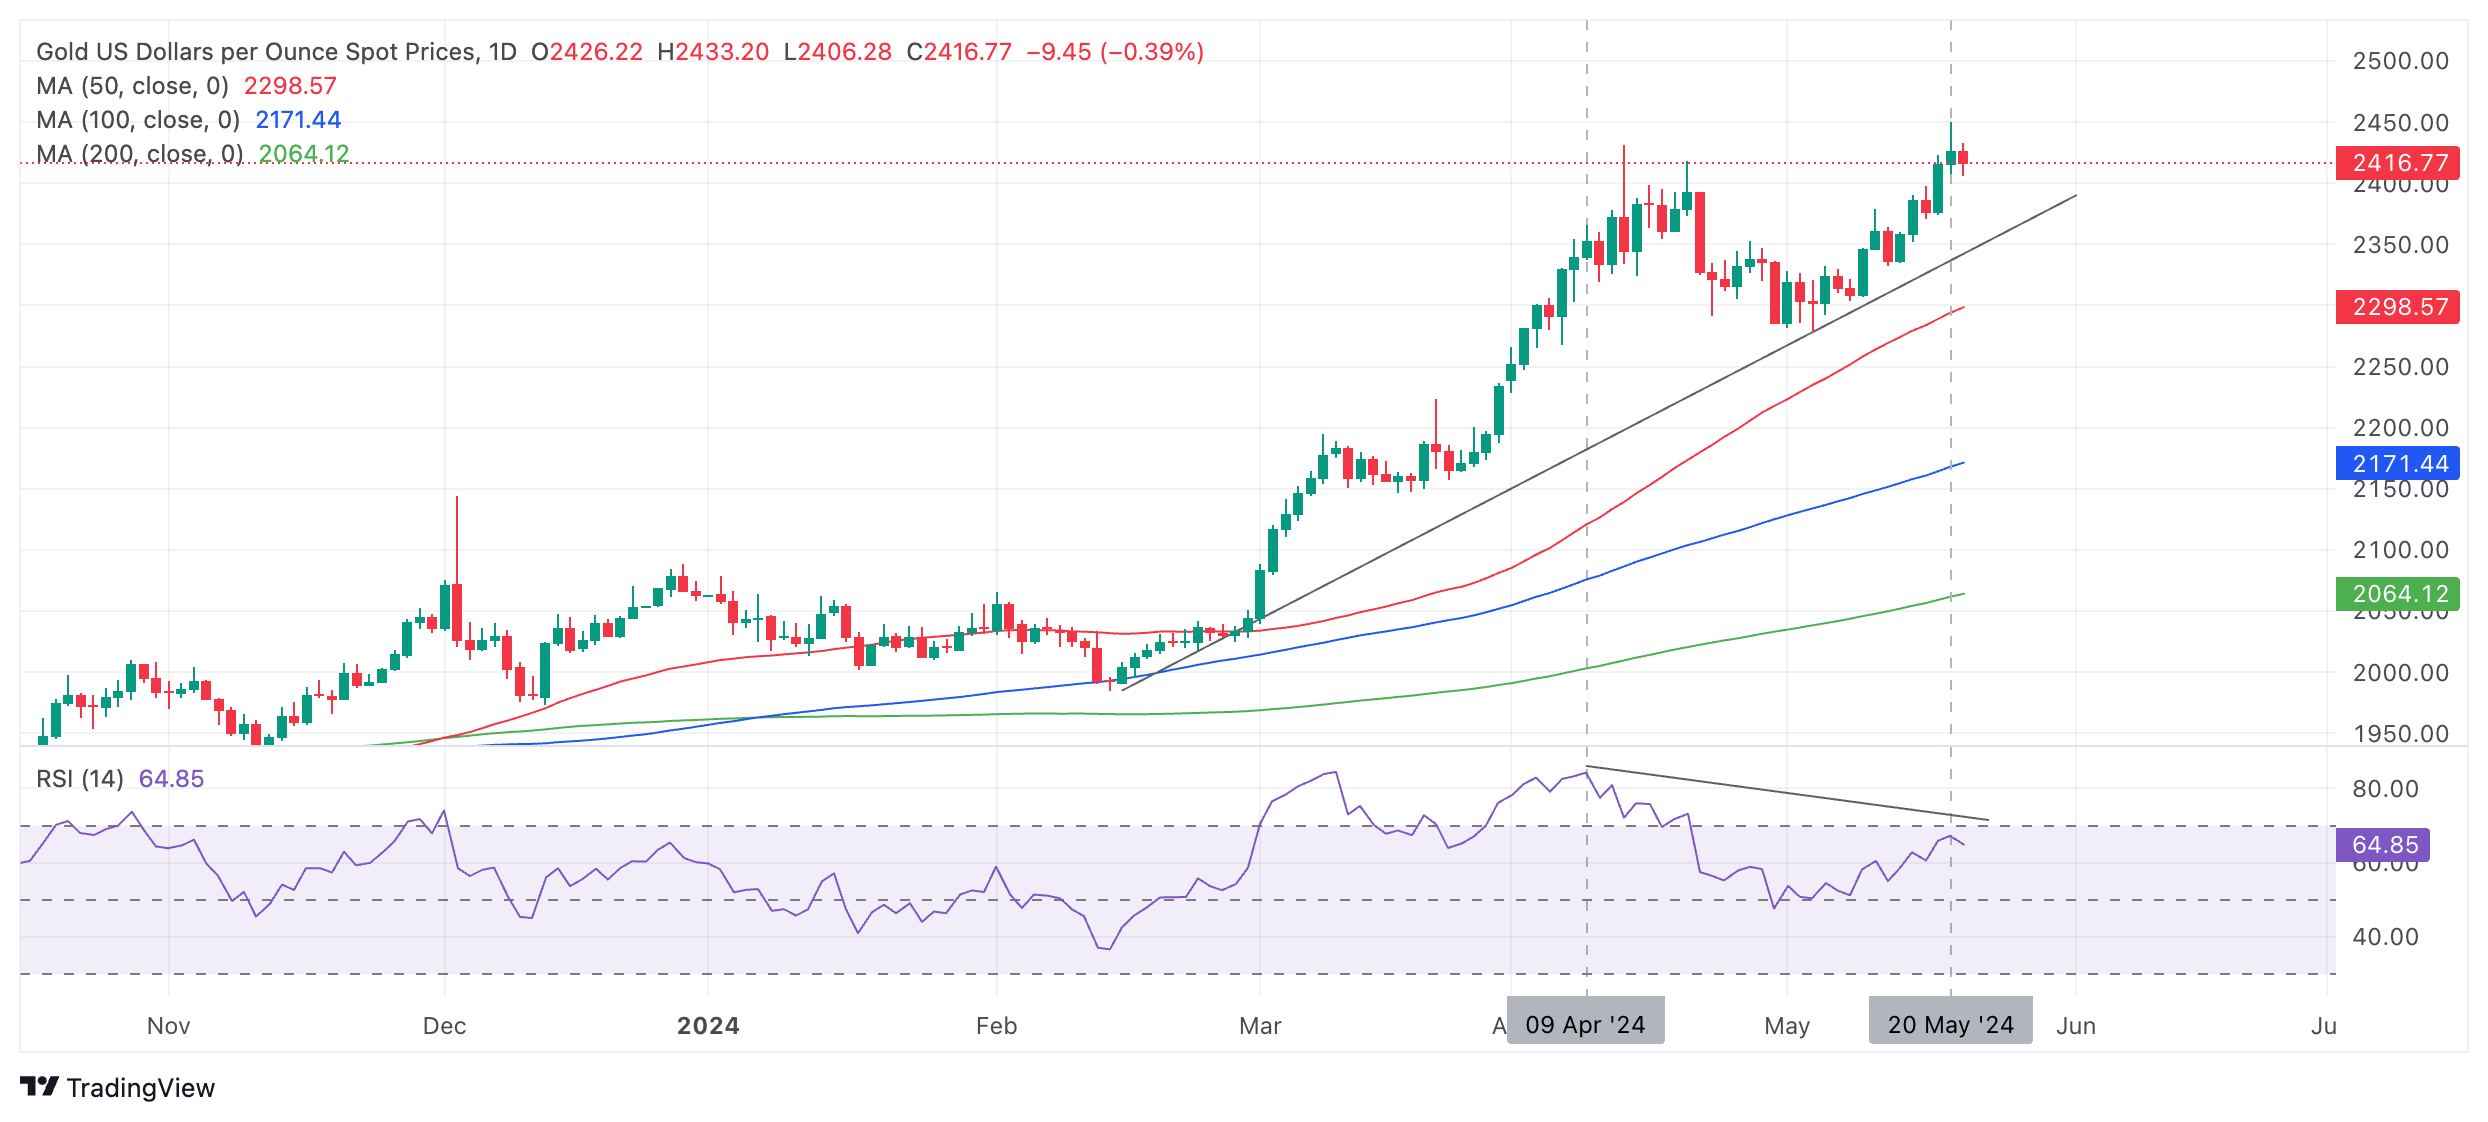
The Relative Strength Index (RSI) momentum indicator shows acute bearish divergence with price on the daily chart, providing further evidence that a correction may be about to unfold. Although the Gold price rose above the April 12 peak to make a higher high on May 20, the RSI failed to make a higher high. This is a bearish indication, suggesting a greater chance of a pull-back evolving.
If a correction unfolds, Gold will probably fall to support at the upward-sloping trendline in the $2,360s.
However, the precious metal’s short-medium and long-term trends are bullish, and given the old adage that “the trend is your friend”, the odds favor an eventual recovery even if there is a correction.
A break above the new $2,450 all-time high would likely continue the rally to the next target at the psychologically significant $2,500 level.
Gold FAQs
Gold has played a key role in human’s history as it has been widely used as a store of value and medium of exchange. Currently, apart from its shine and usage for jewelry, the precious metal is widely seen as a safe-haven asset, meaning that it is considered a good investment during turbulent times. Gold is also widely seen as a hedge against inflation and against depreciating currencies as it doesn’t rely on any specific issuer or government.
Central banks are the biggest Gold holders. In their aim to support their currencies in turbulent times, central banks tend to diversify their reserves and buy Gold to improve the perceived strength of the economy and the currency. High Gold reserves can be a source of trust for a country’s solvency. Central banks added 1,136 tonnes of Gold worth around $70 billion to their reserves in 2022, according to data from the World Gold Council. This is the highest yearly purchase since records began. Central banks from emerging economies such as China, India and Turkey are quickly increasing their Gold reserves.
Gold has an inverse correlation with the US Dollar and US Treasuries, which are both major reserve and safe-haven assets. When the Dollar depreciates, Gold tends to rise, enabling investors and central banks to diversify their assets in turbulent times. Gold is also inversely correlated with risk assets. A rally in the stock market tends to weaken Gold price, while sell-offs in riskier markets tend to favor the precious metal.
The price can move due to a wide range of factors. Geopolitical instability or fears of a deep recession can quickly make Gold price escalate due to its safe-haven status. As a yield-less asset, Gold tends to rise with lower interest rates, while higher cost of money usually weighs down on the yellow metal. Still, most moves depend on how the US Dollar (USD) behaves as the asset is priced in dollars (XAU/USD). A strong Dollar tends to keep the price of Gold controlled, whereas a weaker Dollar is likely to push Gold prices up.
- EUR/USD trades back and forth around 1.0850 with eyes on FOMC minutes and preliminary Eurozone and US PMIs.
- Doubts are rising over the possibility that the ECB will extend the rate-cut cycle beyond June.
- Fed officials say they need to see more soft inflation data to be sure that inflation will return to 2%.
EUR/USD is stuck in a tight range near 1.0850 in Tuesday’s European session. The major currency pair is expected to continue its sideways performance as the US Dollar (USD) stabilizes ahead of the publication later this week of the Federal Open Market Committee (FOMC) Minutes and the preliminary S&P Global Purchasing Managers Index (PMI) data for May.
The Euro trades relatively firm against the US Dollar (USD) as uncertainty over the European Central Bank (ECB) extending the rate-cut cycle beyond June has deepened. ECB policymakers are comfortable with the central bank starting to lower its three key interest rates from the June meeting, but are reluctant to commit to any further rate path and said they prefer to remain data-dependent.
Some ECB policymakers cautioned that a follow-up rate cut in the July meeting could revamp price pressures and offset the impact of the job done to tame sticky price pressures.
Daily digest market movers: EUR/USD stays calm ahead of Eurozone, US PMIs
- EUR/USD consolidates in a tight range near 1.0850 as investors look for fresh cues about the interest rate outlook on both sides of the Atlantic. As for the United States, Federal Reserve (Fed) officials continue to emphasize the need to maintain the restrictive policy framework as they are not convinced that price pressures will sustainably return to the desired rate of 2%.
- US inflation declined as expected in April. However, Fed policymakers want to see more good inflation data to gain confidence that price growth is on course to return to the 2% target. Therefore, Fed policymakers reiterate that the current monetary policy is in good shape and needs to remain at its current levels.
- On Monday, Fed Vice Chair for Supervision Michael Barr said "Q1 inflation was disappointing and did not provide the confidence needed to ease monetary policy". Barr vowed to allow more time for a tight policy stance to do its job, Reuters reported. Separately, Atlanta Fed Bank President Raphael Bostic said to Bloomberg TV that officials would take a while to be certain that inflation will come down to 2%.
- Meanwhile, investors shift focus to the FOMC minutes for the May policy meeting, which will be published on Wednesday. Officials' view on the interest rate outlook in the May meeting is expected to be hawkish as hotter-than-expected inflation in the January-March period indicated that the progress in the disinflation process stalled.
- On the economic data front, investors await the preliminary Eurozone and United States PMI data for May, which will be published on Thursday. The PMI data will gauge the economic outlook of the respective nations.
Technical Analysis: EUR/USD consolidates around 1.0850
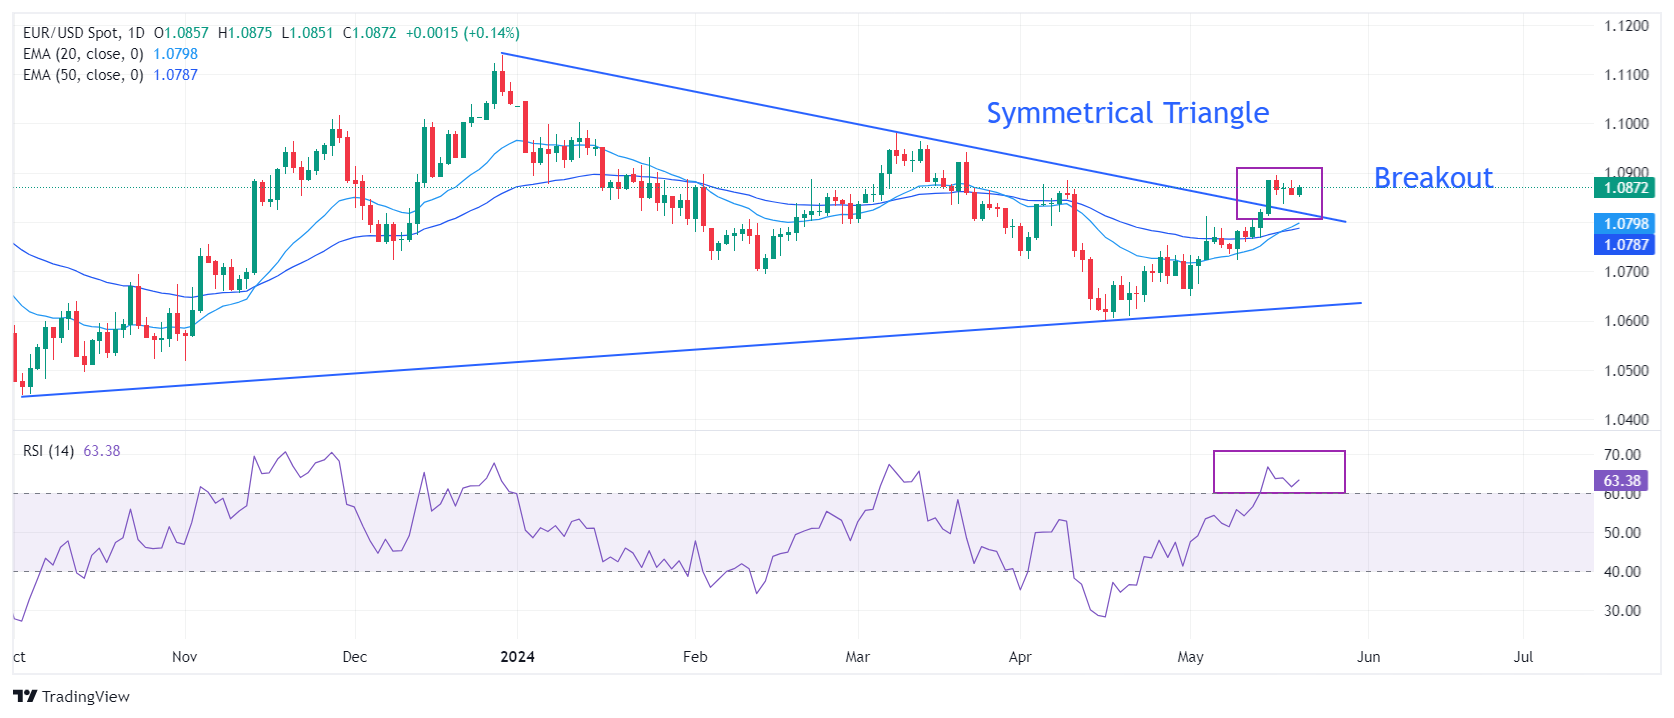
EUR/USD trades in a narrow range around 1.0850 as investors look for fresh triggers that could guide the next potential move. The shared currency pair is broadly firm as it is holding the Symmetrical Triangle breakout that formed on the daily time frame. Also, a bullish crossover involving the 20-day and 50-day Exponential Moving Averages (EMAs) around 1.0780 has improved the near-term outlook of the shared currency pair.
The 14-period Relative Strength Index (RSI) has shifted comfortably into the range of 60.00-80.00, suggesting that the momentum has turned bullish.
Euro FAQs
The Euro is the currency for the 20 European Union countries that belong to the Eurozone. It is the second most heavily traded currency in the world behind the US Dollar. In 2022, it accounted for 31% of all foreign exchange transactions, with an average daily turnover of over $2.2 trillion a day. EUR/USD is the most heavily traded currency pair in the world, accounting for an estimated 30% off all transactions, followed by EUR/JPY (4%), EUR/GBP (3%) and EUR/AUD (2%).
The European Central Bank (ECB) in Frankfurt, Germany, is the reserve bank for the Eurozone. The ECB sets interest rates and manages monetary policy. The ECB’s primary mandate is to maintain price stability, which means either controlling inflation or stimulating growth. Its primary tool is the raising or lowering of interest rates. Relatively high interest rates – or the expectation of higher rates – will usually benefit the Euro and vice versa. The ECB Governing Council makes monetary policy decisions at meetings held eight times a year. Decisions are made by heads of the Eurozone national banks and six permanent members, including the President of the ECB, Christine Lagarde.
Eurozone inflation data, measured by the Harmonized Index of Consumer Prices (HICP), is an important econometric for the Euro. If inflation rises more than expected, especially if above the ECB’s 2% target, it obliges the ECB to raise interest rates to bring it back under control. Relatively high interest rates compared to its counterparts will usually benefit the Euro, as it makes the region more attractive as a place for global investors to park their money.
Data releases gauge the health of the economy and can impact on the Euro. Indicators such as GDP, Manufacturing and Services PMIs, employment, and consumer sentiment surveys can all influence the direction of the single currency. A strong economy is good for the Euro. Not only does it attract more foreign investment but it may encourage the ECB to put up interest rates, which will directly strengthen the Euro. Otherwise, if economic data is weak, the Euro is likely to fall. Economic data for the four largest economies in the euro area (Germany, France, Italy and Spain) are especially significant, as they account for 75% of the Eurozone’s economy.
Another significant data release for the Euro is the Trade Balance. This indicator measures the difference between what a country earns from its exports and what it spends on imports over a given period. If a country produces highly sought after exports then its currency will gain in value purely from the extra demand created from foreign buyers seeking to purchase these goods. Therefore, a positive net Trade Balance strengthens a currency and vice versa for a negative balance.
Silver prices (XAG/USD) fell on Tuesday, according to FXStreet data. Silver trades at $31.62 per troy ounce, down 0.63% from the $31.82 it cost on Monday.
Silver prices have increased by 24.15% since the beginning of the year.
| Unit measure | Today Price |
|---|---|
| Silver price per troy ounce | $31.62 |
| Silver price per gram | $1.02 |
The Gold/Silver ratio, which shows the number of troy ounces of Silver needed to equal the value of one troy ounce of Gold, stood at 76.47 on Tuesday, up from 76.25 on Monday.
Investors might use this ratio to determine the relative valuation of Gold and Silver. Some may consider a high ratio as an indicator that Silver is undervalued – or Gold is overvalued – and might buy Silver or sell Gold accordingly. Conversely, a low ratio might suggest that Gold is undervalued relative to Silver.
(An automation tool was used in creating this post.)
Silver FAQs
Silver is a precious metal highly traded among investors. It has been historically used as a store of value and a medium of exchange. Although less popular than Gold, traders may turn to Silver to diversify their investment portfolio, for its intrinsic value or as a potential hedge during high-inflation periods. Investors can buy physical Silver, in coins or in bars, or trade it through vehicles such as Exchange Traded Funds, which track its price on international markets.
Silver prices can move due to a wide range of factors. Geopolitical instability or fears of a deep recession can make Silver price escalate due to its safe-haven status, although to a lesser extent than Gold's. As a yieldless asset, Silver tends to rise with lower interest rates. Its moves also depend on how the US Dollar (USD) behaves as the asset is priced in dollars (XAG/USD). A strong Dollar tends to keep the price of Silver at bay, whereas a weaker Dollar is likely to propel prices up. Other factors such as investment demand, mining supply – Silver is much more abundant than Gold – and recycling rates can also affect prices.
Silver is widely used in industry, particularly in sectors such as electronics or solar energy, as it has one of the highest electric conductivity of all metals – more than Copper and Gold. A surge in demand can increase prices, while a decline tends to lower them. Dynamics in the US, Chinese and Indian economies can also contribute to price swings: for the US and particularly China, their big industrial sectors use Silver in various processes; in India, consumers’ demand for the precious metal for jewellery also plays a key role in setting prices.
Silver prices tend to follow Gold's moves. When Gold prices rise, Silver typically follows suit, as their status as safe-haven assets is similar. The Gold/Silver ratio, which shows the number of ounces of Silver needed to equal the value of one ounce of Gold, may help to determine the relative valuation between both metals. Some investors may consider a high ratio as an indicator that Silver is undervalued, or Gold is overvalued. On the contrary, a low ratio might suggest that Gold is undervalued relative to Silver.
- AUD/JPY depreciates possibly due to risk aversion sentiment on Tuesday.
- Australia’s Consumer Confidence fell 0.3% MoM in May, marking the third consecutive month of decline.
- This interest-rate disparity puts pressure on the Japanese Yen as investors seek higher returns offered by other assets.
The AUD/JPY pair snapped its six-day winning streak, trading around 104.00 during the European session on Tuesday, likely influenced by a general risk aversion sentiment. However, the AUD/USD pair received minor support following the release of Westpac Consumer Confidence data during the early Asian hours. The index fell by 0.3% month-over-month in May, an improvement compared to a 2.4% decline in April, marking the third consecutive month of decline but at a softer pace.
Additionally, the minutes from the Reserve Bank of Australia's (RBA) May 2024 meeting expressed that the board considered raising rates but ultimately found the case for maintaining a steady policy to be stronger. Policymakers acknowledged the difficulty in ruling in or out future changes to the cash rate and noted that the recent flow of data had increased the risk of inflation remaining above the target for an extended period.
The Australian Dollar could gain support from China's announcement of a comprehensive package to bolster its struggling property market. China's finance ministry plans to raise 1 trillion Yuan by issuing bonds with maturities of 20 to 50 years for larger stimulus measures. These measures include relaxing mortgage rules and encouraging local governments to purchase unsold homes. This development could boost sentiment in the Australian markets, given the close trade relationship between Australia and China.
The Japanese Yen (JPY) may face challenges due to the significant interest rate differential between Japan and other countries. This pressure on the JPY could reinforce the support for the AUD/JPY cross. Market sentiment is shifting toward the possibility that the Bank of Japan (BoJ) may raise interest rates earlier than anticipated, driven by concerns over the weak Japanese Yen.
As per a Reuters report, Japanese Finance Minister Shunichi Suzuki expressed concerns about the negative implications of the weak JPY. Suzuki mentioned that market discussions are focusing on the rising long-term rates and the importance of appropriate national debt policies in Japan. He highlighted hopes for wage hikes to exceed the pace of inflation and stated that he is closely monitoring foreign exchange (FX) movements.
Gold prices rose in India on Tuesday, according to data from India's Multi Commodity Exchange (MCX).
Gold price stood at 73,853 Indian Rupees (INR) per 10 grams, up INR 692 compared with the INR 73,161 it cost on Monday.
As for futures contracts, Gold prices decreased to INR 73,968 per 10 gms from INR 74,367 per 10 gms.
Prices for Silver futures contracts decreased to INR 94,350 per kg from INR 95,267 per kg.
| Major Indian city | Gold Price |
|---|---|
| Ahmedabad | 76,415 |
| Mumbai | 76,215 |
| New Delhi | 76,170 |
| Chennai | 76,420 |
| Kolkata | 76,370 |
Global Market Movers: Comex Gold price struggles to gain ground amid the USD recovery
- Gold price on Comex reached a record high on Monday at $2,450, and silver prices moved toward 12-year highs. Gold has risen 18% this year, while silver has gained 35%.
- Fed Vice Chair Michael Barr said that the central bank “will need to allow our restrictive policy some further time to continue to do its work.”
- Fed policymaker Philip Jefferson, another permanent voting member of the Fed's rate-setting committee, said inflation was still easing, although nowhere near as quickly as he expected.
- Atlanta Fed President Raphael Bostic said that policy is restrictive and that it would take a while before the central bank gains confidence that inflation is headed to 2%.
- Investors see a 76% odd of rate cut from the Fed by 25 basis points (bps) in September and two cuts by the end of the year, according to the CME FedWatch Tool.
(An automation tool was used in creating this post.)
Gold FAQs
Gold has played a key role in human’s history as it has been widely used as a store of value and medium of exchange. Currently, apart from its shine and usage for jewelry, the precious metal is widely seen as a safe-haven asset, meaning that it is considered a good investment during turbulent times. Gold is also widely seen as a hedge against inflation and against depreciating currencies as it doesn’t rely on any specific issuer or government.
Central banks are the biggest Gold holders. In their aim to support their currencies in turbulent times, central banks tend to diversify their reserves and buy Gold to improve the perceived strength of the economy and the currency. High Gold reserves can be a source of trust for a country’s solvency. Central banks added 1,136 tonnes of Gold worth around $70 billion to their reserves in 2022, according to data from the World Gold Council. This is the highest yearly purchase since records began. Central banks from emerging economies such as China, India and Turkey are quickly increasing their Gold reserves.
Gold has an inverse correlation with the US Dollar and US Treasuries, which are both major reserve and safe-haven assets. When the Dollar depreciates, Gold tends to rise, enabling investors and central banks to diversify their assets in turbulent times. Gold is also inversely correlated with risk assets. A rally in the stock market tends to weaken Gold price, while sell-offs in riskier markets tend to favor the precious metal.
The price can move due to a wide range of factors. Geopolitical instability or fears of a deep recession can quickly make Gold price escalate due to its safe-haven status. As a yield-less asset, Gold tends to rise with lower interest rates, while higher cost of money usually weighs down on the yellow metal. Still, most moves depend on how the US Dollar (USD) behaves as the asset is priced in dollars (XAU/USD). A strong Dollar tends to keep the price of Gold controlled, whereas a weaker Dollar is likely to push Gold prices up.
- USD/CHF inches lower possibly due to the higher yield on 10-year Swiss bond.
- SNB Chairman Thomas Jordan will deliver a speech about monetary policy at the Swiss Media Forum on Friday.
- The US Dollar may advance due to the hawkish remarks from the Fed officials.
USD/CHF snaps its three-day winning streak, trading around 0.9100 during the European session on Tuesday. The yield on the 10-year Swiss government bond inched higher to around 0.72%, which has indicated the Swiss National Bank (SNB) to maintain current interest rates. This could have strengthened the CHF and weakened the USD/CHF pair.
Traders await the Employment Level released by the Swiss Statistics later in the week. Also, the Swiss National Bank (SNB) Chairman Thomas Jordan will deliver a speech about communication, monetary policy, and public impact at the Swiss Media Forum in Lucerne, Switzerland on Friday.
On the USD side, the downward correction of the US Dollar (USD) is attributed to the lower US Treasury yields, undermining the USD/CHF pair. The US Dollar Index (DXY), which measures the value of the US Dollar (USD) against the six other major currencies, edges lower to near 104.60 with 2-year and 10-year yields on US Treasury bonds standing at 4.83% and 4.43%, respectively, by the press time.
The US Federal Reserve (Fed) maintains a cautious stance regarding inflation and the possibility of rate cuts in 2024. On Monday, Loretta Mester, President of the Federal Reserve Bank of Cleveland, told Bloomberg that she no longer believes three rate cuts in 2024 are appropriate. Mester highlighted that inflation risks are skewed to the upside and emphasized that there is no harm in spending additional time gathering data on inflation, given the strength of the economy.
- The Pound Sterling trades strongly above 1.2700 against the US Dollar ahead of UK inflation data.
- UK inflation is forecasted to have declined sharply in April.
- Fed officials continue to support higher interest rates for a longer period.
The Pound Sterling (GBP) exhibits a firm footing, trading slightly above 1.2700 in Tuesday’s European session. The next move in the GBP/USD pair will likely be guided by the United Kingdom Consumer Price Index (CPI) data for April and the Federal Open Market Committee (FOMC) minutes for the May meeting, which will be published on Wednesday.
The US Dollar Index (DXY), which tracks the Greenback’s value against six major currencies, remains steady near 104.60 as investors look for fresh cues about when the Federal Reserve (Fed) will start reducing interest rates. Investors await the FOMC minutes to get a deep understanding of policymakers’ views on the interest-rate outlook.
The impact of the FOMC minutes on markets could be light as the inflation outlook in the US has changed significantly since the last Fed meeting. Inflation declined as expected in April, signalling that the progress in the disinflation process has restarted after failing to do so during the January-March period. As the last Fed meeting was held before the release of the latest inflation print, the communication from Fed officials over interest rates is expected to be significantly hawkish.
Despite April’s decline in US inflation, Fed officials seem to still lack confidence that price pressures will sustainably return to the desired rate of 2%. On Monday, Fed Vice Chair for Supervision Michael Barr said that "Q1 inflation was disappointing, did not provide the confidence needed to ease monetary policy". Barr vowed for allowing more time for a tight policy stance to do its job.
Daily digest market movers: Pound Sterling moves higher despite steady US Dollar
- The Pound Sterling edges higher but trades inside Monday’s trading range and holds the crucial support of 1.2700 against the US Dollar. The Pound Sterling performs strongly against all major currencies ahead of the UK CPI data for April.
- Economists expect that the UK Office for National Statistics (ONS) will report a sharp decline in headline inflation to 2.1% from the prior reading of 3.2%. The core CPI, which strips off the more volatile items, is estimated to have decelerated to 3.6% from 4.2% in March. The monthly headline inflation is expected to have grown at a slower pace of 0.2% after a sharp increase of 0.6% in March.
- The expected decline in UK inflation will increase investors’ confidence that price pressures are on course to return to the desired rate of 2%. This will boost expectations of early rate cuts by the Bank of England (BoE). Currently, investors are divided between the June or August meeting from when the BoE could start returning to policy normalization.
- The expectations for the BoE to begin lowering interest rates in summer have strengthened, driven by a dovish communication from BoE Deputy Governor Ben Broadbent on the interest rate outlook. On Monday, Broadbent said: "If things continue to evolve with its forecasts – forecasts that suggest policy will have to become less restrictive at some point – then it's possible Bank Rate could be cut sometime over the summer," Reuters reported.
Technical Analysis: Pound Sterling trades above 1.2700

The Pound Sterling extends its winning spell for the third trading session on Tuesday but prices hover inside Monday’s trading session, suggesting that investors await fresh triggers for further action. The GBP/USD pair advances to an almost two-month high near 1.2700. The Cable is expected to remain in the bullish trajectory as all short-to-long-term Exponential Moving Averages (EMAs) are sloping higher, suggesting a strong uptrend. The Cable has retraced 61.8% of losses from March’s high around 1.2900.
The 14-period Relative Strength Index (RSI) has shifted into the bullish range of 60.00-80.00, suggesting that the momentum has leaned toward the upside.
Pound Sterling FAQs
The Pound Sterling (GBP) is the oldest currency in the world (886 AD) and the official currency of the United Kingdom. It is the fourth most traded unit for foreign exchange (FX) in the world, accounting for 12% of all transactions, averaging $630 billion a day, according to 2022 data. Its key trading pairs are GBP/USD, aka ‘Cable’, which accounts for 11% of FX, GBP/JPY, or the ‘Dragon’ as it is known by traders (3%), and EUR/GBP (2%). The Pound Sterling is issued by the Bank of England (BoE).
The single most important factor influencing the value of the Pound Sterling is monetary policy decided by the Bank of England. The BoE bases its decisions on whether it has achieved its primary goal of “price stability” – a steady inflation rate of around 2%. Its primary tool for achieving this is the adjustment of interest rates. When inflation is too high, the BoE will try to rein it in by raising interest rates, making it more expensive for people and businesses to access credit. This is generally positive for GBP, as higher interest rates make the UK a more attractive place for global investors to park their money. When inflation falls too low it is a sign economic growth is slowing. In this scenario, the BoE will consider lowering interest rates to cheapen credit so businesses will borrow more to invest in growth-generating projects.
Data releases gauge the health of the economy and can impact the value of the Pound Sterling. Indicators such as GDP, Manufacturing and Services PMIs, and employment can all influence the direction of the GBP. A strong economy is good for Sterling. Not only does it attract more foreign investment but it may encourage the BoE to put up interest rates, which will directly strengthen GBP. Otherwise, if economic data is weak, the Pound Sterling is likely to fall.
Another significant data release for the Pound Sterling is the Trade Balance. This indicator measures the difference between what a country earns from its exports and what it spends on imports over a given period. If a country produces highly sought-after exports, its currency will benefit purely from the extra demand created from foreign buyers seeking to purchase these goods. Therefore, a positive net Trade Balance strengthens a currency and vice versa for a negative balance.
- The Mexican Peso continues its uptrend despite poor Mexican data and risk aversion.
- The wide interest-rate differential between Mexico and Western countries continues to favor the Peso in the carry trade.
- USD/MXN hits the conservative target for its range breakout.
The Mexican Peso (MXN) seesaws between marginal gains and losses in its key pairs on Tuesday after shrugging off poor Retail Sales data from Mexico and hawkish commentary from Federal Reserve (Fed) speakers on Monday, and continuing to drift higher.
The wide interest-rate differential between Mexico and most major economies – with relatively higher interest rates in Mexico (11.00%) providing an attractive draw for carry traders – is a key factor driving MXN’s uptrend, with little prospect of the gap closing anytime soon.
USD/MXN is trading at 16.55, EUR/MXN at 17.98 and GBP/MXN at 21.05, at the time of writing.
Mexican Peso shrugs off poor data
The Mexican Peso trades relatively flat on Tuesday despite recent data showing a fall in Mexican Retail Sales on both a monthly and yearly basis.
Whilst the data indicated the high interest rates imposed by the Bank of Mexico (Banxico) are probably having the desired effect of cooling the economy, Banxico has not signaled it is in a hurry to reduce interest rates yet.
Indeed on Friday, the Deputy Governor of Banxico, Irene Espinosa, said she thought interest rates should remain at their current level until inflation had been brought down on a sustainable basis.
Somber market mood caps Peso’s upside
The generally somber market mood on Tuesday is capping the Peso’s upside, however, as investors retreat from risk assets and commodities – MXN included – out of a fear high interest rates are here to stay. Asian stocks are down and Oil, metals and softs are following suit.
The change in sentiment comes as a result of commentary from central bankers, in both the US and Australia, that suggests they are not only reluctant to cut interest rates in the near future but are even discussing raising them.
In the US, Federal Reserve Bank of Cleveland President Loretta Mester said inflation risks were “tilted to the upside”, that the Fed could “even raise them (rates)” if inflation rose, and that it was “no longer appropriate” to expect the Fed to make three cuts this year.
The minutes of the RBA May meeting, released on Tuesday morning, showed that the board of governors discussed the possibility of raising interest rates. It was the first time in many months they had discussed further policy tightening.
Technical Analysis: USD/MXN hits first downside target
USD/MXN – or the number of Pesos that can be bought with one US Dollar – edges lower on Tuesday, continuing its overall bearish bias of recent weeks.
USD/MXN 4-hour Chart
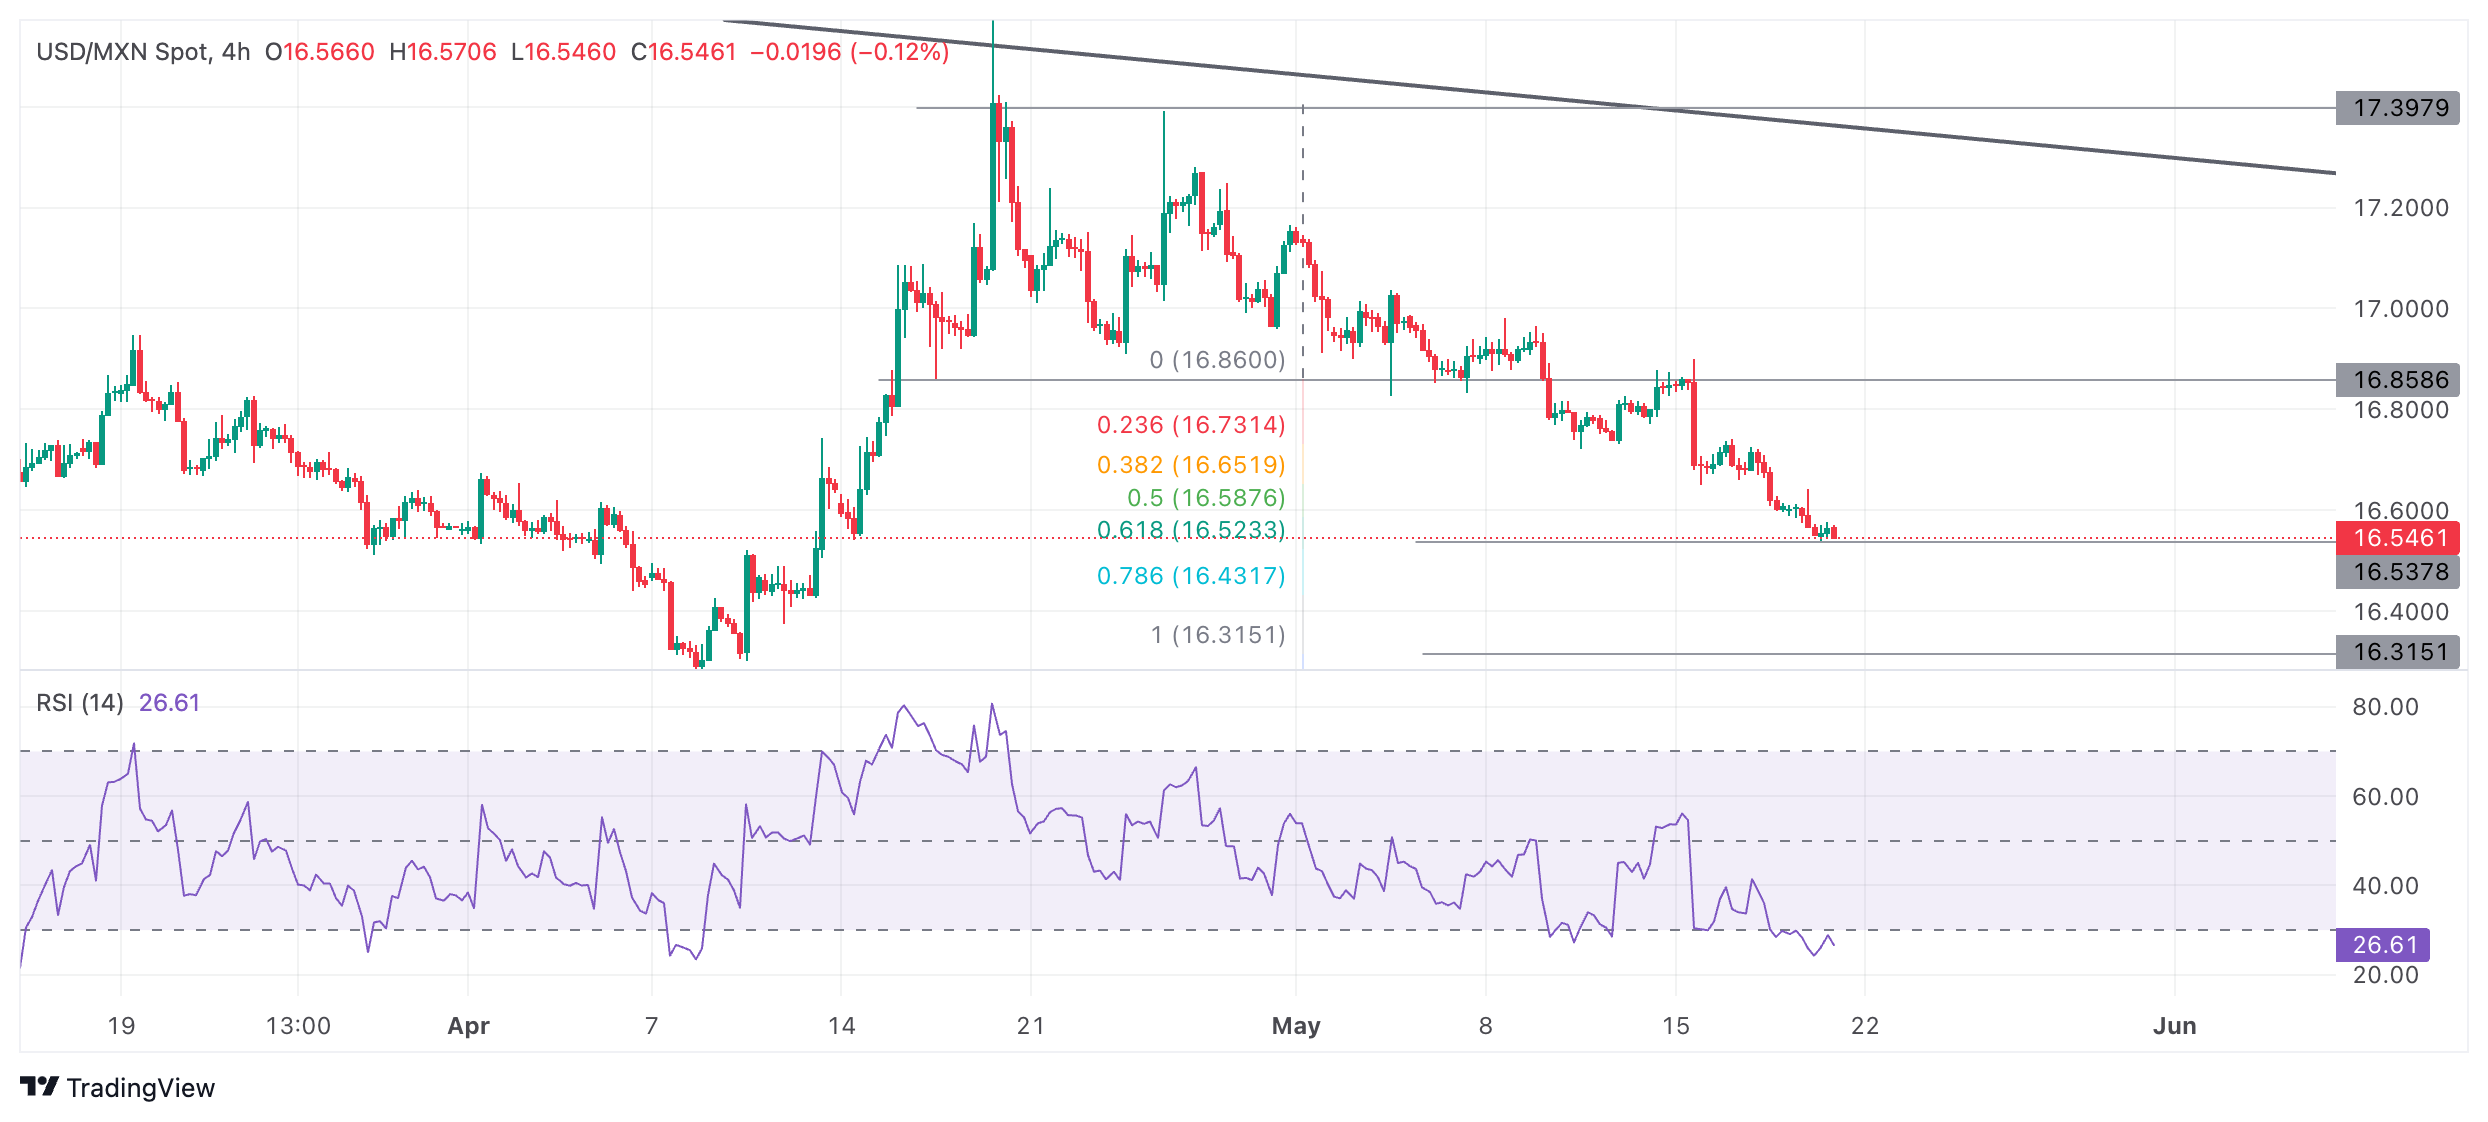
USD/MXN is falling in a short-term downtrend within a descending channel that favors short bets over longs.
The pair has now just reached its conservative price objective for the breakout of the mid-April to May range at 16.54. This is calculated as the 0.618 Fibonacci ratio of the range's height extrapolated lower.
Further bearishness could still see USD/MXN reach 16.34, the more bearish target, calculated by taking the full height of the range and extrapolating it lower.
The Relative Strength Index (RSI) momentum indicator is still oversold, which indicates traders should not add to their short positions. If the RSI exits oversold conditions and returns to neutral territory above 30, it would be a signal to close existing short positions as a correction is probably underway. Once the correction ends, however, the descending channel is expected to continue taking prices lower in line with the dominant downtrend.
Given the medium and long-term trends are also bearish, the odds further favor more downside.
Economic Indicator
Retail Sales (MoM)
The Retail Sales released by INEGI measures the total receipts of retail stores. Monthly percent changues reflect the rate of changes of such sales. Changes in retail sales are widely followed as an indicator of consumer spending. Generally speaking, a high reading is seen as positive or bullish for the Mexican peso, while a low reading is seen as negative or bearish.
Read more.
Here is what you need to know on Tuesday, May 21:
Major currency pairs continue to fluctuate in familiar ranges early Tuesday after closing the first day of the week with small changes. Eurostat will release Current Account and Trade Balance data for March. Later in the session, Statistics Canada will publish Consumer Price Index (CPI) figures for April. More importantly, Bank of England (BoE) Governor Andrew Bailey and Federal Reserve officials Christopher Waller, John Williams, Raphael Bostic and Loretta Mester will be delivering speeches.
In the absence of high-tier data releases, investors refrained from taking large positions on Monday. Wall Street's main indexes closed the day mixed, the US Dollar (USD) Index posted marginal gains and the benchmark 10-year US Treasury bond yield edged slightly to end the day above 4.4%. Early Tuesday, the USD Index moves sideways at around 104.50 and US stock index futures trade virtually unchanged on the day.
US Dollar PRICE Today
The table below shows the percentage change of US Dollar (USD) against listed major currencies today. US Dollar was the strongest against the Canadian Dollar.
| USD | EUR | GBP | JPY | CAD | AUD | NZD | CHF | |
|---|---|---|---|---|---|---|---|---|
| USD | -0.06% | -0.08% | -0.12% | 0.03% | 0.00% | -0.00% | -0.07% | |
| EUR | 0.06% | -0.02% | -0.03% | 0.07% | 0.06% | 0.04% | -0.00% | |
| GBP | 0.08% | 0.02% | -0.06% | 0.10% | 0.09% | 0.06% | 0.01% | |
| JPY | 0.12% | 0.03% | 0.06% | 0.16% | 0.12% | 0.10% | 0.06% | |
| CAD | -0.03% | -0.07% | -0.10% | -0.16% | -0.02% | -0.04% | -0.09% | |
| AUD | 0.00% | -0.06% | -0.09% | -0.12% | 0.02% | -0.02% | -0.05% | |
| NZD | 0.00% | -0.04% | -0.06% | -0.10% | 0.04% | 0.02% | -0.06% | |
| CHF | 0.07% | 0.00% | -0.01% | -0.06% | 0.09% | 0.05% | 0.06% |
The heat map shows percentage changes of major currencies against each other. The base currency is picked from the left column, while the quote currency is picked from the top row. For example, if you pick the US Dollar from the left column and move along the horizontal line to the Japanese Yen, the percentage change displayed in the box will represent USD (base)/JPY (quote).
During the Asian trading hours, the Reserve Bank of Australia (RBA) published the minutes of its May monetary policy meeting, highlighting that the board members considered whether to raise rates and judged the case for steady policy as the stronger one. Additional details of the publication showed that the board agreed it was difficult to either rule in or rule out future changes in the cash rate, per Reuters. AUD/USD showed no immediate reaction to the RBA Minutes and was last seen trading marginally lower on the day at around 0.6660.
EUR/USD struggled to build on the previous week's gains and posted small losses on Monday. The pair holds steady above 1.0850 in the European morning on Tuesday.
GBP/USD moved up and down in a narrow channel and closed a few pips above 1.2700 on Monday. The pair registers small losses near 1.2720 in the early European session.
After setting a new all-time high of $2,450 at the beginning of the week, Gold erased a large portion of its gains to close below $2,430 on Monday. XAU/USD stays under bearish pressure early Tuesday and trades below $2,420.
NZD/USD seems to have stabilized at around 0.6100 after losing nearly 0.5% on Monday. The Reserve Bank of New Zealand will announce monetary policy decisions in the early trading hours of the Asian session on Wednesday.
USD/JPY edged higher on Monday and ended the day above 156.00. The pair stays in a consolidation phase at around this level early Tuesday.
Fed FAQs
Monetary policy in the US is shaped by the Federal Reserve (Fed). The Fed has two mandates: to achieve price stability and foster full employment. Its primary tool to achieve these goals is by adjusting interest rates. When prices are rising too quickly and inflation is above the Fed’s 2% target, it raises interest rates, increasing borrowing costs throughout the economy. This results in a stronger US Dollar (USD) as it makes the US a more attractive place for international investors to park their money. When inflation falls below 2% or the Unemployment Rate is too high, the Fed may lower interest rates to encourage borrowing, which weighs on the Greenback.
The Federal Reserve (Fed) holds eight policy meetings a year, where the Federal Open Market Committee (FOMC) assesses economic conditions and makes monetary policy decisions. The FOMC is attended by twelve Fed officials – the seven members of the Board of Governors, the president of the Federal Reserve Bank of New York, and four of the remaining eleven regional Reserve Bank presidents, who serve one-year terms on a rotating basis.
In extreme situations, the Federal Reserve may resort to a policy named Quantitative Easing (QE). QE is the process by which the Fed substantially increases the flow of credit in a stuck financial system. It is a non-standard policy measure used during crises or when inflation is extremely low. It was the Fed’s weapon of choice during the Great Financial Crisis in 2008. It involves the Fed printing more Dollars and using them to buy high grade bonds from financial institutions. QE usually weakens the US Dollar.
Quantitative tightening (QT) is the reverse process of QE, whereby the Federal Reserve stops buying bonds from financial institutions and does not reinvest the principal from the bonds it holds maturing, to purchase new bonds. It is usually positive for the value of the US Dollar.
- USD/CAD edges higher to 1.3630 amid the modest rebound in USD on Tuesday.
- The higher bets on rate cuts from the BoC and the decline in oil prices weigh on the Loonie.
- The higher-for-longer US rate narrative is likely to cap the pair’s downside in the near term.
The USD/CAD pair trades in positive territory for the second consecutive day around 1.3630 on Tuesday during the early European session. Market players await the remarks from more FOMC members. Also, the Canadian CPI inflation report for April will be in the spotlight.
The markets expect further cooling of CPI inflation figures on both an annual and monthly basis to convince the Bank of Canada (BOC) to cut interest rates next month. The Canadian central bank is anticipated to cut interest rates 2-3 times before the Fed's first rate cut, which might weigh on the Loonie and create a tailwind for the USD/CAD pair. Canada’s CPI inflation is expected to ease to 2.7% YoY in April from 2.9% in the previous reading, while the monthly CPI inflation is estimated to drop to 0.5% MoM in April from 0.6% in March.
Meanwhile, the decline in crude oil exerts some selling pressure on the commodity-linked Canadian Dollar (CAD), as Canada is the leading exporter of oil to the United States.
On the other hand, US Federal Reserve (Fed) officials remain cautious about the timing of its easing cycle, emphasizing the need to keep interest rates higher for extended periods of time to gain confidence that inflation is on track to meet its objective. This, in turn, might lift the Greenback and cap the pair’s downside for the time being.
US Treasury Secretary Janet Yellen said on Tuesday that the “global economy resilient in the face of the challenging geopolitical landscape.”
Additional quotes
Urge European banks to heighten compliance measures and increase focus on russian evasion attempts-remarks to bankers.
European banks should ensure that overseas branches stringently apply sanctions compliance policies, especially in high risk jurisdictions.
Continues to explore new ways to reduce russia's revenues and acquire goods for its war in Ukraine.
The most concerning evasion of US Russian sanctions has come through China, UAE, Turkey but watching europe as well.
Banks have bolstered compliance measures in response to US warnings on secondary financial institution sanctions.
Actions by global financial sector are helping to frustrate russia's ability to procure battlefield goods.
Global financial conditions have eased since 2023 banking sector turmoil, risks broadly balanced.
Remaining vigilant to elevated corporate debt, leverage and liquidity mismatches in non-bank sector, commercial real estate strains.
Market reaction
The US Dollar Index is holding steady at 104.58, at the time of writing, little affected by Yellen’s comments.
FX option expiries for May 21 NY cut at 10:00 Eastern Time, via DTCC, can be found below
- EUR/USD: EUR amounts
- 1.0800 632m
- 1.0840 1.1b
- 1.0845 561m
- 1.0875 942m
- 1.0900 605m
- GBP/USD: GBP amounts
- 1.2625 533m
- USD/JPY: USD amounts
- 154.50 796m
- USD/CHF: USD amounts
- 0.9055 1.9m
- AUD/USD: AUD amounts
- 0.6565 644m
- 0.6575 965m
-USD/CAD: USD amounts
- 1.3600 460m
- 1.3645 1.2b
- 1.3700 1.3b
- 1.3765 668m
- NZD/USD: NZD amounts
- 0.6115 550m
- EUR/GBP: EUR amounts
- 0.8600 434m
- NZD/USD depreciates due to the hawkish remarks from Fed officials regarding maintaining higher rates for longer.
- RBNZ is expected to maintain its Official Cash Rate at 5.5%, marking the seventh consecutive meeting without changes.
- Fed maintains a cautious stance regarding inflation and the possibility of rate cuts in 2024.
NZD/USD extended losses to near 0.6100 during Asian trading hours on Tuesday. Investors are awaiting the Reserve Bank of New Zealand's (RBNZ) policy meeting scheduled for Wednesday. It's widely anticipated that the RBNZ will maintain its Official Cash Rate (OCR) at 5.5%, marking the seventh consecutive meeting without changes. Policymakers are expected to emphasize the necessity of maintaining a restrictive policy stance for an extended period to steer inflation back within the 1-3% target range.
Recent data showed a decline in the country’s 2-year inflation expectations to their lowest point in nearly three years during the second quarter. This has fueled speculation that the RBNZ might contemplate rate cuts later in 2024.
Support for the New Zealand Dollar (NZD) could arise from China's announcement of a comprehensive package to bolster its struggling property market. China's finance ministry plans to start raising 1 trillion Yuan in issuing 20 to 50 years bonds for larger stimulus measures. Measures include the relaxation of mortgage regulations and encouragement for local governments to purchase unsold homes. This development may boost sentiment in Kiwi markets, given the close trade ties between New Zealand and China.
The US Dollar (USD) remains stable as there are no major economic data releases from the United States (US). The Greenback receives support from higher US Treasury yields. The US Federal Reserve (Fed) maintains a cautious stance regarding inflation and the possibility of rate cuts in 2024.
Based on the CME FedWatch Tool, the probability of the Federal Reserve implementing a 25 basis-point rate cut in September has seen a slight uptick to 49.6%, compared to 48.6% a week ago.
- EUR/USD holds positive ground near 1.0860 in Tuesday’s early European session on Monday.
- The markets expect the Fed's policy rate on hold until September.
- ECB’s Schnabel said policymakers should look very carefully at the data as there is a risk of easing prematurely.
The EUR/USD pair trades on a stronger note around 1.0860 during the early European trading hours on Tuesday. Investors will focus on Fedspeaker amid the absence of key US data releases. On Wednesday, European Central Bank (ECB) President Christine Lagarde's speech and the minutes from the recent FOMC meeting will take center stage.
The Federal Reserve (Fed) officials are confident to say inflation is heading to the 2% target after the US inflation report last week. Fed Vice Chair Philip Jefferson said on Monday that it’s premature to tell whether the recent slowdown in the disinflationary process will be long-lasting, highlighting that he will be carefully assessing incoming economic data and the outlook. Meanwhile, Atlanta Fed, Fed Vice Chair Michael Barr stated that disappointing first-quarter inflation data did not provide the Fed with the increased confidence to support easing monetary policy.”
The US central bank is expected to hold the rate steady at its June meeting. Traders are pricing in a 76% chance of a rate cut from the Fed by 25 basis points (bps) in September and two cuts by the end of the year, according to the CME FedWatch Tool.
Across the pond, the European Central Bank (ECB) is anticipated to lower its borrowing costs in the June meeting. The ECB board member Isabel Schnabel said the central bank may cut the rate in June, but warned about further cuts in borrowing costs given uncertainty over the outlook. Analysts believe the monetary policy divergence between the ECB and Fed might weigh on the Euro (EUR) and create a headwind for the EUR/USD pair.
- The Japanese Yen depreciates due to hawkish sentiment surrounding the Fed maintaining higher rates for longer.
- Japanese Finance Minister Shunichi Suzuki voiced worries regarding the adverse effects of the weak Japanese Yen.
- The US Dollar remains firmer amid higher US Treasury yields.
The Japanese Yen (JPY) lost ground for the fourth consecutive session on Tuesday, driven by the significant interest rate differential between Japan and the United States (US). This pressure on the JPY has bolstered the USD/JPY pair. Market sentiment emerges that the Bank of Japan (BoJ) may raise interest rates earlier than expected against the backdrop of the weak JPY.
Japanese Finance Minister Shunichi Suzuki expressed concerns about the negative implications of the weak JPY. Suzuki also said that market discussions are centered on long-term rates as they increase, focusing on appropriate national debt policies in Japan. There are hopes for wage hikes to surpass the inflation pace. He stated that he is closely monitoring FX movements.
The US Dollar (USD) trades steadily, as there were no major economic data releases from the United States (US). The higher US Treasury yields have provided support to the Greenback. The US Federal Reserve (Fed) remains cautious about inflation and the possibility of rate cuts in 2024.
Daily Digest Market Movers: Japanese Yen depreciates due to the hawkish Fed
- A BoJ survey showed on Monday that approximately 70% of firms reported experiencing drawbacks from the BoJ's 25-year-long monetary easing measures, notably citing a weak JPY that increased import costs. However, around 90% of the firms also acknowledged benefits stemming from the BoJ's prolonged easing, including low borrowing costs. Among Japan's large manufacturers, exchange rate stability emerged as the primary factor they desired from the central bank's monetary policy.
- The yield on the 2-year Japanese government bond stands at 0.34%, according to FactSet. This means policy rates are predicted to reach 0.25% in the second half of the year and 0.5% next year.
- On Monday, Loretta Mester, President of the Federal Reserve Bank of Cleveland, told Bloomberg that she no longer believes three rate cuts in 2024 are appropriate. Mester highlighted that inflation risks are skewed to the upside and emphasized that there is no harm in spending additional time gathering data on inflation, given the strength of the economy.
- According to the CME FedWatch Tool, the probability of the Federal Reserve implementing a 25 basis-point rate cut in September has seen a slight uptick to 49.6%, compared to 48.6% a week ago.
- Market sentiment emerges that the BoJ might reduce bond purchases at the June policy meeting. BOJ Governor Kazuo Ueda also indicated that there are no immediate plans to sell the central bank’s ETF holdings.
Technical Analysis: USD/JPY rises to around a major level of 156.50
The Japanese Yen trades around 156.50 against its counterpart US Dollar on Tuesday. The daily chart for USD/JPY showed an ascending triangle formation. Additionally, the 14-day Relative Strength Index (RSI) indicated a bullish sentiment, holding slightly above the 50 mark.
The USD/JPY pair could retest the upper boundary of the ascending triangle around the psychological barrier at 157.00. A break above this level could support the pair to approach the high of 160.32, a level never seen since April 1990.
On the downside, the lower threshold of the ascending triangle appears as the immediate support, around the major level of 155.50, followed by the 21-day Exponential Moving Average (EMA) at 155.25. A break below this level could exert downward pressure on the USD/JPY pair to move toward the throwback support at 153.60.
USD/JPY: Daily Chart
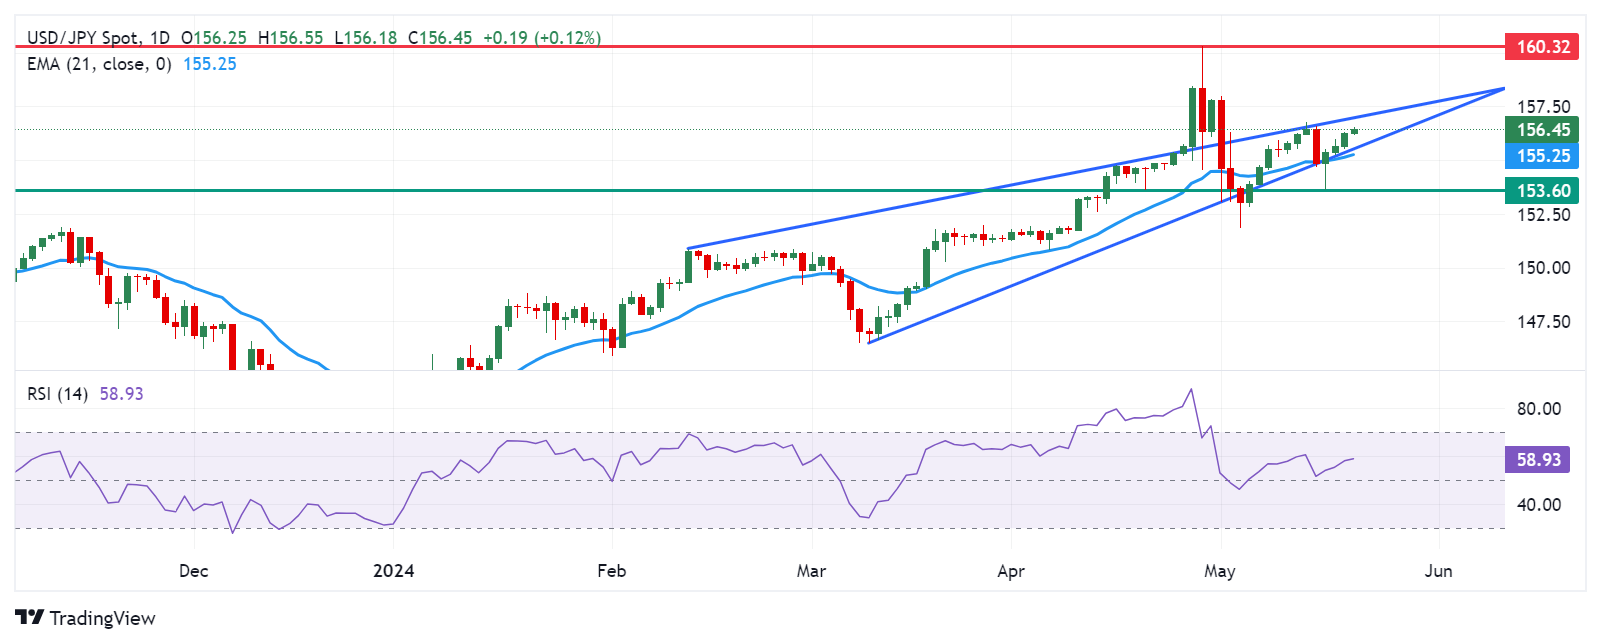
Japanese Yen price today
The table below shows the percentage change of the Japanese Yen (JPY) against listed major currencies today. Japanese Yen was the weakest against the Pound Sterling.
| USD | EUR | GBP | CAD | AUD | JPY | NZD | CHF | |
| USD | 0.01% | 0.00% | 0.09% | 0.21% | 0.05% | 0.11% | 0.07% | |
| EUR | -0.02% | -0.02% | 0.07% | 0.18% | 0.02% | 0.10% | 0.05% | |
| GBP | 0.00% | 0.02% | 0.09% | 0.20% | 0.04% | 0.11% | 0.06% | |
| CAD | -0.09% | -0.08% | -0.09% | 0.11% | -0.06% | 0.02% | -0.02% | |
| AUD | -0.21% | -0.19% | -0.21% | -0.12% | -0.16% | -0.09% | -0.14% | |
| JPY | -0.05% | -0.01% | -0.05% | 0.05% | 0.17% | 0.07% | 0.03% | |
| NZD | -0.12% | -0.10% | -0.12% | -0.02% | 0.10% | -0.07% | -0.03% | |
| CHF | -0.07% | -0.05% | -0.06% | 0.02% | 0.13% | -0.03% | 0.05% |
The heat map shows percentage changes of major currencies against each other. The base currency is picked from the left column, while the quote currency is picked from the top row. For example, if you pick the Euro from the left column and move along the horizontal line to the Japanese Yen, the percentage change displayed in the box will represent EUR (base)/JPY (quote).
Japanese Yen FAQs
The Japanese Yen (JPY) is one of the world’s most traded currencies. Its value is broadly determined by the performance of the Japanese economy, but more specifically by the Bank of Japan’s policy, the differential between Japanese and US bond yields, or risk sentiment among traders, among other factors.
One of the Bank of Japan’s mandates is currency control, so its moves are key for the Yen. The BoJ has directly intervened in currency markets sometimes, generally to lower the value of the Yen, although it refrains from doing it often due to political concerns of its main trading partners. The current BoJ ultra-loose monetary policy, based on massive stimulus to the economy, has caused the Yen to depreciate against its main currency peers. This process has exacerbated more recently due to an increasing policy divergence between the Bank of Japan and other main central banks, which have opted to increase interest rates sharply to fight decades-high levels of inflation.
The BoJ’s stance of sticking to ultra-loose monetary policy has led to a widening policy divergence with other central banks, particularly with the US Federal Reserve. This supports a widening of the differential between the 10-year US and Japanese bonds, which favors the US Dollar against the Japanese Yen.
The Japanese Yen is often seen as a safe-haven investment. This means that in times of market stress, investors are more likely to put their money in the Japanese currency due to its supposed reliability and stability. Turbulent times are likely to strengthen the Yen’s value against other currencies seen as more risky to invest in.
- Indian Rupee edges lower amid renewed USD demand on Tuesday.
- The ongoing Indian equity outflows might weigh on the INR.
- Speeches by Fed’s Waller, Williams, Barr, Bostic, Collins, and Mester will be closely watched on Tuesday.
Indian Rupee (INR) loses traction on Tuesday on the modest rebound of US Dollar (USD). Analysts believe that a continuation of equity outflows might exert some selling pressure on the INR and limit the pair’s downside. Traders will keep an eye on foreign outflows, as overseas investors have mostly been on the sell side since the beginning of the fiscal year.
On the other hand, the prospect of rate cuts this year from the US Federal Reserve (Fed) after softer US April inflation data weighs on the USD and US bond yields. Additionally, the Greenback sales by state-run banks, possibly on behalf of the Reserve Bank of India (RBI), might boost the local currency in the near term. The Indian FX and debt markets will be closed on Thursday. Meanwhile, traders will take more cues from the remarks by Fed officials. Apart from this, India's national election outcome will be due on June 4, and exit polls will be released after the final phase of the elections on June 1.
Daily Digest Market Movers: Indian Rupee weakens amid equity outflows
- Foreign investors have sold Indian equities worth more than $3 billion in May, the largest monthly outflow since January 2023.
- Bond yields are expected to decline as India announced that it will reduce the supply of Treasury bills by 600 billion rupees for the next six weeks till the end of June, per Reuters.
- According to India Ratings and Research's lead economist, Sunil Kumar Sinha, India's GDP growth rate for the March quarter is expected to grow 6.7%, with about 6.9-7% for the fiscal year 2023–24.
- The United Nations (UN) has revised India’s growth projections for 2024 to 6.9% this year from 6.2% projected in January. Indian economy is forecast to expand by 6.6% in 2025.
- Financial markets have priced in a 76% possibility of a rate cut from the Fed by 25 basis points (bps) in September and two cuts by the end of the year, according to the CME FedWatch Tool.
Technical analysis: USD/INR maintains a constructive stance
The Indian Rupee trades on a weaker note on the day. The bullish outlook of USD/INR remains unchanged as the pair is above the key 100-day Exponential Moving Average (EMA) on the daily chart. However, the bearish bias could resume if the pair crosses below the key EMA and the neckline of the Head and Shoulders pattern, which has formed since March 21. The 14-day Relative Strength Index (RSI) holds in bearish territory around 47.30, suggesting that further downside cannot be ruled out.
The first upside barrier for USD/INR will emerge near the right shoulder of 83.54 (high of May 13). A break above this level would end up invalidating the Head and Shoulders pattern. The next hurdle is seen near a high of April 17 at 83.72.
On the flip side, the key support level is located at the 83.20–83.25 region, portraying the confluence of the neckline and the 100-day EMA. A breach of the mentioned level will see a drop to the 83.00 psychological level, followed by a low of January 15 at 82.78.
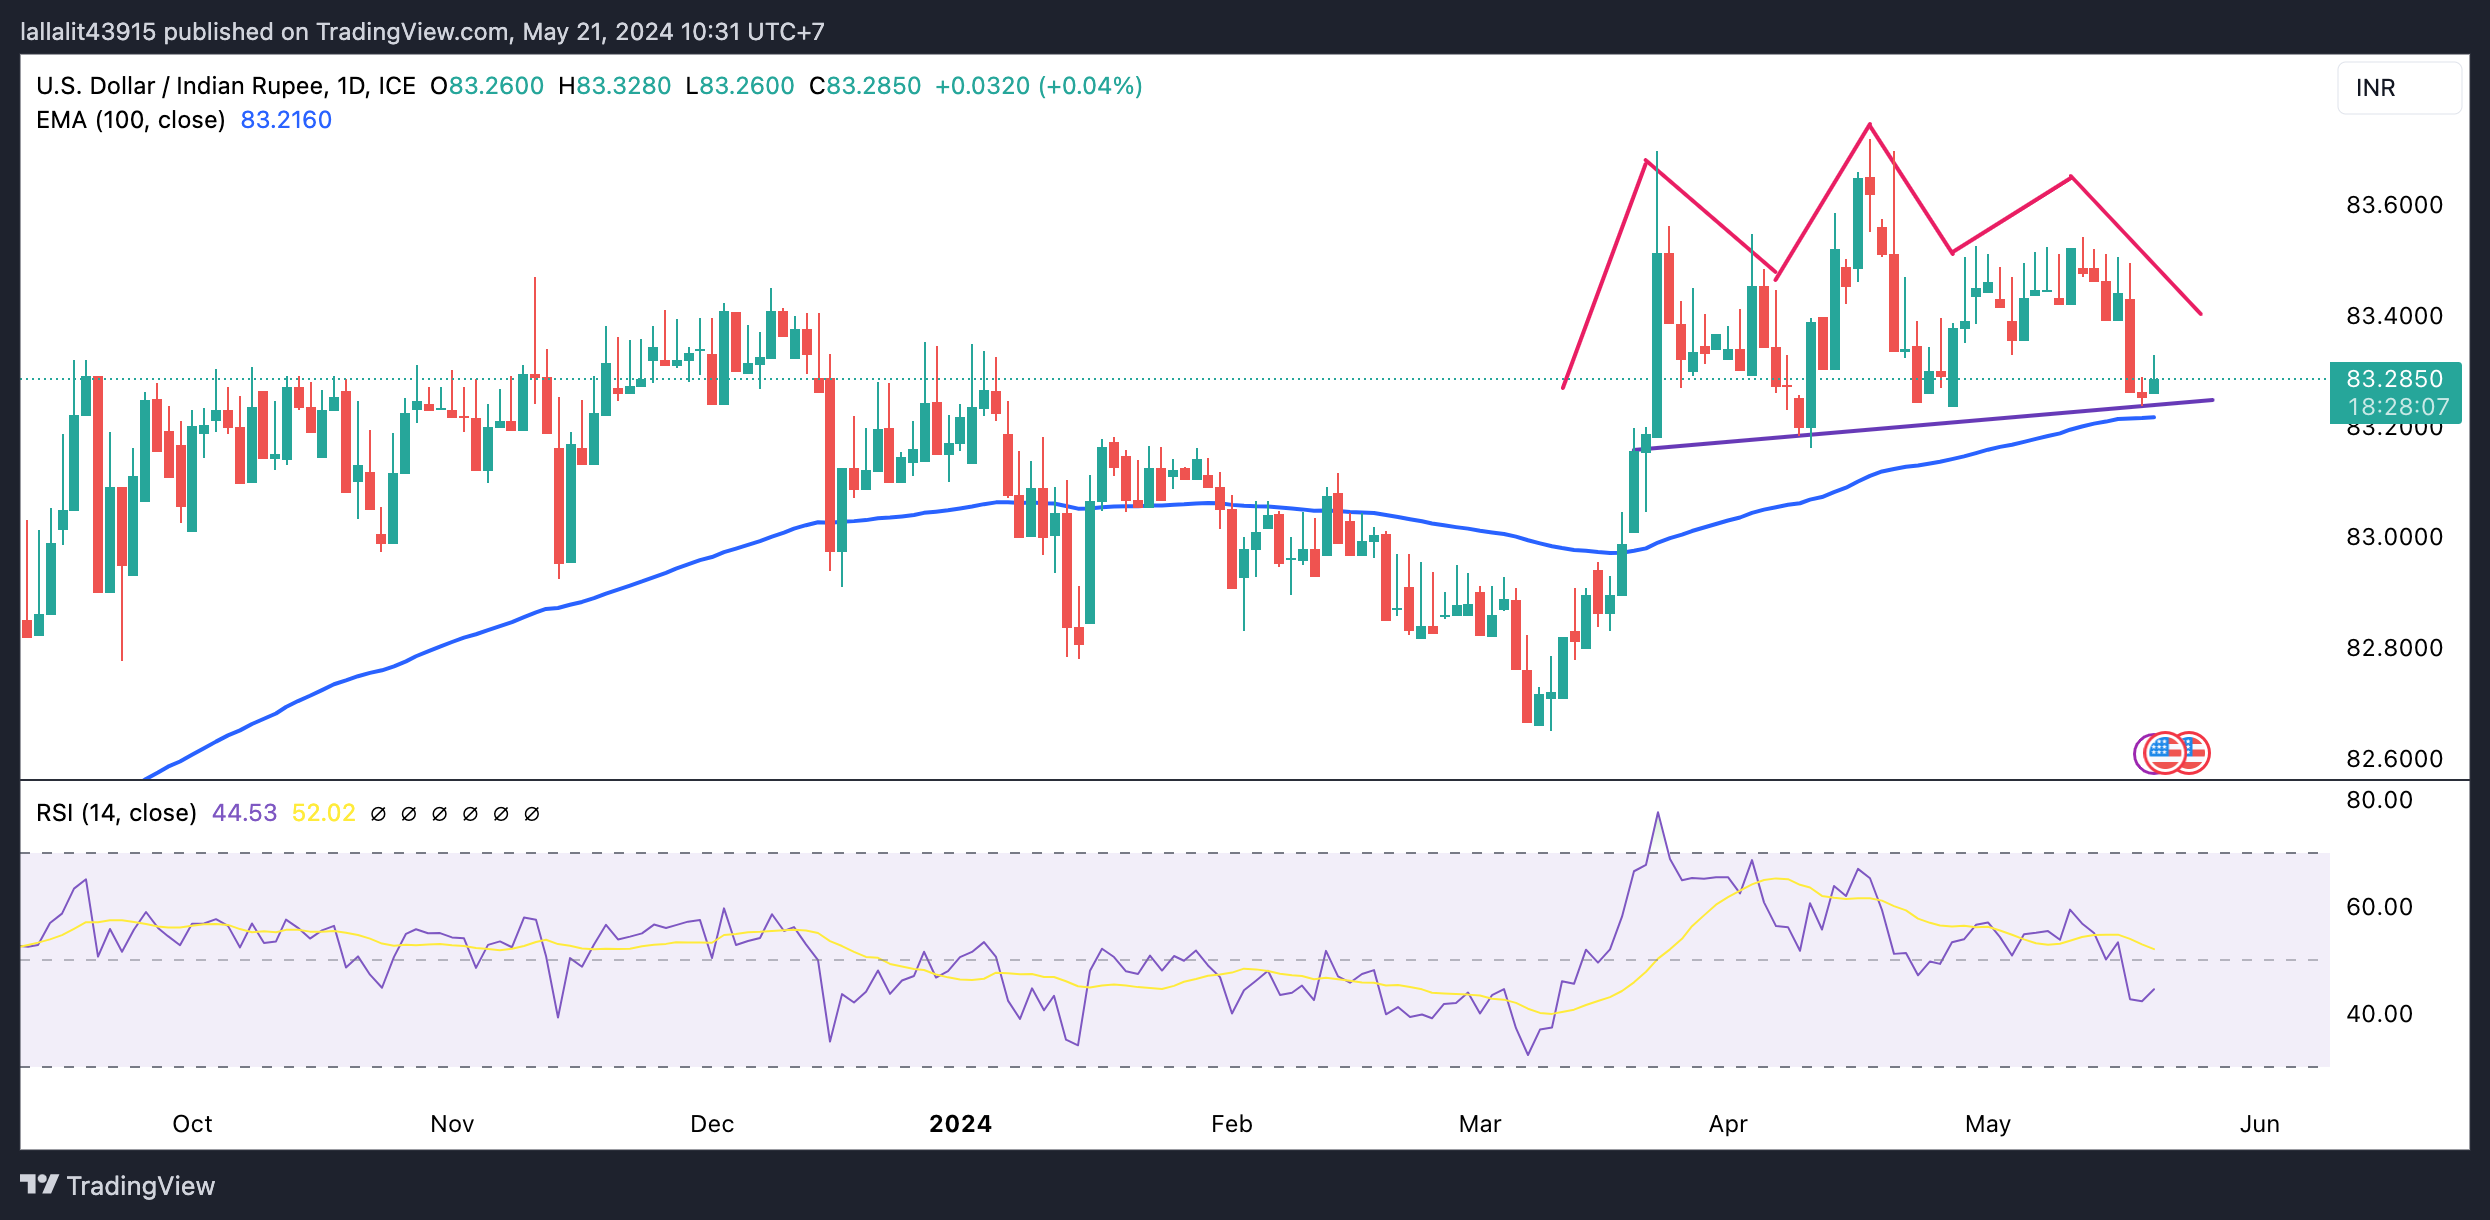
US Dollar price today
The table below shows the percentage change of US Dollar (USD) against listed major currencies today. US Dollar was the strongest against the .
| USD | EUR | GBP | CAD | AUD | JPY | NZD | CHF | |
| USD | 0.05% | 0.03% | 0.12% | 0.28% | 0.06% | 0.21% | 0.11% | |
| EUR | -0.05% | -0.01% | 0.07% | 0.22% | 0.00% | 0.17% | 0.05% | |
| GBP | -0.04% | 0.01% | 0.08% | 0.23% | 0.01% | 0.18% | 0.06% | |
| CAD | -0.12% | -0.09% | -0.07% | 0.15% | -0.06% | 0.10% | -0.03% | |
| AUD | -0.29% | -0.23% | -0.25% | -0.16% | -0.22% | -0.07% | -0.18% | |
| JPY | -0.07% | -0.01% | 0.00% | 0.08% | 0.22% | 0.16% | 0.05% | |
| NZD | -0.21% | -0.17% | -0.18% | -0.09% | 0.07% | -0.15% | -0.09% | |
| CHF | -0.11% | -0.05% | -0.07% | 0.02% | 0.17% | -0.05% | 0.11% |
The heat map shows percentage changes of major currencies against each other. The base currency is picked from the left column, while the quote currency is picked from the top row. For example, if you pick the Euro from the left column and move along the horizontal line to the Japanese Yen, the percentage change displayed in the box will represent EUR (base)/JPY (quote).
Indian Rupee FAQs
The Indian Rupee (INR) is one of the most sensitive currencies to external factors. The price of Crude Oil (the country is highly dependent on imported Oil), the value of the US Dollar – most trade is conducted in USD – and the level of foreign investment, are all influential. Direct intervention by the Reserve Bank of India (RBI) in FX markets to keep the exchange rate stable, as well as the level of interest rates set by the RBI, are further major influencing factors on the Rupee.
The Reserve Bank of India (RBI) actively intervenes in forex markets to maintain a stable exchange rate, to help facilitate trade. In addition, the RBI tries to maintain the inflation rate at its 4% target by adjusting interest rates. Higher interest rates usually strengthen the Rupee. This is due to the role of the ‘carry trade’ in which investors borrow in countries with lower interest rates so as to place their money in countries’ offering relatively higher interest rates and profit from the difference.
Macroeconomic factors that influence the value of the Rupee include inflation, interest rates, the economic growth rate (GDP), the balance of trade, and inflows from foreign investment. A higher growth rate can lead to more overseas investment, pushing up demand for the Rupee. A less negative balance of trade will eventually lead to a stronger Rupee. Higher interest rates, especially real rates (interest rates less inflation) are also positive for the Rupee. A risk-on environment can lead to greater inflows of Foreign Direct and Indirect Investment (FDI and FII), which also benefit the Rupee.
Higher inflation, particularly, if it is comparatively higher than India’s peers, is generally negative for the currency as it reflects devaluation through oversupply. Inflation also increases the cost of exports, leading to more Rupees being sold to purchase foreign imports, which is Rupee-negative. At the same time, higher inflation usually leads to the Reserve Bank of India (RBI) raising interest rates and this can be positive for the Rupee, due to increased demand from international investors. The opposite effect is true of lower inflation.
- WTI Oil price extends losses possibly due to the hawkish remarks from Fed officials regarding maintaining higher rates for longer.
- The death of Iran’s President and emerging health concerns regarding Saudi Arabia’s King do not appear to be affecting the market.
- Canada’s Trans Mountain pipeline started commercial operations this month, transporting an additional 590,000 barrels per day.
West Texas Intermediate (WTI) Oil price extends losses to around $78.90 per barrel during the Asian session on Tuesday following the recent developments in the Middle East. However, the death of Iran’s President Ebrahim Raisi in a helicopter crash and emerging health concerns regarding Saudi Arabia’s King Salman bin Abdulaziz do not appear to be affecting the market.
Crude Oil prices struggled as investors weighed recent hawkish remarks from the Federal Reserve (Fed) despite last week's cooling US consumer inflation data. Federal Reserve Vice Chair Michael Barr said on Monday that the Fed is in a good position to hold the policy steady and watch the economy, as per a Reuters report.
In an interview with Bloomberg, Loretta Mester, President of the Federal Reserve Bank of Cleveland, stated that she no longer believes three rate cuts in 2024 are appropriate. Mester highlighted that inflation risks are skewed to the upside and emphasized that there is no harm in spending additional time gathering data on inflation, given the strength of the economy.
According to the CME FedWatch Tool, the likelihood of the Federal Reserve delivering a 25 basis-point rate cut in September has slightly increased to 49.6%, up from 48.6% a week ago.
In Canada, the expanded Trans Mountain pipeline (TMX) started commercial operations this month, overcoming years of regulatory delays and construction setbacks. This expansion will transport an additional 590,000 barrels per day (bpd) from Alberta to Canada's Pacific coast.
Investors are now turning their attention to the supply from the Organization of the Petroleum Exporting Countries and its affiliates (OPEC+). They are scheduled to meet on June 1 to set output policy, which will include decisions on whether to extend some members' voluntary cuts of 2.2 million barrels per day.
| Raw materials | Closed | Change, % |
|---|---|---|
| Silver | 31.782 | 0.58 |
| Gold | 2424.88 | -0.01 |
| Palladium | 1024.91 | 1.88 |
- The Australian Dollar appreciates due to improved risk appetite on Tuesday.
- Australia’s Consumer Confidence fell 0.3% MoM in May, marking the third consecutive month of decline.
- RBA Meeting Minutes showed that it was challenging to either rule in or rule out future changes in the cash rate.
- The higher US Treasury yields contribute support for the US Dollar.
The Australian Dollar (AUD) inches higher after the release of Westpac Consumer Confidence on Tuesday. The index fell 0.3% month-over-month in May, compared to a 2.4% decline in April. It was the third straight month of drop but the softest pace in this sequence.
The Australian Dollar could receive support as China announced a broad package to support its struggling property market, including the relaxation of mortgage rules and urging local governments to buy unsold homes. This could have lifted sentiment in Aussie markets as both nations are close trade partners.
The US Dollar (USD) trades steady amid the absence of top-tier economic data releases from the United States (US). The higher US Treasury yields contribute support for the Greenback. The US Federal Reserve (Fed) maintains a cautious stance regarding inflation and the potential for rate cuts in 2024.
Daily Digest Market Movers: Australian Dollar advances due to improved risk appetite
- Minutes from the RBA meeting in May 2024 showed that the board considered raising rates but ultimately judged the case for maintaining a steady policy to be stronger. Policymakers agreed that it was challenging to either rule in or rule out future changes in the cash rate. They noted that the flow of data had increased the risk of inflation remaining above the target for an extended period.
- The ASX 200 dropped to around 7,850 on Tuesday following a mixed session on Wall Street. Declines in James Hardie and Sonic Healthcare offset gains in the tech sector. However, mining giants saw an uptick, driven by higher iron ore prices due to Beijing's measures to support the struggling property sector and a surge in copper prices.
- In an interview with Bloomberg, Loretta Mester, President of the Federal Reserve Bank of Cleveland, stated that she no longer believes three rate cuts in 2024 are appropriate. Mester highlighted that inflation risks are skewed to the upside and emphasized that there is no harm in spending additional time gathering data on inflation, given the strength of the economy.
- According to the CME FedWatch Tool, the likelihood of the Federal Reserve delivering a 25 basis-point rate cut in September has slightly increased to 49.6%, up from 48.6% a week ago.
- On Monday, the Chinese Commerce Ministry announced a prohibition on General Atomics Aeronautical Systems, a US company, from engaging in import and export activities related to China. This decision comes amid ongoing trade tensions between the United States and China. Any economic change in the Chinese economy could catalyze the Australian market as both nations are close trade partners.
- Federal Reserve Board of Governors member Michelle Bowman said on Friday that the progress on inflation might not be as steady as many had hoped. Bowman indicated that the decline in inflation observed in the latter half of last year was temporary and that there has been no further progress on inflation this year.
Technical Analysis: Australian Dollar could test the psychological level of 0.6700
The Australian Dollar trades around 0.6670 on Tuesday. The daily chart for AUD/USD showed an ascending triangle formation. Additionally, the 14-day Relative Strength Index (RSI) indicated a bullish sentiment, holding above the 50 mark.
The AUD/USD pair could test the upper limit of the ascending triangle, near the four-month peak of 0.6714. A breakout above this level might lead the pair to explore the area around the significant barrier at 0.6750.
On the downside, potential support is at the nine-day Exponential Moving Average (EMA) at 0.6651, aligned with the key level of 0.6650. A break below this support could push the AUD/USD pair toward the lower boundary of the ascending triangle around 0.6610 and the psychological level of 0.6600.
AUD/USD: Daily Chart
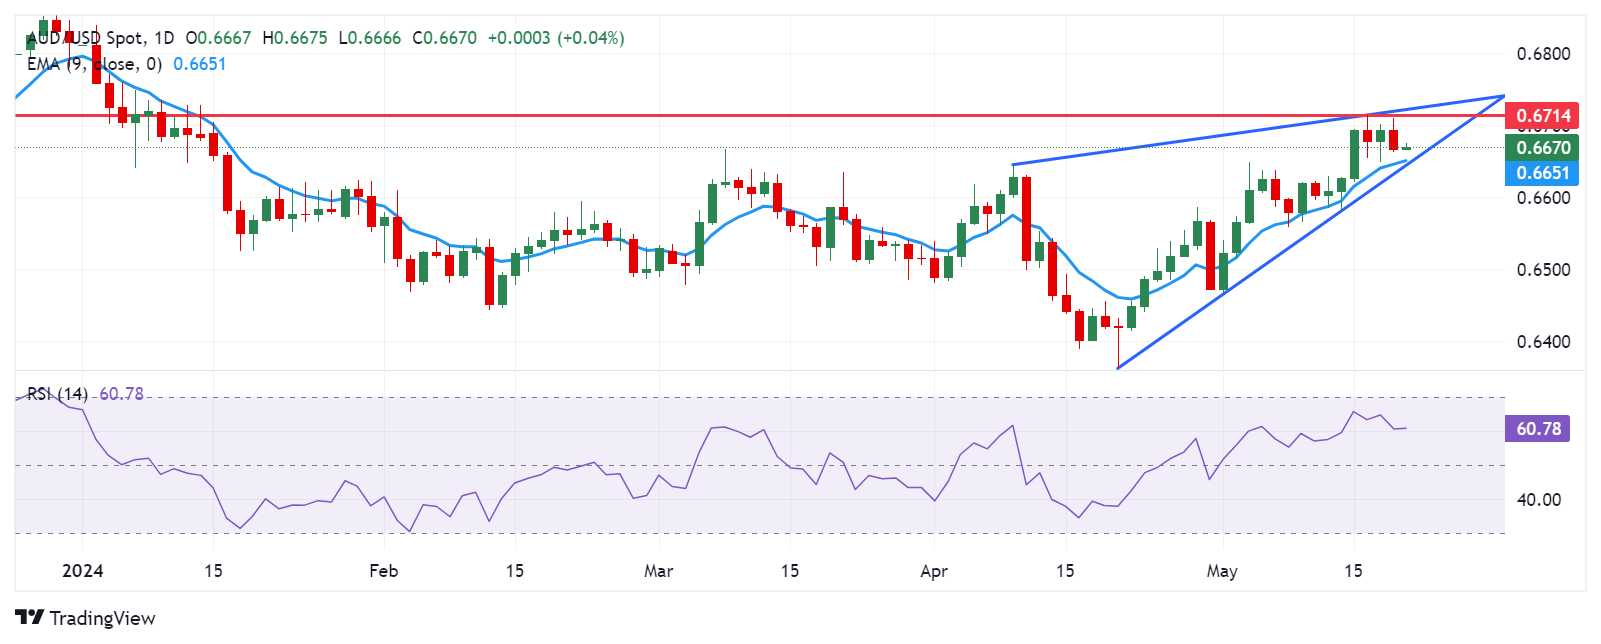
Australian Dollar price today
The table below shows the percentage change of the Australian Dollar (AUD) against listed major currencies today. The Australian Dollar was the strongest against the Swiss Franc.
| USD | EUR | GBP | CAD | AUD | JPY | NZD | CHF | |
| USD | 0.02% | 0.02% | 0.08% | 0.06% | 0.05% | 0.09% | 0.10% | |
| EUR | -0.02% | 0.01% | 0.06% | 0.03% | 0.02% | 0.07% | 0.08% | |
| GBP | -0.03% | -0.01% | 0.05% | 0.02% | 0.01% | 0.06% | 0.07% | |
| CAD | -0.08% | -0.07% | -0.05% | -0.03% | -0.04% | 0.01% | 0.03% | |
| AUD | -0.06% | -0.04% | -0.03% | 0.02% | -0.01% | 0.04% | 0.05% | |
| JPY | -0.04% | -0.01% | -0.01% | 0.05% | 0.01% | 0.06% | 0.07% | |
| NZD | -0.09% | -0.07% | -0.07% | -0.01% | -0.05% | -0.05% | 0.02% | |
| CHF | -0.10% | -0.08% | -0.07% | -0.02% | -0.05% | -0.06% | -0.01% |
The heat map shows percentage changes of major currencies against each other. The base currency is picked from the left column, while the quote currency is picked from the top row. For example, if you pick the Euro from the left column and move along the horizontal line to the Japanese Yen, the percentage change displayed in the box will represent EUR (base)/JPY (quote).
Australian Dollar FAQs
One of the most significant factors for the Australian Dollar (AUD) is the level of interest rates set by the Reserve Bank of Australia (RBA). Because Australia is a resource-rich country another key driver is the price of its biggest export, Iron Ore. The health of the Chinese economy, its largest trading partner, is a factor, as well as inflation in Australia, its growth rate and Trade Balance. Market sentiment – whether investors are taking on more risky assets (risk-on) or seeking safe-havens (risk-off) – is also a factor, with risk-on positive for AUD.
The Reserve Bank of Australia (RBA) influences the Australian Dollar (AUD) by setting the level of interest rates that Australian banks can lend to each other. This influences the level of interest rates in the economy as a whole. The main goal of the RBA is to maintain a stable inflation rate of 2-3% by adjusting interest rates up or down. Relatively high interest rates compared to other major central banks support the AUD, and the opposite for relatively low. The RBA can also use quantitative easing and tightening to influence credit conditions, with the former AUD-negative and the latter AUD-positive.
China is Australia’s largest trading partner so the health of the Chinese economy is a major influence on the value of the Australian Dollar (AUD). When the Chinese economy is doing well it purchases more raw materials, goods and services from Australia, lifting demand for the AUD, and pushing up its value. The opposite is the case when the Chinese economy is not growing as fast as expected. Positive or negative surprises in Chinese growth data, therefore, often have a direct impact on the Australian Dollar and its pairs.
Iron Ore is Australia’s largest export, accounting for $118 billion a year according to data from 2021, with China as its primary destination. The price of Iron Ore, therefore, can be a driver of the Australian Dollar. Generally, if the price of Iron Ore rises, AUD also goes up, as aggregate demand for the currency increases. The opposite is the case if the price of Iron Ore falls. Higher Iron Ore prices also tend to result in a greater likelihood of a positive Trade Balance for Australia, which is also positive of the AUD.
The Trade Balance, which is the difference between what a country earns from its exports versus what it pays for its imports, is another factor that can influence the value of the Australian Dollar. If Australia produces highly sought after exports, then its currency will gain in value purely from the surplus demand created from foreign buyers seeking to purchase its exports versus what it spends to purchase imports. Therefore, a positive net Trade Balance strengthens the AUD, with the opposite effect if the Trade Balance is negative.
The Reserve Bank of Australia (RBA) published the Minutes of its May monetary policy meeting on Tuesday, highlighting that the board members considered whether to raise rates and judged the case for steady policy as the stronger one. Additional details of the RBA Minutes suggest that the board agreed it was difficult to either rule in or rule out future changes in the cash rate, per Reuters.
Key takeaways
“Considered whether to raise rates, judged case for steady policy the stronger one.”
“Board agreed difficult to either rule in or rule out future changes in the cash rate.”
“Flow of data had increased risks of inflation staying above target for longer.”
“Board expressed limited tolerance for inflation returning to target later than 2026.”
“Staff forecasts were considered sound, presented credible path back to target.”
“Board noted forecasts were predicated on a noticeably higher path for the cash rate.”
“Rate rise could be appropriate if forecasts proved overly optimistic.”
“Risks around the forecasts were judged to be balanced.”
“Importantly, inflation expectations remained well anchored.”
“Reasonable to look through short-term variation in inflation to avoid "excessive fine tuning”.”
“Labour market had proved tighter than expected, consumer demand weaker.”
“Financial conditions in Australia were judged to be restrictive.”
“Risks to global growth had become more balanced, the outlook for the US and China revised upward.”
Market reaction
At the time of writing, the AUD/USD pair is trading near 0.6669, holding higher while adding 0.04% on the day.
RBA FAQs
The Reserve Bank of Australia (RBA) sets interest rates and manages monetary policy for Australia. Decisions are made by a board of governors at 11 meetings a year and ad hoc emergency meetings as required. The RBA’s primary mandate is to maintain price stability, which means an inflation rate of 2-3%, but also “..to contribute to the stability of the currency, full employment, and the economic prosperity and welfare of the Australian people.” Its main tool for achieving this is by raising or lowering interest rates. Relatively high interest rates will strengthen the Australian Dollar (AUD) and vice versa. Other RBA tools include quantitative easing and tightening.
While inflation had always traditionally been thought of as a negative factor for currencies since it lowers the value of money in general, the opposite has actually been the case in modern times with the relaxation of cross-border capital controls. Moderately higher inflation now tends to lead central banks to put up their interest rates, which in turn has the effect of attracting more capital inflows from global investors seeking a lucrative place to keep their money. This increases demand for the local currency, which in the case of Australia is the Aussie Dollar.
Macroeconomic data gauges the health of an economy and can have an impact on the value of its currency. Investors prefer to invest their capital in economies that are safe and growing rather than precarious and shrinking. Greater capital inflows increase the aggregate demand and value of the domestic currency. Classic indicators, such as GDP, Manufacturing and Services PMIs, employment, and consumer sentiment surveys can influence AUD. A strong economy may encourage the Reserve Bank of Australia to put up interest rates, also supporting AUD.
Quantitative Easing (QE) is a tool used in extreme situations when lowering interest rates is not enough to restore the flow of credit in the economy. QE is the process by which the Reserve Bank of Australia (RBA) prints Australian Dollars (AUD) for the purpose of buying assets – usually government or corporate bonds – from financial institutions, thereby providing them with much-needed liquidity. QE usually results in a weaker AUD.
Quantitative tightening (QT) is the reverse of QE. It is undertaken after QE when an economic recovery is underway and inflation starts rising. Whilst in QE the Reserve Bank of Australia (RBA) purchases government and corporate bonds from financial institutions to provide them with liquidity, in QT the RBA stops buying more assets, and stops reinvesting the principal maturing on the bonds it already holds. It would be positive (or bullish) for the Australian Dollar.
- Gold price trades on a stronger note on Tuesday amid the softer USD.
- The hope for Fed rate cuts, rising geopolitical risks, and strong gold demand support the yellow metal.
- Investors await the Fed’s Waller, Williams, Barr, Bostic, Collins, and Mester later on Tuesday.
Gold price (XAU/USD) extends the rally on Tuesday after retracing from a record high earlier. The renewed gold demand is bolstered by higher bets on interest rate cuts from the US Federal Reserve (Fed), ongoing geopolitical tensions, along with the strong demand stemming from central banks and Asian buyers.
Nonetheless, the lack of fresh catalysts in a quiet session in terms of top-tier economic data might limit the precious metal’s upside. Gold traders will take more cues from the Fedspeak, with the Fed’s Waller, Williams, Barr, Bostic, Collins, and Mester scheduled to speak later on Tuesday. The FOMC Minutes will be the highlight on Wednesday. Furthermore, the hawkish stance from Fed officials is likely to lift the Greenback and drag the USD-denominated Gold lower.
Daily Digest Market Movers: Gold price holds gains amid the rate cut expectation
- Gold reached a record high on Monday at $2,450, and silver prices moved toward 12-year highs. Gold has risen 18% this year, while silver has gained 35%.
- Fed Vice Chair Michael Barr said that the central bank “will need to allow our restrictive policy some further time to continue to do its work.”
- Fed policymaker Philip Jefferson, another permanent voting member of the Fed's rate-setting committee, said inflation was still easing, although nowhere near as quickly as he expected.
- Atlanta Fed President Raphael Bostic said that policy is restrictive and that it would take a while before the central bank gains confidence that inflation is headed to 2%.
- Investors see a 76% odd of rate cut from the Fed by 25 basis points (bps) in September and two cuts by the end of the year, according to the CME FedWatch Tool.
Technical Analysis: Gold price’s constructive stance remains intact
Gold price posts modest gains on the day. According to the four-hour timeframe, the yellow metal keeps the positive stance unchanged as it holds above the key 100-period Exponential Moving Average (EMA) with an upward slope. The Relative Strength Index (RSI) stands in the bullish zone around 69.00, suggesting the support level to likely to hold rather than break.
Any follow-through buying could make another attempt at breaking above an all-time high of $2,450. Further north, the next hurdle is seen at the $2,500 psychological mark.
On the other hand, the resistance-turned support level of $2,420 acts as an initial support level for XAU/USD. The additional downside filter to watch is the $2,400 round number. The key contention level will emerge at the 100-period EMA at $2,355.
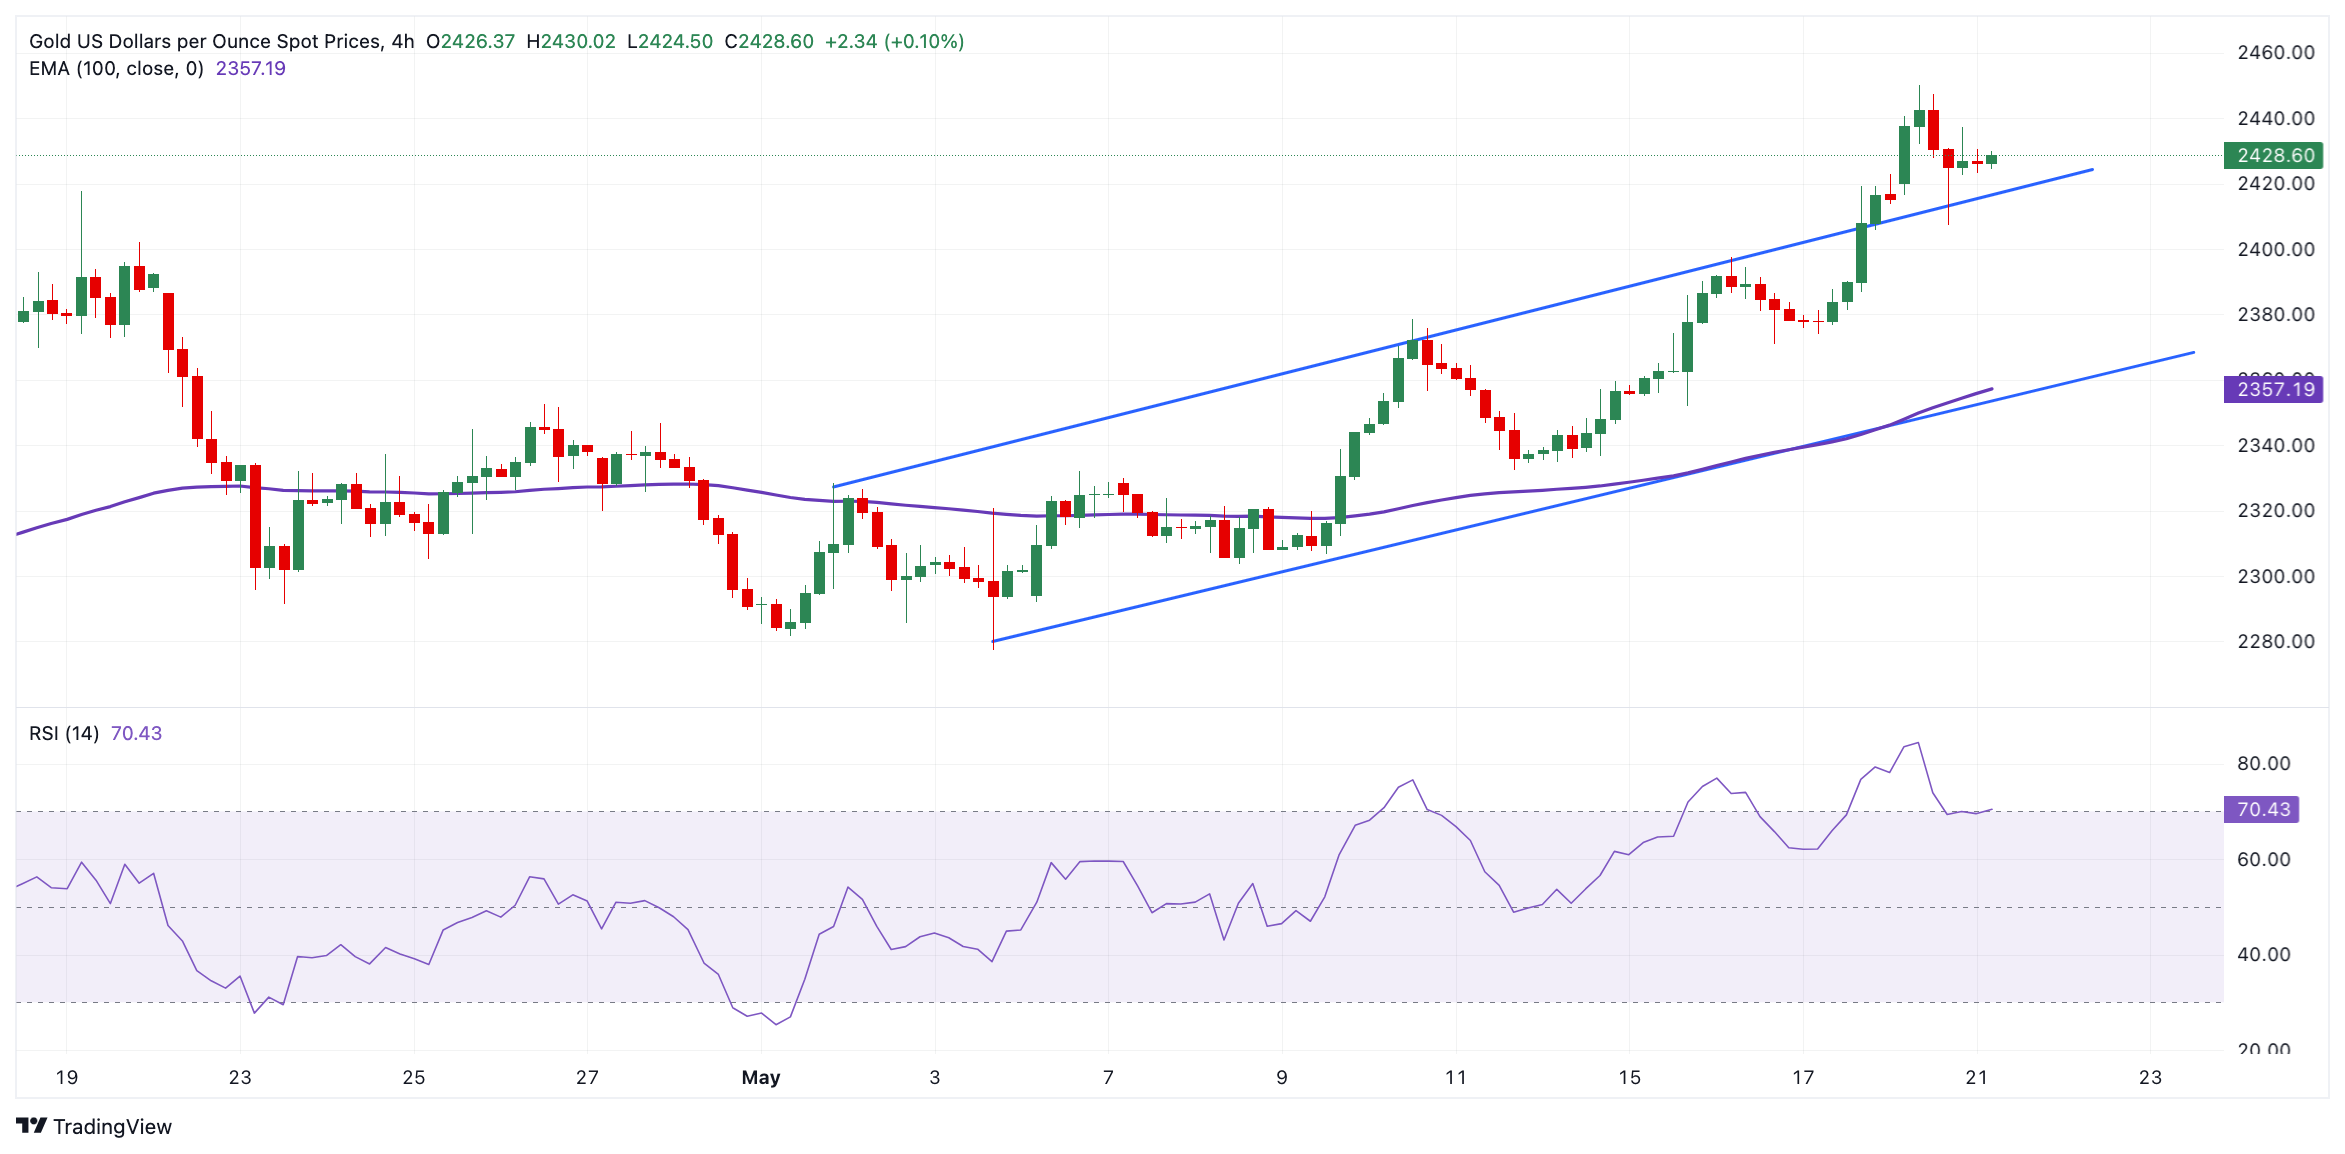
US Dollar price today
The table below shows the percentage change of US Dollar (USD) against listed major currencies today. US Dollar was the weakest against the Australian Dollar.
| USD | EUR | GBP | CAD | AUD | JPY | NZD | CHF | |
| USD | 0.01% | 0.01% | 0.04% | 0.01% | 0.05% | 0.03% | 0.08% | |
| EUR | -0.01% | 0.00% | 0.02% | -0.01% | 0.03% | 0.02% | 0.07% | |
| GBP | -0.01% | 0.00% | 0.04% | -0.01% | 0.03% | 0.02% | 0.07% | |
| CAD | -0.04% | -0.03% | -0.03% | -0.03% | 0.00% | -0.01% | 0.05% | |
| AUD | -0.01% | 0.00% | 0.00% | 0.02% | 0.04% | 0.01% | 0.07% | |
| JPY | -0.05% | -0.01% | -0.03% | 0.00% | -0.04% | -0.02% | 0.05% | |
| NZD | -0.03% | -0.01% | -0.02% | 0.01% | -0.02% | 0.02% | 0.07% | |
| CHF | -0.08% | -0.07% | -0.07% | -0.05% | -0.08% | -0.04% | -0.06% |
The heat map shows percentage changes of major currencies against each other. The base currency is picked from the left column, while the quote currency is picked from the top row. For example, if you pick the Euro from the left column and move along the horizontal line to the Japanese Yen, the percentage change displayed in the box will represent EUR (base)/JPY (quote).
Gold FAQs
Gold has played a key role in human’s history as it has been widely used as a store of value and medium of exchange. Currently, apart from its shine and usage for jewelry, the precious metal is widely seen as a safe-haven asset, meaning that it is considered a good investment during turbulent times. Gold is also widely seen as a hedge against inflation and against depreciating currencies as it doesn’t rely on any specific issuer or government.
Central banks are the biggest Gold holders. In their aim to support their currencies in turbulent times, central banks tend to diversify their reserves and buy Gold to improve the perceived strength of the economy and the currency. High Gold reserves can be a source of trust for a country’s solvency. Central banks added 1,136 tonnes of Gold worth around $70 billion to their reserves in 2022, according to data from the World Gold Council. This is the highest yearly purchase since records began. Central banks from emerging economies such as China, India and Turkey are quickly increasing their Gold reserves.
Gold has an inverse correlation with the US Dollar and US Treasuries, which are both major reserve and safe-haven assets. When the Dollar depreciates, Gold tends to rise, enabling investors and central banks to diversify their assets in turbulent times. Gold is also inversely correlated with risk assets. A rally in the stock market tends to weaken Gold price, while sell-offs in riskier markets tend to favor the precious metal.
The price can move due to a wide range of factors. Geopolitical instability or fears of a deep recession can quickly make Gold price escalate due to its safe-haven status. As a yield-less asset, Gold tends to rise with lower interest rates, while higher cost of money usually weighs down on the yellow metal. Still, most moves depend on how the US Dollar (USD) behaves as the asset is priced in dollars (XAU/USD). A strong Dollar tends to keep the price of Gold controlled, whereas a weaker Dollar is likely to push Gold prices up.
The People’s Bank of China (PBoC) set the USD/CNY central rate for the trading session ahead on Tuesday at 7.1069 as compared to the previous day's fix of 7.1042 and 7.2366 Reuters estimates.
Japanese Finance Minister Shunichi Suzuki said on Tuesday that there are both advantages and disadvantages of the weak Japanese Yen (JPY), but he is more concerned about the negative aspects of the weak JPY.
Key quotes
“Market dialogue key as long-term rates increase.”
“Aims for appropriate national debt policies in Japan.”
“Hopes for wage hikes above inflation pace.”
“Plans wage increases to combat deflationary mindset.”
“Both advantages and disadvantages of weak Yen.”
“ Market determines levels for currencies.”
“Opposes excessive forex volatility.”
“Will discuss world economy, AI, and other issues.”
“Says the government is watching markets.”
“Will conduct appropriate bond management policy.”
“Says he is closely watching FX moves.”
Market reaction
These comments have little to no market reaction to the Japanese Yen (JPY). At the time of writing, USD/JPY is trading 0.09% higher on the day to trade at 156.38.
Japanese Yen FAQs
The Japanese Yen (JPY) is one of the world’s most traded currencies. Its value is broadly determined by the performance of the Japanese economy, but more specifically by the Bank of Japan’s policy, the differential between Japanese and US bond yields, or risk sentiment among traders, among other factors.
One of the Bank of Japan’s mandates is currency control, so its moves are key for the Yen. The BoJ has directly intervened in currency markets sometimes, generally to lower the value of the Yen, although it refrains from doing it often due to political concerns of its main trading partners. The current BoJ ultra-loose monetary policy, based on massive stimulus to the economy, has caused the Yen to depreciate against its main currency peers. This process has exacerbated more recently due to an increasing policy divergence between the Bank of Japan and other main central banks, which have opted to increase interest rates sharply to fight decades-high levels of inflation.
The BoJ’s stance of sticking to ultra-loose monetary policy has led to a widening policy divergence with other central banks, particularly with the US Federal Reserve. This supports a widening of the differential between the 10-year US and Japanese bonds, which favors the US Dollar against the Japanese Yen.
The Japanese Yen is often seen as a safe-haven investment. This means that in times of market stress, investors are more likely to put their money in the Japanese currency due to its supposed reliability and stability. Turbulent times are likely to strengthen the Yen’s value against other currencies seen as more risky to invest in.
| Index | Change, points | Closed | Change, % |
|---|---|---|---|
| NIKKEI 225 | 282.3 | 39069.68 | 0.73 |
| Hang Seng | 82.61 | 19636.22 | 0.42 |
| KOSPI | 17.52 | 2742.14 | 0.64 |
| ASX 200 | 49.3 | 7863.7 | 0.63 |
| DAX | 64.54 | 18768.96 | 0.35 |
| CAC 40 | 28.47 | 8195.97 | 0.35 |
| Dow Jones | -196.82 | 39806.77 | -0.49 |
| S&P 500 | 4.86 | 5308.13 | 0.09 |
| NASDAQ Composite | 108.9 | 16794.88 | 0.65 |
| Pare | Closed | Change, % |
|---|---|---|
| AUDUSD | 0.66675 | -0.45 |
| EURJPY | 169.61 | 0.26 |
| EURUSD | 1.08575 | -0.14 |
| GBPJPY | 198.467 | 0.42 |
| GBPUSD | 1.27054 | 0.03 |
| NZDUSD | 0.61054 | -0.5 |
| USDCAD | 1.36231 | 0.11 |
| USDCHF | 0.91042 | 0.18 |
| USDJPY | 156.207 | 0.4 |


© 2000-2026. Sva prava zaštićena.
Sajt je vlasništvo kompanije Teletrade D.J. LLC 2351 LLC 2022 (Euro House, Richmond Hill Road, Kingstown, VC0100, St. Vincent and the Grenadines).
Svi podaci koji se nalaze na sajtu ne predstavljaju osnovu za donošenje investicionih odluka, već su informativnog karaktera.
The company does not serve or provide services to customers who are residents of the US, Canada, Iran, The Democratic People's Republic of Korea, Yemen and FATF blacklisted countries.
Izvršenje trgovinskih operacija sa finansijskim instrumentima upotrebom marginalne trgovine pruža velike mogućnosti i omogućava investitorima ostvarivanje visokih prihoda. Međutim, takav vid trgovine povezan je sa potencijalno visokim nivoom rizika od gubitka sredstava. Проведение торговых операций на финанcовых рынках c маржинальными финанcовыми инcтрументами открывает широкие возможноcти, и позволяет инвеcторам, готовым пойти на риcк, получать выcокую прибыль, но при этом неcет в cебе потенциально выcокий уровень риcка получения убытков. Iz tog razloga je pre započinjanja trgovine potrebno odlučiti o izboru odgovarajuće investicione strategije, uzimajući u obzir raspoložive resurse.
Upotreba informacija: U slučaju potpunog ili delimičnog preuzimanja i daljeg korišćenja materijala koji se nalazi na sajtu, potrebno je navesti link odgovarajuće stranice na sajtu kompanije TeleTrade-a kao izvora informacija. Upotreba materijala na internetu mora biti praćena hiper linkom do web stranice teletrade.org. Automatski uvoz materijala i informacija sa stranice je zabranjen.
Ako imate bilo kakvih pitanja, obratite nam se pr@teletrade.global.
транcфери