- Analiza
- Novosti i instrumenti
- Vesti sa tržišta
Forex-novosti i prognoze od 20-08-2019
| Time | Country | Event | Period | Previous value | Forecast |
|---|---|---|---|---|---|
| 01:30 | Australia | Leading Index | July | -0.1% | |
| 08:30 | United Kingdom | PSNB, bln | July | -6.50 | -2.65 |
| 12:30 | Canada | Bank of Canada Consumer Price Index Core, y/y | July | 2% | |
| 12:30 | Canada | Consumer Price Index m / m | July | -0.2% | 0.2% |
| 12:30 | Canada | Consumer price index, y/y | July | 2% | 1.7% |
| 14:00 | U.S. | Existing Home Sales | July | 5.27 | 5.39 |
| 14:30 | U.S. | Crude Oil Inventories | August | 1.58 | -1.885 |
| 18:00 | U.S. | FOMC meeting minutes |
Major US stock indices fell moderately, interrupting the three-day rally, as the decline in financial companies outweighed the solid growth in shares of the retailer Home Depot (HD).
Shares of major US banks such as Citigroup (C), Bank of America (BAC) and J.P. Morgan Chase (JPM) fell in price amid falling treasury yields. Yields on 10-year bonds fell 5 basis points to 1.55%.
Home Depot reported a quarterly profit of $ 3.17 per share, which was higher than the average forecast of analysts at $ 3.08. However, the company's revenue was slightly below forecasts. In addition, comparable sales increased by 3% compared to analysts forecast + 3.5%. Home Depot said its sales were affected by lower sawnwood prices, and it lowered its full-year sales forecast, noting that tariffs could affect US consumer spending. However, HD stock prices jumped 4.63%.
Investors look forward to the publication of the minutes of the July meeting of the Federal Reserve System (FRS) on Wednesday, as well as statements by Fed Chairman Jerome Powell on Friday at the annual conference of central banks in Jackson Hole (Wyoming). Powell's comments will be closely monitored for tips on whether to expect further easing of the policy amid the ongoing trade war with China and growing fears of an impending recession, signaled by an inversion of the US bond yield curve last week.
Most DOW components recorded a decrease (25 out of 30). Outsiders were shares of Dow Inc. (DOW, -5.39%). The biggest gainers were Home Depot Inc. (HD, + 4.63%).
Almost all S&P sectors completed trading in the red. The largest decline was shown by the financial sector (-0.8%). Only the conglomerate sector grew (+ 0.8%).
At the time of closing:
Dow 25,962.44 -173.35 -0.66%
S&P 500 2,900.51 -23.14 -0.79%
Nasdaq 100 7,948.56 -54.25 -0.68%
| Time | Country | Event | Period | Previous value | Forecast |
|---|---|---|---|---|---|
| 01:30 | Australia | Leading Index | July | -0.1% | |
| 08:30 | United Kingdom | PSNB, bln | July | -6.50 | -2.65 |
| 12:30 | Canada | Bank of Canada Consumer Price Index Core, y/y | July | 2% | |
| 12:30 | Canada | Consumer Price Index m / m | July | -0.2% | 0.2% |
| 12:30 | Canada | Consumer price index, y/y | July | 2% | 1.7% |
| 14:00 | U.S. | Existing Home Sales | July | 5.27 | 5.39 |
| 14:30 | U.S. | Crude Oil Inventories | August | 1.58 | -1.885 |
| 18:00 | U.S. | FOMC meeting minutes |
- Says EU will remain united in its approach to Brexit
- Britain must decide which way it goes, we have made our offer to work closely
- It is a question of the political declaration on future ties, not of the Withdrawal Agreement
- Says deputy PM Salvini has violated commitments
- The League party's decision to present no-confident motion was "grave" and will have consequences for country
- Decision will make it likely that budget won't be passed in time; VAT may have to be increased
Mazen Issa, the senior FX strategist at TD Securities, suggests that, as the markets await key Fed events in the minutes and the symposium this week, the broad USD is off to a firm start and it comes against a backdrop of suppressed U.S. Treasury (and global) bond yields.
- “We think this firmness can continue, at the very least on a tactical basis as we think the Fed will not be able to bridge the gap between aggressive easing priced into the curve and the Fed's definition of a "mid-cycle adjustment". As such, we see a risk that US yields adjust temporarily and tactically higher in the short-term in the coming days (a dynamic which we think will be met with inevitable demand).
- We do not expect the USD to be immune to this adjustment and perhaps more durably than the rates market. There are some signs that the recent bid in the USD may persist for a while longer. For one, even with the rally in US 10s in recent weeks, the USD still remains the only game in town as far as carry is concerned (in the G10).
- Dethroning this status will be very difficult to do without a return to aggressive balance sheet expansion we think. Here, the ECB is just much further ahead in this process. Taken in conjunction with US data surprises moving in the USD's favor only serves to reinforce its its allure (although still healthily stable on a y/y trade-weighted basis).
- Further to this, option markets are pricing in a modest premium in USD calls, and, after leading the move lower against the USD earlier this summer (but in line with the move in US10s), both the EUR and JPY have begun to diverge from the recent drop in 10yr yields. This suggests to us that the market requires a fresh catalyst to compel upside in these currencies vs. the USD, neither of which - with some caveats in the JPY - is compelling at the moment.”
Nathan Janzen, the senior economist at the Royal Bank of Canada (RBC), notes that Canada’s June manufacturing sales were on the soft side, declining 1.2% in total, but perhaps not quite as soft as feared given an earlier-reported sharp drop in exports for June.
- “Most of the headline manufacturing sales decline was due to a drop in prices, including a big 5% drop in petroleum and coal prices. The 0.2% dip in headline sales once controlling for price changes followed a 1.7% jump in May.
- Overall in Q2, manufacturing sale volumes increased 7.3% (at an annualized rate) from Q1 and 2.9% from a year ago. We are still tracking a ~3% increase in overall Q2 GDP.”
U.S. stock-index futures traded little-changed on Tuesday as investors paused after a three-day rally, which was triggered by hopes that major economies would act to counter a global economic slowdown.
Global Stocks:
Index/commodity | Last | Today's Change, points | Today's Change, % |
Nikkei | 20,677.22 | +114.06 | +0.55% |
Hang Seng | 26,231.54 | -60.30 | -0.23% |
Shanghai | 2,880.00 | -3.09 | -0.11% |
S&P/ASX | 6,545.00 | +77.60 | +1.20% |
FTSE | 7,200.83 | +11.18 | +0.16% |
CAC | 5,373.96 | +2.40 | +0.04% |
DAX | 11,709.21 | -6.16 | -0.05% |
Crude oil | $55.98 | -0.29% | |
Gold | $1,514.70 | +0.21% |
- Says he is hopeful Hong Kong situation will be resolved in a humane way
- Imports from Huawei in 5G networks represent an "enormous risk"
- Progress on trade deal is up to Chinese President Xi
(company / ticker / price / change ($/%) / volume)
3M Co | MMM | 162.8 | -0.15(-0.09%) | 554 |
ALCOA INC. | AA | 18.3 | 0.07(0.38%) | 120 |
Amazon.com Inc., NASDAQ | AMZN | 1,820.06 | 3.94(0.22%) | 17699 |
Apple Inc. | AAPL | 211.09 | 0.74(0.35%) | 127718 |
AT&T Inc | T | 35.35 | -0.03(-0.08%) | 25573 |
Boeing Co | BA | 334.1 | 0.32(0.10%) | 3996 |
Caterpillar Inc | CAT | 117.5 | 0.14(0.12%) | 673 |
Chevron Corp | CVX | 117.59 | 0.28(0.24%) | 2074 |
Cisco Systems Inc | CSCO | 48.56 | 0.06(0.12%) | 8010 |
Citigroup Inc., NYSE | C | 64.15 | -0.16(-0.25%) | 3998 |
Exxon Mobil Corp | XOM | 69.64 | 0.19(0.27%) | 3145 |
Facebook, Inc. | FB | 186.36 | 0.19(0.10%) | 39424 |
FedEx Corporation, NYSE | FDX | 159 | 0.69(0.44%) | 654 |
Ford Motor Co. | F | 9.05 | 0.02(0.22%) | 5418 |
Freeport-McMoRan Copper & Gold Inc., NYSE | FCX | 9.21 | -0.04(-0.43%) | 6200 |
General Electric Co | GE | 8.64 | -0.03(-0.35%) | 315903 |
General Motors Company, NYSE | GM | 37.54 | 0.18(0.48%) | 101 |
Goldman Sachs | GS | 202 | -0.20(-0.10%) | 800 |
Google Inc. | GOOG | 1,198.93 | 0.48(0.04%) | 1907 |
Hewlett-Packard Co. | HPQ | 18.9 | -0.31(-1.61%) | 13150 |
Home Depot Inc | HD | 213.16 | 5.21(2.51%) | 218735 |
Intel Corp | INTC | 47.16 | -0.07(-0.15%) | 5640 |
International Business Machines Co... | IBM | 134.99 | -0.05(-0.04%) | 3935 |
JPMorgan Chase and Co | JPM | 108.4 | -0.29(-0.27%) | 2339 |
Merck & Co Inc | MRK | 86.35 | 0.16(0.19%) | 770 |
Nike | NKE | 80.62 | -0.51(-0.63%) | 2632 |
Pfizer Inc | PFE | 35.19 | 0.01(0.03%) | 7148 |
Procter & Gamble Co | PG | 120.43 | 0.19(0.16%) | 299 |
Tesla Motors, Inc., NASDAQ | TSLA | 228.5 | 1.67(0.74%) | 51614 |
Twitter, Inc., NYSE | TWTR | 41.84 | 0.14(0.34%) | 10932 |
Verizon Communications Inc | VZ | 57.16 | 0.16(0.28%) | 2715 |
Visa | V | 180 | 0.26(0.14%) | 2543 |
Wal-Mart Stores Inc | WMT | 113.77 | -0.04(-0.04%) | 11000 |
Walt Disney Co | DIS | 133.7 | -1.59(-1.18%) | 41420 |
Yandex N.V., NASDAQ | YNDX | 36.36 | -0.05(-0.14%) | 300 |
Walt Disney (DIS) target lowered to $140 from $147 at Imperial Capital
DuPont (DD) target lowered to $77 from $83 at Cowen
HP (HPQ) downgraded to Neutral from Buy at Citigroup; target lowered to $21
AT&T (T) removed from BofA/Merrill's US 1 List
Statistics
Canada released its Monthly Survey of Manufacturing on Tuesday, which showed that
the Canadian manufacturing sales fell 1.2 percent m-o-m in June to CAD58.02
billion, following an unrevised 1.6 percent m-o-m increase in May.
Economists had
anticipated a drop of 1.7 percent m-o-m for June.
According to
the survey, sales dropped in 16 of 21 industries, representing 68 percent of
total manufacturing sales. The petroleum and coal product (-3.8 percent m-o-m) and
food (-2.5 percent m-o-m) industries accounted for most of the June drop. Sales
also were lower in the machinery (-5.6 percent m-o-m), paper (-5.9 percent
m-o-m) and chemical (-2.9 percent m-o-m) industries. On the contrary, the
primary metal industry (+11.7 percent m-o-m) posted the largest gain.
Overall, sales
of non-durable goods declined 3.3 percent m-o-m in June, while sales of durable
goods rose 0.7 percent m-o-m.
For the second
quarter, manufacturing sales grew 1.7 percent y-o-y.
Jane Foley, the senior FX strategist at Rabobank, notes that it has been 28 years since Australia last fell into recession and the recent flattening of yield curve in response to slowing growth both domestically and internationally is fuelling the debate about whether a significant downturn is now inevitable.
- “So far this year the RBA has already cut interest rates twice, bringing its policy rate down to 1%. The pre-emptive nature of the central bank’s policy may have been partly aimed at pushing down the value of the AUD, which has dropped by 3.8% vs. the USD in the year to date. The drop in the policy rate combined with market expectations that further cuts are in the pipeline has also encouraged a debate about the likelihood that the RBA could resort to quantitative easing in the foreseeable future. This would likely further depress the value of the AUD.
- There is speculation that commercial banks in Australia could be unlikely to pass on any rate cut in the RBA’s main policy rate below the 0.50% level. This is related to concerns about the impact on deposits and fears about the impact on their net interest margins.
- In terms of the outlook for the domestic economy, it is not all bad news. Aided by the drop in interest rates, evidence is growing of a stabilisation in the housing market and this can be expected to have a positive impact on consumer confidence. That said, the labour market is posting some worrying signals.
- On top of the subdued inflation outlook, the Australian economy is vulnerable to slowing growth in China.
- Not only does weakness in the Chinese economy have negative implications for Australia and the AUD through various trade channels but the associated rise in risk aversion can also pressure the exchange rate. Although Australia’s current account deficit % GDP has fallen, this can still increase the sensitivity of the AUD to bad news. We expect AUD/USD to head towards 0.65 on a 12 month view.”
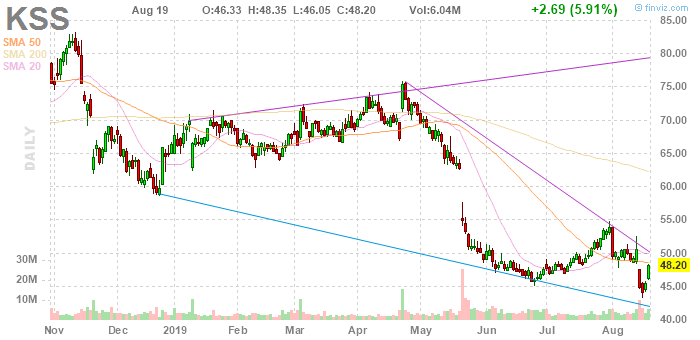
Kohl's (KSS) reported Q2 FY 2019 earnings of $1.55 per share (versus $1.76 in Q2 FY 2018), beating analysts’ consensus estimate of $1.53.
The company’s quarterly revenues amounted to $4.430 bln (-3.1% y/y), beating analysts’ consensus estimate of $4.248 bln.
The company reaffirmed guidance for FY 2019, projecting EPS of $5.15-5.45 versus analysts’ consensus estimate of $5.22.
KSS rose to $50.20 (+4.15%) in pre-market trading.
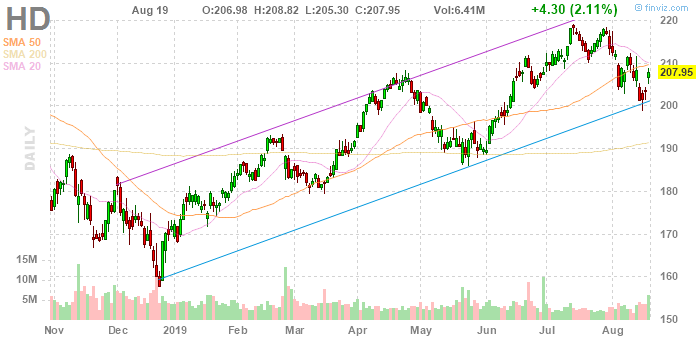
Home Depot (HD) reported Q2 FY 2019 earnings of $3.17 per share (versus $3.05 in Q2 FY 2018), beating analysts’ consensus estimate of $3.08.
The company’s quarterly revenues amounted to $30.839 bln (+1.2% y/y), generally in line with analysts’ consensus estimate of $30.984 bln.
The company also issued guidance for FY 2019, projecting EPS of +3.1% y/y to ~$10.34 (versus analysts’ consensus estimate of $10.10) and revenues of +2.3% y/y to ~$110.7 bln (versus analysts’ consensus estimate of $111.18 bln).
HD rose to $212.00 (+1.95%) in pre-market trading.
Andreas Steno Larsen, the analyst at Nordea Markets, believes that markets have so far also chosen to price in more cuts from the Fed than the ECB, even though the Euro-area outlook is probably worse than the US outlook, both on the growth and the inflation front and is simply a result of differing starting points.
- “The Fed simply has room to cut (materially), while it is much more exhausting for the ECB to convince the public of the need for more cuts even deeper into negative territory (with that said, we expect them to cut rates). The USD/EUR spread compression trade could continue to work based on this relatively simple line of thought.
- Furthermore, we have noted how the Fed rarely (if at all) underdelivers versus market expectations of cuts. It can be too expensive not to deliver the expected cuts as the Fed risks to tighten financial conditions abruptly in that case. From a risk/reward perspective, it continues to make sense to bet on the Fed delivering (at least) what is priced in.
- Hence, USD hedge costs have likely already peaked last year as the Fed can “outcut” the ECB over the coming quarters, which will continue to compress short-end USD/EUR spreads as a consequence.
- But this is not a green light for USD depreciation pressure as the rate spread is not a particularly good predictor of EUR/USD spot moves. We have a target of 1.08 for EUR/USD at the end of the year due to continued trade and growth tensions.”
Karen Jones, the analyst at Commerzbank, notes that EUR/GBP cross has held the initial test of the .9088 31st July low and remains downside corrective – the market has temporarily topped at .9327 and the market has already sold off to .9088, the 31st July low.
- “We look for losses to the 55-day ma at .9022 and there is scope for the 50% retracement at .8896. The intraday Elliott wave counts are conflicting and for now, we will step aside. Intraday rallies are likely to hold below .9225. Above .9327 targets .9403, the 2016 high and eventually .9803. Only below the July low at .8891 will alleviate upside pressure.
- We regard .8465 as an interim low.”
FX Strategists at UOB Group are expecting the USD/JPY to trade within a sideline theme in the short-term horizon.
- "24-hour view: While USD edged to a high of 106.69, the advance lacks momentum and is viewed as part of a broader sideway trading range. That said, there is room for USD to rise to further even though a break of 107.00 would come as a surprise. Support is at 106.40 followed by the stronger level at 106.20.
- Next 1-3 weeks: USD touched 105.03 earlier last week (12 Aug) before staging an outsized and rapid rebound that hit 106.97. While downward pressure has eased and the 105.03 low could be a short-term bottom, it is too early to expect a sustained recovery. Mixed indicators suggest USD could trade sideways for period and only a clear break out of the expected 105.50/107.30 sideway trading range would indicate that USD is ready for a sustained directional move”.
The latest
survey by the Confederation of British Industry (CBI) showed on Tuesday the UK
manufacturers’ order books remained below normal in August, but to a lesser
extent than in July.
According to
the report, the CBI's monthly factory order book balance increased to -13 in August
from -34 in the previous month. That was the highest reading since May and in line with the long-run average. Economists had expected the reading to increase
to -23.
According to the report, present stocks of finished goods were reported as above adequate, but were roughly in line with the long-run average.
The survey also revealed manufacturers expect to keep output prices in the next three months broadly unchanged, - the lowest balance since February 2016.
Britain's economy is slightly larger than previously thought, according to new official estimates published on Tuesday that take into account new methodology and data.
The Office for National Statistics added around 26 billion pounds to the size of the world's fifth-biggest economy in 2016, a rise equivalent to around 1.3% of gross domestic product and bringing total output to just under 2 trillion pounds.
The ONS regularly updates its methods for measuring the economy, which usually results in slight increases to its size.
Average annual growth in the economy between 1997 to 2016 is now estimated at 2.1%, up from 2.0% previously.
"These new figures are produced using new sources and methods, giving significantly improved estimates of how money moves around the UK economy," Rob Kent-Smith, head of GDP at the ONS, said.
The new figures showed the economy contracted by 6.0% during the financial crisis, a smaller drop than the 6.3% estimated previously. The economy also returned to its pre-crisis peak in early 2013, slightly sooner than thought beforehand.
According to first estimates from Eurostat, in June 2019 compared with May 2019, seasonally adjusted production in the construction sector remained unchanged in the euro area (EA19) and decreased by 0.3% in the EU28. In May 2019, production in construction decreased by 0.5% in the euro area and by 0.4% in the EU28.
In June 2019 compared with June 2018, production in construction increased by 1.0% in the euro area and by 0.6% in the EU28.
In the euro area in June 2019, compared with May 2019, civil engineering increased by 0.3% while building construction decreased by 0.5%. In the EU28, civil engineering fell by 0.5% and building construction by 0.2%.
In the euro area in June 2019, compared with June 2018, building construction increased by 1.5% and civil engineering by 0.8%. In the EU28, civil engineering rose by 1.4% and building construction by 0.5%.
In view of Karen Jones, analyst at Commerzbank, USD/JPY continues to creep slowly higher, its recent new low of 105.05 was not been confirmed by the daily RSI.
“We suspect that the market has based just ahead of the 104.48/10 January low and the 2013-2019 uptrend. Interim resistance is the 107.21 18th July low. A negative bias remains entrenched while capped by the 108.99/109.32 recent highs. Failure at 104.10 would target 99.00 the 2016 low, but for now we would allow for consolidation. We look for the market to remain capped by its 111.62 2015-2019 downtrend. Only above here would target the 114.55 October 2018 high.”
Veteran investor Mark Mobius gave a blanket endorsement to buying gold, saying that accumulating bullion will reap rewards over the long term as leading central banks loosen monetary policy and the rise of cryptocurrencies serves only to reinforce demand for genuinely hard assets.
“Gold’s long-term prospect is up, up and up, and the reason why I say that is money supply is up, up and up,” Mobius told Bloomberg TV. He added: “I think you have to be buying at any level, frankly.”
“With the efforts by the central banks to lower interest rates, they’re going to be printing like crazy,” said Mobius, who recommends allocating about 10% of a portfolio to physical bullion. In the interview he didn’t spell out a price target for gold in his on-air remarks.
The increasing role of digital currencies such as Bitcoin has spurred a debate in the precious metals market both about their intrinsic worth, and whether their rising popularity will detract from traditional haven gold. For Mobius, their advent will actually boost bullion consumption.
“You have all these currencies, new currencies coming into play,” he said. “I call them ‘psycho currencies,’ because it’s a matter of faith whether you believe in Bitcoin or any of the other cyber-currencies. I think with the rise of that, there’s going to be a demand for real, hard assets, and that includes gold.”
According to Karen Jones, analyst at Commerzbank, GBP/USD’s rally has so far been capped by the 20 day ma at 1.2172.
“Last week the market based at 1.2015 and is correcting higher near term. The market remains under pinned by the January 2017 low at 1.1988 (we have a 13 count on the daily chart and TD support is 1.1988). We would allow for a rebound to the down channel at 1.2336. Below 1.1988 lies the 1.1491 3rd October low (according to CQG). It stays negative while contained by its 3 month downtrend at 1.2336 today. Only above the downtrend this would introduce scope to the 55 day ma at 1.2443 and the June high at 1.2784. Only a rise above the June high at 1.2784 would indicate that a bottom is being formed (not favoured).”
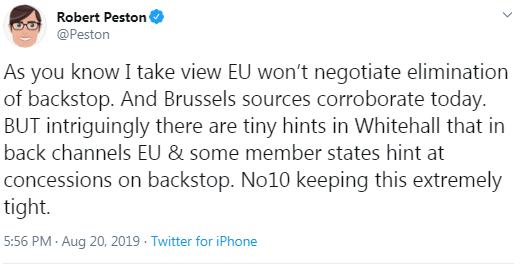
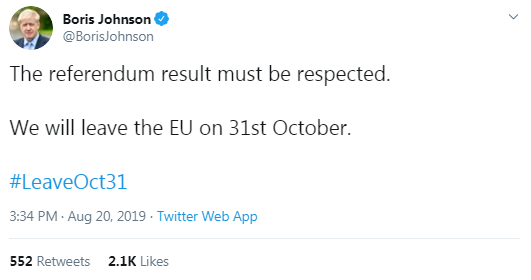
The European Union needs to show flexibility over the Irish border “backstop” because the issue of whether Britain leaves the bloc with or without a deal is now mainly up to Brussels, Conservative party chairman James Cleverly said.
“The decision as to whether we leave with or without a deal is largely now in the hands of European Union negotiators,” Cleverly told Sky News, adding that the EU’s insistence on the so-called backstop was the main sticking point in reaching a deal.
“We will be leaving on the 31st of October come what may, and I think the recognition of that will help the EU negotiators understand what they need to do.”
Karen Jones, analyst at Commerzbank, suggests that USD/CHF pair is upside corrective near term, after the market saw a key day reversal on Tuesday last week from .9659.
“A sustained break below the .9716/.9692 key support was not seen (location of the 25th June low, the January low and Fibo support) and we would allow for recovery to the 55 day ma at .9851. Key resistance remains the 200 day ma at .9960, and we continue to look for this to cap the topside. Below .9659 (last weeks low) targets the .9543 September 2018 low. Longer term we target .9211/.9188, the 2018 low. Above the 200 day moving average lies the mid-June high at 1.0014 and 1.0123/78.6% retracement.”
Danske Bank analysts note that yesterday, the Fed's Rosengren pushed back against further rate cuts arguing that the US economy is still in good shape and he does not expect a significant slowdown.
“Rosengren, who voted against the first cut last month, said "I just want to see evidence we are going into something that is more a slowdown ". The Fed has been extraordinarily quiet in the past couple of weeks after the FOMC meeting and markets are awaiting more details from Fed chair Powell when he speaks at the annual Jackson Hole conference on Friday (we are also probably going to hear from some of the other FOMC members as well, but nothing is scheduled as of now). In the other camp to Rosengren is US President Trump, who yesterday maintained the pressure on the Fed by tweeting that the Fed should cut rates by at least 100bp and possibly restart QE to support both the US and world economy. While we think the Fed will bark off the political pressure, we still think the economic reality means the Fed will deliver cuts over the next six months without pre-committing to more easing.”
China lowered its new lending reference rate slightly on Tuesday, as expected, as the country’s central bank kicked off new interest rate reforms designed to lower corporate borrowing costs.
But the tiny reduction in the revamped Loan Prime Rate (LPR), which is calculated from price contributions from selected banks, reflects lenders’ reluctance to reduce loan rates. That has fueled expectation Beijing will need to take more steps to guide borrowing costs lower in a struggling economy.
The new one-year LPR was set at 4.25% on Tuesday, down 6 basis points from 4.31% previously. It was 10 basis points lower than the PBOC’s existing benchmark one-year lending rate.
“While this should nudge banks to reduce lending rates slightly, the impact on economic activity will be marginal,” Capital Economics Senior China Economist Julian Evans-Pritchard said in a note. “A decline of only a few basis points is small.”
He also said the PBOC would need to take other steps, including cuts to medium-term liquidity rates, if it wants to continue reducing the LPR to lower funding costs for banks.
According to the report from Federal Statistical Office (Destatis), in July 2019 the index of producer prices for industrial products rose by 1.1% compared with the corresponding month of the preceding year. Economists had expected a 1.0% increase. In June 2019 the annual rate of change all over had been +1.2%. Compared with the preceding month June 2019 the overall index increased slightly by 0.1% in July 2019 (-0.4% in June 2019).
The greatest impact on the growth of the overall index compared to July 2018 had the development of electricity prices. These were up 8.4% (+2.2% compared to June 2019). Energy prices as a whole rose by 2.1% (+0.7% compared to June 2019). On an annual basis prices of natural gas (distribution) decreased by 1.5% and prices of petroleum products by 2.0%.
The overall index disregarding energy was 0.7% up on July 2018 and fell by 0.1% compared to June 2019.
Prices of non-durable consumer goods increased by 1.7% compared to July 2018 (-0.2% on June 2019). Food prices were up 2.2%.
Prices of capital goods increased by 1.5%, prices of durable consumer goods were up 1.3%.
Prices of intermediate goods decreased by 0.7% compared to July 2018 (-0.4% on June 2019). Prices decreased especially regarding electronic integrated circuits (-14%).
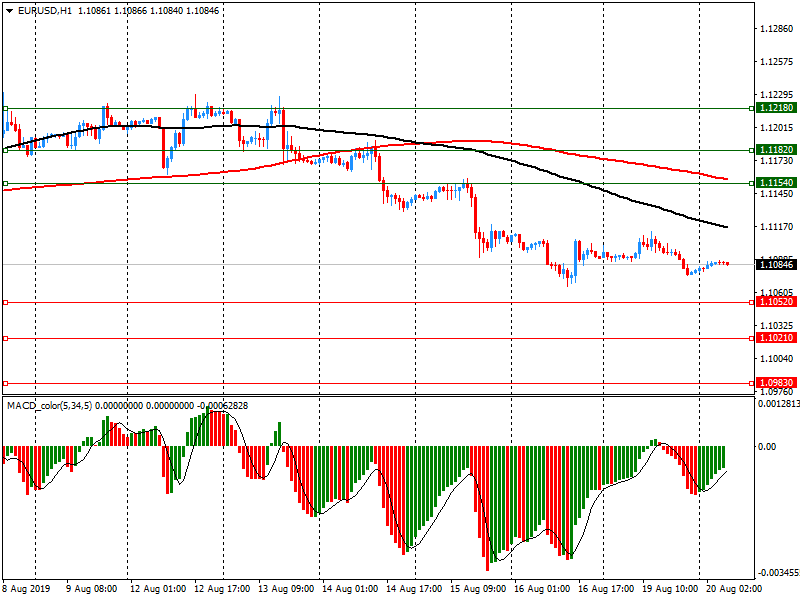
EUR/USD
Resistance levels (open interest**, contracts)
$1.1218 (2667)
$1.1182 (2107)
$1.1154 (791)
Price at time of writing this review: $1.1085
Support levels (open interest**, contracts):
$1.1052 (4602)
$1.1021 (4093)
$1.0983 (7289)
Comments:
- Overall open interest on the CALL options and PUT options with the expiration date September, 6 is 104321 contracts (according to data from August, 19) with the maximum number of contracts with strike price $1,1400 (8870);
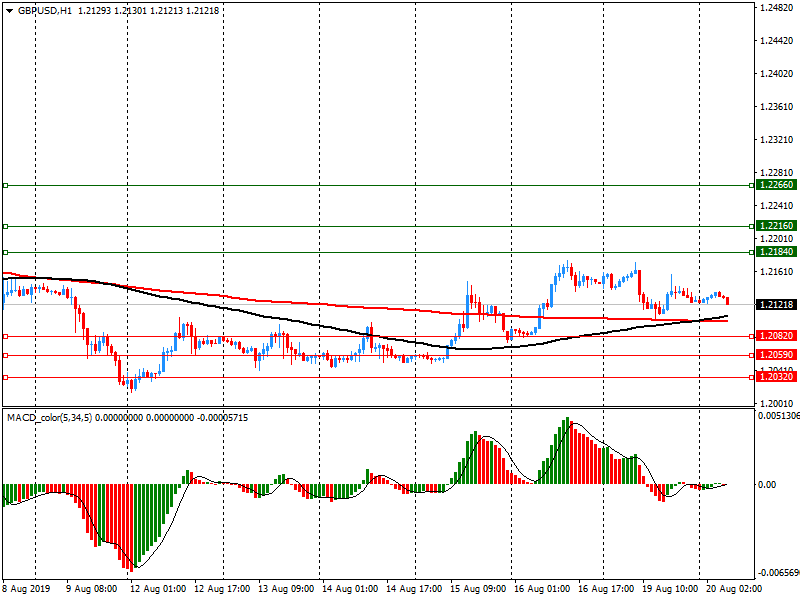
GBP/USD
Resistance levels (open interest**, contracts)
$1.2266 (1194)
$1.2216 (893)
$1.2184 (322)
Price at time of writing this review: $1.2122
Support levels (open interest**, contracts):
$1.2082 (968)
$1.2059 (586)
$1.2032 (2075)
Comments:
- Overall open interest on the CALL options with the expiration date September, 6 is 30274 contracts, with the maximum number of contracts with strike price $1,2750 (4128);
- Overall open interest on the PUT options with the expiration date September, 6 is 23710 contracts, with the maximum number of contracts with strike price $1,2100 (2075);
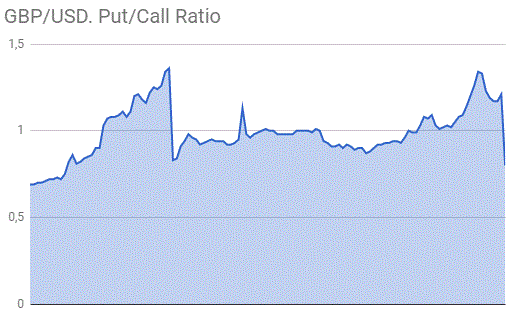
- The ratio of PUT/CALL was 0.78 versus 0.78 from the previous trading day according to data from August, 19
* - The Chicago Mercantile Exchange bulletin (CME) is used for the calculation.
** - Open interest takes into account the total number of option contracts that are open at the moment.
| Raw materials | Closed | Change, % |
|---|---|---|
| Brent | 59.31 | 1.63 |
| WTI | 56 | 2.13 |
| Silver | 16.84 | -1.41 |
| Gold | 1495.781 | -1.1 |
| Palladium | 1476.44 | 1.95 |
| Index | Change, points | Closed | Change, % |
|---|---|---|---|
| NIKKEI 225 | 144.35 | 20563.16 | 0.71 |
| Hang Seng | 557.62 | 26291.84 | 2.17 |
| KOSPI | 12.73 | 1939.9 | 0.66 |
| ASX 200 | 61.9 | 6467.4 | 0.97 |
| FTSE 100 | 72.5 | 7189.65 | 1.02 |
| DAX | 152.63 | 11715.37 | 1.32 |
| Dow Jones | 249.78 | 26135.79 | 0.96 |
| S&P 500 | 34.97 | 2923.65 | 1.21 |
| NASDAQ Composite | 106.82 | 8002.81 | 1.35 |
| Pare | Closed | Change, % |
|---|---|---|
| AUDUSD | 0.67642 | -0.24 |
| EURJPY | 118.103 | 0.13 |
| EURUSD | 1.10791 | -0.1 |
| GBPJPY | 129.255 | 0.06 |
| GBPUSD | 1.21256 | -0.17 |
| NZDUSD | 0.64062 | -0.29 |
| USDCAD | 1.33242 | 0.41 |
| USDCHF | 0.98134 | 0.31 |
| USDJPY | 106.594 | 0.24 |
© 2000-2026. Sva prava zaštićena.
Sajt je vlasništvo kompanije Teletrade D.J. LLC 2351 LLC 2022 (Euro House, Richmond Hill Road, Kingstown, VC0100, St. Vincent and the Grenadines).
Svi podaci koji se nalaze na sajtu ne predstavljaju osnovu za donošenje investicionih odluka, već su informativnog karaktera.
The company does not serve or provide services to customers who are residents of the US, Canada, Iran, The Democratic People's Republic of Korea, Yemen and FATF blacklisted countries.
Izvršenje trgovinskih operacija sa finansijskim instrumentima upotrebom marginalne trgovine pruža velike mogućnosti i omogućava investitorima ostvarivanje visokih prihoda. Međutim, takav vid trgovine povezan je sa potencijalno visokim nivoom rizika od gubitka sredstava. Проведение торговых операций на финанcовых рынках c маржинальными финанcовыми инcтрументами открывает широкие возможноcти, и позволяет инвеcторам, готовым пойти на риcк, получать выcокую прибыль, но при этом неcет в cебе потенциально выcокий уровень риcка получения убытков. Iz tog razloga je pre započinjanja trgovine potrebno odlučiti o izboru odgovarajuće investicione strategije, uzimajući u obzir raspoložive resurse.
Upotreba informacija: U slučaju potpunog ili delimičnog preuzimanja i daljeg korišćenja materijala koji se nalazi na sajtu, potrebno je navesti link odgovarajuće stranice na sajtu kompanije TeleTrade-a kao izvora informacija. Upotreba materijala na internetu mora biti praćena hiper linkom do web stranice teletrade.org. Automatski uvoz materijala i informacija sa stranice je zabranjen.
Ako imate bilo kakvih pitanja, obratite nam se pr@teletrade.global.

