- Analiza
- Novosti i instrumenti
- Vesti sa tržišta
Forex-novosti i prognoze od 20-06-2024
- EUR/USD backslid to the 1.0700 handle on Thursday, erasing the week’s gains.
- EU PMI figures expected to rise slightly on Friday.
- US PMIs to wrap up the trading week, expected to tick lower.
EUR/USD fell back to familiar technical levels on Thursday, clunking down to the 1.0700 handle after a miss in US economic figures bolstered the Greenback. Friday markets loom ahead with a packed data docket, with Purchasing Managers Index (PMI) figures for both the EU and the US on the cards.
Forex today: All the looks will be on PMI reports
In May, Germany's Producer Price Index (PPI) fell to 0.0% on a month-over-month basis, down from the previous 0.2% and missing the expected increase to 0.3%. On a year-over-year basis, the PPI also came in below expectations, declining to -2.2% for the year ending in May. Although the annual figure improved from the previous -3.3%, it still fell short of the forecasted recovery to -2.0%.
Read more: US Initial Jobless Claims rose more than estimated last week
The latest US Initial Jobless Claims numbers came in higher than expected, with 238,000 people filing for unemployment benefits in the week ending June 14, compared to the revised previous week's figure of 243,000. This increase also pushed the four-week average up to 242,750 from the previous 227,250.
The Philadelphia Fed Manufacturing Survey for June dropped to 1.3 from 4.5, falling short of the expected 5.0. Additionally, US Housing Starts decreased to 1.277 million new residential construction projects in May, lower than the forecast of 1.37 million and the revised previous month's figure of 1.352 million.
Coming up on Friday: EU & US PMI prints to close out the week
Friday’s pan-EU HCOB Purchasing Managers Index (PMI) activity surveys for June are expected to recover slightly. The EU’s June Manufacturing PMI is expected to move to 47.9 from 47.3, while the Services PMI component is forecast to rise to 53.5 from 53.2.
On the US side, Manufacturing and Services PMIs are both forecast to tick lower, with Manufacturing expected to slip to 51.0 from 51.3 and Services sliding to 53.7 from 54.8.
EUR/USD technical outlook
EUR/USD continues to follow technicals lower, driving intraday action further down the charts as the 200-hour Exponential Moving Average (EMA) presses down from 1.0750. The Fiber is bumping into the 1.0700 handle as selling pressure keeps the pair in reach of last week’s low point just below 1.0670.
EUR/USD continues to stagnate on daily candlesticks, and any fresh selling pressure will send the pair back into 2024 lows set in April near the 1.0600 handle. On the high side, a bullish recovery will run aground of the 200-day EMA at 1.0800.
EUR/USD hourly chart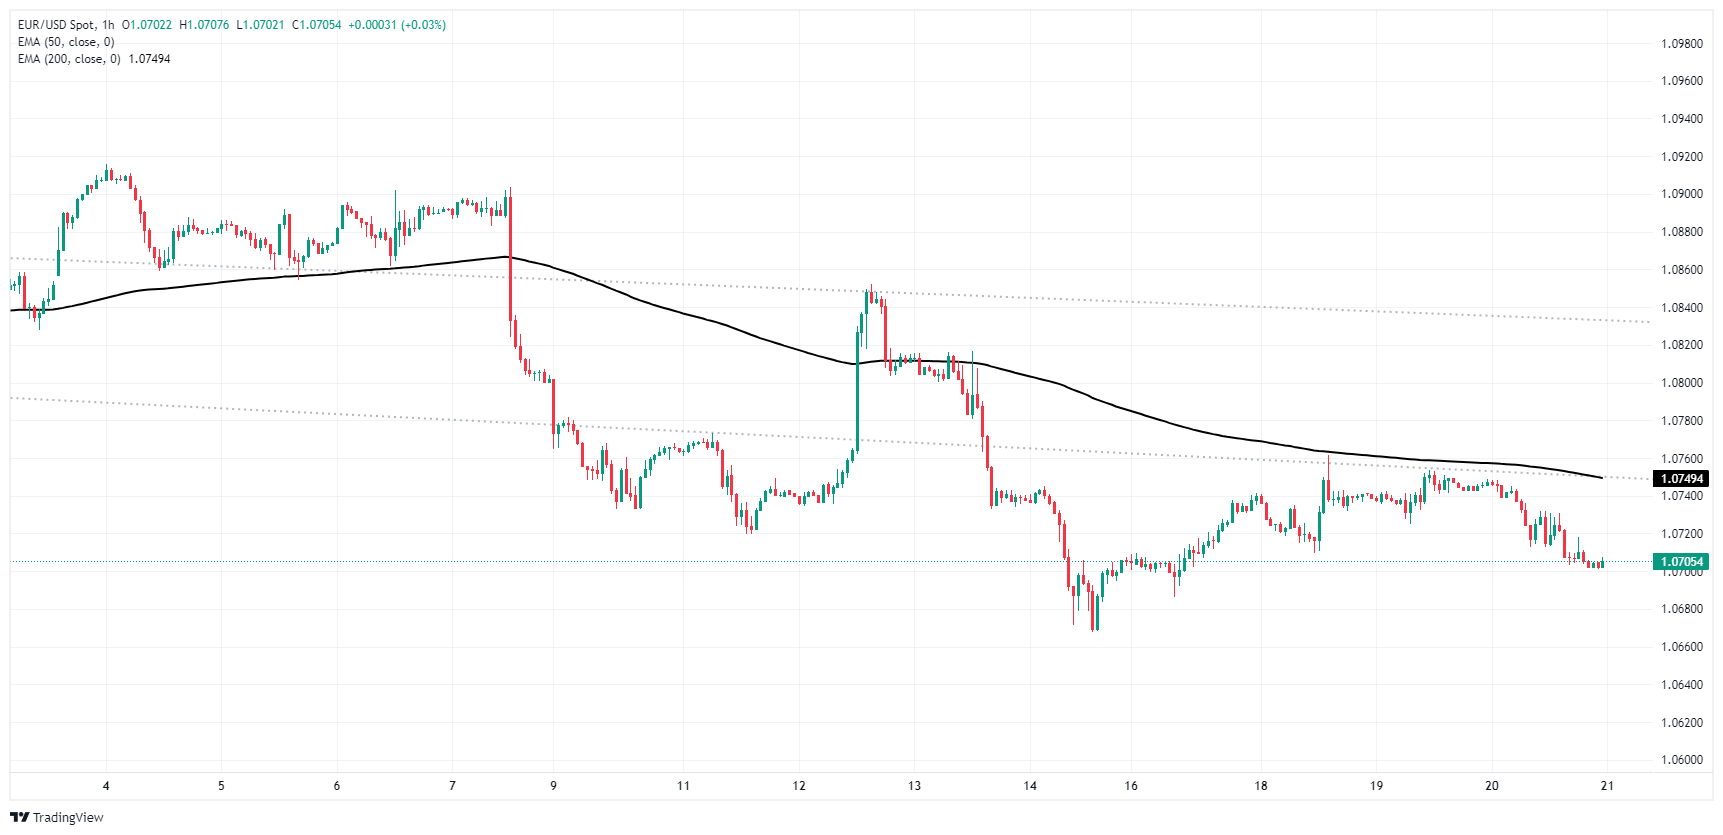
EUR/USD daily chart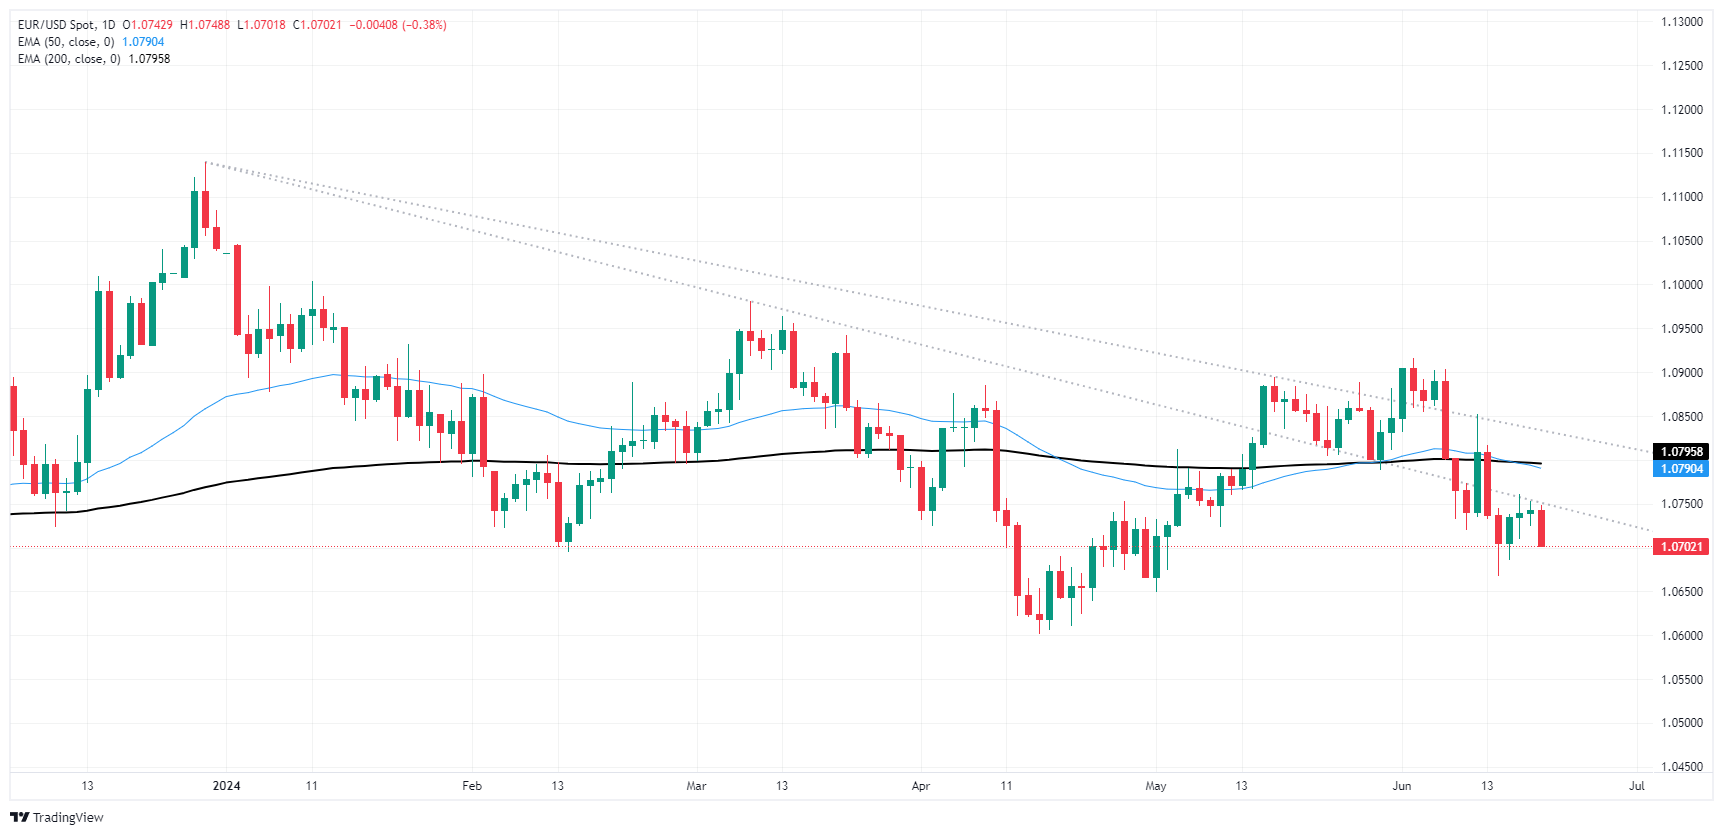
Euro FAQs
The Euro is the currency for the 20 European Union countries that belong to the Eurozone. It is the second most heavily traded currency in the world behind the US Dollar. In 2022, it accounted for 31% of all foreign exchange transactions, with an average daily turnover of over $2.2 trillion a day. EUR/USD is the most heavily traded currency pair in the world, accounting for an estimated 30% off all transactions, followed by EUR/JPY (4%), EUR/GBP (3%) and EUR/AUD (2%).
The European Central Bank (ECB) in Frankfurt, Germany, is the reserve bank for the Eurozone. The ECB sets interest rates and manages monetary policy. The ECB’s primary mandate is to maintain price stability, which means either controlling inflation or stimulating growth. Its primary tool is the raising or lowering of interest rates. Relatively high interest rates – or the expectation of higher rates – will usually benefit the Euro and vice versa. The ECB Governing Council makes monetary policy decisions at meetings held eight times a year. Decisions are made by heads of the Eurozone national banks and six permanent members, including the President of the ECB, Christine Lagarde.
Eurozone inflation data, measured by the Harmonized Index of Consumer Prices (HICP), is an important econometric for the Euro. If inflation rises more than expected, especially if above the ECB’s 2% target, it obliges the ECB to raise interest rates to bring it back under control. Relatively high interest rates compared to its counterparts will usually benefit the Euro, as it makes the region more attractive as a place for global investors to park their money.
Data releases gauge the health of the economy and can impact on the Euro. Indicators such as GDP, Manufacturing and Services PMIs, employment, and consumer sentiment surveys can all influence the direction of the single currency. A strong economy is good for the Euro. Not only does it attract more foreign investment but it may encourage the ECB to put up interest rates, which will directly strengthen the Euro. Otherwise, if economic data is weak, the Euro is likely to fall. Economic data for the four largest economies in the euro area (Germany, France, Italy and Spain) are especially significant, as they account for 75% of the Eurozone’s economy.
Another significant data release for the Euro is the Trade Balance. This indicator measures the difference between what a country earns from its exports and what it spends on imports over a given period. If a country produces highly sought after exports then its currency will gain in value purely from the extra demand created from foreign buyers seeking to purchase these goods. Therefore, a positive net Trade Balance strengthens a currency and vice versa for a negative balance.
Japan's National Consumer Price Index (CPI) rose on an annualized basis, with headline CPI inflation climbing 2.8% YoY versus the previous print of 2.5%.
Core CPI inflation, or headline CPI inflation less volatile food prices, rose less than median market estimates, climbed 2.5% versus the previous 2.2% compared to the market forecast of 2.6%.
Core-core Japanese CPI, or CPI inflation less both food and energy prices, eased back to 2.1% from the previous 2.4%.
Japan's national-level CPI inflation print tends to be previewed by Tokyo CPI inflation several weeks prior, leaving a muted market impact from nationwide aggregated inflation figures.
Economic Indicator
National CPI ex Fresh Food (YoY)
Japan’s National Consumer Price Index (CPI), released by the Statistics Bureau of Japan on a monthly basis, measures the price fluctuation of goods and services purchased by households nationwide excluding fresh food, whose prices often fluctuate depending on the weather. The YoY reading compares prices in the reference month to the same month a year earlier. Generally, a high reading is seen as bullish for the Japanese Yen (JPY), while a low reading is seen as bearish.
Read more.Last release: Thu Jun 20, 2024 23:30
Frequency: Monthly
Actual: 2.5%
Consensus: 2.6%
Previous: 2.2%
Source: Statistics Bureau of Japan
Japanese Yen FAQs
The Japanese Yen (JPY) is one of the world’s most traded currencies. Its value is broadly determined by the performance of the Japanese economy, but more specifically by the Bank of Japan’s policy, the differential between Japanese and US bond yields, or risk sentiment among traders, among other factors.
One of the Bank of Japan’s mandates is currency control, so its moves are key for the Yen. The BoJ has directly intervened in currency markets sometimes, generally to lower the value of the Yen, although it refrains from doing it often due to political concerns of its main trading partners. The current BoJ ultra-loose monetary policy, based on massive stimulus to the economy, has caused the Yen to depreciate against its main currency peers. This process has exacerbated more recently due to an increasing policy divergence between the Bank of Japan and other main central banks, which have opted to increase interest rates sharply to fight decades-high levels of inflation.
The BoJ’s stance of sticking to ultra-loose monetary policy has led to a widening policy divergence with other central banks, particularly with the US Federal Reserve. This supports a widening of the differential between the 10-year US and Japanese bonds, which favors the US Dollar against the Japanese Yen.
The Japanese Yen is often seen as a safe-haven investment. This means that in times of market stress, investors are more likely to put their money in the Japanese currency due to its supposed reliability and stability. Turbulent times are likely to strengthen the Yen’s value against other currencies seen as more risky to invest in.
Japan's top currency diplomat, Masato Kanda, who will instruct the BoJ to intervene, when he judges it necessary, said on Friday that he will take necessary action on foreign exchange (FX) if needed
Key quotes
To take necessary action on foreign exchange if needed.
Sees no problem with Japan's approach in US report on foreign exchange.
Yen slightly strengthens against US Dollar
FX intervention has been effective
Market reaction
At the time of writing, USD/JPY was trading at 158.85, losing 0.05% on the day.
Japanese Yen FAQs
The Japanese Yen (JPY) is one of the world’s most traded currencies. Its value is broadly determined by the performance of the Japanese economy, but more specifically by the Bank of Japan’s policy, the differential between Japanese and US bond yields, or risk sentiment among traders, among other factors.
One of the Bank of Japan’s mandates is currency control, so its moves are key for the Yen. The BoJ has directly intervened in currency markets sometimes, generally to lower the value of the Yen, although it refrains from doing it often due to political concerns of its main trading partners. The current BoJ ultra-loose monetary policy, based on massive stimulus to the economy, has caused the Yen to depreciate against its main currency peers. This process has exacerbated more recently due to an increasing policy divergence between the Bank of Japan and other main central banks, which have opted to increase interest rates sharply to fight decades-high levels of inflation.
The BoJ’s stance of sticking to ultra-loose monetary policy has led to a widening policy divergence with other central banks, particularly with the US Federal Reserve. This supports a widening of the differential between the 10-year US and Japanese bonds, which favors the US Dollar against the Japanese Yen.
The Japanese Yen is often seen as a safe-haven investment. This means that in times of market stress, investors are more likely to put their money in the Japanese currency due to its supposed reliability and stability. Turbulent times are likely to strengthen the Yen’s value against other currencies seen as more risky to invest in.
Australia's Judo Bank Purchasing Manager Index (PMI) figures declined in June, with both the Manufacturing and Services components chalking in a fall back from previous periods.
June's Australian Manufacturing PMI declined to 47.5 from 49.7, returning to familiar lows. The Services PMI also backslid but remained in positive territory, falling to a five-month low of 51.0 from 51.2.
As noted by Judo Bank Chief Economist Warren Hogan, "The composite output index pulled back in June but remains in expansionary territory. The June flash reading was the lowest since January and has now eased back from the March high point. The June reading suggests that business activity is still growing, but slower than in March and April."
Economic Indicator
Judo Bank Composite PMI
The Composite Purchasing Managers Index (PMI), released on a monthly basis by Judo Bank and S&P Global, is a leading indicator gauging private-business activity in Australia for both the manufacturing and services sectors. The data is derived from surveys to senior executives. Each response is weighted according to the size of the company and its contribution to total manufacturing or services output accounted for by the sub-sector to which that company belongs. Survey responses reflect the change, if any, in the current month compared to the previous month and can anticipate changing trends in official data series such as Gross Domestic Product (GDP), industrial production, employment and inflation. The index varies between 0 and 100, with levels of 50.0 signaling no change over the previous month. A reading above 50 indicates that the Australian private economy is generally expanding, a bullish sign for the Australian Dollar (AUD). Meanwhile, a reading below 50 signals that activity is generally declining, which is seen as bearish for AUD.
Read more.Last release: Thu Jun 20, 2024 23:00 (Prel)
Frequency: Monthly
Actual: 50.6
Consensus: -
Previous: 52.1
Source: S&P Global
Australian Dollar FAQs
One of the most significant factors for the Australian Dollar (AUD) is the level of interest rates set by the Reserve Bank of Australia (RBA). Because Australia is a resource-rich country another key driver is the price of its biggest export, Iron Ore. The health of the Chinese economy, its largest trading partner, is a factor, as well as inflation in Australia, its growth rate and Trade Balance. Market sentiment – whether investors are taking on more risky assets (risk-on) or seeking safe-havens (risk-off) – is also a factor, with risk-on positive for AUD.
The Reserve Bank of Australia (RBA) influences the Australian Dollar (AUD) by setting the level of interest rates that Australian banks can lend to each other. This influences the level of interest rates in the economy as a whole. The main goal of the RBA is to maintain a stable inflation rate of 2-3% by adjusting interest rates up or down. Relatively high interest rates compared to other major central banks support the AUD, and the opposite for relatively low. The RBA can also use quantitative easing and tightening to influence credit conditions, with the former AUD-negative and the latter AUD-positive.
China is Australia’s largest trading partner so the health of the Chinese economy is a major influence on the value of the Australian Dollar (AUD). When the Chinese economy is doing well it purchases more raw materials, goods and services from Australia, lifting demand for the AUD, and pushing up its value. The opposite is the case when the Chinese economy is not growing as fast as expected. Positive or negative surprises in Chinese growth data, therefore, often have a direct impact on the Australian Dollar and its pairs.
Iron Ore is Australia’s largest export, accounting for $118 billion a year according to data from 2021, with China as its primary destination. The price of Iron Ore, therefore, can be a driver of the Australian Dollar. Generally, if the price of Iron Ore rises, AUD also goes up, as aggregate demand for the currency increases. The opposite is the case if the price of Iron Ore falls. Higher Iron Ore prices also tend to result in a greater likelihood of a positive Trade Balance for Australia, which is also positive of the AUD.
The Trade Balance, which is the difference between what a country earns from its exports versus what it pays for its imports, is another factor that can influence the value of the Australian Dollar. If Australia produces highly sought after exports, then its currency will gain in value purely from the surplus demand created from foreign buyers seeking to purchase its exports versus what it spends to purchase imports. Therefore, a positive net Trade Balance strengthens the AUD, with the opposite effect if the Trade Balance is negative.
- USD/CAD trades in negative territory for the sixth consecutive day near 1.3690 in Friday’s early Asian session.
- Fed’s Birkin said central bank is well-positioned with necessary firepower for job but needs to maintain data-dependent approach.
- Higher crude oil prices due to renewed hopes of a summertime upswing in fuel demand support the Loonie.
The USD/CAD pair remains under some selling pressure around 1.3690 during the early Asian session on Friday. The pair edges lower despite the rise of the USD Index (DXY) to four-day highs near 105.70. The rally of crude oil prices continues to underpin the commodity-linked Loonie. On Friday, the advanced S&P Global Manufacturing and Services PMI will be in the stoplight.
The US Federal Reserve's (Fed) policymakers pushed out the timing of the first interest rate cut this year. Fed Bank of Richmond President Tom Barkin said on Thursday that the central bank is well-positioned with the necessary firepower for the job, but will learn a lot more over the next several months. Meanwhile, Fed Bank of Minneapolis President Neel Kashkari noted that it will probably take a year or two to get inflation back to 2%, per Reuters.
The financial markets have priced in around 10% odds of a rate cut in July, rising to nearly 70% in September and fully priced in for November, according to the CME FedWatch Tool. Even though the recent US Retail Sales last week prompted the expectation of two rate cuts from the Fed this year, a strict data-dependent approach from Fed officials might cap the downside for the Greenback against its rivals.
On the Loonie front, crude oil markets extend the rally on renewed hopes of a summertime upswing in fuel demand. It's worth noting that higher oil prices could underpin the Canadian Dollar (CAD) as Canada is the major crude oil exporter to the United States.
Furthermore, the Bank of Canada (BoC) cut its policy rate to 4.75% from 5% on June 5, the first cut in four years. The BoC Summary of Deliberations on Wednesday noted the risks of cutting too soon against the dangers of waiting too long. The BoC Governor Tiff Macklem said that it’s “reasonable” to expect further rate cuts, but that the decline in interest rates will likely be gradual.
- GBP/USD eases back to 1.2650 as Sterling stumbles.
- UK Retail Sales, PMIs to close off the trading week with a bang.
- US PMI figures to add onto week’s data prints, expecting to soften.
GBP/USD is poised for a bumper Friday session. Key UK data is due during the European market session, and US Purchasing Managers Index (PMI) activity surveys set to wrap up the trading week. The Bank of England (BoE) held rates at 5.25% this week, with a stubbornly tepid stance on rate cuts that deflated broad-market rate cut expectations.
Forex Today: All the looks will be on PMI reports
The BoE was widely expected to keep interest rates unchanged in June. However, there was a focus on recent services inflation and a vague aim to keep inflation "sustainably" lower, which has left the value of the Sterling uncertain. Additionally, the BoE expressed a willingness to maintain restrictive policies for as long as necessary and emphasized that although the UK labor market is looser than before, it still remains historically tight.
Read more: BoE maintains policy rate at 5.25% as forecast
A miss in US economic figures softened investor risk appetite on Thursday, headlined by a worse-than-expected print in US Initial Jobless Claims coming in higher than expected for the week ended June 14. Week-on-week unemployment claimants are still lower, printing at 238K versus the previous 243K (revised from 242K), but still came in above the four-week trending average of 242.75K, which itself also rose from the previous 227.25K.
After the BoE voted seven-to-two to keep interest rates on hold at 5.25%, GBP traders will now focus on Friday's upcoming economic data. The scheduled releases include UK Retail Sales and updated S&P Global PMI figures for both the UK and the US. UK retail sales are expected to rebound to 1.5% MoM in May, compared to the previous decline of -2.3%. Additionally, UK PMIs are forecasted to show slight improvements. The Manufacturing PMI is expected to increase to 51.3 from 51.2, and the Services component is anticipated to rise to 53.0 from 52.9.
US Manufacturing and Services PMIs are both forecast to tick lower, with Manufacturing expected to slip to 51.0 from 51.3 and Services sliding to 53.7 from 54.8.
GBP/USD technical outlook
The value of the Pound Sterling dropped below the 1.2700 mark against the US Dollar on Thursday, showing a decline and moving lower towards recent lows at 1.2657. Technical indicators suggest a potential continuation of this bearish trend as the price failed to stay above the 200-hour Exponential Moving Average (EMA) at 1.2721. Further decreases in value are likely if there is no significant upward movement to reverse this trend.
The daily candlestick chart confirms a bearish rejection from a supply zone above the 1.2800 mark, indicating a potential return to the 200-day EMA, which is currently around 1.2580. The technical support provided by the 50-day EMA at 1.2674 is getting weaker, and if bearish pressure continues, GBP/USD could drop back to the 2024 lows around the 1.2300 level.
GBP/USD hourly chart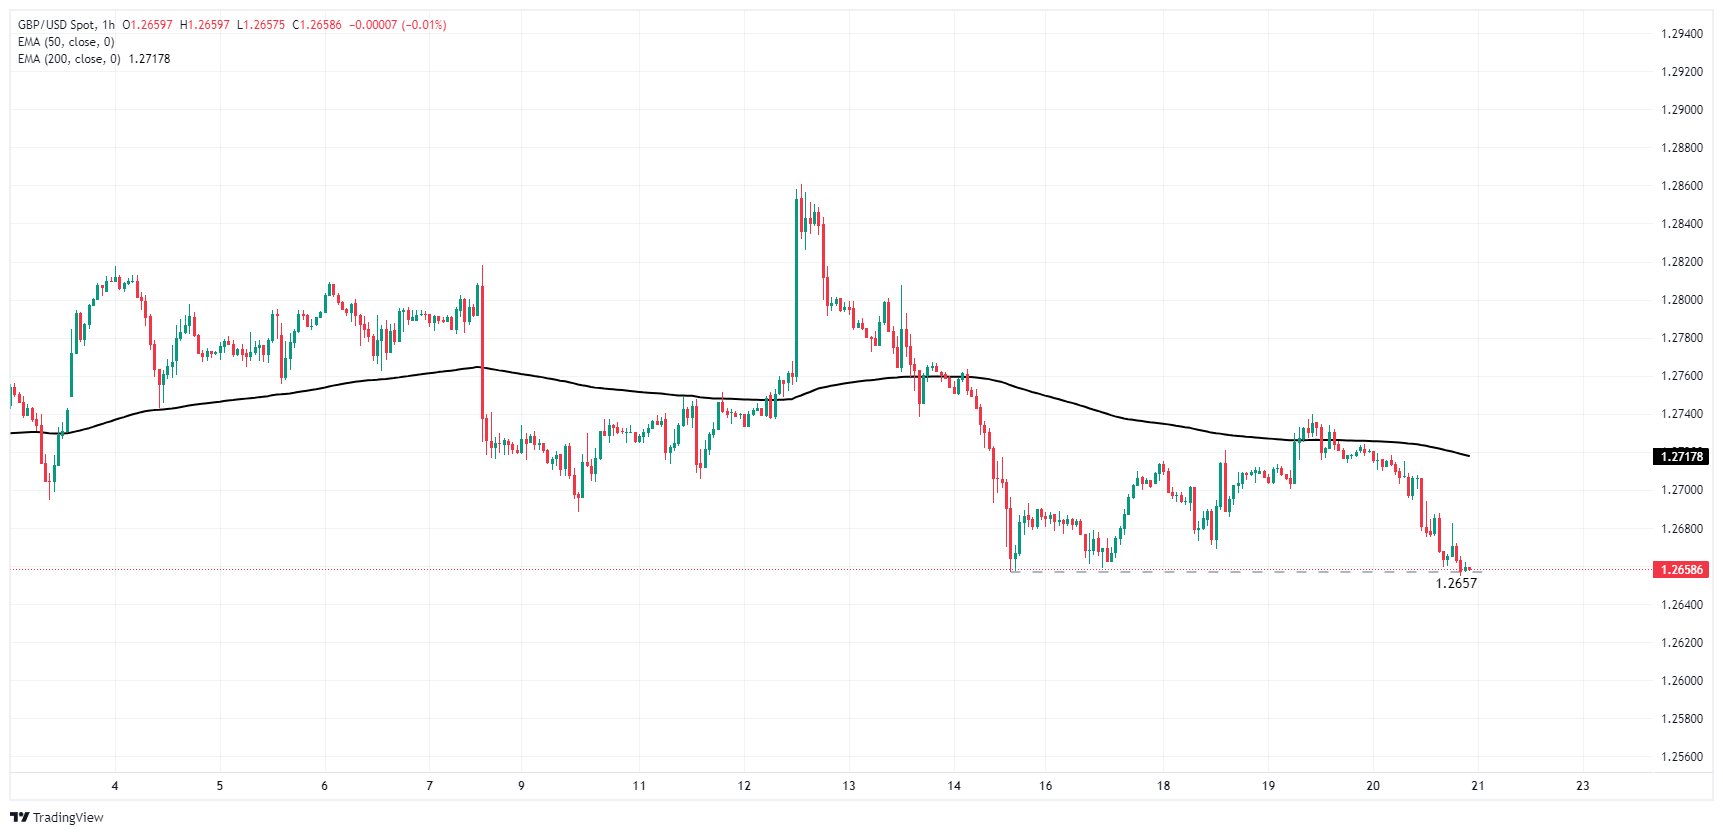
GBP/USD daily chart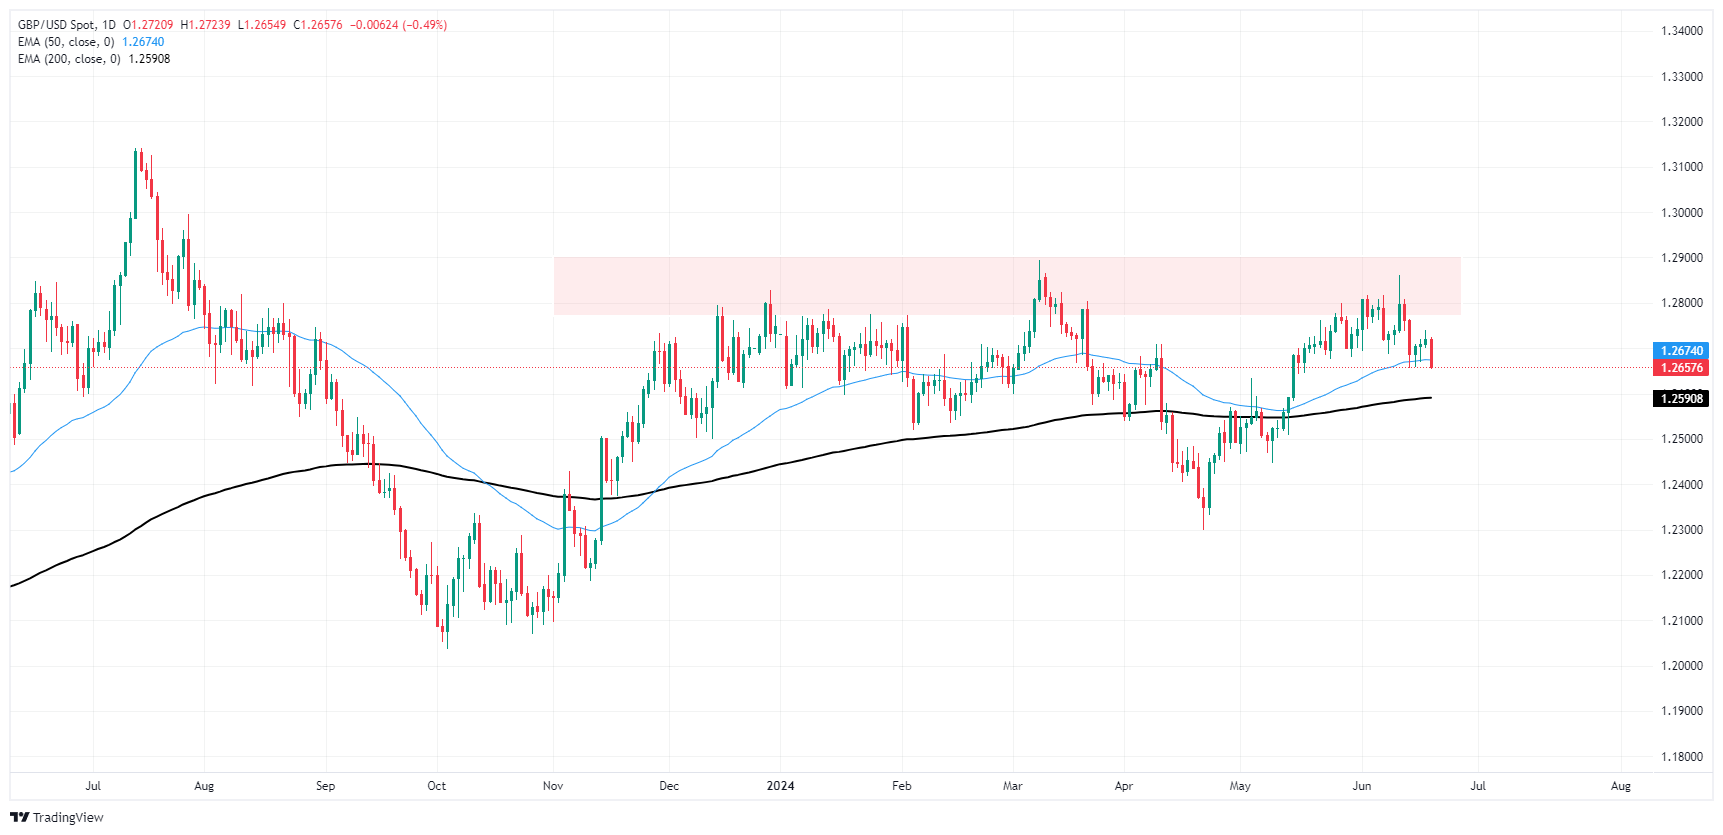
Pound Sterling FAQs
The Pound Sterling (GBP) is the oldest currency in the world (886 AD) and the official currency of the United Kingdom. It is the fourth most traded unit for foreign exchange (FX) in the world, accounting for 12% of all transactions, averaging $630 billion a day, according to 2022 data. Its key trading pairs are GBP/USD, aka ‘Cable’, which accounts for 11% of FX, GBP/JPY, or the ‘Dragon’ as it is known by traders (3%), and EUR/GBP (2%). The Pound Sterling is issued by the Bank of England (BoE).
The single most important factor influencing the value of the Pound Sterling is monetary policy decided by the Bank of England. The BoE bases its decisions on whether it has achieved its primary goal of “price stability” – a steady inflation rate of around 2%. Its primary tool for achieving this is the adjustment of interest rates. When inflation is too high, the BoE will try to rein it in by raising interest rates, making it more expensive for people and businesses to access credit. This is generally positive for GBP, as higher interest rates make the UK a more attractive place for global investors to park their money. When inflation falls too low it is a sign economic growth is slowing. In this scenario, the BoE will consider lowering interest rates to cheapen credit so businesses will borrow more to invest in growth-generating projects.
Data releases gauge the health of the economy and can impact the value of the Pound Sterling. Indicators such as GDP, Manufacturing and Services PMIs, and employment can all influence the direction of the GBP. A strong economy is good for Sterling. Not only does it attract more foreign investment but it may encourage the BoE to put up interest rates, which will directly strengthen GBP. Otherwise, if economic data is weak, the Pound Sterling is likely to fall.
Another significant data release for the Pound Sterling is the Trade Balance. This indicator measures the difference between what a country earns from its exports and what it spends on imports over a given period. If a country produces highly sought-after exports, its currency will benefit purely from the extra demand created from foreign buyers seeking to purchase these goods. Therefore, a positive net Trade Balance strengthens a currency and vice versa for a negative balance.
- The cross resumed its gains, establishing new cycle highs at levels exceeding 97.00.
- The daily chart continues to display resilience, increasing chances for the upward trend to persist.
On Thursday, the NZD/JPY cross made further gains, moving past the previous resistance at 97.00 and setting a fresh cycle high. At the start of the week, support around the 20-day Simple Moving Average (SMA) at 96.30 held strong as buyers swiftly stepped in to overpower the sellers' efforts to breach this level.
The daily Relative Strength Index (RSI) for NZD/JPY currently stands at 62, denoting a climb from Wednesday's reading and overall positive momentum. Meanwhile, the Moving Average Convergence Divergence (MACD) for today prints decreasing red bars, signifying a reduction in selling pressure.
NZD/JPY daily chart
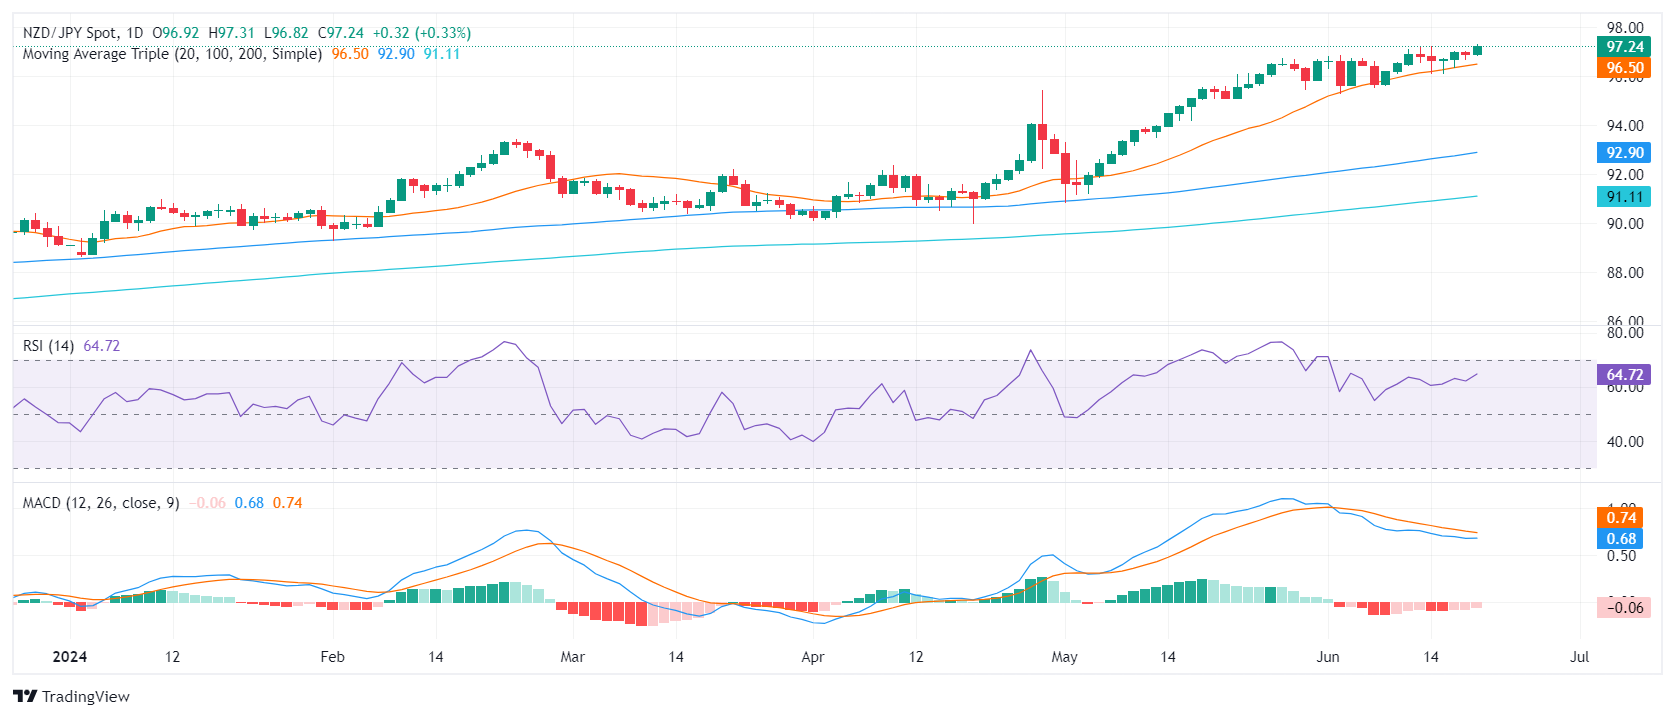
The bull's resolve to keep its position above the 20-day SMA remains steadfast. This, coupled with the resilience of the daily technical indicators, highlights a clear technical strength of the Kiwi over the Yen. The three consecutive failed attempts from the sellers to breach the 96.30 mark fuelled the buyers' momentum, which paved the way for the climb to fresh highs.
Going forward, the trading sessions may witness the cross oscillate between the immediate support at 97.00 and the resistance target of 98.00. Close monitoring of the breach above the current consolidation range or a dip below the 20-SMA mark could potentially provide insights into future movements.
Federal Reserve (Fed) Bank of Richmond President Tom Barkin spoke to reports late Thursday, noting that the Fed has sufficient firepower to address policy issues looking forward, but will have to maintain a strict data-dependent approach as policymakers look to time rate cuts appropriately.
Key highlights
The impact of Fed rate increases will hit in time.
Need clearer inflation signals before rate cut.
Data to determine further moves after initial rate cut.
Fed Reserve is well-positioned with necessary firepower for job.
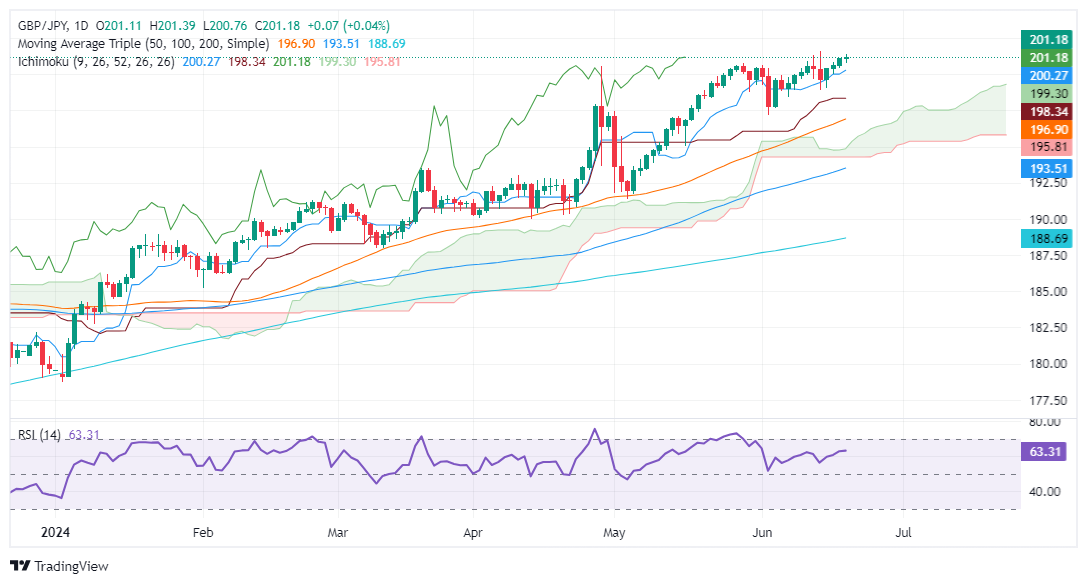
- GBP/JPY remains upward biased with support from a bullish yet trendless RSI, hinting at stable rates.
- Key resistance at YTD high of 201.61 and the 202.00 mark.
- Key support levels include 201.00, Tenkan-Sen at 200.26, Senkou Span A at 199.71, and Kijun-Sen at 199.15.
The GBP/JPY remained subdued on Thursday yet finished up 0.06%, virtually unchanged. As Friday’s Asian Pacific session begins, the cross trades at 201.11, flat.
GBP/JPY Price Analysis: Technical outlook
According to the daily chart, the GBP/JPY remains upward biased and is backed by momentum as the Relative Strength Index (RSI) is bullish, though trendless. This hints that the cross might remain at around current exchange rates amid the lack of catalysts and fears of Japanese authority's intervention.
On the upside, the GBP/JPY first resistance would be the year-to-date (YTD) high at 201.61, ahead of the 202.00 mark.
On further weakness, the cross could tumble below 201.00 and test the Tenkan-Sen at 200.26, the first support level, followed by the Senkou Span A at 199.71. Once surpassed, the next stop would be the Kijun-Sen at 199.15.
GBP/JPY Price Action – Daily Chart
- Despite NZD/USD's attempts to recover losses, another rejection at the 20-day SMA sees a retreat to 0.6122.
- The short-term outlook is increasingly bearish, with rising selling traction visible.
- For a break in the bearish outlook, the pair must recover the 20-day SMA at 0.6150.
On Thursday, the NZD/USD extended its losses below the 20-day Simple Moving Average (SMA), its fourth consecutive rejection at this strong support level this week. The pair retreated to 0.6122. Despite attempts to recover losses, indicators are signalling rising bearish traction potentially paving the way for further downside unless the pair can regain control over the 20-day SMA around the 0.6150 mark.
The Relative Strength Index (RSI) of the NZDUSD daily chart positions at 49, slightly below the neutral territory. Compared to Tuesday's reading of 51, the RSI indicators are pointing south, suggesting a potential decrease in the market momentum. Despite near-term downward dynamics, it remains distanced from the oversold conditions. The Moving Average Convergence Divergence (MACD) profile continues to print rising red bars indicating an elevated presence of sellers in the market.
NZD/USD daily chart
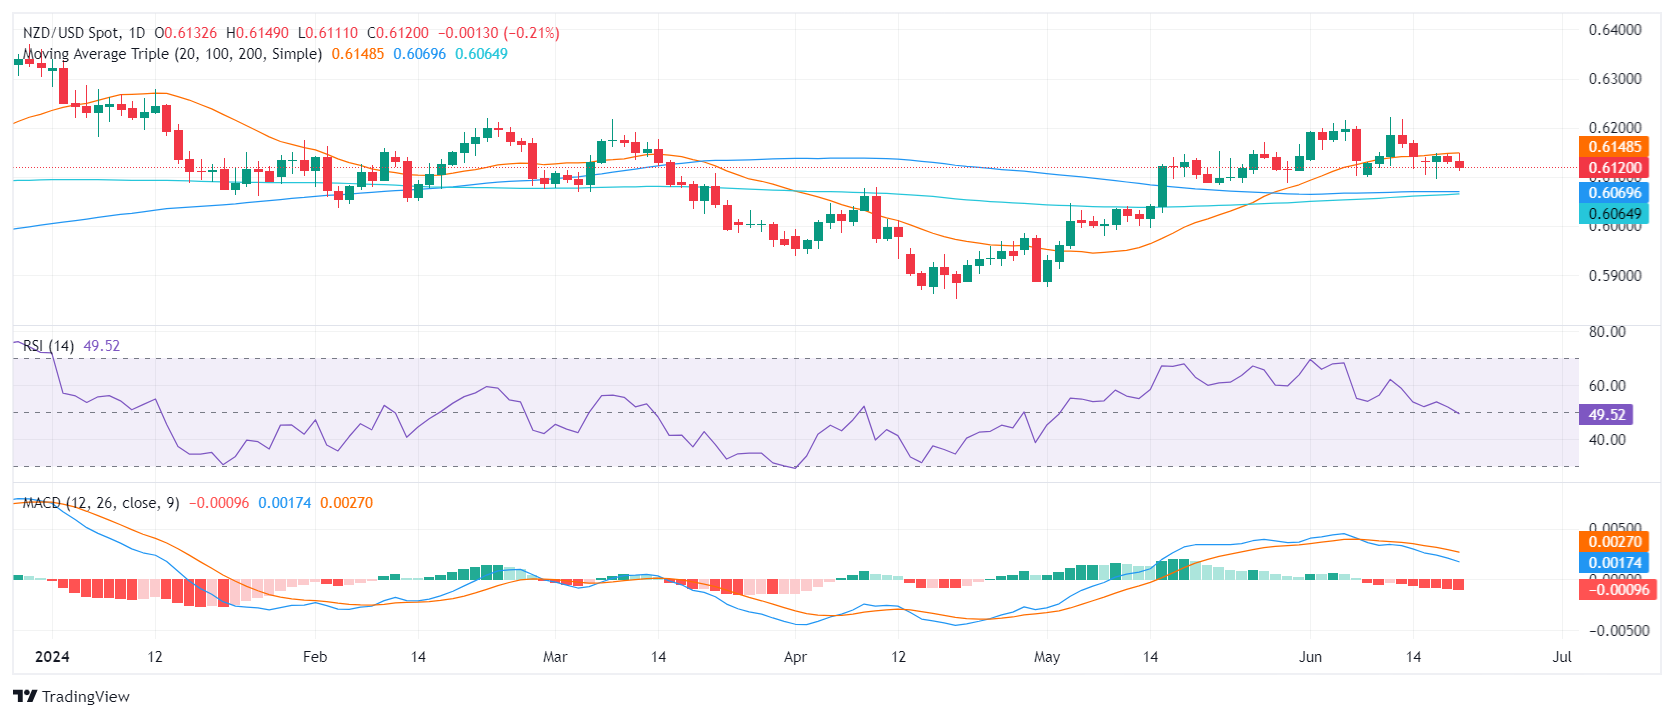
For the NZD/USD, immediate support remains near the 0.6100 level. Further support is available at the convergence of the 100-day and 200-day SMAs at 0.60695 and 0.60627 respectively. These levels could provide a solid foundation in the event of an extension of the downside move. A break below these SMA convergence points might be indicative of a strong sell-off scenario.
In stark contrast, resistance for the pair is entrenched around the 20-day SMA at 0.6150 level. Then higher up at 0.6170 and finally at the 0.6200 level. A decisive breakout above these levels could potentially signify the end of the current bearish market sentiment and a shift toward bullish dynamics.
- WTI edged into fresh highs near $81.40 as energy markets hope for drawdown.
- EIA barrel counts reported a larger-than-expected decline in US Crude Oil stocks.
- Barrel traders edge bids higher on extended hopes of a summertime supply crunch.
West Texas Intermediate (WTI) US Crude Oil inched into fresh highs on Thursday, clipping $81.40 and continuing its march towards the $82.00 handle. Crude Oil markets lurch forward on renewed hopes of a summertime upswing in fuel demand helping to chew away at a looming oversupply issue in global oil supplies.
The Energy Information Administration (EIA) reported an unexpected decline in US Crude Oil Stocks Change for the week ended June 14. EIA barrels counts printed a -2.547 million barrel decline, sharply down from the previous week’s 3.73 million barrel buildup and even lower than the forecast -2.0 million decline. Despite the drag on EIA barrel stocks, traders with a calculator handy will note that the week’s backslide brings EIA Crude Oil counts for the year to a 26 million barrel surplus.
Crude Oil markets are bidding up barrel prices as energy markets pin their hopes on a summertime uptick in fuel demand for cooling and travel purposes. This comes after an uptick in Chinese fossil fuel demand failed to materialize and a non-starter kickoff to the US Memorial Day “driving season.”
The Organization of the Petroleum Exporting Countries (OPEC) is set to phase out voluntary production cuts for its extended network of non-member ally states, OPEC+, later this year. OPEC+ nations that shouldered a significant burden in trying to bolster global Crude Oil prices by intentionally restricting the amount of unrefined Crude Oil they pull out of the ground has begun to weigh on government budgets that routinely rely on barrel-selling activity to balance accounts.
WTI technical outlook
WTI extended bullish momentum on Thursday, edging towards $81.50 as intraday bids accelerate above rising trendlines from the last major swing low into $72.50. US Crude Oil has climbed further above the 200-day Exponential Moving Average (EMA) at $78.85.
WTI has closed bullish for all but four of the last 12 consecutive trading days, climbing 12.34% from the last major low.
WTI hourly chart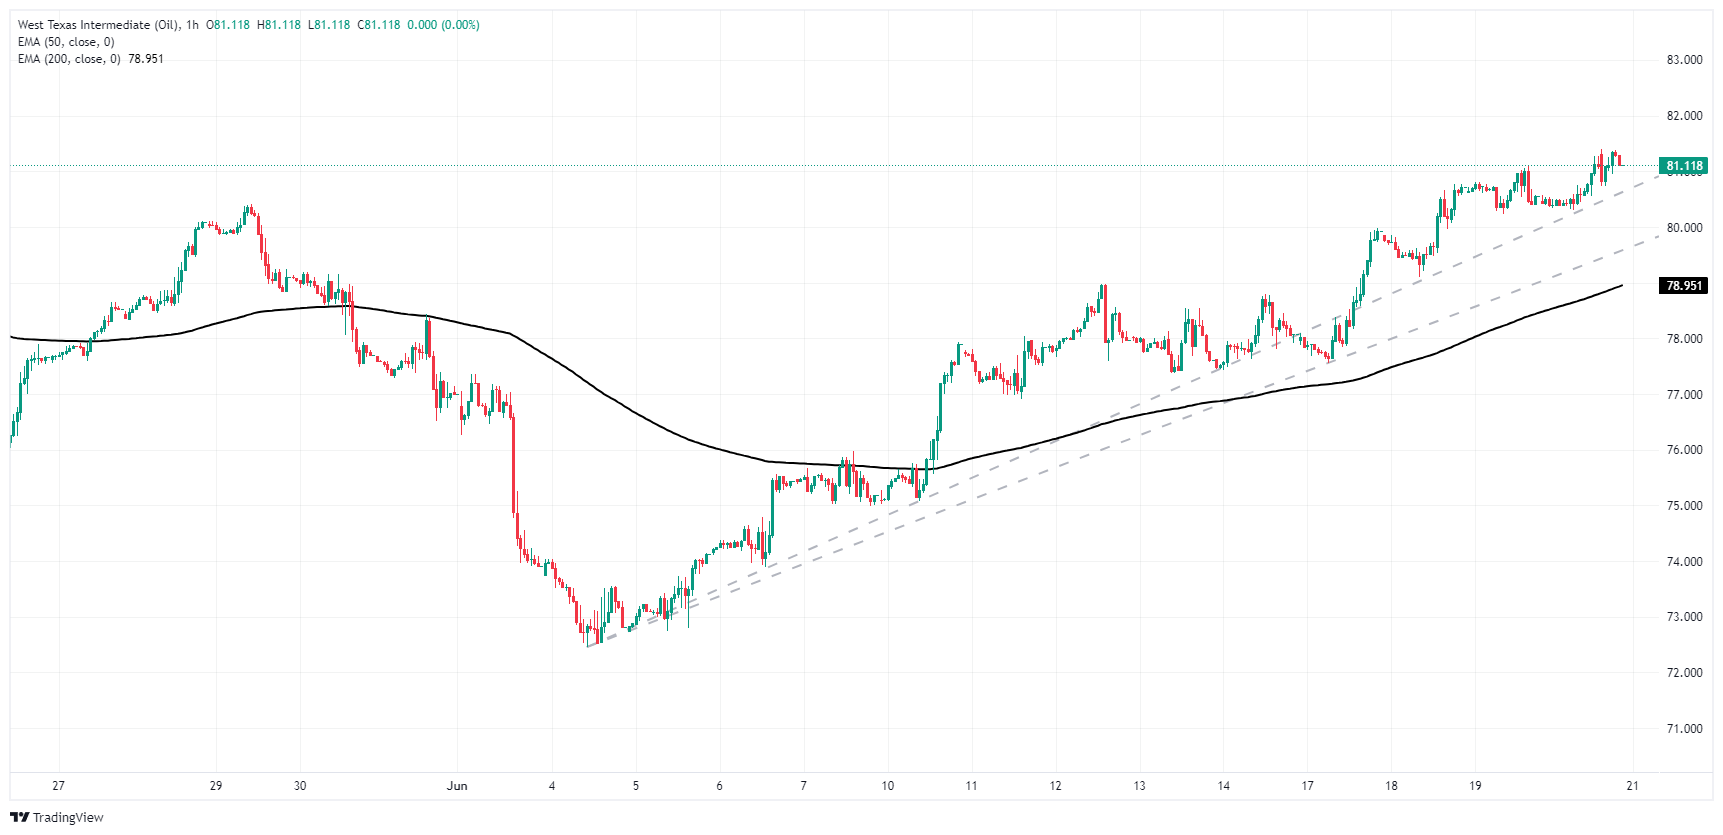
WTI daily chart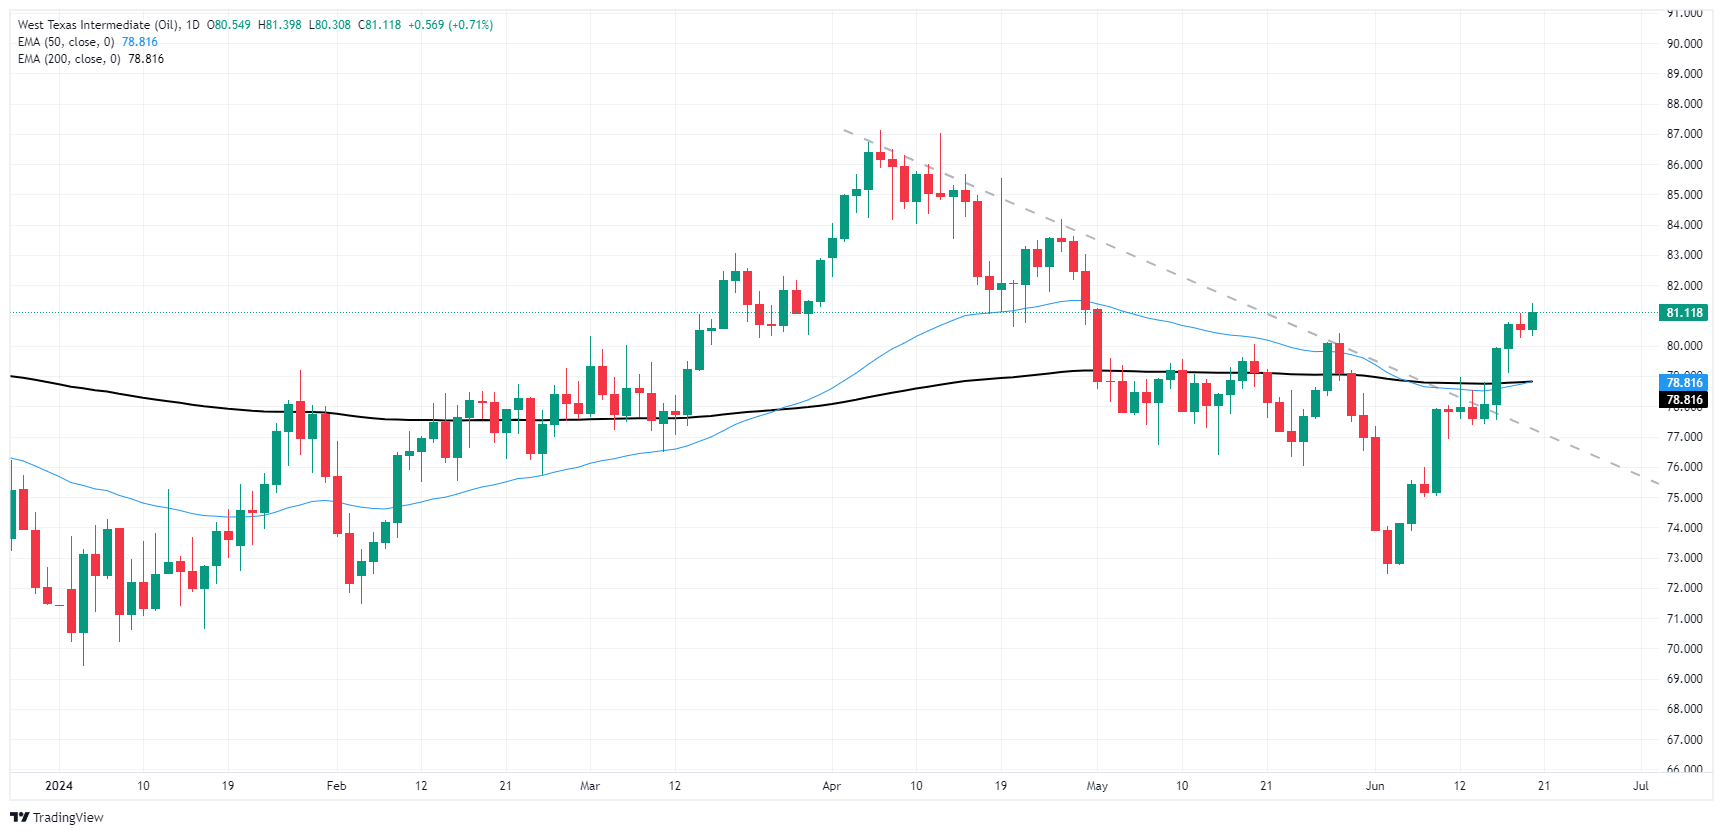
- Silver climbs over 3%, despite higher US Treasury yields and a stronger US Dollar.
- Technical outlook shows bullish bias with momentum favoring buyers; RSI aims higher above the 50-neutral line.
- Key resistance levels: $31.54 (June 7 high) and $32.00, with YTD high at $32.51 in sight.
- Support levels at $29.09 (50-DMA) and $28.66 (MTD low).
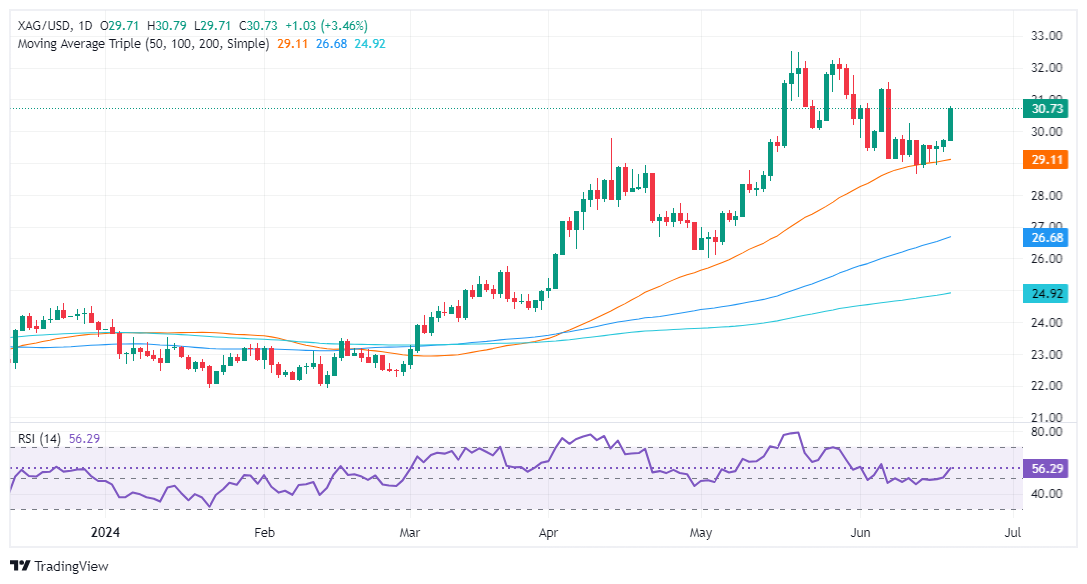
Silver price rallied sharply for the second straight day and climbed past $30.00 on Thursday amid elevated US Treasury bond yields and a stronger US Dollar. The grey metal trades at $30.68 up by more than 3%.
XAG/USD Price Analysis: Technical outlook
Silver remains bullish biased and after consolidating during the last six days within the $28.60-$29.80, it has finally cleared the top of the range and surged past the $30.00 figure.
Momentum shifted in favor of the buyers after the Relative Strength Index (RSI) stood at around the 50-neutral line.
As XAG/USD resumed its uptrend, the next resistance level would be June 7 high at $31.54. Once cleared, the next stop would be $32.00 before challenging the year-to-date (YTD) high of $32.51.
On the other hand, if XAG/USD sellers drag spot prices below the 50-day moving average (DMA) at $29.09, it will expose $29.00. Once cleared, that could expose the MTD low of $28.66, ahead of plunging toward the 100-DMA at $26.60.
XAG/USD Price Action – Daily Chart
- AUD/JPY continues its rally, reaching fresh cycle highs around 105.70 on Thursday.
- Daily RSI and MACD stand deep in positive terrain.
- Indicators point towards more room for additional gains.
During Thursday's session, the AUD/JPY pair maintained its uptrend, achieving new cycle highs around 105.70, its the highest point reached since 2013. There has been a clear consolidation around the 104.00 level in the last sessions, and as the sellers failed to make a significant move, buyers stepped in.
On a daily scale, the Relative Strength Index (RSI) of the AUDJPY has risen to 68, up from 63 recorded on Wednesday. This increase suggests bullish momentum continues to gain strength. The Moving Average Convergence Divergence (MACD) marker persists in showing rising green bars, indicating the bullish momentum is far from plateauing.
AUD/JPY daily chart
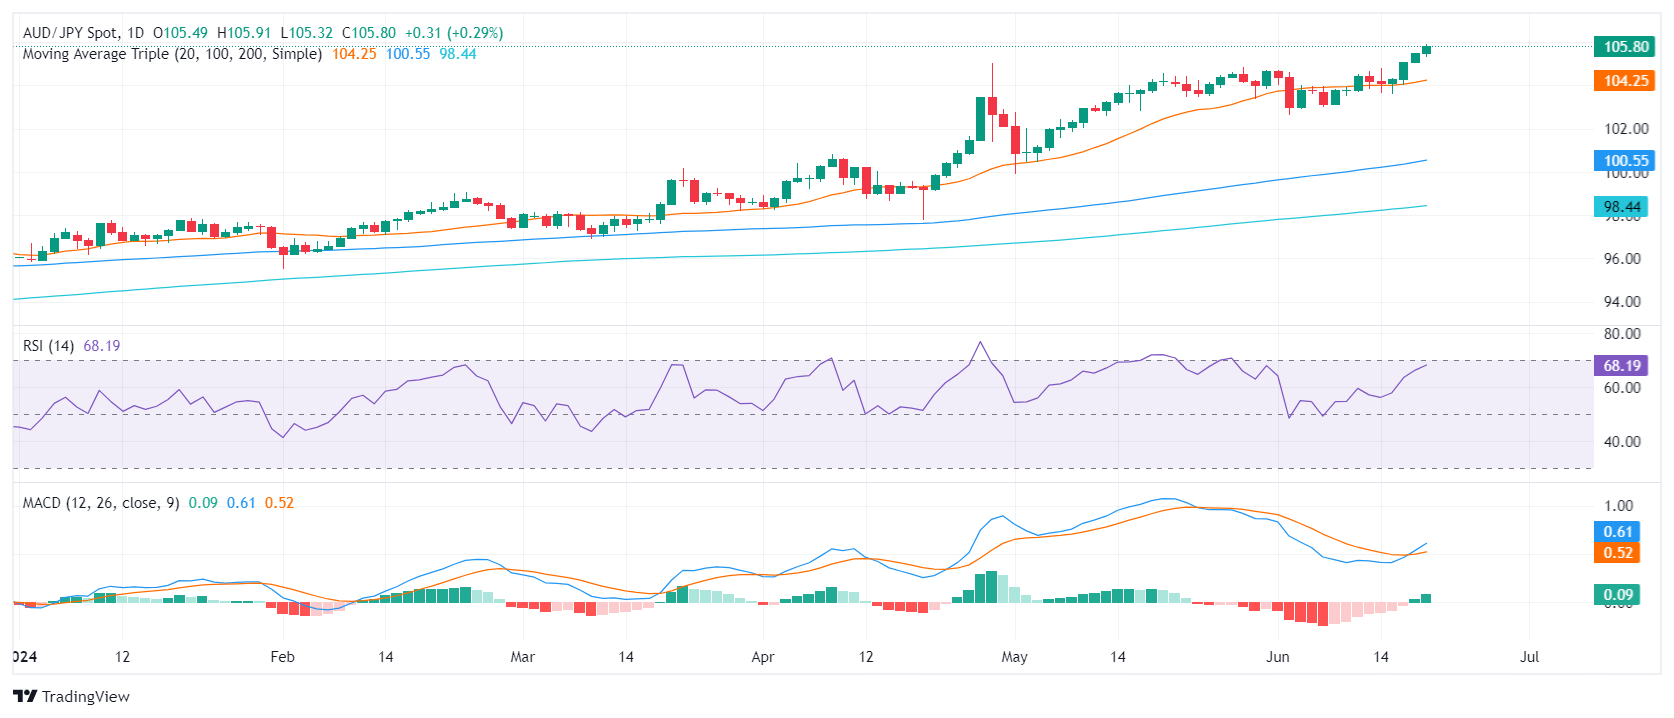 In summary, the AUD/JPY pair's robust showing on Thursday endorses a broader bullish outlook, with the intensity of the trend validated by the pair's position above the 20-day, 100-day, and 200-day Simple Moving Averages (SMAs). Looking forward, traders can expect the pair to sustain its uptrend, potentially reaching into the 105.80-106.00 range, as current indicators do not suggest over-extended movements and hence provide space for subsequent gains.
On the off chance that the pair falls below the support level set at 105.00, followed by the 104.15 level (20-day SMA), it would likely seek new support thresholds. As such, the 102.50 and 100.35 levels may serve as potential support lines.
- Swiss Franc weakens as SNB cuts rates from 1.50% to 1.25%, with potential for another cut in September.
- USD/CHF jumps from 0.8833 to 0.8911, breaching a key resistance level post-rate cut.
- Softer US jobless claims and deteriorating housing data increase speculation of Fed rate cuts in 2024.
The Swiss Franc extended its losses on Thursday after the Swiss National Bank (SNB) decided to cut rates for the second time in the year, lowering rates from 1.50% to 1.25% during the European session. The USD/CHF trades at 0.8911, up 0.83%.
USD/CHF jumped above 0.8900 after the Swiss National Bank reduced rates to 1.25%, hinting further easing
According to Reuters, the SNB looks likely to follow Thursday’s second consecutive rate cut in September. SNB Chairman Thomas Jordan said the CHF strengthened significantly in recent weeks, adding that the central bank is ready to intervene in the FX market.
If the SNB wants to prevent the Swissie from appreciating, it could slash rates in September instead of intervening and selling Francs in the markets.
The USD/CHF rose from around 0.8833 to 0.8911 in the first two hours after the SNB cut and breached a key resistance level.
Aside from this, the latest US Initial Jobless Claims report showed that more people than expected filed for unemployment benefits, highlighting that the labor market is cooling. With US housing deteriorating further, traders' hopes remained higher, and the Federal Reserve could cut rates at least twice.
Swiss Franc PRICE Today
The table below shows the percentage change of Swiss Franc (CHF) against listed major currencies today. Swiss Franc was the strongest against the Japanese Yen.
| USD | EUR | GBP | JPY | CAD | AUD | NZD | CHF | |
|---|---|---|---|---|---|---|---|---|
| USD | 0.35% | 0.45% | 0.49% | -0.15% | 0.23% | 0.16% | 0.80% | |
| EUR | -0.35% | 0.09% | 0.17% | -0.50% | -0.12% | -0.20% | 0.42% | |
| GBP | -0.45% | -0.09% | 0.06% | -0.58% | -0.20% | -0.29% | 0.33% | |
| JPY | -0.49% | -0.17% | -0.06% | -0.69% | -0.27% | -0.36% | 0.27% | |
| CAD | 0.15% | 0.50% | 0.58% | 0.69% | 0.37% | 0.31% | 0.92% | |
| AUD | -0.23% | 0.12% | 0.20% | 0.27% | -0.37% | -0.08% | 0.55% | |
| NZD | -0.16% | 0.20% | 0.29% | 0.36% | -0.31% | 0.08% | 0.62% | |
| CHF | -0.80% | -0.42% | -0.33% | -0.27% | -0.92% | -0.55% | -0.62% |
The heat map shows percentage changes of major currencies against each other. The base currency is picked from the left column, while the quote currency is picked from the top row. For example, if you pick the Swiss Franc from the left column and move along the horizontal line to the US Dollar, the percentage change displayed in the box will represent CHF (base)/USD (quote).
- Dow Jones reclaims 39,000.00 handle as markets rebound post-Juneteenth holiday.
- Softening US data helps to bolster rate cut expectations.
- US PMIs still loom ahead on Friday.
The Dow Jones Industrial Average (DJIA) is surging upwards on Thursday as investors return to markets with a vengeance following the midweek Juneteenth holiday that shuttered US exchanges on Wednesday. US economic data cooled with May’s Building Permits and the Philadelphia Fed Manufacturing Survey for June both declining, while Initial Jobless Claims recovered less ground than expected to notch another print above the four-week average.
With US economic figures broadly missing the mark, investor hopes of the Federal Reserve (Fed) getting bullied into a rate cut sooner rather than later are pinned to the ceiling. According to the CME’s FedWatch Tool, rate markets are pricing in upwards of a 70% chance that the Fed will deliver at least a quarter-point cut on September 18.
Read more: US Initial Jobless Claims rose more than estimated last week
Despite recent economic data softening, the Fed continues to pursue a restrictive policy stance. Fed policymakers are determined to await several months of chilled inflation figures before considering policy rate shifts. Despite jiggles in week-on-week unemployment claims, the US jobs market remains incredibly tight, giving Fed officials a firm branch to lean on and avoid rushing into any abrupt policy adjustments.
US Purchasing Managers Index (PMI) figures will round out the trading week. Rate-cut-hungry investors are looking for a continued cooling effect in US economic data. The Manufacturing and Services PMIs are both forecast to etch in small losses, with June's Manufacturing PMI expected to tick down to 51.0 from 51.3 and the Services PMI component to shift down to 53.7 from 54.8.
Dow Jones news
The Dow Jones is firmly higher on Thursday, with all but five of the index’s constituent securities lower on the day. Apple Inc. (AAPL) is leading declines, shedding 2.0% and falling below $210.00 per share as investors rethink a recent splurge driven by Apple’s announcement of further integration of AI tech into pre-existing Apple software offerings. Apple also announced the closure of its Pay Later program, which allowed Apple customers to make purchases on an in-house financed installment plan.
On the high side, Salesforce Inc. (CRM) climbed 4.5% on Thursday after the digital customer data management firm announced its own fresh batch of AI-tech integrations to investors. CRM climbed over $242.00 per share as investors continue to scoop up AI tech announcements with little concern over how these companies will convert AI integrations into more sales.
Dow Jones tech outlook
The Dow Jones index climbed to fresh highs for the week on Thursday, testing its highest bids in almost four weeks to reclaim the 39,000.00 handle. The DJIA is testing chart territory north of 39,200.00 and has made significant one-day progress to grinding its way back to all-time highs set above 40,000.00 in May.
Daily candlesticks have lept back over the 50-day Exponential Moving Average (EMA) at 38,825.00, extending a recovery from a recent plunge to the 38,000.00 region.
Dow Jones five minute chart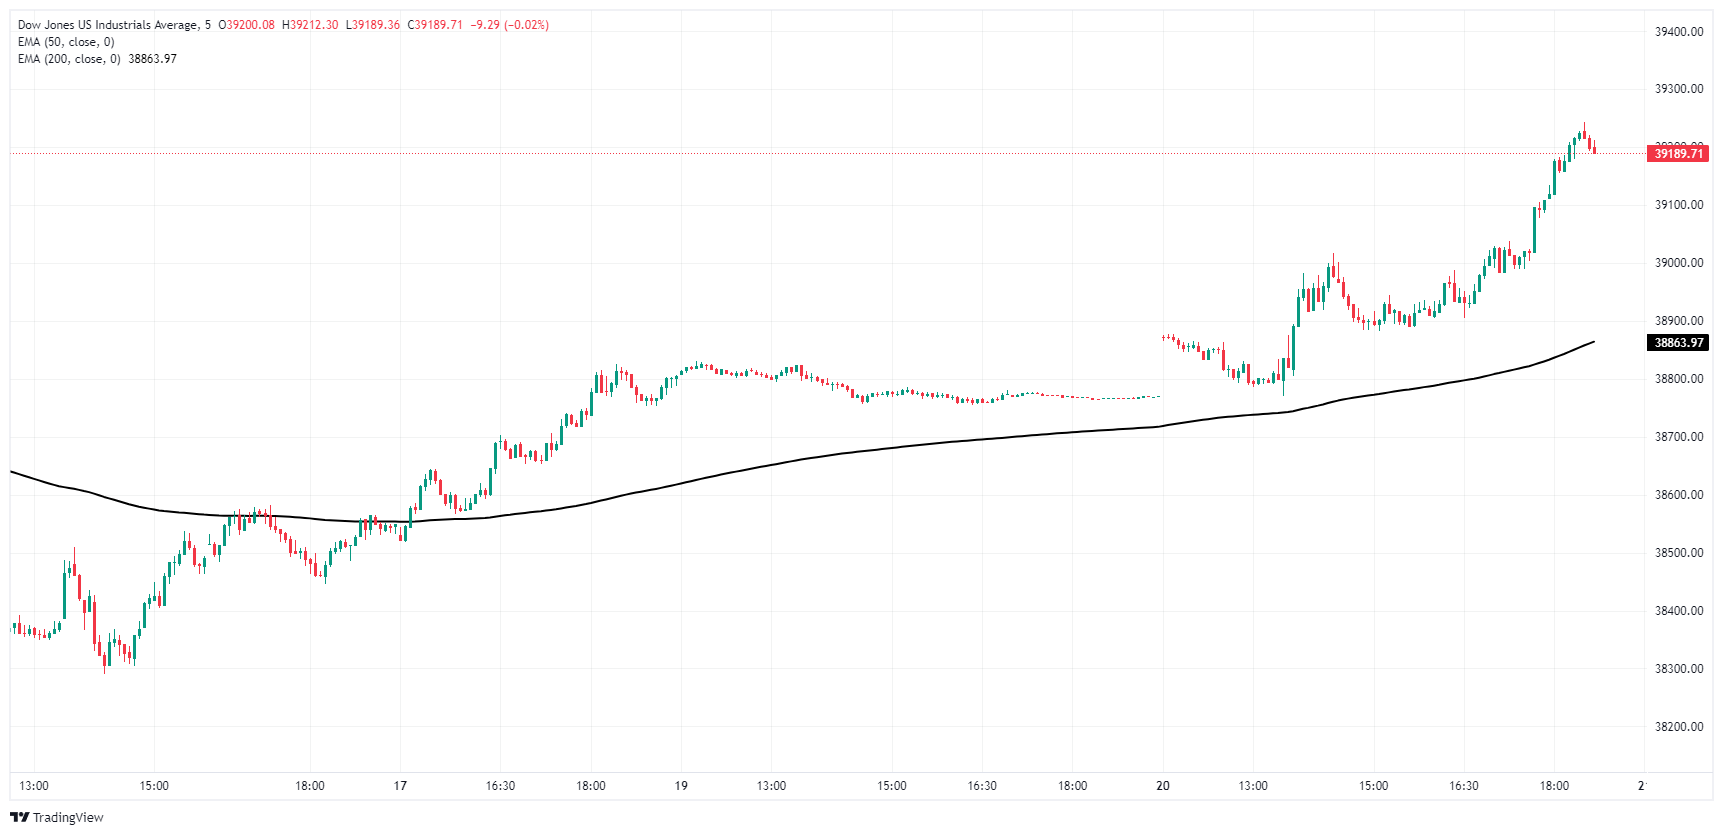
Dow Jones daily chart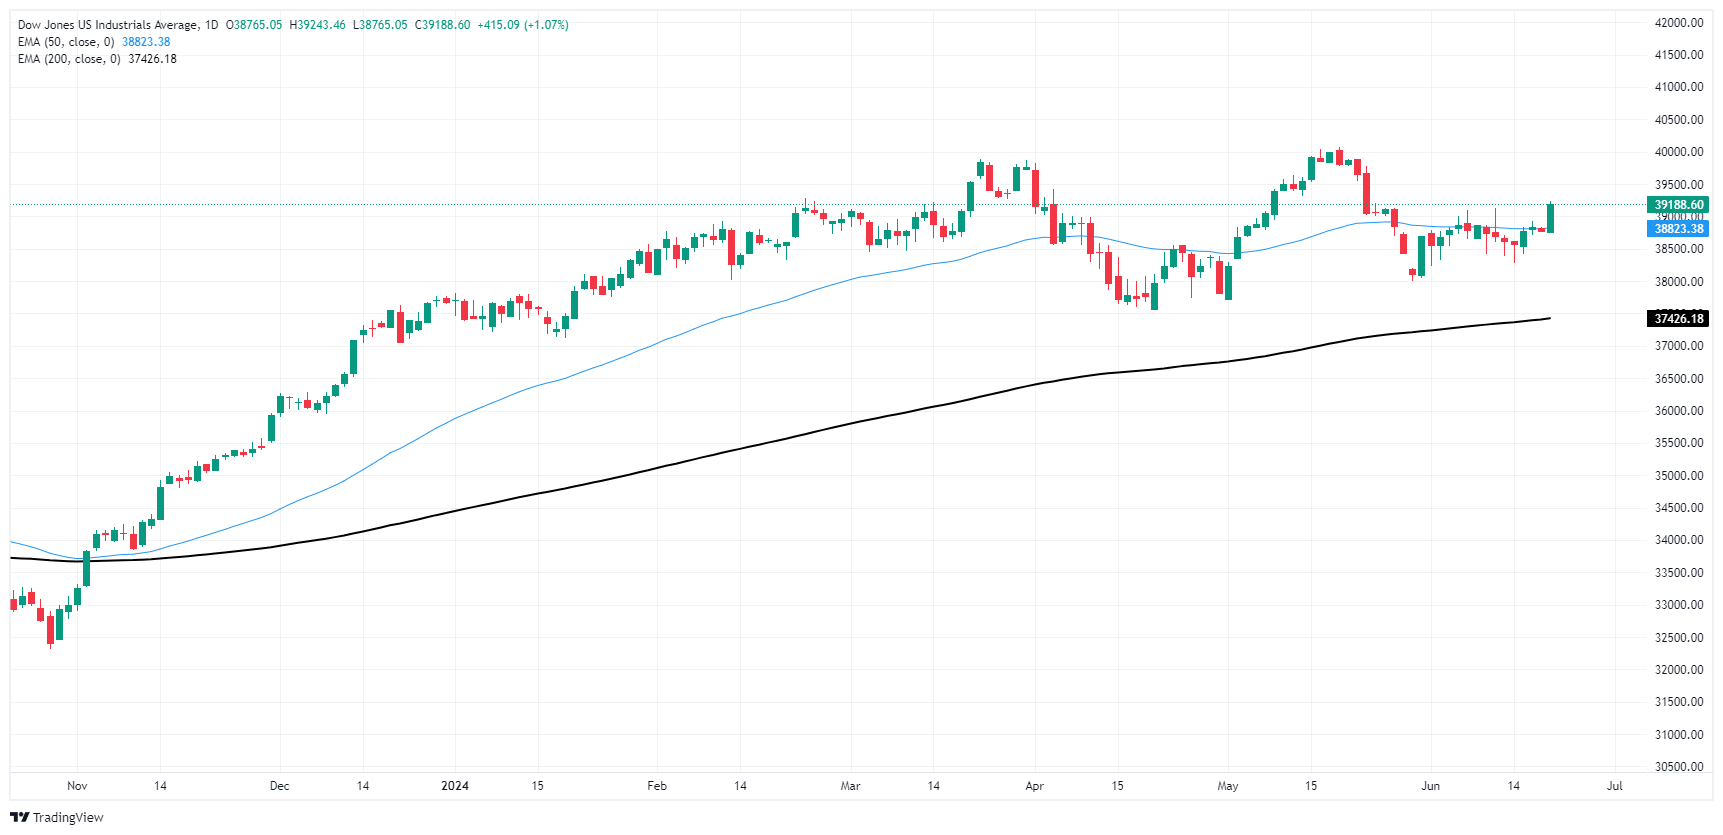
Dow Jones FAQs
The Dow Jones Industrial Average, one of the oldest stock market indices in the world, is compiled of the 30 most traded stocks in the US. The index is price-weighted rather than weighted by capitalization. It is calculated by summing the prices of the constituent stocks and dividing them by a factor, currently 0.152. The index was founded by Charles Dow, who also founded the Wall Street Journal. In later years it has been criticized for not being broadly representative enough because it only tracks 30 conglomerates, unlike broader indices such as the S&P 500.
Many different factors drive the Dow Jones Industrial Average (DJIA). The aggregate performance of the component companies revealed in quarterly company earnings reports is the main one. US and global macroeconomic data also contributes as it impacts on investor sentiment. The level of interest rates, set by the Federal Reserve (Fed), also influences the DJIA as it affects the cost of credit, on which many corporations are heavily reliant. Therefore, inflation can be a major driver as well as other metrics which impact the Fed decisions.
Dow Theory is a method for identifying the primary trend of the stock market developed by Charles Dow. A key step is to compare the direction of the Dow Jones Industrial Average (DJIA) and the Dow Jones Transportation Average (DJTA) and only follow trends where both are moving in the same direction. Volume is a confirmatory criteria. The theory uses elements of peak and trough analysis. Dow’s theory posits three trend phases: accumulation, when smart money starts buying or selling; public participation, when the wider public joins in; and distribution, when the smart money exits.
There are a number of ways to trade the DJIA. One is to use ETFs which allow investors to trade the DJIA as a single security, rather than having to buy shares in all 30 constituent companies. A leading example is the SPDR Dow Jones Industrial Average ETF (DIA). DJIA futures contracts enable traders to speculate on the future value of the index and Options provide the right, but not the obligation, to buy or sell the index at a predetermined price in the future. Mutual funds enable investors to buy a share of a diversified portfolio of DJIA stocks thus providing exposure to the overall index.
- Gold advances sharply, gaining over 1% amid weakening US economic indicators.
- Softer US jobs and housing data increase expectations of two 25-bps Fed rate cuts in 2024.
- Rising geopolitical tensions in the Middle East and North Korea-Russia pact enhance Gold's safe-haven appeal.
Gold prices advanced sharply by more than 1% on Thursday during the North American session as US Treasury bond yields advanced to underpin the Greenback. Data from the United States was softer than expected, boosting traders' confidence that the Federal Reserve (Fed) will ease policy at least twice in 2024. The XAU/USD trades at $2,356 at the time of writing.
The latest economic data from the US continued to show that the economy is decelerating, prompting investors to price in two 25-basis-point (bps) interest rate cuts. A worse-than-expected US jobs report revealed the number of Americans filing for unemployment benefits rose above estimates.
US housing data disappoints markets as Building Permits and Housing Starts cooled.
In the meantime, Minneapolis Fed President Neel Kashkari stated that it will likely take a year or two to bring core inflation down to 2%. He added that the trajectory of interest rates would depend on the economic conditions, emphasizing, "We are achieving disinflation despite remarkable economic growth."
Rising geopolitical risks helped the golden metal uptrend. Tensions in the Middle East are rising as Israel threatens to launch an attack on Hezbollah in Lebanon. That, along with the recently signed pact between Russia and North Korea, could increase the appeal for the yellow metal, which is trading near a crucial resistance level.
The CME FedWatch Tool shows that the odds for a 25 bps rate cut for September stand at 58%, down from 62% a day ago. In the meantime, the December 2024 fed funds futures contract implies the Fed will cut 36 bps toward the end of the year.
Daily digest market movers: Gold price rises amid high US yields and strong USD
- US Dollar Index prints gains of 0.405, up at 105.64, a headwind for Gold prices.
- US Treasury bond yields jumped, 10-year Treasury note yield is up more than four basis points to 4.257%.
- US Initial Jobless Claims for the week ending June 15 rose to 238K, exceeding estimates of 235K but lower than the previous reading of 243K.
- US Building Permits declined by 3.6% in May, dropping from 1.44 million to 1.386 million. Housing Starts for the same period fell by 5.5%, from 1.352 million to 1.277 million.
- Fed officials counseled patience on interest rate cuts and emphasized they would remain data dependent. Although last week's CPI report was positive, policymakers reiterated they need to see more reports like May’s data.
- Despite the US CPI report showing that the disinflation process continues, Fed Chair Jerome Powell commented that they remain “less confident” about the progress on inflation.
Technical analysis: Gold price challenges Head-and-Shoulders pattern, climbs past $2,350
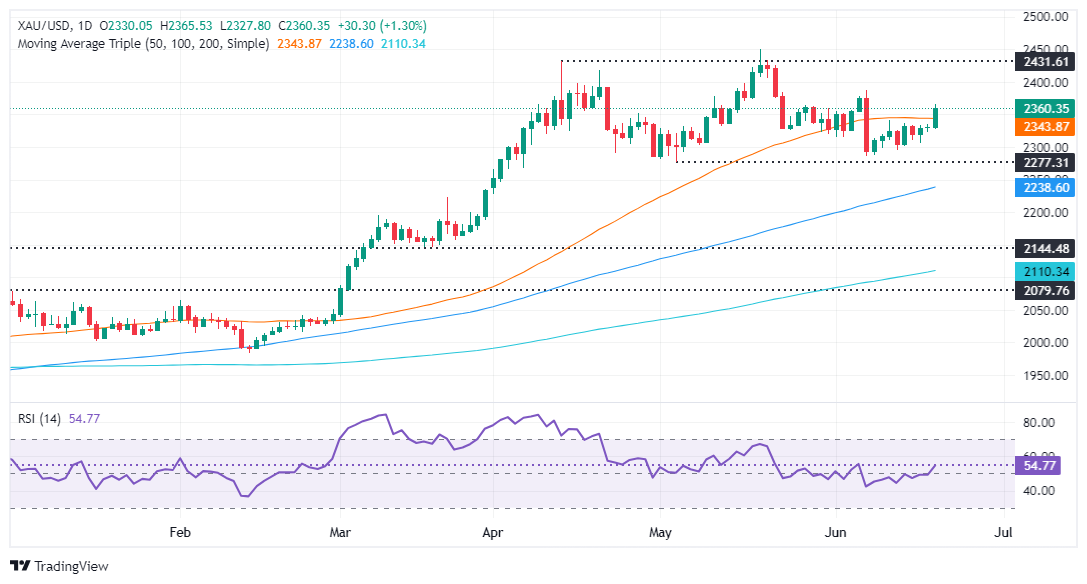
Gold buyers are testing the Head-and-Shoulders pattern, dragging the golden metal above the pattern’s neckline. A daily close above the latter's confluence and the 50-day Simple Moving Averages (SMA) at around $2,343 could negate the bearish chart pattern and open the door for further gains.
In that event, Gold could extend its gains above $2,350, exposing additional key resistance levels. Next would be the June 7 cycle high of $2,387, ahead of challenging the $2,400 figure.
Conversely, if XAU/USD drops below $2,343, that would keep the Head-and-Shoulders chart pattern intact, and Gold could be headed to the downside. If XAU/USD slides drops below $2,300, the next support would be the May 3 low of $2,277, followed by the March 21 high of $2,222. Further losses lie underneath, with sellers eyeing the Head-and-Shoulders chart pattern objective from $2,170 to $2,160.
Gold FAQs
Gold has played a key role in human’s history as it has been widely used as a store of value and medium of exchange. Currently, apart from its shine and usage for jewelry, the precious metal is widely seen as a safe-haven asset, meaning that it is considered a good investment during turbulent times. Gold is also widely seen as a hedge against inflation and against depreciating currencies as it doesn’t rely on any specific issuer or government.
Central banks are the biggest Gold holders. In their aim to support their currencies in turbulent times, central banks tend to diversify their reserves and buy Gold to improve the perceived strength of the economy and the currency. High Gold reserves can be a source of trust for a country’s solvency. Central banks added 1,136 tonnes of Gold worth around $70 billion to their reserves in 2022, according to data from the World Gold Council. This is the highest yearly purchase since records began. Central banks from emerging economies such as China, India and Turkey are quickly increasing their Gold reserves.
Gold has an inverse correlation with the US Dollar and US Treasuries, which are both major reserve and safe-haven assets. When the Dollar depreciates, Gold tends to rise, enabling investors and central banks to diversify their assets in turbulent times. Gold is also inversely correlated with risk assets. A rally in the stock market tends to weaken Gold price, while sell-offs in riskier markets tend to favor the precious metal.
The price can move due to a wide range of factors. Geopolitical instability or fears of a deep recession can quickly make Gold price escalate due to its safe-haven status. As a yield-less asset, Gold tends to rise with lower interest rates, while higher cost of money usually weighs down on the yellow metal. Still, most moves depend on how the US Dollar (USD) behaves as the asset is priced in dollars (XAU/USD). A strong Dollar tends to keep the price of Gold controlled, whereas a weaker Dollar is likely to push Gold prices up.
The US Dollar regained strong upside traction and maintained the price action in the risk complex depressed amidst interest rate cuts speculation and soft US data releases. In addition, the BoE and the Norges Bank kept their policy rates unchanged vs. a surprising cut by the SNB.
Here is what you need to know on Friday, June 21:
The USD Index (DXY) rose to four-day highs near 105.70 on the back of the rebound in US yields across the curve and the dominating risk-off mood in the FX galaxy. On June 21, the advanced S&P Global Manufacturing and Services PMI will take centre stage seconded by the CB Leading Index and Existing Home Sales.
EUR/USD left behind part of the recent three-session advance and revisited the boundaries of the 1.0700 support amidst strong selling pressure. The EcoFin meeting is due on June 20, followed by the preliminary HCOB Manufacturing and Services PMI in Germany and Euroland.
GBP/USD followed its risky peers and retreated to multi-day lows well south of the 1.2700 support following a firm Dollar and the dovish hold by the BoE. The flash S&P Global advanced Manufacturing and Services PMI come on June 21, along with the GfK Consumer Confidence, Public Sector Net Borrowing, and Retail Sales.
USD/JPY maintained its robust bullish bias and challenged fresh tops near the 159.00 barrier amidst the stronger Greenback and higher yields. The advanced Jibun Bank Manufacturing and Services PMI will be published on June 21 followed by the Inflation Rate.
AUD/USD faced some renewed downside pressure and receded from recent weekly tops, revisiting the 0.6650 zone. In Australia, the flash Judo Bank Manufacturing and Services PMIs are expected on June 21.
WTI prices advanced to fresh highs and approached the $82.00 mark per barrel on the back of renewed geopolitical jitters and a weekly drop in US crude oil inventories.
Gold prices managed to gather fresh steam and advance to two-week highs around $2,365 per ounce troy. Silver rallied more than 3% to surpass the $30.00 mark per ounce and clinch a new two-week high.
- Australian Dollar has lost some momentum in recent sessions despite RBA’s hawkish hold.
- Treasury yields benefit US Dollar on Thursday.
- Australian economy's next crucial data set will be released in Friday's session with the June Judo PMI figures from Australia.
In Thursday's session, the Australian Dollar (AUD) met with some losses against its peers. This development follows the AUD/USD’s retreat after two consecutive sessions of gains heading toward 0.6670, ultimately succumbing to higher US Treasury yields that boost the USD.
Signs of fragility are emerging in the Australian economy, however, persistently high inflation is causing the Reserve Bank of Australia (RBA) to postpone potential rate cuts, potentially mitigating further losses. The RBA is primed to be among the last G10 nations to initiate rate cuts, a situation that might perpetuate the Aussie's gains.
Daily digest market movers: Australian Dollar consolidates RBA gains, eyes on PMIs
- RBA once more demonstrated a hawkish hold, retaining the official cash rate (OCR) at 4.35% without committing to a particular future stance, echoing their phrase “the Board is not ruling anything in or out.”
- In her subsequent press conference, Governor Bullock reiterated the Board’s discussions about potential rate hikes and dismissed considerations of rate cuts in the near term.
- In light of this, the RBA expressed readiness to do "what is necessary" to guide inflation back within target parameters.
- Market anticipates nearly 50 bps of easing by December 2025, while rate hikes in August and September are yet to be ruled out.
- Further indications will come from upcoming preliminary data from Australia’s Judo Bank Purchasing Managers Index (PMI) set for release on Friday.
- Expected signs of revival in the Australian economy might command the RBA to delay rate cuts, potentially uplifting the Australian Dollar against the USD.
- US Treasury yields saw a considerable rise, with gains exceeding 1%. The 2-year, 5-year and 10-year rates stood at 4.74%, 4.29%, and 4.27%, respectively, and seem to be driving demand toward the USD.
Technical analysis: Bullish signals ease off, confirmation still on hold
On the technical front, indicators are losing some intensity despite the recovery of the Relative Strength Index (RSI), which has surged back above 50, while the Moving Average Convergence Divergence (MACD) charts a fresh green bar.
However, it's worth mentioning that these are still buy signals. For a more solid buying confirmation, the AUD/USD pair needs to fully anchor itself above the 20-day Simple Moving Average (SMA). In that sense,sellers might retest the support in the next few sessions to test its strength.
Australian Dollar FAQs
One of the most significant factors for the Australian Dollar (AUD) is the level of interest rates set by the Reserve Bank of Australia (RBA). Because Australia is a resource-rich country another key driver is the price of its biggest export, Iron Ore. The health of the Chinese economy, its largest trading partner, is a factor, as well as inflation in Australia, its growth rate and Trade Balance. Market sentiment – whether investors are taking on more risky assets (risk-on) or seeking safe-havens (risk-off) – is also a factor, with risk-on positive for AUD.
The Reserve Bank of Australia (RBA) influences the Australian Dollar (AUD) by setting the level of interest rates that Australian banks can lend to each other. This influences the level of interest rates in the economy as a whole. The main goal of the RBA is to maintain a stable inflation rate of 2-3% by adjusting interest rates up or down. Relatively high interest rates compared to other major central banks support the AUD, and the opposite for relatively low. The RBA can also use quantitative easing and tightening to influence credit conditions, with the former AUD-negative and the latter AUD-positive.
China is Australia’s largest trading partner so the health of the Chinese economy is a major influence on the value of the Australian Dollar (AUD). When the Chinese economy is doing well it purchases more raw materials, goods and services from Australia, lifting demand for the AUD, and pushing up its value. The opposite is the case when the Chinese economy is not growing as fast as expected. Positive or negative surprises in Chinese growth data, therefore, often have a direct impact on the Australian Dollar and its pairs.
Iron Ore is Australia’s largest export, accounting for $118 billion a year according to data from 2021, with China as its primary destination. The price of Iron Ore, therefore, can be a driver of the Australian Dollar. Generally, if the price of Iron Ore rises, AUD also goes up, as aggregate demand for the currency increases. The opposite is the case if the price of Iron Ore falls. Higher Iron Ore prices also tend to result in a greater likelihood of a positive Trade Balance for Australia, which is also positive of the AUD.
The Trade Balance, which is the difference between what a country earns from its exports versus what it pays for its imports, is another factor that can influence the value of the Australian Dollar. If Australia produces highly sought after exports, then its currency will gain in value purely from the surplus demand created from foreign buyers seeking to purchase its exports versus what it spends to purchase imports. Therefore, a positive net Trade Balance strengthens the AUD, with the opposite effect if the Trade Balance is negative.
- Canadian Dollar caught a bid on Thursday, but gains remain limited against USD.
- Canada sees better-than-expected recovery in unemployment claims.
- US Initial Jobless Claims fell, but less than expected; US PMIs loom ahead on Friday.
The Canadian Dollar (CAD) found some room on the high side on Thursday, adding to the week’s thin gains. The CAD is struggling to outperform the US Dollar (USD), which is climbing as US markets return to the fold following a midweek holiday that kept US exchanges dark and Greenback trading thin.
Canada reported a comparatively steep cut in the number of Canadians taking unemployment benefits. US Initial Jobless Claims also eased but less than expected, driving the four-week average higher. Canadian Retail Sales and US Purchasing Managers Index (PMI) figures are slated for Friday to wrap up the trading week.
Daily digest market movers: Jobless benefits figures drive market sentiment, CAD shifts higher
- Canadian Employment Insurance Beneficiaries Change declined 2.8% MoM in April, sharply below the previous 0.1% increase and the steepest decline in Canadian jobless benefits claimants since November 2022.
- US Initial Jobless Claims also declined from a week earlier but less than expected. New unemployment benefit seekers eased to 238K for the week ended June 14, less than the previous 243K but more than the expected 235K.
- US Initial Jobless Claims are still riding higher than the four-week average, which ticked up to 232.75K from 227.25K.
- Philadelphia Fed Manufacturing Survey backslid to 1.3 in June, missing the forecasted increase to 5.0 from the previous 4.5 as economic concerns continue to weigh on business sentiment.
- Canadian Retail Sales due on Friday are expected to recover to 0.7% MoM in April, up from the previous -0.2% decline.
- Friday’s US PMI will close out the trading week, with markets expecting a slight shift lower. The Manufacturing PMI is forecast to push down to 51.0 from 51.3, and the Services component is expected to slide to 53.7 from 54.8.
Canadian Dollar PRICE Today
The table below shows the percentage change of Canadian Dollar (CAD) against listed major currencies today. Canadian Dollar was the strongest against the Swiss Franc.
| USD | EUR | GBP | JPY | CAD | AUD | NZD | CHF | |
|---|---|---|---|---|---|---|---|---|
| USD | 0.34% | 0.46% | 0.46% | -0.01% | 0.32% | 0.25% | 0.75% | |
| EUR | -0.34% | 0.11% | 0.12% | -0.35% | -0.02% | -0.10% | 0.40% | |
| GBP | -0.46% | -0.11% | 0.00% | -0.46% | -0.13% | -0.22% | 0.27% | |
| JPY | -0.46% | -0.12% | 0.00% | -0.51% | -0.15% | -0.26% | 0.26% | |
| CAD | 0.00% | 0.35% | 0.46% | 0.51% | 0.31% | 0.26% | 0.74% | |
| AUD | -0.32% | 0.02% | 0.13% | 0.15% | -0.31% | -0.08% | 0.42% | |
| NZD | -0.25% | 0.10% | 0.22% | 0.26% | -0.26% | 0.08% | 0.49% | |
| CHF | -0.75% | -0.40% | -0.27% | -0.26% | -0.74% | -0.42% | -0.49% |
The heat map shows percentage changes of major currencies against each other. The base currency is picked from the left column, while the quote currency is picked from the top row. For example, if you pick the Canadian Dollar from the left column and move along the horizontal line to the US Dollar, the percentage change displayed in the box will represent CAD (base)/USD (quote).
Technical analysis: Canadian Dollar bounces, but remains trapped at key levels
The Canadian Dollar (CAD) is gaining ground across the board on Thursday, climbing nearly eight-tenths of one percent against the battered Swiss Franc (CHF), the day’s worst-performing currency. The CAD is also up over one-half of one percent against the Pound Sterling (GBP) and the Japanese Yen (JPY), but gains against the US Dollar remain limited as the Canadian Dollar trades within a tenth of a percent against the Greenback.
USD/CAD remains mired in near-term congestion at the 1.3700 handle, but momentum is tilting in favor of bears looking to push the Greenback lower against the Canadian Dollar. The pair is drifting steadily lower from a near-term supply zone above 1.3760, with eyes set on the recent swing low into 1.3680.
Daily candles are on pace to make a return to technical support from a confluence in a rough rising trendline and the 50-day Exponential Moving Average (EMA) at 1.3676, but a long-term price floor is baked in at the 200-day EMA rising into the 1.3600 handle. USD/CAD is down a full percent from the year’s peaks near 1.3850 but is still up a healthy 3.5% from 2024’s opening bids near 1.3250.
USD/CAD hourly chart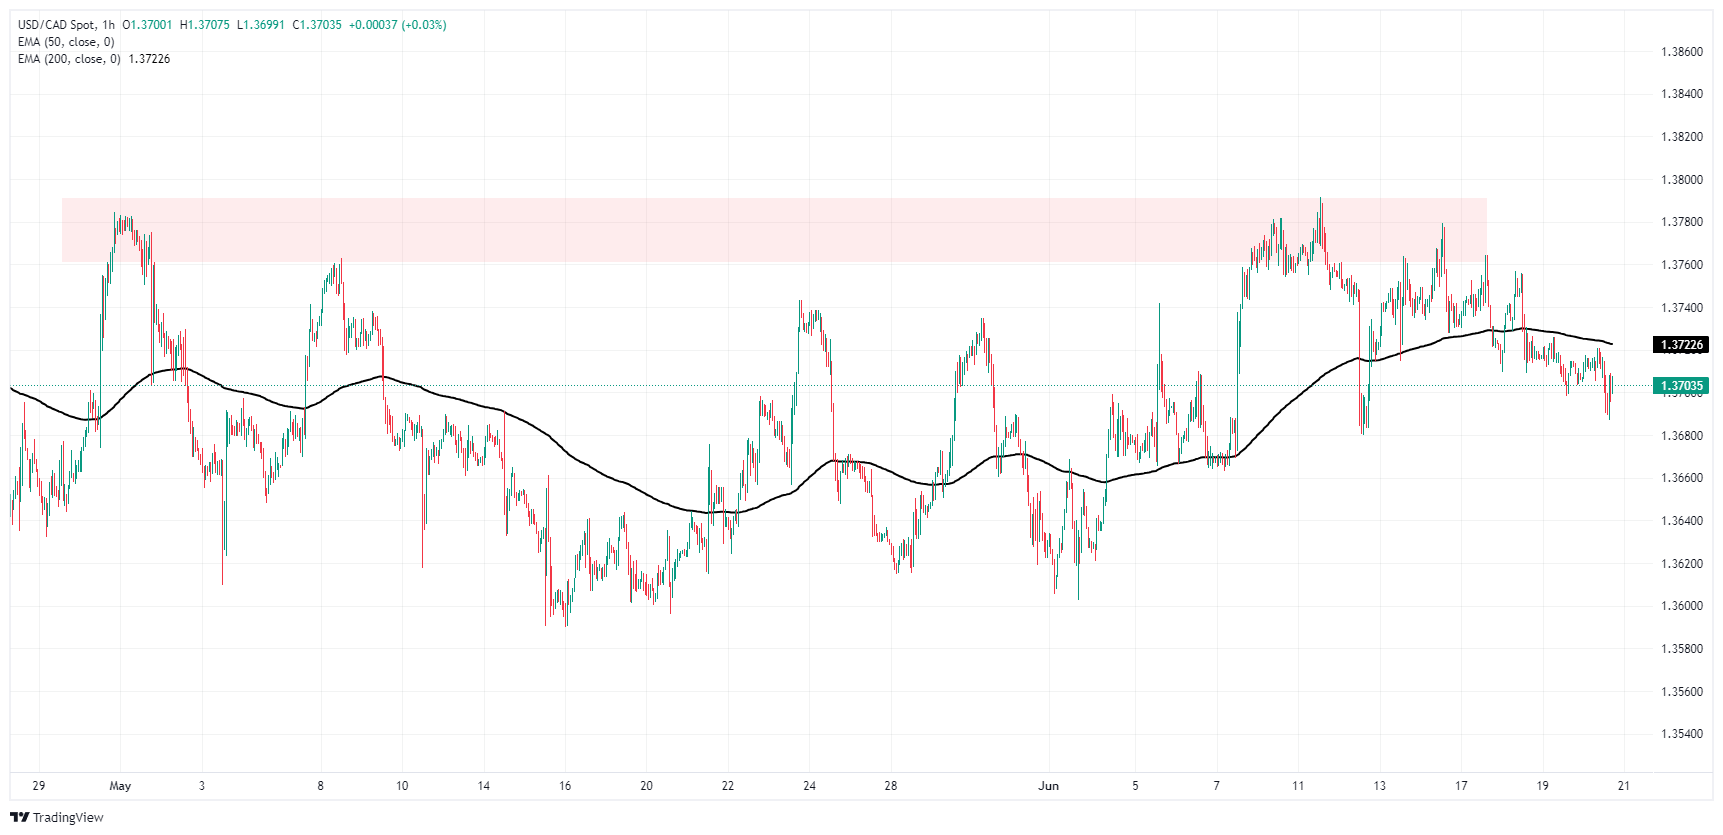
USD/CAD daily chart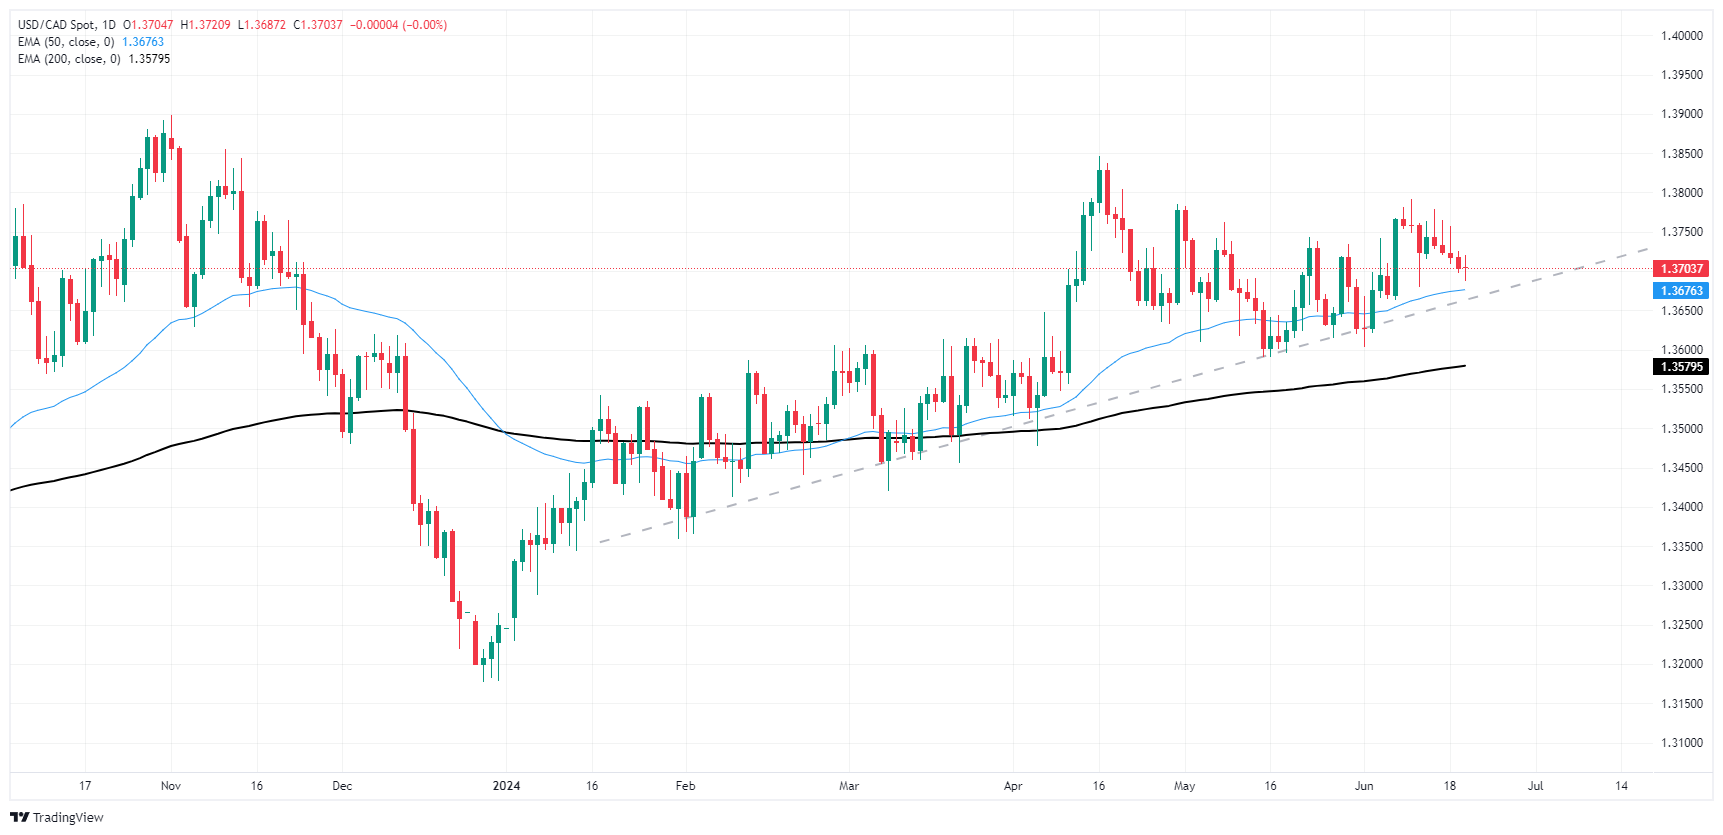
Canadian Dollar FAQs
The key factors driving the Canadian Dollar (CAD) are the level of interest rates set by the Bank of Canada (BoC), the price of Oil, Canada’s largest export, the health of its economy, inflation and the Trade Balance, which is the difference between the value of Canada’s exports versus its imports. Other factors include market sentiment – whether investors are taking on more risky assets (risk-on) or seeking safe-havens (risk-off) – with risk-on being CAD-positive. As its largest trading partner, the health of the US economy is also a key factor influencing the Canadian Dollar.
The Bank of Canada (BoC) has a significant influence on the Canadian Dollar by setting the level of interest rates that banks can lend to one another. This influences the level of interest rates for everyone. The main goal of the BoC is to maintain inflation at 1-3% by adjusting interest rates up or down. Relatively higher interest rates tend to be positive for the CAD. The Bank of Canada can also use quantitative easing and tightening to influence credit conditions, with the former CAD-negative and the latter CAD-positive.
The price of Oil is a key factor impacting the value of the Canadian Dollar. Petroleum is Canada’s biggest export, so Oil price tends to have an immediate impact on the CAD value. Generally, if Oil price rises CAD also goes up, as aggregate demand for the currency increases. The opposite is the case if the price of Oil falls. Higher Oil prices also tend to result in a greater likelihood of a positive Trade Balance, which is also supportive of the CAD.
While inflation had always traditionally been thought of as a negative factor for a currency since it lowers the value of money, the opposite has actually been the case in modern times with the relaxation of cross-border capital controls. Higher inflation tends to lead central banks to put up interest rates which attracts more capital inflows from global investors seeking a lucrative place to keep their money. This increases demand for the local currency, which in Canada’s case is the Canadian Dollar.
Macroeconomic data releases gauge the health of the economy and can have an impact on the Canadian Dollar. Indicators such as GDP, Manufacturing and Services PMIs, employment, and consumer sentiment surveys can all influence the direction of the CAD. A strong economy is good for the Canadian Dollar. Not only does it attract more foreign investment but it may encourage the Bank of Canada to put up interest rates, leading to a stronger currency. If economic data is weak, however, the CAD is likely to fall.
- US Dollar gets a boost from an increase in US Treasury yields on Thursday.
- Markets still show signs of caution as Fed officials express a conservative stance on embracing easing cycles.
- The mixed US economic outlook tempers upside in the Greenback.
On Thursday, the US Dollar, as gauged by the Dollar Index (DXY), saw significant strength on the back of rising US Treasury yields. This follows a dip midweek as market participants analyzed several recently released mid-tier data releases, including soft Retail Sales figures from May. On Thursday, the USD shrugged off weak labor and housing data.
In regard to the US economic outlook, while there are signs of disinflation, Federal Reserve (Fed) officials' measured comments are keeping the market's expectations in check. If the mixed signals from the economy persist, it could potentially hinder further USD strength.
Daily digest market movers: US Dollar gains despite weak data
- Building Permits declined from 1.44 million to 1.386 million, a dip below predictions.
- In addition, Housing Starts also decreased, moving from 1.352 million to 1.277 million, missing optimistic estimates.
- Initial Jobless Claims recorded a slight drop, trending from a revised 243K to 238K. Continuing Jobless Claims saw an increase from 1.813 million to 1.828 million.
- Philadelphia Fed Manufacturing Survey for June disappointed, posting a 1.3 instead of the projected 5, down from the previous 4.5.
- Minneapolis Fed President Neel Kashkari noted that returning inflation to the 2% target could take one to two years since current wage growth still outpaces the desired rate.
- Chances of an interest rate cut remain at about 67% for the upcoming Fed meeting on September 18, according to the CME Group's FedWatch Tool.
- US Treasury yields saw a considerable rise, with gains exceeding 1%. The 2-year, 5-year and 10-year rates stood at 4.74%, 4.29%, and 4.27%, respectively.
DXY technical analysis: Bullish sentiment gains traction, must recover 105.50
Technical indicators for Thursday's session showed renewed bullish momentum bolstered by increased US Treasury yields. The Relative Strength Index (RSI) held above 50, with a prevailing green histogram in the Moving Average Convergence Divergence (MACD), indicating sustained bullish sentiment.
Additionally, the DXY Index maintains above its 20-day, 100-day and 200-day Simple Moving Averages (SMA). This, combined with the rising indicators, suggests the potential for additional gains in the US Dollar. Yet, given the mixed economic outlook, investors should remain attentive to changes in the market landscape.
Fed FAQs
Monetary policy in the US is shaped by the Federal Reserve (Fed). The Fed has two mandates: to achieve price stability and foster full employment. Its primary tool to achieve these goals is by adjusting interest rates. When prices are rising too quickly and inflation is above the Fed’s 2% target, it raises interest rates, increasing borrowing costs throughout the economy. This results in a stronger US Dollar (USD) as it makes the US a more attractive place for international investors to park their money. When inflation falls below 2% or the Unemployment Rate is too high, the Fed may lower interest rates to encourage borrowing, which weighs on the Greenback.
The Federal Reserve (Fed) holds eight policy meetings a year, where the Federal Open Market Committee (FOMC) assesses economic conditions and makes monetary policy decisions. The FOMC is attended by twelve Fed officials – the seven members of the Board of Governors, the president of the Federal Reserve Bank of New York, and four of the remaining eleven regional Reserve Bank presidents, who serve one-year terms on a rotating basis.
In extreme situations, the Federal Reserve may resort to a policy named Quantitative Easing (QE). QE is the process by which the Fed substantially increases the flow of credit in a stuck financial system. It is a non-standard policy measure used during crises or when inflation is extremely low. It was the Fed’s weapon of choice during the Great Financial Crisis in 2008. It involves the Fed printing more Dollars and using them to buy high grade bonds from financial institutions. QE usually weakens the US Dollar.
Quantitative tightening (QT) is the reverse process of QE, whereby the Federal Reserve stops buying bonds from financial institutions and does not reinvest the principal from the bonds it holds maturing, to purchase new bonds. It is usually positive for the value of the US Dollar.
- EUR/GBP bounced from near-term lows to cross 0.8450.
- BoE keeps rates on hold, cites still-tight labor market and tricky inflation.
- Friday to wrap up the trading week with UK Retail Sales, PMIs in EU and UK.
EUR/GBP found some room on the high side on Thursday after the Bank of England kept rates on hold at 5.25%. Mid-tier EU data did little to spark much movement in either direction, though Euro traders will note a further softening in the German Producer Price Index (PPI) in May.
Germany’s PPI slipped to 0.0% MoM in May, down from the previous 0.2% and flubbing the forecast uptick to 0.3%. YoY PPI figures also missed the mark, declining to -2.2% for the year ended in May. The annualized figure rebounded from the previous -3.3%, but still failed to grab the forecast recovery to -2.0%.
The BoE held rates in place in June as was broadly expected, but a focus on recent services inflation coupled with an ambiguous goal to keep inflation “sustainably” at 2% has left the Sterling in the lurch. The BoE went on to note a willingness to keep policy restrictive for as long as needed and highlighted that the UK labor market, while looser than previous, still remains tight in comparison to historical figures. The Sterling lost ground against the Euro, pulling EUR/GBP back up from an intraday low of 0.8435 to retest 0.8460.
Read more: BoE maintains policy rate at 5.25% as forecast
Friday will see a fresh round of UK Retail Sales, forecast to recover to 1.5% MoM in May after April’s -2.3% decline. Pan-EU HCOB Purchasing Managers Index (PMI) and UK PMI numbers for June are expected to recover slightly. The EU’s June Manufacturing PMI is expected to move to 47.9 from 47.3, while the Services PMI component is forecast to rise to 53.5 from 53.2. On the UK side, June’s Manufacturing PMI is expected to tick to 51.3 from 51.2, while the Services PMI is forecast to clip into 53.0 from 52.9.
EUR/GBP technical outlook
EUR/GBP found the juice for an intraday bullish recovery, but the pair's outlook is still firmly bearish. 0.8460 represents a significant near-term hurdle for bulls to overcome, and the pair has only just started clawing back ground after last week’s tumble into a 22-month low at the 0.8400 handle.
The pair has closed flat or down for five consecutive weeks, and despite recovering 0.80% from nearly two-year lows, bullish momentum remains anemic. If bidders are able to recover their balance, the 0.8500 handle will be waiting further above.
EUR/GBP hourly chart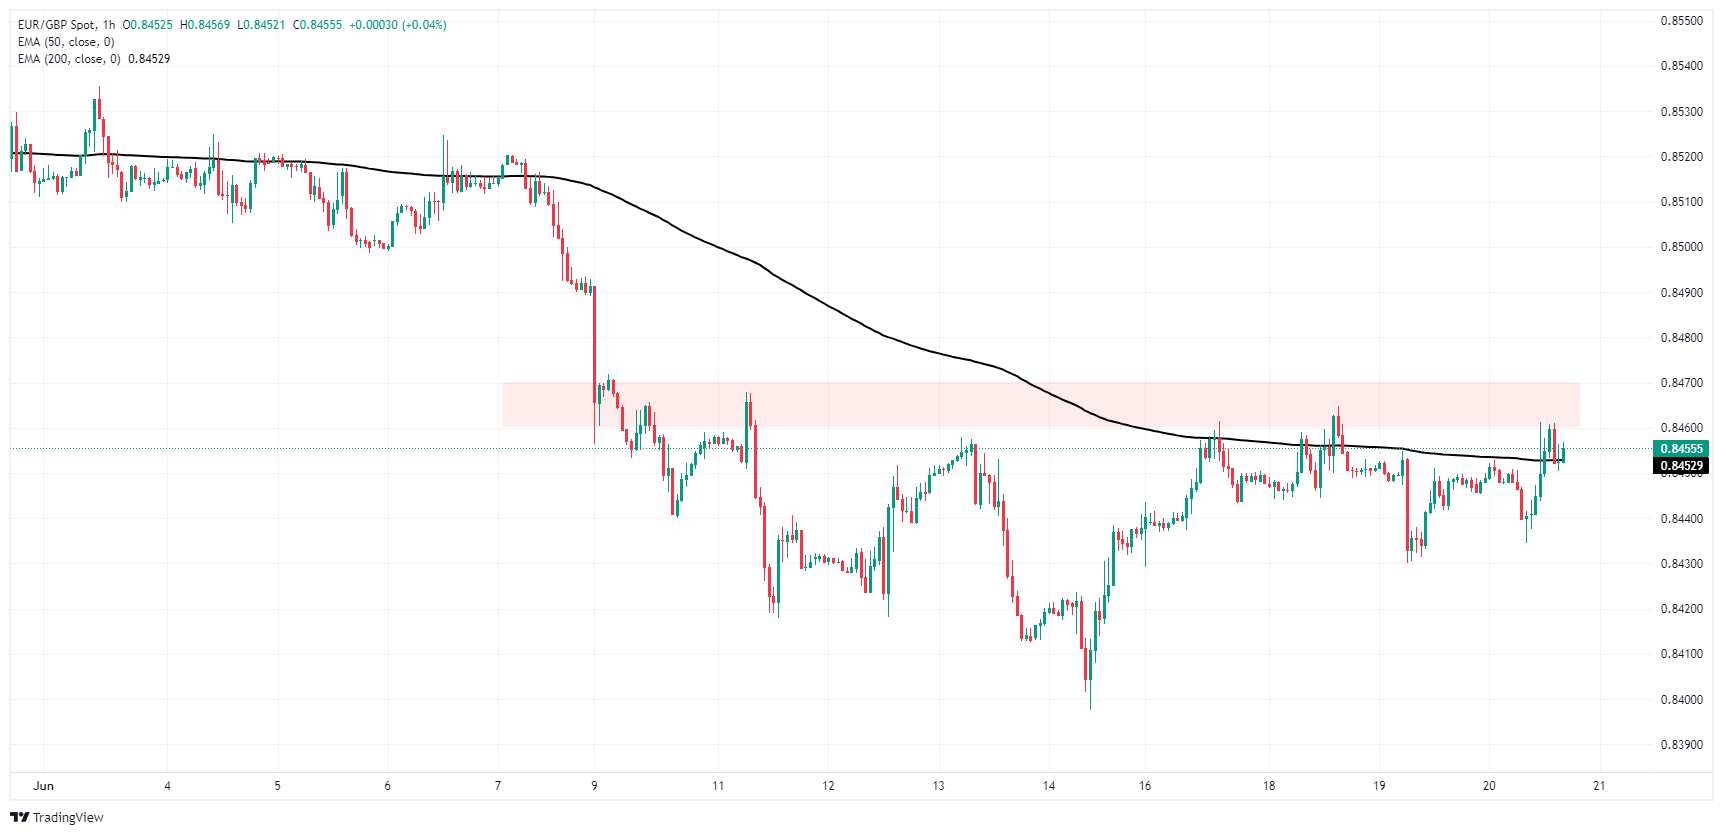
EUR/GBP daily chart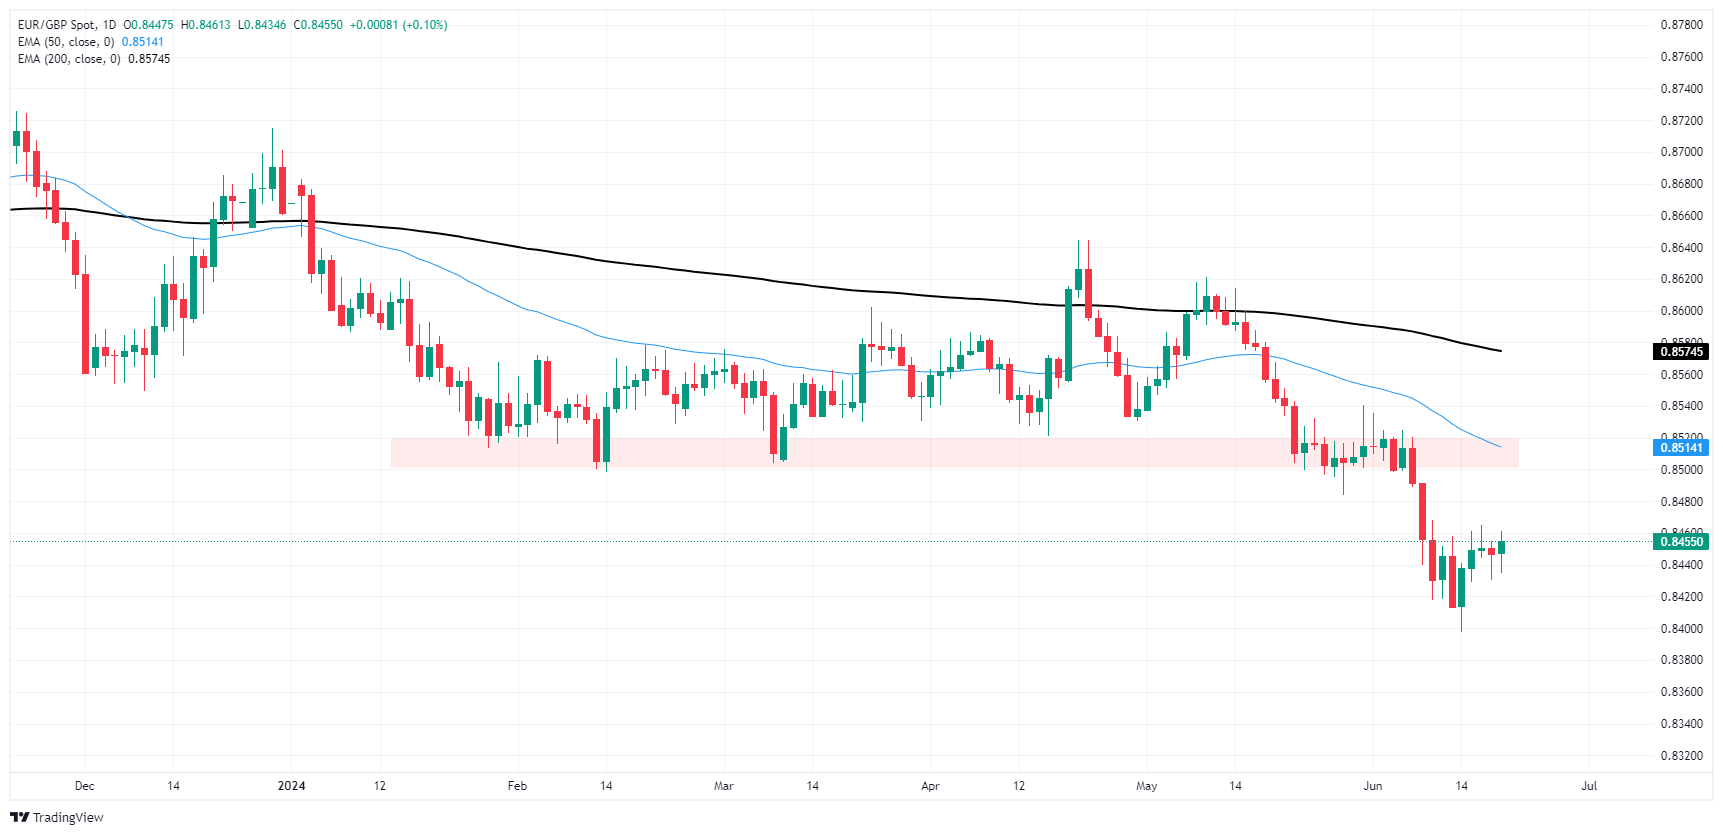
- Mexican Peso remains stable against US Dollar alongside solid April Retail Sales data.
- Political uncertainty over AMLO's judiciary reforms limits further gains, with key announcements expected from President-elect Sheinbaum.
- US housing sector weakens and softer jobs data emerge.
- Fed's Kashkari suggests disinflation may take a year or two.
The Mexican Peso clung to gains against the US Dollar on Thursday after economic data showed the country’s economy remains robust. However, political uncertainty about a pending judiciary reform caps the emerging market currency's advance. The USD/MXN exchanges hands at 18.40, virtually unchanged.
Mexico’s economic docket revealed solid Retail Sales in April, exceeding estimates and March’s figures. Later on Thursday, President-elect Claudia Sheinbaum will reveal the names of six cabinet members who have collaborated with her since October 1.
In the meantime, political noise about President Andres Manuel Lopez Obrador's (AMLO) reforms submitted to the congress had waned, as reflected by the USD/MXN stabilizing at around 18.40-18.50. Nevertheless, this consolidation could be the calm before the storm, as the newly elected Mexican congress will begin on September 1.
Across the border, the US housing sector continued to deteriorate, while jobs data was softer than expected. Federal Reserve speakers continued to cross the newswires, with Minneapolis Fed President Neel Kashkari speaking.
Kashkari stated that it will probably take a year or two to lower core inflation to 2%. He added the path of interest rates would depend on the economy, emphasizing, “We are getting disinflation despite remarkable economic growth.”
Daily digest market movers: Mexican Peso remains flat despite posting strong Retail Sales
- Mexican Retail Sales in April increased from 0% to 0.5%, above estimates of -0.3% MoM. They jumped from -1.7% to 3.2%, more than doubling projections by analysts for the 12 months to April.
- USD/MXN stabilizes following last week’s verbal intervention by Banxico Governor Victoria Rodriguez Ceja, who said the central bank is attentive to volatility in the Mexican currency exchange rate and could act to restore “order” in markets.
- Volatility in the USD/MXN exchange rate could prevent Banxico from cutting interest rates for the second time in the year at the upcoming meeting on June 27. A rate cut could weaken the Mexican Peso and expose the USD/MXN year-to-date high at 18.99.
- US Initial Jobless Claims for the week ending June 15 climbed 238K, exceeding estimates of 235K but lower than the previous reading of 243K.
- US Building Permits plunged 3.6% in May, from 1.44 million to 1.386 million. Housing Starts for the same period dropped from 1.352 million to 1.277 million, a fall of 5.5%.
- The CME FedWatch Tool shows odds for a 25-basis-point Fed rate cut at 58%, down from 62% on Wednesday.
Technical analysis: Mexican Peso consolidates at around 18.30-18.50
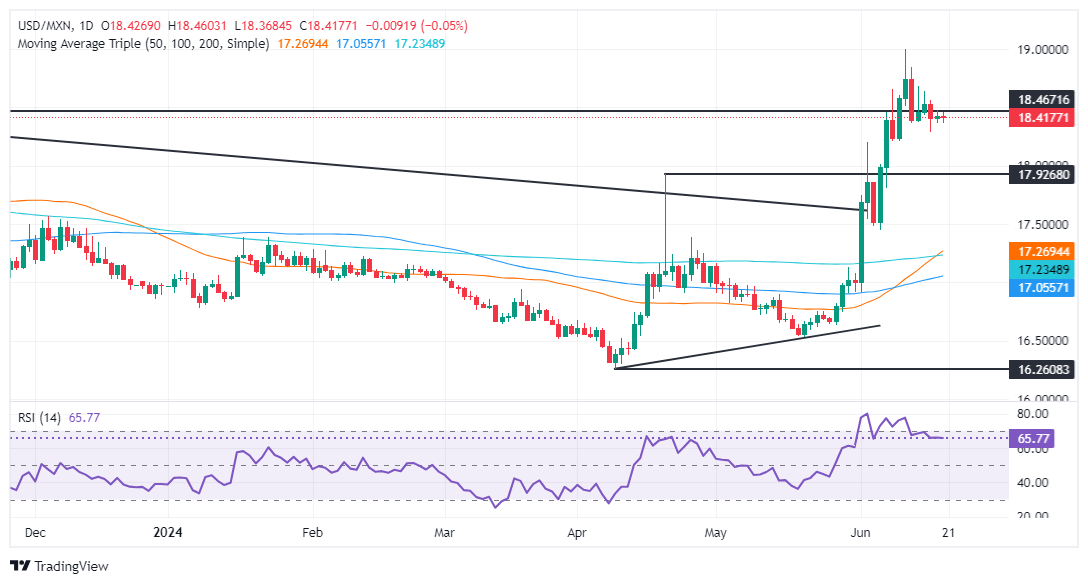
The USD/MXN shifted upward bias despite consolidating within the 18.30-18.50 range during the last four days. Momentum supports buyers as the Relative Strength Index (RSI) remains bullish.
For a bullish continuation, the USD/MXN must clear 18.50 if buyers want to retest the year-to-date high of 18.99. A breach of the latter will expose the March 20, 2023, high of 19.23. If that price is cleared, this will sponsor an uptick to 19.50, ahead of the psychological 20.00 mark.
Conversely, if sellers push prices below the April 19 high of 18.15, the exotic pair will be kept within the 18.00-18.15 range.
Mexican Peso FAQs
The Mexican Peso (MXN) is the most traded currency among its Latin American peers. Its value is broadly determined by the performance of the Mexican economy, the country’s central bank’s policy, the amount of foreign investment in the country and even the levels of remittances sent by Mexicans who live abroad, particularly in the United States. Geopolitical trends can also move MXN: for example, the process of nearshoring – or the decision by some firms to relocate manufacturing capacity and supply chains closer to their home countries – is also seen as a catalyst for the Mexican currency as the country is considered a key manufacturing hub in the American continent. Another catalyst for MXN is Oil prices as Mexico is a key exporter of the commodity.
The main objective of Mexico’s central bank, also known as Banxico, is to maintain inflation at low and stable levels (at or close to its target of 3%, the midpoint in a tolerance band of between 2% and 4%). To this end, the bank sets an appropriate level of interest rates. When inflation is too high, Banxico will attempt to tame it by raising interest rates, making it more expensive for households and businesses to borrow money, thus cooling demand and the overall economy. Higher interest rates are generally positive for the Mexican Peso (MXN) as they lead to higher yields, making the country a more attractive place for investors. On the contrary, lower interest rates tend to weaken MXN.
Macroeconomic data releases are key to assess the state of the economy and can have an impact on the Mexican Peso (MXN) valuation. A strong Mexican economy, based on high economic growth, low unemployment and high confidence is good for MXN. Not only does it attract more foreign investment but it may encourage the Bank of Mexico (Banxico) to increase interest rates, particularly if this strength comes together with elevated inflation. However, if economic data is weak, MXN is likely to depreciate.
As an emerging-market currency, the Mexican Peso (MXN) tends to strive during risk-on periods, or when investors perceive that broader market risks are low and thus are eager to engage with investments that carry a higher risk. Conversely, MXN tends to weaken at times of market turbulence or economic uncertainty as investors tend to sell higher-risk assets and flee to the more-stable safe havens.
- GBP/USD back below 1.2675 after BoE keeps rates pinned.
- BoE voting split remains unchanged at seven-to-two.
- Softer US data further eroded market sentiment, bolstering Greenback.
GBP/USD slipped lower on Thursday after the Bank of England (BoE) held rates at 5.25%, citing ongoing concerns about the central bank’s ability to sustainably keep inflation at or below the 2.0% target. US data was broadly softer than investors had expected in early American trading, igniting a soft patch of risk aversion which kept the US Dollar bid and Sterling pinned into the low end.
Read more: BoE maintains policy rate at 5.25% as forecast
The BoE was broadly expected to keep rates held in place in June, but a focus on recent services inflation coupled with an ambiguous goal to keep inflation “sustainably” lower has left the Sterling in the lurch. Adding onto this, the BoE also noted a willingness to keep policy restrictive for as long as needed, and highlighted that the UK labor market, while looser than previous, still remains historically tight. The Sterling is down around a third of a percent against the extending US Dollar as Thursday’s market action rolls on.
US Initial Jobless Claims missed the mark, coming in higher than expected for the week ended June 14. Week-on-week unemployment claimants are still lower, printing at 238K versus the previous 243K (revised from 242K), but still came in above the four-week trending average of 242.75K, which itself also rose from the previous 227.25K.
The Philadelphia Fed Manufacturing Survey for June backslid to 1.3 from the previous 4.5, entirely missing the forecast 5.0. US Housing Starts also softened, falling back to 1.277 million new residential construction projects MoM in May versus the forecast 1.37 million and the previous month’s 1.352 million (revised from 1.36 million).
Friday will round out the Cable’s trading week with a bang, with UK Retail Sales and a fresh update to S&P Global Purchasing Managers Index (PMI) figures for both the UK and the US. UK retail sales are expected to rebound to 1.5% MoM in May compared to the previous -2.3% decline, while UK PMIs are expected to tick slightly higher. The Manufacturing PMI is forecast to increase to 51.3 from 51.2, and the Services component is expected to bump to 53.0 from 52.9.
On the US side, Manufacturing and Services PMIs are both forecast to tick lower, with Manufacturing expected to slip to 51.0 from 51.3 and Services sliding to 53.7 from 54.8.
GBP/USD technical outlook
The Pound Sterling fell back below the 1.2700 handle against the US Dollar on Thursday, shedding weight and turning lower in a race back to near-term lows at 1.2657. Technicals favor a bearish extension as price action flubs the 200-hour Exponential Moving Average (EMA) at 1.2721, with further declines on the cards if a bullish rebound isn’t scraped together.
Daily candles are hardening a bearish rejection from a supply zone above the 1.2800 handle, and declines are on pace to return to the 200-day EMA rising through 1.2580. Technical support from the 50-day EMA at 1.2674 is weakening, and a full-on bearish push will drag GBP/USD back down to 2024 lows at the 1.2300 level.
GBP/USD hourly chart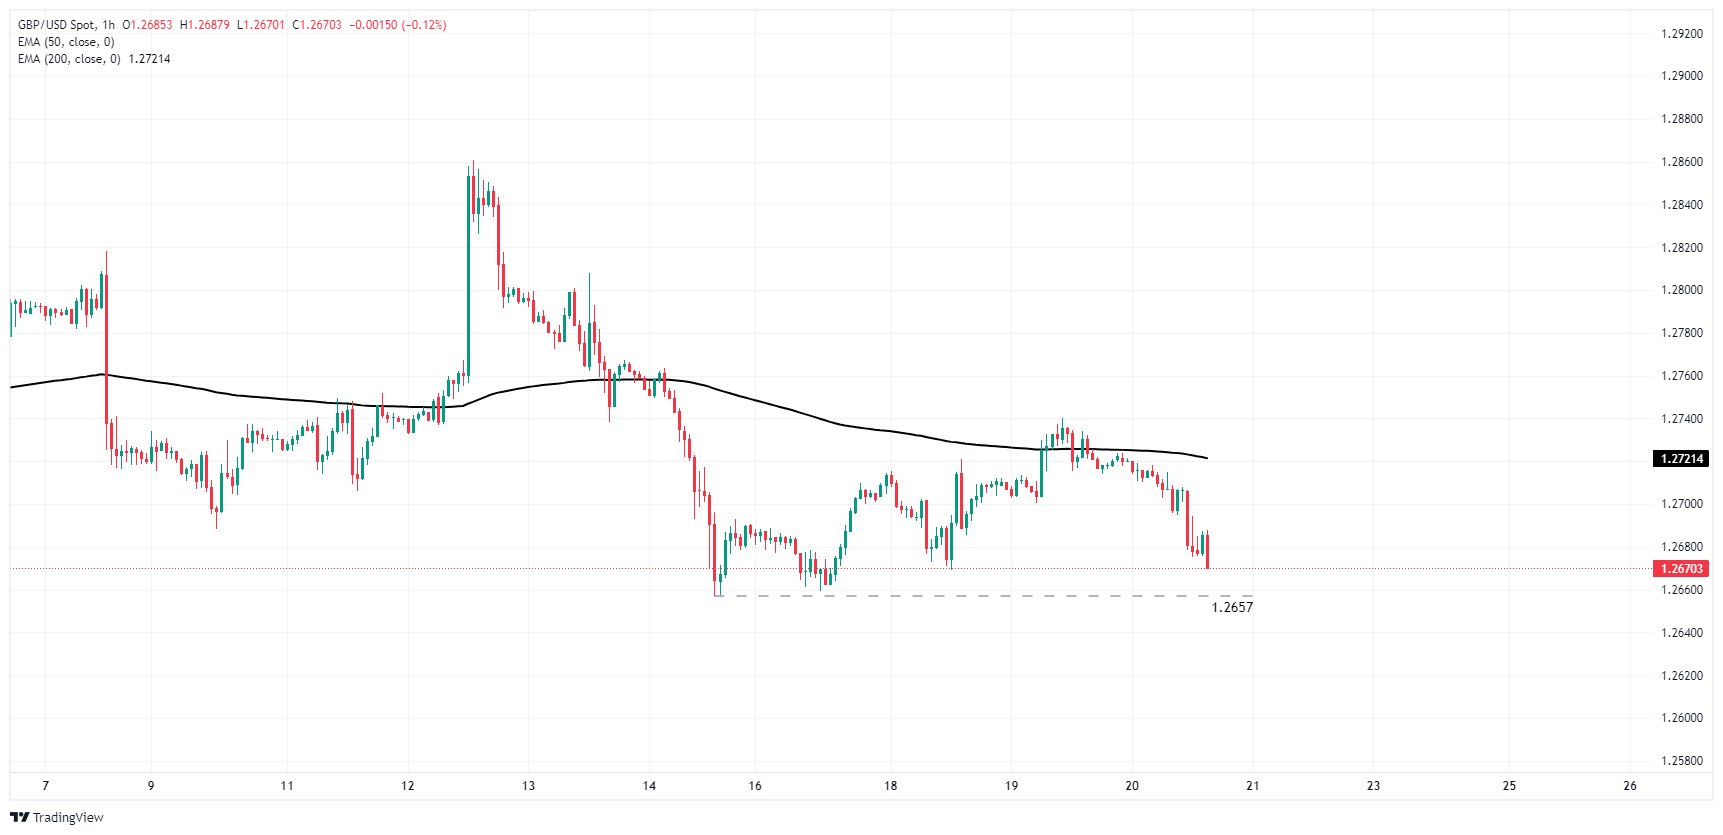
GBP/USD daily chart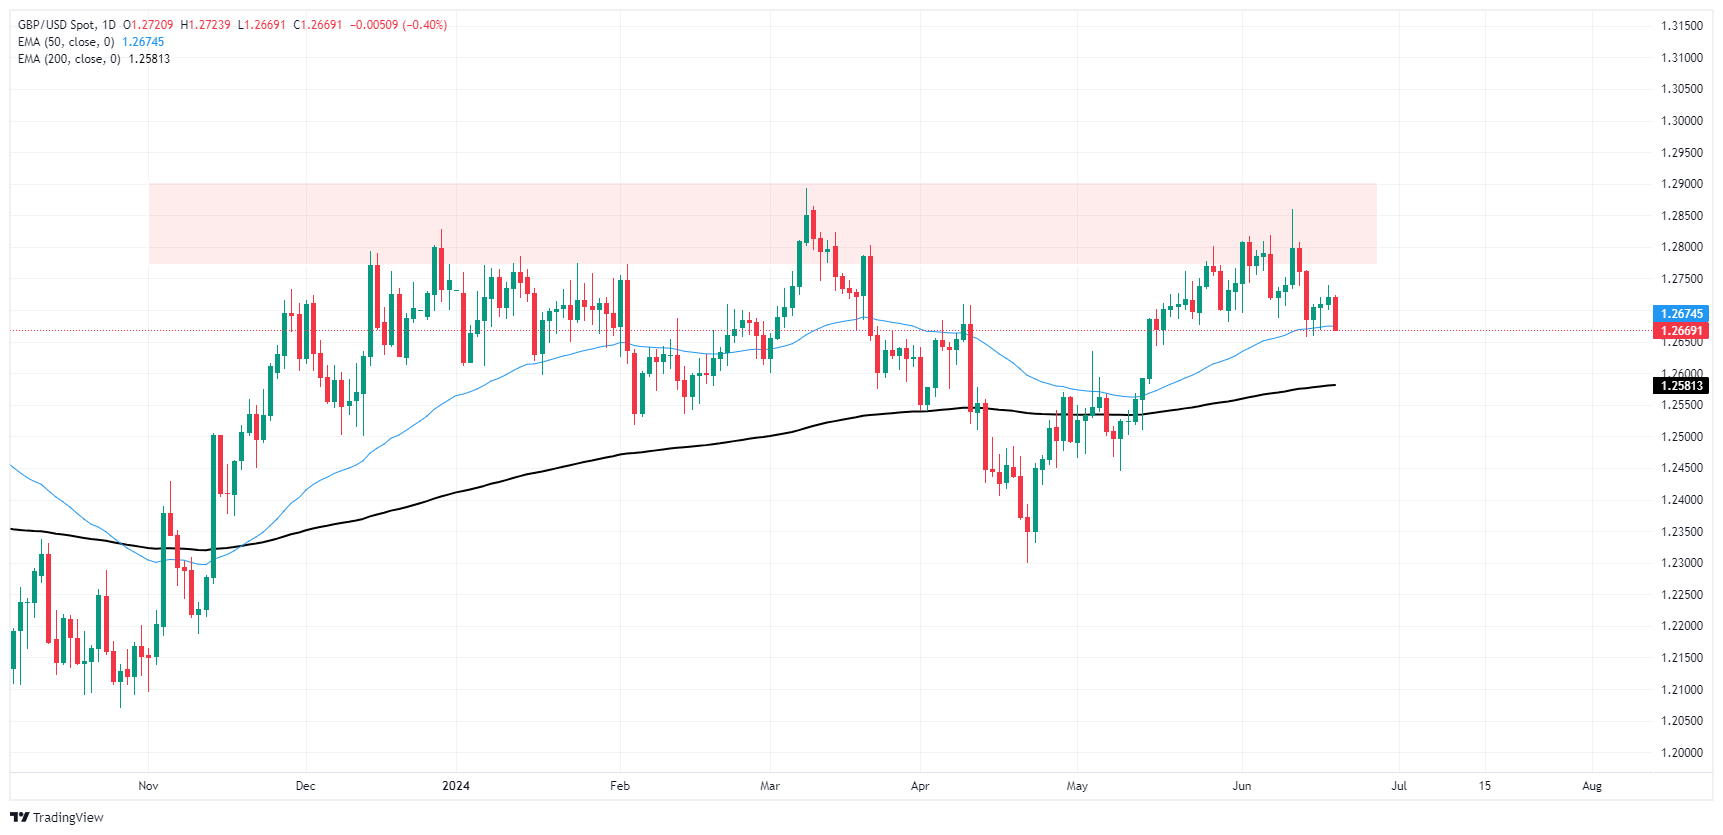
Pound Sterling FAQs
The Pound Sterling (GBP) is the oldest currency in the world (886 AD) and the official currency of the United Kingdom. It is the fourth most traded unit for foreign exchange (FX) in the world, accounting for 12% of all transactions, averaging $630 billion a day, according to 2022 data. Its key trading pairs are GBP/USD, aka ‘Cable’, which accounts for 11% of FX, GBP/JPY, or the ‘Dragon’ as it is known by traders (3%), and EUR/GBP (2%). The Pound Sterling is issued by the Bank of England (BoE).
The single most important factor influencing the value of the Pound Sterling is monetary policy decided by the Bank of England. The BoE bases its decisions on whether it has achieved its primary goal of “price stability” – a steady inflation rate of around 2%. Its primary tool for achieving this is the adjustment of interest rates. When inflation is too high, the BoE will try to rein it in by raising interest rates, making it more expensive for people and businesses to access credit. This is generally positive for GBP, as higher interest rates make the UK a more attractive place for global investors to park their money. When inflation falls too low it is a sign economic growth is slowing. In this scenario, the BoE will consider lowering interest rates to cheapen credit so businesses will borrow more to invest in growth-generating projects.
Data releases gauge the health of the economy and can impact the value of the Pound Sterling. Indicators such as GDP, Manufacturing and Services PMIs, and employment can all influence the direction of the GBP. A strong economy is good for Sterling. Not only does it attract more foreign investment but it may encourage the BoE to put up interest rates, which will directly strengthen GBP. Otherwise, if economic data is weak, the Pound Sterling is likely to fall.
Another significant data release for the Pound Sterling is the Trade Balance. This indicator measures the difference between what a country earns from its exports and what it spends on imports over a given period. If a country produces highly sought-after exports, its currency will benefit purely from the extra demand created from foreign buyers seeking to purchase these goods. Therefore, a positive net Trade Balance strengthens a currency and vice versa for a negative balance.
- EUR/GBP is moving up to a gap in the price charts formed when prices were rapidly selling-off earlier in June.
- There is a possibility it could fill the gap if it continues higher.
- A roughly equal risk exists that EUR/GBP resuming its prior downtrend and making new lows.
EUR/GBP has recovered after breaking out of the range that it was trading in, in late May and falling steeply.
EUR/GBP 4-hour Chart
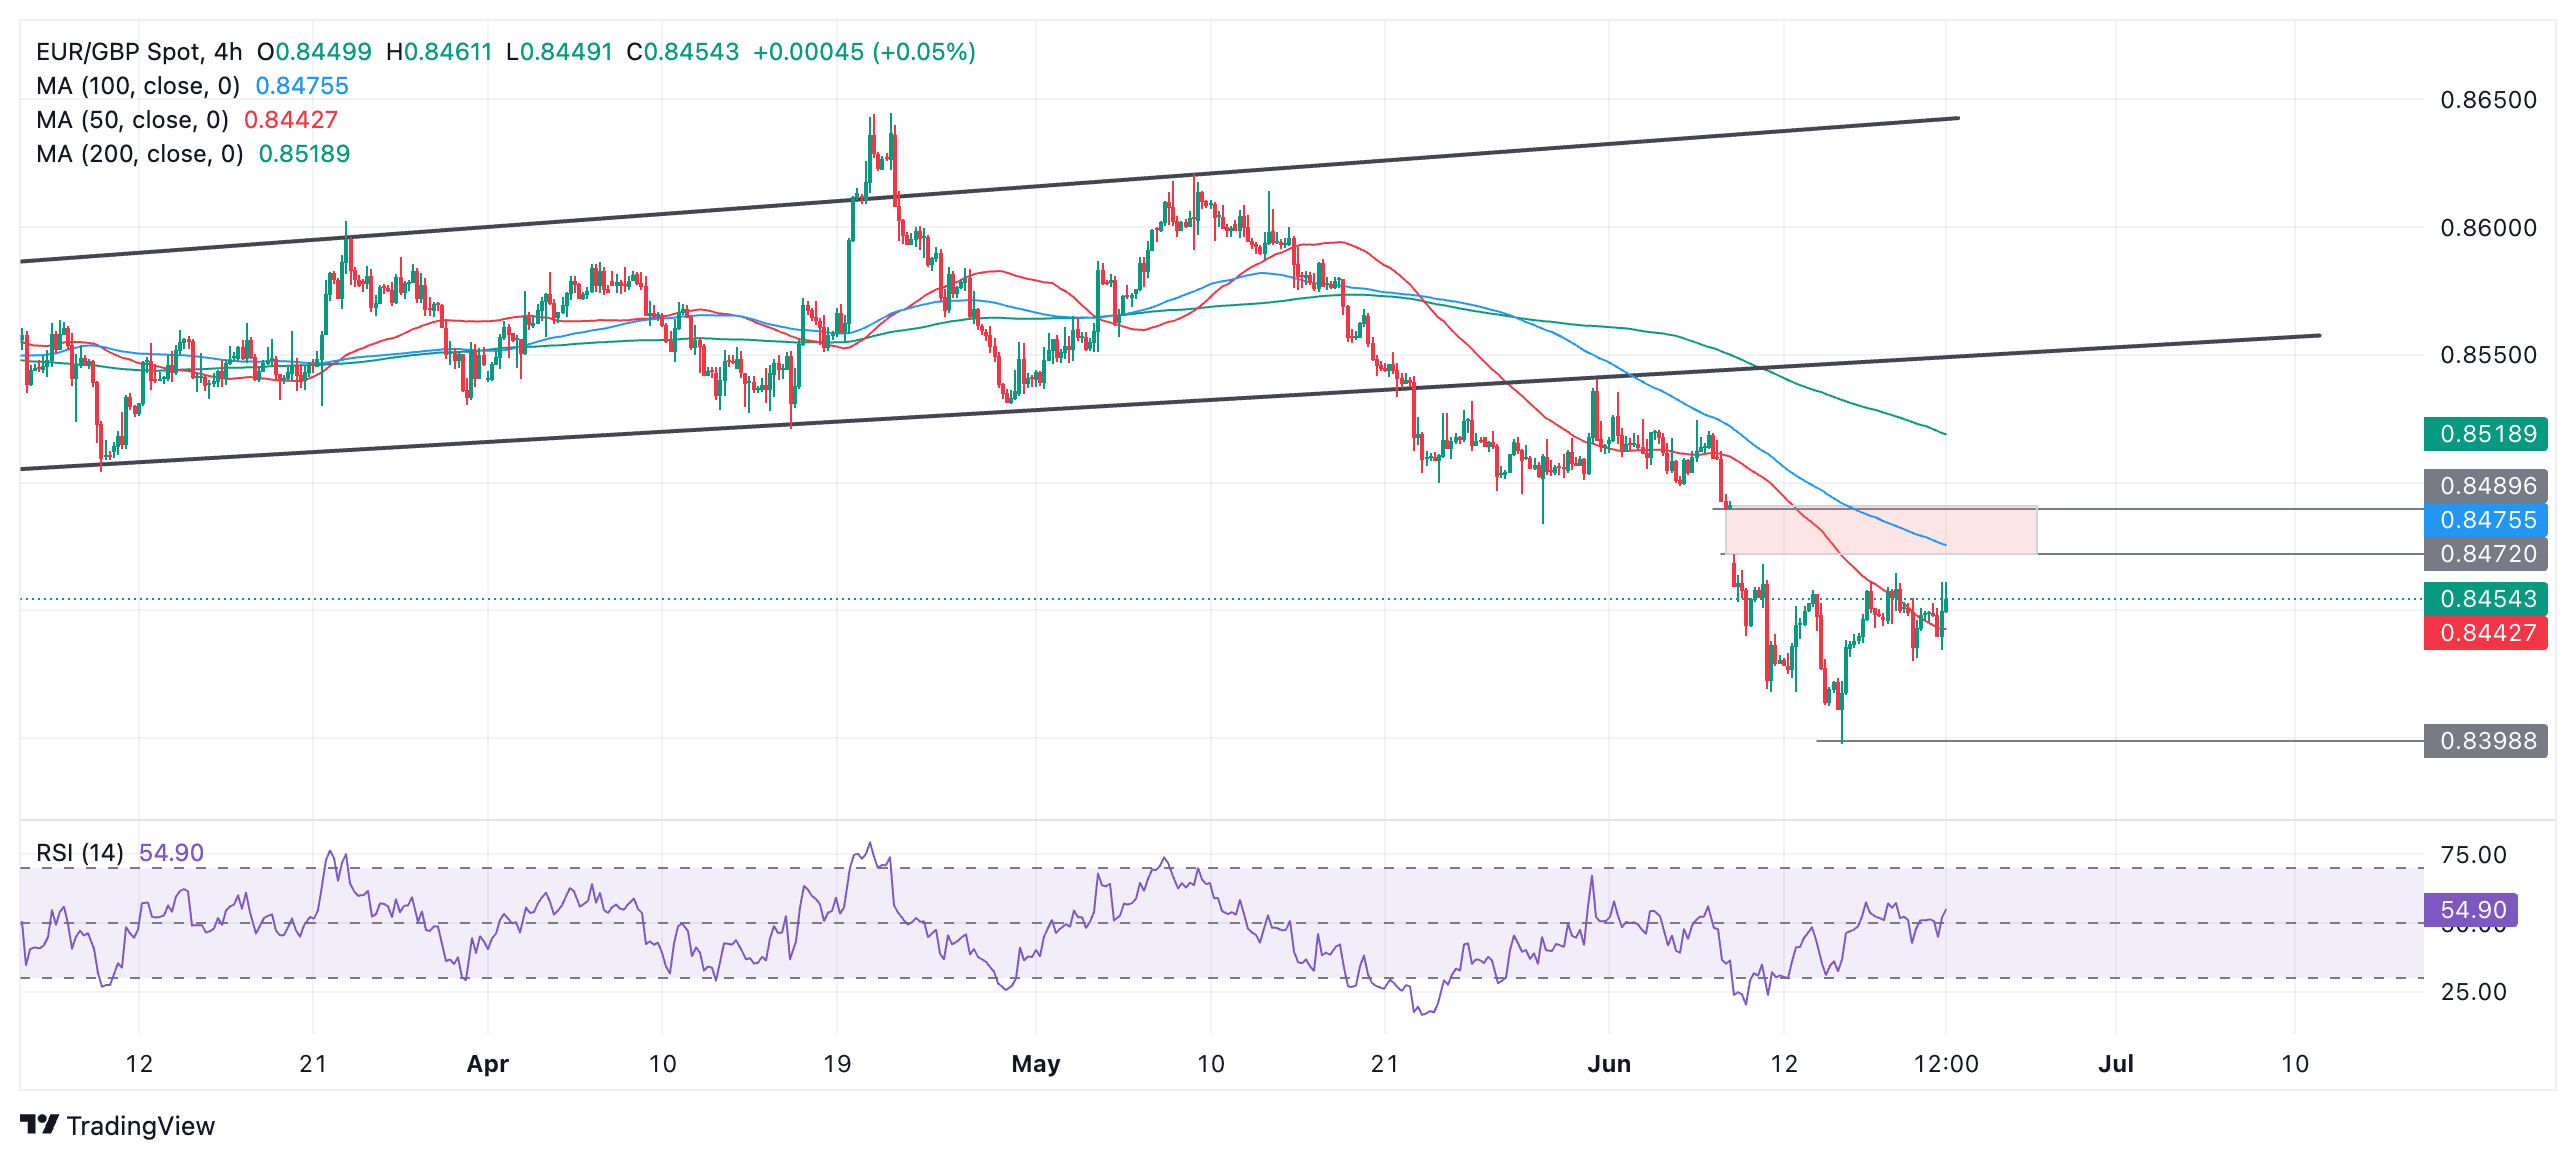
During the steep decline the pair formed a gap in price (red shaded area). There is a saying amongst traders that “gaps like to get filled” and there is a chance price could now rise up and close this gap. A break above the 0.8468 high would probably confirm a closing of the gap between 0.8472 and 0.8490.
The direction of the short-term trend is in doubt since the recovery from the June 14 lows at 0.8397. On the one hand it could be argued that it is still bearish and prices could capitulate and fall at any moment.
On the other hand there is the effect of the price gap which could draw prices higher.
If EUR/GBP does roll over and resume its short-term downtrending bias, a break below 0.8397 would see the pair fall to the next downside target at 0.8340 (August 2022 low).
FX will be dominated by two key themes over the coming months. The first is the prospect of Marine Le Pen’s RN party coming to government. The second are welcome signs of US disinflation, which will give the Federal Reserve (Fed) enough confidence to start cutting rates in September, Chris Turner, Global Head of Markets at ING noted.
EUR/CHF proves a cleaner vehicle to hedge against election risk
“Crosswinds in the FX market suggest EUR/USD should stay volatile within ranges – although probably with a downside bias this month as investors reduce euro exposure ahead of French elections on 30 June and 7 July. EUR/CHF is proving a cleaner vehicle to hedge against election risk and looks to press 0.9500.”
“On the subject of rate cuts, we see downside risks to sterling this month when UK May CPI likely comes in lower and the Bank of England signals it is ready to cut rates in August. This could send EUR/GBP back above 0.85 again.”
“And in the rest of the G10 space, our preference would be for outperformance of the commodities currencies whose central banks are last in the queue to cut rates – step forward the Australian dollar.”
The Bank of England (BoE) kept rates on hold, but comments in the statement and minutes suggest officials are getting closer to cutting interest rates despite some recent unwelcome services inflation figures. The latest post-meeting statement is slightly dovish, ING Developed Markets Economist James Smith notes.
Pund Sterling to trade back under 1.2500
“The Bank of England has voted 7-2 in favour of keeping rates at 5.25% for another month. No surprises there, but in the limited comments we got from the Bank today, this is a statement that reads more dovish than we suspect many investors might have expected.”
“The probability of an August rate cut has inched up from 40% to 60% in the minutes since. The fact that there wasn't a larger repricing is probably because the Bank didn't change its forward guidance. And for us, August rate cut is our base case.”
“News that the views of some of those voting for unchanged rates today were ‘finely balanced’ was enough to generate a little bullish steepening of the Gilt curve and a modestly weaker pound. The minutes are slightly bearish for the pound. We expect it to trade back under 1.25.”
The Bank of England (BoE) left the policy rate at 5.25%, as expected by almost everyone in the market. Upcoming elections still weigh heavy on the market sentiment, Stefan Koopman, Senior Macro Strategist at Rabobank, notes.
BoE leaves rate unchanged
“The Bank of England’s MPC maintained the policy rate at 5.25%, a decision that was ‘finely balanced’ for some members. The vote concluded with a 7-2 split, in line with expectations.”
“The central bank appears to be preparing the markets for a first rate cut in August, which continues to be our base case. We have, however, removed a subsequent September cut from our forecasts. This follows yesterday’s services inflation data which remains a concern with notable differences of opinion within the MPC.”
“BoE Governor Andrew Bailey didn’t add additional color to this meeting outcome and the pre-election purdah means we will hear nothing from members until after July 4. The Conservatives will pay the price for the surge in inflation and the incoming Labour government is going to take credit for the upcoming rate cuts.”
Bank of England (BoE) left the Bank Rate unchanged at 5.25% as widely expected, but delivering a slight dovish twist, Danske Bank’s Analyst Kirstine Kundby-Nielsen notes.
BoE delivers a dovish twist, hinting at August cut
“At today's monetary policy meeting the BoE left the Bank Rate unchanged at 5.25% as widely expected.”
“As we expected, the BoE retained much of its previous guidance but delivered a slight dovish twist, laying the groundwork for an August cut.”
“Following the release of the statement, EUR/GBP moved higher on the dovish twist from the statement. By extension and combined with the political uncertainty in France, this also acts as a downside risk to our EUR/GBP forecast of 0.88 in 6-12 months.”
While industrial metal prices found some support, the hopes for fresh Chinese stimulus are failing to generate any material upside for the time being, TD Securities Senior Commodity Strategist Ryan McKay argues.
Chinese stimulus fails to push industrial metals up
“Our gauge of commodity demand is weakening amid a precarious global macro landscape, and our return decompositions across the complex confirm the demand side is finally starting to weigh heavy on the metals as the early summer euphoria fades.”
“Inflows into broad commodity ETFs throughout May had lifted the complex, but an easing of inflows and modest outflows have also started to weigh on the base metal complex. In this sense, AUM for base metal specific ETFs have also notably declined.”
“For Copper, our return decomposition framework is also showing a major drag from idiosyncratic factors, such as positioning, which suggests that the Red Metal could still be prone to additional downside in the near-term as bloated positions are cut. Copper could see some length added back at prices above $9,854/t.”
Shanghai Futures Exchange (SHFE) continue to hold large positions in Gold (XAU/USD) and Silver (XAG/USD). Commodity Trading Advisors (CTAs) are set to add +16% to their historic max length in Platinum, TDS Senior Commodity Strategist Ryan McKay notes.
Precious Metals gain bullish traction
“Precious metals are gaining ground as the Chinese Yuan fix was its weakest since November. Top traders on the SHFE continue to hold large positions in Gold and Silver, while inflows continue into Chinese Gold ETFs.”
“In the West, traders are watching the data like hawks. Macro investors have remained underpositioned in the Yellow Metal relative to a typical cutting cycle and macro traders seem to be happy waiting on the sidelines until there is more certainty on the timing of the coming Fed cuts.”
“Looking forward, as a trend of weakening data begins to form, these investors will be more likely to enter the fray, which could ultimately be the next catalyst needed for another leg higher. Elsewhere, CTAs are set to double their net long position in Platinum, adding +16% of historic max length with all signals now firing long in the metal.”
- GBP/USD edges down 0.30%, following the Bank of England's rate decision.
- Technical outlook shows neutral to upward bias, with critical support at 1.2643/38.
- Resistance levels to watch: 1.2700, 1.2739, and 1.2800. Support levels include 1.2619, 1.2600, and 200-DMA at 1.2551.
The Pound Sterling collapsed during the North American session, below the 1.2700 figure after the Bank of England (BoE) decided to keep rates unchanged but hinted at a possible cut in the summer. The GBP/USD trades at 1.2677, down 0.30%.
GBP/USD Price Analysis: Technical outlook
From a technical perspective, the GBP/USD is neutral to upward biased, but as it approaches the confluence of the 100-day moving average (DMA) and the May 3 high turned support at around 1.2643/38, a pierce underneath that zone, would accelerate the downtrend, change the pair bias and challenge the 50-DMA at 1.2619. Further losses are seen underneath the atter at 1.2600, ahead of testing the 200-DMA at 1.2551.
On the other hand, if buyers lift the exchange rate above 1.2700, the GBP/USD might get to the current week's high of 1.2739. Once cleared, the next stop would be the already tested 1.2800 mark.
GBP/USD Price Action – Daily Chart
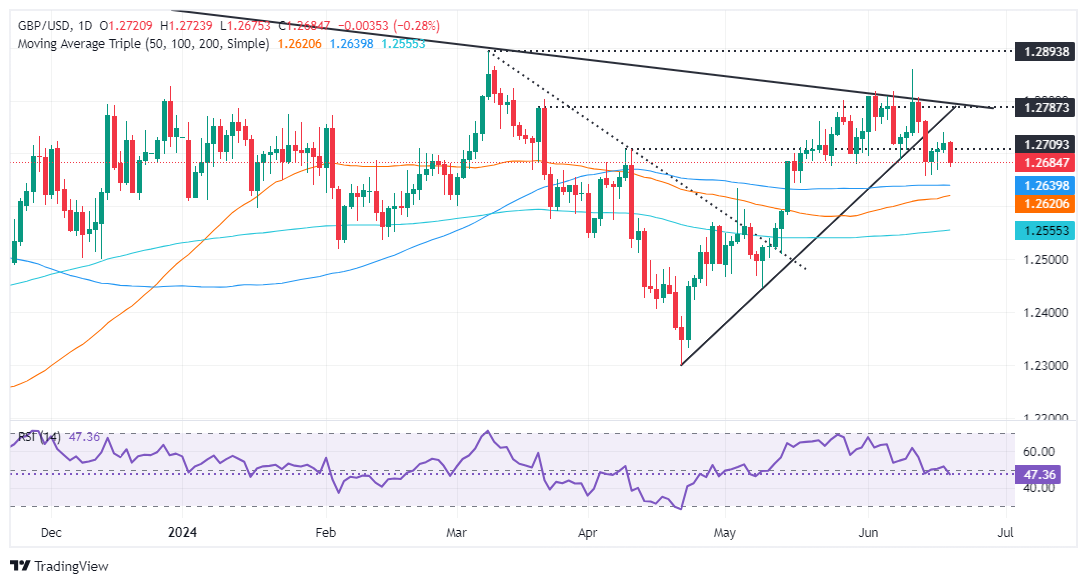
British Pound PRICE Today
The table below shows the percentage change of British Pound (GBP) against listed major currencies today. British Pound was the strongest against the Swiss Franc.
| USD | EUR | GBP | JPY | CAD | AUD | NZD | CHF | |
|---|---|---|---|---|---|---|---|---|
| USD | 0.13% | 0.29% | 0.35% | -0.12% | 0.00% | 0.03% | 0.74% | |
| EUR | -0.13% | 0.15% | 0.22% | -0.25% | -0.12% | -0.11% | 0.61% | |
| GBP | -0.29% | -0.15% | 0.06% | -0.39% | -0.27% | -0.26% | 0.45% | |
| JPY | -0.35% | -0.22% | -0.06% | -0.49% | -0.33% | -0.35% | 0.39% | |
| CAD | 0.12% | 0.25% | 0.39% | 0.49% | 0.11% | 0.13% | 0.85% | |
| AUD | -0.01% | 0.12% | 0.27% | 0.33% | -0.11% | 0.01% | 0.74% | |
| NZD | -0.03% | 0.11% | 0.26% | 0.35% | -0.13% | -0.01% | 0.72% | |
| CHF | -0.74% | -0.61% | -0.45% | -0.39% | -0.85% | -0.74% | -0.72% |
The heat map shows percentage changes of major currencies against each other. The base currency is picked from the left column, while the quote currency is picked from the top row. For example, if you pick the British Pound from the left column and move along the horizontal line to the US Dollar, the percentage change displayed in the box will represent GBP (base)/USD (quote).
- USD/CAD pulls back to support at the 50-day SMA.
- It is possible it could begin a recovery from this level.
- At the same time a break lower could turn the tables on bulls.
USD/CAD has continued pulling back after decisively breaking out of a Symmetrical Triangle (ST) pattern on the daily chart. The drip decline since the bullish upthrust on June 7 has taken price back down to the level of the 50-day Simple Moving Average (SMA) at 1.3696, and the upper trendline of the ST.
USD/CAD Daily Chart
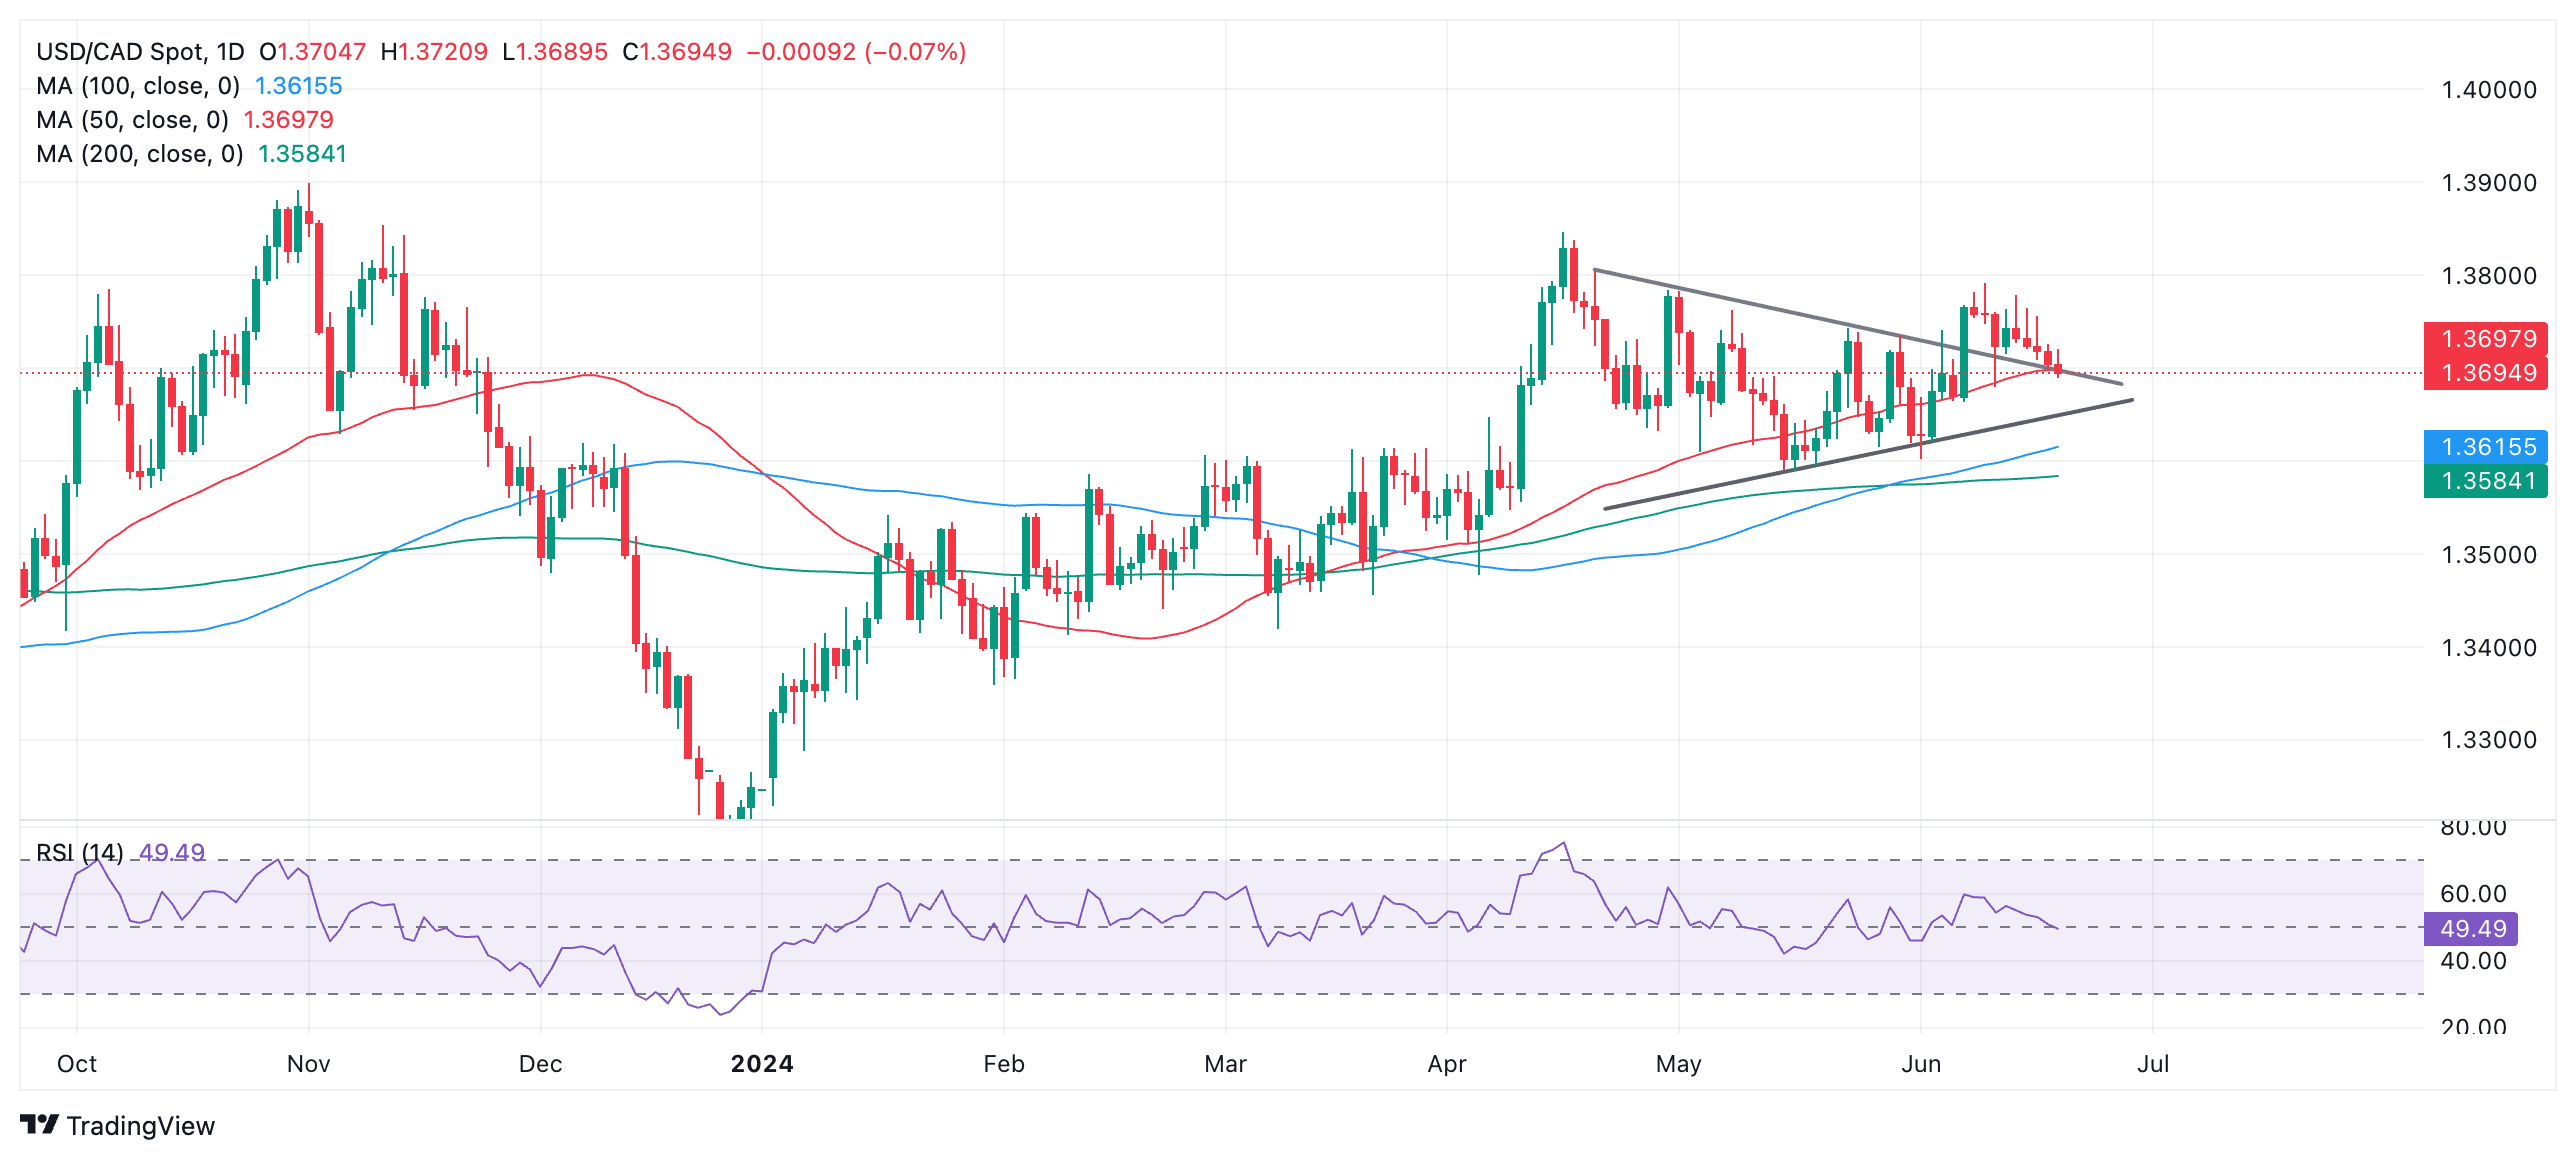
USD/CAD will probably find support at the 50-day SMA and upper borderline and, if so, it is possible this could mark the beginning of a recovery.
The original breakout of the Symmetrical Triangle on June 7, activated some bullish upside targets for the pattern. The conservative target lies at roughly 1.3881, which is the 0.618 Fibonacci extrapolation of the height of the ST at its widest from the breakout point higher.
A more bullish target lies at 1.3978, the 100% extrapolation of the height of the ST northwards.
Although price action has been bearish since the June 7 breakout, with seven out of the last eight days closing lower, the odds continue to favor a resumption of the initial move higher. A break above 1.3791 (June 11 high) would provide bullish confirmation.
However, a break below 1.3663 (June 7 low) would bring into doubt the uptrending bias.
Furthemore, a break below the lower trendline of the ST at roughly 1.3640 would suggest a reversal lower, with such a move expected to reach a target at roughly 1.3518, the Fibonacci 0.618 ratio of the height of the Symmetrical Triangle pattern extrapolated lower.
Bank of England meeting didn’t surprise the market and was unphased by this week's stronger than anticipated service inflation data, Pooja Kumra, Senior European & UK Rates Strategist at TDS, notes.
BoE meeting comes with close to no surprises
“Today's BoE meeting came with minimal surprises, with the MPC keeping the Bank Rate on hold with an unchanged 7-2 vote as Ramsden and Dhingra continue to favor a cut.”
“Markets appear relieved that this week's stronger than anticipated service inflation data did not derail the MPC's rate cut cycle guidance. In fact, the Committee also acknowledged that the stronger than anticipated service inflation was driven by one-off pay factors.”
“The front-end is now pricing in around 15bp in cuts for August meeting and around 50bp in total for 2024. We believe risks could be 'finely' balanced as there is still a lot of information markets need to absorb ahead of the next meeting, including elections on July 4 and CPI data on July 17.”
- USD/JPY is in a long, intermediate and short-term uptrend.
- The pair is reaching the “intervention zone” where the Japanese authorities previously intervened.
- As such, there is a growing risk of intervention occurring again and a correction evolving.
USD/JPY is currently trading in the 158.50s as it continues rising up in an ascending channel. It is now quite close to 160.32, the April 26 high – its highest level since 1986.
USD/JPY Weekly Chart
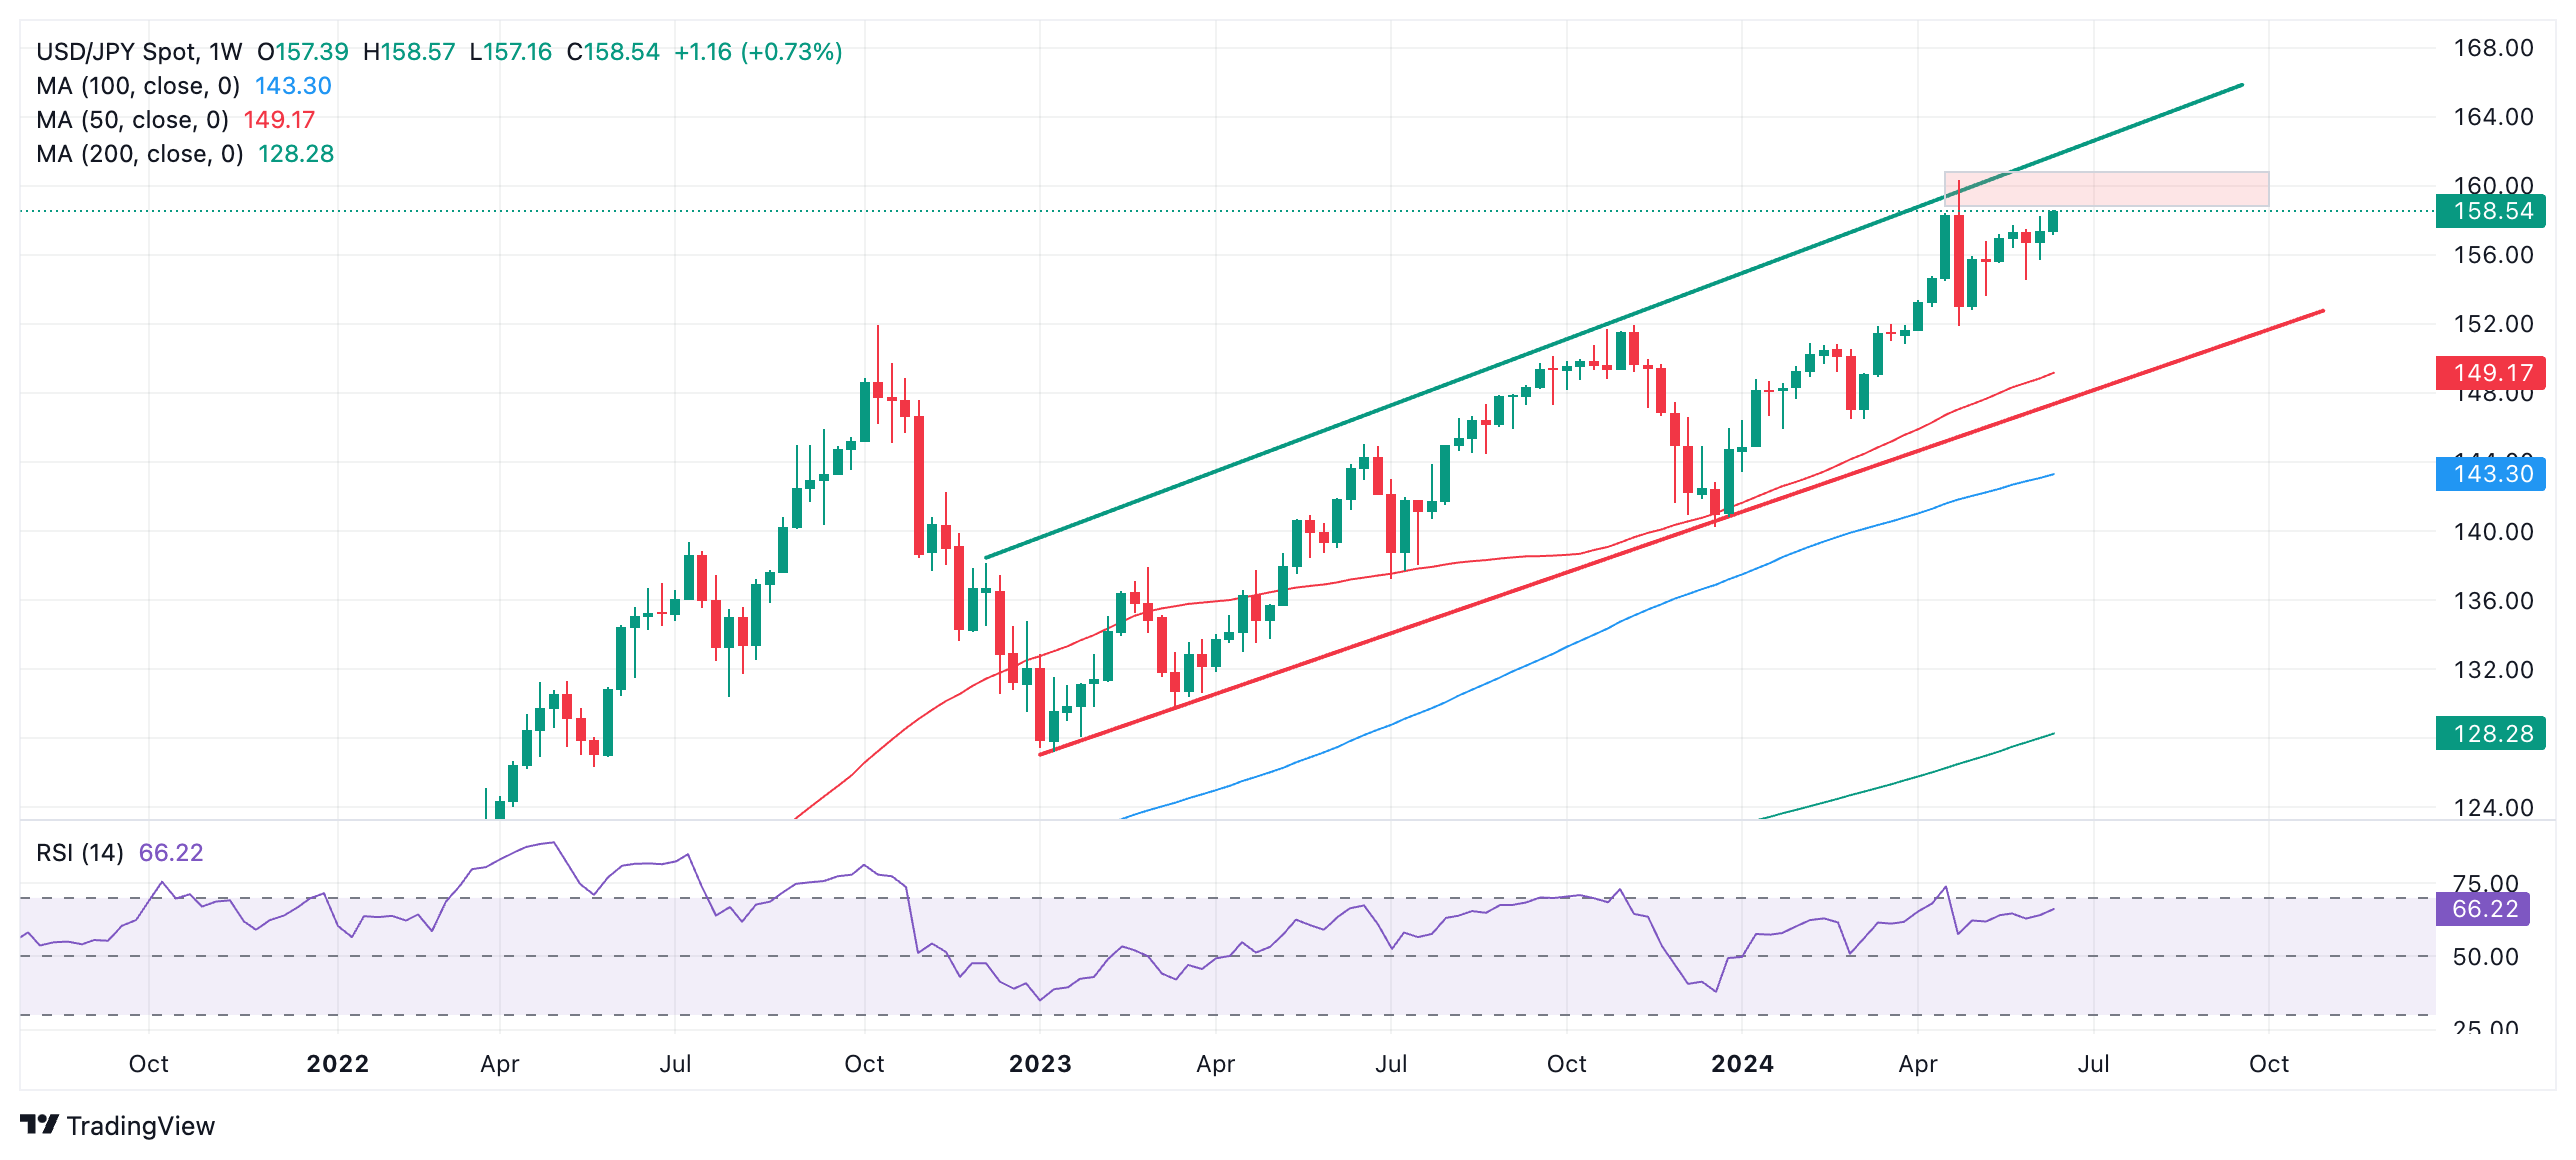
USD/JPY is now close to the “intervention zone” (red shaded band) around where the Japanese authorities intervened to support the Yen on April 29 and May 2, according to data from the BoJ. This can be seen as the long red candle that represents the last week in April.
On Thursday, Japan’s top currency diplomat, Masato Kanda, warned, “The government will respond to excessive currency moves”, adding that, “There is no limit for forex intervention resources”.
From a purely technical point of view the trend is bullish on all time frames and given the saying that “the trend is your friend” it is more likely than not to continue higher.
However, the USD/JPY is a special case because of the high risk of market manipulation by the Japanese authorities. As such, traders should be cautious before assuming the pair will simply go higher as the trend extends.
Federal Reserve (Fed) Bank of Minneapolis President Neel Kashkari argued on Thursday that it will probably take a year or two to get inflation back to 2%, per Reuters.
Key takeaways
"Wage growth might still be a bit too high to get back to 2% right now."
"US economy has proven to be remarkably resilient."
"We are getting disinflation despite remarkable economic growth."
"Some evidence of some softening around edges of the economy."
Market reaction
These comments failed to trigger a significant market reaction. At the time of press, the US Dollar Index was up 0.23% on the day at 105.45.
- Initial Jobless Claims rose by 238K vs. the previous week.
- Continuing Jobless Claims increased by more than 1.80M.
US citizens that applied for unemployment insurance benefits increased by 238K in the week ending June 15 according to the US Department of Labor (DoL) on Thursday. The prints surpassed initial estimates (235K) and came in a tad lower than the previous weekly gain of 243K (revised from 242K).
Further details of the publication revealed that the advance seasonally adjusted insured unemployment rate was 1.2% and the 4-week moving average was 232.75K, an increase of 5.5K from the previous week's unrevised average.
In addition, Continuing Claims increased by 15K to 1.828M in the week ended June 8.
Market reaction
The US Dollar Index (DXY) trades with decent gains near the 105.40 region, partially reversing the recent multi-session pullback in the wake of the release of weekly claims.
- The US Dollar trades mildly in the green after China fixes its Yuan at the lowest level since November.
- Markets gear up for two data-packed days in the US.
- The US Dollar index trades broadly sideways, keeping its head above 105.00.
The US Dollar (USD) trades mildly in the green on Thursday, advancing against most major peers with exceptions such as the Japanese Yen (JPY) and the Swiss Franc (CHF) when it was trading ahead of its Swiss National Bank (SNB) rate decision which triggered a reversal now . The Greenback appears to be supported by the broad risk-off market mood, with traders concerned as the People’s Bank of China (PBoC) has set the Yuan’s reference rate at 7.1192 against the US Dollar, its weakest level since November.
On the US economic data front, the schedule resumes after the brief hiatus due to the Juneteenth public holiday. Per usual on Thursday, the weekly Jobless Claims will be on the forefront after numbers started to tick up last week. The Philadelphia Fed Manufacturing Survey will be the second focal point.
Daily digest market movers: Asia moving markets
- An eventful Asia-Pacific session triggered substantial moves in the Forex space:
- The People’s Bank of China (PBoC) has let loose its daily fixing, weakening to a fresh low for 2024 against the US Dollar.
- The New Zealand Dollar (NZD/USD) advanced substantially against the Greenback after the country’s economy expanded by 0.2% in the first quarter, which means the country is out of its brief technical recession.
- Asian equities rolled over with concerns that the Chinese economy might be doing worse than markets anticipated, seeing the actions from the PBoC to devalue its currency.
- A big batch of data will be released at 12:30 GMT:
- May’s Building Permits and Housing Starts:
- Building Permits are expected to tick up to 1.45 million from 1.44 million.
- Housing Starts should paint a similar picture as the permits, with an uptick from 1.37 million units to 1.36 million.
- Weekly Jobless Claims:
- Initial Claims are expected to ease to 235,000 from 242,000.
- Continuing Claims should abate as well, to 1.81 million from 1.82 million.
- An uptick in Jobless Claims would mean a second consecutive week of increases, possibly triggering some US Dollar weakness.
- The Philadelphia Fed Manufacturing Survey for June should tick up from 4.5 to 5.
- May’s Building Permits and Housing Starts:
- Two US Federal Reserve Speakers to look out for was well this Thursday:
- At 12:45 GMT, Federal Reserve Bank of Minneapolis President Neel Kashkari participates in a fireside chat as part of the Michigan Bankers Association Annual Conference.
- Near 20:00 GMT, Federal Reserve Bank of Richmond President Thomas Barkin participates in a conversation and Q&A session about the economic outlook at the Richmond Risk Management Association.
- Equities are rolling over with red numbers across Asia. European and US futures are snapping that negativeness and are in the green after the European opening bell.
- The CME Fedwatch futures for September are further backing in a rate cut, with odds now standing at 59.5% for a 25 basis point cut. A rate pause stands at a 34.1% chance, while a 50-basis-point rate cut has a slim 6.4% possibility.
- The US 10-year benchmark rate is trading at 4.24%, right in the middle of this week’s range.
US Dollar Index Technical Analysis: It never was going to be easy
The US Dollar Index (DXY) is putting up a heavy fight, with a bit of a thank you to the Asian uncertainty after the PBoC let loose its stronger Yuan fixing. With concerns growing that there might be something brewing in China with more monetary policy coming in, some slumbering support for the DXY could linger on and limit any substantial downturns.
On the upside, there are no big changes to the levels traders need to watch out for. The first is 105.52, a barrier that held during most of April. The next level to watch is 105.88, which triggered a rejection at the start of May and will likely play its role as resistance again. Further up, the biggest challenge remains at 106.51, the year-to-date high from April 16.
On the downside, the trifecta of Simple Moving Averages (SMA) is still playing as support. First is the 55-day SMA at 105.14, safeguarding the 105.00 figure. A touch lower, near 104.61 and 104.48, both the 100-day and the 200-day SMA are forming a double layer of protection to support any declines. Should this area be broken, look for 104.00 to salvage the situation.
US Dollar FAQs
The US Dollar (USD) is the official currency of the United States of America, and the ‘de facto’ currency of a significant number of other countries where it is found in circulation alongside local notes. It is the most heavily traded currency in the world, accounting for over 88% of all global foreign exchange turnover, or an average of $6.6 trillion in transactions per day, according to data from 2022. Following the second world war, the USD took over from the British Pound as the world’s reserve currency. For most of its history, the US Dollar was backed by Gold, until the Bretton Woods Agreement in 1971 when the Gold Standard went away.
The most important single factor impacting on the value of the US Dollar is monetary policy, which is shaped by the Federal Reserve (Fed). The Fed has two mandates: to achieve price stability (control inflation) and foster full employment. Its primary tool to achieve these two goals is by adjusting interest rates. When prices are rising too quickly and inflation is above the Fed’s 2% target, the Fed will raise rates, which helps the USD value. When inflation falls below 2% or the Unemployment Rate is too high, the Fed may lower interest rates, which weighs on the Greenback.
In extreme situations, the Federal Reserve can also print more Dollars and enact quantitative easing (QE). QE is the process by which the Fed substantially increases the flow of credit in a stuck financial system. It is a non-standard policy measure used when credit has dried up because banks will not lend to each other (out of the fear of counterparty default). It is a last resort when simply lowering interest rates is unlikely to achieve the necessary result. It was the Fed’s weapon of choice to combat the credit crunch that occurred during the Great Financial Crisis in 2008. It involves the Fed printing more Dollars and using them to buy US government bonds predominantly from financial institutions. QE usually leads to a weaker US Dollar.
Quantitative tightening (QT) is the reverse process whereby the Federal Reserve stops buying bonds from financial institutions and does not reinvest the principal from the bonds it holds maturing in new purchases. It is usually positive for the US Dollar.
- Oil holds above $80 on Thursday, setting forth another profitable weekly performance.
- Traders keep prices supported as tensions in the Middle East intensify.
- The US Dollar Index trades back around 105.50 amid rising safe-haven inflows.
Oil price is shooting higher for a second week in a row and holds above $80 on Thursday after tensions in the Middle East are mounting again. On Tuesday, Israel signed off on plans to launch a Lebanon offensive with the motivation of trying to wipe out Hezbollah. Meanwhile, a Greek freight ship sank on Wednesday after Houthi rebels attacked it with a drone in the Red Sea.
Meanwhile, the US Dollar Index (DXY) is trading back near 105.50 after some easing earlier this week on the back of weak US Retail Sales data for May. The Greenback is picking up power, though, on Thursday, as markets are concerned after the People’s Bank of China (PBoC) let loose its overnight Yuan fixing against the Greenback, opening up for some devaluation against the US Dollar. Markets are picking this up as a sign of concern about more easing and interventions from PBoC.
At the time of writing, Crude Oil (WTI) trades at $80.58 and Brent Crude at $84.56
Oil news and market movers: Houthi rebels at it again
- Houthi rebels have sunk a Greek freight ship in the Red Sea by using an unmanned drone missile on Wednesday, Reuters reported.
- For a fourth straight month, China has imported nearly 284,000 tons of Venezuelan crude Oil despite implied US embargoes, Boomberg reports.
- At 15:00 GMT, the US stockpile change for the week ending June 14 from the Energy Information Administration (EIA) will be published. The previous release was a build of 3.73 million barrels, with a drawdown of 2 million expected for this week.
- Tropical storm Alberto is nearing the West Gulf Coast and could cause brief Crude supply disruptions out of the region on the back of it.
Oil Technical Analysis: Brief bullish elements
Oil price is shooting higher on a mixture of data which tilts to the bullish side. With hurricane season starting to get underway in the US, Houthi rebels sinking a ship in the Red Sea, and Israel set to pursue its military actions by entering Lebanon, traders have a buffet of elements to pick from, which are cause enough to jack up oil prices. Should the EIA print on Thursday show another significant drawdown, crude prices could jump into a new price range, higher.
On the upside, the red descending trend line near $81.00 is the last cap remaining before entering a new price region not seen since April. A break above the trend line would open room for a move back up to $87.12, the year-to-date high (April 5). Previously, a relatively small pivotal level would act as resistance near $84.00.
On the downside, the big belt of Simple Moving Averages (SMA) should work now as support and no longer allow to see moves below it. That means the 55-day SMA at $79.87, the 100-day SMA at $79.39, and the 200-day SMA at $79.03 should no longer see any dips below $79.00. Should those levels not hold, another drop back to $75 could be inevitable.
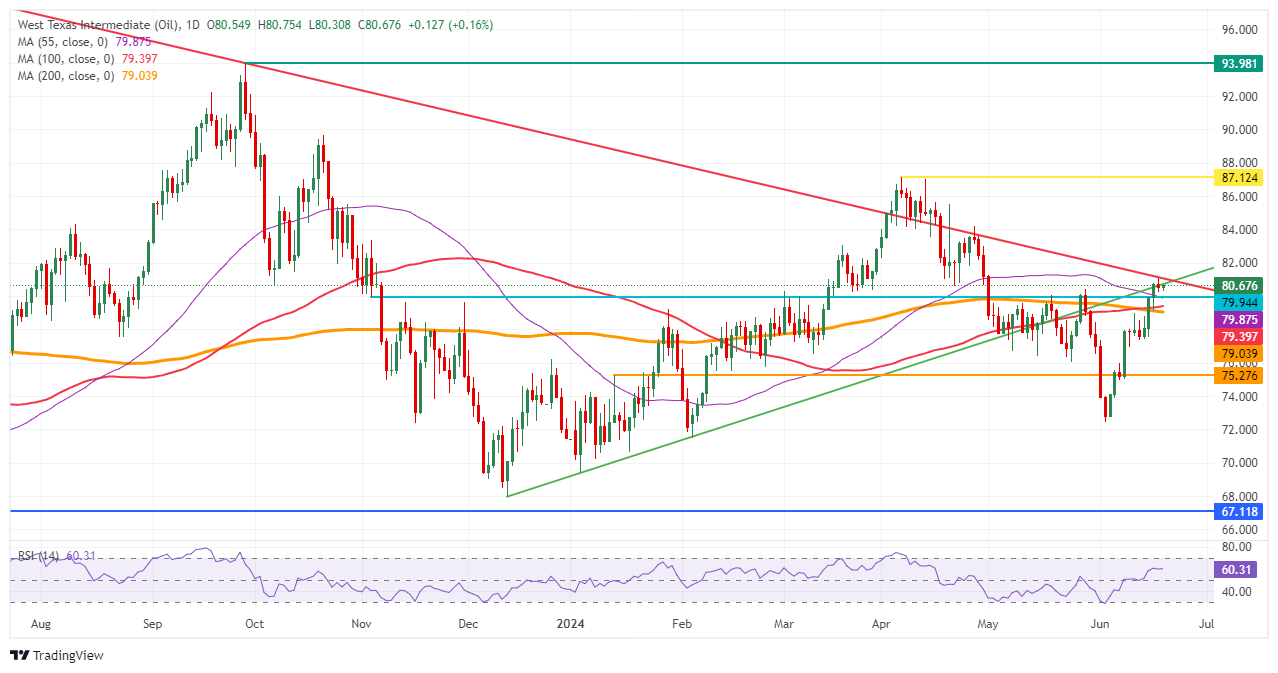
US WTI Crude Oil: Daily Chart
WTI Oil FAQs
WTI Oil is a type of Crude Oil sold on international markets. The WTI stands for West Texas Intermediate, one of three major types including Brent and Dubai Crude. WTI is also referred to as “light” and “sweet” because of its relatively low gravity and sulfur content respectively. It is considered a high quality Oil that is easily refined. It is sourced in the United States and distributed via the Cushing hub, which is considered “The Pipeline Crossroads of the World”. It is a benchmark for the Oil market and WTI price is frequently quoted in the media.
Like all assets, supply and demand are the key drivers of WTI Oil price. As such, global growth can be a driver of increased demand and vice versa for weak global growth. Political instability, wars, and sanctions can disrupt supply and impact prices. The decisions of OPEC, a group of major Oil-producing countries, is another key driver of price. The value of the US Dollar influences the price of WTI Crude Oil, since Oil is predominantly traded in US Dollars, thus a weaker US Dollar can make Oil more affordable and vice versa.
The weekly Oil inventory reports published by the American Petroleum Institute (API) and the Energy Information Agency (EIA) impact the price of WTI Oil. Changes in inventories reflect fluctuating supply and demand. If the data shows a drop in inventories it can indicate increased demand, pushing up Oil price. Higher inventories can reflect increased supply, pushing down prices. API’s report is published every Tuesday and EIA’s the day after. Their results are usually similar, falling within 1% of each other 75% of the time. The EIA data is considered more reliable, since it is a government agency.
OPEC (Organization of the Petroleum Exporting Countries) is a group of 13 Oil-producing nations who collectively decide production quotas for member countries at twice-yearly meetings. Their decisions often impact WTI Oil prices. When OPEC decides to lower quotas, it can tighten supply, pushing up Oil prices. When OPEC increases production, it has the opposite effect. OPEC+ refers to an expanded group that includes ten extra non-OPEC members, the most notable of which is Russia.
- The Pound Sterling prints red bars lower on traders’ screens ahead of the Bank of England meeting.
- The bank is expected to leave interest rates unchanged, the Minutes and voting will be keenly eyed.
- Recent inflation data was mixed despite the headline rate hitting the BoE’s 2.0% target.
The Pound Sterling (GBP) trades marginally lower on Thursday just above the 1.2700 mark against the US Dollar (USD), ahead of the Bank of England (BoE) policy meeting, a key event for GBP pairs.
The BoE sets interest rates in the UK, which influence demand for Pound Sterling. Higher interest rates tend to appreciate the Pound by attracting more foreign capital inflows; the opposite is true of lower interest rates. The decisions of the BoE, therefore, heavily impact the Pound.
Pound Sterling awaits BoE decision
The Pound Sterling drops off a bit against the US Dollar as traders anticipate the big event for the day, the announcement of the BoE’s policy decision at the conclusion of its June meeting. The announcement is scheduled to take place at 11.00 GMT. The accompanying statement and meeting minutes will offer more background detail on the bank’s stance, as well as the division of voting. These in turn may impact the outlook for the future path of interest rates and, therefore, impact the Pound Sterling.
The market consensus is for there to be no rate cuts and a 7-2 split in the voting, with 2 favoring a cut. It is very rare for the BoE to change interest rates during an election campaign. BoE Governor Andrew Bailey himself said a rate cut at the meeting was, “neither ruled out nor a fait accompli”.
Despite UK Consumer Price Index (CPI) inflation data showing a fall to the BoE’s 2.0% target in May, higher inflation in other pockets of the economy continue to keep policymakers away from voting for a cut, with a first rate cut not likely until August.
“Over in the UK, there was another important milestone yesterday, as CPI inflation fell exactly in line with the Bank of England’s target, reaching +2.0% in May as expected,” says Jim Reid, Global Head of Macro Research at Deutsche Bank. “However, some of the details of the report were less favorable, as core CPI was higher at +3.5%, while services inflation surprised on the upside at +5.7% (vs. +5.5% expected), and that’s one of the stickier categories. As a result, investors dialed back the chance that the Bank of England would cut rates by the August meeting, with the chance falling from 52% to 34% by the close.”
On Thursday morning, Swiss Franc traders were handed some volatility to play with after the Swiss National Bank (SNB) decided to cut interest rates for the second time in a row to 1.25%. The decision, however, was widely expected, with two-thirds of economists polled by Reuters prior to the event saying they thought the SNB would cut. Still, the SNB decision does not particularly serve as an accurate barometer of what to expect from the BoE.
Technical Analysis: Pound Sterling lacks direction after breakdown runs out of steam
GBP/USD is pulling back after breaking below the (red) lower trendline of a rising channel. From a technical perspective, the trend in the short-term is unclear and the pair could either break lower or just as well recover.
GBP/USD Daily Chart
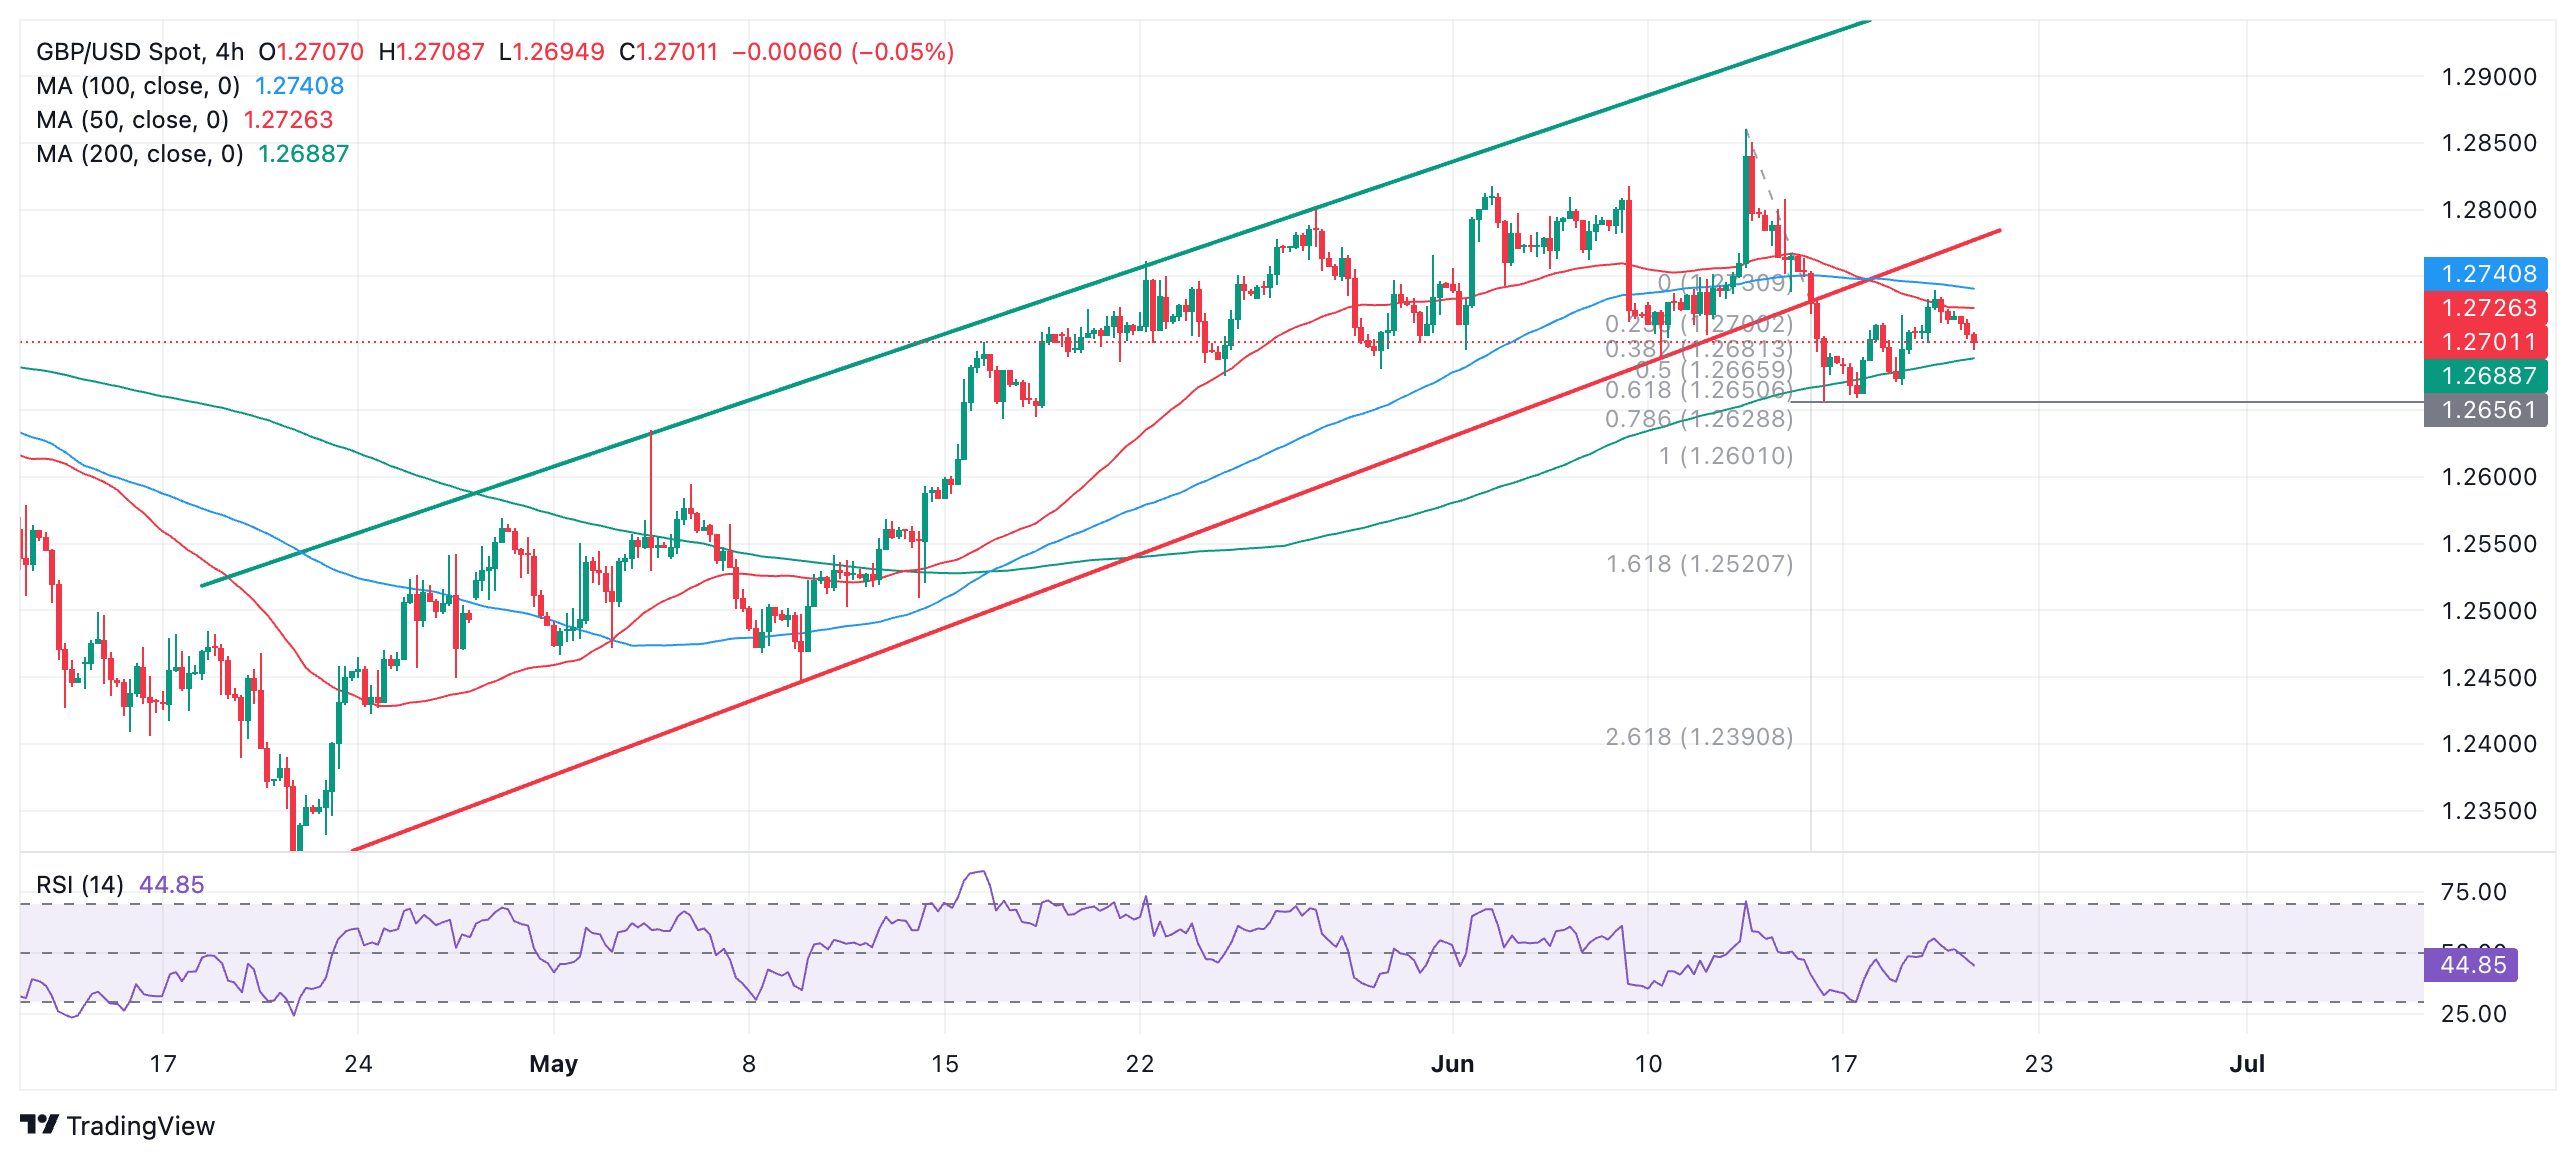
The sharp decline which saw GBP/USD break out of the bottom of the channel could be a sign the short-term trend is reversing. However, the lack of follow-through lower after the break cautions traders against getting too bearish.
A break below the 1.2657 level (June 14 low) would provide more evidence of a change to a more bearish short-term trend, with an initial target coming in at 1.2601, the extension of the height of the move prior to the break below the channel, extrapolated lower.
On the other hand, a break above the 100 Simple Moving Average (SMA) at 1.2740 could indicate the resumption of the prior uptrending bias, with a target at the underside of the channel at circa 1.2775.
Economic Indicator
Consumer Price Index (YoY)
The United Kingdom (UK) Consumer Price Index (CPI), released by the Office for National Statistics on a monthly basis, is a measure of consumer price inflation – the rate at which the prices of goods and services bought by households rise or fall – produced to international standards. It is the inflation measure used in the government’s target. The YoY reading compares prices in the reference month to a year earlier. Generally, a high reading is seen as bullish for the Pound Sterling (GBP), while a low reading is seen as bearish.
Read more.Last release: Wed Jun 19, 2024 06:00
Frequency: Monthly
Actual: 2%
Consensus: 2%
Previous: 2.3%
Source: Office for National Statistics
The Bank of England is tasked with keeping inflation, as measured by the headline Consumer Price Index (CPI) at around 2%, giving the monthly release its importance. An increase in inflation implies a quicker and sooner increase of interest rates or the reduction of bond-buying by the BOE, which means squeezing the supply of pounds. Conversely, a drop in the pace of price rises indicates looser monetary policy. A higher-than-expected result tends to be GBP bullish.
Silver prices (XAG/USD) rose on Thursday, according to FXStreet data. Silver trades at $30.19 per troy ounce, up -1.64% from the $29.71 it cost on Wednesday.
Silver prices have increased by 26.89% since the beginning of the year.
| Unit measure | Silver Price Today in USD |
|---|---|
| Troy Ounce | 30.19 |
| 1 Gram | 0.97 |
The Gold/Silver ratio, which shows the number of ounces of Silver needed to equal the value of one ounce of Gold, stood at 77.30 on Thursday, down from 78.43 on Wednesday.
Silver FAQs
Silver is a precious metal highly traded among investors. It has been historically used as a store of value and a medium of exchange. Although less popular than Gold, traders may turn to Silver to diversify their investment portfolio, for its intrinsic value or as a potential hedge during high-inflation periods. Investors can buy physical Silver, in coins or in bars, or trade it through vehicles such as Exchange Traded Funds, which track its price on international markets.
Silver prices can move due to a wide range of factors. Geopolitical instability or fears of a deep recession can make Silver price escalate due to its safe-haven status, although to a lesser extent than Gold's. As a yieldless asset, Silver tends to rise with lower interest rates. Its moves also depend on how the US Dollar (USD) behaves as the asset is priced in dollars (XAG/USD). A strong Dollar tends to keep the price of Silver at bay, whereas a weaker Dollar is likely to propel prices up. Other factors such as investment demand, mining supply – Silver is much more abundant than Gold – and recycling rates can also affect prices.
Silver is widely used in industry, particularly in sectors such as electronics or solar energy, as it has one of the highest electric conductivity of all metals – more than Copper and Gold. A surge in demand can increase prices, while a decline tends to lower them. Dynamics in the US, Chinese and Indian economies can also contribute to price swings: for the US and particularly China, their big industrial sectors use Silver in various processes; in India, consumers’ demand for the precious metal for jewellery also plays a key role in setting prices.
Silver prices tend to follow Gold's moves. When Gold prices rise, Silver typically follows suit, as their status as safe-haven assets is similar. The Gold/Silver ratio, which shows the number of ounces of Silver needed to equal the value of one ounce of Gold, may help to determine the relative valuation between both metals. Some investors may consider a high ratio as an indicator that Silver is undervalued, or Gold is overvalued. On the contrary, a low ratio might suggest that Gold is undervalued relative to Silver.
(An automation tool was used in creating this post.)
- Gold demand increases from investors bundling into safety as geopolitical risks escalate.
- Israel’s threat of “all-out war” with Lebanon and Russia’s signing of an alliance with North Korea are intensifying concerns.
- XAU/USD recovers and reaches a cross-roads level, bringing its ongoing bearish pattern into question.
Gold (XAU/USD) price awakens from its slumber on Thursday, gaining a sprightly half a percent to trade in the $2,340s, and finds itself at a technical crossroads that could define the directional trend for the rest of the summer.
The market mood is placid going into the European session, with Asian bourses showing either mild gains or tepid losses. That said, Gold sees gains from safety demand as the geopolitical global threat level lights up another bar and global powers move their chess pieces across the world’s strategic chequered board.
Gold gains as geopolitical threat level rises a notch
Safe-haven Gold sees demand pick up as investors cast a worrying eye over intensifying geopolitical events on the world stage.
In the Middle East, tensions between Israel and Lebanon reached boiling point on Wednesday after Israeli officials warned they had approved plans for the Northern Command to launch an “all-out war” with Hezbollah in Lebanon.
The threat came in response to the release of drone footage by Hezbollah chief Hassan Nasrallah, showing nine minutes of aerial footage of the docks in Israel’s port city of Haifa, which are operated by foreign companies from China and India, reported Aljazeera News.
A full-frontal assault by Israel would represent a significant escalation of the conflict in the region, something US diplomats are working to avoid. Lebanon has been engaged in border skirmishes and traded missile attacks with Israel since the start of Israel’s invasion of Gaza.
Russia and China make strategic moves
Gold also sees gains as investors note concerning events further east. On Wednesday, Russian President Vladimir Putin signed a pact with North Korean leader Kim Jong Un that ensures either country will support the other in the case they are attacked.
Malaysia also announced on Wednesday its plans to join the BRICS trading federation before a meeting between its Prime Minister Anwar Ibrahim and Premier Li Qiang of China. In May, Thailand also announced plans to join the BRICS.
The growing power of BRICS as a counterweight to Western and US dominance is concerning some global strategists as it risks fracturing the smooth flow of world trade.
BoE meeting in focus after UK inflation hits target
On the economic data front, traders brace for the outcome of the Bank of England (BoE) policy meeting on Thursday.
Recent inflation data in the UK – which showed inflation falling to the BoE’s 2.0% target – has raised the possibility of a wild-card rate-cut from the BoE, which could cause volatility to the Pound Sterling (GBP), broader markets and possibly even Gold.
Lower interest rates are overall positive for Gold since they reduce the opportunity cost of holding a non-coupon-paying asset, so a fall in interest rates, even in the UK, could stimulate demand.
Technical Analysis: Gold reaches technical crossroads
Gold rallies up to a key resistance level at a trendline and the 50-day Simple Moving Average (SMA), situated at around $2,340. XAU/USD has reached a technical crossroads that could determine the directional trend for some time to come.
A decisive break above the cluster of resistance would invalidate the bearish Head-and-Shoulders (H&S) pattern that has been forming on the daily chart.
A deceive break would be one accompanied by a long green bullish daily candle that pierced cleanly through the resistance and closed near its high, or three consecutive bullish candles that broke above the level.
Such a break would invalidate the bearish H&S and indicate a continuation of Gold’s broader uptrend higher, probably to an initial target in the mid $2,380s (June 7 high).
XAU/USD Daily Chart
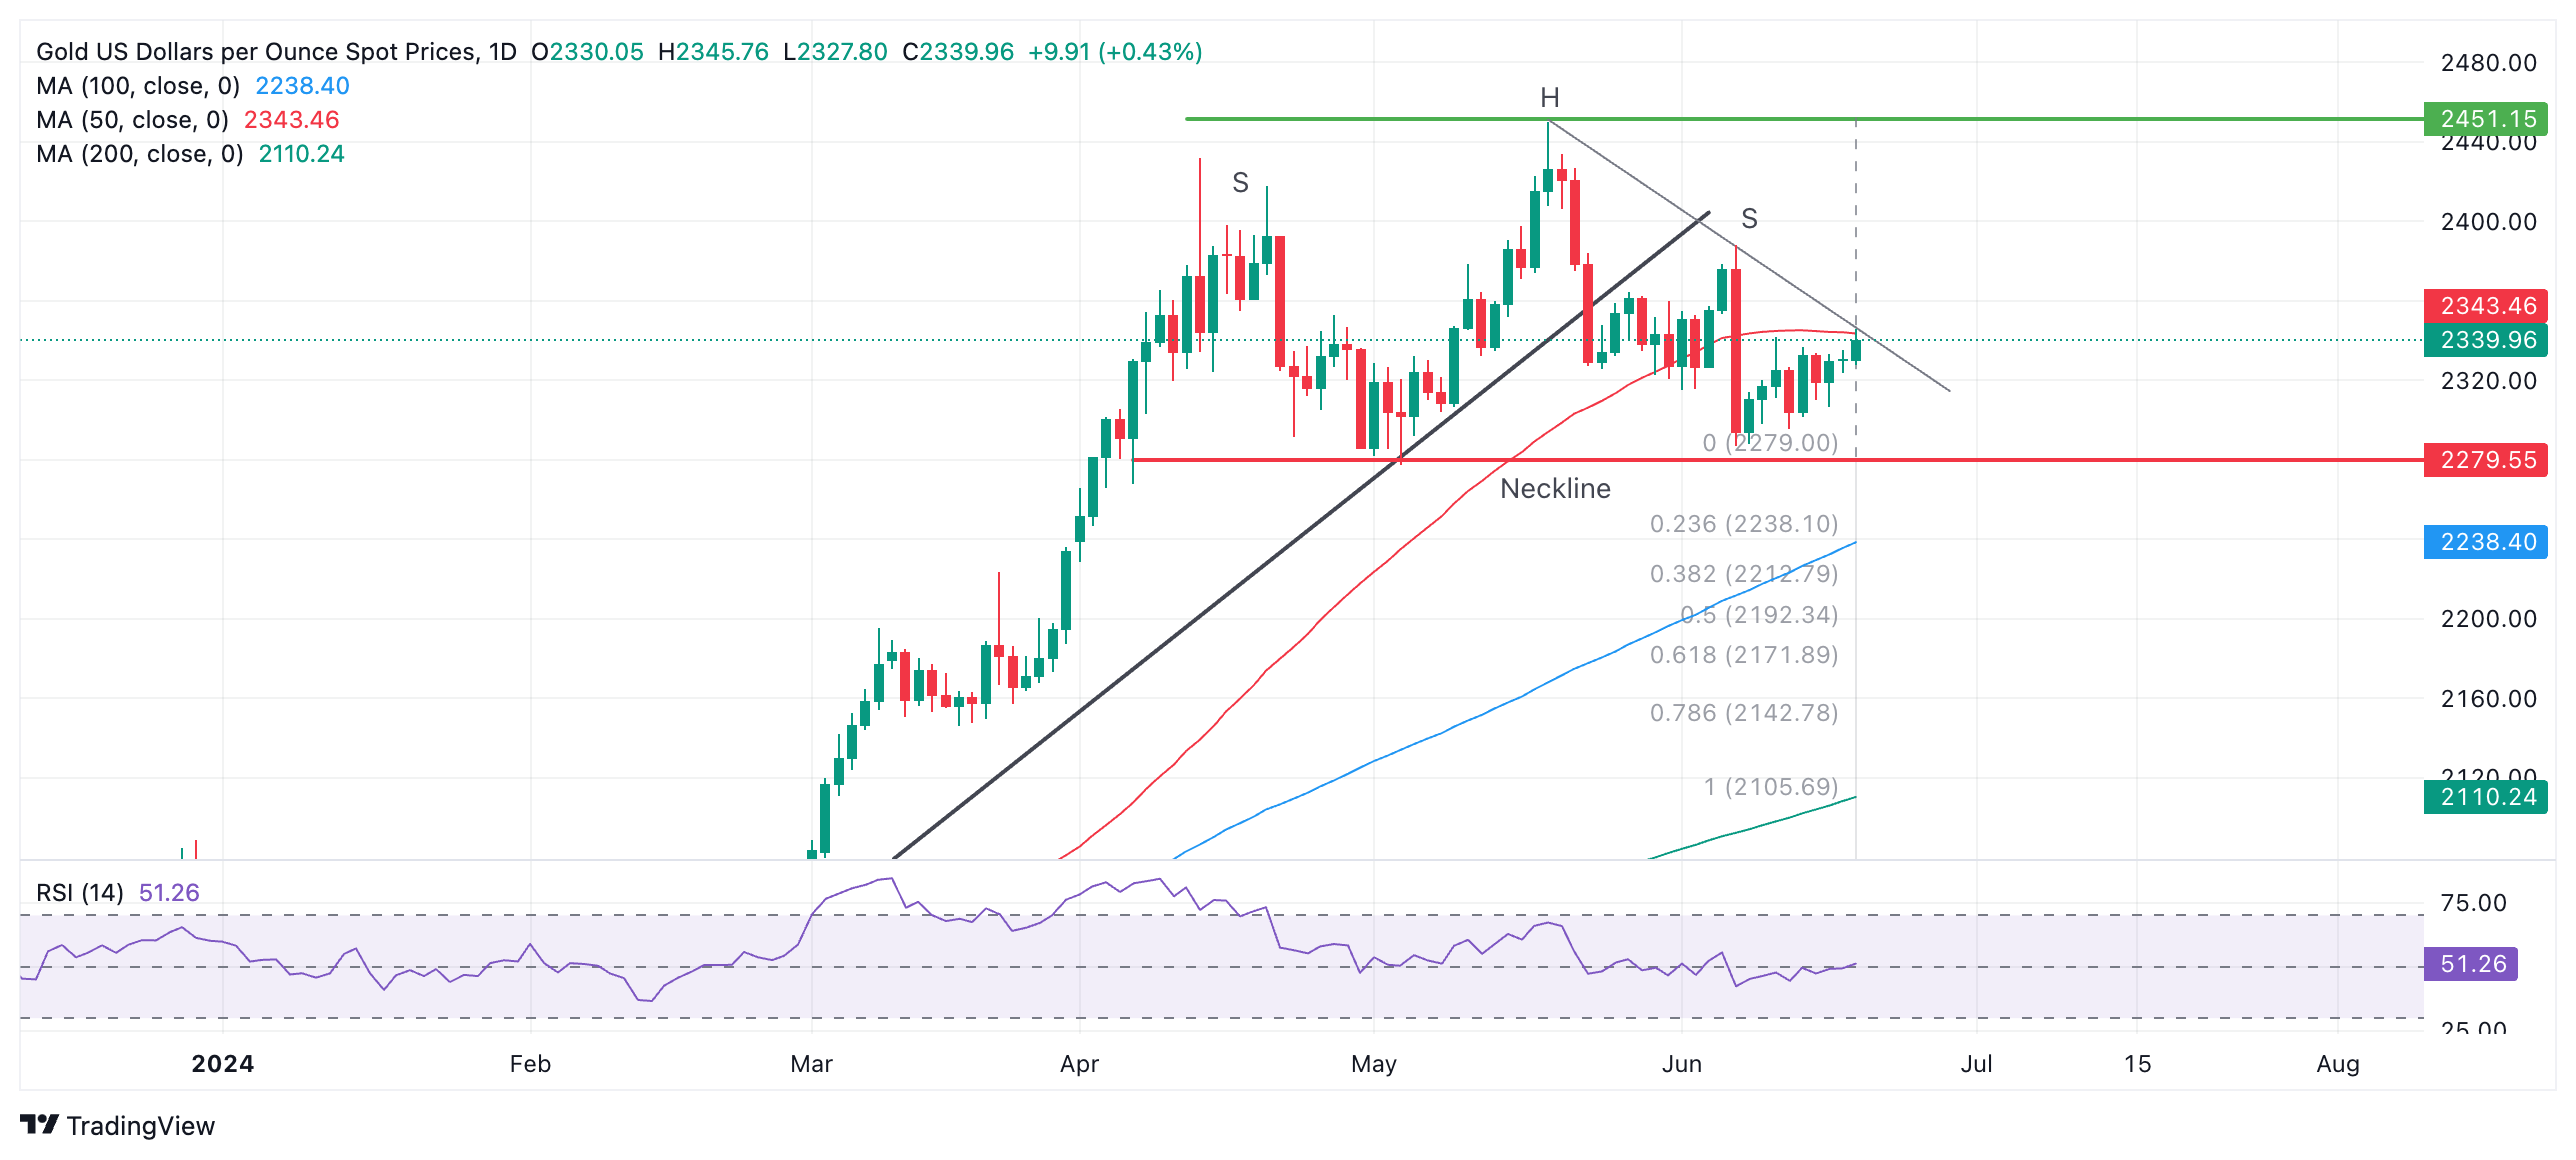
However, a failure to break above would continue to support the possibility that Gold is forming an H&S reversal pattern. Such patterns tend to occur at market tops and signal a change of trend.
The H&S on Gold has completed a left and right shoulder (labeled “S”) and a “head” (labeled “H”). The so-called “neckline” of the pattern appears to be at the $2,279 support level (red line).
A decisive break below the neckline would validate the H&S pattern and activate downside targets. The first more conservative target would be $2,171, calculated by taking the 0.618 Fibonacci ratio of the height of the pattern and extrapolating it lower from the neckline. The second target would be at $2,106, the full height of the pattern extrapolated lower.
A break above $2,345, however, would bring the H&S into doubt and could signal a continuation higher, to an initial target at the $2,450 peak.
Economic Indicator
BoE Interest Rate Decision
The Bank of England (BoE) announces its interest rate decision at the end of its eight scheduled meetings per year. If the BoE is hawkish about the inflationary outlook of the economy and raises interest rates it is usually bullish for the Pound Sterling (GBP). Likewise, if the BoE adopts a dovish view on the UK economy and keeps interest rates unchanged, or cuts them, it is seen as bearish for GBP.
Read more.Next release: Thu Jun 20, 2024 11:00
Frequency: Irregular
Consensus: 5.25%
Previous: 5.25%
Source: Bank of England
“The risks to economic growth are balanced in the near term,” the European Central Bank (ECB) said in its Economic Bulletin published on Thursday.
Additional takeaways
The Governing Council is determined to ensure that inflation returns to its 2% medium-term target in a timely manner.
It will keep policy rates sufficiently restrictive for as long as necessary to achieve this aim.
After five quarters of stagnation, the euro area economy grew by 0.3% over the first quarter of 2024.
Most measures of underlying inflation declined further in April, the last month for which data were available, confirming the picture of gradually diminishing price pressures.
However, domestic inflation remains high.
The risks to economic growth are balanced in the near term but remain tilted to the downside over the medium term.
Credit dynamics remain weak.
Market reaction
The Euro remains unfazed by the ECB Bulletin, with EUR/USD losing ground below 1.0750, down 0.21% so far.
Following the Swiss National Bank (SNB) decision to reduce the policy rate for the second consecutive meeting, Chairman Thomas Jordan speaks on the inflation and policy outlook during the post-policy meeting press conference on Thursday.
Key quotes
Underlying inflation pressure has decreased.
Swiss Franc has significantly increased in past weeks.
Swiss inflation driven by prices for domestic services.
We will continue to monitor inflation development closely, adjust policy if necessary.
SNB willing to be active in forex markets as necessary.
Political risks add to uncertainty about inflation.
Franc appreciation due to political uncertainties.
We do not give any forward guidance regarding interest rates.
Will adjust policy rate to ensure inflation rate stays in range of price stability.
We will go forward looking at inflationary pressure.
The exchange rate plays a very important role, has an influence on inflationary outlook.
There is appreciation of Swiss Franc, that has an impact on monetary conditions.
Forex interventions can be in both directions.
Market reaction to SNB Jordan's comments
As of writing, USD/CHF is holding the rebound near 0.8900, adding 0.61% on the day.
SNB FAQs
The Swiss National Bank (SNB) is the country’s central bank. As an independent central bank, its mandate is to ensure price stability in the medium and long term. To ensure price stability, the SNB aims to maintain appropriate monetary conditions, which are determined by the interest rate level and exchange rates. For the SNB, price stability means a rise in the Swiss Consumer Price Index (CPI) of less than 2% per year.
The Swiss National Bank (SNB) Governing Board decides the appropriate level of its policy rate according to its price stability objective. When inflation is above target or forecasted to be above target in the foreseeable future, the bank will attempt to tame excessive price growth by raising its policy rate. Higher interest rates are generally positive for the Swiss Franc (CHF) as they lead to higher yields, making the country a more attractive place for investors. On the contrary, lower interest rates tend to weaken CHF.
Yes. The Swiss National Bank (SNB) has regularly intervened in the foreign exchange market in order to avoid the Swiss Franc (CHF) appreciating too much against other currencies. A strong CHF hurts the competitiveness of the country’s powerful export sector. Between 2011 and 2015, the SNB implemented a peg to the Euro to limit the CHF advance against it. The bank intervenes in the market using its hefty foreign exchange reserves, usually by buying foreign currencies such as the US Dollar or the Euro. During episodes of high inflation, particularly due to energy, the SNB refrains from intervening markets as a strong CHF makes energy imports cheaper, cushioning the price shock for Swiss households and businesses.
The SNB meets once a quarter – in March, June, September and December – to conduct its monetary policy assessment. Each of these assessments results in a monetary policy decision and the publication of a medium-term inflation forecast.
Japan’s top currency diplomat Masato Kanda said on Thursday that the government “will thoroughly respond to excessive forex moves.”
Additional quotes
There is no limit for forex intervention resources.
Forex market is determined by various factors including interest rate gap.
Forex intervention announced in end of may was quite effective in responding to excessive FX moves caused by speculators.
Market reaction
The above comments fail to inspire the Japanese Yen, as USD/JPY keeps pushing higher to trading 0.09% higher to near 158.25, as of writing.
The Swiss National Bank (SNB) board members decided to cut the benchmark Sight Deposit Rate by 25 basis points (bps) from 1.50% to 1.25%, following its quarterly monetary policy assessment on Thursday.
The decision came in line with the market expectations.
The SNB announced a surprise 25 bps rate reduction in March to 1.50%, which made it the first major central bank to dial back tighter monetary policy.
Summary of the SNB policy statement
Momentum on the mortgage and real estate markets in recent quarters has been weaker than in previous years.
Also willing to be active in the foreign exchange market as necessary.
The utilisation of overall production capacity was normal.
A renewed increase in geopolitical tensions could result in weaker development of global economic activity.
Able to maintain appropriate monetary conditions.
Will adjust its monetary policy if necessary to ensure inflation remains within the range consistent with price stability over the medium term.
Monetary policy remains restrictive in manycountries.
Inflation in Switzerland is currently being driven above all by higher prices for domestic services.
Global economic growth was solid in the first quarter of 2024.
The forecast for Switzerland, as for the global economy, is subject to significant uncertainty.developments abroad represent the main risk.
SNB sees 2025 inflation at 1.1% (previous forecast was for 1.2%) (removes extraneous letters).
SNB sees 2024 swiss growth at around 1% (previous forecast was for around 1.0%).
SNB sees Q1 2027 inflation at 1.0%.
SNB sees 2024 inflation at 1.3% (previous forecast was for 1.4%).
SNB sees 2026 inflation at 1.0% (previous forecast was for 1.1%).
Market reaction to the SNB interest rate decision
In a knee-jerk reaction to the expected SNB rate cut decision, the USD/CHF pair jumped over 50 pips to test 0.8900, where it now wavers. The pair is up 0.53% on the day.
Swiss Franc PRICE Today
The table below shows the percentage change of Swiss Franc (CHF) against listed major currencies today. Swiss Franc was the weakest against the New Zealand Dollar.
| USD | EUR | GBP | JPY | CAD | AUD | NZD | CHF | |
|---|---|---|---|---|---|---|---|---|
| USD | 0.07% | 0.06% | 0.05% | 0.01% | -0.05% | -0.06% | 0.44% | |
| EUR | -0.07% | -0.01% | 0.00% | -0.06% | -0.12% | -0.14% | 0.37% | |
| GBP | -0.06% | 0.01% | 0.02% | -0.04% | -0.10% | -0.13% | 0.37% | |
| JPY | -0.05% | 0.00% | -0.02% | -0.09% | -0.10% | -0.16% | 0.37% | |
| CAD | -0.01% | 0.06% | 0.04% | 0.09% | -0.07% | -0.08% | 0.43% | |
| AUD | 0.05% | 0.12% | 0.10% | 0.10% | 0.07% | -0.02% | 0.49% | |
| NZD | 0.06% | 0.14% | 0.13% | 0.16% | 0.08% | 0.02% | 0.50% | |
| CHF | -0.44% | -0.37% | -0.37% | -0.37% | -0.43% | -0.49% | -0.50% |
The heat map shows percentage changes of major currencies against each other. The base currency is picked from the left column, while the quote currency is picked from the top row. For example, if you pick the Swiss Franc from the left column and move along the horizontal line to the US Dollar, the percentage change displayed in the box will represent CHF (base)/USD (quote).
- EUR/USD loses traction around 1.0730 as markets turn cautious in Thursday’s early European session.
- The worries about the Eurozone political uncertainty in the Eurozone continue to undermine the Euro.
- The Fed’s wait-and-see mode might boost the Greenback despite the recent weaker US Retail Sales data.
The EUR/USD pair weakens near 1.0730, snapping the three-day winning streak during the early European session on Thursday. However, the upside for the pair seems limited as investors are worried about the political uncertainty in the Eurozone. Investors will closely watch the preliminary Eurozone and US Purchasing Managers Index (PMI) for June, which are due on Friday.
The cautious mood by the calling of a snap election in France after a defeat by the far-right National Rally raised fear of Eurozone political uncertainty and weighed on the Euro (EUR). Furthermore, the divergence in monetary policy between the Eurozone and the US might further drag the shared currency lower. On Wednesday, the European Central Bank (ECB) Governing Council member Mario Centeno said that the central bank can ease monetary policy further so long as inflation continues to moderate.
Across the pond, the weaker US Retail Sales report suggested signs of subdued activity among US consumers, fueling the case for US Federal Reserve (Fed) rate cuts later this year, which is likely to weaken the Greenback in the near term. However, the hawkish tone from several Fed officials might cap the Greenback’s downside. Boston Fed President Susan Collins warned on Tuesday that it is still too early to say whether or not inflation is on course towards the Fed’s 2% target. Meanwhile, Richmond Fed President Thomas Barkin said that he needs to wait for several more months of economic data before considering cutting the interest rate.
Here is what you need to know on Thursday, June 20:
The market action was subdued on Wednesday because US markets were closed in observance of the Juneteenth holiday. The Swiss National Bank (SNB) and the Bank of England (BoE) monetary policy announcements could ramp up volatility during the European trading hours on Thursday. Later in the day, the US economic docket will feature weekly Jobless Claims and Building Permits data for May. Investors will continue to pay close attention to comments from Federal Reserve (Fed) officials as well.
The US Dollar (USD) Index registered small losses on Wednesday. With the benchmark 10-year US Treasury bond yield edging higher early Thursday, the USD Index recovered a portion of this week's losses. In the meantime, US stock index futures trade mixed in the European morning. Nasdaq Futures are up more than 0.5% while Dow Futures trade marginally lower on the day.
US Dollar PRICE This week
The table below shows the percentage change of US Dollar (USD) against listed major currencies this week. US Dollar was the weakest against the Australian Dollar.
| USD | EUR | GBP | JPY | CAD | AUD | NZD | CHF | |
|---|---|---|---|---|---|---|---|---|
| USD | -0.25% | -0.15% | 0.49% | -0.20% | -0.78% | -0.02% | -0.77% | |
| EUR | 0.25% | 0.12% | 0.76% | 0.05% | -0.62% | 0.29% | -0.51% | |
| GBP | 0.15% | -0.12% | 0.74% | -0.08% | -0.76% | 0.14% | -0.62% | |
| JPY | -0.49% | -0.76% | -0.74% | -0.60% | -1.26% | -0.37% | -1.20% | |
| CAD | 0.20% | -0.05% | 0.08% | 0.60% | -0.63% | 0.19% | -0.54% | |
| AUD | 0.78% | 0.62% | 0.76% | 1.26% | 0.63% | 0.97% | 0.13% | |
| NZD | 0.02% | -0.29% | -0.14% | 0.37% | -0.19% | -0.97% | -0.74% | |
| CHF | 0.77% | 0.51% | 0.62% | 1.20% | 0.54% | -0.13% | 0.74% |
The heat map shows percentage changes of major currencies against each other. The base currency is picked from the left column, while the quote currency is picked from the top row. For example, if you pick the US Dollar from the left column and move along the horizontal line to the Japanese Yen, the percentage change displayed in the box will represent USD (base)/JPY (quote).
The BoE is widely anticipated to leave monetary policy settings unchanged following the June policy meeting. There will not be a press conference, and the bank might refrain from making significant changes to its policy meeting ahead of the July 4 election. GBP/USD stays under modest bearish pressure and trades slightly above 1.2700 to start the European session.
The SNB is forecast to lower the policy rate by 25 basis points (bps) to 1.25%. USD/CHF fell sharply at the beginning of the week and touched its weakest level since mid-March below 0.8830. The pair has been consolidating channel slightly below 0.8850 since then.
EUR/USD posted small gains on Wednesday but lost its traction after meeting resistance near 1.0750. The pair trades in negative territory at around 1.0730 in the European morning on Thursday. The European Commission will publish preliminary Consumer Confidence data for June later in the day.
USD/JPY registered gains for the fifth straight day on Wednesday. The pair continue to stretch higher early Thursday and was last seen trading above 158.00.
Gold failed to make a noticeable move in either direction on Wednesday and closed the day virtually unchanged. XAU/USD gathers bullish momentum in the European morning and was last seen trading above $2,340.
Central banks FAQs
Central Banks have a key mandate which is making sure that there is price stability in a country or region. Economies are constantly facing inflation or deflation when prices for certain goods and services are fluctuating. Constant rising prices for the same goods means inflation, constant lowered prices for the same goods means deflation. It is the task of the central bank to keep the demand in line by tweaking its policy rate. For the biggest central banks like the US Federal Reserve (Fed), the European Central Bank (ECB) or the Bank of England (BoE), the mandate is to keep inflation close to 2%.
A central bank has one important tool at its disposal to get inflation higher or lower, and that is by tweaking its benchmark policy rate, commonly known as interest rate. On pre-communicated moments, the central bank will issue a statement with its policy rate and provide additional reasoning on why it is either remaining or changing (cutting or hiking) it. Local banks will adjust their savings and lending rates accordingly, which in turn will make it either harder or easier for people to earn on their savings or for companies to take out loans and make investments in their businesses. When the central bank hikes interest rates substantially, this is called monetary tightening. When it is cutting its benchmark rate, it is called monetary easing.
A central bank is often politically independent. Members of the central bank policy board are passing through a series of panels and hearings before being appointed to a policy board seat. Each member in that board often has a certain conviction on how the central bank should control inflation and the subsequent monetary policy. Members that want a very loose monetary policy, with low rates and cheap lending, to boost the economy substantially while being content to see inflation slightly above 2%, are called ‘doves’. Members that rather want to see higher rates to reward savings and want to keep a lit on inflation at all time are called ‘hawks’ and will not rest until inflation is at or just below 2%.
Normally, there is a chairman or president who leads each meeting, needs to create a consensus between the hawks or doves and has his or her final say when it would come down to a vote split to avoid a 50-50 tie on whether the current policy should be adjusted. The chairman will deliver speeches which often can be followed live, where the current monetary stance and outlook is being communicated. A central bank will try to push forward its monetary policy without triggering violent swings in rates, equities, or its currency. All members of the central bank will channel their stance toward the markets in advance of a policy meeting event. A few days before a policy meeting takes place until the new policy has been communicated, members are forbidden to talk publicly. This is called the blackout period.
Gold prices rose in India on Thursday, according to data compiled by FXStreet.
The price for Gold stood at 6,294.29 Indian Rupees (INR) per gram, up compared with the INR 6,257.45 it cost on Wednesday.
The price for Gold increased to INR 73,415.39 per tola from INR 72,985.62 per tola a day earlier.
| Unit measure | Gold Price in INR |
|---|---|
| 1 Gram | 6,294.29 |
| 10 Grams | 62,942.92 |
| Tola | 73,415.39 |
| Troy Ounce | 195,776.20 |
FXStreet calculates Gold prices in India by adapting international prices (USD/INR) to the local currency and measurement units. Prices are updated daily based on the market rates taken at the time of publication. Prices are just for reference and local rates could diverge slightly.
Global Market Movers: Comex Gold price sits at weekly highs even as USD bounces
- The uncertainty over the likely timing of when the Federal Reserve will start cutting interest rates keeps traders on the sidelines and leads to subdued range-bound price action around the Gold price.
- The Fed projected only one interest rate cut this year as compared to three projected in March, which acts as a tailwind for the US Treasury bond yields and caps the upside for the non-yielding yellow metal.
- The US Retail Sales data released on Tuesday pointed to lackluster economic activity, which, along with weaker US consumer and producer prices, should allow the Fed to ease monetary policy soon.
- The current market pricing indicates a greater chance of the first rate cut in September and the possibility of one more rate cut in November or December, offering some support to the XAU/USD.
- Ukrainian drone strikes on Russian energy infrastructure and Israel's warning that an all-out war with Iran-backed Hezbollah was coming soon point to escalating geopolitical risk in Europe and the Middle East.
- Adding to this, concerns that a new government in France could weaken fiscal discipline act as a tailwind for the safe-haven assets and should help limit any meaningful downfall for the commodity.
- Investors now look forward to the Swiss National Bank (SNB) decision and the crucial Bank of England (BoE) policy meeting, which might infuse volatility and provide some impetus to the metal.
- Traders will further take cues from the US economic docket, featuring the release of the usual Weekly Initial Jobless Claims, Philly Fed Manufacturing Index, Building Permits and Housing Starts.
Gold FAQs
Gold has played a key role in human’s history as it has been widely used as a store of value and medium of exchange. Currently, apart from its shine and usage for jewelry, the precious metal is widely seen as a safe-haven asset, meaning that it is considered a good investment during turbulent times. Gold is also widely seen as a hedge against inflation and against depreciating currencies as it doesn’t rely on any specific issuer or government.
Central banks are the biggest Gold holders. In their aim to support their currencies in turbulent times, central banks tend to diversify their reserves and buy Gold to improve the perceived strength of the economy and the currency. High Gold reserves can be a source of trust for a country’s solvency. Central banks added 1,136 tonnes of Gold worth around $70 billion to their reserves in 2022, according to data from the World Gold Council. This is the highest yearly purchase since records began. Central banks from emerging economies such as China, India and Turkey are quickly increasing their Gold reserves.
Gold has an inverse correlation with the US Dollar and US Treasuries, which are both major reserve and safe-haven assets. When the Dollar depreciates, Gold tends to rise, enabling investors and central banks to diversify their assets in turbulent times. Gold is also inversely correlated with risk assets. A rally in the stock market tends to weaken Gold price, while sell-offs in riskier markets tend to favor the precious metal.
The price can move due to a wide range of factors. Geopolitical instability or fears of a deep recession can quickly make Gold price escalate due to its safe-haven status. As a yield-less asset, Gold tends to rise with lower interest rates, while higher cost of money usually weighs down on the yellow metal. Still, most moves depend on how the US Dollar (USD) behaves as the asset is priced in dollars (XAU/USD). A strong Dollar tends to keep the price of Gold controlled, whereas a weaker Dollar is likely to push Gold prices up.
(An automation tool was used in creating this post.)
FX option expiries for June 20 NY cut at 10:00 Eastern Time, via DTCC, can be found below
- EUR/USD: EUR amounts
- 1.0600 1.9b
- 1.0700 2.3b
- 1.0725 774m
- 1.0750 851m
- 1.0800 1.4b
- 1.0860 896m
- GBP/USD: GBP amounts
- 1.2700 1b
- USD/JPY: USD amounts
- 155.00 802m
- 155.80 1.4b
- 156.00 1.3b
- 157.00 2.2b
- 157.75 534m
- 158.00 621m
- USD/CHF: USD amounts
- 0.8820 560m
- 0.8850 912m
- 0.8900 530m
- 0.9040 615m
- 0.9100 1.1b
- AUD/USD: AUD amounts
- 0.6500 1.9b
- 0.6525 551m
- 0.6570 553m
- 0.6650 567m
- 0.6685 500m
- 0.6770 545m
- 0.6800 1.2b
- USD/CAD: USD amounts
- 1.3665 639m
- NZD/USD: NZD amounts
- 0.6080 462m
- EUR/GBP: EUR amounts
- 0.8450 450m
- 0.8500 671m
- The Bank of England is expected to keep its policy rate unchanged.
- UK disinflationary pressure accelerated in May.
- GBP/USD faces an initial up-barrier at 1.2860.
The Bank of England (BoE) is expected to keep its policy rate unchanged for the seventh consecutive meeting on Thursday, despite the recent acceleration of disinflationary pressures in the UK and speculation of two interest rate cuts this year.
Bank of England could deliver a cautious message
The Bank of England is widely seen maintaining its benchmark interest rate at 5.25% following its policy meeting on Thursday. In addition to the interest rate announcement, the central bank will release its Monetary Policy Minutes.
Despite disinflationary pressures remaining well in place in May, the Bank of England (BoE) appears poised to begin reducing its policy rate at some point in Q4 in response to still highly elevated services inflation (+5.7% YoY vs. +5.3% YoY expected in May).
Furthermore, inflation figures in the UK saw the headline Consumer Price Index (CPI) increasing by 2.0% (down from 2.3%) and the core CPI, which excludes food and energy costs, rising by 3.5% (down from 3.9%). Additionally, it was the first time that the CPI hit the bank’s goal since October 2021.
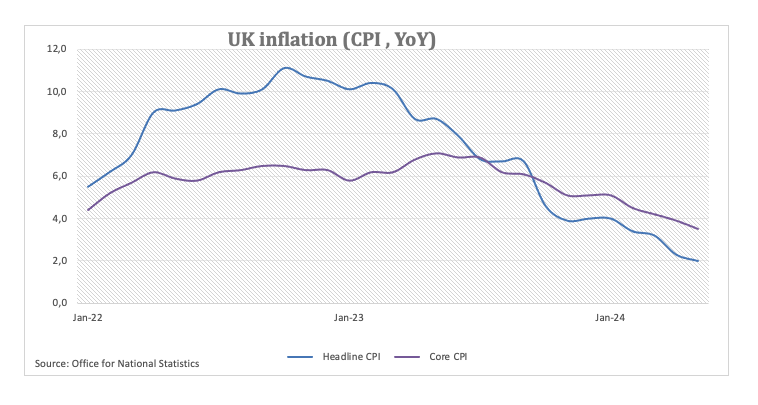
In addition, money markets now see around 45 bps of easing by the BoE by year-end and nearly 30 bps by November.
Regarding the upcoming event, the latest inflation readings are unlikely to challenge the BoE’s view of starting its easing cycle in the latter part of the year, while a cautious message, particularly highlighting services inflation and the still tight domestic labour market, should not be ruled out just yet.
All in all, the BoE is predicted to hold its policy rate at 5.25% on Thursday at 11 GMT. The vote is anticipated to stay 7-2, with a few revisions to the accompanying statement. It seems likely that traders will be particularly interested in rate recommendations for the August meeting. It is worth recalling that in its May policy decision, the central bank emphasised the importance of upcoming data in formulating decisions on monetary policy.
Following the bank’s event on May 9, Bank of England Governor Andrew Bailey stated that future rate cuts might need to exceed current market expectations to prevent inflation from dropping below target. On Thursday, Bailey remarked that even a small cut to the Bank of England's interest rate would keep monetary policy in restrictive territory.
Additional comments from BoE officials also saw outgoing Deputy Governor Ben Broadbent, whose final policy decision will be Thursday’s, reportedly maintain that there is a possibility of a summer rate cut. Broadbent indicated that for the BoE to justify lowering rates, the data would need to align with their projections. He also emphasized that he is giving more consideration to services CPI in the short term when making his decision.
His colleague Megan Greene, who had previously noted in April that high wage growth and services CPI indicated inflation persistence, making near-term rate cuts unlikely, has since adjusted her stance. Greene reportedly acknowledged that inflation persistence has lessened, thus omitting the earlier reference to distant rate cuts. Consequently, if forthcoming data further indicate that inflation is decreasing, markets might anticipate Greene voting for a rate cut at the June meeting, contributing to the dovish sentiment from the previous session.
Previewing the BoE gathering, Senior Macro Strategist at Rabobank Stefan Koopman argued that the BoE MPC is expected to maintain the policy rate at next week’s meeting. "The vote might again be split, with two members possibly supporting a 25 bps rate reduction. While the MPC is considering lowering interest rates, the current data does not justify such a move. Additionally, the political context makes a pre-election rate cut unnecessarily complicated. We continue to believe that both wage growth and services inflation are not yet consistent with a sustained return to 2% inflation," he added.
How will the BoE interest rate decision impact GBP/USD?
Even though inflation continued to decline in May, the central bank is unlikely to adopt a more relaxed tone or provide a clearer indication of when interest rates might be reduced. With surprises largely ruled out, the British Pound (GBP) is expected to remain within its current familiar range for the time being.
Against that backdrop, GBP/USD maintains its constructive bias after convincingly surpassing the key 200-day SMA (1.2550). FXStreet Senior Analyst Pablo Piovano suggests that further gains may lead Cable to revisit the June high of 1.2860 (June 12). Beyond that, the next target is the 2024 top of 1.2893 (March 8) prior to the psychological milestone of 1.3000.
Conversely, Pablo notes that a resurgence of the selling bias could trigger some corrective moves in the short term. Immediate support aligns at the June low of 1.2656 (June 12), closely followed by the provisional 100-day and 55-day SMAs of 1.2639 and 1.2618, respectively. Down from here comes the 200-day SMA at 1.2550. A deeper pullback could put a potential test of the 2024 bottom of 1.2299 (April 22) back on the radar.
Economic Indicator
BoE Interest Rate Decision
The Bank of England (BoE) announces its interest rate decision at the end of its eight scheduled meetings per year. If the BoE is hawkish about the inflationary outlook of the economy and raises interest rates it is usually bullish for the Pound Sterling (GBP). Likewise, if the BoE adopts a dovish view on the UK economy and keeps interest rates unchanged, or cuts them, it is seen as bearish for GBP.
Read more.Last release: Thu May 09, 2024 11:00
Frequency: Irregular
Actual: 5.25%
Consensus: 5.25%
Previous: 5.25%
Source: Bank of England
BoE FAQs
The Bank of England (BoE) decides monetary policy for the United Kingdom. Its primary goal is to achieve ‘price stability’, or a steady inflation rate of 2%. Its tool for achieving this is via the adjustment of base lending rates. The BoE sets the rate at which it lends to commercial banks and banks lend to each other, determining the level of interest rates in the economy overall. This also impacts the value of the Pound Sterling (GBP).
When inflation is above the Bank of England’s target it responds by raising interest rates, making it more expensive for people and businesses to access credit. This is positive for the Pound Sterling because higher interest rates make the UK a more attractive place for global investors to park their money. When inflation falls below target, it is a sign economic growth is slowing, and the BoE will consider lowering interest rates to cheapen credit in the hope businesses will borrow to invest in growth-generating projects – a negative for the Pound Sterling.
In extreme situations, the Bank of England can enact a policy called Quantitative Easing (QE). QE is the process by which the BoE substantially increases the flow of credit in a stuck financial system. QE is a last resort policy when lowering interest rates will not achieve the necessary result. The process of QE involves the BoE printing money to buy assets – usually government or AAA-rated corporate bonds – from banks and other financial institutions. QE usually results in a weaker Pound Sterling.
Quantitative tightening (QT) is the reverse of QE, enacted when the economy is strengthening and inflation starts rising. Whilst in QE the Bank of England (BoE) purchases government and corporate bonds from financial institutions to encourage them to lend; in QT, the BoE stops buying more bonds, and stops reinvesting the principal maturing on the bonds it already holds. It is usually positive for the Pound Sterling.
- USD/CHF trades on a softer note near 0.8840 in Thursday’s early European session.
- The SNB is expected to cut its key policy rate for a second straight meeting in June on Thursday.
- The Federal Reserve (Fed) officials are in wait-and-see mode, looking for more data.
The USD/CHF pair trades weaker around 0.8840 on Thursday during the early European trading hours. Traders prefer to wait on the sidelines ahead of the Swiss National Bank (SNB) monetary policy meeting on Thursday.
The markets expect the central bank to cut its key policy rate by 25 basis points (bps) from 1.50% to 1.25% at its June meeting. "We expect the policy rate to be cut by 25bp to 1.25% at this upcoming meeting ... it is our base case because inflation is within the target range, it is expected to remain there and the SNB thinks the policy is currently restrictive," said George Moran, European economist at Nomura. In case the SNB refrains from rate cuts, this might provide some support to the Swiss Franc (CHF). On the other hand, a rate cut by the central bank might weigh on the CHF against the USD.
On the USD’s front, Federal Reserve (Fed) officials maintain a cautious stance and look for additional inflation data before considering the interest rate cut. Traders expect one or two rate cuts by the end of this year. Odds of a September Fed funds rate cut by 25 basis points (bps) increased to 67% after the weaker Retail Sales data, up from 61% a day ago, according to the CME FedWatch tool. Investors will take more cues from the preliminary US S&P Global PMI reports for June for fresh impetus. The stronger-than-expected data could lift the Greenback and cap the downside for the pair.
- GBP/USD ticks lower on Thursday and snaps a three-day winning streak to the weekly top.
- The USD draws support from rebounding US bond yields and exerts pressure on the major.
- The downtick lacks follow-through as traders look to the BoE before placing directional bets.
The GBP/USD pair trades with a mild negative bias during the Asian session on Thursday and moves further away from the weekly low, around the 1.2740 area touched the previous day. Spot prices, however, hold above the 1.2700 mark as traders await the crucial Bank of England (BoE) monetary policy decision before placing fresh directional bets.
Heading into the key central bank event risk, the US Dollar (USD) attracts some buyers in the wake of a goodish pickup in the US Treasury bond yields and turns out to be a key factor acting as a heading for the GBP/USD pair. However, expectations that the Federal Reserve (Fed) will cut interest rates twice this year keep a lid on any meaningful gains for the Greenback. Furthermore, reduced bets that the BoE will ease monetary policy in the coming months in the wake of higher-than-expected services sector inflation in May should underpin the British Pound (GBP) and lend support to the currency pair.
From a technical perspective, the GBP/USD pair is holding comfortably above the 100-day and 200-day Simple Moving Averages (SMA), which favors bullish traders. That said, mixed oscillators on the daily chart and the recent repeated failures to find acceptance above the 1.2800 round-figure mark warrant some before positioning for any meaningful upside ahead of the UK national election on July 4. Nevertheless, any further decline is likely to find decent support near the 1.2755-1.2750 horizontal zone, below which spot prices could accelerate the downfall further towards the 1.2715-1.2710 region.
Some follow-through selling below the 1.2690-1.2685 region will suggest that the recent strong rally from the YTD low touched in April has run its course and expose the 100-day SMA support, currently pegged near the 1.2640-1.2635 area. The GBP/USD pair could eventually weaken further below the 1.2600 mark and aim to challenge the very important 200-day SMA, around the 1.2560-1.2555 zone.
On the flip side, bulls need to wait for sustained strength above the 1.2800 mark before positioning for a move back towards challenging over a three-month high, around the 1.2860 area touched last Wednesday. The subsequent move up should allow the GBP/USD pair to surpass the YTD peak, around the 1.2900 neighborhood, and climb further towards the 1.2950 hurdle before aiming to reclaim the 1.3000 psychological mark for the first time since July 2023.
GBP/USD daily chart
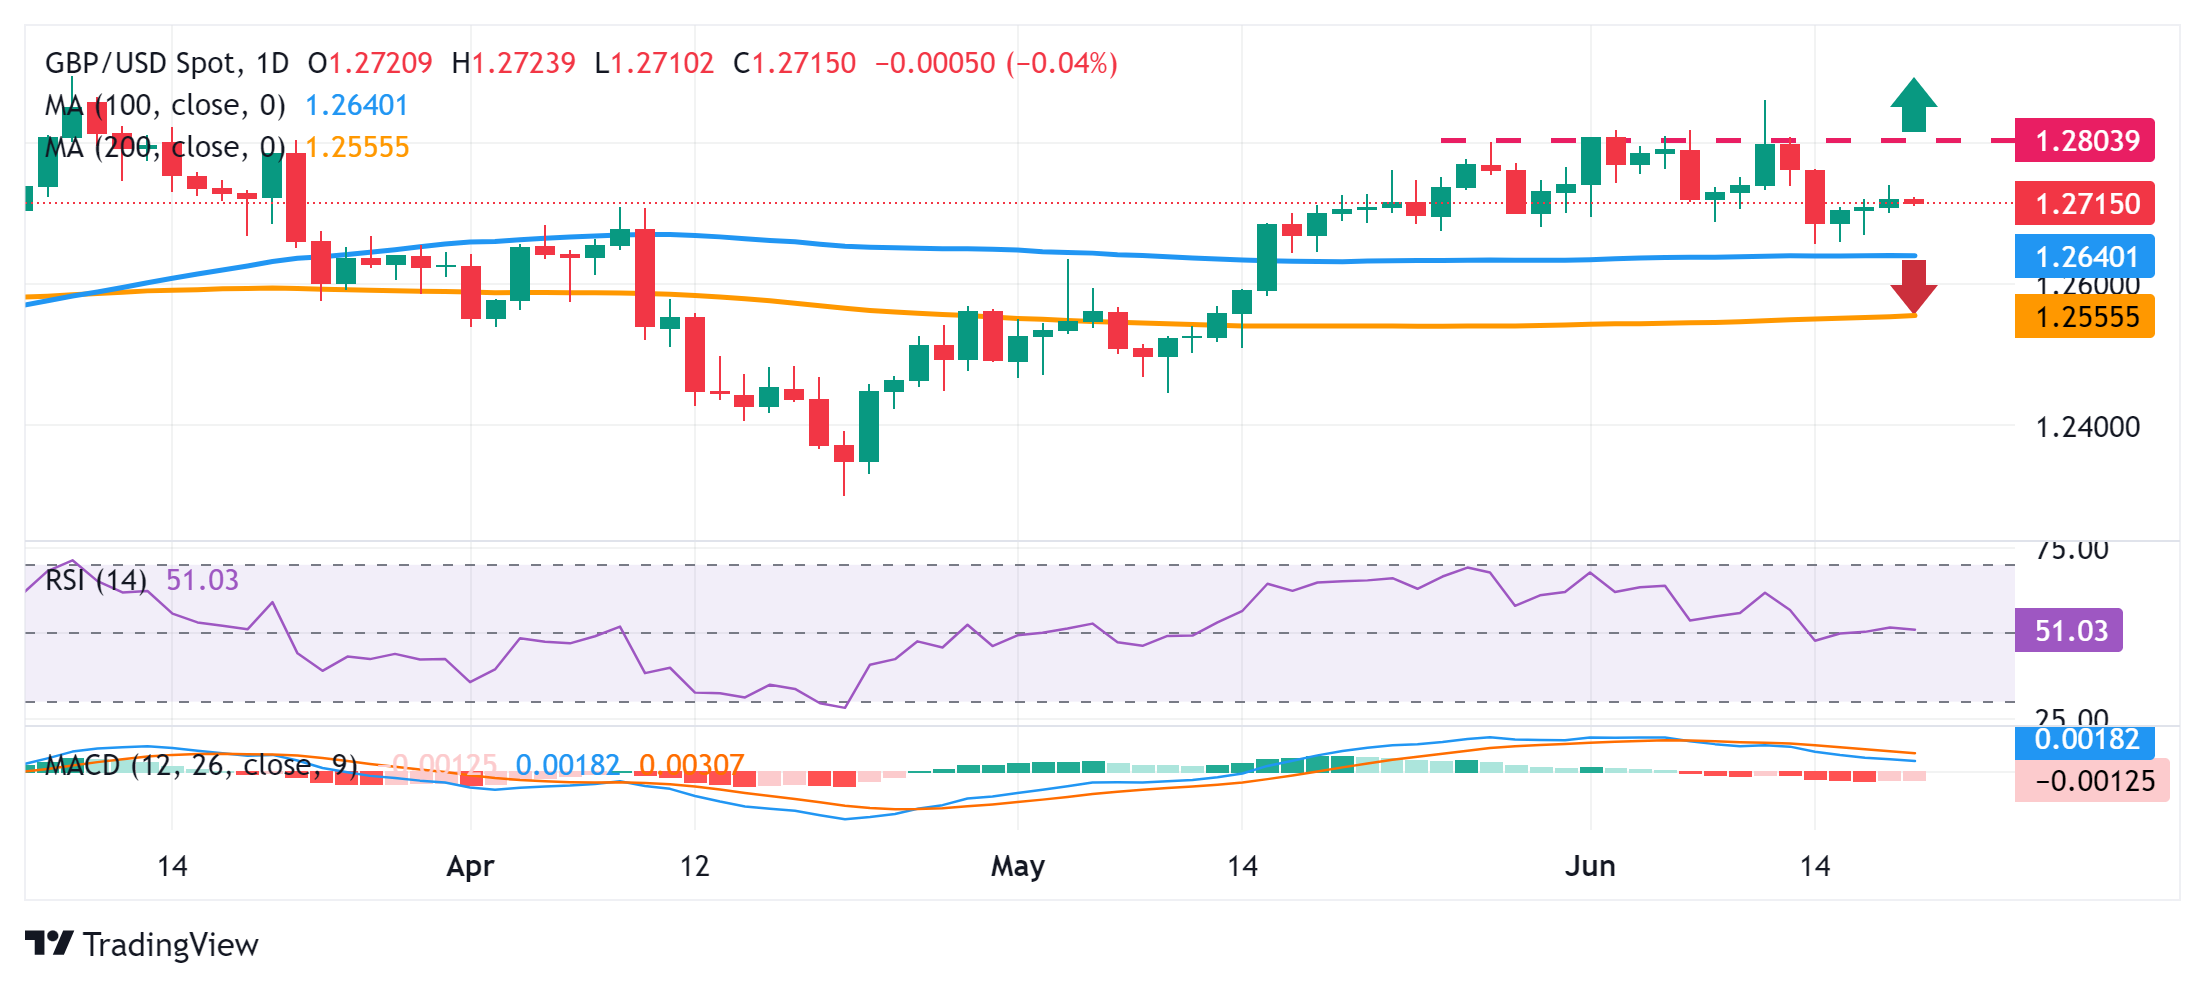
- The Australian Dollar (AUD) extends upside in Thursday’s Asian session.
- RBA's hawkish hold and rising bets on Fed rate cut support the pair.
- The US Initial Jobless Claims, Housing data, Philly Fed Manufacturing Index and Fed’s Neel Kashkari speech are due on Thursday.
The Australian Dollar (AUD) trades in positive territory for the third consecutive day on Thursday. The hawkish stance from the Reserve Bank of Australia (RBA) at its June meeting on Tuesday continues to support the pair. Additionally, weaker-than-expected Retail Sales have fueled speculation for US Federal Reserve (Fed) rate cuts later this year, weighing on the Greenback and creating a tailwind for AUD/USD.
However, the RBA statement indicated that the economic outlook remains uncertain and the process of taming inflation to target is unlikely to be smooth. Traders will take more cues from the preliminary Australia’s Judo Bank Purchasing Managers Index (PMI) for May on Friday. Any sign of weakness in the Australian economy might prompt the Australian central bank to lower its borrowing costs, which might drag the AUD lower.
On the US docket, investors will watch the release of the US weekly Initial Jobless Claims, Building Permits, Housing Starts, the Philly Fed Manufacturing Index and the Fed’s Neel Kashkari speech on Thursday. On Friday, the preliminary US S&P Global PMI reports for June will be in the spotlight.
Daily Digest Market Movers: Australian Dollar extends gains, supported by RBA’s hawkish hold
- The Australian central bank delivered a hawkish hold, as widely expected. The RBA kept the cash rate unchanged at 4.35% and reiterated that “the Board is not ruling anything in or out.”
- The RBA Governor Michele Bullock said during the press conference that the board discussed the option of raising rates while the case for a rate cut was not considered, adding that it “will do what is necessary” to return inflation to target.
- The first reading of Australian Judo Bank Manufacturing PMI is projected to improve to 50.6 in June from 49.7 in May.
- Odds of a September Fed funds rate cut rose to 67% after the disappointing retail sales data. Fed funds futures also raise expectations for 50 basis points (bps) of total rate cuts this year.
- The US Initial Jobless Claims for the week ending June 15 are estimated to decline by 235,000 from the previous week's 242,000.
Technical Analysis: AUD/USD remains constructive amid symmetrical triangle pattern
The Australian Dollar trades on a stronger note on Thursday. The AUD/USD pair has established a symmetrical triangle pattern since May 8. The pair keeps the positive vibe beyond the key 100-day Exponential Moving Average (EMA) on the daily chart. The bullish momentum in the 14-day Relative Strength Index (RSI) continues to reinforce the pair’s upside.
A decisive break above the upper boundary of the symmetrical triangle of 0.6670 will attract some buyers to the 0.6700 psychological level. Extended gains will see a rally to 0.6760, a high of January 4.
On the flip side, the 0.6590-0.6600 zone acts as a crucial support level for AUD/USD. The mentioned level is the confluence of the 100-day EMA and the lower limit of triangle patterns. A breach of this level will expose 0.6510, a low of March 22, followed by 0.6465, a low of May 1.
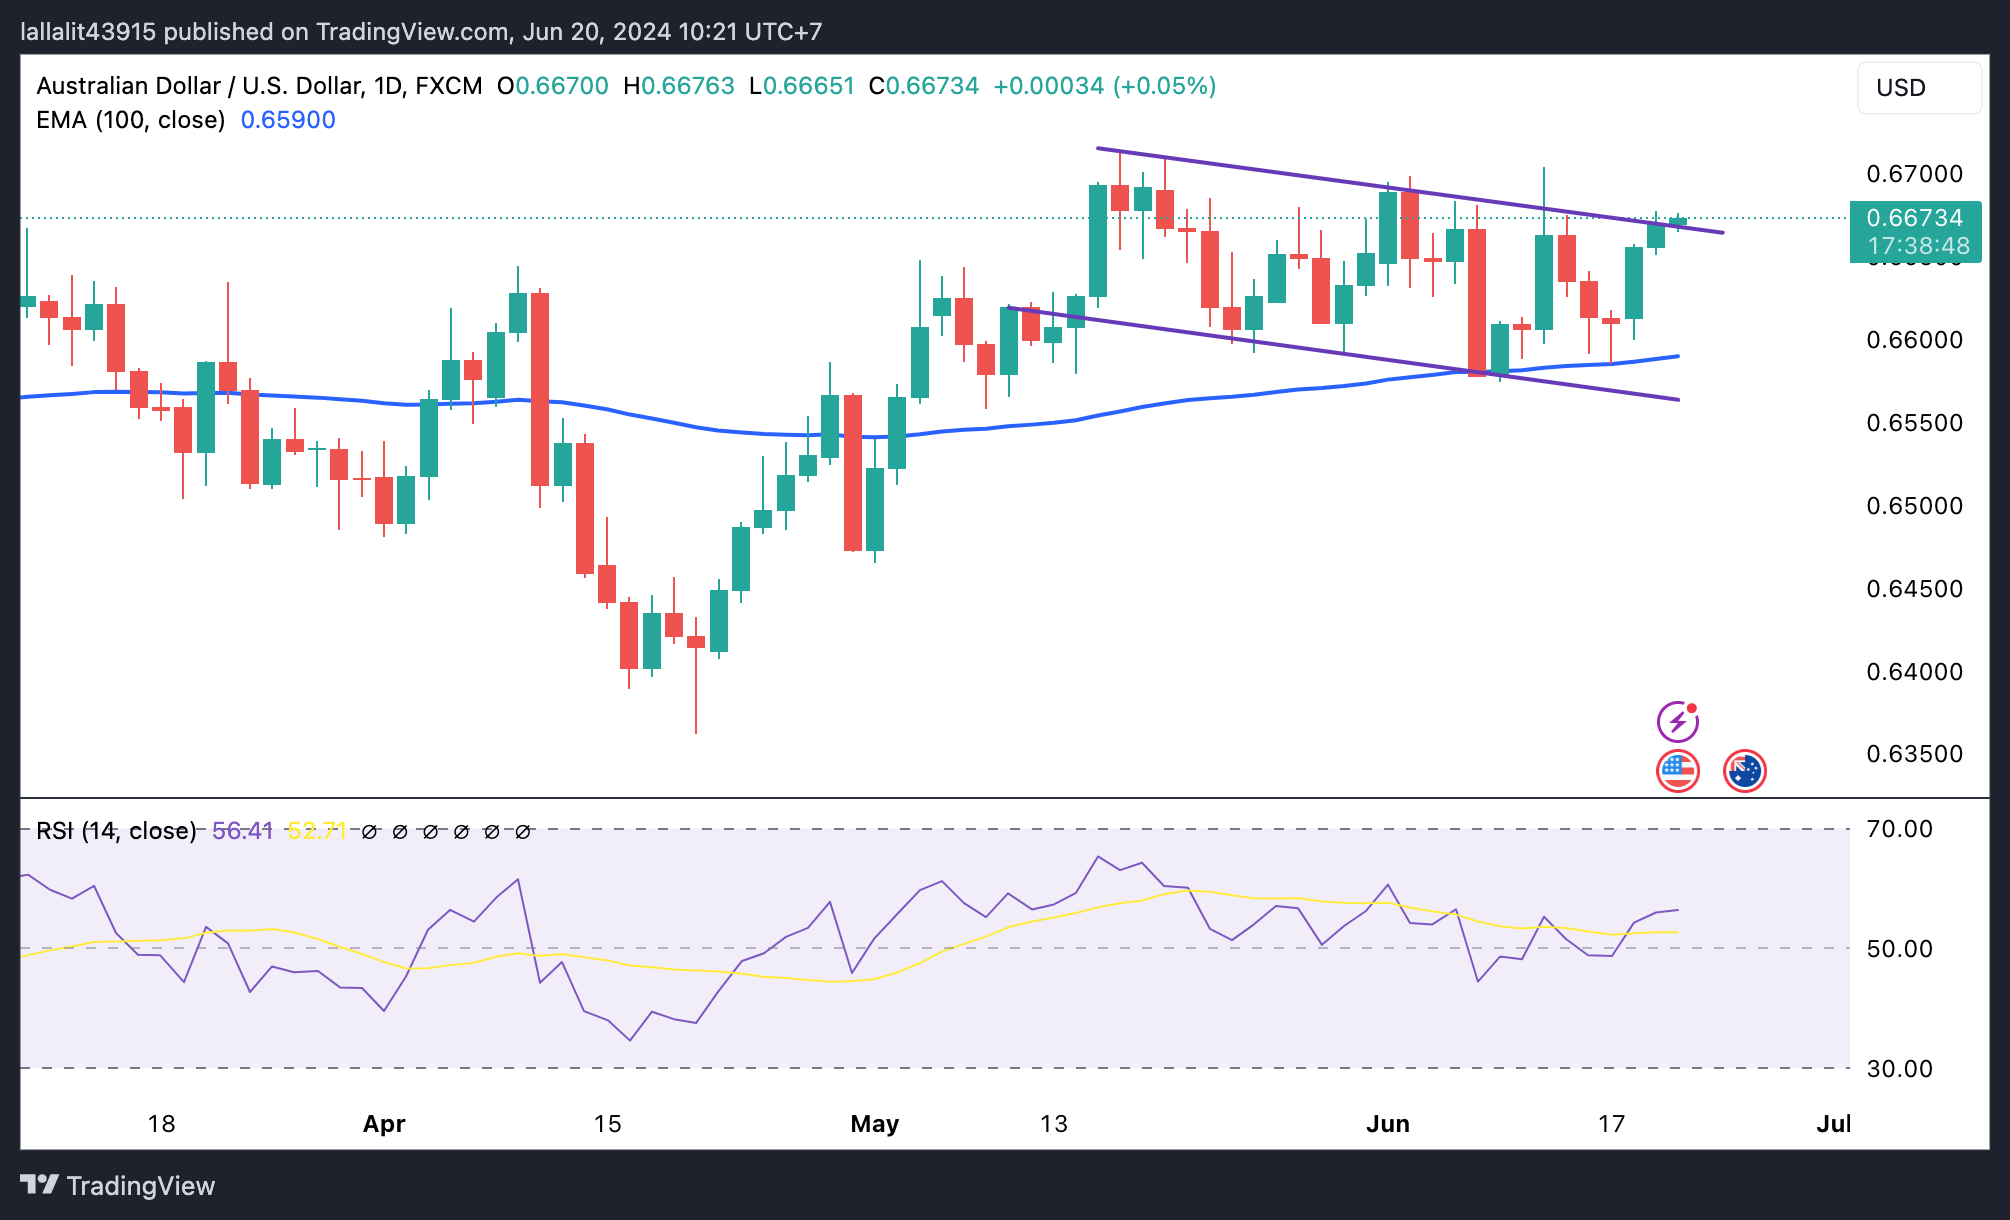
Australian Dollar price today
The table below shows the percentage change of Australian Dollar (AUD) against listed major currencies today. Australian Dollar was the strongest against the Pound Sterling.
| USD | EUR | GBP | CAD | AUD | JPY | NZD | CHF | |
| USD | 0.00% | 0.00% | 0.00% | 0.00% | 0.00% | 0.12% | 0.00% | |
| EUR | -0.06% | -0.03% | -0.01% | 0.04% | -0.03% | 0.06% | -0.01% | |
| GBP | -0.01% | 0.00% | 0.01% | 0.02% | 0.00% | -0.03% | 0.01% | |
| CAD | 0.00% | 0.00% | 0.00% | 0.02% | -0.01% | -0.03% | 0.00% | |
| AUD | 0.01% | 0.02% | 0.02% | 0.01% | 0.00% | -0.01% | 0.01% | |
| JPY | 0.00% | 0.00% | 0.01% | -0.01% | 0.03% | -0.01% | 0.03% | |
| NZD | 0.02% | 0.03% | 0.04% | 0.03% | 0.05% | 0.05% | 0.02% | |
| CHF | 0.02% | -0.01% | -0.01% | 0.00% | 0.02% | -0.03% | -0.03% |
The heat map shows percentage changes of major currencies against each other. The base currency is picked from the left column, while the quote currency is picked from the top row. For example, if you pick the Euro from the left column and move along the horizontal line to the Japanese Yen, the percentage change displayed in the box will represent EUR (base)/JPY (quote).
Australian Dollar FAQs
One of the most significant factors for the Australian Dollar (AUD) is the level of interest rates set by the Reserve Bank of Australia (RBA). Because Australia is a resource-rich country another key driver is the price of its biggest export, Iron Ore. The health of the Chinese economy, its largest trading partner, is a factor, as well as inflation in Australia, its growth rate and Trade Balance. Market sentiment – whether investors are taking on more risky assets (risk-on) or seeking safe-havens (risk-off) – is also a factor, with risk-on positive for AUD.
The Reserve Bank of Australia (RBA) influences the Australian Dollar (AUD) by setting the level of interest rates that Australian banks can lend to each other. This influences the level of interest rates in the economy as a whole. The main goal of the RBA is to maintain a stable inflation rate of 2-3% by adjusting interest rates up or down. Relatively high interest rates compared to other major central banks support the AUD, and the opposite for relatively low. The RBA can also use quantitative easing and tightening to influence credit conditions, with the former AUD-negative and the latter AUD-positive.
China is Australia’s largest trading partner so the health of the Chinese economy is a major influence on the value of the Australian Dollar (AUD). When the Chinese economy is doing well it purchases more raw materials, goods and services from Australia, lifting demand for the AUD, and pushing up its value. The opposite is the case when the Chinese economy is not growing as fast as expected. Positive or negative surprises in Chinese growth data, therefore, often have a direct impact on the Australian Dollar and its pairs.
Iron Ore is Australia’s largest export, accounting for $118 billion a year according to data from 2021, with China as its primary destination. The price of Iron Ore, therefore, can be a driver of the Australian Dollar. Generally, if the price of Iron Ore rises, AUD also goes up, as aggregate demand for the currency increases. The opposite is the case if the price of Iron Ore falls. Higher Iron Ore prices also tend to result in a greater likelihood of a positive Trade Balance for Australia, which is also positive of the AUD.
The Trade Balance, which is the difference between what a country earns from its exports versus what it pays for its imports, is another factor that can influence the value of the Australian Dollar. If Australia produces highly sought after exports, then its currency will gain in value purely from the surplus demand created from foreign buyers seeking to purchase its exports versus what it spends to purchase imports. Therefore, a positive net Trade Balance strengthens the AUD, with the opposite effect if the Trade Balance is negative.
- USD/JPY bulls turn cautious near a one-and-half-month peak amid mixed fundamental cues.
- The BoJ’s cautious approach and the upbeat market mood undermine the safe-haven JPY.
- Fed rate-cut uncertainty keeps the USD bulls on the defensive and cap gains for the major.
The USD/JPY pair consolidates around the 158.00 round figure during the Asian session on Thursday and remains well within the striking distance of its highest level since late April touched last week. The mixed fundamental backdrop, meanwhile, warrants some caution before positioning for an extension of the recent appreciating move witnessed over the past two weeks or so.
The Japanese Yen (JPY) is undermined by the Bank of Japan's (BoJ) decision to hold off on any discussions around JGB tapering until the next meeting. Apart from this, the underlying bullish tone across the global equity markets is seen denting demand for the safe-haven JPY and lending support to the USD/JPY pair. However, speculations that Japanese authorities might intervene to prop up the domestic currency, along with persistent geopolitical tensions and political uncertainty in Europe, should limit any meaningful downside for the JPY.
Furthermore, the BoJ Governor Kazuo Ueda's hawkish remarks earlier this week, saying that the central bank could raise rates in July depending on economic data, might hold back the JPY bears from placing aggressive bets. Meanwhile, the US Dollar (USD) continues with its struggle to attract any meaningful buyers and languishes near the weekly low amid expectations that the Federal Reserve (Fed) will cut interest rates twice this year, bolstered by signs that inflation is subsiding. This might contribute to keeping a lid on the USD/JPY pair.
Market participants now look to Thursday's US economic docket, featuring the release of the usual Initial Jobless Claims, the Philly Fed Manufacturing Index and housing market data – Building Permits and Housing Starts. This, along with the US bond yields and Fedspeak, will influence the USD price dynamics and provide some impetus to the USD/JPY pair. Traders will further take cues from the broader risk sentiment to grab short-term opportunities ahead of the Japan National Core CPI and the global flash PMI prints on Friday.
| Raw materials | Closed | Change, % |
|---|---|---|
| Silver | 29.761 | 0.81 |
| Gold | 2328.78 | -0 |
| Palladium | 903.88 | 1.57 |
- Gold price gained some positive traction on Thursday amid September Fed rate cut bets.
- Geopolitical risks and political uncertainty in Europe also lend support to the XAU/USD.
- Rebounding US bond yields and a positive risk tone might cap any further positive move.
Gold price (XAU/USD) attracts some buyers during the Asian session on Thursday and climbs to over a one-week top, around the $2,338 area in the last hour. The incoming US macro data pointed to signs of easing inflationary pressures and that the economy is slowing down, fueling speculations that the Federal Reserve (Fed) will cut interest rates twice this year. The expectations keep the US Dollar (USD) pinned near the weekly low and turn out to be a key factor acting as a tailwind for the commodity.
Adding to this, geopolitical tensions and renewed political uncertainty in Europe lend additional support to the safe-haven precious metal. Meanwhile, the Fed last week adopted a more hawkish stance, and policymakers continue to argue in favor of one rate cut in 2024. This, along with a goodish bounce in the US Treasury bond yields, might cap any further appreciating move for the non-yielding Gold price. Apart from this, a positive risk tone might contribute to keeping a lid on the XAU/USD.
Daily Digest Market Movers: Gold price benefits from rising bets for two Fed rate cuts in 2024
- The uncertainty over the likely timing of when the Federal Reserve will start cutting interest rates keeps traders on the sidelines and leads to subdued range-bound price action around the Gold price.
- The Fed projected only one interest rate cut this year as compared to three projected in March, which acts as a tailwind for the US Treasury bond yields and caps the upside for the non-yielding yellow metal.
- The US Retail Sales data released on Tuesday pointed to lackluster economic activity, which, along with weaker US consumer and producer prices, should allow the Fed to ease monetary policy soon.
- The current market pricing indicates a greater chance of the first rate cut in September and the possibility of one more rate cut in November or December, offering some support to the XAU/USD.
- Ukrainian drone strikes on Russian energy infrastructure and Israeli's warning that an all-out war with Iran-backed Hezbollah was coming soon point to escalating geopolitical risk in Europe and the Middle East.
- Adding to this, concerns that a new government in France could weaken fiscal discipline act as a tailwind for the safe-haven assets and should help limit any meaningful downfall for the commodity.
- Investors now look forward to the Swiss National Bank (SNB) decision and the crucial Bank of England (BoE) policy meeting, which might infuse volatility and provide some impetus to the metal.
- Traders will further take cues from the US economic docket, featuring the release of the usual Weekly Initial Jobless Claims, Philly Fed Manufacturing Index, Building Permits and Housing Starts.
Technical Analysis: Gold price needs to surpass the 50-day SMA barrier for bulls to seize control
From a technical perspective, bulls might still wait for a sustained strength beyond the 50-day Simple Moving Average (SMA) support breakpoint-turned-resistance, currently pegged near the $2,344-2,345 region, before placing fresh bets. The subsequent move-up will suggest that the recent corrective decline has run its course and lifts the Gold price beyond the $2,360-2,362 zone, towards the $2,387-2,388 intermediate hurdle en route to the $2,400 mark. The momentum could extend further towards the all-time peak, around the $2,450 area touched in May.
On the flip side, the $2,320-2,318 region is likely to protect the immediate downside ahead of the $2,300 mark. Some follow-through selling below the $2,285 horizontal support will be seen as a fresh trigger for bearish traders and pave the way for the resumption of the recent pullback from the record high. The Gold price might then accelerate the fall towards the next relevant support near the $2,254-2,253 region before eventually dropping to the $2,225-2,220 support and the $2,200 round-figure mark.
Gold FAQs
Gold has played a key role in human’s history as it has been widely used as a store of value and medium of exchange. Currently, apart from its shine and usage for jewelry, the precious metal is widely seen as a safe-haven asset, meaning that it is considered a good investment during turbulent times. Gold is also widely seen as a hedge against inflation and against depreciating currencies as it doesn’t rely on any specific issuer or government.
Central banks are the biggest Gold holders. In their aim to support their currencies in turbulent times, central banks tend to diversify their reserves and buy Gold to improve the perceived strength of the economy and the currency. High Gold reserves can be a source of trust for a country’s solvency. Central banks added 1,136 tonnes of Gold worth around $70 billion to their reserves in 2022, according to data from the World Gold Council. This is the highest yearly purchase since records began. Central banks from emerging economies such as China, India and Turkey are quickly increasing their Gold reserves.
Gold has an inverse correlation with the US Dollar and US Treasuries, which are both major reserve and safe-haven assets. When the Dollar depreciates, Gold tends to rise, enabling investors and central banks to diversify their assets in turbulent times. Gold is also inversely correlated with risk assets. A rally in the stock market tends to weaken Gold price, while sell-offs in riskier markets tend to favor the precious metal.
The price can move due to a wide range of factors. Geopolitical instability or fears of a deep recession can quickly make Gold price escalate due to its safe-haven status. As a yield-less asset, Gold tends to rise with lower interest rates, while higher cost of money usually weighs down on the yellow metal. Still, most moves depend on how the US Dollar (USD) behaves as the asset is priced in dollars (XAU/USD). A strong Dollar tends to keep the price of Gold controlled, whereas a weaker Dollar is likely to push Gold prices up.
- The Indian Rupee (INR) posts modest gains on the softer US Dollar on Thursday.
- Significant inflows into Indian markets might support the INR, while renewed US Dollar demand could cap the upside.
- Investors await the US weekly Initial Jobless Claims, Housing data, and Philly Fed Manufacturing Index, which are due on Thursday.
The Indian Rupee (INR) trades with mild gains on Thursday amid the modest decline of the US Dollar (USD). The INR depreciation on Wednesday underscores the pressure from local importers and oil companies demanding USD. Furthermore, the rise in crude oil prices might contribute to the INR’s downside as India is the third largest consumer of crude oil in the world, after the United States and China.
Nonetheless, the significant inflows into Indian equities and bond markets could boost the INR in the near term. Meanwhile, the speculation that the US Federal Reserve (Fed) might cut the interest rate two times in 2024, beginning in September, might undermine the Greenback and create a headwind for the pair.
Looking ahead, the US weekly Initial Jobless Claims, Building Permits, Housing Starts and the Philly Fed Manufacturing Index will be released on Thursday. The attention will shift to the Indian HSBC Manufacturing and Services PMI on Friday, along with the US S&P Global PMI reports.
Daily Digest Market Movers: Indian Rupee recovers amid strong inflow into Indian markets
- Indian equity indices reached fresh record highs for the fourth consecutive session before ending on a flat note. The BSE Sensex ended at 77,337.59, dropped 41.90 points or 0.18%, while the Nifty50 closed at 77,337.60, up 36.46 points or 0.05%.
- The Indian Rupee may rise beyond 83.20 once inflows from India's inclusion in the JPMorgan emerging market debt index begin later this month, said Sajal Gupta, head of FX and commodities at Nuvama Wealth Management's institutional desk.
- Fitch Ratings raised India’s growth forecast from 7% in March to 7.2% due to the recovery in consumer spending and increased investment.
- "The Rupee is likely to hold in the 83-83.55 band in the next few trading sessions" with the Reserve Bank of India firmly capping sharp declines below 83.55,” said Anil Kumar Bhansali, head of treasury at Finrex Treasury Advisors.
- Traders have priced in a nearly 67% chance of a 25 basis points (bps) for a Fed rate cut in September, up from 61% a day ago, according to the CME FedWatch tool.
- The US Initial Jobless Claims for the week ending June 15 are estimated to drop by 235K from the previous week of 242K.
Technical analysis: USD/INR paints a positive picture in the longer term
The Indian Rupee trades stronger on the day. The USD/INR pair maintains the constructive outlook unchanged above the key 100-day Exponential Moving Average (EMA) on the daily chart. Nonetheless, further consolidation looks favorable amid the neutral level of the 14-day Relative Strength Index (RSI).
In the bullish case, the first upside target for the pair will emerge at 83.55 (high of June 18). The next barrier is located at 83.72 (high of April 17) and then the 84.00 psychological level.
On the flip side, the key support level is seen near 83.30, the 100-day EMA. Any follow-through selling below this level will pave the way to 83.00 (round figure), followed by 82.78 (low of January 15).
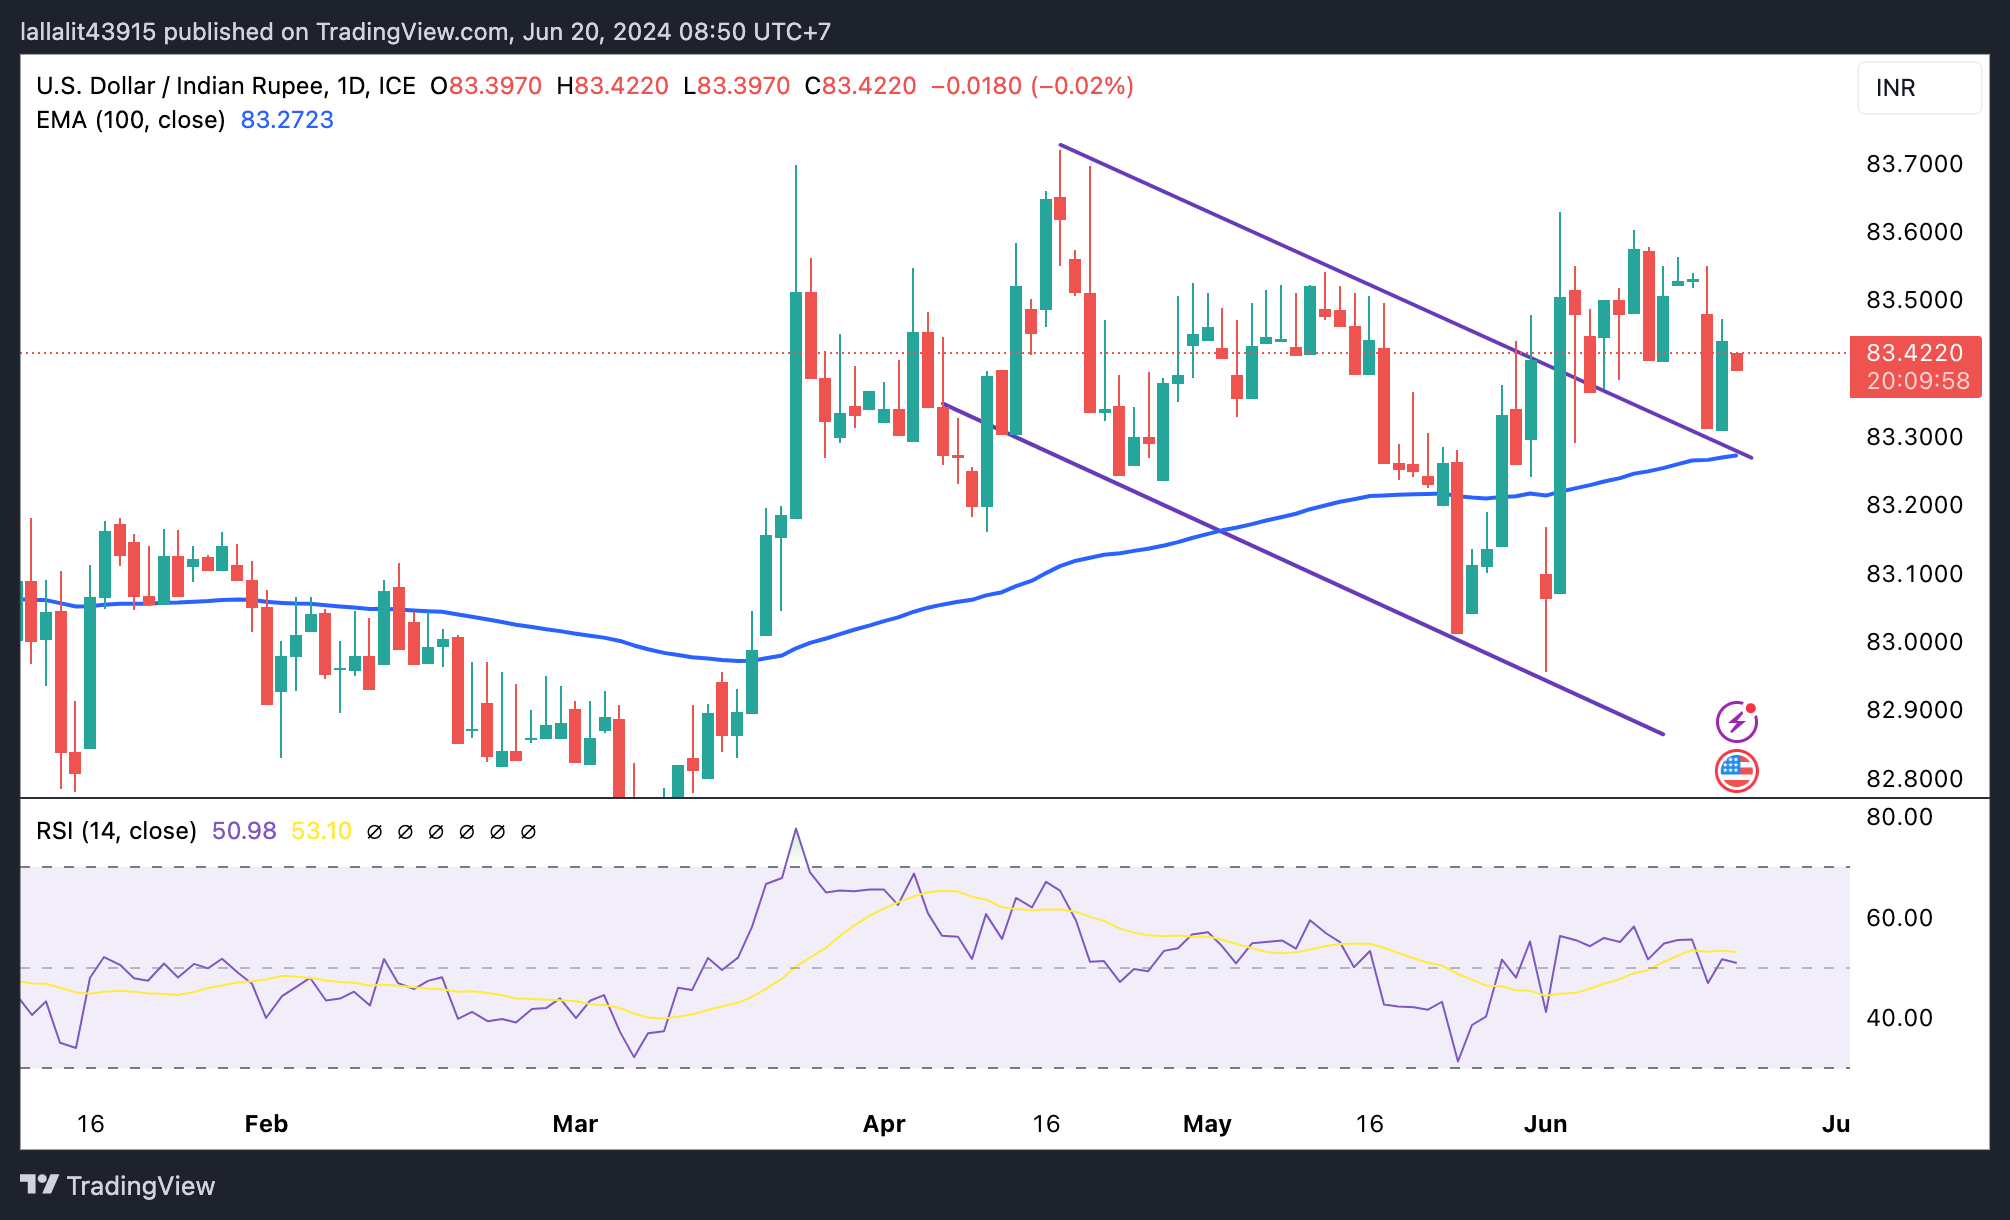
Indian Rupee FAQs
The Indian Rupee (INR) is one of the most sensitive currencies to external factors. The price of Crude Oil (the country is highly dependent on imported Oil), the value of the US Dollar – most trade is conducted in USD – and the level of foreign investment, are all influential. Direct intervention by the Reserve Bank of India (RBI) in FX markets to keep the exchange rate stable, as well as the level of interest rates set by the RBI, are further major influencing factors on the Rupee.
The Reserve Bank of India (RBI) actively intervenes in forex markets to maintain a stable exchange rate, to help facilitate trade. In addition, the RBI tries to maintain the inflation rate at its 4% target by adjusting interest rates. Higher interest rates usually strengthen the Rupee. This is due to the role of the ‘carry trade’ in which investors borrow in countries with lower interest rates so as to place their money in countries’ offering relatively higher interest rates and profit from the difference.
Macroeconomic factors that influence the value of the Rupee include inflation, interest rates, the economic growth rate (GDP), the balance of trade, and inflows from foreign investment. A higher growth rate can lead to more overseas investment, pushing up demand for the Rupee. A less negative balance of trade will eventually lead to a stronger Rupee. Higher interest rates, especially real rates (interest rates less inflation) are also positive for the Rupee. A risk-on environment can lead to greater inflows of Foreign Direct and Indirect Investment (FDI and FII), which also benefit the Rupee.
Higher inflation, particularly, if it is comparatively higher than India’s peers, is generally negative for the currency as it reflects devaluation through oversupply. Inflation also increases the cost of exports, leading to more Rupees being sold to purchase foreign imports, which is Rupee-negative. At the same time, higher inflation usually leads to the Reserve Bank of India (RBI) raising interest rates and this can be positive for the Rupee, due to increased demand from international investors. The opposite effect is true of lower inflation.
The People’s Bank of China (PBoC) set the USD/CNY central rate for the trading session ahead on Thursday at 7.1192, as against the previous day's fix of 7.1159 and 7.2653 Reuters estimates.
The People's Bank of China announced on Thursday that it maintained the Loan Prime Rate (LPR) unchanged across the time curve, as widely expected.
The Chinese central bank maintained the one-year and five-year LPRs steady at 3.45% and 3.95%, respectively.
In February, the PBOC lowered the five-year LPR by 25 basis points (bps) from 4.20% to 3.95.
Market reaction
At the time of writing, AUD/USD is holding lower ground near 0.6670, losing 0.05% on the day.
Australian Dollar FAQs
One of the most significant factors for the Australian Dollar (AUD) is the level of interest rates set by the Reserve Bank of Australia (RBA). Because Australia is a resource-rich country another key driver is the price of its biggest export, Iron Ore. The health of the Chinese economy, its largest trading partner, is a factor, as well as inflation in Australia, its growth rate and Trade Balance. Market sentiment – whether investors are taking on more risky assets (risk-on) or seeking safe-havens (risk-off) – is also a factor, with risk-on positive for AUD.
The Reserve Bank of Australia (RBA) influences the Australian Dollar (AUD) by setting the level of interest rates that Australian banks can lend to each other. This influences the level of interest rates in the economy as a whole. The main goal of the RBA is to maintain a stable inflation rate of 2-3% by adjusting interest rates up or down. Relatively high interest rates compared to other major central banks support the AUD, and the opposite for relatively low. The RBA can also use quantitative easing and tightening to influence credit conditions, with the former AUD-negative and the latter AUD-positive.
China is Australia’s largest trading partner so the health of the Chinese economy is a major influence on the value of the Australian Dollar (AUD). When the Chinese economy is doing well it purchases more raw materials, goods and services from Australia, lifting demand for the AUD, and pushing up its value. The opposite is the case when the Chinese economy is not growing as fast as expected. Positive or negative surprises in Chinese growth data, therefore, often have a direct impact on the Australian Dollar and its pairs.
Iron Ore is Australia’s largest export, accounting for $118 billion a year according to data from 2021, with China as its primary destination. The price of Iron Ore, therefore, can be a driver of the Australian Dollar. Generally, if the price of Iron Ore rises, AUD also goes up, as aggregate demand for the currency increases. The opposite is the case if the price of Iron Ore falls. Higher Iron Ore prices also tend to result in a greater likelihood of a positive Trade Balance for Australia, which is also positive of the AUD.
The Trade Balance, which is the difference between what a country earns from its exports versus what it pays for its imports, is another factor that can influence the value of the Australian Dollar. If Australia produces highly sought after exports, then its currency will gain in value purely from the surplus demand created from foreign buyers seeking to purchase its exports versus what it spends to purchase imports. Therefore, a positive net Trade Balance strengthens the AUD, with the opposite effect if the Trade Balance is negative.
| Index | Change, points | Closed | Change, % |
|---|---|---|---|
| NIKKEI 225 | 88.65 | 38570.76 | 0.23 |
| Hang Seng | 514.84 | 18430.39 | 2.87 |
| KOSPI | 33.41 | 2797.33 | 1.21 |
| ASX 200 | -8.4 | 7769.7 | -0.11 |
| DAX | -64.06 | 18067.91 | -0.35 |
| CAC 40 | -58.6 | 7570.2 | -0.77 |
- USD/CAD gains ground near 1.3710 in Thursday’s early Asian session.
- The weaker US Retail Sales data fueled Fed rate cut expectations and might cap the Greenback’s upside.
- The BoC policymakers worried about downside risks and the possibility of a widening divergence between Canada and the US.
The USD/CAD pair trades with mild gains around 1.3710, snapping the four-day losing streak during the early Asian trading hours on Thursday. The modest recovery of the US Dollar (USD) might be limited amid reduced bets of the US Federal Reserve (Fed) rate cut this year.
The softer-than-expected US Retail Sales data for May boosts the expectation that the US Fed will reduce interest rates this year, which might drag the Greenback and Treasury yields lower. The Fed officials maintain the data-dependent approach. Fed Bank of New York President John Williams said on Tuesday that interest rates will come down gradually over time as inflation eases, but he declined to say about the timing that Fed can begin easing monetary policy. Meanwhile, Boston Fed President Susan Collins stated that it is still too early to say whether or not inflation is on course toward the target.
Traders will take more cues from the US weekly Initial Jobless Claims, Building Permits, Housing Starts, the Philly Fed Manufacturing Index, and the speech by the Fed’s Barkin, which are due later on Thursday. The US Initial Jobless Claims are expected to drop 235K from the previous week of 242K. The better-than-expected reading could lift the Greenback and cap the downside for the pair.
The Bank of Canada's (BoC) latest Summary of Deliberations on Wednesday stated that the BoC policymaker has worried about downside risks and the possibility of a widening divergence between Canada and the US. The Canadian central bank decided to cut its policy rate to 4.75% from 5% on June 5, the first cut in four years. Investors see at least two more rate cuts before the end of 2023, and priced in nearly 60% odds of a quarter-point rate cut in a July meeting, according to Refinitiv data.
| Pare | Closed | Change, % |
|---|---|---|
| AUDUSD | 0.66698 | 0.17 |
| EURJPY | 169.76 | 0.14 |
| EURUSD | 1.07445 | 0.03 |
| GBPJPY | 200.958 | 0.16 |
| GBPUSD | 1.27188 | 0.06 |
| NZDUSD | 0.61315 | -0.22 |
| USDCAD | 1.3706 | -0.07 |
| USDCHF | 0.88429 | 0.03 |
| USDJPY | 157.985 | 0.1 |


© 2000-2026. Sva prava zaštićena.
Sajt je vlasništvo kompanije Teletrade D.J. LLC 2351 LLC 2022 (Euro House, Richmond Hill Road, Kingstown, VC0100, St. Vincent and the Grenadines).
Svi podaci koji se nalaze na sajtu ne predstavljaju osnovu za donošenje investicionih odluka, već su informativnog karaktera.
The company does not serve or provide services to customers who are residents of the US, Canada, Iran, The Democratic People's Republic of Korea, Yemen and FATF blacklisted countries.
Izvršenje trgovinskih operacija sa finansijskim instrumentima upotrebom marginalne trgovine pruža velike mogućnosti i omogućava investitorima ostvarivanje visokih prihoda. Međutim, takav vid trgovine povezan je sa potencijalno visokim nivoom rizika od gubitka sredstava. Проведение торговых операций на финанcовых рынках c маржинальными финанcовыми инcтрументами открывает широкие возможноcти, и позволяет инвеcторам, готовым пойти на риcк, получать выcокую прибыль, но при этом неcет в cебе потенциально выcокий уровень риcка получения убытков. Iz tog razloga je pre započinjanja trgovine potrebno odlučiti o izboru odgovarajuće investicione strategije, uzimajući u obzir raspoložive resurse.
Upotreba informacija: U slučaju potpunog ili delimičnog preuzimanja i daljeg korišćenja materijala koji se nalazi na sajtu, potrebno je navesti link odgovarajuće stranice na sajtu kompanije TeleTrade-a kao izvora informacija. Upotreba materijala na internetu mora biti praćena hiper linkom do web stranice teletrade.org. Automatski uvoz materijala i informacija sa stranice je zabranjen.
Ako imate bilo kakvih pitanja, obratite nam se pr@teletrade.global.
транcфери