- Analiza
- Novosti i instrumenti
- Vesti sa tržišta
Forex-novosti i prognoze od 19-08-2024
- The New Zealand Dollar gains momentum in Tuesday’s early Asian session.
- The positive risk sentiment weighs on the US Dollar and lifts NZD/USD.
- Investors await the PBoC rate decision ahead of Fedspeak on Tuesday.
The New Zealand Dollar (NZD) trades in positive territory for the third consecutive day on Tuesday. The risk-on sentiment in global markets and easing geopolitical risks in the Middle East continue to undermine the Greenback. Nonetheless, the dovish remarks from the Reserve Bank of New Zealand (RBNZ) after a surprise rate cut last week might cap the pair’s upside. RBNZ Governor Adrian Orr said on Monday that he is more convinced that inflation has returned to the 1-3% target area, boosting the likelihood of more rate reductions in the future.
Looking ahead, investors will keep an eye on the People’s Bank of China’s (PBoC) Interest Rate Decision, along with the Fed’s Raphael Bostic and Michael Barr speeches on Tuesday. On Friday, New Zealand’s Retail Sales data and Fed Chair Powell's speech at the Jackson Hole symposium will be in the spotlight.
Daily Digest Market Movers: New Zealand Dollar gathers strength amid broad USD weakness
- New Zealand’s Trade Balance came in at NZD $-9.29B YoY in July versus $-9.5B prior, according to the latest data released by Statistics New Zealand on Tuesday.
- New Zealand’s Exports decreased to $6.15B in July versus $6.17B in June whereas Imports rose to $7.11B compared to $5.45B in previous readings.
- Federal Reserve Bank of Minneapolis President Neel Kashkari said on Monday that it was appropriate to discuss potentially cutting US interest rates in September due to concerns about the weakening labor market, per Reuters.
- Chicago Fed President Austan Goolsbee said on Sunday that the US economy does not show signs of overheating, so Fed policymakers should be cautious about keeping restrictive policy in place longer than necessary.
- The markets are now pricing in a nearly 77% chance of a 25 basis points (bps) Fed rate cut in its September meeting, according to the CME FedWatch Tool.
Technical Analysis: New Zealand Dollar resumes its broader bullish trend
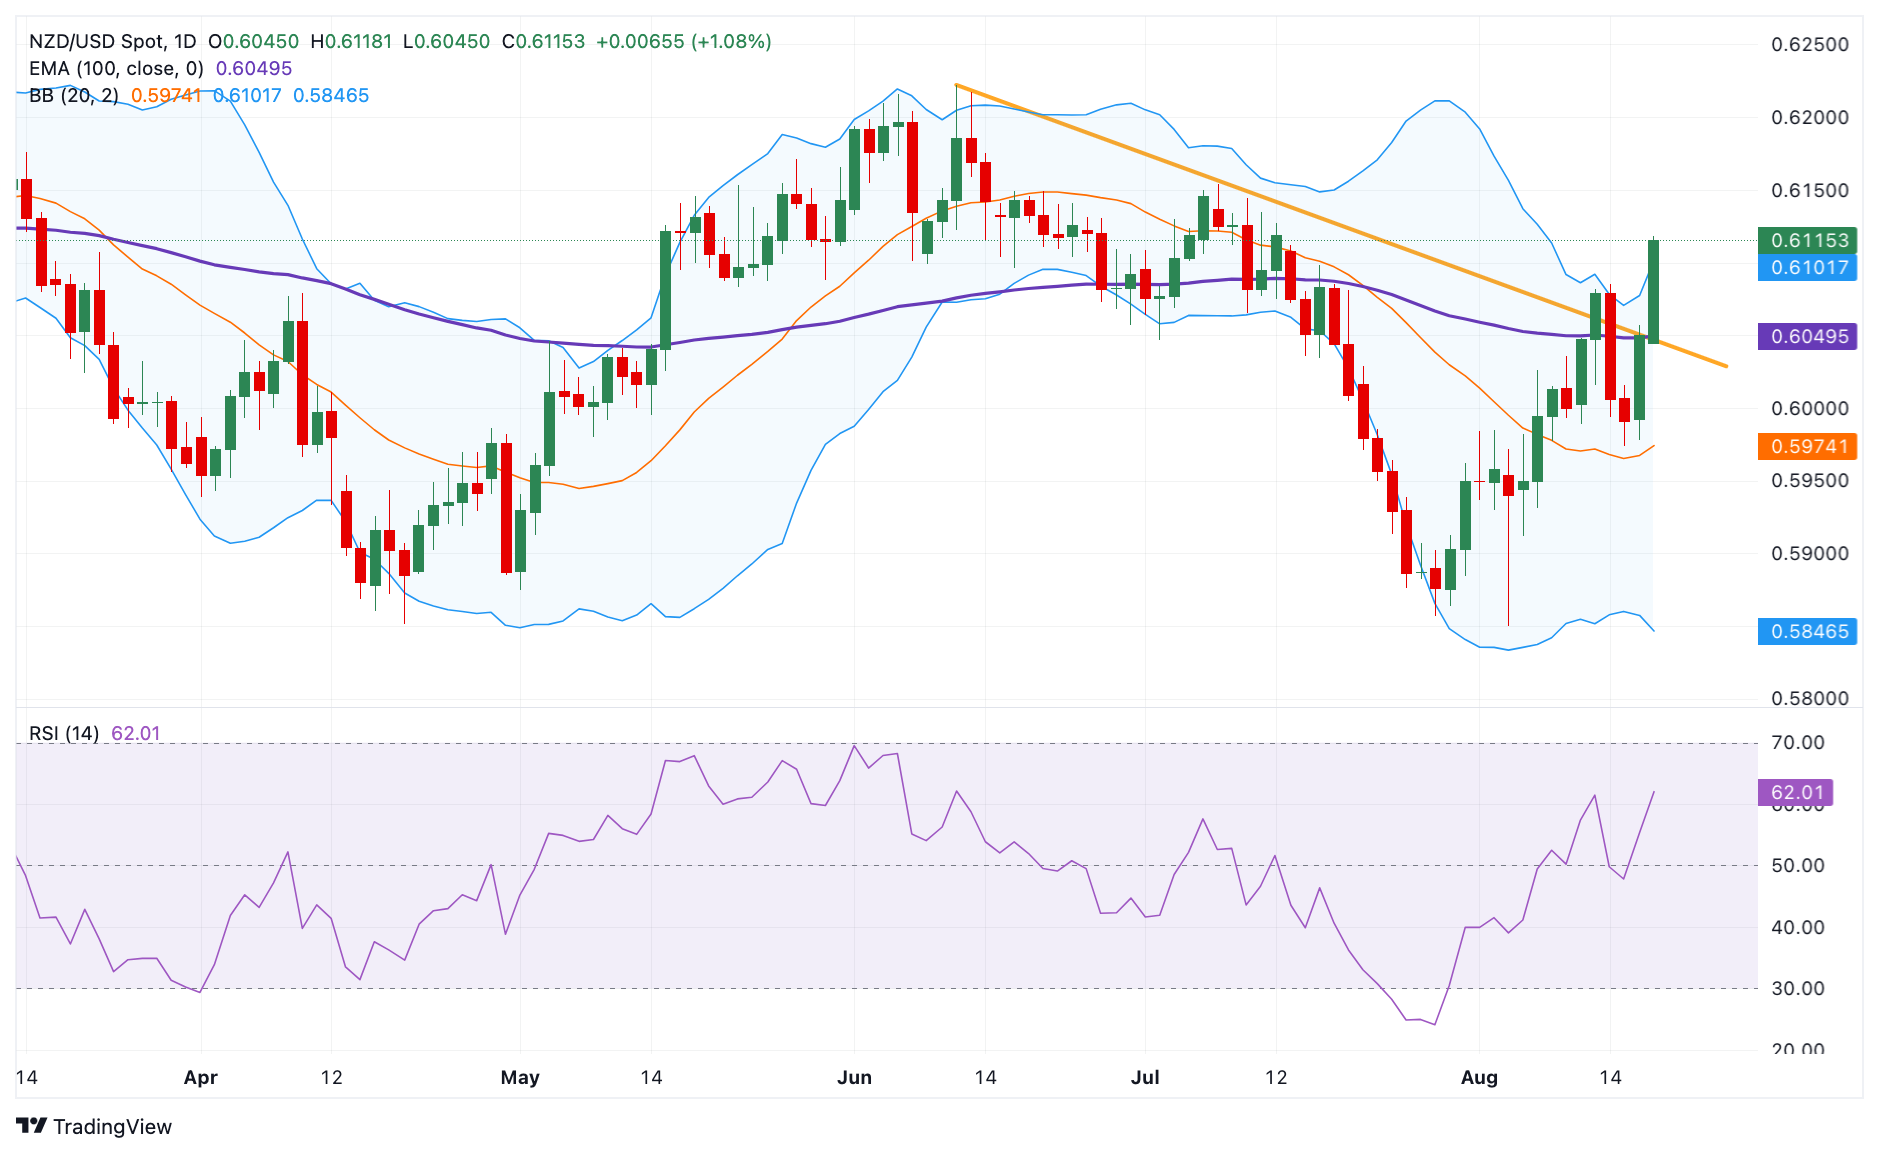
The New Zealand Dollar edges higher on the day. The NZD/USD pair resumes its upside journey on the daily chart after breaking above the descending trendline on Monday. Furthermore, the pair holds above the key 100-day Exponential Moving Average (EMA), with the bullish 14-day Relative Strength Index (RSI) above the midline near 62.0, supporting buyers for the time being.
A decisive break above the upper boundary of the Bollinger Band at the 0.6100 psychological level could pave the way to 0.6154, the high of July 8. Further north, the next hurdle emerges at 0.6222, the high of June 12.
On the flip side, the crucial support level for NZD/USD is seen at 0.6050, representing the 100-day EMA and descending trendline. Sustained trading below this level could expose 0.5974, the low of August 15. The next contention level is located at 0.5846, the lower limit of the Bollinger Band.
New Zealand Dollar FAQs
The New Zealand Dollar (NZD), also known as the Kiwi, is a well-known traded currency among investors. Its value is broadly determined by the health of the New Zealand economy and the country’s central bank policy. Still, there are some unique particularities that also can make NZD move. The performance of the Chinese economy tends to move the Kiwi because China is New Zealand’s biggest trading partner. Bad news for the Chinese economy likely means less New Zealand exports to the country, hitting the economy and thus its currency. Another factor moving NZD is dairy prices as the dairy industry is New Zealand’s main export. High dairy prices boost export income, contributing positively to the economy and thus to the NZD.
The Reserve Bank of New Zealand (RBNZ) aims to achieve and maintain an inflation rate between 1% and 3% over the medium term, with a focus to keep it near the 2% mid-point. To this end, the bank sets an appropriate level of interest rates. When inflation is too high, the RBNZ will increase interest rates to cool the economy, but the move will also make bond yields higher, increasing investors’ appeal to invest in the country and thus boosting NZD. On the contrary, lower interest rates tend to weaken NZD. The so-called rate differential, or how rates in New Zealand are or are expected to be compared to the ones set by the US Federal Reserve, can also play a key role in moving the NZD/USD pair.
Macroeconomic data releases in New Zealand are key to assess the state of the economy and can impact the New Zealand Dollar’s (NZD) valuation. A strong economy, based on high economic growth, low unemployment and high confidence is good for NZD. High economic growth attracts foreign investment and may encourage the Reserve Bank of New Zealand to increase interest rates, if this economic strength comes together with elevated inflation. Conversely, if economic data is weak, NZD is likely to depreciate.
The New Zealand Dollar (NZD) tends to strengthen during risk-on periods, or when investors perceive that broader market risks are low and are optimistic about growth. This tends to lead to a more favorable outlook for commodities and so-called ‘commodity currencies’ such as the Kiwi. Conversely, NZD tends to weaken at times of market turbulence or economic uncertainty as investors tend to sell higher-risk assets and flee to the more-stable safe havens.
- EUR/USD gains half of a percent as markets force the Greenback lower.
- Impending major central banking summit has investors looking out for Fedspeak.
- EU and US PMIs due later in the week.
EUR/USD rallied into a half-percent gain on Monday as investors kick off the new trading week with a fresh dog-pile into broad-market buy buttons. The Fiber was bolstered cleanly above 1.1050 and is headed firmly for a retest of the 1.1100 handle. Recently, a rough patch of bad US data reignited investor fears of an impending US recession, but a late upswing in more recent US data prints has soothed investor nerves, who have to returned to waiting for signs of rate cuts from the Federal Reserve (Fed).
Forex Today: Attention shifts to Fedspeak ahead of Jackson Hole
The midweek stretch is a quiet affair as markets await key PMI data from both the EU and the US, as well as the kickoff of this year’s Jackson Hole Economic Symposium. All three are expected to land on markets beginning on Thursday.
Pan-EU HCOB Purchasing Managers Index (PMI) figures are expected to test higher in August. EU MoM Manufacturing PMI numbers are expected to clip into 46.0 from 45.8, while the Services PMI component is forecast to hold steady at 51.9 over the same period.
Across the Atlantic, US PMI figures are expected to soften on Thursday. US Manufacturing PMI in August is expected to tick down slightly to 49.5 from 49.6, while US Services PMI numbers are forecast to fall an entire point to 54.0 from 55.0.
The Jackson Hole Economic Symposium, slated to kick off a multi-day central banker extravaganza on Thursday, will have investors across the globe tuning in for any signals from Fed policymakers about the likelihood of a Fed rate cut in September.
Recent bets of a double cut in September have eased significantly after reaching a peak of 70% two weeks ago. According to the CME’s FedWatch Tool, rate markets are pricing in a scant one-in-five chance of a 50 bps cut on September 18. Overall, markets still have a 25 bps cut in September fully priced in, with three or four quarter-point cuts expected by the end of the year.
EUR/USD price forecast
EUR/USD set a new bidding high for 2024 on Monday, tapping 1.1086 as markets lean firmly into a risk-on stance. The Euro continues to rise against the Greenback unabated, kicking firmly above the 1.1000 handle as bidders drive the Fiber towards 1.1100. Bullish momentum fell short of reclaiming the key technical price handle, but buying power remains firm as the pair continues to climb.
EUR/USD has chalked in a nearly 3% gain bottom-to-top since the beginning of August, after the pair launched north following a swing low into the 200-day Exponential Moving Average (EMA) near 1.0800.
EUR/USD daily chart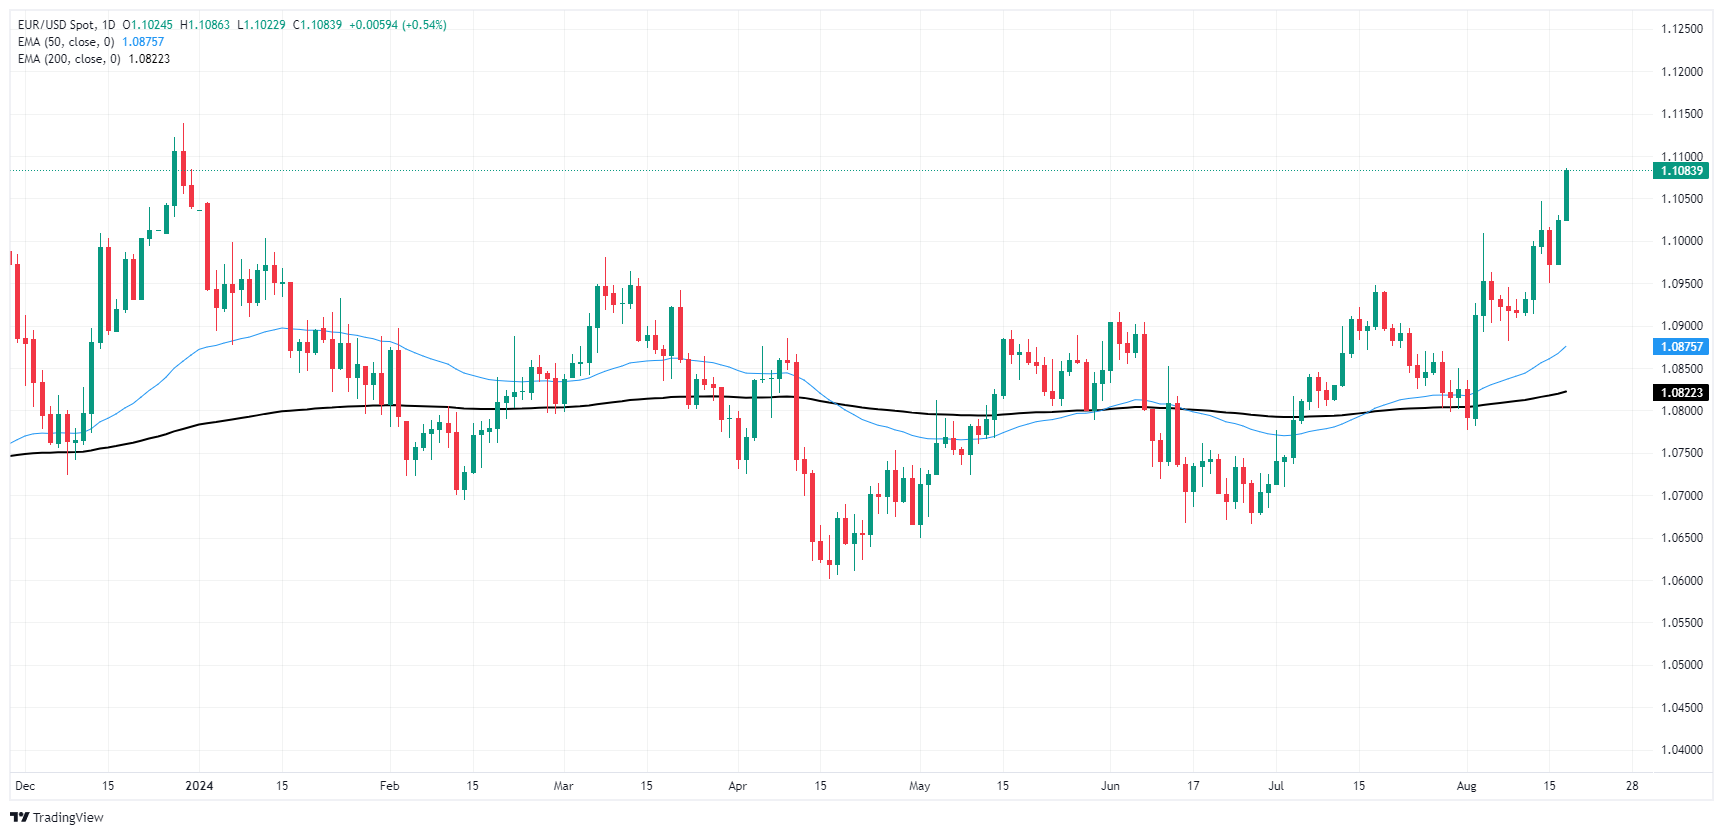
Euro FAQs
The Euro is the currency for the 20 European Union countries that belong to the Eurozone. It is the second most heavily traded currency in the world behind the US Dollar. In 2022, it accounted for 31% of all foreign exchange transactions, with an average daily turnover of over $2.2 trillion a day. EUR/USD is the most heavily traded currency pair in the world, accounting for an estimated 30% off all transactions, followed by EUR/JPY (4%), EUR/GBP (3%) and EUR/AUD (2%).
The European Central Bank (ECB) in Frankfurt, Germany, is the reserve bank for the Eurozone. The ECB sets interest rates and manages monetary policy. The ECB’s primary mandate is to maintain price stability, which means either controlling inflation or stimulating growth. Its primary tool is the raising or lowering of interest rates. Relatively high interest rates – or the expectation of higher rates – will usually benefit the Euro and vice versa. The ECB Governing Council makes monetary policy decisions at meetings held eight times a year. Decisions are made by heads of the Eurozone national banks and six permanent members, including the President of the ECB, Christine Lagarde.
Eurozone inflation data, measured by the Harmonized Index of Consumer Prices (HICP), is an important econometric for the Euro. If inflation rises more than expected, especially if above the ECB’s 2% target, it obliges the ECB to raise interest rates to bring it back under control. Relatively high interest rates compared to its counterparts will usually benefit the Euro, as it makes the region more attractive as a place for global investors to park their money.
Data releases gauge the health of the economy and can impact on the Euro. Indicators such as GDP, Manufacturing and Services PMIs, employment, and consumer sentiment surveys can all influence the direction of the single currency. A strong economy is good for the Euro. Not only does it attract more foreign investment but it may encourage the ECB to put up interest rates, which will directly strengthen the Euro. Otherwise, if economic data is weak, the Euro is likely to fall. Economic data for the four largest economies in the euro area (Germany, France, Italy and Spain) are especially significant, as they account for 75% of the Eurozone’s economy.
Another significant data release for the Euro is the Trade Balance. This indicator measures the difference between what a country earns from its exports and what it spends on imports over a given period. If a country produces highly sought after exports then its currency will gain in value purely from the extra demand created from foreign buyers seeking to purchase these goods. Therefore, a positive net Trade Balance strengthens a currency and vice versa for a negative balance.
- GBP/USD fell just shy of reclaiming the 1.3000 handle on Monday.
- UK and US PMIs slated for Thursday this week.
- Jackson Hole Economic Symposium kickoff looms ahead.
GBP/USD rose one-third of one percent after the US Dollar continued to recede to kick off the new trading week. Greenback flows extended a near-term course reversal as investors shrug off a recent downswing in market sentiment. A rough patch of bad US data reignited investor fears of an impending US recession, but a late upswing in recent US data prints have soothed investor nerves, who have to returned to waiting for signs of rate cuts from the Federal Reserve (Fed).
Forex Today: Attention shifts to Fedspeak ahead of Jackson Hole
The midweek stretch is a quiet affair as markets await key data on Thursday as well as the kickoff of this year’s Jackson Hole Economic Symposium. All three are expected to land on markets beginning on Thursday.
UK Purchasing Managers Index (PMI) figures are expected to hold on the high side in August. UK MoM Manufacturing PMI numbers are expected to hold steady at 52.1, while the Services PMI component is forecast to tick upwards to 52.8 from 52.5 over the same period.
Across the Atlantic, US PMI figures are expected to soften on Thursday. US Manufacturing PMI in August is expected to tick down slightly to 49.5 from 49.6, while US Services PMI numbers are forecast to fall an entire point to 54.0 from 55.0.
The Jackson Hole Economic Symposium, slated to kick off a multi-day central banker extravaganza on Thursday, will have investors across the globe tuning in for any signals from Fed policymakers about the likelihood of a Fed rate cut in September.
Recent bets of a double cut in September have eased significantly after reaching a peak of 70% two weeks ago. According to the CME’s FedWatch Tool, rate markets are pricing in a scant one-in-five chance of a 50 bps cut on September 18. Overall, markets still have a 25 bps cut in September fully priced in, with three or four quarter-point cuts expected by the end of the year.
GBP/USD price forecast
Despite a firm extension of bullish momentum on Monday, GBP/USD bidders were unable to recapture the 1.3000 major price handle, hanging price action out to dry at key resistance levels on the tail end of a one-sided momentum play. Near-term momentum traders will be looking for an opportunity to jump short, targeting a decline back into the 50-day Exponential Moving Average (EMA) near 1.2800.
GBP/USD daily chart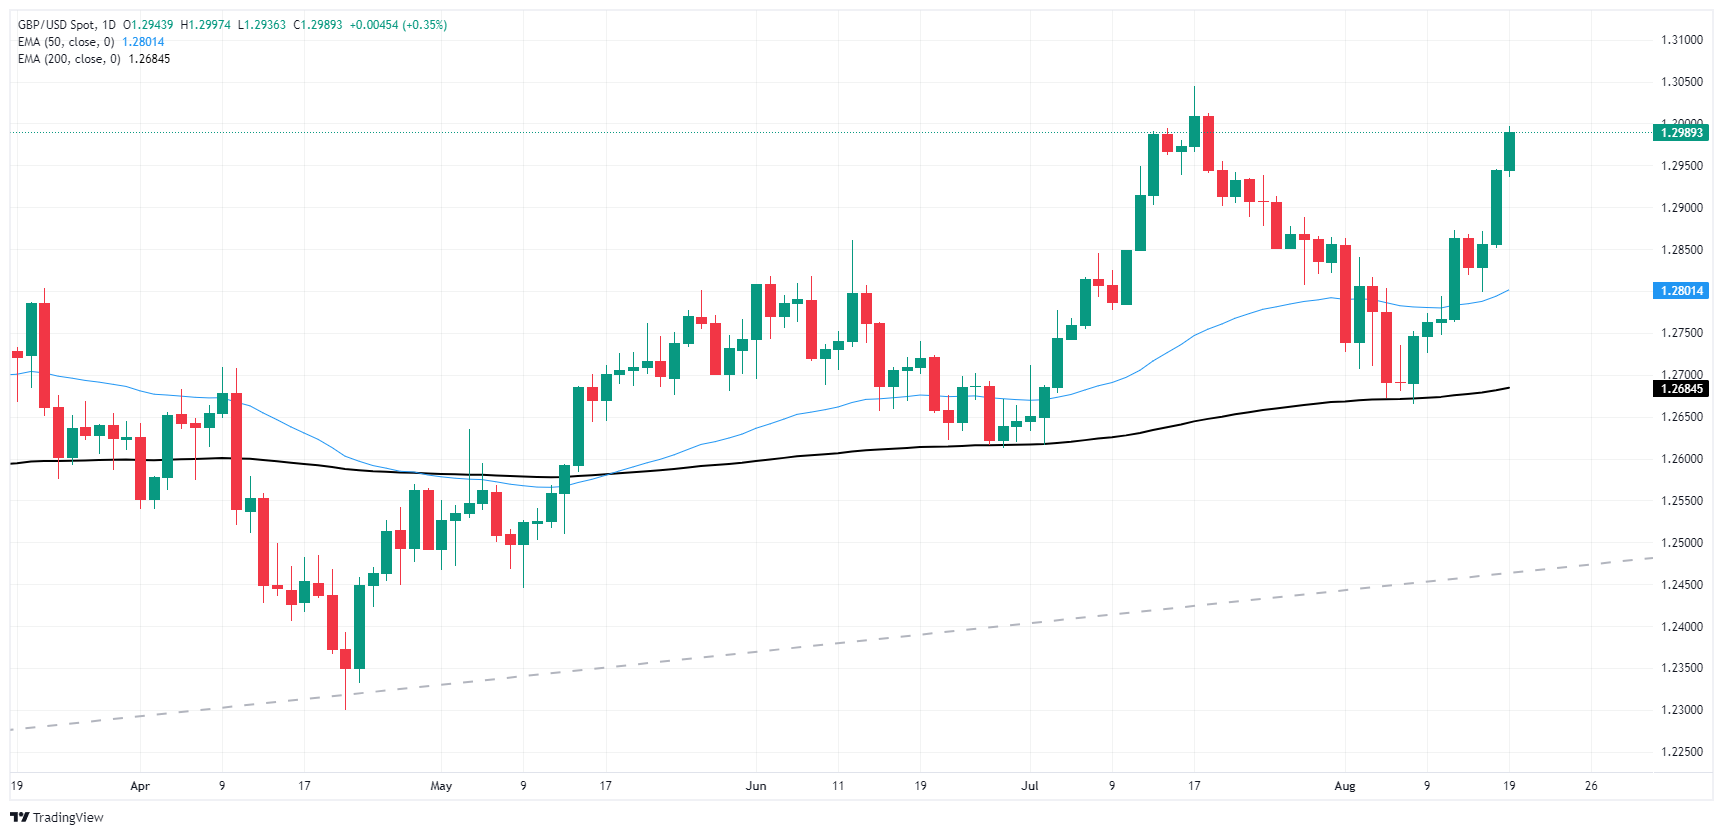
Pound Sterling FAQs
The Pound Sterling (GBP) is the oldest currency in the world (886 AD) and the official currency of the United Kingdom. It is the fourth most traded unit for foreign exchange (FX) in the world, accounting for 12% of all transactions, averaging $630 billion a day, according to 2022 data. Its key trading pairs are GBP/USD, aka ‘Cable’, which accounts for 11% of FX, GBP/JPY, or the ‘Dragon’ as it is known by traders (3%), and EUR/GBP (2%). The Pound Sterling is issued by the Bank of England (BoE).
The single most important factor influencing the value of the Pound Sterling is monetary policy decided by the Bank of England. The BoE bases its decisions on whether it has achieved its primary goal of “price stability” – a steady inflation rate of around 2%. Its primary tool for achieving this is the adjustment of interest rates. When inflation is too high, the BoE will try to rein it in by raising interest rates, making it more expensive for people and businesses to access credit. This is generally positive for GBP, as higher interest rates make the UK a more attractive place for global investors to park their money. When inflation falls too low it is a sign economic growth is slowing. In this scenario, the BoE will consider lowering interest rates to cheapen credit so businesses will borrow more to invest in growth-generating projects.
Data releases gauge the health of the economy and can impact the value of the Pound Sterling. Indicators such as GDP, Manufacturing and Services PMIs, and employment can all influence the direction of the GBP. A strong economy is good for Sterling. Not only does it attract more foreign investment but it may encourage the BoE to put up interest rates, which will directly strengthen GBP. Otherwise, if economic data is weak, the Pound Sterling is likely to fall.
Another significant data release for the Pound Sterling is the Trade Balance. This indicator measures the difference between what a country earns from its exports and what it spends on imports over a given period. If a country produces highly sought-after exports, its currency will benefit purely from the extra demand created from foreign buyers seeking to purchase these goods. Therefore, a positive net Trade Balance strengthens a currency and vice versa for a negative balance.
- NZD/USD soared to 0.6100, extending Friday's gains.
- RSI stands above 60 and MACD’s rising green bars hint at a increasing bullish momentum.
- Outlook will be bright if the bulls hold above 0.6100.
In Monday's session, the NZD/USD rose by more than 0.80% to 0.6100, tallying a two-day winning streak. The pair has been trading in within a range between 0.5980 and 0.6110 for the past few weeks but the breakout of Monday suggests a stronger upward momentum.
On the daily chart, the Relative Strength Index (RSI) jumped to 61 while Moving Average Convergence Divergence (MACD) is showing rising green bars, suggesting increasing bullish momentum. These indicators suggest that the buying pressure is gathering strength and a further rise is possible.
NZD/USD daily chart
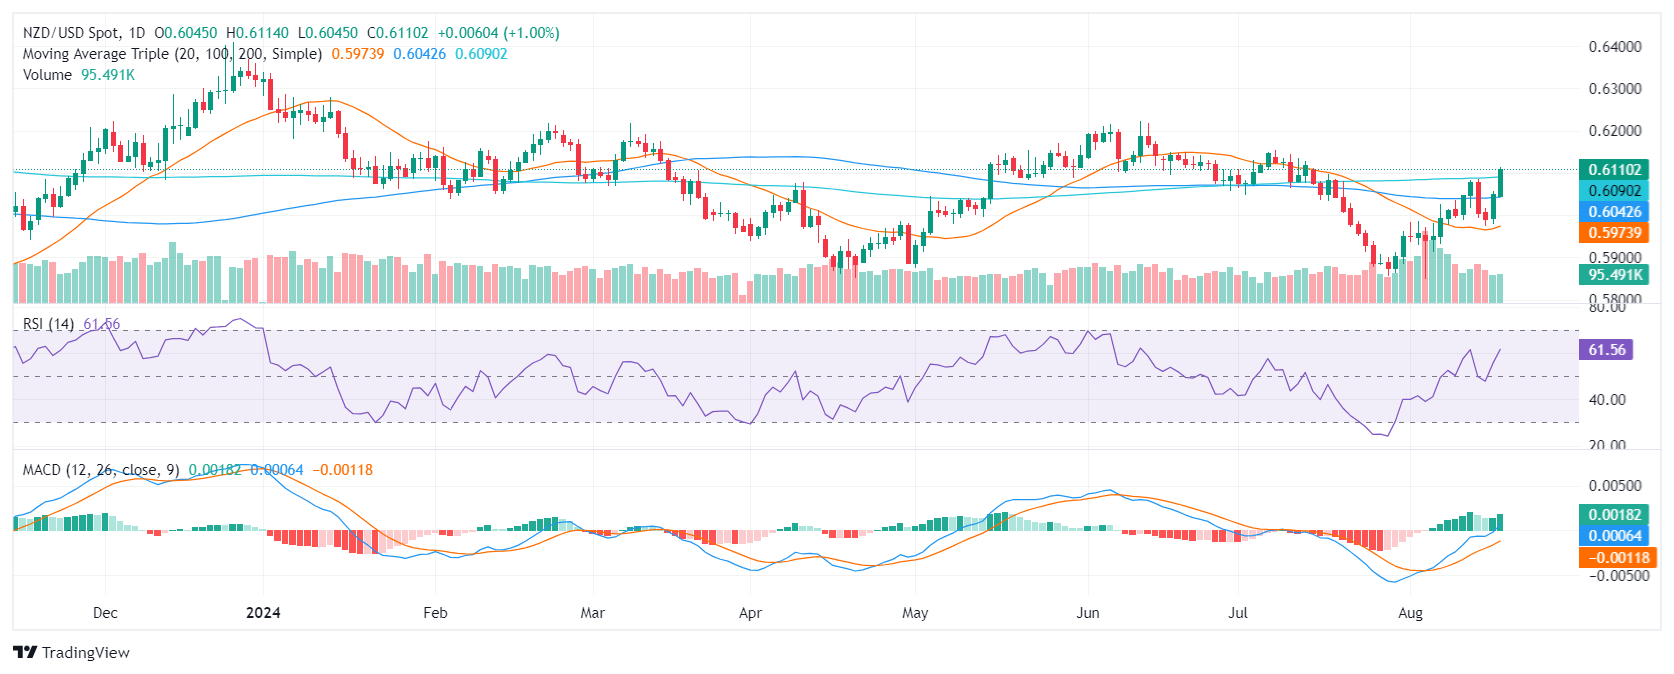
The NZD/USD pair is facing immediate resistance at 0.6110, the top of the range it has been trading in. A consolidation above this level could open the door for a further rally towards 0.6150 (the recent swing high before the pullback). On the downside, immediate support lies at 0.6070 and a break below this level could lead to a deeper correction towards 0.6030. Traders should monitor any breaks above or below the mentioned levels as they could set the pace for the next sessions.
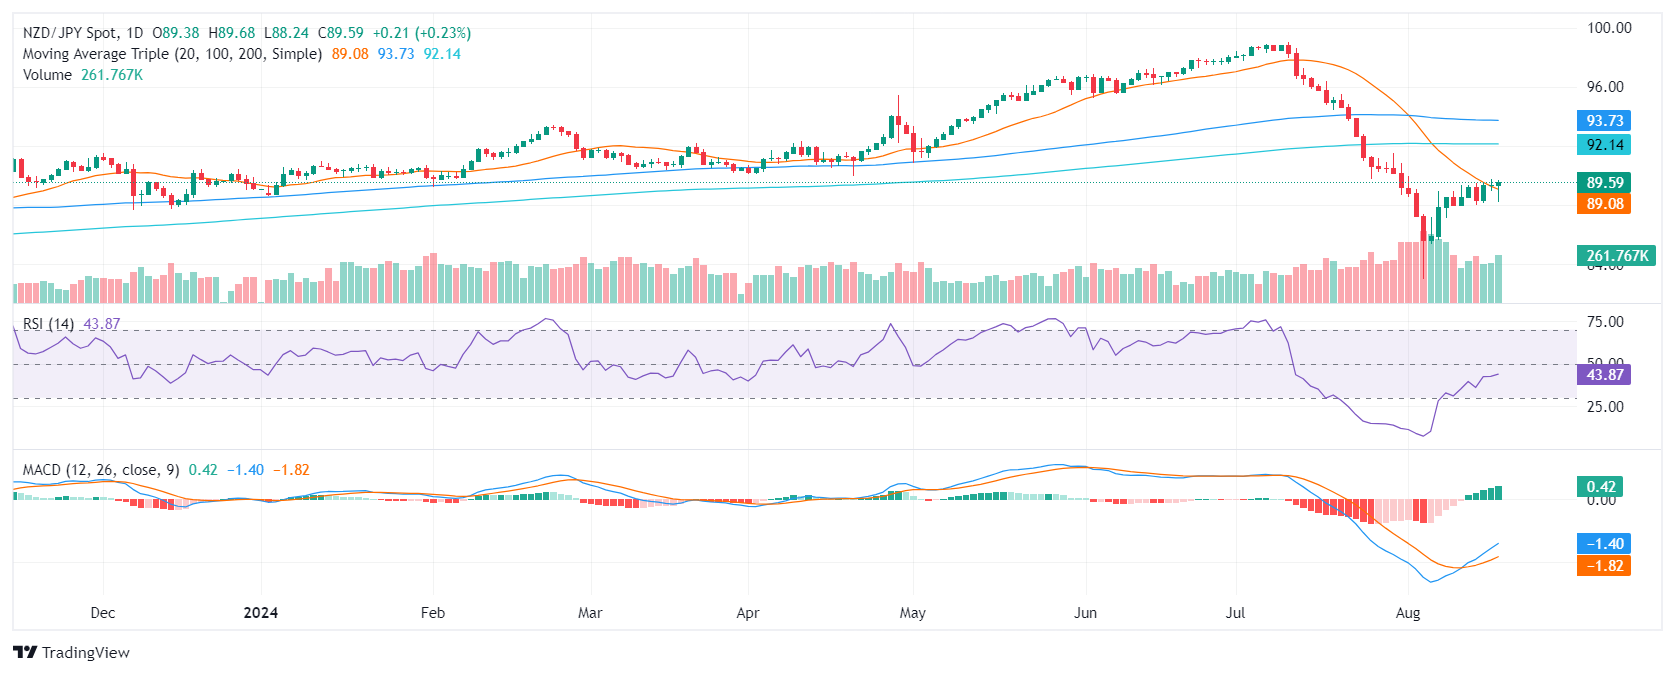
- NZD/JPY advanced by 0.15% in Monday's session, landing at 89.50.
- The RSI has climbed near the neutral zone while the MACD remains flat, suggesting a lack of clear momentum.
- The pair is trading within a range of 88.75 and 89.80; a breakout from either boundary could signal further directional movement.
The NZD/JPY currency pair has experienced sideways trading for over a week, with Monday's session witnessing a modest gain of 0.15%, settling at 89.50. The pair has been unable to break above the resistance level of 89.80 since the beginning of August.
Technical indicators paint a mixed picture. The Relative Strength Index (RSI) has rebounded slightly and is currently hovering around 43, indicating neutral market sentiment. The Moving Average Convergence Divergence (MACD), a momentum indicator, is printing flat green bars, suggesting that there is no clear momentum in either direction. This neutral stance implies that neither the bulls nor the bears are holding a significant advantage.
Volume has been consistently low, indicating a lack of conviction in the recent price movements. The pair is currently trading within a range between 88.75 and 89.80. A break below could lead to further declines towards 88.00, while a break above could push the pair up to 90.00.
NZD/JPY daily chart
- The Canadian Dollar gained ground against the US Dollar, but fell elsewhere.
- Canada set to deliver the latest round of CPI inflation figures on Tuesday.
- Jackson Hole looms large later in the week.
The Canadian Dollar (CAD) broadly shed weight on Monday, declining across the board except for a firm performance against the US Dollar, rising one-third of one percent against the softening Greenback. Market flows into and out of the CAD remain subdued as investors buckle down for the long wait to the Jackson Hole Economic Symposium set to kick off later this week.
Canada’s latest inflation print is due on Tuesday, with headline Consumer Price Index (CPI) inflation forecast to tick lower in July, while core CPI is expected to accelerate in a price growth bump after contracting the previous month. The Bank of Canada’s (BoC) own core CPI inflation tracker last printed 1.9% YoY in June.
Daily digest market movers: Canadian CPI approaches as Fed watch continues to grind away
- Markets are broadly looking ahead to this week’s kick-off of the Jackson Hole Economic Symposium, where rate-cut-hungry investors will be hanging on every word from Federal Reserve (Fed) policymakers.
- Recent bets of a double cut in September have eased significantly after reaching a peak of 70% two weeks ago. According to the CME’s FedWatch Tool, rate markets are pricing in a scant one-in-five chance of a 50 bps cut on September 18.
- Overall, markets still have a 25 bps cut in September fully priced in, with three or four quarter-point cuts expected by the end of the year.
- Canadian Consumer Price Index (CPI) inflation forecast to tick down to 2.5% from 2.7% for the month of July
- Canadian Core CPI is expected to accelerate to 0.3% MoM from the previous month’s -0.1% contraction.
Canadian Dollar PRICE Today
The table below shows the percentage change of Canadian Dollar (CAD) against listed major currencies today. Canadian Dollar was the strongest against the US Dollar.
| USD | EUR | GBP | JPY | CAD | AUD | NZD | CHF | |
|---|---|---|---|---|---|---|---|---|
| USD | -0.53% | -0.35% | -0.72% | -0.36% | -0.93% | -1.11% | -0.32% | |
| EUR | 0.53% | 0.11% | -0.15% | 0.17% | -0.49% | -0.73% | 0.18% | |
| GBP | 0.35% | -0.11% | -0.42% | 0.03% | -0.61% | -0.77% | 0.07% | |
| JPY | 0.72% | 0.15% | 0.42% | 0.29% | -0.24% | -0.24% | 0.27% | |
| CAD | 0.36% | -0.17% | -0.03% | -0.29% | -0.59% | -0.65% | 0.00% | |
| AUD | 0.93% | 0.49% | 0.61% | 0.24% | 0.59% | -0.08% | 0.67% | |
| NZD | 1.11% | 0.73% | 0.77% | 0.24% | 0.65% | 0.08% | 0.79% | |
| CHF | 0.32% | -0.18% | -0.07% | -0.27% | -0.00% | -0.67% | -0.79% |
The heat map shows percentage changes of major currencies against each other. The base currency is picked from the left column, while the quote currency is picked from the top row. For example, if you pick the Canadian Dollar from the left column and move along the horizontal line to the US Dollar, the percentage change displayed in the box will represent CAD (base)/USD (quote).
Canadian Dollar price forecast: USD/CAD crashes into 200-day EMA, set to run out of gas
The Canadian Dollar gained one-third of one percent against the Greenback on Monday, but broadly fell across the rest of the major currency board to kick off the new trading week. USD/CAD added further bearish fuel to the fire, extending a downside plunge below the 1.3700 handle.
Daily candlesticks are set to run aground of the 200-day Exponential Moving Average (EMA) near 1.3640, and CAD bidders are likely to run out of gas before price action can ease all the way down to 1.3600.
USD/CAD daily chart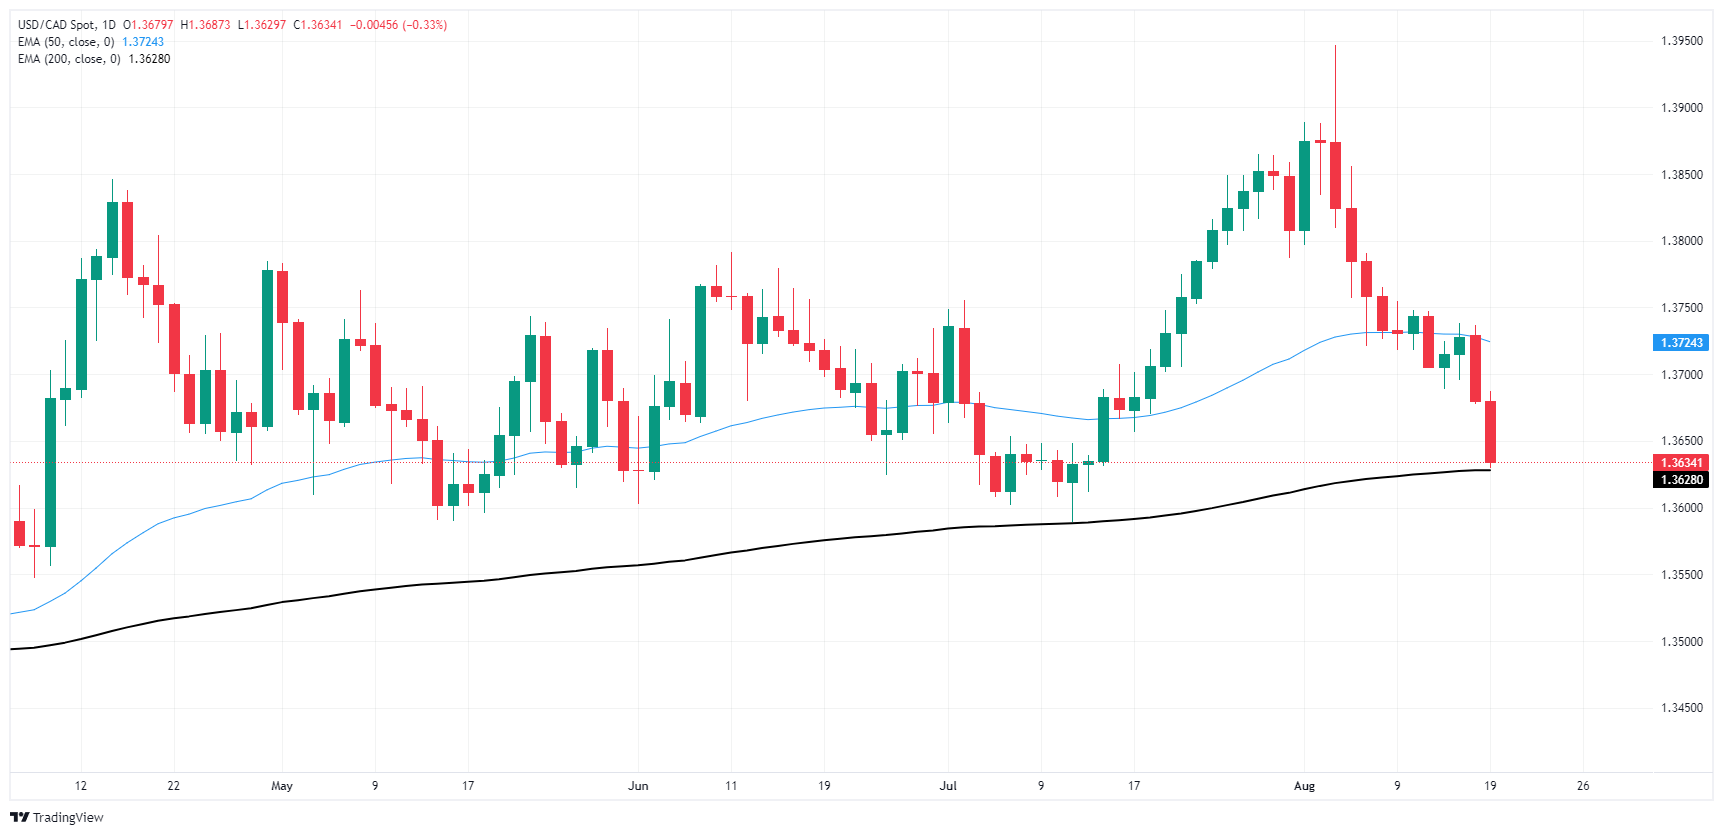
Canadian Dollar FAQs
The key factors driving the Canadian Dollar (CAD) are the level of interest rates set by the Bank of Canada (BoC), the price of Oil, Canada’s largest export, the health of its economy, inflation and the Trade Balance, which is the difference between the value of Canada’s exports versus its imports. Other factors include market sentiment – whether investors are taking on more risky assets (risk-on) or seeking safe-havens (risk-off) – with risk-on being CAD-positive. As its largest trading partner, the health of the US economy is also a key factor influencing the Canadian Dollar.
The Bank of Canada (BoC) has a significant influence on the Canadian Dollar by setting the level of interest rates that banks can lend to one another. This influences the level of interest rates for everyone. The main goal of the BoC is to maintain inflation at 1-3% by adjusting interest rates up or down. Relatively higher interest rates tend to be positive for the CAD. The Bank of Canada can also use quantitative easing and tightening to influence credit conditions, with the former CAD-negative and the latter CAD-positive.
The price of Oil is a key factor impacting the value of the Canadian Dollar. Petroleum is Canada’s biggest export, so Oil price tends to have an immediate impact on the CAD value. Generally, if Oil price rises CAD also goes up, as aggregate demand for the currency increases. The opposite is the case if the price of Oil falls. Higher Oil prices also tend to result in a greater likelihood of a positive Trade Balance, which is also supportive of the CAD.
While inflation had always traditionally been thought of as a negative factor for a currency since it lowers the value of money, the opposite has actually been the case in modern times with the relaxation of cross-border capital controls. Higher inflation tends to lead central banks to put up interest rates which attracts more capital inflows from global investors seeking a lucrative place to keep their money. This increases demand for the local currency, which in Canada’s case is the Canadian Dollar.
Macroeconomic data releases gauge the health of the economy and can have an impact on the Canadian Dollar. Indicators such as GDP, Manufacturing and Services PMIs, employment, and consumer sentiment surveys can all influence the direction of the CAD. A strong economy is good for the Canadian Dollar. Not only does it attract more foreign investment but it may encourage the Bank of Canada to put up interest rates, leading to a stronger currency. If economic data is weak, however, the CAD is likely to fall.
- AUD/USD showed a significant increase of 0.75%, rising to 0.6720.
- The continued hawkish stance of the RBA supports the Aussie against its peers.
- Intense dovish bets on the Fed weigh on the USD.
On Monday, the AUD/USD is gaining significant traction mainly due to a weaker USD on a quiet Monday. In addition, the monetary policy divergence between the Federal Reserve (Fed), set to start cutting in September, versus the reluctance of the Reserve Bank of Australia (RBA) to cut is also pushing the pair upward.
Despite the mixed Australian economic outlook and the high inflation, the RBA's persistent hawkish stance has led to markets pricing in just 25 basis points of easing for 2024, which seems to be making the Aussie gain more traction.
Daily digest market movers: Aussie extends gains through RBA's hawkish guidance
- Aussie showed signs of gaining strength or at least maintaining its current levels, largely due to the hawkish guidance by the RBA.
- Despite the falling trend in iron ore prices, the RBA's persistent hawkish stance is providing significant support to the Australian Dollar.
- The markets are now looking forward to Tuesday’s discourse on the last RBA meeting's minutes, which could influence the pair's future trajectory.
- With a weakened USD due to a quiet Monday session, the AUD/USD pair has the potential for further upside facilitated by the monetary policy difference.
AUD/USD technical outlook: AUD/USD buyers prevail, bullish outlook persists
From a technical perspective, the AUD/USD pair has shown an inclination toward an upward trajectory based on the daily indicators. The Relative Strength Index (RSI), an oscillator that denotes market momentum, has been fluctuating around the mid-levels but has recently risen to 62, implying increased bullish sentiment. The Moving Average Convergence Divergence (MACD) further validates this bullish bias, evident from its rising green bars.
As the pair inches upward, it might face resistance around the 0.6750 mark, a level that presents a tough ceiling. Support is seen at 0.6730, 0.6715 and 0.6700.
Australian Dollar FAQs
One of the most significant factors for the Australian Dollar (AUD) is the level of interest rates set by the Reserve Bank of Australia (RBA). Because Australia is a resource-rich country another key driver is the price of its biggest export, Iron Ore. The health of the Chinese economy, its largest trading partner, is a factor, as well as inflation in Australia, its growth rate and Trade Balance. Market sentiment – whether investors are taking on more risky assets (risk-on) or seeking safe-havens (risk-off) – is also a factor, with risk-on positive for AUD.
The Reserve Bank of Australia (RBA) influences the Australian Dollar (AUD) by setting the level of interest rates that Australian banks can lend to each other. This influences the level of interest rates in the economy as a whole. The main goal of the RBA is to maintain a stable inflation rate of 2-3% by adjusting interest rates up or down. Relatively high interest rates compared to other major central banks support the AUD, and the opposite for relatively low. The RBA can also use quantitative easing and tightening to influence credit conditions, with the former AUD-negative and the latter AUD-positive.
China is Australia’s largest trading partner so the health of the Chinese economy is a major influence on the value of the Australian Dollar (AUD). When the Chinese economy is doing well it purchases more raw materials, goods and services from Australia, lifting demand for the AUD, and pushing up its value. The opposite is the case when the Chinese economy is not growing as fast as expected. Positive or negative surprises in Chinese growth data, therefore, often have a direct impact on the Australian Dollar and its pairs.
Iron Ore is Australia’s largest export, accounting for $118 billion a year according to data from 2021, with China as its primary destination. The price of Iron Ore, therefore, can be a driver of the Australian Dollar. Generally, if the price of Iron Ore rises, AUD also goes up, as aggregate demand for the currency increases. The opposite is the case if the price of Iron Ore falls. Higher Iron Ore prices also tend to result in a greater likelihood of a positive Trade Balance for Australia, which is also positive of the AUD.
The Trade Balance, which is the difference between what a country earns from its exports versus what it pays for its imports, is another factor that can influence the value of the Australian Dollar. If Australia produces highly sought after exports, then its currency will gain in value purely from the surplus demand created from foreign buyers seeking to purchase its exports versus what it spends to purchase imports. Therefore, a positive net Trade Balance strengthens the AUD, with the opposite effect if the Trade Balance is negative.
The continuation of the selling pressure remained unchanged around the Greenback in the context of further improvement in the appetite for the risk-associated universe, all ahead of the release of the FOMC Minutes and the speech by Chief Powell at Jackson Hole.
Here is what you need to know on Tuesday, August 20:
The USD Index (DXY) collapsed to multi-month lows near 101.80 on the back of the intense upbeat sentiment in the risk complex. On August 20, the Fed’s Bostic and Barr are due to speak, seconded by the API’s weekly report on US crude oil inventories.
EUR/USD advanced to new 2024 peaks near the 1.1100 mark in response to the steep decline in the Greenback. The final Inflation Rate in the euro area is expected on August 20, along with Germany’s Producer Prices.
GBP/USD maintained its recovery well in place and approached the key 1.3000 yardstick. Next on tap across the Channel will be Public Sector Net Borrowing figures due on August 21.
USD/JPY dropped to multi-day lows and revisited the low-145.00s following the sharp decline in the US Dollar and mixed yields. The Balance of Trade results will be the next data release noteworthy in Japan on August 21.
An auspicious start to the week saw AUD/USD climb to five-week highs around 0.6730. The RBA Minutes will be published on August 20.
Demand concerns stemming from China and increasing hopes surrounding ceasefire talks in the Middle East dragged prices of WTI to two-week lows near $73.50 per barrel.
Gold prices traded within a narrow range and stayed close to recent all-time highs around the $2,500 mark per ounce troy. Silver rose for the third straight day and surpassed the $29.00 level per ounce, or five-week tops.
- The Dow Jones Industrial Average rose over 150 points in Monday bid.
- Equities continue to recover ground as market sentiment climbs.
- Previous recession fears have eased following upbeat US data.
The Dow Jones Industrial Average (DJIA) climbed over 150 points in quiet trading on Monday as US market indexes broadly gain ground. Investors have rediscovered their risk appetite after a recent broad-based plunge sparked by fresh recession fears off the back of US economic data tilting to the downside faster than many had expected. However, an upturn at the tail end of a recent batch of US figures has soothed investor fears, and markets are broadly climbing once more.
Markets will now pivot to fully focus on upcoming central bank speaking notes as the Jackson Hole Economic Symposium looms ahead later in the week. At the current cut, markets still have a September rate cut fully priced in, according to the CME’s FedWatch Tool. Odds of a double cut for 50 bps have eased to less than 25% this week, down from a two-week high of over 70%, with rate traders piling into bets of a more reasonable 25 bps cut on September 18.
Dow Jones news
Most of the Dow Jones is on the rise on Monday, with over two-thirds of the equity board climbing into the green. McDonald’s Corp. (MCD) is gaining ground, climbing 3.4% to $288.00 per share. Intel Corp. (INTC) followed behind, rising 2.5% to $21.39 per share.
On the low end, Boeing Corp. (BA) fell a full percent to $178.15 per share as the aviation company struggles to return value to investors, with Apple Inc. (AAPL) declining -0.7% to $224.50 per share.
Dow Jones price forecast
The Dow Jones is on pace to chalk in a fifth straight bullish candle on Monday, tapping an intraday high of 40,907.54 as the major equity index continues to climb after hitting a near-term low of 38,382.90 in recent weeks.
The DJIA is slowly grinding its way back towards all-time highs set in July at 31,371.38, and bullish momentum remains the flavor of the week as investors claw back ground. A technical floor is priced in at the 50-day Exponential Moving Average (EMA) at 39,728.00.
Dow Jones daily chart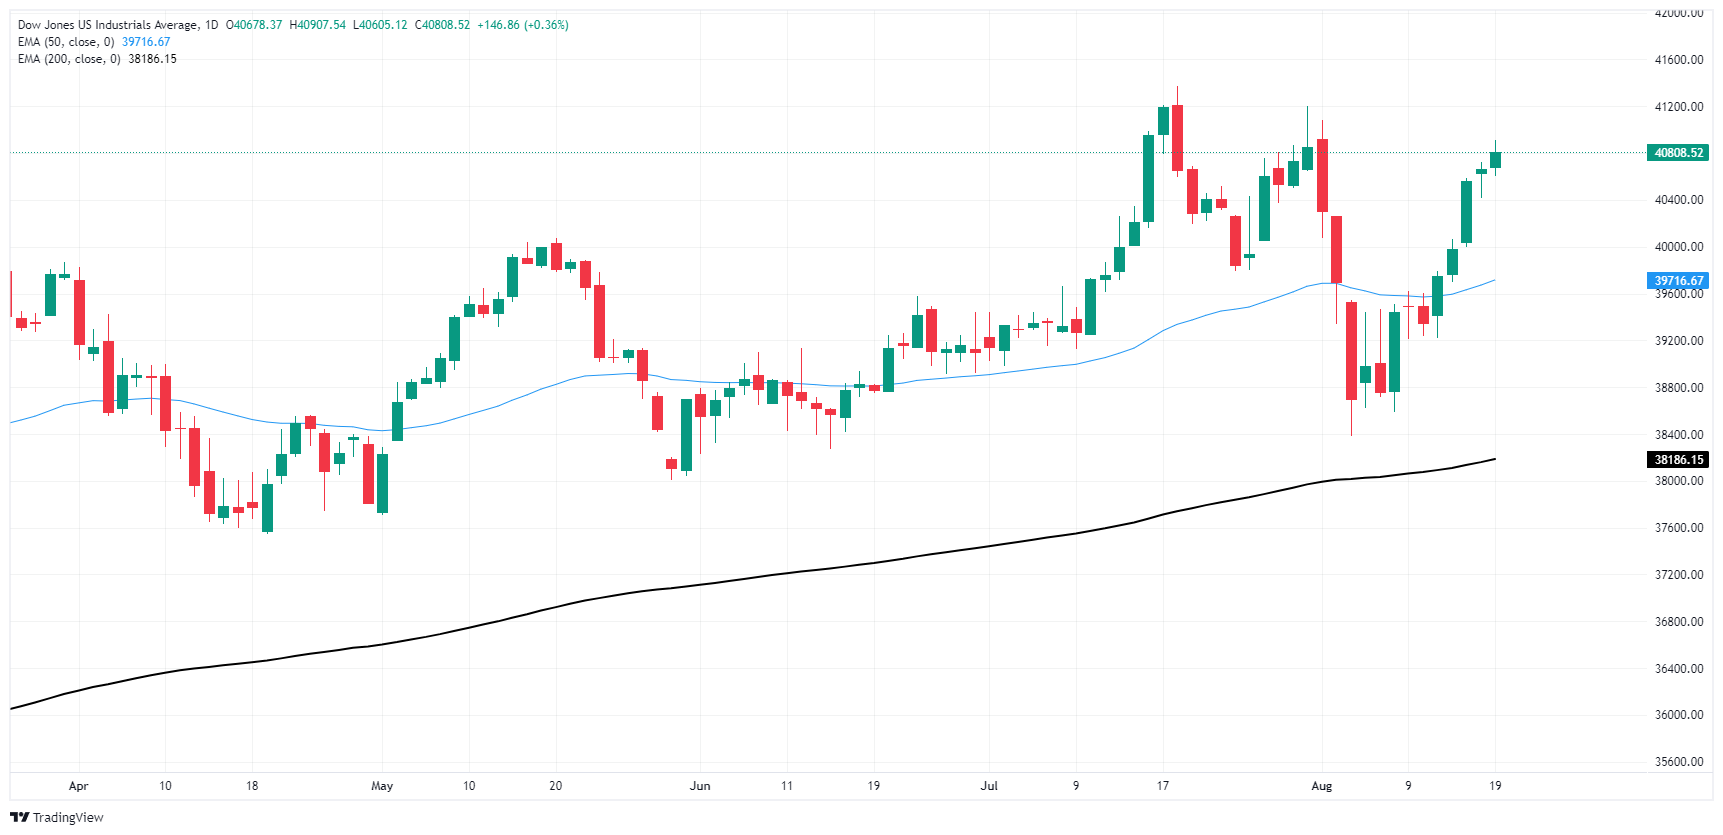
Dow Jones FAQs
The Dow Jones Industrial Average, one of the oldest stock market indices in the world, is compiled of the 30 most traded stocks in the US. The index is price-weighted rather than weighted by capitalization. It is calculated by summing the prices of the constituent stocks and dividing them by a factor, currently 0.152. The index was founded by Charles Dow, who also founded the Wall Street Journal. In later years it has been criticized for not being broadly representative enough because it only tracks 30 conglomerates, unlike broader indices such as the S&P 500.
Many different factors drive the Dow Jones Industrial Average (DJIA). The aggregate performance of the component companies revealed in quarterly company earnings reports is the main one. US and global macroeconomic data also contributes as it impacts on investor sentiment. The level of interest rates, set by the Federal Reserve (Fed), also influences the DJIA as it affects the cost of credit, on which many corporations are heavily reliant. Therefore, inflation can be a major driver as well as other metrics which impact the Fed decisions.
Dow Theory is a method for identifying the primary trend of the stock market developed by Charles Dow. A key step is to compare the direction of the Dow Jones Industrial Average (DJIA) and the Dow Jones Transportation Average (DJTA) and only follow trends where both are moving in the same direction. Volume is a confirmatory criteria. The theory uses elements of peak and trough analysis. Dow’s theory posits three trend phases: accumulation, when smart money starts buying or selling; public participation, when the wider public joins in; and distribution, when the smart money exits.
There are a number of ways to trade the DJIA. One is to use ETFs which allow investors to trade the DJIA as a single security, rather than having to buy shares in all 30 constituent companies. A leading example is the SPDR Dow Jones Industrial Average ETF (DIA). DJIA futures contracts enable traders to speculate on the future value of the index and Options provide the right, but not the obligation, to buy or sell the index at a predetermined price in the future. Mutual funds enable investors to buy a share of a diversified portfolio of DJIA stocks thus providing exposure to the overall index.
- USD is pressured by a pullback in US Treasury yields due to anticipated clarity on the Fed's policy.
- Fed officials express concern over potential easing with the US economy growing above trend.
- Investors await Powell’s remarks at the Jackson Hole Symposium on Thursday.
On Monday, the US Dollar (USD), measured by the US Dollar Index (DXY), declined to its lowest level since January around 102.20 following a pullback in US Treasury yields. Market participants are awaiting clarity on the Federal Reserve's (Fed) policy outlook.
Despite the modest setback, the US economy indicates sustained progress above trend, which suggests the market may be overestimating aggressive future easing.
Daily digest market movers: US Dollar weakens as market anticipates strong Fed easing
- DXY Index is expected to weaken in the short term due to the market's perception that the Fed is set to relax monetary policy in light of recent data indicating an economic slowdown.
- July Retail Sales report showed a stronger-than-expected rise, signaling resilient consumer spending and suggesting the US economy may not be as weak as feared.
- The robust labor market continues to drive wage increases, supporting consumer spending and suggesting no immediate recession threat.
- This suggests that the market seems to be overestimating the Fed, and that might get a surprise if the bank delays the cutting cycle.
- On Thursday and Friday, Fed Chair Jerome Powell will be on the wires at the Jackson Hole Symposium, where markets will look for clues regarding the next steps.
DXY technical outlook: A weakening bias persists and DXY loses key support
The technical indicators for the DXY Index are consolidating, albeit in negative territory, reflecting subdued price action with the Relative Strength Index (RSI) down deeply near 30. The Moving Average Convergence Divergence (MACD) bars appear to be growing red, suggesting consistent selling pressure. The index break signals the end of sideways trading in the 102.50-103.30 channel, which strengthens selling arguments.
Support Levels: 102.20, 102.00, 101.80.
Resistance Levels: 103.00, 103.50, 104.00.
US Dollar FAQs
The US Dollar (USD) is the official currency of the United States of America, and the ‘de facto’ currency of a significant number of other countries where it is found in circulation alongside local notes. It is the most heavily traded currency in the world, accounting for over 88% of all global foreign exchange turnover, or an average of $6.6 trillion in transactions per day, according to data from 2022. Following the second world war, the USD took over from the British Pound as the world’s reserve currency. For most of its history, the US Dollar was backed by Gold, until the Bretton Woods Agreement in 1971 when the Gold Standard went away.
The most important single factor impacting on the value of the US Dollar is monetary policy, which is shaped by the Federal Reserve (Fed). The Fed has two mandates: to achieve price stability (control inflation) and foster full employment. Its primary tool to achieve these two goals is by adjusting interest rates. When prices are rising too quickly and inflation is above the Fed’s 2% target, the Fed will raise rates, which helps the USD value. When inflation falls below 2% or the Unemployment Rate is too high, the Fed may lower interest rates, which weighs on the Greenback.
In extreme situations, the Federal Reserve can also print more Dollars and enact quantitative easing (QE). QE is the process by which the Fed substantially increases the flow of credit in a stuck financial system. It is a non-standard policy measure used when credit has dried up because banks will not lend to each other (out of the fear of counterparty default). It is a last resort when simply lowering interest rates is unlikely to achieve the necessary result. It was the Fed’s weapon of choice to combat the credit crunch that occurred during the Great Financial Crisis in 2008. It involves the Fed printing more Dollars and using them to buy US government bonds predominantly from financial institutions. QE usually leads to a weaker US Dollar.
Quantitative tightening (QT) is the reverse process whereby the Federal Reserve stops buying bonds from financial institutions and does not reinvest the principal from the bonds it holds maturing in new purchases. It is usually positive for the US Dollar.
- The Mexican Peso gave back 0.6% against the US Dollar on Monday.
- Mexico has limited representation on the economic calendar this week.
- Jackson Hole looms large in the week ahead alongside US PMI figures.
The Mexican Peso (MXN) returned six-tenths of one percent to Greenback bidders on Monday, paring back recent gains as Peso bulls took a breather. The US Dollar is broadly softer across the board to kick off the new trading week, but recent Peso-positive flows have briefly reversed direction.
Mexico has a scant release schedule on this week’s data docket, and all figures slated to print this week on the Peso side are strictly low-tier numbers. Mexican Retail Sales for the year ended in June are due on Tuesday, and are expected to contract by 1.8% YoY compared to the previous 0.3% growth.
Fortnightly headline and core Mexico inflation figures are due on Thursday. Core Inflation is forecast to tick up slightly to 0.19% from 0.18% in the first half of August, while headline Inflation is forecast to slump to 0.13% over the same period, down sharply from the previous 0.71%.
Daily digest market movers: Greenback goes belly up, but Peso flows need a breather
- Peso bidding has reversed course on Monday, paring back the MXN against the US Dollar.
- Despite a brief easing in buying pressure, the MXN is still up 6.6% against the USD as the Peso recovers from a 22-month low.
- Markets are broadly looking ahead to this week’s kick-off of the Jackson Hole Economic Symposium, where rate-cut-hungry investors will be hanging on every word from Federal Reserve (Fed) policymakers.
- Recent bets of a double cut in September have eased significantly after reaching a peak of 70% two weeks ago. According to the CME’s FedWatch Tool, rate markets are pricing in a scant one-in-five chance of a 50 bps cut on September 18.
- Overall, markets still have a 25 bps cut in September fully priced in, with three or four quarter-point cuts expected by the end of the year.
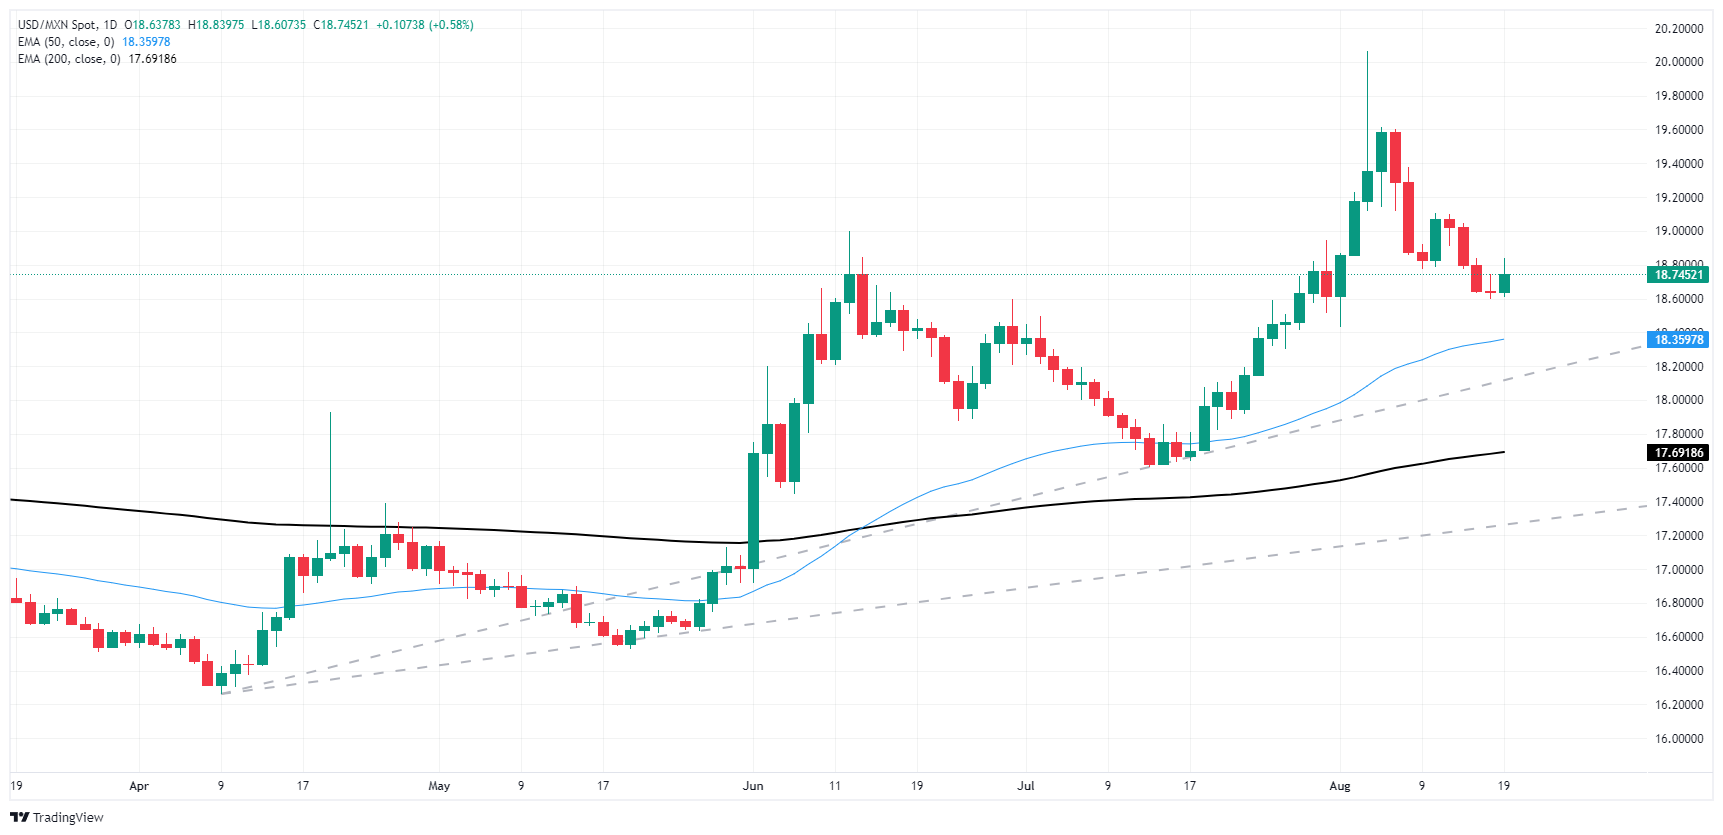
Mexican Peso price forecast: Pullback leaves Peso bidders primed for another leg, but technical limits remain
The Mexican Peso’s recent recovery against the US Dollar has sent USD/MXN bids skidding toward 18.50. Still, a long-run bullish trend in the chart leaves Peso bidders grappling with an accelerating pattern of higher lows as the Greenback trends higher against the MXN.
Price action is poised for a continued decline into the 50-day Exponential Moving Average (EMA) at 18.35, with a hard floor priced in at the rising trendline drawn from April’s lows near 16.25.
USD/MXN daily chart
Mexican Peso FAQs
The Mexican Peso (MXN) is the most traded currency among its Latin American peers. Its value is broadly determined by the performance of the Mexican economy, the country’s central bank’s policy, the amount of foreign investment in the country and even the levels of remittances sent by Mexicans who live abroad, particularly in the United States. Geopolitical trends can also move MXN: for example, the process of nearshoring – or the decision by some firms to relocate manufacturing capacity and supply chains closer to their home countries – is also seen as a catalyst for the Mexican currency as the country is considered a key manufacturing hub in the American continent. Another catalyst for MXN is Oil prices as Mexico is a key exporter of the commodity.
The main objective of Mexico’s central bank, also known as Banxico, is to maintain inflation at low and stable levels (at or close to its target of 3%, the midpoint in a tolerance band of between 2% and 4%). To this end, the bank sets an appropriate level of interest rates. When inflation is too high, Banxico will attempt to tame it by raising interest rates, making it more expensive for households and businesses to borrow money, thus cooling demand and the overall economy. Higher interest rates are generally positive for the Mexican Peso (MXN) as they lead to higher yields, making the country a more attractive place for investors. On the contrary, lower interest rates tend to weaken MXN.
Macroeconomic data releases are key to assess the state of the economy and can have an impact on the Mexican Peso (MXN) valuation. A strong Mexican economy, based on high economic growth, low unemployment and high confidence is good for MXN. Not only does it attract more foreign investment but it may encourage the Bank of Mexico (Banxico) to increase interest rates, particularly if this strength comes together with elevated inflation. However, if economic data is weak, MXN is likely to depreciate.
As an emerging-market currency, the Mexican Peso (MXN) tends to strive during risk-on periods, or when investors perceive that broader market risks are low and thus are eager to engage with investments that carry a higher risk. Conversely, MXN tends to weaken at times of market turbulence or economic uncertainty as investors tend to sell higher-risk assets and flee to the more-stable safe havens.
Positioning cues are flashing red in Gold markets on several fronts, such that fund managers are now only likely to be vindicated in an imminent recession or with a broadening composition of Gold investors, TD Securities Senior Commodity Strategist Daniel Ghali notes.
Jackson Hole and the next payrolls report seem consequential
“Gold prices are now retracing from new all-time highs, following the significant technical break north of $2500/oz in spot Gold which participants have tied to significant macro fund buying, digital barriers, ETF options expiry and reports the PBoC issued new Gold import licenses. In reality, the mosaic of information suggests the breakout was more likely associated with options flows, given that reports of Chinese import quotas appear largely inconsequential for the time being with domestic Gold prices still trading at a discount.”
“We continue to see signs of buying exhaustion on several fronts, barring an imminent recession. Shanghai traders' positions remain near record highs, despite demand for a currency-depreciation hedge grinding to a halt. CTAs remain 'max long'. Most importantly, macro fund positioning is now at its highest levels since April 2020 and is in fact now more statistically consistent with 370bps of Fed cuts over the next twelve months.”
“This is out of line with more modest pricing for cuts across global macro markets, and screams of a dislocation in positioning that may only be vindicated by an imminent recession, unless 'this time is different'. Wednesday's annual benchmark revision estimate for payrolls could add fuel to recession fears, given payrolls data does appear to be overstating job gains, but Jackson Hole and the next payrolls report appear most consequential.”
Downside asymmetry is building, but it will take a big downtape to spark large-scale selling activity, TD Securities Senior Commodity Strategist Daniel Ghali notes.
Large-scale CTA buying activity continues
“We have reiterated the set-up in aluminium markets has been superior to that of the complex, with extreme asymmetries in algorithmic positioning still contributing to large-scale CTA buying activity. We expect that trend-following algos are now likely to cover their remaining shorts and build a net long position, resulting in a buying program totaling +11% of their max size this session.”
“That being said, this will likely mark the peak in algo buying for the time being, with our simulations of future prices now suggesting that the upside asymmetries in positioning risks that have supported the rally have likely completely dissipated.”
“Downside asymmetry is now building, but it will take a big downtape to spark large-scale selling activity. In this scenario, zinc appears most vulnerable to large-scale selling activity.”
- EUR/GBP marginally rose to 0.8520 after two sessions of losses.
- Technical indicators present a neutral outlook for the short term.
- Traders should track a potential bullish crossover between the 20 and 100-day SMA at around 0.8500.
Monday's trading saw the EUR/GBP pair fluctuate within a narrow range, with a marginal rise to 0.8520. This movement followed a two-day losing streak for the pair.
The EUR/GBP pair suggests a mix of bullish and bearish signals. The Relative Strength Index (RSI) is currently at 53, indicating a slight upward trend in buying pressure. However, the Moving Average Convergence Divergence (MACD) has printed a fresh red bar, suggesting a potential shift towards bearish momentum. Volume patterns have been mixed, with recent sessions exhibiting lower volume compared to large spikes observed earlier in the month.
EUR/GBP daily chart
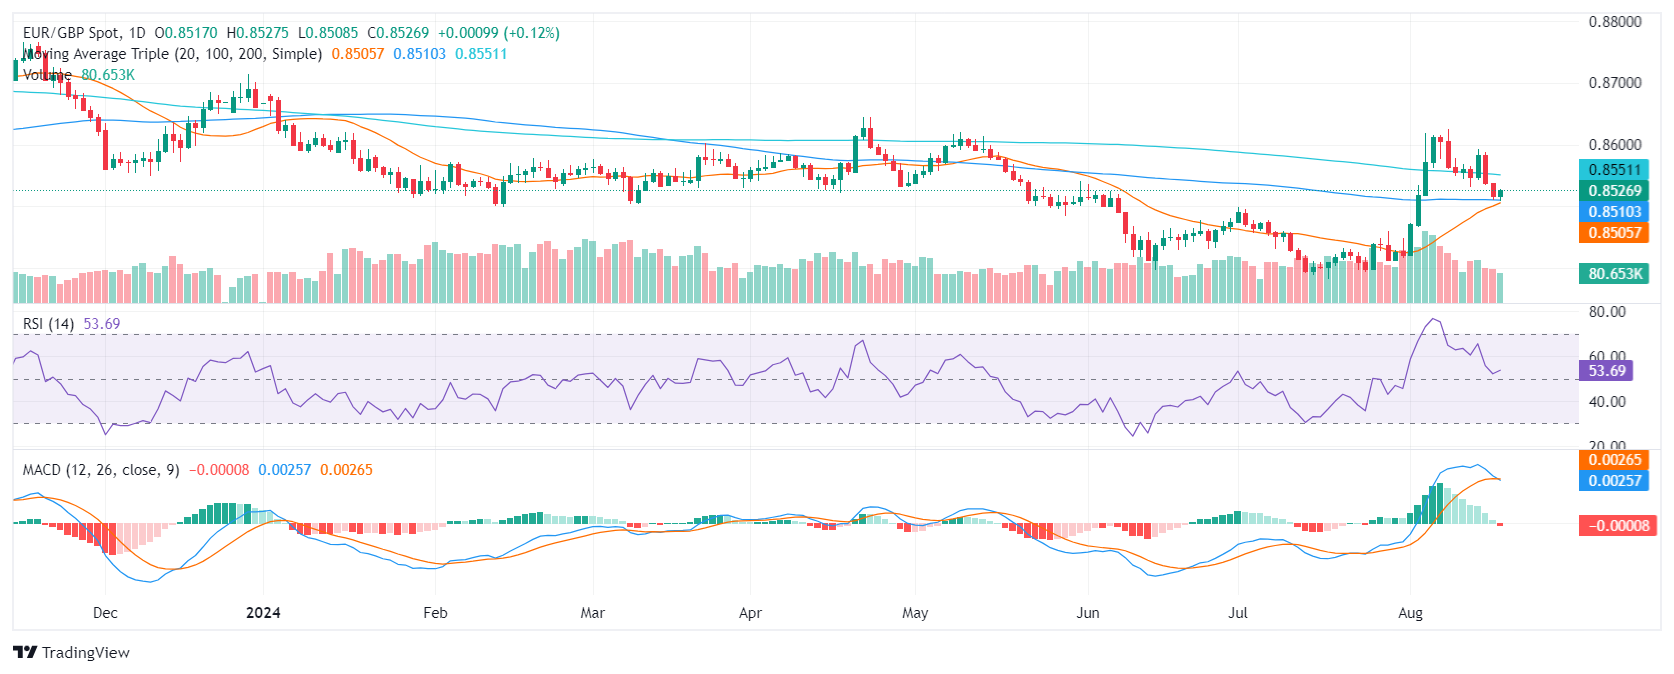
The EUR/GBP pair has been consolidating within a range of 0.8500-0.8550 for the last few sessions. A breakout above 0.8550 could indicate a potential bullish trend, while a break below 0.8500 may increase the likelihood of further downward movement. Key support levels to watch include 0.8450 and 0.8400, while resistance levels to consider include 0.8580 and 0.8600.
A bullish catalyst might be a crossover about to be completed between the 20 and 100-day Simple Moving Averages (SMA) at around 0.8500. This could firstly propel the pair upwards as well as build support around the mentioned psychological level.
Market commentators’ forecast for inflation as of end-2024 did not accelerate by all measures, but did so by some measures – in other words, they have turned jittery all over again, as opposed to steadily declining in response to latest (favourable) inflation data, Commerzbank's FX Analyst Tatha Ghose notes.
Political situation emerges as a lira negative factor
“These inflation expectations have remained consistently higher than official forecasts (e.g. those found in CBT’s Inflation Report). Why this is becoming concerning is that the commonly observed year-on-year inflation rate has sharply declined in the past two readings.”
“Historically, expectations behaved mostly in an adaptive manner, hence it is somewhat intriguing that there was no improvement in response – which means that the broader market sees through the superficial inflation improvement achieved so far and, rightly, worries about the underlying trend.”
“At a time when more decisive inflation targeting is warranted, the political situation is turning adverse for this very initiative. And, this now emerges as a further lira negative factor.”
The extra impetus which CE3 currencies are receiving as a result of the appreciating Euro (EUR) paused briefly as the euro corrected lower below the 1.10 level, Commerzbank's FX Analyst Tatha Ghose notes.
Koruna is not set to continue appreciating
“Alongside peers such as the Hungarian forint, the Czech koruna, too, slightly weakened as a result. Against this backdrop, the upside surprise from Czech PPI for July hardly had any counter-effect. Not only because there was nothing significant within the PPI data, but also because the currency had already rallied somewhat in response to a preceding upward surprise of the CPI.”
“As far as the PPI surprise is concerned, prices rose back to positive month-on-month change after some months of outright month-on-month deflation. Naturally, it should not be expected that price levels would continue to fall every month, hence some reversal in that extra-dovish trend had to be expected.”
“The data still argue for some further rate cuts, even if these are not urgently needed to combat below-target inflation. To the extent that a month ago, such fears were prominent, such fears have now been reversed. This justifies a modest koruna rally. But, the bigger effect is probably the euro rally itself. Once that has peaked, we should not expect the koruna to continue appreciating.”
Having cut rates for the first time in about eight years in early May, the market is prepared for the Riksbank to announce another 25 bps of easing at tomorrow’s policy meeting. The results of the Bloomberg survey of economists show that this expectation is unanimous amongst the nineteen participants, Senior FX Strategist Jane Foley notes.
EUR/SEK is currently trading close to its average level
“Rate cut hopes have been cemented both by the outcome of last week’s Swedish CPI inflation report and by the guidance provided by the Riksbank at its last policy meeting in June. EUR/SEK is currently trading close to its average level for the past year. That said, although the SEK has clawed back some ground vs. the EUR relative to its Sept 2023 low, it remains weak when viewed from a historical perspective.”
“The softness of the exchange rate means that policymakers are likely keeping a close eye on the probable policy decisions by both the ECB and the Fed this year and their respective impacts on the FX market. In our view, the vulnerability of the SEK limits the likelihood of the Riksbank announcing a 50-bps rate cut this week.”
“In view of the risk that the pace of Riksbank rate cuts could front run those of the ECB through the remainder of the year, we have lifted our 3-month EUR/SEK forecast to 11.50 from 11.20. We still expect some moderate appreciation of the SEK vs. the EUR next year on the assumption that lower Riksbank policy rates help stimulate the economy.”
The THB has retraced over 80% of this year’s losses against the USD, DBS Senior FX Strategist Philip Wee notes.
Bears may push towards 34 on a weaker USD
“In the first four months of this year, USD/THB rose from 34.0 to 37.3 from the Fed’s ‘high for longer’ rates stance to push back the market’s aggressive rate cut bets. In early August, the Bank of Thailand announced plans to lift the annual outflow limit to $200k from $50k, reflecting its confidence in the THB’s stability.”
“Despite the Thai constitutional court removing Srettha Thavisin as prime minister last Wednesday, USD/THB closed below 35 last week for the first time since mid-August 2023. USD/THB has the scope to fall further to 34 on a weaker USD, and the kingdom has moved quickly to defuse the political leadership uncertainty.”
“Over the weekend, Thai King Maha Vajiralongkorn granted former Thai prime minister Thaksin Shinawatra a royal pardon and appointed his daughter, Paetongtarn, the new prime minister.”
The MYR has appreciated 3.7% ytd vs. USD in the first 8.5 months to become the top performer this year. GBP was a distant second with 1.7% gains, and the SGD third with 0.3%, DBS Senior FX Strategist Philip Wee notes.
BNM does not mind more appreciation
“Malaysia’s real GDP growth accelerated to 5.9% YoY in 2Q24 following its rebound to 4.2% in 1Q24 from 2.9% in 4Q23. Bank Negara Malaysia expects the broad-based recovery to be sustained in the second half of the year, fuelled by higher demand for tech exports, more tourist arrivals underpinning consumption spending, and investment growth from foreign investments in the semiconductor sector and AI data centres.”
“Although policymakers see growth near the top of this year’s official 4-5% target, they do not expect inflation to breach the 2-3.5% target. Hence, BNM is in no hurry to reduce interest rates despite the wide expectations for the Fed to lower rates in September.”
“Given the MYR’s recovery from its worst levels since the Asian financial crisis, BNM does not appear to mind more appreciation in the currency. In February, BNM did not disagree with private sector estimates that the fair value of USD/MYR should fall between 3.90 and 4.30 to the USD, citing Malaysia’s positive economic prospects.”
Data released Sunday by Rightmove showed a 1.5% fall average asking prices for UK houses in August. Prices were 0.8% higher in the year, however, Scotiabank’s Chief FX Strategist Shaun Osborne notes.
Low 1.29 area should remain well-supported for now
“The Pound Sterling (GBP) has made marginal progress on the day so far and continues to look relatively comfortable in the upper 1.29s. UK PMI data are released Thursday. BoE Governor Baily speaks Saturday at the Jackson Hole event.”
“GBP’s rebound from the early August low has developed strongly but it may moderate in the short run. Spot gains are supported by bullish, short-term trend indicators but gains are showing signs of easing around 1.2954 (76.4% retracement of the July/August drop) this morning.”
“GBP dips to the high 1.28s/low 1.29 area should remain well-supported for now.”
EUR/USD reached a marginal new high barely above 1.1050 earlier, reflecting broader USD losses and little else, Scotiabank’s Chief FX Strategist Shaun Osborne notes.
200-week MA is the next major resistance for the EU
“There were no data reports from the Eurozone today. Local focus falls on Thursday’s ECB minutes and the central bank’s update on negotiated wages for Q2. Some ECB hakes have fretted that still high wage growth is a risk for the inflation outlook. Eurozone PMIs are also released Thursday. Real and nominal spreads are EUR-supportive but some additional spread compression may be needed to drive more EUR gains moving forward.”
“Spot is drifting back from the intraday high just above 1.1050, the highest since January. Intraday price action suggests some near-term consolidation may be at hand for the EUR.”
“Bullish trend oscillators on the intraday, daily and weekly DMI oscillators suggest limited scope for EUR corrections at the moment, which should mean firm support on dips to the mid/upper 1.09s. The 200-week MA (1.1064) is the next major topside challenge for the EUR.
The Canadian Dollar (CAD) and the MXN are lagging, along with the soft USD again, Scotiabank’s Chief FX Strategist Shaun Osborne notes.
USD/CAD resistance is 1.3750/75
“The CAD is still holding below the 1.37 area, however, and made some progress through the upper 1.36s overnight before easing back. Weaker crude prices may temper CAD gains in the short run. The broader risk backdrop appears positive, although US equity futures are showing only marginal gains on the day so far.”
“Our fair value estimate for the CAD continues to shift favourably and sits at 1.3621 this morning, however. The CAD-constructive shift in factors driving the currency outlook should help curb near-term USD rebounds.”
“Spot losses through noted USD support (retracement and 40-day MA) around 1.3725 have prompted the anticipated drop in funds to 1.3675 (the last retracement support ahead of a return to 1.36). The CAD has given up some of those overnight gains in early trade here but the loss of support in the low 1.37s tilts risks towards some additional—perhaps grinding—CAD gains. USD/CAD resistance is 1.3750/75.”
Expect two events to weigh on the greenback this week, DBS senior FX strategist Philip Wee notes.
Fed and BoJ to talk this week
“During the special parliamentary hearing on August 23, Bank of Japan Governor Kazuo Ueda will likely stand by the plan to raise interest rates through Fiscal Year 2025. At the Kansas City Fed Jackson Hole Symposium on August 22-24, Fed Chair Jerome Powell should pave the ground to remove top-level restriction via a 25 bps rate cut at the FOMC meeting on September 18.”
“Expect Powell to play down the market’s recent panic about a US recession and reassert his optimism for a soft landing in the economy and the labour market. Ueda will unlikely expect the Nikkei’s ‘Black Monday’ sell-off on August 5 to derail the upgrades to the BOJ’s economic and inflation forecasts announced on July 31.”
“Hence, USD/JPY should be eyeing lower levels again after its short covering from 141.70 on August 5 to 147.60 last Friday.”
The end of the week should be quieter than previous days in the CEE region with only secondary data in Poland and the Czech Republic.
The end of the week set to be quieter in the CEE region
“It was more or less a successful week for CEE currencies, especially in USD crosses as we turned bullish on the region at the end of the last week. We mentioned on Wednesday that the room for a further rally here is shrinking but yesterday's strong US data sent CEE FX into a brick wall.”
“However, part of the CEE market was closed for a local public holiday and we should see some catch up with higher core rates today. The Czech koruna and Hungarian forint markets were open yesterday and saw some losses already. However, we still believe there is more space for the CEE currencies to rally.”
“EUR/USD is coming back after the US data and some pressure on paying rates in CEE following higher core rates should again improve the picture for CEE currencies. We remain positive on the zloty and koruna, whereas for the forint we want to be more neutral at these levels. But it is clear that from these levels it will be harder for CEE to see further gains.”
- USD/CHF has corrected back over recent days, raising the question of whether it might be reversing lower.
- It has still not fallen far enough to confidently indicate a reversal in the trend and a resumption of the uptrend is still possible.
USD/CHF reversed course after posting a new low on August 5 and started trending higher. The pair began a sequence of higher highs and lows on the 4-hour chart suggesting it was in a short-term uptrend. It peaked at 0.8749 on August 15. Since then it has been correcting back. It reached a new low of 0.8616 on August 19.
USD/CHF 4-hour Chart
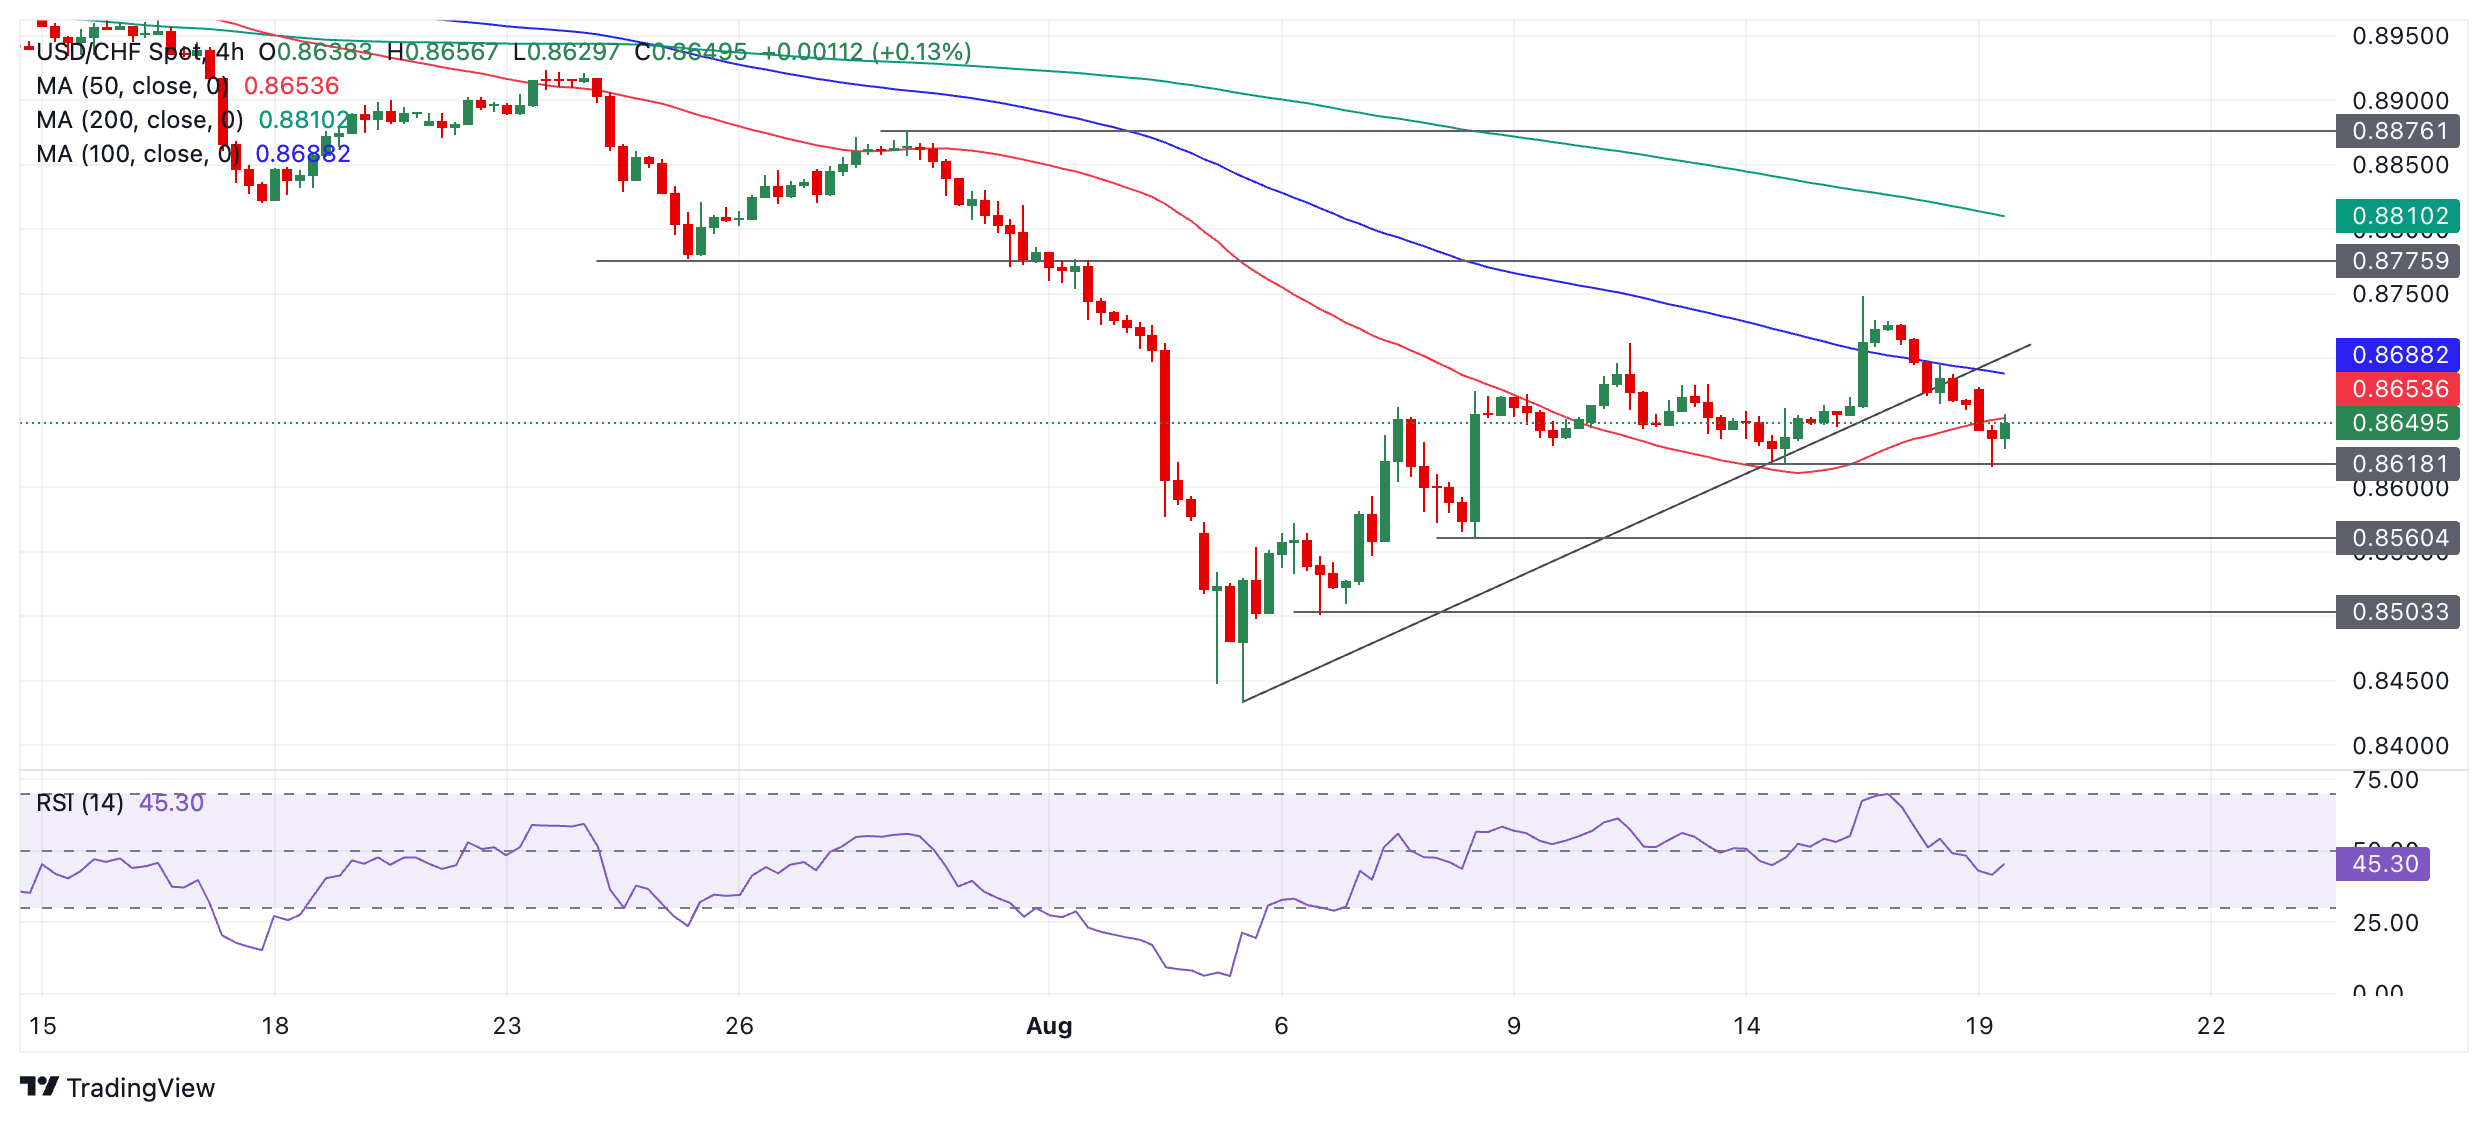
The question is whether the correction is merely a pull back within the dominant uptrend or the start of a deeper move lower?
Although USD/CHF is showing bearish signs it is still probably on balance slightly bullish, though not without risks. The pair has broken below a trendline for the rally up from the August 4 lows and below both the 100 and 50-period Simple Moving Averages – and it looks quite bearish on the daily chart (not shown). These are all negative signs, however, the short-term trend remains intact. More downside is still required to signal a reversal lower.
A close below the 0.8618 support level, for example, would provide confirmation of a reversal of the short-term trend and thestart of a new downtrend. Such a move might then be expected to continue falling to a downside target at 0.8560.
Alternatively the pair might still recover. The pull back from the August 15 high could be characterized as an ABC correction of the uptrend. If so, the uptrend is likely to resume.
The formation of a bullish reversal candlestick pattern at the current lows could provide evidence the pair was about to resume its uptrend. Or a close back above the 100 SMA at 0.8688 would help provide confirmation.
The pair would then be expected to climb back up to the August 15 high at 0.8749. A break above that would extend the trend probably to resistance at 0.8776.
US Dollar (USD) is drifting lower against all major currencies with the DXY index hitting a seven-month low. Money market expectations for an aggressive Fed easing cycle and the modest improvement in financial market risk appetite, reflected by the recovery in global equity markets, are weighing on USD, BBH FX strategisys note.
Fed platemakers ready to talk
“Fed funds futures are still pricing-in about 100bps of easing by year-end. In our view, the encouraging US macro backdrop of solid domestic demand activity and moderate disinflation suggests the Fed is unlikely to cut the funds rate as much as is currently priced-in. As such, there is room for an upward reassessment in Fed funds rate expectations in favour of USD and Treasury yields.”
“San Francisco Fed President Mary Daly (FOMC voter) emphasised the need for gradual interest rate cuts, pointing out the US economy is ‘not in an urgent place’ and the labor market was ‘not weak’. Daly added ‘gradualism is not weak, it’s not slow, it’s not behind, it’s just prudent’.”
“Today, Fed Governor Chris Waller gives welcoming remarks at a Money, Banking, Payments, and Finance workshop. But Friday’s speech by Fed Chair Jay Powell on the economic outlook at the Jackson Hole Economic Policy Symposium (Thursday to Saturday) takes the spotlight. We expect Powell to signal the Fed is prepared to begin cutting the funds rate in September and push back against any sort of pre-commitment to an aggressive easing path.”
The data calendar today is so quiet even ECB President Lagarde does not appear to be speaking. The lack of economic data to guide investors might be troubling—but recent market swings were not based on rational economic analysis, UBS macro analyst Paul Donoban notes.
Feds’s summer camp for central bankers cometh
“Politics dominates the near-term market landscape. US President Biden will open the Democratic National Convention in Chicago. The focus is less on Biden’s remarks and more on policy proposals from Vice-President Harris. Of course, markets do not necessarily assume campaign rhetoric will become policy reality.”
“The issue of food retailers’ ‘price-gouging’ has been getting attention. US retailers’ profits-to-GDP ratio has risen from circa 14% before the pandemic to just under 22% today (wholesalers’ profit ratio remained around pre-pandemic levels, in contrast). Absolute price controls are generally regarded by economists as unhelpful. Enforcing competition and educating consumers can combat profit-led inflation.”
“The Federal Reserve’s summer camp for central bankers is at the end of the week, and we get minutes from the last Fed meeting mid-week. The summer camp is likely to be more of a focus. Fed President Daly was signaling a series of rate cuts are coming.”
- Oil price slips lower for a second consecutive trading day.
- Prices retreat as traders focus on Chinese demand fears and efforts to get a ceasefire deal in Gaza.
- The US Dollar Index eases further after hedge funds go long on the Japanese Yen, which appreciates against the Greenback.
Oil retreats for a second consecutive session as some tail risks move to the forefront on Monday. Traders are fearing weaker demand again from Oil importer China, weighing on overall market sentiment. Meanwhile, all eyes are on the Middle East, where a successful outcome of Gaza ceasefire talks could reduce supply risks substantially, according to Reuters. With two major risk premium events being priced out, some more easing in Crude prices might be at hand.
The US Dollar Index (DXY), which tracks the performance of the US Dollar against six major currencies, is feeling the heat from the Japanese Yen. Markets got rattled on Friday after the Commodity Futures Trading Commission (CFTC) reported that hedge funds were back to being net long on the Japanese Yen (JPY) for the first time since 2021. This weighed on the Greenback and spilled over into the DXY’s performance, which flirts with a break below 102 ahead of the Federal Reserve’s Jackson Hole Symposium later this week.
At the time of writing, Crude Oil (WTI) trades at $75.03 and Brent Crude at $78.71
Oil news and market movers: Easing demand from China
- Bloomberg reports that Iran has jacked up the premium on its light crude prices by $2.35 per barrel over the benchmark Oman-Dubai pricing for September sales to Asia. The move is rather strange taking into account that markets are concerned about a slowdown from China.
- The weekly Commodity Futures Trading Commission (CFTC) data revealed that hedge funds are still net long on Crude Oil even though price action has not been outperforming these past few weeks. Bloomberg reports that hedge funds might be compelled to cut their stake if crude does not gain ground this week, adding to more selling pressure.
- Oil output in Libya has increased by 300,000 barrels per day with the Waha Oil production back to normal levels after maintenance, Reuters reports.
- Headline risk is to be considered with ceasefire talks on Gaza taking place in the coming days.
Oil Technical Analysis: That rejection has more room to go
A big warning already appeared last week on charts after Oil prices were unable to cross over the important 100-day Simple Moving Average (SMA) around $78.45, a key technical level. With that rejection unfolding, the Relative Strength Index (RSI) in the daily chart is still trading fairly in the middle of its range, not looking oversold. This could mean more downside to come, particularly when hedge funds start to cut their stake, triggering a further slide towards $72.00 or lower.
On the upside, it becomes very difficult to be bullish with a lot of resistance levels nearby. The first element to look out for is the pivotal $75.27. Next up is the double level at $77.65, which aligns with both a descending trendline and the 200-day Simple Moving Average (SMA). In case bulls are able to break above it, the 100-day SMA at $78.45 could trigger another rejection as it did last week.
On the downside, the low from August 5 at $71.17 is the best level for a bounce. It might not be bad to start considering levels below $70.00 in case ceasefire talks reach a breakthrough and hedge funds start selling their speculative stake in Oil contracts. The $68.00 big figure level is the first level to watch followed by $67.11, which is the lowest point from the triple bottom seen back in June 2023.
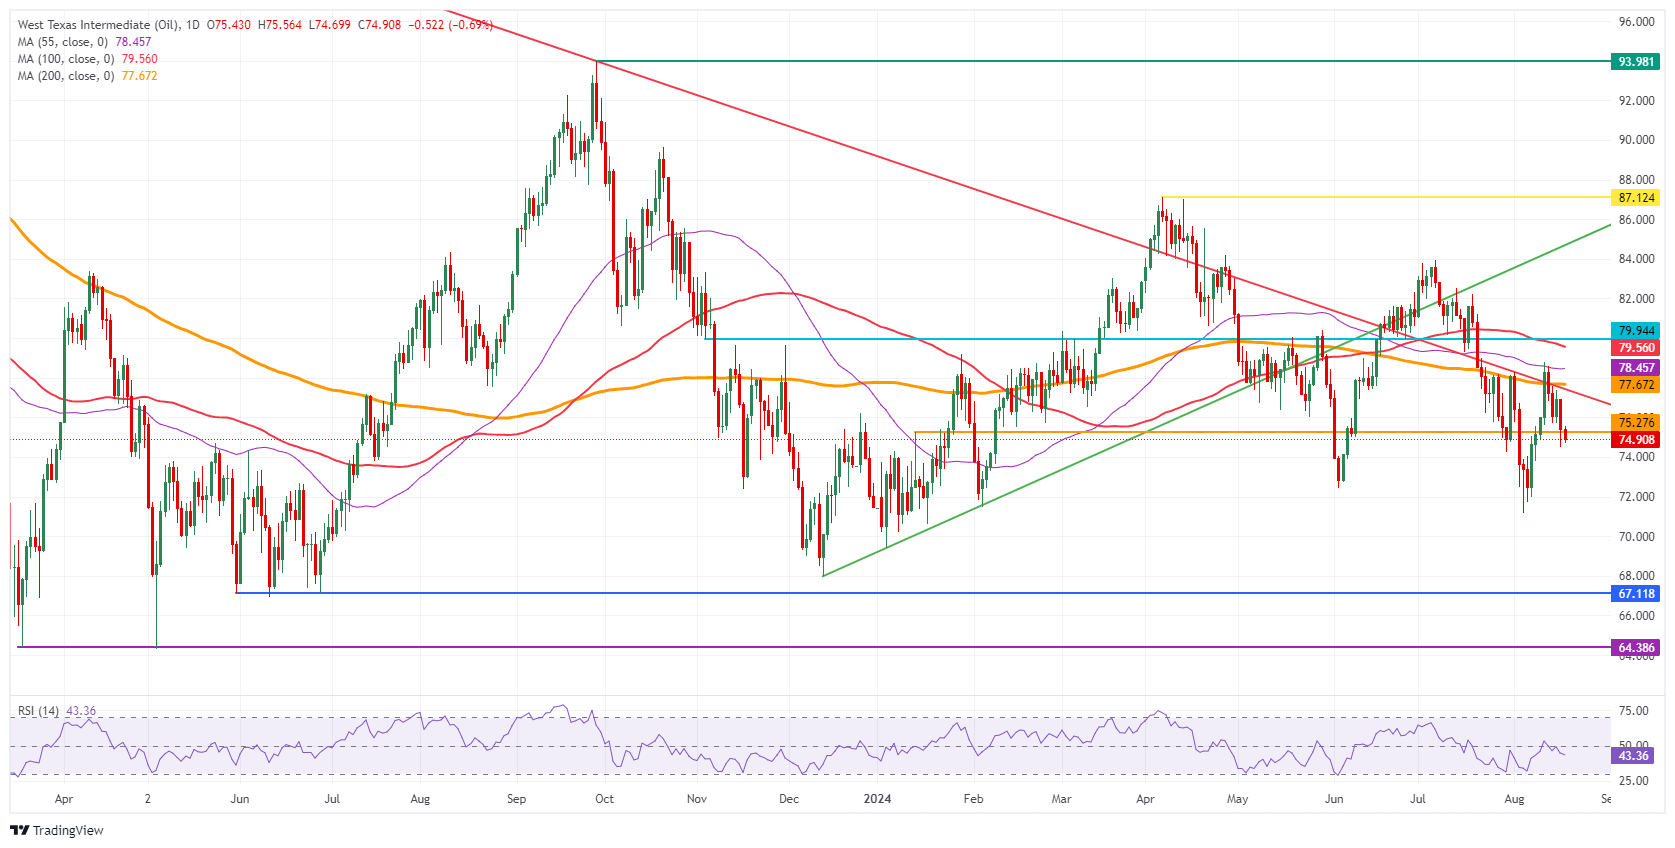
US WTI Crude Oil: Daily Chart
WTI Oil FAQs
WTI Oil is a type of Crude Oil sold on international markets. The WTI stands for West Texas Intermediate, one of three major types including Brent and Dubai Crude. WTI is also referred to as “light” and “sweet” because of its relatively low gravity and sulfur content respectively. It is considered a high quality Oil that is easily refined. It is sourced in the United States and distributed via the Cushing hub, which is considered “The Pipeline Crossroads of the World”. It is a benchmark for the Oil market and WTI price is frequently quoted in the media.
Like all assets, supply and demand are the key drivers of WTI Oil price. As such, global growth can be a driver of increased demand and vice versa for weak global growth. Political instability, wars, and sanctions can disrupt supply and impact prices. The decisions of OPEC, a group of major Oil-producing countries, is another key driver of price. The value of the US Dollar influences the price of WTI Crude Oil, since Oil is predominantly traded in US Dollars, thus a weaker US Dollar can make Oil more affordable and vice versa.
The weekly Oil inventory reports published by the American Petroleum Institute (API) and the Energy Information Agency (EIA) impact the price of WTI Oil. Changes in inventories reflect fluctuating supply and demand. If the data shows a drop in inventories it can indicate increased demand, pushing up Oil price. Higher inventories can reflect increased supply, pushing down prices. API’s report is published every Tuesday and EIA’s the day after. Their results are usually similar, falling within 1% of each other 75% of the time. The EIA data is considered more reliable, since it is a government agency.
OPEC (Organization of the Petroleum Exporting Countries) is a group of 13 Oil-producing nations who collectively decide production quotas for member countries at twice-yearly meetings. Their decisions often impact WTI Oil prices. When OPEC decides to lower quotas, it can tighten supply, pushing up Oil prices. When OPEC increases production, it has the opposite effect. OPEC+ refers to an expanded group that includes ten extra non-OPEC members, the most notable of which is Russia.
The US Dollar (USD) net long positions have edged up for the first time in 4 weeks. The Euro (EUR) net long positions fell back after the surge the previous week. The Pound Sterling (GBP) net long positions have plunged for a third week in a row, and the Japanese Yen (JPY) net positions have pushed into positive ground for the first time since 2021, Rabobank’s Senior FX Strategist Jane Foley and Cross-Asset Macro Strategist Molly Schwartz notes.
JPY pushes into positive ground for the first time since 2021
“USD net long positions have edged up for the first time in 4 weeks, driven by an increase in long positions. Better US economic data have provided reassurance that the market was priced for too much easing from the Fed during its mini panic earlier this month. The market is now awaiting the appearance of Fed Chair Powell at the Jackson Hole event on Friday.”
“EUR net long positions fell back after the surge the previous week. The market continues to focus on the ECB policy signals but the single currency has largely shaken off budget pressures in various Eurozone countries this year. ECB Chief economist Lane is due to speak at Jackson Hole on Saturday.”
“GBP net long positions have plunged for a third week in a row, driven by a decrease in long positions as the market re-evaluates the post UK election surge. That said, GBP is still the only G10 currency to have outperformed the USD in the year to date. JPY net positions have pushed into positive ground for the first time since 2021, driven by a rise in long positions. This continues the improving trend that has been in place since early July.”
USD/BRL has come off sharply from its early August spike to 5.80, ING’s FX strategist Chris Turner notes.
USD/BRL set to struggle to break below 5.40/45 area
“The broad turn lower in the dollar and the global equity market recovery are helping. However, the commodity story is a worry for the Brazilian real. Brazil's terms of trade have dropped to the lowest levels since January 2023 as weak Chinese demand weighs on both soybeans and iron ore – two of Brazil's key exports. Brazil's terms of trade levels are more consistent with USD/BRL trading at 5.70/5.80.”
“In addition, investors await the Brazilian government's 2025 budget plans – which are announced on 31 August. The market view is split here. If the Lula administration prioritises social spending, then fiscal targets will be missed and the real will be hit hard. However, some in the market suspect that the government will cut spending to try and keep the bond market on side. Typically, fiscal weakness has always been the Achilles heel of Brazilian asset markets.”
“Given this late August event risk with the budget and the terms of trade drop, we suspect USD/BRL will struggle to break support in the 5.40/45 area.”
- Silver makes higher highs as short-term uptrend favors longs.
- Silver has just exited overbought according to the RSI increasing chances of a pull back.
Silver (XAG/USD) is posting higher highs and higher lows as it rises up on the 4-hour chart. This suggests the commodity is probably in a short-term uptrend, and because “the trend is your friend” the odds favor a continuation of that trend higher.
Silver 4-hour Chart
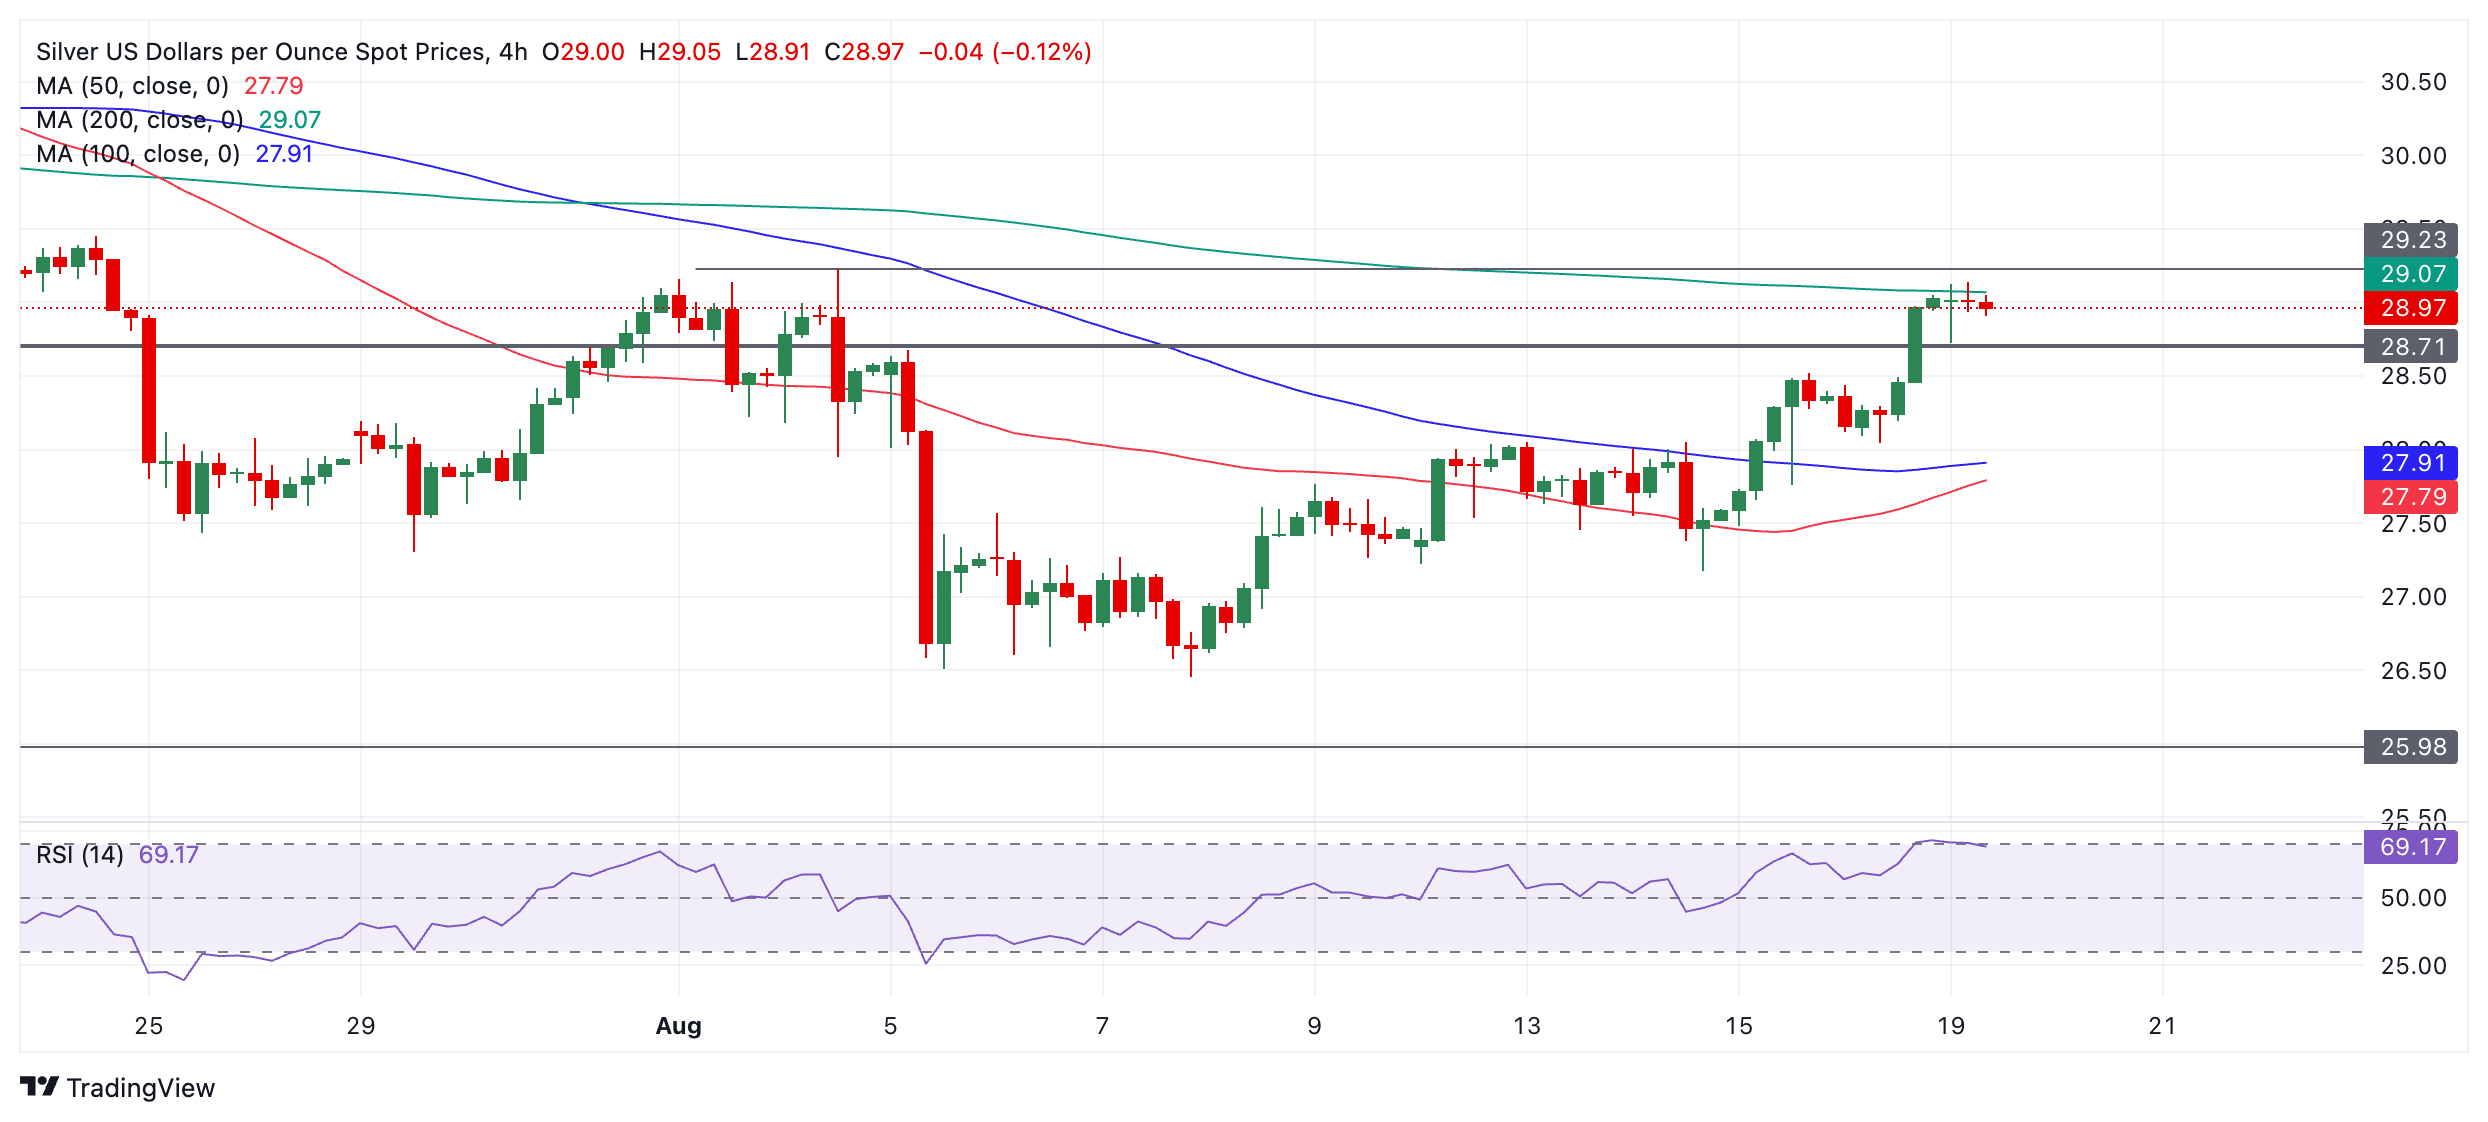
Silver has just broken above a key long-term support and resistance level at $28.71 and this further confirms its bullish short-term bias.
The precious metal is now close to the August 2 high at $29.23 where it will meet further technical resistance, however, given the short-term uptrending bias it will probably overcome the resistance eventually and continue higher.
Beyond that, upside targets lie at $29.44 (July 24 swing high) and $30.59 (July 18 swing high).
The Relative Strength Index (RSI) has just exited overbought, however, indicating an increased chance of a pull back unfolding. Such a correction could see Silver temporarily return to $28.71, or possibly even support at $28.52 (August 15 swing high).
The UK economy continued to rebound cautiously from a recession. GDP grew by 0.6% q/q in 2Q24, after rising by 0.7% q/q in 1Q24. This was in line with consensus expectations, but a tad lower than the Bank of England (BOE)’s forecast for a 0.7% gain, UOB Group economist Lee Sue Ann notes.
Economy continues to recover
“The UK's economy grew by 0.6% between Apr and Jun as it continued its recovery from the recession at the end of last year. The latest figure was in line with forecasts and follows a 0.7% increase in the first three months of this year.”
“Annual CPI inflation rate rose to 2.2% in Jul, its first acceleration since Dec last year, and is expected to remain above its 2% target for the rest of the year. Separately, unemployment fell unexpectedly after companies stepped up hiring.”
“We see a rate hold at the next BOE meeting on 19 Sep, and another rate cut at its 7 Nov meeting, on the premise that data on services inflation and wage growth will soften in the coming months, making the committee more comfortable with proceeding with one more cut this year.”
- The US Dollar trades substantially softer, touching a seven-month low, at the start of the week.
- The Greenback continues eking out losses after Friday’s turmoil.
- The US Dollar index trades on the brink of entering the 101-region and might face more downside.
The US Dollar (USD) trades substantially softer this Monday, touching its lowest level since mid-January, mainly driven by a more than 1% appreciation of the Japanese Yen (JPY) against the Greenback. . The Commodity Futures Trading Commission (CFTC) reported on Friday that hedge funds are net long on the Japanese Yen, and Asian and European investors seem to follow through on Monday. . As the Japanese Yen accounts for 13.6% of the US Dollar Index (DXY), the rise weighs on the index’s performance this Monday, pushing it to lows not seen in roughly seven months.
On the economic data front, a rather soft start for the data this week where all eyes will be on Wyoming at the end of the week for the annual US Federal Reserve’s Jackson Hole Symposium. The event will have the crème-de-la-crème of central bankers speaking, including Fed Chairman Jerome Powell, and is known for being the occasion for the Fed to signal a change in monetary policy outside of its scheduled meetings. In the run-up to that event, several headlines will come out from other central bankers, and the US Purchasing Managers Index (PMI) data on Thursday will give the latest insights about the state of the economy.
Daily digest market movers: Fast forward?
- The Commodity Futures Trading Commission (CFTC) issued on Friday its weekly holding of speculative and non-speculative positions in currency futures markets. The report revealed that hedge funds are net long JPY for the first time since 2021.
- This week kicks off with comments from Federal Reserve Governor Christopher Waller, who delivers welcoming remarks at the 2024 Summer Workshop on Money, Banking, Payments, and Finance in Washington, D.C at 13:15 GMT.
- The US Treasury is allocating a short-term 3-month and 6-month bill at 15:30 GMT.
- Asian equity markets are mixed, with Chinese indices up nearly 1%, while Japanese equities are sliding over 1% lower. European equities are also looking for direction while US futures are trading flat.
- The CME Fedwatch Tool shows a 72% chance of a 25 basis points (bps) interest rate cut by the Fed in September against a 28% chance for a 50 bps cut. Another 25 bps cut (if September is a 25 bps cut) is expected in November by 53.7%, while there is a 39.2% chance that rates will be 75 bps below the current levels and a 7.1% probability of rates being 100 basis points lower.
- The US 10-year benchmark rate trades at 3.87% and is looking for direction after last week’s dip.
Economic Indicator
Fed's Chair Powell speech
Jerome H. Powell took office as a member of the Board of Governors of the Federal Reserve System on May 25, 2012, to fill an unexpired term. On November 2, 2017, President Donald Trump nominated Powell to serve as the next Chairman of the Federal Reserve. Powell assumed office as Chair on February 5, 2018.
Read more.Next release: Fri Aug 23, 2024 14:00
Frequency: Irregular
Consensus: -
Previous: -
Source: Federal Reserve
US Dollar Index Technical Analysis: Who did what now?
The US Dollar Index (DXY) looks very bleak, and chances of recovery seem low. With this new information from the CFTC, traders have to ask themselves where they see the DXY heading to, considering that hedge funds will not pile into a currency on the back of some feeble belief.
Hedge funds are always in it to sit on their positions until their earnings projection is met. Seeing that this is just the beginning, and with more and more hedge funds and traders possibly joining this trade, the US Dollar could be set to bleed further. This could mean more downside, and then that 100-level might be showing up quicker than expected.
Defining pivotal levels becomes very important in order to avoid any “dead-cat bounces,” in which traders pile in too quickly in a trade and get caught on the wrong side of the fence once the course reverses. First up is 103.18, a level that traders were unable to hold last week. Next up, a heavy resistance level is at 103.99-104.00, and inches above there is the 200-day Simple Moving Average (SMA) at 104.07.
On the downside, the first immediate support comes up at the 101.90 level if prices breach below 102.00. Levels not seen since early January are popping up, and even a fresh yearly low could come into play once the DXY dips below 101.30 (low from January 2). The low of December 28 at 100.62 will be the ultimate level to look out for.
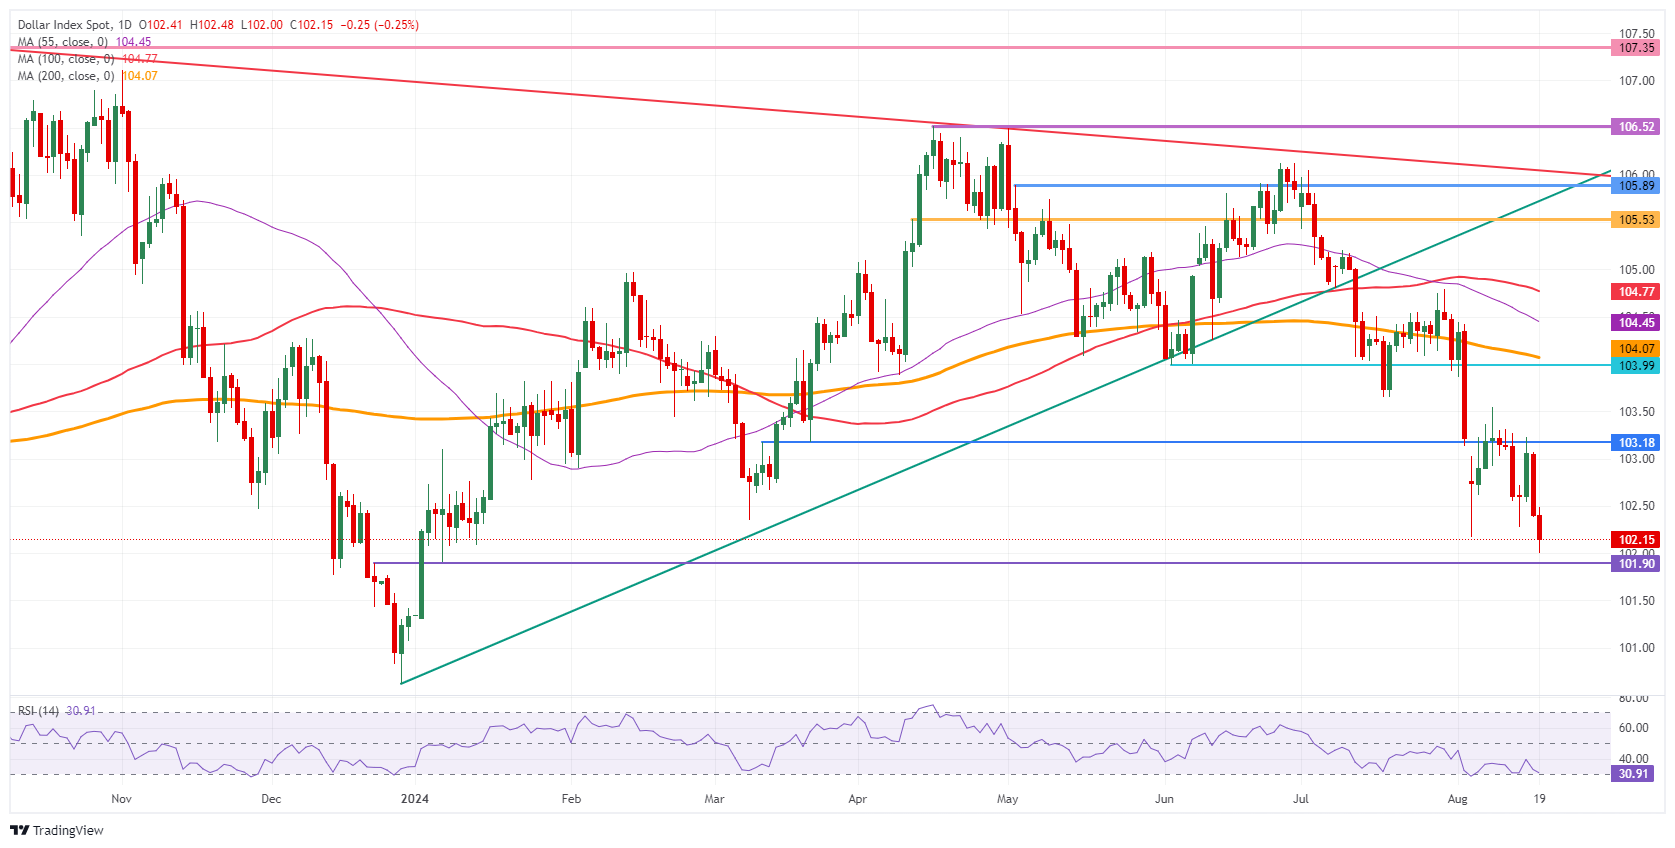
US Dollar Index: Daily Chart
US Dollar FAQs
The US Dollar (USD) is the official currency of the United States of America, and the ‘de facto’ currency of a significant number of other countries where it is found in circulation alongside local notes. It is the most heavily traded currency in the world, accounting for over 88% of all global foreign exchange turnover, or an average of $6.6 trillion in transactions per day, according to data from 2022. Following the second world war, the USD took over from the British Pound as the world’s reserve currency. For most of its history, the US Dollar was backed by Gold, until the Bretton Woods Agreement in 1971 when the Gold Standard went away.
The most important single factor impacting on the value of the US Dollar is monetary policy, which is shaped by the Federal Reserve (Fed). The Fed has two mandates: to achieve price stability (control inflation) and foster full employment. Its primary tool to achieve these two goals is by adjusting interest rates. When prices are rising too quickly and inflation is above the Fed’s 2% target, the Fed will raise rates, which helps the USD value. When inflation falls below 2% or the Unemployment Rate is too high, the Fed may lower interest rates, which weighs on the Greenback.
In extreme situations, the Federal Reserve can also print more Dollars and enact quantitative easing (QE). QE is the process by which the Fed substantially increases the flow of credit in a stuck financial system. It is a non-standard policy measure used when credit has dried up because banks will not lend to each other (out of the fear of counterparty default). It is a last resort when simply lowering interest rates is unlikely to achieve the necessary result. It was the Fed’s weapon of choice to combat the credit crunch that occurred during the Great Financial Crisis in 2008. It involves the Fed printing more Dollars and using them to buy US government bonds predominantly from financial institutions. QE usually leads to a weaker US Dollar.
Quantitative tightening (QT) is the reverse process whereby the Federal Reserve stops buying bonds from financial institutions and does not reinvest the principal from the bonds it holds maturing in new purchases. It is usually positive for the US Dollar.
Federal Reserve (Fed) Bank of Minneapolis President Neel Kashkari told the Wall Street Journal on Monday that a debate about potentially cutting the policy rate in September is an appropriate one to have, pre Reuters.
"The balance of risks has shifted more towards labor market and away from inflation side of our dual mandate," Kashkari added and noted that inflation is making progress while the labor market is showing some concerning signs.
Market reaction
These comments don't seem to be having a significant impact on the US Dollar's (USD) valuation. At the time of press, the USD index was down 0.15% on the day at 102.25.
The USD received a lift from the better-than-expected retail sales data, ING’s FX strategist Chris Turner notes.
DXY is consolidating
“The data has prompted investors to shift towards pricing a 25bp Federal Reserve rate cut on 18 September. However, there will be a myriad of data inputs into the Fed equation and the events calendar picks up next week. The focus for today will be on August University of Michigan consumer confidence data. This survey will have been taken during the stock market rout at the start of August and could see consumer expectations sink further.”
“Elsewhere, firmer US rates have allowed USD/JPY to climb back towards 150 and have encouraged flows back into the high yielders like the Mexican peso and the South African rand. We still have our concerns over the peso given potential constitutional reforms next month and doubt investors will chase USD/MXN much under 18.50.”
“DXY is consolidating, but we have a bias for a drop to 102.15/25 next week.”
- Gold takes a breather after a strong rally that saw it break to new all-time highs at the end of last week.
- Talk of the US economy giving “warning signals” drove safe-haven flows into the precious metal, pushing it to new highs.
- From a technical point of view, Gold has broken out of a range and is tipped to rally higher.
Gold (XAU/USD) trades just above $2,500 on Monday as it consolidates the gains made after it broke above resistance to new all-time highs on Friday. The precious metal is supported by lingering doubts about the resilience of the US economy, simmering geopolitical tensions – particularly in the Middle East – and a weaker US Dollar, in which Gold is mostly priced.
Gold surged to new highs after comments from Chicago Fed President
Gold surged to a new all-time high of $2,509 on Friday after comments from the President of the Federal Reserve Bank of Chicago, Austan Goolsbee, reawakened US recession fears. Goolsbee said that the US labor market and some other leading economic indicators were “flashing warning signs”. One such sign was rising levels of credit card delinquencies. His words reawakened recession concerns leading to a rise in safe-haven flows to Gold.
Investors had grown complacent after the release of US Retail Sales data on Thursday showed a 1.0% rise MoM in July, reversing the 0.3% decline in June. The data, along with lower-than-expected Initial Jobless Claims had helped calm fears the US economy was heading for a hard landing. The Chicago Fed President’s remarks, however, suggested a part of the growth in retail sales might be due to consumers borrowing beyond their limits, reviving concerns and increasing haven demand for the yellow Metal.
Changing Fed expectations
The move higher in Gold came as something of a surprise given the recent change in the outlook for interest rates in the US. Gold tends to appreciate when investors expect interest rates to fall because it is a non-interest paying asset.
Market-based estimates of the future course of interest rates altered considerably last week. At the start of the week investors were pricing in at least a 50% chance the Federal Reserve (Fed) would cut interest rates by 0.50% at their September meeting, and a 100% chance of at least a 0.25% cut.
As the week progressed, the probabilities of a “big” 0.50% cut fell to only around 30% whilst the chances of at least a 0.25% cut remained fully priced in, according to the CME Fedwatch tool. The fall in chances of the Fed cutting by 0.50% did weigh marginally on the price of Gold but that did not stop it surging late Friday. Despite the rally in Gold prices and Fed Goolsbee’s comments the probabilities of a 0.50% cut in September remain around 30%.
The sudden rally at the end of Friday was also surprising because data on investor positioning in the Gold futures market suggests a bearish bias rather than a bullish one. Most large investors are already long Gold with the uneven allocation into Gold longs and Gold option calls actually suggesting a risk of the market rebalancing in a reaction in the opposite direction.
“Several of the major cohorts in Gold markets are now facing buying exhaustion, whereas the narrative that propelled prices to these all-time highs now appears stale. The risk of a positioning washout is at its highest levels of the year,” says TD Securities senior commodity strategist Daniel Ghali.
There is the potential for Gold to be buffeted by a host of factors in the week ahead, including the outcome of peace talks in Cairo aimed at ending the war between Israelis and Palestinians, whether Iran’s threat of all out war with Israel finally bears fruit, and commentary around interest rates coming out of the the Jackson Hole central banking summit at the end of the week.
Technical Analysis: Gold breaks out of range
Gold (XAU/USD) breaks decisively out of the top of a range it has been trapped in since the middle of July and rises to new all-time highs. The breakout will probably hold and then rise to an initial target at $2,550, calculated by taking the 0.618 Fibonacci ratio of the range’s height and extrapolating it higher.
XAU/USD 4-hour Chart

The pair has just exited the overbought region of the Relative Strength Index (RSI), however, which indicates a probable pullback will unfold, dragging Gold price down before it pushes higher.
Such a pullback might be expected to correct to support in the $2,480s, at around the level of the July 17 high.
Gold is in a broad uptrend on the short, medium and long-term timeframes, however, and given “the trend is your friend”, this uptrend is more likely than not to continue.
Economic Indicator
Fed's Goolsbee speech
Austan D. Goolsbee took office on January 9, 2023, as the 10th president and chief executive officer of the Seventh District, Federal Reserve Bank of Chicago. In 2023, he serves as a voting member of the Federal Open Market Committee.
Read more.
Last release: Sun Aug 18, 2024 15:15
Frequency: Irregular
Actual: -
Consensus: -
Previous: -
Source: Federal Reserve Bank of Chicago
This weekend, all the big names in central banking and economics will be meeting in Jackson Hole. In the past, Fed chairs have occasionally used this symposium as an opportunity to announce important policy changes. Now, it is common knowledge that the Fed could soon lower its key interest rate for the first time since the interest rate hikes of 2022/23 — that is, that another policy change is imminent. And that is why Jackson Hole is even more of a topic for the market than it is every year, Commerzbank’s Head of FX and Commodity Research Ulrich Leuchtmann notes.
USD is set to weaken further
“Now, an interest rate cut cycle that everyone and their brother is expecting should not be a particularly relevant thing. But it is. Because it's all about the speed and (especially) the extent to which the USD carry is disappearing. And even more fundamentally, it's about how the Fed deals with the conflict between inflation (core PCE at 2.6% versus the Fed's target of 2%) and emerging economic risks. In other words, what I like to call the ‘policy response function’.”
“In this sense, it is not about whether Fed Chair Jay Powell will announce the long-awaited interest rate cuts in Jackson Hole. And it's not about the initial rate-cutting pace in September, November and December. It should come as no surprise that after the surprising US labor market report on August 2, interest rate expectations for this year have recovered, but the USD has continued to lose ground.”
“It is how he explains and justifies them that matters. Because, since it is the Chair's job to announce the consensus, Powell's words are far more relevant than any individual voices from the FOMC, however wise they may be. The currency market may be acting in preparation for the coming events. If not all market participants feel sufficiently prepared for a potentially dovish message from the Fed Chair at current levels, the USD will have to weaken further.”
Silver prices (XAG/USD) fell on Monday, according to FXStreet data. Silver trades at $28.93 per troy ounce, down 0.36% from the $29.03 it cost on Friday.
Silver prices have increased by 21.57% since the beginning of the year.
| Unit measure | Silver Price Today in USD |
|---|---|
| Troy Ounce | 28.93 |
| 1 Gram | 0.93 |
The Gold/Silver ratio, which shows the number of ounces of Silver needed to equal the value of one ounce of Gold, stood at 86.51 on Monday, up from 86.39 on Friday.
Silver FAQs
Silver is a precious metal highly traded among investors. It has been historically used as a store of value and a medium of exchange. Although less popular than Gold, traders may turn to Silver to diversify their investment portfolio, for its intrinsic value or as a potential hedge during high-inflation periods. Investors can buy physical Silver, in coins or in bars, or trade it through vehicles such as Exchange Traded Funds, which track its price on international markets.
Silver prices can move due to a wide range of factors. Geopolitical instability or fears of a deep recession can make Silver price escalate due to its safe-haven status, although to a lesser extent than Gold's. As a yieldless asset, Silver tends to rise with lower interest rates. Its moves also depend on how the US Dollar (USD) behaves as the asset is priced in dollars (XAG/USD). A strong Dollar tends to keep the price of Silver at bay, whereas a weaker Dollar is likely to propel prices up. Other factors such as investment demand, mining supply – Silver is much more abundant than Gold – and recycling rates can also affect prices.
Silver is widely used in industry, particularly in sectors such as electronics or solar energy, as it has one of the highest electric conductivity of all metals – more than Copper and Gold. A surge in demand can increase prices, while a decline tends to lower them. Dynamics in the US, Chinese and Indian economies can also contribute to price swings: for the US and particularly China, their big industrial sectors use Silver in various processes; in India, consumers’ demand for the precious metal for jewellery also plays a key role in setting prices.
Silver prices tend to follow Gold's moves. When Gold prices rise, Silver typically follows suit, as their status as safe-haven assets is similar. The Gold/Silver ratio, which shows the number of ounces of Silver needed to equal the value of one ounce of Gold, may help to determine the relative valuation between both metals. Some investors may consider a high ratio as an indicator that Silver is undervalued, or Gold is overvalued. On the contrary, a low ratio might suggest that Gold is undervalued relative to Silver.
(An automation tool was used in creating this post.)
- USD/CAD loses ground following the dovish comments from the Fed officials.
- San Francisco Fed President Mary Daly emphasized that the US central bank should reduce rates gradually.
- The upside of the commodity-linked CAD could be retrained due to lower crude Oil prices.
USD/CAD retraces its recent gains from the previous two sessions, trading around 1.3670 during Monday’s European hours. This downside is attributed to the tepid US Dollar (USD) following dovish comments from Federal Reserve (Fed) officials regarding their policy stance. This has increased the odds of an interest rate cut by the central bank in September and undermined the USD/CAD pair.
Federal Reserve Bank of San Francisco President Mary Daly emphasized Sunday that the US central bank should take a gradual approach to reducing borrowing costs, according to the Financial Times. Daly pushed back against economists' concerns that the US economy is on the verge of a sharp slowdown that would justify rapid interest rate cuts.
Federal Reserve Bank of Chicago President Austan Goolsbee warned that central bank officials should be cautious about keeping a restrictive policy in place longer than necessary. While it's uncertain whether the Fed will cut interest rates next month, failing to do so could harm the labor market, per CNBC.
However, the downside of the USD/CAD pair could be restrained as the commodity-linked Canadian Dollar (CAD) may struggle due to lower WTI prices. Given the fact that Canada is the biggest crude Oil exporter to the United States (US).
West Texas Intermediate (WTI) Oil price drops to near $75.00 per barrel at the time of writing. The decline in crude Oil prices is driven by concerns over weaker demand from China, the world's top oil importer. However, any escalation in geopolitical tensions related to the Israel-Hamas and Russia-Ukraine conflicts could raise supply concerns, potentially limiting further declines in Oil prices.
Hamas has issued a statement rejecting the terms for a hostage release-ceasefire deal discussed in Doha on Thursday and Friday, according to Reuters citing a local news agency Times of Israel. Additionally, concerns about escalating tensions between Ukraine and Russia were heightened as Ukraine initiated the largest invasion of Russia since World War II.
Traders are likely to focus on Canada's Consumer Price Index (CPI) data for July on Tuesday, with market expectations pointing to a 2.5% year-on-year increase, down from the previous 2.7% rise. Meanwhile, the monthly index is expected to rise by 0.3%, swinging from the previous 0.1% decline.
Canadian Dollar FAQs
The key factors driving the Canadian Dollar (CAD) are the level of interest rates set by the Bank of Canada (BoC), the price of Oil, Canada’s largest export, the health of its economy, inflation and the Trade Balance, which is the difference between the value of Canada’s exports versus its imports. Other factors include market sentiment – whether investors are taking on more risky assets (risk-on) or seeking safe-havens (risk-off) – with risk-on being CAD-positive. As its largest trading partner, the health of the US economy is also a key factor influencing the Canadian Dollar.
The Bank of Canada (BoC) has a significant influence on the Canadian Dollar by setting the level of interest rates that banks can lend to one another. This influences the level of interest rates for everyone. The main goal of the BoC is to maintain inflation at 1-3% by adjusting interest rates up or down. Relatively higher interest rates tend to be positive for the CAD. The Bank of Canada can also use quantitative easing and tightening to influence credit conditions, with the former CAD-negative and the latter CAD-positive.
The price of Oil is a key factor impacting the value of the Canadian Dollar. Petroleum is Canada’s biggest export, so Oil price tends to have an immediate impact on the CAD value. Generally, if Oil price rises CAD also goes up, as aggregate demand for the currency increases. The opposite is the case if the price of Oil falls. Higher Oil prices also tend to result in a greater likelihood of a positive Trade Balance, which is also supportive of the CAD.
While inflation had always traditionally been thought of as a negative factor for a currency since it lowers the value of money, the opposite has actually been the case in modern times with the relaxation of cross-border capital controls. Higher inflation tends to lead central banks to put up interest rates which attracts more capital inflows from global investors seeking a lucrative place to keep their money. This increases demand for the local currency, which in Canada’s case is the Canadian Dollar.
Macroeconomic data releases gauge the health of the economy and can have an impact on the Canadian Dollar. Indicators such as GDP, Manufacturing and Services PMIs, employment, and consumer sentiment surveys can all influence the direction of the CAD. A strong economy is good for the Canadian Dollar. Not only does it attract more foreign investment but it may encourage the Bank of Canada to put up interest rates, leading to a stronger currency. If economic data is weak, however, the CAD is likely to fall.
- NZD/USD advances to a multi-week top, albeit struggles to break through the 200-day SMA.
- Fed rate cut bets continue to undermine the USD and remain supportive of the positive move.
- The RBNZ’s dovish tilt keeps a lid on further gains amid worries about a slowdown in China.
The NZD/USD pair attracts some follow-through buying for the second straight day on Monday and climbs to over a one-month peak amid sustained US Dollar (USD) selling. Spot prices, however, struggle to make it through the very important 200-day Simple Moving Average (SMA) resistance and trade around the 0.6070 area during the first half of the European session, still up over 0.35% for the day.
The US Producer Price Index (PPI) and Consumer Price Index (CPI) released last week indicated that inflation is on a downward trend, reaffirming market bets that the Federal Reserve (Fed) will begin its rate-cutting cycle in September. This, in turn, triggers a fresh leg down in the US Treasury bond yields and drags the USD Index (DXY), which tracks the Greenback against a basket of currencies, to its lowest level since January. Apart from this, a stable performance across the global equity markets turns out to be another factor undermining the safe-haven buck and benefiting the risk-sensitive Kiwi.
That said, the Reserve Bank of New Zealand's (RBNZ) dovish tilt last week holds back bulls from placing aggressive bets and keeps a lid on any further gains. In fact, the central bank unexpectedly decided to cut the Official Cash Rate (OCR) for the first time since March 2020, citing the recent progress towards meeting the annual inflation target and weak domestic economic growth. The RBNZ also indicated more cuts over the coming months, which, along with concerns about an economic downturn in China, acts as a headwind for antipodean currencies, including the New Zealand Dollar (NZD).
Investors also seem reluctant and prefer to wait for more cues about the Fed's policy path before positioning for the next leg of a directional move. Hence, the focus remains glued to the release of the FOMC meeting minutes on Wednesday and Fed Chair Jerome Powell's speech at the Jackson Hole Symposium on Friday. Apart from this, New Zealand's quarterly Retail Sales data, due on Friday, will help determine the near-term trajectory for the NZD/USD pair. In the meantime, the USD price dynamics might continue to drive spot prices in the absence of relevant macro data on Monday.
US Dollar PRICE Today
The table below shows the percentage change of US Dollar (USD) against listed major currencies today. US Dollar was the strongest against the Canadian Dollar.
| USD | EUR | GBP | JPY | CAD | AUD | NZD | CHF | |
|---|---|---|---|---|---|---|---|---|
| USD | -0.13% | -0.22% | -1.11% | -0.06% | -0.30% | -0.40% | -0.10% | |
| EUR | 0.13% | -0.16% | -0.94% | 0.07% | -0.26% | -0.43% | 0.00% | |
| GBP | 0.22% | 0.16% | -0.93% | 0.19% | -0.10% | -0.21% | 0.16% | |
| JPY | 1.11% | 0.94% | 0.93% | 0.98% | 0.77% | 0.83% | 0.87% | |
| CAD | 0.06% | -0.07% | -0.19% | -0.98% | -0.26% | -0.26% | -0.07% | |
| AUD | 0.30% | 0.26% | 0.10% | -0.77% | 0.26% | -0.02% | 0.26% | |
| NZD | 0.40% | 0.43% | 0.21% | -0.83% | 0.26% | 0.02% | 0.32% | |
| CHF | 0.10% | -0.01% | -0.16% | -0.87% | 0.07% | -0.26% | -0.32% |
The heat map shows percentage changes of major currencies against each other. The base currency is picked from the left column, while the quote currency is picked from the top row. For example, if you pick the US Dollar from the left column and move along the horizontal line to the Japanese Yen, the percentage change displayed in the box will represent USD (base)/JPY (quote).
- USD/MXN price tests the nine-day EMA at the 18.81 level, followed by the lower boundary of the channel.
- The 9-day EMA is higher than the 50-day EMA, indicating a bullish signal for the short-term price trend.
- A return to the ascending channel would reinforce the bullish bias, leading the pair to test the upper boundary.
The USD/MXN pair halts its four-day losing streak, trading around 18.70 during the European session on Monday. The daily chart analysis shows that the pair is consolidating below an ascending channel pattern, indicating a potential weakening of the bullish bias.
Additionally, the 14-day Relative Strength Index (RSI) is positioned slightly above the 50 level, suggesting a bullish momentum. Further movement may offer a clear directional trend.
Moreover, the 9-day Exponential Moving Average (EMA) is higher than the 50-day EMA, indicating a bullish signal for the USD/MXN pair. This suggests that the short-term price trend is stronger than the long-term trend, which could imply upward momentum in the asset's price.
On the upside, the nine-day Exponential Moving Average (EMA) at the 18.81 level serves as an immediate barrier, followed by the lower boundary of the ascending channel around the 19.00 level.
A return to the ascending channel would reinforce the bullish bias, potentially leading the USD/MXN pair to explore the region around the upper boundary of the ascending channel at 20.06, the highest level since October 2022, which was reached on August 5.
In terms of support, the 50-day EMA at 18.35 appears as a key support level. A break below this level could initiate the emergence of the bearish bias and push the USD/MXN pair to navigate the area around throwback support at the 17.60 level.
USD/MXN: Daily Chart
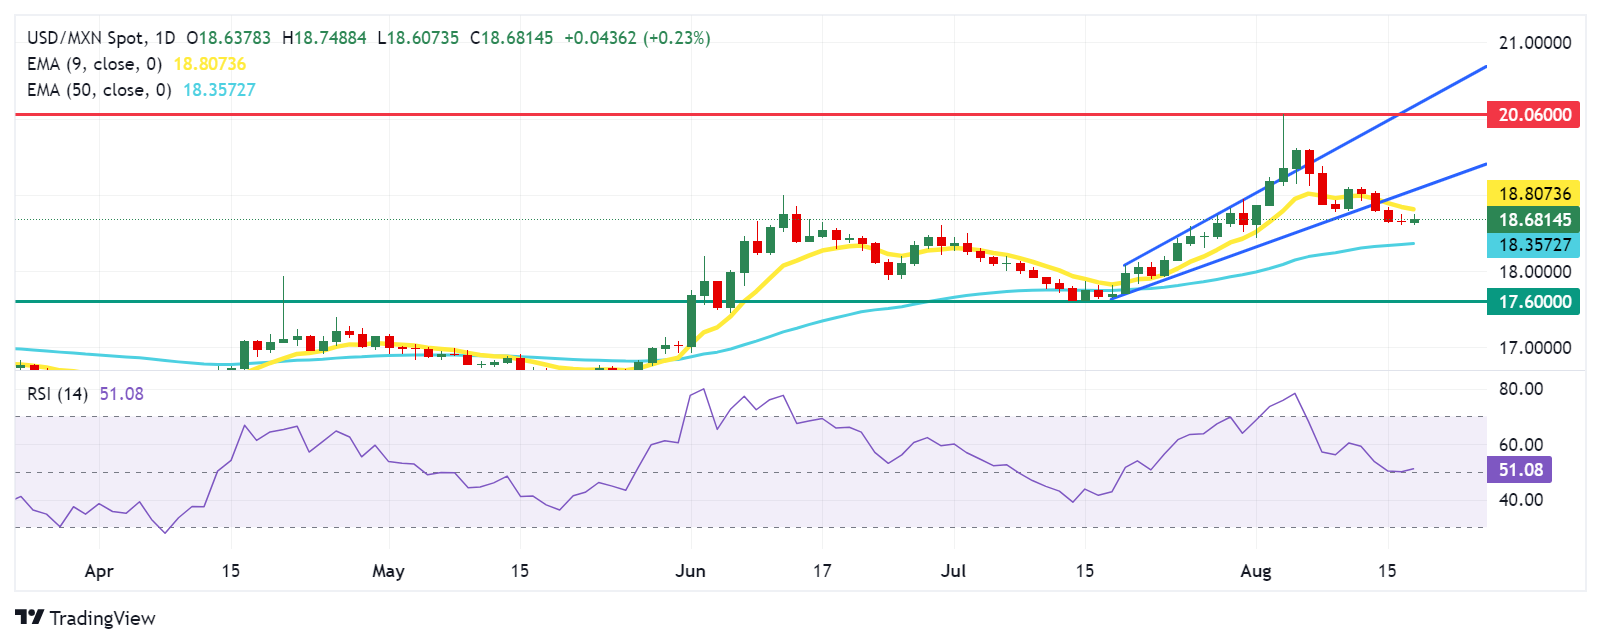
Mexican Peso FAQs
The Mexican Peso (MXN) is the most traded currency among its Latin American peers. Its value is broadly determined by the performance of the Mexican economy, the country’s central bank’s policy, the amount of foreign investment in the country and even the levels of remittances sent by Mexicans who live abroad, particularly in the United States. Geopolitical trends can also move MXN: for example, the process of nearshoring – or the decision by some firms to relocate manufacturing capacity and supply chains closer to their home countries – is also seen as a catalyst for the Mexican currency as the country is considered a key manufacturing hub in the American continent. Another catalyst for MXN is Oil prices as Mexico is a key exporter of the commodity.
The main objective of Mexico’s central bank, also known as Banxico, is to maintain inflation at low and stable levels (at or close to its target of 3%, the midpoint in a tolerance band of between 2% and 4%). To this end, the bank sets an appropriate level of interest rates. When inflation is too high, Banxico will attempt to tame it by raising interest rates, making it more expensive for households and businesses to borrow money, thus cooling demand and the overall economy. Higher interest rates are generally positive for the Mexican Peso (MXN) as they lead to higher yields, making the country a more attractive place for investors. On the contrary, lower interest rates tend to weaken MXN.
Macroeconomic data releases are key to assess the state of the economy and can have an impact on the Mexican Peso (MXN) valuation. A strong Mexican economy, based on high economic growth, low unemployment and high confidence is good for MXN. Not only does it attract more foreign investment but it may encourage the Bank of Mexico (Banxico) to increase interest rates, particularly if this strength comes together with elevated inflation. However, if economic data is weak, MXN is likely to depreciate.
As an emerging-market currency, the Mexican Peso (MXN) tends to strive during risk-on periods, or when investors perceive that broader market risks are low and thus are eager to engage with investments that carry a higher risk. Conversely, MXN tends to weaken at times of market turbulence or economic uncertainty as investors tend to sell higher-risk assets and flee to the more-stable safe havens.
- The Pound Sterling is trading mixed in its key pairs at the start of the new week.
- GBP is rising against the US Dollar as recession concerns haunt USD – versus the Yen it is weakening due to strong Japanese data.
- From a technical perspective, GBP/USD continues rising in an established short-term uptrend.
The Pound Sterling (GBP) trades mixed in its most heavily traded pairs on Monday despite positive economic data releases of late. The Sterling is gaining against the US Dollar (USD) but trading flat against the Euro (EUR) and falling against the Japanese Yen (JPY). GBP’s recent moves have less to do with news or data out of the UK and more to do with the volatility in its counterparts.
Pound Sterling mixed but resilient after string of positive data
The Pound Sterling is trading mixed at the start of the new week. Recent assessments of the UK economy have been mostly positive, with some economists describing it as striking a “Goldilocks” balance between “not too cold” and “not too hot”.
Headline Inflation is hovering around the Bank of England’s (BoE) 2.0% target, and Services inflation – which thus far has remained particularly high – fell to 5.2% in July from 5.7% previously, working its way back to a long-run average of around 3.5%.
UK Retail Sales data last week showed a rebound in July of 0.5% from a negative 0.9% in June. The Unemployment Rate fell to 4.2% in Q2 from 4.4% in Q1, and Gross Domestic Product (GDP) rose 0.9% from 0.3% over the same period.
Lower headline inflation and easing in stubbornly high Services inflation led the BoE to cut interest rates at its August meeting to 5.00% from 5.25%. Lower interest rates tend to depress GBP’s value by reducing foreign capital inflows. Market-based gauges of whether interest rates will fall any further are giving a slightly lower than 50% probability of a further 0.25% cut in September. Economists at Capital Economics expect a total of two more 0.25% cuts before the end of the year.
Sterling rises versus the USD but falls against JPY
Against the US Dollar, GBP has risen two tenths of a percent to trade in the 1.2950s on Monday, extending its gains from the previous week. The move comes on the back of broad-based USD weakness, following comments from the President of the Federal Reserve (Fed) Bank of Chicago Austin Goolsbee on Friday, who said that the US labor market and some other leading economic indicators were “flashing warning signs” including rising levels of credit card delinquencies. His words reawakened recession concerns, weighing on the US currency.
EUR/GBP is seesawing between tepid gains and losses with little new information or data to drive either of the currencies in the pair.
The Pound is falling against the Japanese Yen (JPY) after data out of Japan late Sunday evening showed Machinery Orders in Japan rebounding by a stronger-than-expected 2.1% MoM in June after registering a 3.2% decline in the previous month.
Japanese 10-year Government Bond yields rose to 0.9% following the data, helping to support the Yen to which they are highly correlated. The JPY had already been rallying after Japanese GDP data out last week surprised to the upside, showing the economy expanded 0.8% QoQ in Q2, reversing the 0.6% contraction in Q1 and beating expectations of 0.5%.
The Bank of Japan (BoJ) also surprised markets in July after deciding to raise interest rates from a 0.0% -0.10% band to 0.25% due to increasing inflationary pressures. This comes after successful spring wage negotiations gave workers more disposable income. The expectation is that the BoJ will raise rates even higher before the end of the year.
Technical Analysis: GBP/USD continues short-term rally
GBP/USD extends its sequence of higher highs and higher lows on the 4-hour time frame. This indicates the short-term trend is bullish and given “the trend is your friend” it is biased to continue rising.
GBP/USD 4-hour Chart
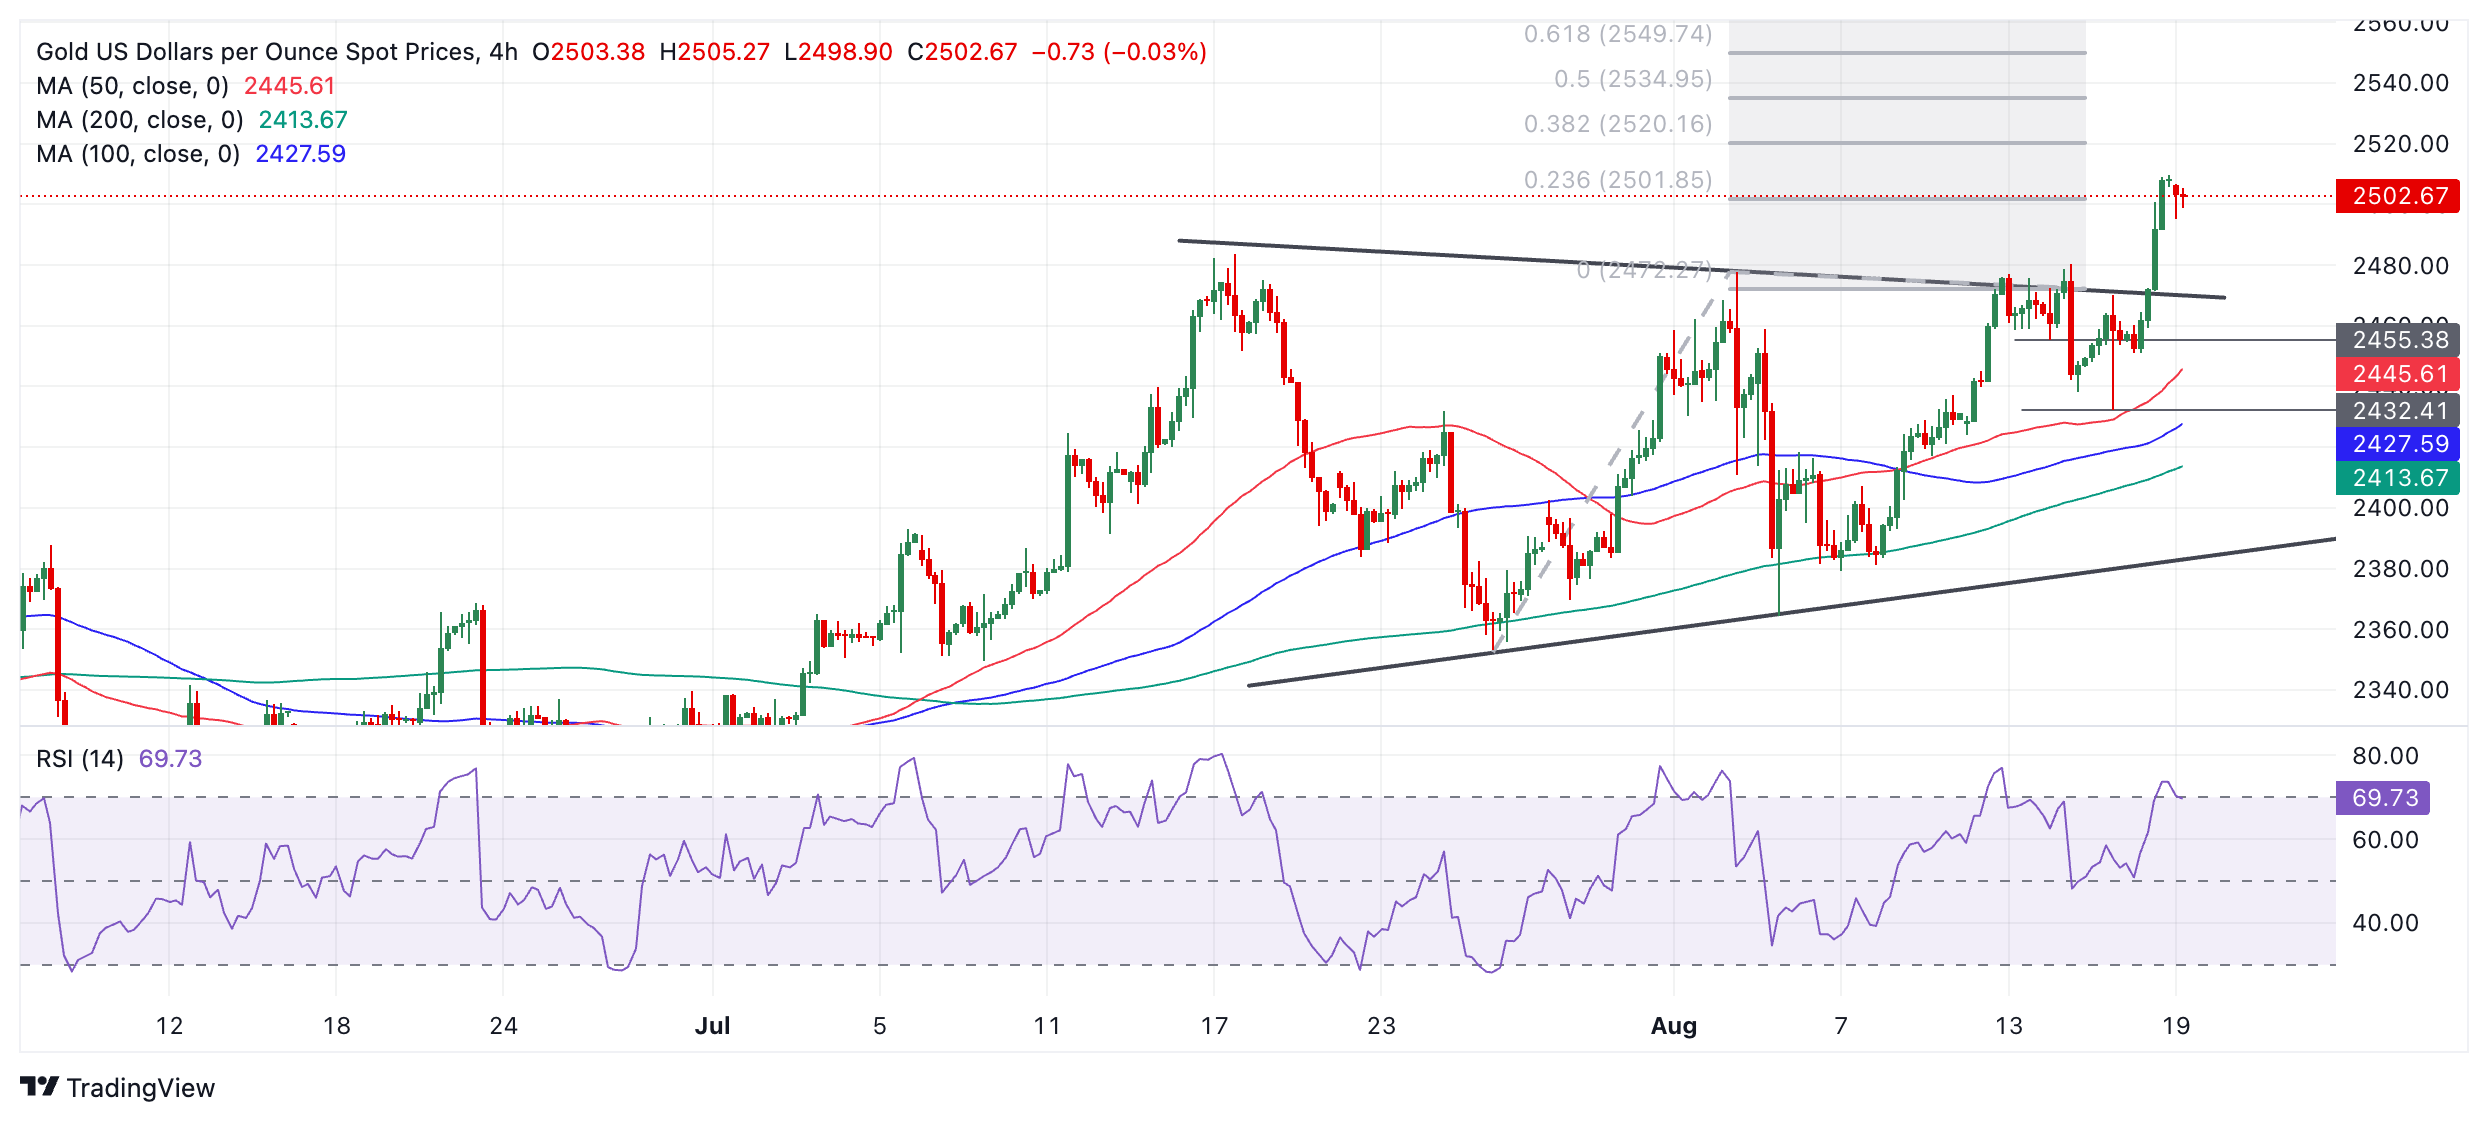
GBP/USD will probably extend higher to the next target at 1.3042 (July 17 high).
The Relative Strength Index (RSI) has risen into the overbought zone, indicating an increasing risk the pair could pull back. Former highs at 1.2940 could provide a support level for any pull back that materializes. The round number of 1.2900 is another level the pair might fall to in the event of a correction.
The medium and longer-term trends remain opaque and more “sideways” than directional, with price action trapped in the range between 1.2300 and 1.3042 since November 2023.
Economic Indicator
Retail Sales (MoM)
The Retail Sales data, released by the Office for National Statistics on a monthly basis, measures the volume of sales of goods by retailers in Great Britain directly to end customers. Changes in Retail Sales are widely followed as an indicator of consumer spending. Percent changes reflect the rate of changes in such sales, with the MoM reading comparing sales volumes in the reference month with the previous month. Generally, a high reading is seen as bullish for the Pound Sterling (GBP), while a low reading is seen as bearish.
Read more.Last release: Fri Aug 16, 2024 06:00
Frequency: Monthly
Actual: 0.5%
Consensus: 0.5%
Previous: -1.2%
Source: Office for National Statistics
- AUD/USD scales higher for the third straight day and touches a fresh multi-week top on Monday.
- Fed rate cut bets, along with the RBA’s hawkish stance, remain supportive of the strong move up.
- The technical setup favors bullish traders and supports prospects for a further appreciating move.
The AUD/USD pair sticks to its intraday gains through the early part of the European session and currently trades around the 0.6685 region, up over 0.25% for the day.
Expectations that the Federal Reserve (Fed) will start its rate-cutting cycle in September drag the US Dollar (USD) to its lowest level since January This, along with the Reserve Bank of Australia's (RBA) hawkish stance, turn out to be a key factor acting as a tailwind for the AUD/USD pair for the third successive day.
Meanwhile, technical indicators on the daily chart are holding comfortably in positive territory and are still away from being in the overbought zone. This, along with the recent breakout through the 200-day Simple Moving Average (SMA), suggests that the path of least resistance for the AUD/USD pair is to the upside
Bulls, however, need to wait for some follow-through buying beyond the 0.6700 handle before positioning for an extension of the recovery from the 0.6520-0.6515 area, or the YTD low touched earlier this month The AUD/USD pair might then climb to the 0.6745 intermediate hurdle before aiming to conquer the 0.6800 mark.
On the flip side, the Asian session low, around the 0.6650 area, is likely to act as immediate support ahead of the 0.6600 mark, or the 200-day SMA resistance breakpoint. The latter should now act as a strong base, which if broken might prompt aggressive technical selling around the AUD/USD pair and pave deeper losses.
The next relevant support is pegged near the 0.6565 area, below which the slide could extend towards the 0.6520-0.6510 region. Some follow-through selling below the 0.6500 psychological mark will suggest that the move-up witnessed over the past two weeks or so has run out of steam and shift the bias in favor of bearish traders.
AUD/USD daily chart
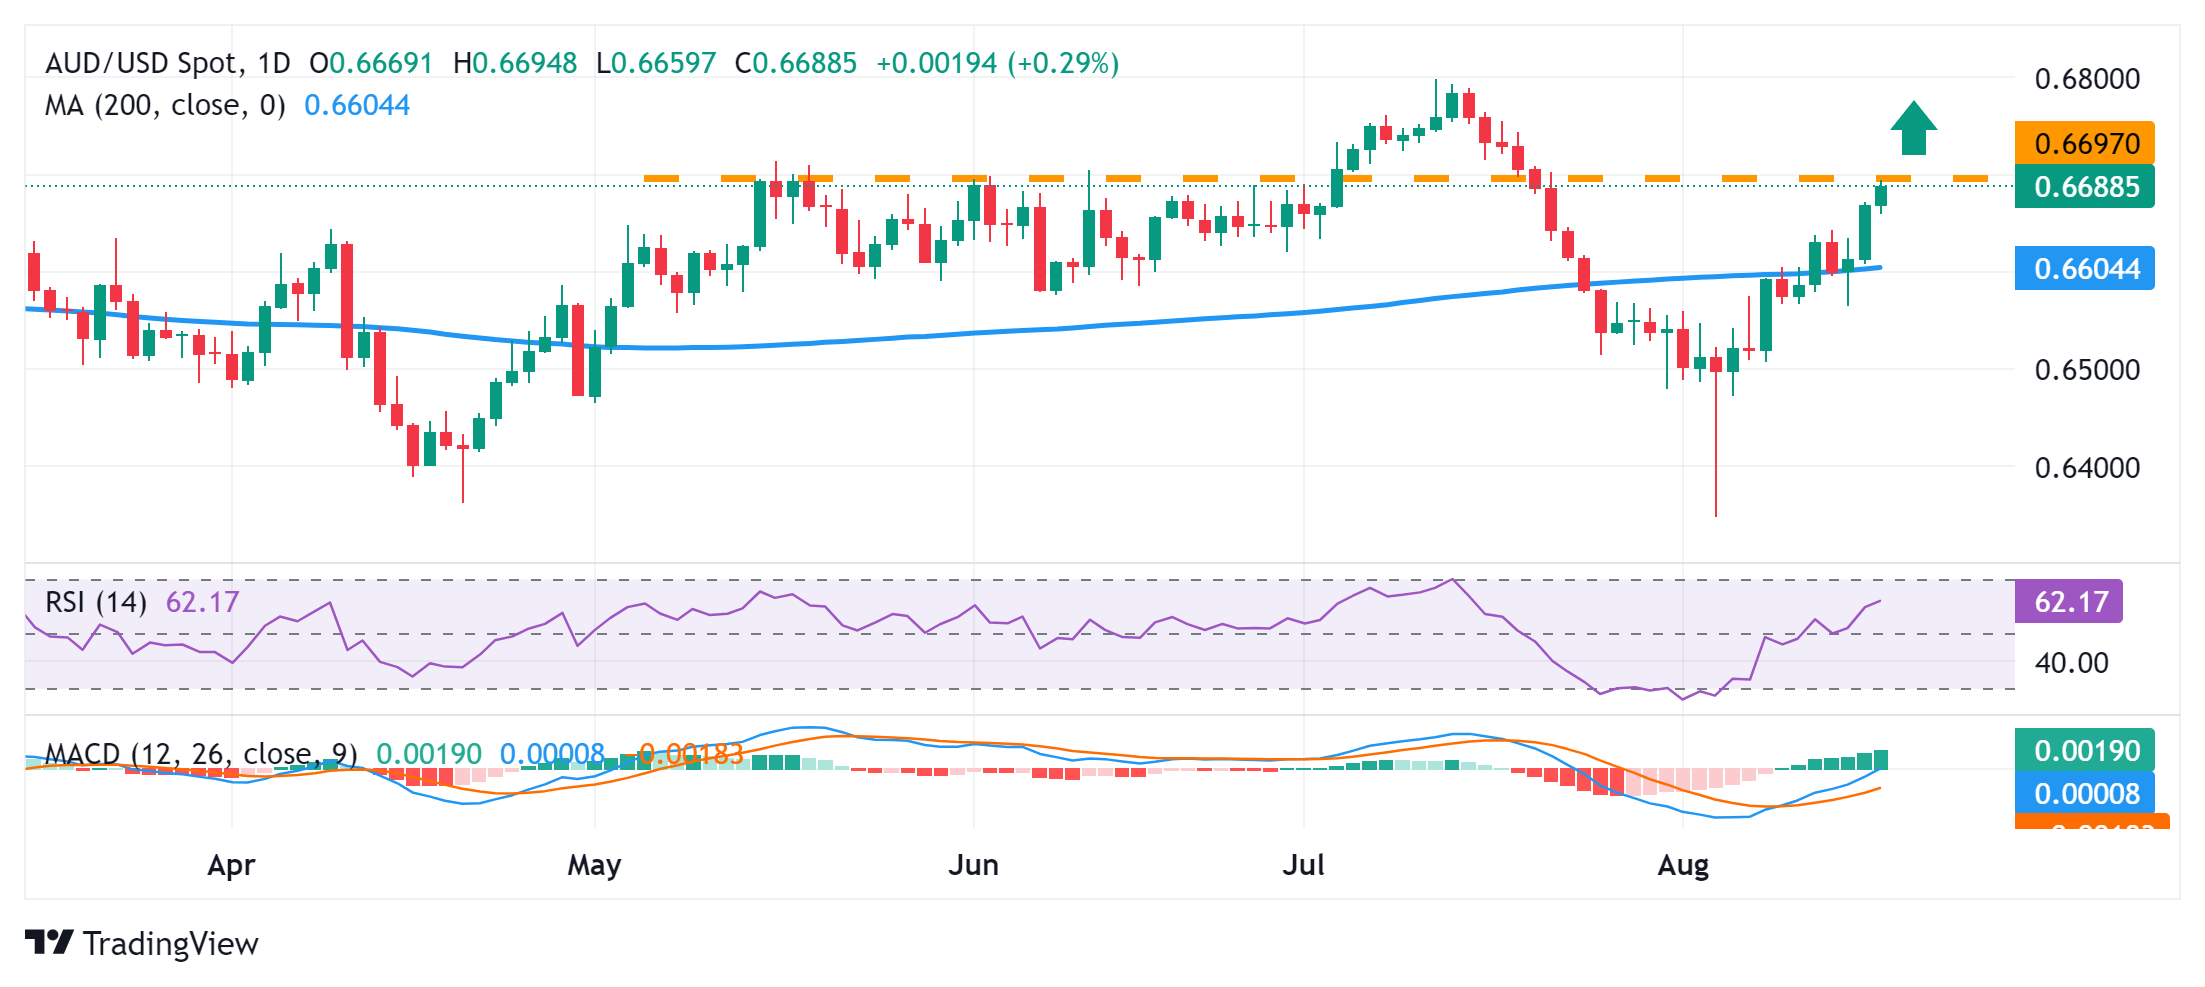
Australian Dollar FAQs
One of the most significant factors for the Australian Dollar (AUD) is the level of interest rates set by the Reserve Bank of Australia (RBA). Because Australia is a resource-rich country another key driver is the price of its biggest export, Iron Ore. The health of the Chinese economy, its largest trading partner, is a factor, as well as inflation in Australia, its growth rate and Trade Balance. Market sentiment – whether investors are taking on more risky assets (risk-on) or seeking safe-havens (risk-off) – is also a factor, with risk-on positive for AUD.
The Reserve Bank of Australia (RBA) influences the Australian Dollar (AUD) by setting the level of interest rates that Australian banks can lend to each other. This influences the level of interest rates in the economy as a whole. The main goal of the RBA is to maintain a stable inflation rate of 2-3% by adjusting interest rates up or down. Relatively high interest rates compared to other major central banks support the AUD, and the opposite for relatively low. The RBA can also use quantitative easing and tightening to influence credit conditions, with the former AUD-negative and the latter AUD-positive.
China is Australia’s largest trading partner so the health of the Chinese economy is a major influence on the value of the Australian Dollar (AUD). When the Chinese economy is doing well it purchases more raw materials, goods and services from Australia, lifting demand for the AUD, and pushing up its value. The opposite is the case when the Chinese economy is not growing as fast as expected. Positive or negative surprises in Chinese growth data, therefore, often have a direct impact on the Australian Dollar and its pairs.
Iron Ore is Australia’s largest export, accounting for $118 billion a year according to data from 2021, with China as its primary destination. The price of Iron Ore, therefore, can be a driver of the Australian Dollar. Generally, if the price of Iron Ore rises, AUD also goes up, as aggregate demand for the currency increases. The opposite is the case if the price of Iron Ore falls. Higher Iron Ore prices also tend to result in a greater likelihood of a positive Trade Balance for Australia, which is also positive of the AUD.
The Trade Balance, which is the difference between what a country earns from its exports versus what it pays for its imports, is another factor that can influence the value of the Australian Dollar. If Australia produces highly sought after exports, then its currency will gain in value purely from the surplus demand created from foreign buyers seeking to purchase its exports versus what it spends to purchase imports. Therefore, a positive net Trade Balance strengthens the AUD, with the opposite effect if the Trade Balance is negative.
- AUD/JPY loses ground due to hawkish sentiment surrounding the BoJ.
- The safe-haven flows amid rising geopolitical tensions provide support for the Japanese Yen.
- The downside of the currency cross could be limited due to the risk-on mood, along with the hawkish RBA.
AUD/JPY depreciates to near 97.50 during the early European hours on Monday. The downside of the AUD/JPY cross is attributed to the improved Japanese Yen (JPY), driven by hawkish sentiment surrounding the Bank of Japan (BoJ) regarding its policy outlook.
Last week’s data showing growth in Japan’s second-quarter GDP supports the potential for an interest rate hike by the BoJ in the near term. On Monday, Japan’s Machinery Orders, a key indicator of capital expenditure, increased by 2.1% month-on-month in June, surpassing the forecasted 1.1% rise. Markets are now anticipating Japanese inflation figures later this week for further insight into the Bank of Japan’s monetary policy direction.
Additionally, the safe-haven flows amid rising geopolitical tensions might have supported the Japanese Yen. Hamas has rejected the terms for a hostage release-ceasefire deal discussed in Doha on Thursday and Friday, according to Reuters citing a local news agency Times of Israel. Additionally, concerns about escalating tensions between Ukraine and Russia were heightened as Ukraine initiated the largest invasion of Russia since World War II.
However, the downside of the AUD/JPY cross could be restrained due to improved risk sentiment, along with the hawkish mood surrounding the Reserve Bank of Australia (RBA) regarding its policy outlook. Investors will be closely watching the RBA Meeting Minutes and the People’s Bank of China’s (PBoC) Interest Rate Decision on Tuesday.
RBA Governor Michele Bullock stated on Friday that the Australian central bank is focused on the potential upside risks to inflation and anticipates no rate cuts in the near term. Bullock emphasized that the RBA board believes it has struck the right balance between controlling inflation and maintaining stability in the current economic climate, according to ABC News.
Risk sentiment FAQs
In the world of financial jargon the two widely used terms “risk-on” and “risk off'' refer to the level of risk that investors are willing to stomach during the period referenced. In a “risk-on” market, investors are optimistic about the future and more willing to buy risky assets. In a “risk-off” market investors start to ‘play it safe’ because they are worried about the future, and therefore buy less risky assets that are more certain of bringing a return, even if it is relatively modest.
Typically, during periods of “risk-on”, stock markets will rise, most commodities – except Gold – will also gain in value, since they benefit from a positive growth outlook. The currencies of nations that are heavy commodity exporters strengthen because of increased demand, and Cryptocurrencies rise. In a “risk-off” market, Bonds go up – especially major government Bonds – Gold shines, and safe-haven currencies such as the Japanese Yen, Swiss Franc and US Dollar all benefit.
The Australian Dollar (AUD), the Canadian Dollar (CAD), the New Zealand Dollar (NZD) and minor FX like the Ruble (RUB) and the South African Rand (ZAR), all tend to rise in markets that are “risk-on”. This is because the economies of these currencies are heavily reliant on commodity exports for growth, and commodities tend to rise in price during risk-on periods. This is because investors foresee greater demand for raw materials in the future due to heightened economic activity.
The major currencies that tend to rise during periods of “risk-off” are the US Dollar (USD), the Japanese Yen (JPY) and the Swiss Franc (CHF). The US Dollar, because it is the world’s reserve currency, and because in times of crisis investors buy US government debt, which is seen as safe because the largest economy in the world is unlikely to default. The Yen, from increased demand for Japanese government bonds, because a high proportion are held by domestic investors who are unlikely to dump them – even in a crisis. The Swiss Franc, because strict Swiss banking laws offer investors enhanced capital protection.
- GBP/JPY attracts some sellers to near 188.70 in Monday’s early European session, down 1.27% on the day.
- A rebound in Japanese 2Q GDP supports the case for a rate hike by the BoJ.
- The preliminary UK August S&P Global/CIPS Manufacturing PMI and Japanese July National CPI will be the highlights this week.
The GBP/JPY cross weakens around 188.70 on Monday during the early European trading hours. Hawkish sentiment surrounding the Bank of Japan (BoJ) and the stronger Japanese second-quarter Gross Domestic Product (GDP) data support the rally of the Japanese Yen (JPY) and drag the cross lower.
Investors seem to be optimistic that Japan's better second-quarter GDP report last week would convince the Bank of Japan (BoJ) to raise interest rates further, which boosts the JPY broadly. The Japanese economy grew by 0.8% quarter-on-quarter in Q2, beating the market estimation of 0.5%.
Kazutaka Maeda, an economist at Meiji Yasuda Research Institute, said that the reports are simply positive overall and “it supports the BoJ’s view and bodes well for further rate hikes, although the central bank would remain cautious as the last rate increase had caused a sharp spike in the Yen.”
Japanese Economy Minister Yoshitaka Shindo stated last week that the economy is estimated to recover gradually as wages and income improve, adding that the government will collaborate closely with the BoJ to implement flexible monetary policy in the future.
On the other hand, the encouraging UK Retail Sales data on Friday has diminished bets of a second straight Bank of England (BoE) interest rate cut. This, in turn, might cap the downside for the Pound Sterling (GBP). However, UBS analysts expect another rate cut by the BoE in November. “We expect another 25 bps cut in November with more to come in 2025,” said UBS analysts.
Traders will keep an eye on the preliminary UK S&P Global/CIPS Manufacturing Purchasing Managers Index (PMI) for August and Japanese National CPI for July for fresh impetus, which is due on Thursday and Friday, respectively.
Japanese Yen FAQs
The Japanese Yen (JPY) is one of the world’s most traded currencies. Its value is broadly determined by the performance of the Japanese economy, but more specifically by the Bank of Japan’s policy, the differential between Japanese and US bond yields, or risk sentiment among traders, among other factors.
One of the Bank of Japan’s mandates is currency control, so its moves are key for the Yen. The BoJ has directly intervened in currency markets sometimes, generally to lower the value of the Yen, although it refrains from doing it often due to political concerns of its main trading partners. The current BoJ ultra-loose monetary policy, based on massive stimulus to the economy, has caused the Yen to depreciate against its main currency peers. This process has exacerbated more recently due to an increasing policy divergence between the Bank of Japan and other main central banks, which have opted to increase interest rates sharply to fight decades-high levels of inflation.
The BoJ’s stance of sticking to ultra-loose monetary policy has led to a widening policy divergence with other central banks, particularly with the US Federal Reserve. This supports a widening of the differential between the 10-year US and Japanese bonds, which favors the US Dollar against the Japanese Yen.
The Japanese Yen is often seen as a safe-haven investment. This means that in times of market stress, investors are more likely to put their money in the Japanese currency due to its supposed reliability and stability. Turbulent times are likely to strengthen the Yen’s value against other currencies seen as more risky to invest in.
Here is what you need to know on Monday, August 19:
The US Dollar (USD) stays under selling pressure early Monday, with the USD Index dropping to its weakest level since early January near 102.00. The economic calendar will not offer any high-impact data releases and investors will pay close attention to comments from central bank officials.
US Dollar PRICE Today
The table below shows the percentage change of US Dollar (USD) against listed major currencies today. US Dollar was the weakest against the Japanese Yen.
| USD | EUR | GBP | JPY | CAD | AUD | NZD | CHF | |
|---|---|---|---|---|---|---|---|---|
| USD | -0.20% | -0.18% | -1.40% | -0.10% | -0.30% | -0.51% | -0.23% | |
| EUR | 0.20% | -0.06% | -1.17% | 0.09% | -0.20% | -0.49% | -0.07% | |
| GBP | 0.18% | 0.06% | -1.27% | 0.12% | -0.15% | -0.36% | -0.01% | |
| JPY | 1.40% | 1.17% | 1.27% | 1.24% | 1.07% | 1.01% | 1.04% | |
| CAD | 0.10% | -0.09% | -0.12% | -1.24% | -0.23% | -0.33% | -0.17% | |
| AUD | 0.30% | 0.20% | 0.15% | -1.07% | 0.23% | -0.13% | 0.13% | |
| NZD | 0.51% | 0.49% | 0.36% | -1.01% | 0.33% | 0.13% | 0.30% | |
| CHF | 0.23% | 0.07% | 0.00% | -1.04% | 0.17% | -0.13% | -0.30% |
The heat map shows percentage changes of major currencies against each other. The base currency is picked from the left column, while the quote currency is picked from the top row. For example, if you pick the US Dollar from the left column and move along the horizontal line to the Japanese Yen, the percentage change displayed in the box will represent USD (base)/JPY (quote).
The USD Index fell over 0.5% on Friday and closed the fifth consecutive week in negative territory. Improving risk mood and the decline seen in the US Treasury bond yields made it difficult for the USD to hold its ground heading into the weekend. In the European morning on Monday, the 10-year US yield stays in the red below 3.9% and US stock index futures trade virtually unchanged on the day.
The Japanese Yen (JPY) is one of the best performing major currencies at the start of the new week. At the time of press, USD/JPY was down 1.5% on the day at 145.30 and EUR/JPY was losing 1.4% near 160.50. During the Asian trading hours, the data from Japan showed that Machinery Orders rose by 2.1% on a monthly basis in June, following the 3.2% contraction recorded in May and surpassing the market expectation for an increase of 1.1%.
After rising 0.5% on Friday, EUR/USD continued to stretch higher and set a new 2024-high at 1.1050 early Monday. Germany's Bundesbank will publish its monthly report later in the European session.
Gold gathered bullish momentum and reached a new record high near $2,510 in the late American session on Friday. XAU/USD stays in a consolidation phase above $2,500 in the European morning on Monday.
GBP/USD extended its uptrend on Friday and registered its highest weekly close since early July at 1.2945. The pair inches higher in the early European session and was last seen trading a few pips above 1.2960.
AUD/USD benefits from the broad-based selling pressure surrounding the US Dollar and trades at its highest level in nearly a month at around 0.6700. Similarly, NZD/USD rises 0.4% on the day near 0.6080.
Japanese Yen FAQs
The Japanese Yen (JPY) is one of the world’s most traded currencies. Its value is broadly determined by the performance of the Japanese economy, but more specifically by the Bank of Japan’s policy, the differential between Japanese and US bond yields, or risk sentiment among traders, among other factors.
One of the Bank of Japan’s mandates is currency control, so its moves are key for the Yen. The BoJ has directly intervened in currency markets sometimes, generally to lower the value of the Yen, although it refrains from doing it often due to political concerns of its main trading partners. The current BoJ ultra-loose monetary policy, based on massive stimulus to the economy, has caused the Yen to depreciate against its main currency peers. This process has exacerbated more recently due to an increasing policy divergence between the Bank of Japan and other main central banks, which have opted to increase interest rates sharply to fight decades-high levels of inflation.
The BoJ’s stance of sticking to ultra-loose monetary policy has led to a widening policy divergence with other central banks, particularly with the US Federal Reserve. This supports a widening of the differential between the 10-year US and Japanese bonds, which favors the US Dollar against the Japanese Yen.
The Japanese Yen is often seen as a safe-haven investment. This means that in times of market stress, investors are more likely to put their money in the Japanese currency due to its supposed reliability and stability. Turbulent times are likely to strengthen the Yen’s value against other currencies seen as more risky to invest in.
FX option expiries for Aug 19 NY cut at 10:00 Eastern Time, via DTCC, can be found below.
EUR/USD: EUR amounts
- 1.0980 1.2b
- 1.1000 582m
- 1.1090 765m
GBP/USD: GBP amounts
- 1.2675 779m
- 1.2850 845m
USD/JPY: USD amounts
- 146.00 1.3b
- 147.80 800m
AUD/USD: AUD amounts
- 0.6675 1.1b
USD/CAD: USD amounts
- 1.3700 705m
- 1.3900 1.4b
EUR/GBP: EUR amounts
- 0.8685 680m
- EUR/USD edge higher to YTD highs near 1.1040 in Monday’s early European session.
- Fed’s Dovish remarks and higher bets on Fed rate cut in September continue to undermine USD and lift EUR/USD.
- The Euro gains ground as the markets expect the ECB to reduce interest rates gradually.
The EUR/USD pair rises to the year-to-date (YTD) highs near 1.1040 during the early European section on Monday. The softer US Dollar (USD) across the board amid the growing speculation that the Federal Reserve (Fed) will cut the interest rate in September provides some support to the major pair. Traders will closely monitor Fed Chair Jerome Powell's speech on Friday for more cues about potential interest rate cuts.
San Francisco Fed President Mary Daly said on Sunday that recent US economic data have given her “more confidence” that inflation is under control, adding that it’s time to consider adjusting borrowing costs from their current range of 5.25% to 5.5%. Meanwhile, Chicago Fed President Austan Goolsbee emphasized on Sunday that the US central bank officials should be wary of keeping the restrictive policy in place longer than necessary. The dovish comments from Fed policymakers further exert some selling pressure on the Greenback and create a tailwind for EUR/USD.
Investors are now pricing in about 70% odds of a quarter-point Fed rate cut in September, while a minority of investors expect a half-point move. Morningstar chief US economist, Preston Caldwell, noted that the CPI report "provides further support for aggressive Fed rate cuts beginning in September.” Caldwell sees a 25bps cut to start, which will take Fed Funds to 5.00-5.25%.
Across the pond, the Euro (EUR) remains strong as the markets anticipate the European Central Bank (ECB) will reduce interest rates gradually. ECB President Christine Lagarde underscored at the latest press conference that policymakers are "not pre-committing to a particular rate path. The consensus was to adhere to a data-dependent and meeting-by-meeting approach.
Euro FAQs
The Euro is the currency for the 20 European Union countries that belong to the Eurozone. It is the second most heavily traded currency in the world behind the US Dollar. In 2022, it accounted for 31% of all foreign exchange transactions, with an average daily turnover of over $2.2 trillion a day. EUR/USD is the most heavily traded currency pair in the world, accounting for an estimated 30% off all transactions, followed by EUR/JPY (4%), EUR/GBP (3%) and EUR/AUD (2%).
The European Central Bank (ECB) in Frankfurt, Germany, is the reserve bank for the Eurozone. The ECB sets interest rates and manages monetary policy. The ECB’s primary mandate is to maintain price stability, which means either controlling inflation or stimulating growth. Its primary tool is the raising or lowering of interest rates. Relatively high interest rates – or the expectation of higher rates – will usually benefit the Euro and vice versa. The ECB Governing Council makes monetary policy decisions at meetings held eight times a year. Decisions are made by heads of the Eurozone national banks and six permanent members, including the President of the ECB, Christine Lagarde.
Eurozone inflation data, measured by the Harmonized Index of Consumer Prices (HICP), is an important econometric for the Euro. If inflation rises more than expected, especially if above the ECB’s 2% target, it obliges the ECB to raise interest rates to bring it back under control. Relatively high interest rates compared to its counterparts will usually benefit the Euro, as it makes the region more attractive as a place for global investors to park their money.
Data releases gauge the health of the economy and can impact on the Euro. Indicators such as GDP, Manufacturing and Services PMIs, employment, and consumer sentiment surveys can all influence the direction of the single currency. A strong economy is good for the Euro. Not only does it attract more foreign investment but it may encourage the ECB to put up interest rates, which will directly strengthen the Euro. Otherwise, if economic data is weak, the Euro is likely to fall. Economic data for the four largest economies in the euro area (Germany, France, Italy and Spain) are especially significant, as they account for 75% of the Eurozone’s economy.
Another significant data release for the Euro is the Trade Balance. This indicator measures the difference between what a country earns from its exports and what it spends on imports over a given period. If a country produces highly sought after exports then its currency will gain in value purely from the extra demand created from foreign buyers seeking to purchase these goods. Therefore, a positive net Trade Balance strengthens a currency and vice versa for a negative balance.
Gold prices fell in India on Monday, according to data compiled by FXStreet.
The price for Gold stood at 6,744.25 Indian Rupees (INR) per gram, down compared with the INR 6,764.75 it cost on Friday.
The price for Gold decreased to INR 78,663.64 per tola from INR 78,902.73 per tola on friday.
| Unit measure | Gold Price in INR |
|---|---|
| 1 Gram | 6,744.25 |
| 10 Grams | 67,442.80 |
| Tola | 78,663.64 |
| Troy Ounce | 209,774.90 |
FXStreet calculates Gold prices in India by adapting international prices (USD/INR) to the local currency and measurement units. Prices are updated daily based on the market rates taken at the time of publication. Prices are just for reference and local rates could diverge slightly.
Gold FAQs
Gold has played a key role in human’s history as it has been widely used as a store of value and medium of exchange. Currently, apart from its shine and usage for jewelry, the precious metal is widely seen as a safe-haven asset, meaning that it is considered a good investment during turbulent times. Gold is also widely seen as a hedge against inflation and against depreciating currencies as it doesn’t rely on any specific issuer or government.
Central banks are the biggest Gold holders. In their aim to support their currencies in turbulent times, central banks tend to diversify their reserves and buy Gold to improve the perceived strength of the economy and the currency. High Gold reserves can be a source of trust for a country’s solvency. Central banks added 1,136 tonnes of Gold worth around $70 billion to their reserves in 2022, according to data from the World Gold Council. This is the highest yearly purchase since records began. Central banks from emerging economies such as China, India and Turkey are quickly increasing their Gold reserves.
Gold has an inverse correlation with the US Dollar and US Treasuries, which are both major reserve and safe-haven assets. When the Dollar depreciates, Gold tends to rise, enabling investors and central banks to diversify their assets in turbulent times. Gold is also inversely correlated with risk assets. A rally in the stock market tends to weaken Gold price, while sell-offs in riskier markets tend to favor the precious metal.
The price can move due to a wide range of factors. Geopolitical instability or fears of a deep recession can quickly make Gold price escalate due to its safe-haven status. As a yield-less asset, Gold tends to rise with lower interest rates, while higher cost of money usually weighs down on the yellow metal. Still, most moves depend on how the US Dollar (USD) behaves as the asset is priced in dollars (XAU/USD). A strong Dollar tends to keep the price of Gold controlled, whereas a weaker Dollar is likely to push Gold prices up.
(An automation tool was used in creating this post.)
- USD/CHF extends its losses as traders expect the Fed to start reducing the rate in September.
- San Francisco Fed President Mary Daly emphasized that the US central bank should reduce rates gradually.
- The Swiss Franc may appreciate further due to rising geopolitical tensions in the Middle East and the ongoing Russia-Ukraine conflict.
USD/CHF continues to lose ground, trading around 0.8640 during the Asian session on Monday. The US Dollar (USD) continues to weaken following dovish comments from Federal Reserve (Fed) officials, raising bets for an interest rate cut by the central bank in September and undermining the USD/CHF pair.
Federal Reserve Bank of San Francisco President Mary Daly emphasized Sunday that the US central bank should take a gradual approach to reducing borrowing costs, according to the Financial Times. Additionally, Federal Reserve Bank of Chicago President Austan Goolsbee warned that central bank officials should be cautious about keeping a restrictive policy in place longer than necessary.
The US Dollar Index (DXY), which measures the value of the US Dollar (USD) against other six major currencies, extends its losses for the second successive day, hovering around 102.10. The decline in the US yields contributes to downward pressure for the Greenback with 2-year and 10-year yields standing at 4.05% and 3.88%, respectively, at the time of writing.
On the CHF front, the safe-haven flows amid rising geopolitical tensions might have supported the Swiss Franc (CHF). Hamas has issued a statement rejecting the terms for a hostage release-ceasefire deal discussed in Doha on Thursday and Friday, according to Reuters citing a local news agency Times of Israel. Additionally, concerns about escalating tensions between Ukraine and Russia were heightened as Ukraine initiated the largest invasion of Russia since World War II.
On Friday, Industrial Production in Switzerland surged by 7.3% year-on-year in the second quarter, rebounding sharply from a downwardly revised 2% decline in the previous quarter. This represents the fastest expansion in industrial production since Q1 2022. Traders are likely awaiting the Trade Balance data, scheduled for release on Tuesday.
Swiss Franc FAQs
The Swiss Franc (CHF) is Switzerland’s official currency. It is among the top ten most traded currencies globally, reaching volumes that well exceed the size of the Swiss economy. Its value is determined by the broad market sentiment, the country’s economic health or action taken by the Swiss National Bank (SNB), among other factors. Between 2011 and 2015, the Swiss Franc was pegged to the Euro (EUR). The peg was abruptly removed, resulting in a more than 20% increase in the Franc’s value, causing a turmoil in markets. Even though the peg isn’t in force anymore, CHF fortunes tend to be highly correlated with the Euro ones due to the high dependency of the Swiss economy on the neighboring Eurozone.
The Swiss Franc (CHF) is considered a safe-haven asset, or a currency that investors tend to buy in times of market stress. This is due to the perceived status of Switzerland in the world: a stable economy, a strong export sector, big central bank reserves or a longstanding political stance towards neutrality in global conflicts make the country’s currency a good choice for investors fleeing from risks. Turbulent times are likely to strengthen CHF value against other currencies that are seen as more risky to invest in.
The Swiss National Bank (SNB) meets four times a year – once every quarter, less than other major central banks – to decide on monetary policy. The bank aims for an annual inflation rate of less than 2%. When inflation is above target or forecasted to be above target in the foreseeable future, the bank will attempt to tame price growth by raising its policy rate. Higher interest rates are generally positive for the Swiss Franc (CHF) as they lead to higher yields, making the country a more attractive place for investors. On the contrary, lower interest rates tend to weaken CHF.
Macroeconomic data releases in Switzerland are key to assessing the state of the economy and can impact the Swiss Franc’s (CHF) valuation. The Swiss economy is broadly stable, but any sudden change in economic growth, inflation, current account or the central bank’s currency reserves have the potential to trigger moves in CHF. Generally, high economic growth, low unemployment and high confidence are good for CHF. Conversely, if economic data points to weakening momentum, CHF is likely to depreciate.
As a small and open economy, Switzerland is heavily dependent on the health of the neighboring Eurozone economies. The broader European Union is Switzerland’s main economic partner and a key political ally, so macroeconomic and monetary policy stability in the Eurozone is essential for Switzerland and, thus, for the Swiss Franc (CHF). With such dependency, some models suggest that the correlation between the fortunes of the Euro (EUR) and the CHF is more than 90%, or close to perfect.
- The US Dollar Index extends its losses following the dovish comments from Fed officials.
- San Francisco Fed President Mary Daly emphasized that the US central bank should reduce rates gradually.
- The decline in the US yields contributes to the weakening of the Greenback.
The US Dollar Index (DXY), which measures the value of the US Dollar (USD) against other six major currencies, extends its losses for the second successive day, hovering around 102.10 during the Asian hours on Monday.
The US Dollar continues to weaken following dovish comments from Federal Reserve (Fed) officials, which have increased expectations for an interest rate cut by the central bank in September. Furthermore, last week’s US economic data revealed that both the Producer Price Index (PPI) and Consumer Price Index (CPI) suggest that inflation is easing.
Federal Reserve Bank of San Francisco President Mary Daly stressed on Sunday that the US central bank should adopt a gradual approach to lowering borrowing costs, according to the Financial Times. Daly countered economists' concerns that the US economy is facing a sharp slowdown that would warrant rapid interest rate cuts.
Additionally, Federal Reserve Bank of Chicago President Austan Goolsbee cautioned that central bank officials should be careful not to maintain a restrictive policy longer than necessary. Although it's uncertain whether the Fed will cut interest rates next month, failing to do so could negatively impact the labor market, according to CNBC.
Additionally, the decline in the US yields contributes to downward pressure for the Greenback. 2-year and 10-year yields on US Treasury bonds stand at 4.05% and 3.88%, respectively, at the time of writing. This week, all eyes will be on Federal Reserve Chair Jerome Powell's upcoming speech.
US Dollar FAQs
The US Dollar (USD) is the official currency of the United States of America, and the ‘de facto’ currency of a significant number of other countries where it is found in circulation alongside local notes. It is the most heavily traded currency in the world, accounting for over 88% of all global foreign exchange turnover, or an average of $6.6 trillion in transactions per day, according to data from 2022. Following the second world war, the USD took over from the British Pound as the world’s reserve currency. For most of its history, the US Dollar was backed by Gold, until the Bretton Woods Agreement in 1971 when the Gold Standard went away.
The most important single factor impacting on the value of the US Dollar is monetary policy, which is shaped by the Federal Reserve (Fed). The Fed has two mandates: to achieve price stability (control inflation) and foster full employment. Its primary tool to achieve these two goals is by adjusting interest rates. When prices are rising too quickly and inflation is above the Fed’s 2% target, the Fed will raise rates, which helps the USD value. When inflation falls below 2% or the Unemployment Rate is too high, the Fed may lower interest rates, which weighs on the Greenback.
In extreme situations, the Federal Reserve can also print more Dollars and enact quantitative easing (QE). QE is the process by which the Fed substantially increases the flow of credit in a stuck financial system. It is a non-standard policy measure used when credit has dried up because banks will not lend to each other (out of the fear of counterparty default). It is a last resort when simply lowering interest rates is unlikely to achieve the necessary result. It was the Fed’s weapon of choice to combat the credit crunch that occurred during the Great Financial Crisis in 2008. It involves the Fed printing more Dollars and using them to buy US government bonds predominantly from financial institutions. QE usually leads to a weaker US Dollar.
Quantitative tightening (QT) is the reverse process whereby the Federal Reserve stops buying bonds from financial institutions and does not reinvest the principal from the bonds it holds maturing in new purchases. It is usually positive for the US Dollar.
- The downside of the safe-haven Silver price could be limited due to rising geopolitical tensions.
- Hamas rejected the terms for a hostage release-ceasefire deal discussed in Doha on Thursday and Friday.
- Ukraine initiated the largest invasion of Russia since World War II.
Silver price (XAG/USD) price holds minor losses, trading around $29.00 per troy ounce during Monday’s Asian session. However, the downside of the safe-haven Silver could be limited due to rising geopolitical tensions.
On Sunday, conflicting statements from Hamas and Israel dampened the chances of a breakthrough ceasefire deal. Hamas has issued a statement rejecting the terms for a hostage release-ceasefire deal discussed in Doha on Thursday and Friday. The group accuses Prime Minister Benjamin Netanyahu of introducing new obstacles into the negotiations, according to Reuters citing a local news agency Times of Israel.
Israeli Prime Minister Benjamin Netanyahu is scheduled to host US Secretary of State Antony Blinken on Monday. Following their meeting, Blinken will travel to Cairo, where negotiations on a deal are continuing. The US has announced plans to host a second meeting later in the week and aims to finalize the agreement by the end of the week.
Additionally, concerns about escalating tensions between Ukraine and Russia were heightened as Ukraine initiated the largest invasion of Russia since World War II. The ministry released a video showing General Valery Gerasimov, the commander of the Russian military operations, visiting a different combat zone in Ukraine. Gerasimov received reports from commanders and set "tasks for further actions," according to Reuters.
The prices of non-yielding Silver may advance further due to the likelihood of an interest rate cut by the Federal Reserve (Fed) starting in September increases. Last week's US economic data indicated that Retail Sales exceeded expectations, while both the Producer Price Index (PPI) and Consumer Price Index (CPI) suggested that inflation is easing.
Federal Reserve Bank of San Francisco President Mary Daly emphasized Sunday that the US central bank should take a gradual approach to reducing borrowing costs, according to the Financial Times. Additionally, Federal Reserve Bank of Chicago President Austan Goolsbee warned that central bank officials should be cautious about keeping a restrictive policy in place longer than necessary.
Silver FAQs
Silver is a precious metal highly traded among investors. It has been historically used as a store of value and a medium of exchange. Although less popular than Gold, traders may turn to Silver to diversify their investment portfolio, for its intrinsic value or as a potential hedge during high-inflation periods. Investors can buy physical Silver, in coins or in bars, or trade it through vehicles such as Exchange Traded Funds, which track its price on international markets.
Silver prices can move due to a wide range of factors. Geopolitical instability or fears of a deep recession can make Silver price escalate due to its safe-haven status, although to a lesser extent than Gold's. As a yieldless asset, Silver tends to rise with lower interest rates. Its moves also depend on how the US Dollar (USD) behaves as the asset is priced in dollars (XAG/USD). A strong Dollar tends to keep the price of Silver at bay, whereas a weaker Dollar is likely to propel prices up. Other factors such as investment demand, mining supply – Silver is much more abundant than Gold – and recycling rates can also affect prices.
Silver is widely used in industry, particularly in sectors such as electronics or solar energy, as it has one of the highest electric conductivity of all metals – more than Copper and Gold. A surge in demand can increase prices, while a decline tends to lower them. Dynamics in the US, Chinese and Indian economies can also contribute to price swings: for the US and particularly China, their big industrial sectors use Silver in various processes; in India, consumers’ demand for the precious metal for jewellery also plays a key role in setting prices.
Silver prices tend to follow Gold's moves. When Gold prices rise, Silver typically follows suit, as their status as safe-haven assets is similar. The Gold/Silver ratio, which shows the number of ounces of Silver needed to equal the value of one ounce of Gold, may help to determine the relative valuation between both metals. Some investors may consider a high ratio as an indicator that Silver is undervalued, or Gold is overvalued. On the contrary, a low ratio might suggest that Gold is undervalued relative to Silver.
- EUR/JPY attracts sellers for the second straight day amid a goodish pickup in the JPY demand.
- Geopolitical risks, along with bets for additional BoJ rate hike in 2024, lend support to the JPY.
- The ECB’s dovish outlook contributes to the Euro’s underperformance and the ongoing decline.
The EUR/JPY cross turns lower for the second straight day following an Asian session uptick to the 163.20 area and moves away from over a two-week high, around the 163.85-163.90 region touched on Friday. Spot prices drop to a multi-day low, closer to mid-161.00s in the last hour and seem vulnerable to slide further amid a strong pickup in demand for the Japanese Yen (JPY).
Investors remain concerned about the risk of a further escalation of geopolitical tensions in the Middle East, which drives some haven flows towards the JPY and exerts downward pressure on the EUR/JPY cross. The market worries resurfaced after Hamas published an official statement rejecting the terms for a hostage release-ceasefire deal discussed in Doha last week. This, along with hawkish Bank of Japan (BoJ) expectations, underpins the JPY.
Japan’s second-quarter Gross Domestic Product (GDP) print released on Thursday surpassed consensus estimates on a quarterly as well as an annualized basis. Adding to this, data published this Monday showed that Machinery Orders in June surpassed consensus estimates and rose by 2.1% in June 2024. This signaled an improving demand and macroeconomic environment, which should encourage the BoJ to raise interest rates again later this year.
In contrast, the markets have been pricing in the possibility that the European Central Bank (ECB) will cut rates again in the wake of declining inflation in the Eurozone and downbeat economic outlook. This, in turn, contributes to the shared currency's relative underperformance against its Japanese counterpart and exerts additional pressure on the EUR/JPY cross, though a positive risk tone might cap the JPY and help limit any further losses.
The market attention now shifts to the release of the flash Eurozone PMIs on Thursday, which should provide fresh insight into the region's economic health and drive the Euro. In the meantime, the JPY price dynamics will continue to play a key role in influencing the EUR/JPY cross in the absence of any relevant market-moving economic data due for release on Monday.
Bank of Japan FAQs
The Bank of Japan (BoJ) is the Japanese central bank, which sets monetary policy in the country. Its mandate is to issue banknotes and carry out currency and monetary control to ensure price stability, which means an inflation target of around 2%.
The Bank of Japan has embarked in an ultra-loose monetary policy since 2013 in order to stimulate the economy and fuel inflation amid a low-inflationary environment. The bank’s policy is based on Quantitative and Qualitative Easing (QQE), or printing notes to buy assets such as government or corporate bonds to provide liquidity. In 2016, the bank doubled down on its strategy and further loosened policy by first introducing negative interest rates and then directly controlling the yield of its 10-year government bonds.
The Bank’s massive stimulus has caused the Yen to depreciate against its main currency peers. This process has exacerbated more recently due to an increasing policy divergence between the Bank of Japan and other main central banks, which have opted to increase interest rates sharply to fight decades-high levels of inflation. The BoJ’s policy of holding down rates has led to a widening differential with other currencies, dragging down the value of the Yen.
A weaker Yen and the spike in global energy prices have led to an increase in Japanese inflation, which has exceeded the BoJ’s 2% target. With wage inflation becoming a cause of concern, the BoJ looks to move away from ultra loose policy, while trying to avoid slowing the activity too much.
- The Japanese Yen advances as traders expect the BoJ to implement another rate hike in the near term.
- Japan’s Machinery Orders rose by 2.1% MoM in June, surpassing the expected 1.1% rise.
- The US Dollar loses ground as dovish Fedspeak raises odds of a Fed rate cut in September.
The Japanese Yen (JPY) appreciates for the second consecutive day against the US Dollar (USD), driven by hawkish sentiment surrounding the Bank of Japan (BoJ). Recent data showing growth in Japan’s second-quarter GDP supports the potential for an interest rate hike by the BoJ in the near term.
Japan’s Machinery Orders, a key indicator of capital expenditure, increased by 2.1% month-on-month in June, surpassing the forecasted 1.1% rise. Markets are now anticipating Japanese inflation figures later this week for further insight into the Bank of Japan’s monetary policy direction.
The US Dollar continues to lose ground following dovish comments from Federal Reserve (Fed) officials, which have heightened expectations for an interest rate cut by the US central bank in September. Additionally, last week’s US economic data showed that both the Producer Price Index (PPI) and Consumer Price Index (CPI) indicate that inflation is easing.
Federal Reserve Bank of San Francisco President Mary Daly emphasized Sunday that the US central bank should take a gradual approach to reducing borrowing costs, according to the Financial Times. Additionally, Federal Reserve Bank of Chicago President Austan Goolsbee warned that central bank officials should be cautious about keeping a restrictive policy in place longer than necessary.
Daily Digest Market Movers: Japanese Yen appreciates due to a hawkish BoJ
- On Friday, US Housing Starts dropped by 6.8% in July to 1.238 million units, following a 1.1% increase in June. Meanwhile, the University of Michigan’s Consumer Sentiment Index rose to 67.8 in August, showing its first increase in five months, surpassing expectations and up from 66.4 in July.
- The US Census Bureau reported on Thursday that US Retail Sales climbed 1.0% month-over-month in July, a sharp turnaround from June's 0.2% decline, surpassing the projected 0.3% increase. Moreover, Initial Jobless Claims for the week ending August 9 reached 227,000, lower than the forecast of 235,000 and down from 234,000 the previous week.
- On Thursday, Japanese Economy Minister Yoshitaka Shindo stated that the economy is anticipated to recover gradually as wages and income improve. Shindo also added that the government will collaborate closely with the Bank of Japan to implement flexible macroeconomic policies.
- Japan's Gross Domestic Product (GDP) grew by 0.8% quarter-on-quarter in Q2, surpassing market forecasts of 0.5% and rebounding from a 0.6% decline in Q1. This marked the strongest quarterly growth since Q1 of 2023. Meanwhile, the annualized GDP growth reached 3.1%, exceeding the market consensus of 2.1% and reversing a 2.3% contraction in Q1. This was the strongest yearly expansion since Q2 of 2023.
- US headline Consumer Price Index (CPI) rose 2.9% year-over-year in July, slightly down from the 3% increase in June and below market expectations. The Core CPI, which excludes food and energy, climbed 3.2% year-over-year, a slight decrease from the 3.3% rise in June but aligned with market forecasts.
- Rabobank's senior FX strategist, Jane Foley, observes that this week's series of US data releases, along with next week's Jackson Hole event, should provide the market with clearer insights into the potential responses of US policymakers. However, their main expectation is that the Fed will reduce rates by 25 basis points in September and likely cut them again before the end of the year.
Technical Analysis: USD/JPY falls to near 146.50
USD/JPY trades around 146.40 on Monday. Daily chart analysis indicates that the pair is slightly below the nine-day Exponential Moving Average (EMA), signaling a short-term bearish trend. Additionally, the 14-day Relative Strength Index (RSI) remains below 50, confirming the bearish momentum.
For support levels, the USD/JPY pair may test the area around its seven-month low of 141.69, reached on August 5. A further decline could push the pair toward the next “throwback support” level at 140.25.
On the upside, the USD/JPY pair could face an immediate barrier around the nine-day Exponential Moving Average (EMA) at 147.60. A break above this level might see the pair targeting the 50-day EMA at 152.78, with the potential to test the resistance level at 154.50, which has shifted from previous throwback support to current pullback resistance.
USD/JPY: Daily Chart
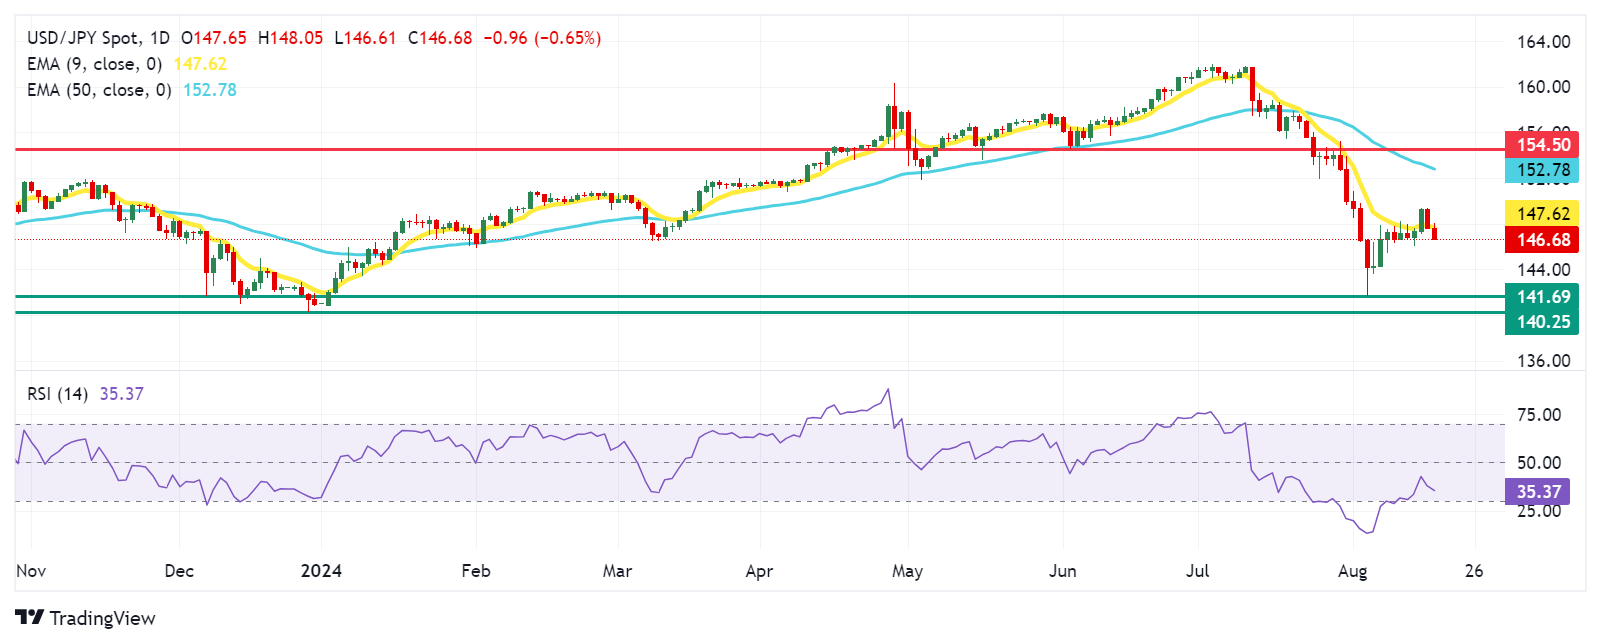
Japanese Yen PRICE Today
The table below shows the percentage change of Japanese Yen (JPY) against listed major currencies today. Japanese Yen was the strongest against the US Dollar.
| USD | EUR | GBP | JPY | CAD | AUD | NZD | CHF | |
|---|---|---|---|---|---|---|---|---|
| USD | -0.12% | -0.07% | -0.82% | -0.13% | -0.31% | -0.55% | -0.09% | |
| EUR | 0.12% | -0.03% | -0.65% | -0.01% | -0.29% | -0.60% | -0.01% | |
| GBP | 0.07% | 0.03% | -0.78% | -0.02% | -0.26% | -0.50% | 0.03% | |
| JPY | 0.82% | 0.65% | 0.78% | 0.62% | 0.46% | 0.38% | 0.58% | |
| CAD | 0.13% | 0.01% | 0.02% | -0.62% | -0.21% | -0.35% | 0.00% | |
| AUD | 0.31% | 0.29% | 0.26% | -0.46% | 0.21% | -0.16% | 0.29% | |
| NZD | 0.55% | 0.60% | 0.50% | -0.38% | 0.35% | 0.16% | 0.48% | |
| CHF | 0.09% | 0.00% | -0.03% | -0.58% | -0.01% | -0.29% | -0.48% |
The heat map shows percentage changes of major currencies against each other. The base currency is picked from the left column, while the quote currency is picked from the top row. For example, if you pick the Japanese Yen from the left column and move along the horizontal line to the US Dollar, the percentage change displayed in the box will represent JPY (base)/USD (quote).
Japanese Yen FAQs
The Japanese Yen (JPY) is one of the world’s most traded currencies. Its value is broadly determined by the performance of the Japanese economy, but more specifically by the Bank of Japan’s policy, the differential between Japanese and US bond yields, or risk sentiment among traders, among other factors.
One of the Bank of Japan’s mandates is currency control, so its moves are key for the Yen. The BoJ has directly intervened in currency markets sometimes, generally to lower the value of the Yen, although it refrains from doing it often due to political concerns of its main trading partners. The current BoJ ultra-loose monetary policy, based on massive stimulus to the economy, has caused the Yen to depreciate against its main currency peers. This process has exacerbated more recently due to an increasing policy divergence between the Bank of Japan and other main central banks, which have opted to increase interest rates sharply to fight decades-high levels of inflation.
The BoJ’s stance of sticking to ultra-loose monetary policy has led to a widening policy divergence with other central banks, particularly with the US Federal Reserve. This supports a widening of the differential between the 10-year US and Japanese bonds, which favors the US Dollar against the Japanese Yen.
The Japanese Yen is often seen as a safe-haven investment. This means that in times of market stress, investors are more likely to put their money in the Japanese currency due to its supposed reliability and stability. Turbulent times are likely to strengthen the Yen’s value against other currencies seen as more risky to invest in.
- USD/CAD drifts lower for the second straight day amid the prevalent USD selling bias.
- Dovish Fed expectations, along with a positive risk tone, continue to weigh on the buck.
- A modest downtick in Oil prices could undermine the Loonie and help limit deeper losses.
The USD/CAD pair extends last week's breakdown momentum through the 50-day Simple Moving Average (SMA) and remains under some selling pressure for the second straight day on Monday. The downward trajectory drags spot prices to over a one-month low, around the 1.3665-1.3660 area, during the Asian session and is sponsored by the bearish sentiment surrounding the US Dollar (USD).
The USD Index (DXY), which tracks the Greenback against a basket of currencies, drops back closer to its lowest level since January touched earlier this month amid bets that the Federal Reserve (Fed) will start its rate-cutting cycle in September. The expectations were reinforced by San Francisco Fed President Mary Daly's remarks, saying that the US central bank needs to take a gradual approach to lowering borrowing costs. This overshadowed the fact that the University of Michigan’s preliminary US Consumer Sentiment Index improved for the first time after four months and rose to 67.8 in August.
Apart from this, a generally positive tone around the equity markets turns out to be another factor denting demand for the safe-haven buck, which, in turn, is seen exerting pressure on the USD/CAD pair. The ongoing decline could further be attributed to some technical selling following last week's breakdown and the subsequent rejection near the 50-day SMA pivotal support-turned-resistance. That said, a softer tone around Crude Oil prices could undermine the commodity-linked Loonie and hold back traders from placing fresh bearish bets ahead of this week's data/central bank event risk.
The latest Canadian consumer inflation figures are due for release on Tuesday, which will be followed by the FOMC meeting minutes on Wednesday. Apart from this, investors will closely scrutinize Fed Chair Jerome Powell's speech at the Jackson Hole Symposium for fresh cues about the central bank's policy path. This, in turn, will play a key role in influencing the near-term USD price dynamics. Furthermore, geopolitical developments in the Middle East, which tend to drive Crude Oil prices, should provide some impetus to the USD/CAD pair and determine the next leg of a directional move.
Economic Indicator
Consumer Price Index (YoY)
The Consumer Price Index (CPI), released by Statistics Canada on a monthly basis, represents changes in prices for Canadian consumers by comparing the cost of a fixed basket of goods and services. The YoY reading compares prices in the reference month to the same month a year earlier. Generally, a high reading is seen as bullish for the Canadian Dollar (CAD), while a low reading is seen as bearish.
Read more.Next release: Tue Aug 20, 2024 12:30
Frequency: Monthly
Consensus: -
Previous: 2.7%
Source: Statistics Canada
- The Indian Rupee trades steady in Monday’s Asian session.
- RBI’s intervention and lower crude oil prices might underpin INR; foreign outflows and strong USD demand might limit its upside.
- The first reading of HSBC India PMI will be released on Wednesday ahead of Fed Chair Powell's speech.
The Indian Rupee (INR) flatlines on Monday despite the softer US Dollar (USD). India’s foreign outflows and strong USD demand from importers remain exerting some selling pressure on the INR. Despite multiple headwinds, the local currency is supported by the Reserve Bank of India (RBI’s) intervention, which is likely to sell USD to stabilize and prevent the INR from a breach of the crucial 84.00 level.
Furthermore, the decline of crude oil prices is likely to support the INR as India remains one of the top importers of crude oil. The preliminary HSBC India Purchasing Managers Index (PMI) will be published on Wednesday. On the US docket, the Federal Reserve (Fed) Chair Jerome Powell's speech will be in the spotlight this Friday as traders will take more cues about potential interest rate cuts. The dovish remarks from the Fed officials might drag the Greenback lower and cap the pair’s upside.
Daily Digest Market Movers: Indian Rupee faces challenges from both domestic and global factors
- India's exports were 6% lower in the current fiscal year through July compared to the same period last year. In FY24, foreign direct investment in the country fell by 3.5%. Foreign portfolio investors (FPI) have withdrawn funds from India due to the country's overheated equities market.
- Consumer sentiment rebounded in August for the first time in five months. The preliminary University of Michigan Consumer Sentiment Index came in at 67.8 in August versus 66.4 prior, better than the 66.9 estimated.
- The US Housing Starts plunged by 6.8% to an annual rate of 1.238 million in July after jumping by 1.1% to a revised rate of 1.329 million in June, the Commerce Department reported on Friday. Building Permits decreased by 4.0% to an annual rate of 1.396 million in July after surging by 3.9% to a revised rate of 1.454 million in June.
- Federal Reserve Bank of Chicago President Austan Goolsbee said on Sunday that the US central bank officials should be wary of keeping the restrictive policy in place longer than necessary.
- San Francisco Fed President Mary Daly called for a "prudent" approach to lowering rates while pushing back on economists’ concerns that the US economy is heading for a sharp slowdown.
Technical analysis: USD/INR’s bullish outlook prevails
Indian Rupee trades flat on the day. According to the daily chart, the USD/INR is in a bullish phase, with the price holding above the key 100-day Exponential Moving Average (EMA) and the 11-week-old uptrend line. The 14-day Relative Strength Index (RSI) stands above the midline near 56.80, supporting a continuation of the uptrend.
A crucial resistance level for USD/INR emerges at the 84.00 psychological level. A break above the mentioned level could expose the record high of 84.24, followed by 84.50.
On the other hand, the initial target could be the uptrend line at 83.88, with potential further downside if the bearish momentum continues. A breach of this level will pave the way to the 100-day EMA at 83.55 en route to 83.36, the low of June 28.
US Dollar price today
The table below shows the percentage change of US Dollar (USD) against listed major currencies today. US Dollar was the weakest against the Japanese Yen.
| USD | EUR | GBP | CAD | AUD | JPY | NZD | CHF | |
| USD | -0.13% | -0.11% | -0.13% | -0.25% | -0.79% | -0.32% | -0.27% | |
| EUR | 0.13% | 0.03% | 0.02% | -0.08% | -0.63% | -0.17% | -0.10% | |
| GBP | 0.12% | -0.02% | -0.02% | -0.14% | -0.69% | -0.21% | -0.15% | |
| CAD | 0.12% | -0.01% | 0.01% | -0.09% | -0.65% | -0.19% | -0.12% | |
| AUD | 0.24% | 0.08% | 0.13% | 0.12% | -0.56% | -0.09% | -0.02% | |
| JPY | 0.79% | 0.63% | 0.67% | 0.63% | 0.56% | 0.45% | 0.52% | |
| NZD | 0.32% | 0.17% | 0.20% | 0.19% | 0.10% | -0.46% | 0.07% | |
| CHF | 0.25% | 0.10% | 0.13% | 0.12% | 0.03% | -0.52% | -0.07% |
The heat map shows percentage changes of major currencies against each other. The base currency is picked from the left column, while the quote currency is picked from the top row. For example, if you pick the Euro from the left column and move along the horizontal line to the Japanese Yen, the percentage change displayed in the box will represent EUR (base)/JPY (quote).
Indian Rupee FAQs
The Indian Rupee (INR) is one of the most sensitive currencies to external factors. The price of Crude Oil (the country is highly dependent on imported Oil), the value of the US Dollar – most trade is conducted in USD – and the level of foreign investment, are all influential. Direct intervention by the Reserve Bank of India (RBI) in FX markets to keep the exchange rate stable, as well as the level of interest rates set by the RBI, are further major influencing factors on the Rupee.
The Reserve Bank of India (RBI) actively intervenes in forex markets to maintain a stable exchange rate, to help facilitate trade. In addition, the RBI tries to maintain the inflation rate at its 4% target by adjusting interest rates. Higher interest rates usually strengthen the Rupee. This is due to the role of the ‘carry trade’ in which investors borrow in countries with lower interest rates so as to place their money in countries’ offering relatively higher interest rates and profit from the difference.
Macroeconomic factors that influence the value of the Rupee include inflation, interest rates, the economic growth rate (GDP), the balance of trade, and inflows from foreign investment. A higher growth rate can lead to more overseas investment, pushing up demand for the Rupee. A less negative balance of trade will eventually lead to a stronger Rupee. Higher interest rates, especially real rates (interest rates less inflation) are also positive for the Rupee. A risk-on environment can lead to greater inflows of Foreign Direct and Indirect Investment (FDI and FII), which also benefit the Rupee.
Higher inflation, particularly, if it is comparatively higher than India’s peers, is generally negative for the currency as it reflects devaluation through oversupply. Inflation also increases the cost of exports, leading to more Rupees being sold to purchase foreign imports, which is Rupee-negative. At the same time, higher inflation usually leads to the Reserve Bank of India (RBI) raising interest rates and this can be positive for the Rupee, due to increased demand from international investors. The opposite effect is true of lower inflation.
- Gold price struggles to capitalize on Friday’s breakout momentum amid a positive risk tone.
- Fed rate cut bets, along with geopolitical risks, might continue to lend support to the metal.
- Traders look to FOMC minutes and Fed Chair Powell’s speech this week for a fresh impetus.
Gold price (XAU/USD) shot to a fresh record peak – levels beyond the $2,500 psychological mark – on Friday and drew support from a combination of factors. The US Dollar (USD) came under some renewed selling pressure and dropped back closer to its lowest level since January touched earlier this week, which, in turn, benefited the commodity. Apart from this, geopolitical risks stemming from the ongoing conflicts in the Middle East and the protracted Russia-Ukraine war provided an additional lift to the safe-haven precious metal.
Meanwhile, easing fears about a possible recession in the United States (US) remains supportive of the prevalent risk-on mood and exerts some pressure on the Gold price during the Asian session on Monday. Traders also opt to lighten their bets and prefer to wait for more cues about the Federal Reserve's (Fed) policy path before positioning for the next leg of a directional move. Hence, the focus remains glued to the release of the FOMC meeting minutes on Wednesday and Fed Chair Jerome Powell's appearance at the Jackson Hole Symposium.
Daily Digest Market Movers: Gold price continues to draw support from dovish Fed expectations and geopolitical tensions
- Dovish Federal Reserve expectations, along with rising geopolitical tensions in the Middle East, lifted the Gold price to a fresh record high – levels beyond the $2,500 psychological mark – on Friday.
- The US Producer Price Index and Consumer Price Index released last week indicated that inflation is on a downward trend, which keeps the Fed on track for a 25-basis-point rate cut in September.
- This, to a larger extent, overshadowed Thursday's upbeat US Retail Sales data, which eased concerns about a recession in the world's largest economy and attracted fresh sellers around the US Dollar.
- Furthermore, the University of Michigan’s preliminary report showed that the US Consumer Sentiment Index improved for the first time after four months of declines and rose to 67.8 in August.
- Another key part of the report revealed that expectations for overall inflation over the next year held steady at 2.9% and over the next five years was unchanged for the fifth straight month at 3%.
- This, however, did little to impress the USD bulls amid bets for an imminent start of the Fed's policy easing cycle, which has been a key factor driving flows towards the non-yielding yellow metal.
- Chicago Fed President Austan Goolsbee said the US economy is not showing signs of overheating, so central bank officials should be wary of keeping restrictive policy in place longer than necessary.
- San Francisco Fed President Mary Daly downplayed concerns about a sharp US economic slowdown, though said that the US central bank needs to take a gradual approach to lower borrowing costs.
- Investors now look to the FOMC minutes, due for release on Wednesday, and Fed Chair Jerome Powell's comments at the Jackson Hole Symposium on Friday for cues about future rate-cut path.
- On the geopolitical front, Hamas published an official statement on Sunday rejecting the terms for a hostage release-ceasefire deal which were discussed in Doha on Thursday and Friday.
- Russia vowed to retaliate to Ukraine’s unexpected cross-border attack into the Kursk region that marked the first time since World War Two that a foreign army has been fighting in the country.
Technical Analysis: Gold price bulls have the upper hand, $2,470-2,472 throwback support zone holds the key
From a technical perspective, Friday's breakout through the $2,470-2,472 horizontal barrier and a subsequent strength beyond the previous all-time high was seen as a fresh trigger for bullish traders. Furthermore, oscillators on the daily chart are holding in positive territory and are still away from being in the overbought zone, suggesting that the path of least resistance for the Gold price is to the upside. That said, failure to build on the momentum beyond the $2,500 psychological mark warrants some caution for bulls. Hence, it will be prudent to wait for some follow-through buying beyond Friday's allow-time peak, around the $2,509-2,510 area, before positioning for any further gains.
On the flip side, the $2,472-2,470 resistance breakpoint now seems to protect the immediate downside. Any further decline is more likely to attract fresh buyers and remain limited near the $2,448-2,446 region. The latter should act as a key pivotal point for short-term traders, which if broken decisively should pave the way for deeper losses. The Gold price might then accelerate the corrective slide towards the 50-day Simple Moving Average (SMA), currently pegged near the $2,388-2,387 zone, with some intermediate support near the $2,400 round figure.
Gold FAQs
Gold has played a key role in human’s history as it has been widely used as a store of value and medium of exchange. Currently, apart from its shine and usage for jewelry, the precious metal is widely seen as a safe-haven asset, meaning that it is considered a good investment during turbulent times. Gold is also widely seen as a hedge against inflation and against depreciating currencies as it doesn’t rely on any specific issuer or government.
Central banks are the biggest Gold holders. In their aim to support their currencies in turbulent times, central banks tend to diversify their reserves and buy Gold to improve the perceived strength of the economy and the currency. High Gold reserves can be a source of trust for a country’s solvency. Central banks added 1,136 tonnes of Gold worth around $70 billion to their reserves in 2022, according to data from the World Gold Council. This is the highest yearly purchase since records began. Central banks from emerging economies such as China, India and Turkey are quickly increasing their Gold reserves.
Gold has an inverse correlation with the US Dollar and US Treasuries, which are both major reserve and safe-haven assets. When the Dollar depreciates, Gold tends to rise, enabling investors and central banks to diversify their assets in turbulent times. Gold is also inversely correlated with risk assets. A rally in the stock market tends to weaken Gold price, while sell-offs in riskier markets tend to favor the precious metal.
The price can move due to a wide range of factors. Geopolitical instability or fears of a deep recession can quickly make Gold price escalate due to its safe-haven status. As a yield-less asset, Gold tends to rise with lower interest rates, while higher cost of money usually weighs down on the yellow metal. Still, most moves depend on how the US Dollar (USD) behaves as the asset is priced in dollars (XAU/USD). A strong Dollar tends to keep the price of Gold controlled, whereas a weaker Dollar is likely to push Gold prices up.
- WTI price depreciated as last week’s data showed China's economy lost momentum in July.
- The prices of crude Oil may appreciate due to rising Middle-East tensions following Hamas’s rejection of a ceasefire deal.
- The downside of the Oil could be restrained due to rising bets of a Fed rate cut in September.
West Texas Intermediate (WTI) Oil price hovers around $75.30 per barrel during the Asian session on Monday. Crude Oil prices receive downward pressure due to concerns over weaker demand in top Oil importer China.
Last week, data from China showed Industrial Production increased by 5.1% year-on-year in July, falling short of the 5.2% expected and easing from the 5.3% growth seen in the previous month. This marks the third consecutive month of moderation in industrial output.
The prices of crude Oil may appreciate due to rising concerns over geopolitical tensions in the Middle East following Hamas’s rejection of a ceasefire deal on Sunday. Hamas has issued a statement rejecting the terms for a hostage release-ceasefire deal discussed in Doha on Thursday and Friday. The group accuses Prime Minister Benjamin Netanyahu of introducing new obstacles into the negotiations, according to Reuters citing a local news agency Times of Israel.
Israeli Prime Minister Benjamin Netanyahu is scheduled to host US Secretary of State Antony Blinken on Monday. Following their meeting, Blinken will travel to Cairo, where negotiations on a deal are continuing. The US has announced plans to host a second meeting later in the week and aims to finalize the agreement by the end of the week.
The downside of the Oil could be restrained due to the rising odds of an interest rate cut by the Federal Reserve (Fed) starting in September increases. Last week's US economic data showed Retail Sales exceeding expectations, while both the Producer Price Index (PPI) and Consumer Price Index (CPI) indicated that inflation is easing. Lower borrowing cost may positively impact the US economic activities.
Federal Reserve Bank of San Francisco President Mary Daly emphasized Sunday that the US central bank should take a gradual approach to reducing borrowing costs, according to the Financial Times. Additionally, Federal Reserve Bank of Chicago President Austan Goolsbee warned that central bank officials should be cautious about keeping a restrictive policy in place longer than necessary.
WTI Oil FAQs
WTI Oil is a type of Crude Oil sold on international markets. The WTI stands for West Texas Intermediate, one of three major types including Brent and Dubai Crude. WTI is also referred to as “light” and “sweet” because of its relatively low gravity and sulfur content respectively. It is considered a high quality Oil that is easily refined. It is sourced in the United States and distributed via the Cushing hub, which is considered “The Pipeline Crossroads of the World”. It is a benchmark for the Oil market and WTI price is frequently quoted in the media.
Like all assets, supply and demand are the key drivers of WTI Oil price. As such, global growth can be a driver of increased demand and vice versa for weak global growth. Political instability, wars, and sanctions can disrupt supply and impact prices. The decisions of OPEC, a group of major Oil-producing countries, is another key driver of price. The value of the US Dollar influences the price of WTI Crude Oil, since Oil is predominantly traded in US Dollars, thus a weaker US Dollar can make Oil more affordable and vice versa.
The weekly Oil inventory reports published by the American Petroleum Institute (API) and the Energy Information Agency (EIA) impact the price of WTI Oil. Changes in inventories reflect fluctuating supply and demand. If the data shows a drop in inventories it can indicate increased demand, pushing up Oil price. Higher inventories can reflect increased supply, pushing down prices. API’s report is published every Tuesday and EIA’s the day after. Their results are usually similar, falling within 1% of each other 75% of the time. The EIA data is considered more reliable, since it is a government agency.
OPEC (Organization of the Petroleum Exporting Countries) is a group of 13 Oil-producing nations who collectively decide production quotas for member countries at twice-yearly meetings. Their decisions often impact WTI Oil prices. When OPEC decides to lower quotas, it can tighten supply, pushing up Oil prices. When OPEC increases production, it has the opposite effect. OPEC+ refers to an expanded group that includes ten extra non-OPEC members, the most notable of which is Russia.
| Raw materials | Closed | Change, % |
|---|---|---|
| Silver | 28.97 | 2.28 |
| Gold | 250.7 | 2.08 |
| Palladium | 946.99 | 0.45 |
- The Australian Dollar advances further due to improved risk sentiment.
- The RBA concentrates on the potential upside risks to inflation and does not anticipate any rate cuts soon.
- The US Dollar loses ground due to dovish comments from Fed officials.
The Australian Dollar (AUD) continues its winning streak for the third consecutive day against the US Dollar (USD) on Monday. The upside of the AUD/USD pair could be attributed to improved risk sentiment, along with the hawkish mood surrounding the Reserve Bank of Australia (RBA) regarding its policy outlook. Investors will be closely watching the RBA Meeting Minutes and the People’s Bank of China’s (PBoC) Interest Rate Decision on Tuesday.
RBA Governor Michele Bullock stated on Friday that the Australian central bank is focused on the potential upside risks to inflation and anticipates no rate cuts in the near term. Bullock emphasized that the RBA board believes it has struck the right balance between controlling inflation and maintaining stability in the current economic climate, according to ABC News.
The US Dollar (USD) receives downward pressure as the likelihood of an interest rate cut by the Federal Reserve (Fed) starting in September increases. Last week's US economic data showed Retail Sales exceeding expectations, while both the Producer Price Index (PPI) and Consumer Price Index (CPI) indicated that inflation is easing. Additionally, Housing Starts in July fell to their lowest level since 2020. This week, all eyes will be on Federal Reserve Chair Jerome Powell's upcoming speech.
Daily Digest Market Movers: Australian Dollar advances as RBA may adopt a hawkish stance
- Federal Reserve Bank of San Francisco President Mary Daly emphasized Sunday that the US central bank should take a gradual approach to reducing borrowing costs, according to the Financial Times. Daly pushed back against economists' concerns that the US economy is on the verge of a sharp slowdown that would justify rapid interest rate cuts.
- Federal Reserve Bank of Chicago President Austan Goolsbee warned that central bank officials should be cautious about keeping a restrictive policy in place longer than necessary. While it's uncertain whether the Fed will cut interest rates next month, failing to do so could harm the labor market, per CNBC.
- On Friday, US Housing Starts dropped by 6.8% in July to 1.238 million units, following a 1.1% increase in June. Meanwhile, the University of Michigan’s Consumer Sentiment Index rose to 67.8 in August, showing its first increase in five months, surpassing expectations and up from 66.4 in July.
- On Thursday, US Retail Sales rose by 1.0% month-over-month in July, a significant rebound from June's 0.2% decline, according to the US Census Bureau. This figure exceeded the forecasted increase of 0.3%. Additionally, Initial Jobless Claims for the week ending August 9 came in at 227,000, better than the anticipated 235,000 and a decrease from the previous week's 234,000.
- The People's Bank of China (PBoC) announced on Thursday that it will renew the medium-term lending facility funds maturing on August 15th later this month. The central bank also lent CNY 577.7 billion (USD 80.9 billion) through seven-day reverse bond repurchase agreements at 1.7% in an open market operation, maintaining the previous rate, according to Reuters. Any change in the Chinese economy could impact the Australian market as both countries are close trade partners.
- US headline Consumer Price Index (CPI) rose 2.9% year-over-year in July, slightly down from the 3% increase in June and below market expectations. The Core CPI, which excludes food and energy, climbed 3.2% year-over-year, a slight decrease from the 3.3% rise in June but aligned with market forecasts.
Technical Analysis: Australian Dollar rises toward 0.6700
The Australian Dollar trades around 0.6680 on Monday. According to daily chart analysis, the AUD/USD pair is moving upwards within the ascending channel, which suggests a bullish bias. Additionally, the 14-day Relative Strength Index (RSI) is climbing toward the 70 mark, reinforcing the current bullish momentum.
On the upside, the AUD/USD pair could aim for the area near the upper boundary of the ascending channel at the 0.6740 level. A breakout above the ascending channel could push the pair toward its seven-month high of 0.6798, which was reached on July 11.
For support, the lower boundary of the ascending channel, around 0.6630, serves as the immediate support level for the AUD/USD pair, followed by the nine-day Exponential Moving Average (EMA) at 0.6618. A drop below the EMA could see the pair test the throwback level at 0.6575. If the pair falls below this support zone, it could indicate a bearish bias, potentially leading it toward the throwback level at 0.6470.
AUD/USD: Daily Chart
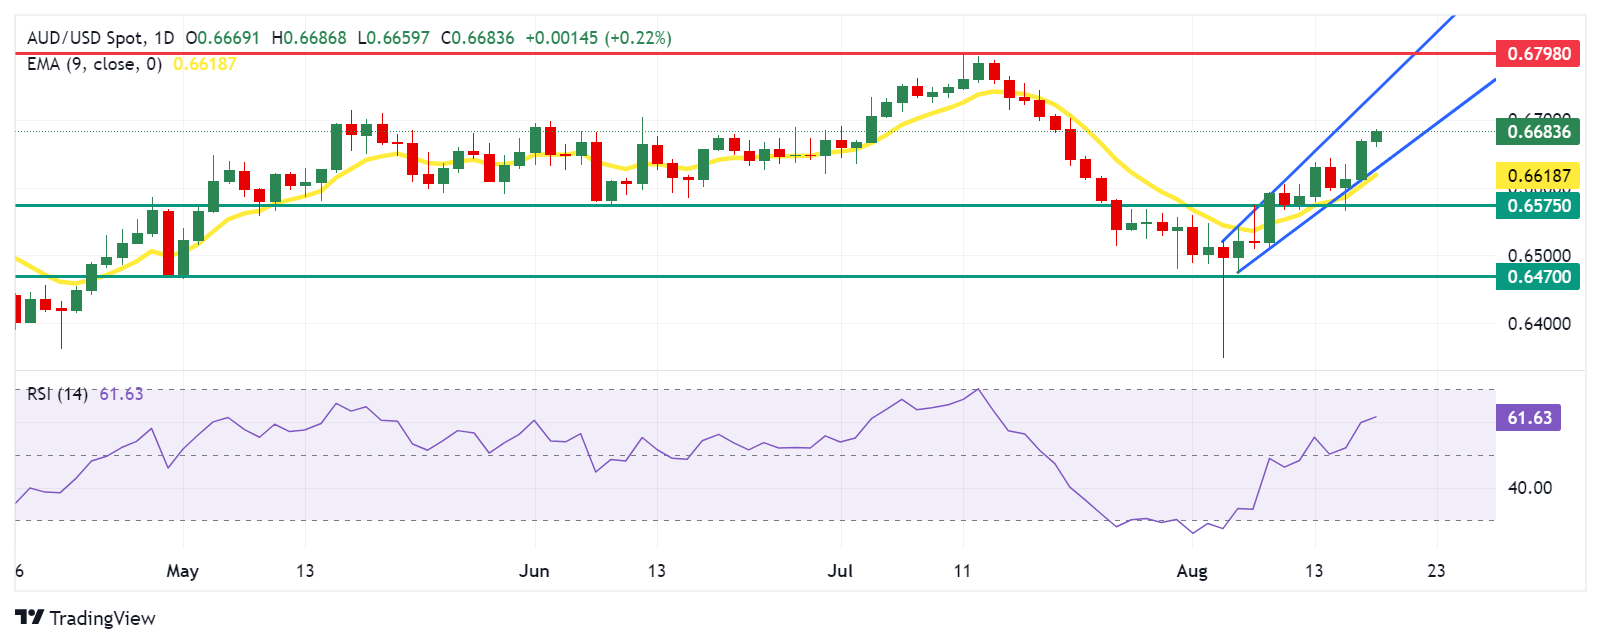
Australian Dollar PRICE Today
The table below shows the percentage change of Australian Dollar (AUD) against listed major currencies today. Australian Dollar was the strongest against the Swiss Franc.
| USD | EUR | GBP | JPY | CAD | AUD | NZD | CHF | |
|---|---|---|---|---|---|---|---|---|
| USD | -0.05% | -0.05% | -0.07% | -0.13% | -0.18% | -0.33% | 0.19% | |
| EUR | 0.05% | -0.09% | 0.02% | -0.08% | -0.22% | -0.45% | 0.21% | |
| GBP | 0.05% | 0.09% | -0.06% | -0.03% | -0.15% | -0.31% | 0.29% | |
| JPY | 0.07% | -0.02% | 0.06% | -0.12% | -0.14% | -0.14% | 0.13% | |
| CAD | 0.13% | 0.08% | 0.03% | 0.12% | -0.08% | -0.12% | 0.28% | |
| AUD | 0.18% | 0.22% | 0.15% | 0.14% | 0.08% | -0.07% | 0.43% | |
| NZD | 0.33% | 0.45% | 0.31% | 0.14% | 0.12% | 0.07% | 0.54% | |
| CHF | -0.19% | -0.21% | -0.29% | -0.13% | -0.28% | -0.43% | -0.54% |
The heat map shows percentage changes of major currencies against each other. The base currency is picked from the left column, while the quote currency is picked from the top row. For example, if you pick the Australian Dollar from the left column and move along the horizontal line to the US Dollar, the percentage change displayed in the box will represent AUD (base)/USD (quote).
Australian Dollar FAQs
One of the most significant factors for the Australian Dollar (AUD) is the level of interest rates set by the Reserve Bank of Australia (RBA). Because Australia is a resource-rich country another key driver is the price of its biggest export, Iron Ore. The health of the Chinese economy, its largest trading partner, is a factor, as well as inflation in Australia, its growth rate and Trade Balance. Market sentiment – whether investors are taking on more risky assets (risk-on) or seeking safe-havens (risk-off) – is also a factor, with risk-on positive for AUD.
The Reserve Bank of Australia (RBA) influences the Australian Dollar (AUD) by setting the level of interest rates that Australian banks can lend to each other. This influences the level of interest rates in the economy as a whole. The main goal of the RBA is to maintain a stable inflation rate of 2-3% by adjusting interest rates up or down. Relatively high interest rates compared to other major central banks support the AUD, and the opposite for relatively low. The RBA can also use quantitative easing and tightening to influence credit conditions, with the former AUD-negative and the latter AUD-positive.
China is Australia’s largest trading partner so the health of the Chinese economy is a major influence on the value of the Australian Dollar (AUD). When the Chinese economy is doing well it purchases more raw materials, goods and services from Australia, lifting demand for the AUD, and pushing up its value. The opposite is the case when the Chinese economy is not growing as fast as expected. Positive or negative surprises in Chinese growth data, therefore, often have a direct impact on the Australian Dollar and its pairs.
Iron Ore is Australia’s largest export, accounting for $118 billion a year according to data from 2021, with China as its primary destination. The price of Iron Ore, therefore, can be a driver of the Australian Dollar. Generally, if the price of Iron Ore rises, AUD also goes up, as aggregate demand for the currency increases. The opposite is the case if the price of Iron Ore falls. Higher Iron Ore prices also tend to result in a greater likelihood of a positive Trade Balance for Australia, which is also positive of the AUD.
The Trade Balance, which is the difference between what a country earns from its exports versus what it pays for its imports, is another factor that can influence the value of the Australian Dollar. If Australia produces highly sought after exports, then its currency will gain in value purely from the surplus demand created from foreign buyers seeking to purchase its exports versus what it spends to purchase imports. Therefore, a positive net Trade Balance strengthens the AUD, with the opposite effect if the Trade Balance is negative.
- The New Zealand Dollar extends its rally in Monday’s Asian session.
- Rising bets of a Fed rate cut in September drag the USD lower and support the pair.
- Traders await New Zealand’s Trade Balance data and the PBoC interest rate decision on Tuesday for fresh impetus.
The New Zealand Dollar (NZD) gathers strength on Monday. The weaker US housing data on Friday has added to concerns over the US economy's strength, especially after recent softer inflation and labor reports. Traders place more bets on interest rate cuts from the US Federal Reserve in September, which undermine the US Dollar (USD) and create a tailwind for NZD/USD.
However, the dovish stance of the Reserve Bank of New Zealand (RBNZ) after a surprise rate cut last week might weigh on the Kiwi as the easing cycle came much sooner than expected. Additionally, any signs of a weaker Chinese economy might cap the upside for China’s proxy NZD as China is New Zealand's largest trading partner.
Traders will monitor New Zealand’s Trade Balance data and the People’s Bank of China’s (PBoC) interest rate decision on Tuesday. The highlight this week will be Fed Chair Powell's speech at the Jackson Hole symposium on Friday. This event might offer some hints about guidance on the pace of Fed easing.
Daily Digest Market Movers: New Zealand Dollar gains ground amid Fed rate cuts hope
- New Zealand’s Business NZ Performance of Services Index (PSI) improved to 44.6 in July from the previous reading of 40.7, according to Business NZ on Monday.
- RBNZ Governor Adrian Orr said on Friday that the committee has achieved a very strong level of confidence that low and stable inflation is back within the 1-3% range.
- The preliminary University of Michigan Consumer Sentiment Index improved to 67.8 in August from the previous reading of 66.4, above the market consensus of 66.9. This figure rose for the first time in five months.
- The US Housing Starts declined by 6.8% in July to 1.238 million units, compared to the 1.1% increase in June, while the Building Permits decreased by 4.0% in July after rising 3.9% in June.
- Federal Reserve Bank of Chicago President Austan Goolsbee said on Sunday that the US economy does not show signs of overheating, so Fed policymakers should be cautious about keeping restrictive policy in place longer than necessary.
- San Francisco Fed President Mary Daly said that the US central bank needs to take a gradual approach to lowering borrowing costs, per Financial Times.
Technical Analysis: New Zealand Dollar’s uptrend is likely to resume
The New Zealand Dollar trades on a stronger note on the day. The NZD/USD pair seems set to close above the key 100-day Exponential Moving Average (EMA) and descending trendline on the daily chart. If the pair decisively closes above this level, it will resume the uptrend. The 14-day Relative Strength Index (RSI) points higher above the midline near 56.60, the potential for further upside.
The immediate resistance levels to watch are the 0.6085-0.6090 zone, representing the high of August 14 and the upper boundary of the Bollinger Band. Sustained trading above this level could see a rally to 0.6154, the high of July 8. The next barrier is seen at 0.6222, the high of June 12.
On the other hand, the confluence of the 100-day EMA and descending trendline of 0.6048 acts as an initial support level for NZD/USD. The additional downside filter to watch is 0.5974, the low of August 15. Any follow-through selling will see a drop to 0.5853, the lower limit of the Bollinger Band.
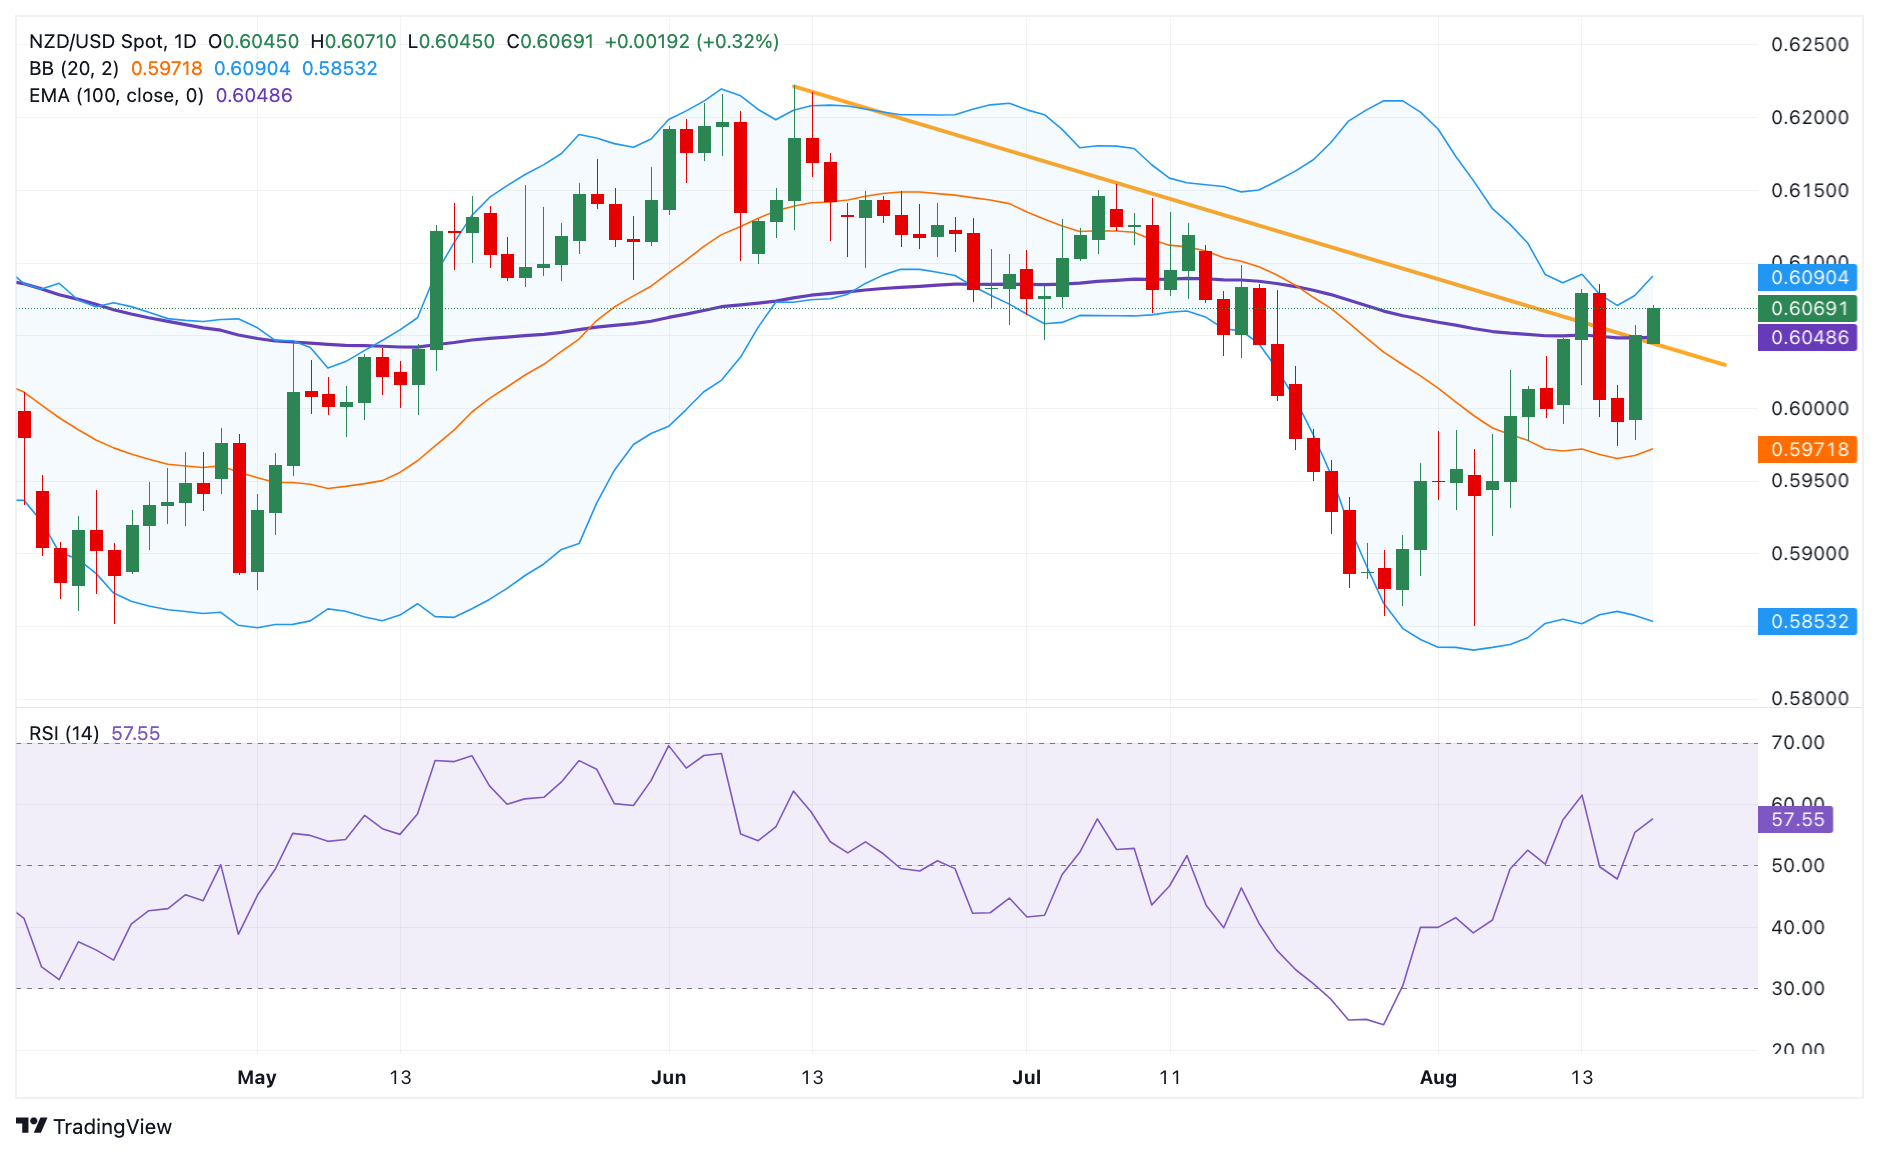
New Zealand Dollar FAQs
The New Zealand Dollar (NZD), also known as the Kiwi, is a well-known traded currency among investors. Its value is broadly determined by the health of the New Zealand economy and the country’s central bank policy. Still, there are some unique particularities that also can make NZD move. The performance of the Chinese economy tends to move the Kiwi because China is New Zealand’s biggest trading partner. Bad news for the Chinese economy likely means less New Zealand exports to the country, hitting the economy and thus its currency. Another factor moving NZD is dairy prices as the dairy industry is New Zealand’s main export. High dairy prices boost export income, contributing positively to the economy and thus to the NZD.
The Reserve Bank of New Zealand (RBNZ) aims to achieve and maintain an inflation rate between 1% and 3% over the medium term, with a focus to keep it near the 2% mid-point. To this end, the bank sets an appropriate level of interest rates. When inflation is too high, the RBNZ will increase interest rates to cool the economy, but the move will also make bond yields higher, increasing investors’ appeal to invest in the country and thus boosting NZD. On the contrary, lower interest rates tend to weaken NZD. The so-called rate differential, or how rates in New Zealand are or are expected to be compared to the ones set by the US Federal Reserve, can also play a key role in moving the NZD/USD pair.
Macroeconomic data releases in New Zealand are key to assess the state of the economy and can impact the New Zealand Dollar’s (NZD) valuation. A strong economy, based on high economic growth, low unemployment and high confidence is good for NZD. High economic growth attracts foreign investment and may encourage the Reserve Bank of New Zealand to increase interest rates, if this economic strength comes together with elevated inflation. Conversely, if economic data is weak, NZD is likely to depreciate.
The New Zealand Dollar (NZD) tends to strengthen during risk-on periods, or when investors perceive that broader market risks are low and are optimistic about growth. This tends to lead to a more favorable outlook for commodities and so-called ‘commodity currencies’ such as the Kiwi. Conversely, NZD tends to weaken at times of market turbulence or economic uncertainty as investors tend to sell higher-risk assets and flee to the more-stable safe havens.
- USD/JPY gains some positive traction on Monday, albeit struggles to capitalize on the move.
- The divergent BoJ-Fed policy expectations turn out to be a key factor capping further gains.
- A positive risk tone undermines the safe-haven JPY and could lend some support to the pair.
The USD/JPY pair struggles to capitalize on its modest Asian session uptick to the 148.00 mark and drops to a fresh daily low in the last hour. Spot prices currently trade just below mid-147.00s and seem vulnerable to prolong Friday’s retracement slide from a two-week top.
The prevalent risk-on mood, bolstered by signs of easing fears of a recession in the US, undermines the safe-haven Japanese Yen (JPY) and lends some support to the USD/JPY pair amid a modest US Dollar (USD) uptick. That said, rising geopolitical tensions in the Middle East keep a lid on the optimism in the markets. Furthermore, the divergent Bank of Japan (BoJ)-Federal Reserve (Fed) policy expectations keep a lid on any meaningful upside for the currency pair.
Investors seem convinced that Thursday's stronger second-quarter Gross Domestic Product (GDP) print released from Japan could encourage the Bank of Japan (BoJ) to continue raising interest rates. In contrast, the US central bank is all but certain to begin its policy-easing cycle in September. The bets were reaffirmed by San Francisco Fed President Mary Daly's remarks that the US central bank needs to take a gradual approach to lowering borrowing costs.
The aforementioned fundamental backdrop suggests that the path of least resistance for the USD/JPY pair is to the downside. Investors, however, might prefer to wait for more cues about the Fed's rate-cut path before positioning for the next leg of a directional move. Hence, the focus will remain on the release of the FOMC meeting minutes on Wednesday, which will be followed by Fed Chair Jerome Powell's speech at the Jackson Hole Symposium on Friday.
Bank of Japan FAQs
The Bank of Japan (BoJ) is the Japanese central bank, which sets monetary policy in the country. Its mandate is to issue banknotes and carry out currency and monetary control to ensure price stability, which means an inflation target of around 2%.
The Bank of Japan has embarked in an ultra-loose monetary policy since 2013 in order to stimulate the economy and fuel inflation amid a low-inflationary environment. The bank’s policy is based on Quantitative and Qualitative Easing (QQE), or printing notes to buy assets such as government or corporate bonds to provide liquidity. In 2016, the bank doubled down on its strategy and further loosened policy by first introducing negative interest rates and then directly controlling the yield of its 10-year government bonds.
The Bank’s massive stimulus has caused the Yen to depreciate against its main currency peers. This process has exacerbated more recently due to an increasing policy divergence between the Bank of Japan and other main central banks, which have opted to increase interest rates sharply to fight decades-high levels of inflation. The BoJ’s policy of holding down rates has led to a widening differential with other currencies, dragging down the value of the Yen.
A weaker Yen and the spike in global energy prices have led to an increase in Japanese inflation, which has exceeded the BoJ’s 2% target. With wage inflation becoming a cause of concern, the BoJ looks to move away from ultra loose policy, while trying to avoid slowing the activity too much.
The People’s Bank of China (PBOC) set the USD/CNY central rate for the trading session ahead on Monday at 7.1415, as against Friday's fix of 7.1464 and 7.1548 Reuters estimates.
- EUR/USD advances further due to dovish comments by the Fed officials.
- San Francisco Fed President Mary Daly emphasized that the US central bank should reduce rates gradually.
- The Euro receives support as ECB policymakers have hesitated to commit to a specific rate-cut path.
EUR/USD extends its gains for the second successive session, trading around 1.1030 during the Asian hours on Monday. The upside of the pair could be attributed to the rising odds of an interest rate cut by the US Federal Reserve (Fed) starting in September.
Last week's US economic data indicated that Retail Sales exceeded expectations, while both the Producer Price Index (PPI) and Consumer Price Index (CPI) suggested that inflation is easing. Additionally, US housing starts dropped by 6.8% in July to 1.238 million units, following a 1.1% increase in June, marking the lowest level since 2020. This decline has heightened concerns about the economy's resilience, particularly in light of recent softer inflation and labor reports.
Federal Reserve Bank of San Francisco President Mary Daly emphasized on Sunday that the US central bank should take a gradual approach to reducing borrowing costs, according to the Financial Times. Daly pushed back against economists' concerns that the US economy is on the verge of a sharp slowdown that would justify rapid interest rate cuts.
Additionally, Federal Reserve Bank of Chicago President Austan Goolsbee warned that central bank officials should be cautious about keeping a restrictive policy in place longer than necessary. While it's uncertain whether the Fed will cut interest rates next month, failing to do so could harm the labor market, per CNBC.
In the Eurozone, investors anticipate that the European Central Bank (ECB) will gradually reduce interest rates. ECB policymakers have hesitated to commit to a specific rate-cut path due to concerns that price pressures could reaccelerate.
Euro FAQs
The Euro is the currency for the 20 European Union countries that belong to the Eurozone. It is the second most heavily traded currency in the world behind the US Dollar. In 2022, it accounted for 31% of all foreign exchange transactions, with an average daily turnover of over $2.2 trillion a day. EUR/USD is the most heavily traded currency pair in the world, accounting for an estimated 30% off all transactions, followed by EUR/JPY (4%), EUR/GBP (3%) and EUR/AUD (2%).
The European Central Bank (ECB) in Frankfurt, Germany, is the reserve bank for the Eurozone. The ECB sets interest rates and manages monetary policy. The ECB’s primary mandate is to maintain price stability, which means either controlling inflation or stimulating growth. Its primary tool is the raising or lowering of interest rates. Relatively high interest rates – or the expectation of higher rates – will usually benefit the Euro and vice versa. The ECB Governing Council makes monetary policy decisions at meetings held eight times a year. Decisions are made by heads of the Eurozone national banks and six permanent members, including the President of the ECB, Christine Lagarde.
Eurozone inflation data, measured by the Harmonized Index of Consumer Prices (HICP), is an important econometric for the Euro. If inflation rises more than expected, especially if above the ECB’s 2% target, it obliges the ECB to raise interest rates to bring it back under control. Relatively high interest rates compared to its counterparts will usually benefit the Euro, as it makes the region more attractive as a place for global investors to park their money.
Data releases gauge the health of the economy and can impact on the Euro. Indicators such as GDP, Manufacturing and Services PMIs, employment, and consumer sentiment surveys can all influence the direction of the single currency. A strong economy is good for the Euro. Not only does it attract more foreign investment but it may encourage the ECB to put up interest rates, which will directly strengthen the Euro. Otherwise, if economic data is weak, the Euro is likely to fall. Economic data for the four largest economies in the euro area (Germany, France, Italy and Spain) are especially significant, as they account for 75% of the Eurozone’s economy.
Another significant data release for the Euro is the Trade Balance. This indicator measures the difference between what a country earns from its exports and what it spends on imports over a given period. If a country produces highly sought after exports then its currency will gain in value purely from the extra demand created from foreign buyers seeking to purchase these goods. Therefore, a positive net Trade Balance strengthens a currency and vice versa for a negative balance.
- A combination of supporting factors lifts GBP/USD to a one-month top on Monday.
- Diminishing odds for a September BoE rate cut continues to underpin the Sterling.
- Dovish Fed expectations and a positive risk tone keep the USD bulls on the defensive.
The GBP/USD pair builds on last week's breakout momentum and climbs to over a one-month peak, around mid-1.2900s during the Asian session on Monday. The strong move up comes on the back of the recent solid bounce from the vicinity of a technically significant 200-day Simple Moving Average (SMA) and could be seen as a fresh trigger for bullish traders.
The British Pound (GBP) continues to draw support from last week's relatively stronger UK macro data, which pointed to a still resilient economy and might have dashed hopes for another interest rate cut by the Bank of England (BoE) in September. The US Dollar (USD), on the other hand, languishes near its lowest level since January touched earlier this month amid dovish Federal Reserve (Fed) expectations and turns out to be another factor acting as a tailwind for the GBP/USD pair.
Despite the fact that the markets have scaled back their bets for a more aggressive policy easing, investors seem convinced that the US central bank will begin its rate-cutting cycle in September. The expectations were reaffirmed by the latest comments by San Francisco Fed President Mary Daly, saying that the US central bank needs to take a gradual approach to lowering borrowing costs. This keeps the US Treasury bond yields depressed and weighs on the USD.
Apart from this, the prevalent risk-on environment is further holding back traders from placing any bullish bets around the safe-haven Greenback. This, in turn, validates the near-term positive outlook for the GBP/USD pair and supports prospects for an extension of a nearly two-week-old uptrend amid the absence of relevant macro data either from the UK or the US. Traders, however, might await more cues about the Fed's rate-cut path before placing aggressive directional bets.
Hence, the focus will remain on the release of the FOMC meeting minutes on Wednesday. This will be followed by the flash global PMIs on Thursday, which, along with Fed Chair Jerome Powell's speech at the Jackson Hole Symposium, will be looked upon for some meaningful impetus during the latter part of the week.
Pound Sterling FAQs
The Pound Sterling (GBP) is the oldest currency in the world (886 AD) and the official currency of the United Kingdom. It is the fourth most traded unit for foreign exchange (FX) in the world, accounting for 12% of all transactions, averaging $630 billion a day, according to 2022 data. Its key trading pairs are GBP/USD, aka ‘Cable’, which accounts for 11% of FX, GBP/JPY, or the ‘Dragon’ as it is known by traders (3%), and EUR/GBP (2%). The Pound Sterling is issued by the Bank of England (BoE).
The single most important factor influencing the value of the Pound Sterling is monetary policy decided by the Bank of England. The BoE bases its decisions on whether it has achieved its primary goal of “price stability” – a steady inflation rate of around 2%. Its primary tool for achieving this is the adjustment of interest rates. When inflation is too high, the BoE will try to rein it in by raising interest rates, making it more expensive for people and businesses to access credit. This is generally positive for GBP, as higher interest rates make the UK a more attractive place for global investors to park their money. When inflation falls too low it is a sign economic growth is slowing. In this scenario, the BoE will consider lowering interest rates to cheapen credit so businesses will borrow more to invest in growth-generating projects.
Data releases gauge the health of the economy and can impact the value of the Pound Sterling. Indicators such as GDP, Manufacturing and Services PMIs, and employment can all influence the direction of the GBP. A strong economy is good for Sterling. Not only does it attract more foreign investment but it may encourage the BoE to put up interest rates, which will directly strengthen GBP. Otherwise, if economic data is weak, the Pound Sterling is likely to fall.
Another significant data release for the Pound Sterling is the Trade Balance. This indicator measures the difference between what a country earns from its exports and what it spends on imports over a given period. If a country produces highly sought-after exports, its currency will benefit purely from the extra demand created from foreign buyers seeking to purchase these goods. Therefore, a positive net Trade Balance strengthens a currency and vice versa for a negative balance.
On Sunday, Hamas published an official statement rejecting the terms for a hostage release-ceasefire deal which were discussed in Doha on Thursday and Friday, blaming Prime Minister Benjamin Netanyahu for putting up new obstacles in the talks. Per the local news agency Times of Israel
Netanyahu is to host visiting US Secretary of State Antony Blinken on Monday. Blinken is then set to fly to Cairo, where talks on a deal are ongoing. The US has said that it intends to host a second meeting later this week and wants to finalize an agreement by the end of the week.
Market reaction
At the time of writing, the gold price (XAU/USD) is trading 0.24% higher on the day to trade at $2,501.
Risk sentiment FAQs
In the world of financial jargon the two widely used terms “risk-on” and “risk off'' refer to the level of risk that investors are willing to stomach during the period referenced. In a “risk-on” market, investors are optimistic about the future and more willing to buy risky assets. In a “risk-off” market investors start to ‘play it safe’ because they are worried about the future, and therefore buy less risky assets that are more certain of bringing a return, even if it is relatively modest.
Typically, during periods of “risk-on”, stock markets will rise, most commodities – except Gold – will also gain in value, since they benefit from a positive growth outlook. The currencies of nations that are heavy commodity exporters strengthen because of increased demand, and Cryptocurrencies rise. In a “risk-off” market, Bonds go up – especially major government Bonds – Gold shines, and safe-haven currencies such as the Japanese Yen, Swiss Franc and US Dollar all benefit.
The Australian Dollar (AUD), the Canadian Dollar (CAD), the New Zealand Dollar (NZD) and minor FX like the Ruble (RUB) and the South African Rand (ZAR), all tend to rise in markets that are “risk-on”. This is because the economies of these currencies are heavily reliant on commodity exports for growth, and commodities tend to rise in price during risk-on periods. This is because investors foresee greater demand for raw materials in the future due to heightened economic activity.
The major currencies that tend to rise during periods of “risk-off” are the US Dollar (USD), the Japanese Yen (JPY) and the Swiss Franc (CHF). The US Dollar, because it is the world’s reserve currency, and because in times of crisis investors buy US government debt, which is seen as safe because the largest economy in the world is unlikely to default. The Yen, from increased demand for Japanese government bonds, because a high proportion are held by domestic investors who are unlikely to dump them – even in a crisis. The Swiss Franc, because strict Swiss banking laws offer investors enhanced capital protection.
| Index | Change, points | Closed | Change, % |
|---|---|---|---|
| NIKKEI 225 | 1336.03 | 38062.67 | 3.64 |
| Hang Seng | 321.02 | 17430.16 | 1.88 |
| KOSPI | 52.73 | 2697.23 | 1.99 |
| ASX 200 | 105.6 | 7971.1 | 1.34 |
| DAX | 139.16 | 18322.4 | 0.77 |
| CAC 40 | 26.33 | 7449.7 | 0.35 |
| Dow Jones | 96.7 | 40659.76 | 0.24 |
| S&P 500 | 11.03 | 5554.25 | 0.2 |
| NASDAQ Composite | 37.22 | 17631.72 | 0.21 |
Federal Reserve Bank of San Francisco President Mary Daly said that the US central bank needs to take a gradual approach to lowering borrowing costs, per Financial Times.
Key quotes
Daly calls for a "prudent" approach to lowering rates
Pushes back on economists’ concerns that the US economy is heading for a sharp slowdown that warrants rapid cuts in interest rates.
Gradualism is not weak, it’s not slow, it’s not behind, it’s just prudent.
After the first quarter of this year, inflation has just been making gradual progress toward 2 percent.
The Fed did not want to overtighten into a slowing economy.
No need for a dramatic response to the weakening labor market.
Market reaction
The US Dollar Index (DXY) is trading 0.03% higher on the day at 102.45, as of writing.
Fed FAQs
Monetary policy in the US is shaped by the Federal Reserve (Fed). The Fed has two mandates: to achieve price stability and foster full employment. Its primary tool to achieve these goals is by adjusting interest rates. When prices are rising too quickly and inflation is above the Fed’s 2% target, it raises interest rates, increasing borrowing costs throughout the economy. This results in a stronger US Dollar (USD) as it makes the US a more attractive place for international investors to park their money. When inflation falls below 2% or the Unemployment Rate is too high, the Fed may lower interest rates to encourage borrowing, which weighs on the Greenback.
The Federal Reserve (Fed) holds eight policy meetings a year, where the Federal Open Market Committee (FOMC) assesses economic conditions and makes monetary policy decisions. The FOMC is attended by twelve Fed officials – the seven members of the Board of Governors, the president of the Federal Reserve Bank of New York, and four of the remaining eleven regional Reserve Bank presidents, who serve one-year terms on a rotating basis.
In extreme situations, the Federal Reserve may resort to a policy named Quantitative Easing (QE). QE is the process by which the Fed substantially increases the flow of credit in a stuck financial system. It is a non-standard policy measure used during crises or when inflation is extremely low. It was the Fed’s weapon of choice during the Great Financial Crisis in 2008. It involves the Fed printing more Dollars and using them to buy high grade bonds from financial institutions. QE usually weakens the US Dollar.
Quantitative tightening (QT) is the reverse process of QE, whereby the Federal Reserve stops buying bonds from financial institutions and does not reinvest the principal from the bonds it holds maturing, to purchase new bonds. It is usually positive for the value of the US Dollar.
Federal Reserve Bank of Chicago President Austan Goolsbee said on Sunday that central bank officials should be wary of keeping the restrictive policy in place longer than necessary.
Key quotes
Credit conditions seem tight and are getting tighter.
Unemployment is up, and that's a caution sign.
No certainty the Fed will cut interest rates next month, but not doing so could damage the labour market
When you set a rate high like we have and hold it there while inflation falls, you're actually tightening.
The economic data is a mix of positive indicators and some that are more concerning.
If you keep too tight for too long, you will have a problem on the employment side of the Fed's mandate.
The impact of past hikes may not be fully realized.
Market reaction
The US Dollar Index (DXY) is trading 0.01% higher on the day at 102.60, as of writing.
Fed FAQs
Monetary policy in the US is shaped by the Federal Reserve (Fed). The Fed has two mandates: to achieve price stability and foster full employment. Its primary tool to achieve these goals is by adjusting interest rates. When prices are rising too quickly and inflation is above the Fed’s 2% target, it raises interest rates, increasing borrowing costs throughout the economy. This results in a stronger US Dollar (USD) as it makes the US a more attractive place for international investors to park their money. When inflation falls below 2% or the Unemployment Rate is too high, the Fed may lower interest rates to encourage borrowing, which weighs on the Greenback.
The Federal Reserve (Fed) holds eight policy meetings a year, where the Federal Open Market Committee (FOMC) assesses economic conditions and makes monetary policy decisions. The FOMC is attended by twelve Fed officials – the seven members of the Board of Governors, the president of the Federal Reserve Bank of New York, and four of the remaining eleven regional Reserve Bank presidents, who serve one-year terms on a rotating basis.
In extreme situations, the Federal Reserve may resort to a policy named Quantitative Easing (QE). QE is the process by which the Fed substantially increases the flow of credit in a stuck financial system. It is a non-standard policy measure used during crises or when inflation is extremely low. It was the Fed’s weapon of choice during the Great Financial Crisis in 2008. It involves the Fed printing more Dollars and using them to buy high grade bonds from financial institutions. QE usually weakens the US Dollar.
Quantitative tightening (QT) is the reverse process of QE, whereby the Federal Reserve stops buying bonds from financial institutions and does not reinvest the principal from the bonds it holds maturing, to purchase new bonds. It is usually positive for the value of the US Dollar.
| Pare | Closed | Change, % |
|---|---|---|
| AUDUSD | 0.66694 | 0.92 |
| EURJPY | 162.748 | -0.55 |
| EURUSD | 1.10256 | 0.49 |
| GBPJPY | 191.051 | -0.35 |
| GBPUSD | 1.29432 | 0.71 |
| NZDUSD | 0.60526 | 1.15 |
| USDCAD | 1.36806 | -0.37 |
| USDCHF | 0.86614 | -0.74 |
| USDJPY | 147.595 | -1.04 |
- Gold price drifts higher to $2,505 in Monday’s early Asian session.
- The recent US Housing Starts added to concerns over the economy's strength and triggered the expectation of Fed rate cuts.
- Escalating geopolitical tensions boosts the safe-haven asset like Gold.
Gold price (XAU/USD) gains momentum around $2,505 during the early Asian session on Monday amid hopes of the US Federal Reserve (Fed) rate cuts in September. Gold traders will take more cues from the first reading of the US S&P Global Purchasing Managers Index (PMI) and Fed Chair Jerome Powell's speech this week.
The precious metal rose to an all-time high on Friday as investors placed more bets on interest rate cuts from the US Fed in September. US economic data last week showed that Retail Sales beat estimates, but the US Producer and Consumer Price Indexes indicated inflation was subsiding.
Additionally, the US Housing Starts fell by 6.8% in July to 1.238 million units from the 1.1% increase in June, the lowest level since 2020. This figure added to concerns over the economy's strength, especially after recent softer inflation and labor reports. This, in turn, fuels deeper reductions by the Fed and underpins the yellow metal as lower interest rates generally reduce the opportunity cost of holding non-yielding bullion.
Federal Reserve Bank of Chicago President Austan Goolsbee said on Sunday that the US economy does not show signs of overheating, thus Fed policymakers should be cautious about keeping restrictive policy in place longer than necessary. The markets are now pricing in nearly 76% chance of a 25 basis points (bps) Fed rate cut in its September meeting, according to the CME FedWatch Tool.
The ongoing geopolitical tensions in the Middle East and the war in Ukraine all contribute to the safe-haven demand for gold. Conflict between Hezbollah and Israel has escalated over the weekend, despite diplomatic attempts to de-escalate tensions to prevent an expected Hezbollah-Iran strike on Israel, per the Guardian. The news agency reported that an Israeli attack on Saturday was one of the bloodiest for civilians since fighting began in October.
Gold FAQs
Gold has played a key role in human’s history as it has been widely used as a store of value and medium of exchange. Currently, apart from its shine and usage for jewelry, the precious metal is widely seen as a safe-haven asset, meaning that it is considered a good investment during turbulent times. Gold is also widely seen as a hedge against inflation and against depreciating currencies as it doesn’t rely on any specific issuer or government.
Central banks are the biggest Gold holders. In their aim to support their currencies in turbulent times, central banks tend to diversify their reserves and buy Gold to improve the perceived strength of the economy and the currency. High Gold reserves can be a source of trust for a country’s solvency. Central banks added 1,136 tonnes of Gold worth around $70 billion to their reserves in 2022, according to data from the World Gold Council. This is the highest yearly purchase since records began. Central banks from emerging economies such as China, India and Turkey are quickly increasing their Gold reserves.
Gold has an inverse correlation with the US Dollar and US Treasuries, which are both major reserve and safe-haven assets. When the Dollar depreciates, Gold tends to rise, enabling investors and central banks to diversify their assets in turbulent times. Gold is also inversely correlated with risk assets. A rally in the stock market tends to weaken Gold price, while sell-offs in riskier markets tend to favor the precious metal.
The price can move due to a wide range of factors. Geopolitical instability or fears of a deep recession can quickly make Gold price escalate due to its safe-haven status. As a yield-less asset, Gold tends to rise with lower interest rates, while higher cost of money usually weighs down on the yellow metal. Still, most moves depend on how the US Dollar (USD) behaves as the asset is priced in dollars (XAU/USD). A strong Dollar tends to keep the price of Gold controlled, whereas a weaker Dollar is likely to push Gold prices up.


© 2000-2026. Sva prava zaštićena.
Sajt je vlasništvo kompanije Teletrade D.J. LLC 2351 LLC 2022 (Euro House, Richmond Hill Road, Kingstown, VC0100, St. Vincent and the Grenadines).
Svi podaci koji se nalaze na sajtu ne predstavljaju osnovu za donošenje investicionih odluka, već su informativnog karaktera.
The company does not serve or provide services to customers who are residents of the US, Canada, Iran, The Democratic People's Republic of Korea, Yemen and FATF blacklisted countries.
Izvršenje trgovinskih operacija sa finansijskim instrumentima upotrebom marginalne trgovine pruža velike mogućnosti i omogućava investitorima ostvarivanje visokih prihoda. Međutim, takav vid trgovine povezan je sa potencijalno visokim nivoom rizika od gubitka sredstava. Проведение торговых операций на финанcовых рынках c маржинальными финанcовыми инcтрументами открывает широкие возможноcти, и позволяет инвеcторам, готовым пойти на риcк, получать выcокую прибыль, но при этом неcет в cебе потенциально выcокий уровень риcка получения убытков. Iz tog razloga je pre započinjanja trgovine potrebno odlučiti o izboru odgovarajuće investicione strategije, uzimajući u obzir raspoložive resurse.
Upotreba informacija: U slučaju potpunog ili delimičnog preuzimanja i daljeg korišćenja materijala koji se nalazi na sajtu, potrebno je navesti link odgovarajuće stranice na sajtu kompanije TeleTrade-a kao izvora informacija. Upotreba materijala na internetu mora biti praćena hiper linkom do web stranice teletrade.org. Automatski uvoz materijala i informacija sa stranice je zabranjen.
Ako imate bilo kakvih pitanja, obratite nam se pr@teletrade.global.
транcфери