- Analiza
- Novosti i instrumenti
- Vesti sa tržišta
Forex-novosti i prognoze od 19-07-2024
- NZD/USD trudges below the 0.6070 level, marking its worst week since January.
- The pair closed at 0.6010, indicating a weekly loss of approximately 1.80%.
- NZD/USD remains under the key SMA of 20, 100, and 200 days, pointing to a sustained bearish bias.
In Friday's session, the NZD/USD sustained its downward momentum, dropping by 0.65% to touch 0.6010. The pair's failure to reclaim the 0.6070 level resulted in a dip to the significant 0.6000 line, consequently closing its worst week since the start of the year with a weekly loss of around 1.80%.
The daily technical indicators also echo this downward trend. The Relative Strength Index (RSI) has decreased further to 36 signaling a continuation of selling pressure. Additionally, the Moving Average Convergence Divergence (MACD) continues to print rising red bars, reaffirming the growing bearish sentiment.
NZD/USD daily chart
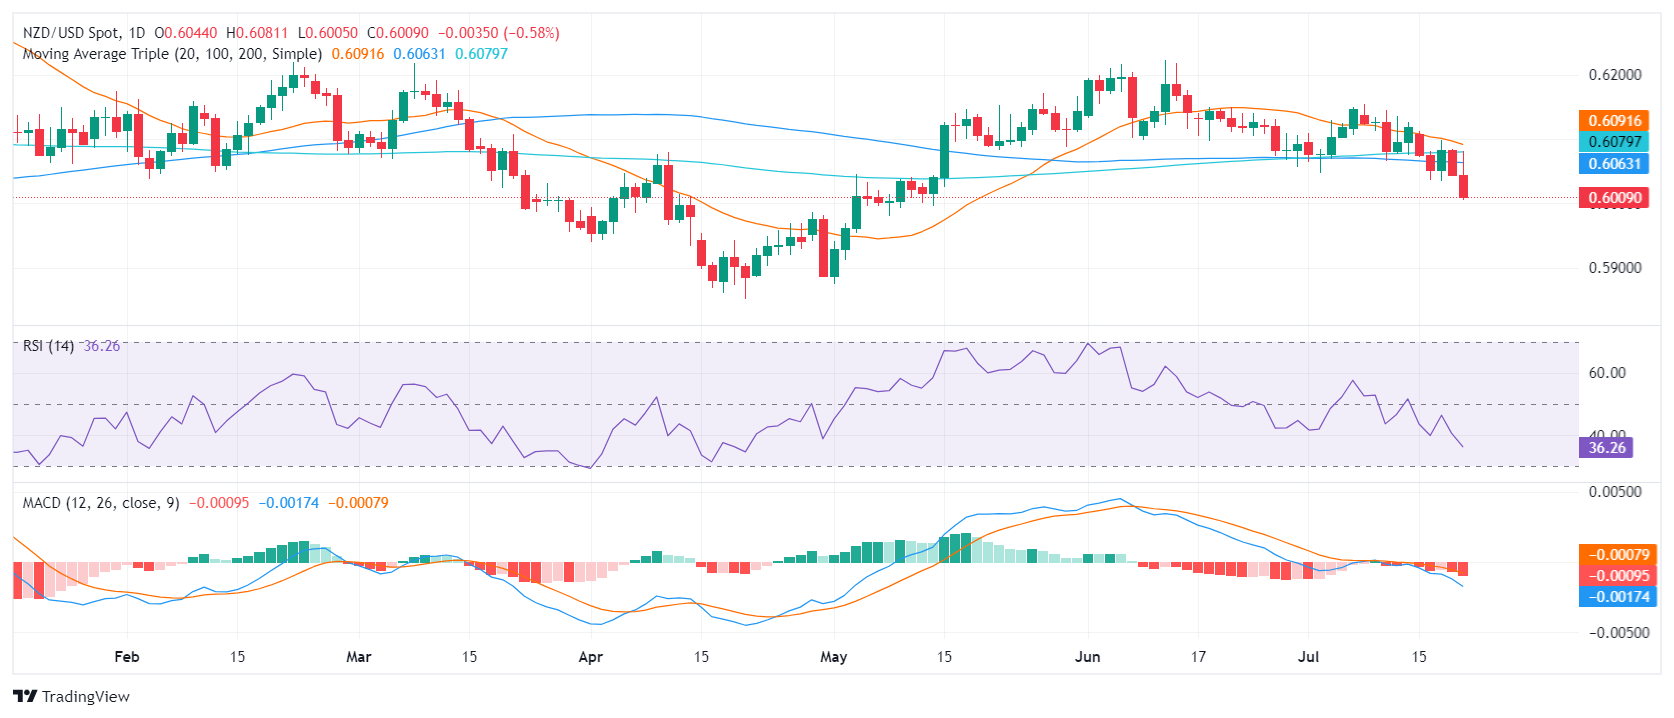
Resistance presently resides at the former support level of 0.6070 and then around 0.6100. On the other hand, strong support is now observed at the formidable 0.6000 line, under which the 0.6450-0.6470 range is visible. Should the bearish tilt maintain its course and lead to a further downturn beneath these levels, it would solidify the bearish narrative.
- Friday's trading session saw the NZD/JPY pair resuming its losses, exacerbating the bearish momentum.
- Cross ends the week with a near 2% loss.
- Sellers are pointing towards the 100-day SMA.
In Friday's trading session, the NZD/JPY pair extended its losses and slumped to 94.65, marking a 0.50% decline. Even though a slight rebound occurred on Thursday, the pair ended the week with approximately 2% losses, underscoring a continuously negative outlook.
Daily technical indicators reinforce the control of the bears, irrespective of Thursday's brief rebound. The Relative Strength Index (RSI) edged into oversold territory while the Moving Average Convergence Divergence (MACD) continued to print rising red bars, implying the presence of sustained selling pressure. However, the RSI below 30, might suggest an incoming upwards correction.
NZD/JPY daily chart
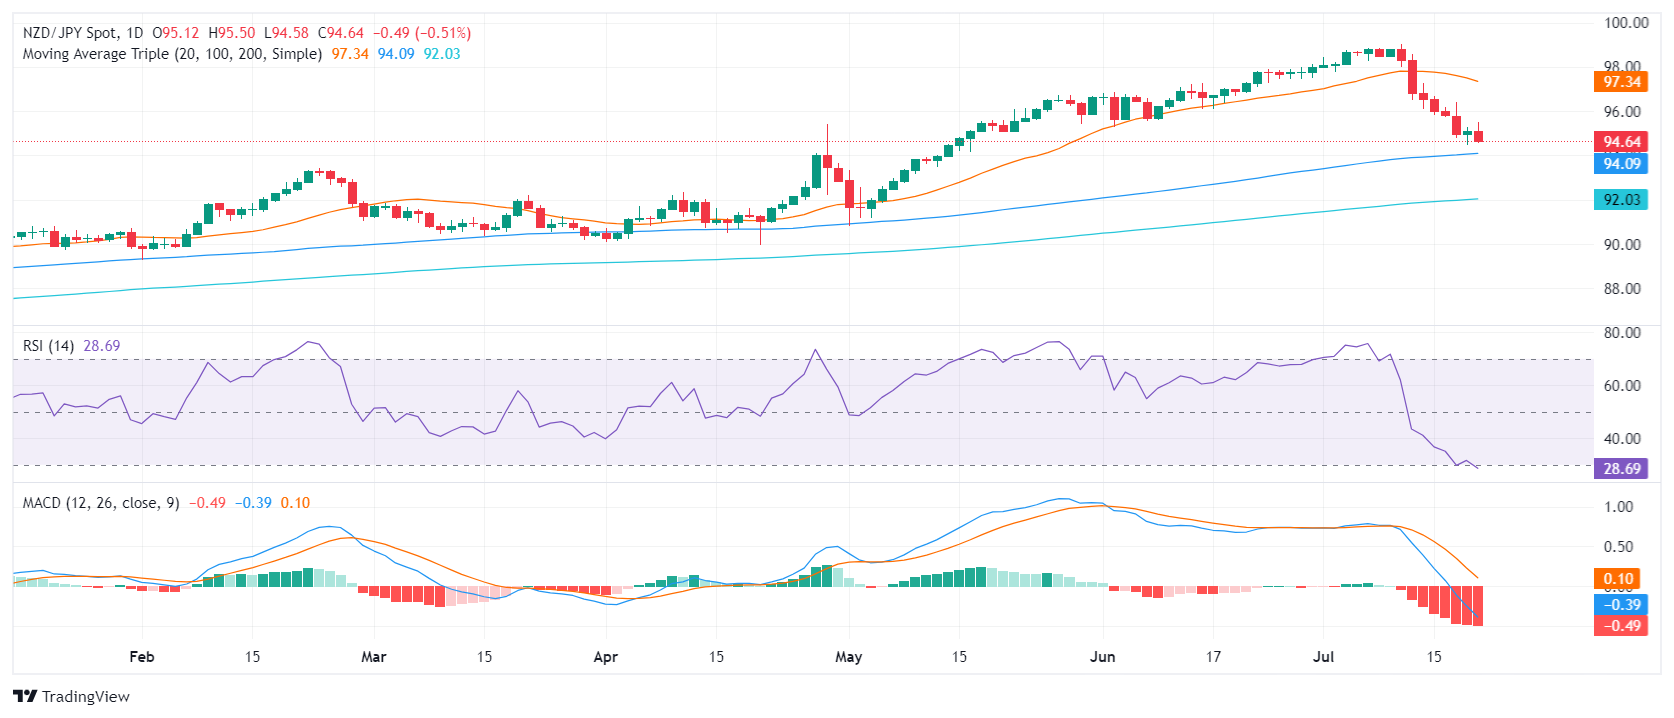
Corresponding to the established bearish mood, immediate support levels are now lower at 94.50 and at the 100-day Simple Moving Average (SMA) of 94.00. A downward crossing of these levels could substantiate the short-term bearish superiority. Resistance levels stay at the prior support markers of 95.00, 95.50, and 96.00, which could be significant thresholds for possible upside movements.
- AUD/JPY resumes decline, falling to 105.25, marking one of the lowest levels in over a month.
- The recovery experienced on Thursday was short-lived as selling pressures resumed, augmenting the prevalent negative outlook.
In Friday's session, the AUD/JPY pair has resumed its downtrend, declining by 0.20% to reach 105.25. The resumption of this bearish trend suggests that the rebound registered previously on Thursday may have been more corrective rather than indicative of a trend reversal. This sustains the dominance of the bears and reinforces the existing negative outlook as the pair will close a 1.60% weekly loss.
The daily Relative Strength Index (RSI) for AUD/JPY currently stands at 42, slightly below Thursday's value, suggesting a continuation of the negative momentum. The similar pattern in the Moving Average Convergence Divergence (MACD) that continues to print rising red bars, suggests a continuation of the selling activity, despite the minor rebound seen previously.
AUD/JPY daily chart
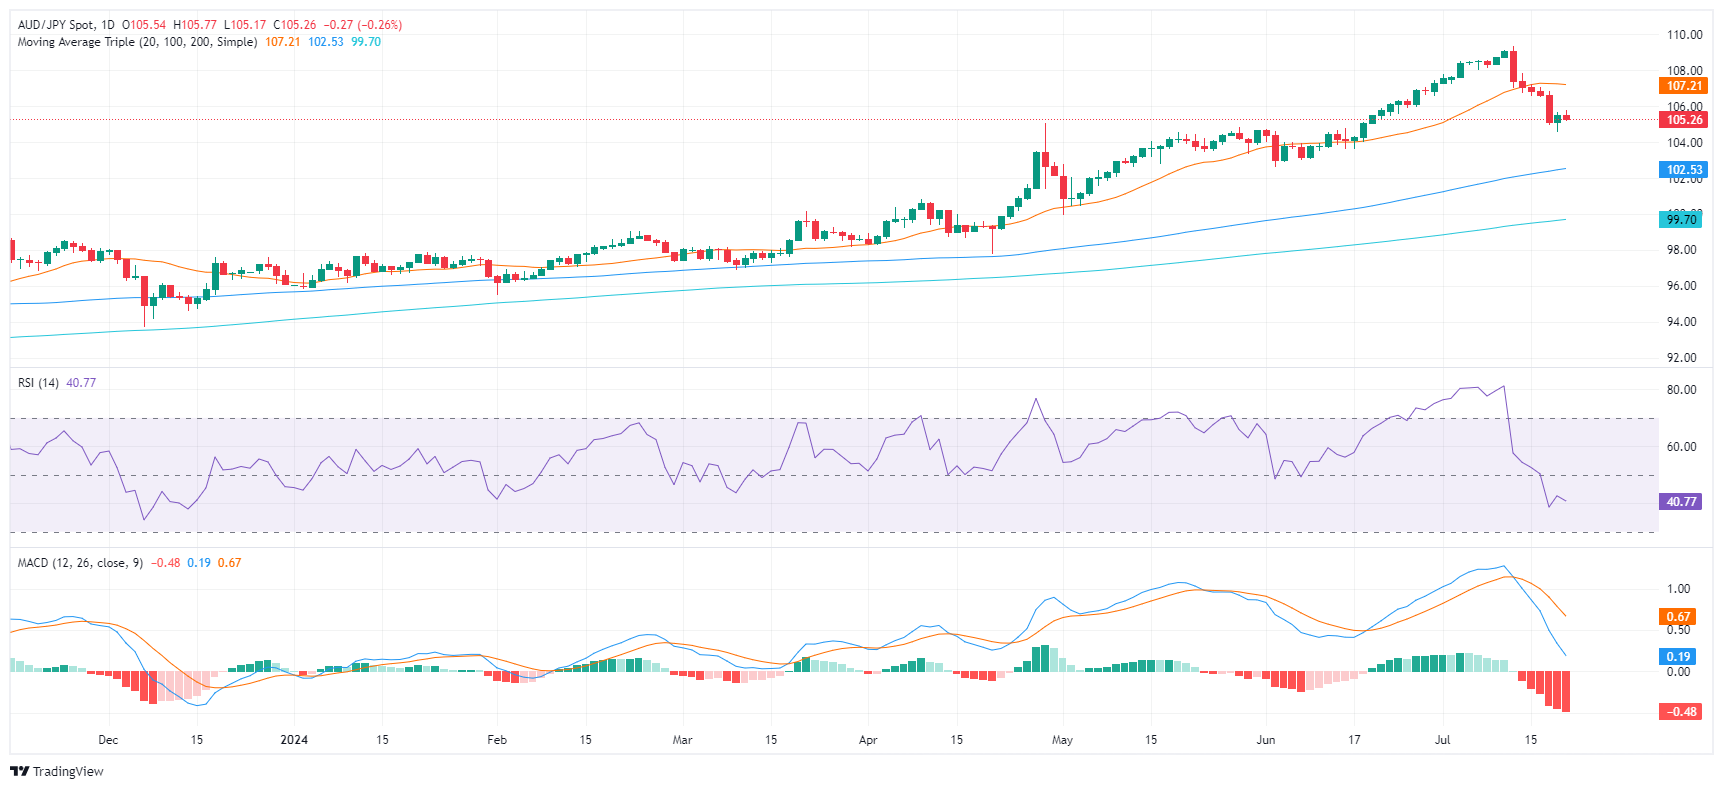
On a broader perspective, the AUD/JPY's short-term bearish trajectory seems to persist, with its price remaining below the 20-day Simple Moving Average (SMA). Looking ahead, immediate support levels appear to have formed around the 105.00 mark, which the buying pressure needs to maintain to fend off a deeper correction. To moderate further potential losses, bulls must aim for the recovery of the 106.00, and subsequently, the 106.50 mark.
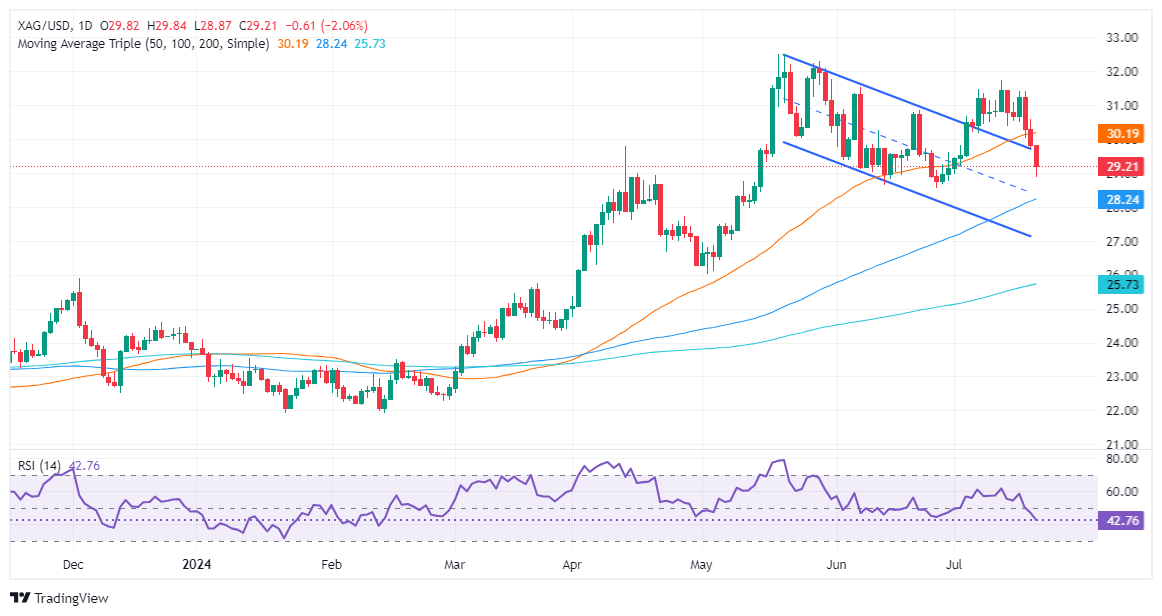
- Silver edges down 2.05%, continues three-day decline amid profit-taking.
- Technicals suggest more selling as RSI drops below 50.
- Key supports: $29.00, June 26 low of $28.57, 100-DMA at $28.23.
- For bullish turn, XAG/USD must surpass $29.50, with resistance at $30.17 and $31.00.
Silver price extended its losses to three straight days, late in the North American session, plummeting more than 5% weekly due to investors booking profits, according to Jim Wyckoff of Kitco. The grey metal witnessed its meteoric rise of eleven days, ending as the XAG/USD trades beneath the $29.20 mark, losing 2.05%.
XAG/USD Price Analysis: Technical outlook
Although XAG/USD maintains a bullish bias, buyers might find it difficult to gain traction. The Relative Strength Index (RSI) vertical drop that pierced the 50-neutral line depicts that momentum indicates that further selling pressure lies ahead.
On further weakness, the XAG/USD first support would be the $29.00 psychological figure. Once cleared, the next support would be the June 26 low at $28.57, followed by the 100-DMA at $28.23.
For a bullish continuation, the XAG/USD must climb above $29.50 so buyers can test the $30.00 mark. On further strength, Silver’s next resistance would be the 50-DMA at $30.17 before challenging the $31.00 mark.
XAG/USD Price Action – Daily Chart
Silver FAQs
Silver is a precious metal highly traded among investors. It has been historically used as a store of value and a medium of exchange. Although less popular than Gold, traders may turn to Silver to diversify their investment portfolio, for its intrinsic value or as a potential hedge during high-inflation periods. Investors can buy physical Silver, in coins or in bars, or trade it through vehicles such as Exchange Traded Funds, which track its price on international markets.
Silver prices can move due to a wide range of factors. Geopolitical instability or fears of a deep recession can make Silver price escalate due to its safe-haven status, although to a lesser extent than Gold's. As a yieldless asset, Silver tends to rise with lower interest rates. Its moves also depend on how the US Dollar (USD) behaves as the asset is priced in dollars (XAG/USD). A strong Dollar tends to keep the price of Silver at bay, whereas a weaker Dollar is likely to propel prices up. Other factors such as investment demand, mining supply – Silver is much more abundant than Gold – and recycling rates can also affect prices.
Silver is widely used in industry, particularly in sectors such as electronics or solar energy, as it has one of the highest electric conductivity of all metals – more than Copper and Gold. A surge in demand can increase prices, while a decline tends to lower them. Dynamics in the US, Chinese and Indian economies can also contribute to price swings: for the US and particularly China, their big industrial sectors use Silver in various processes; in India, consumers’ demand for the precious metal for jewellery also plays a key role in setting prices.
Silver prices tend to follow Gold's moves. When Gold prices rise, Silver typically follows suit, as their status as safe-haven assets is similar. The Gold/Silver ratio, which shows the number of ounces of Silver needed to equal the value of one ounce of Gold, may help to determine the relative valuation between both metals. Some investors may consider a high ratio as an indicator that Silver is undervalued, or Gold is overvalued. On the contrary, a low ratio might suggest that Gold is undervalued relative to Silver.
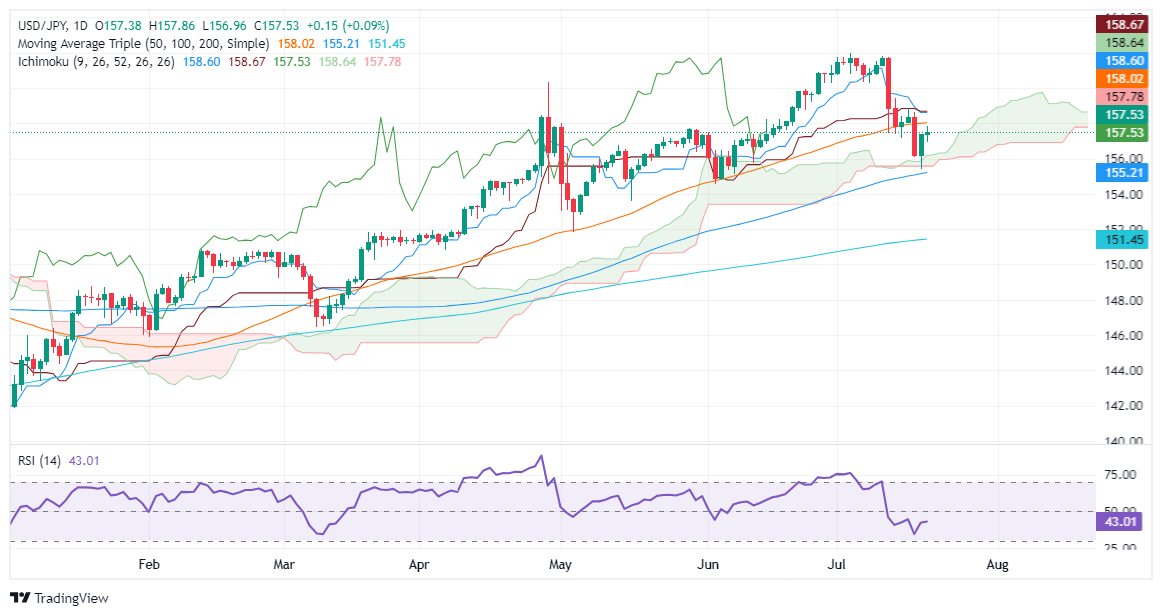
- USD/JPY rises up 0.06%, but fails to break above 158.00.
- Bearish signals: RSI turning bearish, Chikou Span crossing below price action, and Tenkan-Sen crossing beneath Kijun-Sen.
- Key supports at 157.00, 156.00, and bottom of the Kumo at 155.50/60; further support at 155.37 and 155.00.
- Potential resistance at 157.50 and July 16 peak at 158.85 if buyers push the pair higher.
The USD/JPY edged up during the North American session, gaining a decent 0.06% as traders failed to push the exchange rate above 158.00. At the time of writing, the major consolidates in the middle of a 90-pip range and trades at 157.44.
USD/JPY Price Analysis: Technical outlook
The USD/JPY trades subdued ahead of the weekend, but momentum remains on the sellers’ side. The Relative Strength Index (RSI) turning bearish and the Chikou Span crossing below price action, were the first two signals of further weakness. This and the Tenkan-Sen crossing beneath the Kijun-Sen could push prices below the Ichimoku Cloud (Kumo).
If USD/JPY drops below 157.00, that will exert downward pressure on the pair and push prices toward 156.00, ahead of piercing the bottom of the Kumo at 155.50/60. Once those two levels are surpassed, the next demand zone would be the July 18 low of 155.37 ahead of 155.00. A further downside is below that level, exposing the May 16 swing low of 153.61, followed by the May 2 pivot low at 151.87, ahead of testing the 151.00 mark.
Conversely, if buyers stepped in and pushed the USD/JPY above 157.50, look for a re-test of the July 16 peak at 158.85.
USD/JPY Price Action – Daily Chart
Japanese Yen PRICE Today
The table below shows the percentage change of Japanese Yen (JPY) against listed major currencies today. Japanese Yen was the strongest against the New Zealand Dollar.
| USD | EUR | GBP | JPY | CAD | AUD | NZD | CHF | |
|---|---|---|---|---|---|---|---|---|
| USD | 0.15% | 0.26% | 0.09% | 0.18% | 0.34% | 0.61% | 0.15% | |
| EUR | -0.15% | 0.11% | -0.05% | 0.00% | 0.18% | 0.46% | 0.00% | |
| GBP | -0.26% | -0.11% | -0.18% | -0.11% | 0.08% | 0.36% | -0.10% | |
| JPY | -0.09% | 0.05% | 0.18% | 0.07% | 0.24% | 0.52% | 0.06% | |
| CAD | -0.18% | -0.00% | 0.11% | -0.07% | 0.15% | 0.44% | -0.02% | |
| AUD | -0.34% | -0.18% | -0.08% | -0.24% | -0.15% | 0.28% | -0.18% | |
| NZD | -0.61% | -0.46% | -0.36% | -0.52% | -0.44% | -0.28% | -0.46% | |
| CHF | -0.15% | -0.01% | 0.10% | -0.06% | 0.02% | 0.18% | 0.46% |
The heat map shows percentage changes of major currencies against each other. The base currency is picked from the left column, while the quote currency is picked from the top row. For example, if you pick the Japanese Yen from the left column and move along the horizontal line to the US Dollar, the percentage change displayed in the box will represent JPY (base)/USD (quote).
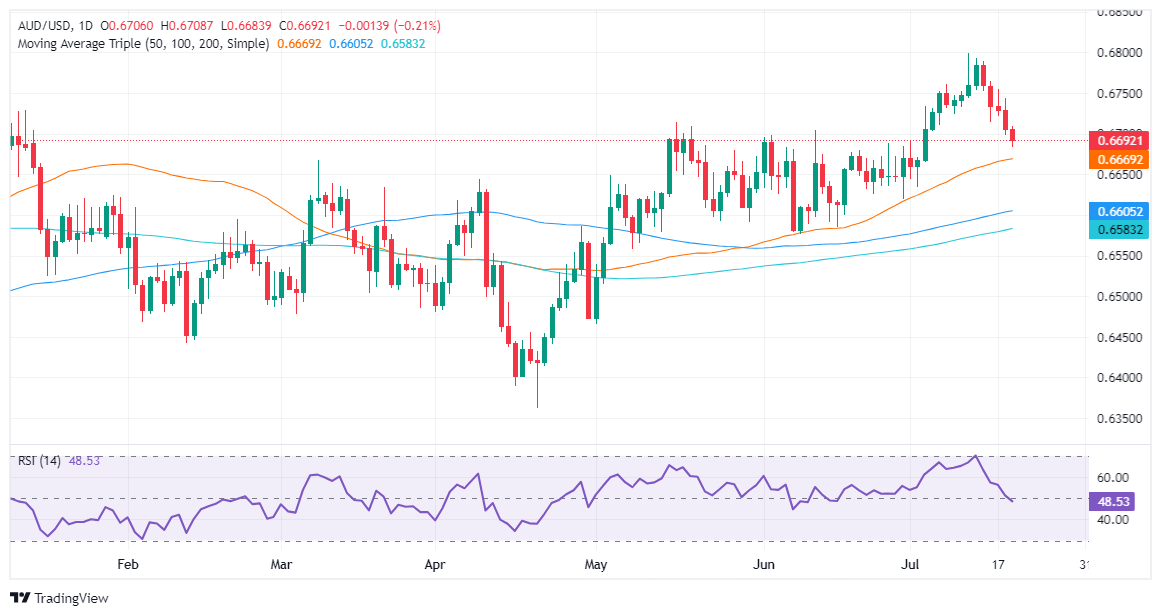
- AUD/USD registered a significant drop on Friday, slipping below 0.6700.
- Employment data continues to shape possible RBA and Federal Reserve decisions.
- The Aussie’s downside is limited by the hawkish RBA stance which hasn’t shown signs of embracing cuts.
In Friday's session, The Australian Dollar (AUD) saw considerable losses against the USD, falling by 0.30% to 0.6690. This slump in the AUD/USD is mostly due to the strengthening of the US Dollar (USD) amid increased aversion to risk. However, higher-than-expected Employment Change figures from Australia, indicating a tight labor market, could curb the AUD's downside by raising concerns over a potential interest rate hike from the Reserve Bank of Australia (RBA) and hence limit the pair’s downside.
Despite some signs of fragility in the Australian economy, persistently high inflation is prompting the RBA to delay rate cuts, potentially limiting any further decline in the AUD. The RBA remains among the last central banks within the G10 countries expected to begin rate cuts, a commitment that could bolster the AUD's position.
Daily digest market movers: Aussie struggles as markets asses employment figures
- On a quiet Friday, markets continue to digest Thursday’s employment figures from Australia which came in mixed.
- It was announced a substantial 50.2K increase in employment changes, soaring beyond earlier market forecasts of 20K and May's 39.5K record.
- On the negative side, the Unemployment Rate rose marginally from 4.0% to 4.1%, which might provide some relief to the RBA's hawkish stance.
- The market currently predicts roughly a 50% chance of the RBA hiking either in September or November.
- Conversely, the chance of the Federal Reserve implementing a rate cut in September stands at approximately 90% according to the CME FedWatch tool.
AUD/USD Technical analysis: AUD/USD falls and concedes the 20-day SMA
After early July's sharp gains, technical indicators such as the Relative Strength Index (RSI) and the Moving Average Convergence Divergence (MACD) have signaled weakening momentum, suggesting the pair has entered a correction period. On Friday, the pair gave up the crucial support of the 20-day Simple Moving Average (SMA) at 0.6700 which should flash some concerns to trades.
It appears the pair may fluctuate between the 0.6650-0.6780 range in the following sessions as the market adjusts.
Australian Dollar FAQs
One of the most significant factors for the Australian Dollar (AUD) is the level of interest rates set by the Reserve Bank of Australia (RBA). Because Australia is a resource-rich country another key driver is the price of its biggest export, Iron Ore. The health of the Chinese economy, its largest trading partner, is a factor, as well as inflation in Australia, its growth rate and Trade Balance. Market sentiment – whether investors are taking on more risky assets (risk-on) or seeking safe-havens (risk-off) – is also a factor, with risk-on positive for AUD.
The Reserve Bank of Australia (RBA) influences the Australian Dollar (AUD) by setting the level of interest rates that Australian banks can lend to each other. This influences the level of interest rates in the economy as a whole. The main goal of the RBA is to maintain a stable inflation rate of 2-3% by adjusting interest rates up or down. Relatively high interest rates compared to other major central banks support the AUD, and the opposite for relatively low. The RBA can also use quantitative easing and tightening to influence credit conditions, with the former AUD-negative and the latter AUD-positive.
China is Australia’s largest trading partner so the health of the Chinese economy is a major influence on the value of the Australian Dollar (AUD). When the Chinese economy is doing well it purchases more raw materials, goods and services from Australia, lifting demand for the AUD, and pushing up its value. The opposite is the case when the Chinese economy is not growing as fast as expected. Positive or negative surprises in Chinese growth data, therefore, often have a direct impact on the Australian Dollar and its pairs.
Iron Ore is Australia’s largest export, accounting for $118 billion a year according to data from 2021, with China as its primary destination. The price of Iron Ore, therefore, can be a driver of the Australian Dollar. Generally, if the price of Iron Ore rises, AUD also goes up, as aggregate demand for the currency increases. The opposite is the case if the price of Iron Ore falls. Higher Iron Ore prices also tend to result in a greater likelihood of a positive Trade Balance for Australia, which is also positive of the AUD.
The Trade Balance, which is the difference between what a country earns from its exports versus what it pays for its imports, is another factor that can influence the value of the Australian Dollar. If Australia produces highly sought after exports, then its currency will gain in value purely from the surplus demand created from foreign buyers seeking to purchase its exports versus what it spends to purchase imports. Therefore, a positive net Trade Balance strengthens the AUD, with the opposite effect if the Trade Balance is negative.
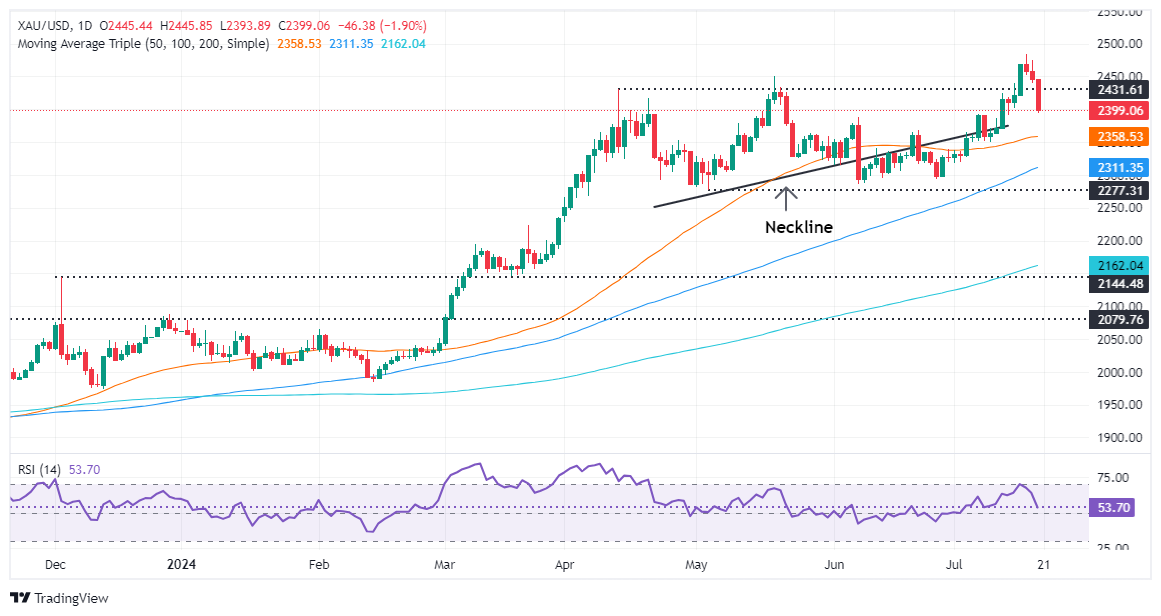
- Gold drops to $2,399, down 1.50%, after hitting a high of $2,447.
- Concerns over China's economic growth and Trump's election prospects boost the Greenback.
- US Dollar Index rises to 104.34, up 0.18%; US Treasury yields climb, with 10-year note at 4.233%.
Gold price sinks by more than 1.50% on Friday and hovers around $2,400 as traders book profits ahead of the weekend. The golden metal could finish the week with losses close to 1% after hitting an all-time high of $2,483 and trading at around the $2,300 handle. The XAU/USD exchanges hands at $2,399 after reaching a high of $2,447.
Trader sentiment is gyrating due to several factors. China’s economy is growing less than expected, and an increasing rumble that former President Donald Trump might win the November 5 elections boosted the Greenback, which is set to end the week with gains of more than 0.26%, according to the US Dollar Index (DXY).
Besides that, reports emerged that US President Joe Biden could pull out of the race as high-level democrats said polls following Trump’s assassination attack show that he can’t beat him.
In the meantime, Federal Reserve policymakers continued to turn slightly dovish yet failed to undermine the US Dollar. Nevertheless, the International Monetary Fund (IMF) said on Thursday that the Fed should not cut interest rates until late 2024.
The US Dollar Index, which tracks the currency's performance against six other currencies, is up 0.18% at 104.34. US Treasury bond yields are also rising across the yield curve, with the 10-year Treasury note yielding 4.233%, up more than three basis points (bps).
Daily digest market movers: Gold price tanks below $2,400
- Weaker-than-expected US Consumer Price Index (CPI) data boosted Gold prices above $2,400, as the increased likelihood of Fed rate cuts led to falling US Treasury bond yields.
- This week’s data featured mixed Retail Sales reading, a slowdown in Industrial Production, and the increase of Americans filling for unemployment benefits, reinforcing the Fed’s rhetoric that its dual mandate has become more balanced.
- December 2024 fed funds rate futures contract implies that the Fed will ease policy by 50 basis points (bps) toward the end of the year, up from 50 last Friday.
- Investors will focus on speeches from Fed policymakers: New York Fed President John Williams and Atlanta Fed President Raphael Bostic are scheduled to speak during the New York session.
Gold technical analysis: XAU/USD tumbles beneath $2,400 as buyers stay on the sidelines
Gold prices are experiencing a pullback, signaling that traders continued to take profits after an 8% rally experienced since June 27. Although the Relative Strength Index (RSI) remains bullish, in the near-term momentum favors sellers. The RSI has experienced a vertical fall, though shy of piercing the 50-neutral line.
Therefore, XAU/USD first support would be the July 5 high at $2,392, followed by the psychological 50-day Simple Moving Average (SMA) at $2,357. The next support would be $2,350, followed by the 100-day SMA at $2,312
Otherwise, if XAU/USD stays above $2,400 and reclaims $2,450, that can pave the way to challenge the all-time high of $2,483 ahead of hitting $2,500.
Gold FAQs
Gold has played a key role in human’s history as it has been widely used as a store of value and medium of exchange. Currently, apart from its shine and usage for jewelry, the precious metal is widely seen as a safe-haven asset, meaning that it is considered a good investment during turbulent times. Gold is also widely seen as a hedge against inflation and against depreciating currencies as it doesn’t rely on any specific issuer or government.
Central banks are the biggest Gold holders. In their aim to support their currencies in turbulent times, central banks tend to diversify their reserves and buy Gold to improve the perceived strength of the economy and the currency. High Gold reserves can be a source of trust for a country’s solvency. Central banks added 1,136 tonnes of Gold worth around $70 billion to their reserves in 2022, according to data from the World Gold Council. This is the highest yearly purchase since records began. Central banks from emerging economies such as China, India and Turkey are quickly increasing their Gold reserves.
Gold has an inverse correlation with the US Dollar and US Treasuries, which are both major reserve and safe-haven assets. When the Dollar depreciates, Gold tends to rise, enabling investors and central banks to diversify their assets in turbulent times. Gold is also inversely correlated with risk assets. A rally in the stock market tends to weaken Gold price, while sell-offs in riskier markets tend to favor the precious metal.
The price can move due to a wide range of factors. Geopolitical instability or fears of a deep recession can quickly make Gold price escalate due to its safe-haven status. As a yield-less asset, Gold tends to rise with lower interest rates, while higher cost of money usually weighs down on the yellow metal. Still, most moves depend on how the US Dollar (USD) behaves as the asset is priced in dollars (XAU/USD). A strong Dollar tends to keep the price of Gold controlled, whereas a weaker Dollar is likely to push Gold prices up.
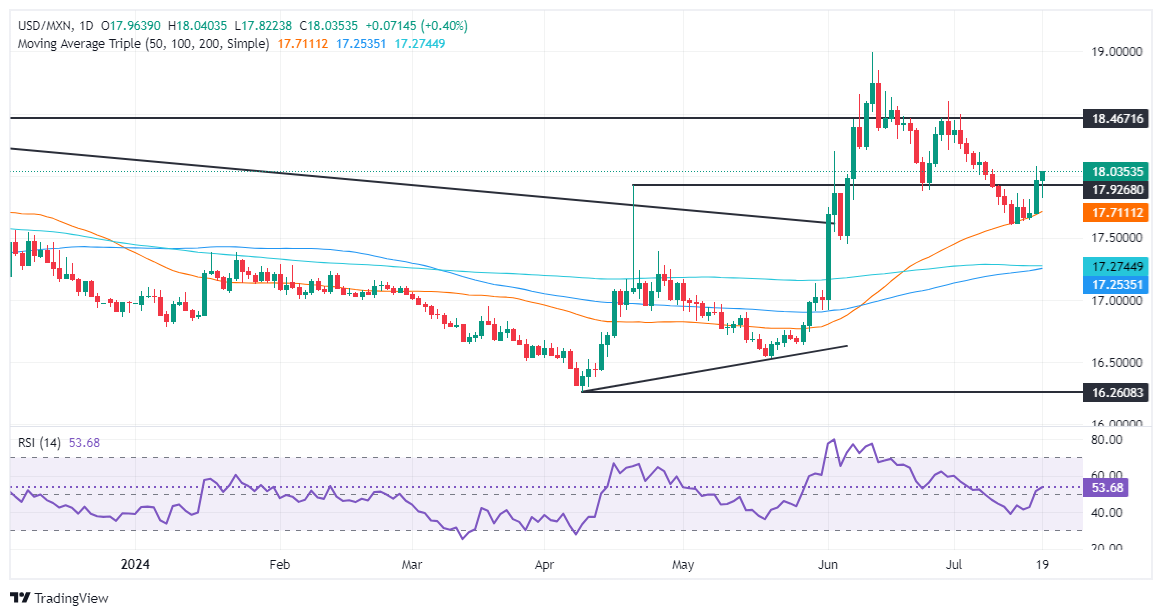
- Mexican Peso plunges more than 2.30% in the week.
- Mexico’s creditworthiness remains solid as Fitch reaffirms Mexico's BBB rating but warns about the judiciary reform.
- Trump's comments on immigration and automotive industry relocation impact Mexican Peso sentiment.
The Mexican Peso prolongs its agony against the US Dollar and dips some 0.16% during the North American session, hurt by market mood deterioration as investors flock to safe-haven currencies. The official nomination of former President Donald Trump as a Republican Candidate and remarks linked to Mexico could be one of the reasons behind the USD/MXN advance, which traded at 17.99 above its opening price by 0.16%.
Sentiment remains sour, as depicted by worldwide indices trading with losses. The Mexican economic docket will gather pace next Monday, July 22, with the release of May's Economic Activity alongside Retail Sales for the same period. This, in turn, has left market participants adrift to US Dollar dynamics.
Across the border, Trump’s comments put Mexico in the spotlight, commenting that he will end illegal immigration “by closing the border and completing the wall.” He added, “China and Mexico have taken 68 percent of our automotive industry, but we are going to get it back.”
The remarks threaten to prevent companies from relocating to Mexico, which could weaken the Mexican Peso.
Meanwhile, Fitch ratings reaffirmed Mexico’s BBB- qualification with a stable outlook, though added that the proposed judicial reform would impact the country. The credit rating agency stated there’s uncertainty in the upcoming administration to narrow the fiscal deficit, expects a slight economic downturn in 2025, and added that trade tensions with the US could leave Mexico vulnerable.
A light US economic schedule will feature New York Fed President John Williams and Atlanta’s Fed President Raphael Bostic.
The US Dollar Index (DXY), which tracks the buck’s value against the other six currencies, climbed back above 104.30, gaining 0.12%.
Daily digest market movers: Mexican Peso hurt by risk aversion
- Mexico’s Economic Activity in May is expected to contract -0.6% MoM and expand by 5.4% YoY. Retail Sales are foreseen to stay positive at 0.5% MoM and 3.2% YoY.
- The International Monetary Fund (IMF) adjusted Mexico’s Gross Domestic Product (GDP) expectations for 2024 from 2.4% to 2.2% due to the country’s economic slowdown and the US economic downturn.
- Bloomberg’s interview of Donald Trump spooked investors as the former US President commented that he favors tax reductions, lower interest rates, and tariffs, including a 60% to 100% increase in China’s products and a 10% in the general rate in other countries.
- The CME FedWatch Tools show that the chances of a quarter-percentage-rate cut to the federal funds rate in September are at 98%.
- June consumer inflation figures were lower than expected in the United States, increasing the chances that the Federal Reserve would lower borrowing costs in 2024 by at least 50 basis points, according to the December 2024 fed funds rate futures contract.
Technical analysis: Mexican Peso stumbles as USD/MXN hovers around 18.00
The USD/MXN has jumped off the floor formed at around 17.58-17.60 amid traders' nervousness about former President Trump's “upcoming” victory as they ditch the Mexican currency. Since Thursday, the exotic pair has gained 1.50% and challenged the psychological 18.00 figure but has failed to print a daily close above the latter.
If USD/MXN extends its gains above the psychological 18.00 figure, that will expose key resistance levels. Once breached, the next stop would be the July 5 high at 18.19, followed by the June 28 high of 18.59, allowing buyers to aim for the YTD high at 18.99.
On further weakness, if USD/MXN clears the 50-day SMA at 17.63, that would pave the way to challenge the December 5 high at 17.56, followed by the 200-day SMA at 17.27. Further losses would test the 100-day SMA at 17.21.
Mexican Peso FAQs
The Mexican Peso (MXN) is the most traded currency among its Latin American peers. Its value is broadly determined by the performance of the Mexican economy, the country’s central bank’s policy, the amount of foreign investment in the country and even the levels of remittances sent by Mexicans who live abroad, particularly in the United States. Geopolitical trends can also move MXN: for example, the process of nearshoring – or the decision by some firms to relocate manufacturing capacity and supply chains closer to their home countries – is also seen as a catalyst for the Mexican currency as the country is considered a key manufacturing hub in the American continent. Another catalyst for MXN is Oil prices as Mexico is a key exporter of the commodity.
The main objective of Mexico’s central bank, also known as Banxico, is to maintain inflation at low and stable levels (at or close to its target of 3%, the midpoint in a tolerance band of between 2% and 4%). To this end, the bank sets an appropriate level of interest rates. When inflation is too high, Banxico will attempt to tame it by raising interest rates, making it more expensive for households and businesses to borrow money, thus cooling demand and the overall economy. Higher interest rates are generally positive for the Mexican Peso (MXN) as they lead to higher yields, making the country a more attractive place for investors. On the contrary, lower interest rates tend to weaken MXN.
Macroeconomic data releases are key to assess the state of the economy and can have an impact on the Mexican Peso (MXN) valuation. A strong Mexican economy, based on high economic growth, low unemployment and high confidence is good for MXN. Not only does it attract more foreign investment but it may encourage the Bank of Mexico (Banxico) to increase interest rates, particularly if this strength comes together with elevated inflation. However, if economic data is weak, MXN is likely to depreciate.
As an emerging-market currency, the Mexican Peso (MXN) tends to strive during risk-on periods, or when investors perceive that broader market risks are low and thus are eager to engage with investments that carry a higher risk. Conversely, MXN tends to weaken at times of market turbulence or economic uncertainty as investors tend to sell higher-risk assets and flee to the more-stable safe havens.
- US Dollar DXY experiences extended gains, approaching 104.30 as sellers step back.
- Concerns over the US labor market might burden the USD.
- Risk aversion benefited the US at the end of the week.
On Friday, the US Dollar measured by the DXY index continued its rebound beyond the 104.00 mark, reaching 104.30, despite persistent worries about the labor market. This rise can be attributed to the sellers easing off and markets refuging itself in safe havens. Market anticipations of a rate cut in September by the Federal Reserve and the fragility of the US labor market are primary factors investors are focused on as their impact could put additional pressure on the currency.
The US economic outlook shows signs of disinflation, with financial markets remaining confident in a September rate cut. Despite this, Federal Reserve officials continue to exhibit hesitancy to hastily make interest rate cuts, sticking to a data-dependent approach.
Daily digest market movers: DXY recovers, Federal Reserve policy outlook and upcoming US elections the movers
- The two key catalysts currently contributing to USD movements are the outlook for Fed policy and the US elections, each having different implications for the USD.
- This month, the USD has attached more attention to Fed policy predictions. This is anticipated as the Fed is likely to cut rates prior to the US elections.
- In recent weeks, anticipations of a September Fed rate cut have made the USD relinquish its position as the top-performing G10 currency this year, mainly due to the report of weak inflation and labor market data.
- The CME FedWatch Tool seems to strongly support a rate cut in September, suggesting that a nearly full rate cut is firmly expected.
DXY Technical outlook: Bearish outlook persists despite gains, must regain the 200-day SMA
The DXY successfully continued its rebound to around 104.30, but the outlook is still bearish with the index continuing to stand below its 200-day Simple Moving Average (SMA). However, daily technical indicators, like the Relative Strength Index (RSI) and Moving Average Convergence Divergence (MACD), have gained some steam despite still being in negative terrain, signifying that bearish pressures are yet to disperse.
The solid support levels continue to lie at 103.50 and 103.00, however, the general technical outlook still favors the bears. Buyers on the other hand should focus on regaining the 200-day SMA at 104.30.
US Dollar FAQs
The US Dollar (USD) is the official currency of the United States of America, and the ‘de facto’ currency of a significant number of other countries where it is found in circulation alongside local notes. It is the most heavily traded currency in the world, accounting for over 88% of all global foreign exchange turnover, or an average of $6.6 trillion in transactions per day, according to data from 2022. Following the second world war, the USD took over from the British Pound as the world’s reserve currency. For most of its history, the US Dollar was backed by Gold, until the Bretton Woods Agreement in 1971 when the Gold Standard went away.
The most important single factor impacting on the value of the US Dollar is monetary policy, which is shaped by the Federal Reserve (Fed). The Fed has two mandates: to achieve price stability (control inflation) and foster full employment. Its primary tool to achieve these two goals is by adjusting interest rates. When prices are rising too quickly and inflation is above the Fed’s 2% target, the Fed will raise rates, which helps the USD value. When inflation falls below 2% or the Unemployment Rate is too high, the Fed may lower interest rates, which weighs on the Greenback.
In extreme situations, the Federal Reserve can also print more Dollars and enact quantitative easing (QE). QE is the process by which the Fed substantially increases the flow of credit in a stuck financial system. It is a non-standard policy measure used when credit has dried up because banks will not lend to each other (out of the fear of counterparty default). It is a last resort when simply lowering interest rates is unlikely to achieve the necessary result. It was the Fed’s weapon of choice to combat the credit crunch that occurred during the Great Financial Crisis in 2008. It involves the Fed printing more Dollars and using them to buy US government bonds predominantly from financial institutions. QE usually leads to a weaker US Dollar.
Quantitative tightening (QT) is the reverse process whereby the Federal Reserve stops buying bonds from financial institutions and does not reinvest the principal from the bonds it holds maturing in new purchases. It is usually positive for the US Dollar.
EUR/USD dips slightly under 1.09. ECB kept rates on hold as expected and left a September rate decision ‘wide open’ and data dependent, DBS FX & Credit Strategist Chang Wei Liang notes.
ECB to lean towards caution
“EUR/USD dipped slightly under 1.09, with the ECB keeping rates on hold as expected and leaving a September rate decision ‘wide open’ and data dependent. ECB President Lagarde hinted that another cut is possible if the data ‘confirms the disinflationary process’, and market expectations had not budged from largely expecting a cut in September.”
“Meanwhile, fractious French politics and possible disagreements over the budget could weigh on consumption and investment, adding another reason for ECB to lean towards caution.”
RMB markets were not excited at the conclusion of China’s Third Plenum, and USD/CNH is likely to consolidate around 7.25-7.30, DBS FX & Credit Strategist Chang Wei Liang notes.
USD/CNH to consolidate within 7.25-7.30
“RMB markets were not excited at the conclusion of China’s Third Plenum, and USD/CNH is likely to consolidate around 7.25-7.30. The communique was largely about a further deepening of reforms and modernization, while giving little details on specific reforms, and no mention of any stimulus measures for the economy.”
“On the positive side, there was agreement to leverage the role of the market, and to lift restrictions while ensuring effective regulation. The PBOC had set the onshore USD/CNY fixing below 7.13 yesterday, though it remains to be seen if the fixing could revert higher after the Plenum.”
- AUD/USD falls more than 1.30% in the week on risk-off mood.
- China’s weaker-than-expected growth figures in Q2 and Iron ore prices are a headwind for the Aussie.
- Strong Aussie jobs data could lead to RBA rate hike; US job indicators show weakness.
The Aussie Dollar edged lower during the North American session, extending its losses by more than 0.20% against the US Dollar. The AUD/USD pair is set to finish the week with more than 1.30% losses and trades at 0.6693.
Aussie Dollar affected by Iron ore prices, China’s soft data
Risk aversion is the game's name on Friday, with most high-beta currencies feeling the pain of traders looking for safety. China’s second-quarter growth data disappointed investors, a headwind for the Australian Dollar due to its closest ties with the second-largest economy in the world.
In the meantime, commodity prices are affecting antipodeans, including the Kiwi. Iron ore prices are plunging 1.70%, extending their losses for the last two weeks to more than 3.70%.
Aside from this, the Greenback continued to recover after dipping to lows last seen on March 21 around the 103.60 area. The US Dollar Index (DXY) posted gains of 0.11% at the time of writing, up at 104.29 as it tests the crucial 200-day moving average (DMA). A further upside is seen if that level is cleared.
Macroeconomically, the latest Aussie jobs data was solid, and it could prompt the Reserve Bank of Australia (RBA) to raise rates in August. On the US front, jobs data continues to show signs of “weakness,” though Federal Reserve policymakers had refrained from hinting at a timetable of possible rate cuts, adding they need more confidence before easing policy.
Ahead on the day, traders will eye speeches of New York Fed President John Williams, and Atlanta’s Raphael Bostic.
AUD/USD Price Analysis: Technical outlook
After falling beneath the 0.6700 figure, the AUD/USD is set to challenge the 50-DMA at 0.6668 on further weakness, as negative momentum piled. Sellers are in charge, according to the Relative Strength Index (RSI), which has fallen below the 50-neutral line, opening the door for further downside.
Once traders drag prices below 0.6668, the next support levels to eye would be June 28’s low of 0.6619 and the 100-DMA at 0.6604. Key resistance lies at 0.6700, followed by the July 18 peak at 0.6743.
Australian Dollar FAQs
One of the most significant factors for the Australian Dollar (AUD) is the level of interest rates set by the Reserve Bank of Australia (RBA). Because Australia is a resource-rich country another key driver is the price of its biggest export, Iron Ore. The health of the Chinese economy, its largest trading partner, is a factor, as well as inflation in Australia, its growth rate and Trade Balance. Market sentiment – whether investors are taking on more risky assets (risk-on) or seeking safe-havens (risk-off) – is also a factor, with risk-on positive for AUD.
The Reserve Bank of Australia (RBA) influences the Australian Dollar (AUD) by setting the level of interest rates that Australian banks can lend to each other. This influences the level of interest rates in the economy as a whole. The main goal of the RBA is to maintain a stable inflation rate of 2-3% by adjusting interest rates up or down. Relatively high interest rates compared to other major central banks support the AUD, and the opposite for relatively low. The RBA can also use quantitative easing and tightening to influence credit conditions, with the former AUD-negative and the latter AUD-positive.
China is Australia’s largest trading partner so the health of the Chinese economy is a major influence on the value of the Australian Dollar (AUD). When the Chinese economy is doing well it purchases more raw materials, goods and services from Australia, lifting demand for the AUD, and pushing up its value. The opposite is the case when the Chinese economy is not growing as fast as expected. Positive or negative surprises in Chinese growth data, therefore, often have a direct impact on the Australian Dollar and its pairs.
Iron Ore is Australia’s largest export, accounting for $118 billion a year according to data from 2021, with China as its primary destination. The price of Iron Ore, therefore, can be a driver of the Australian Dollar. Generally, if the price of Iron Ore rises, AUD also goes up, as aggregate demand for the currency increases. The opposite is the case if the price of Iron Ore falls. Higher Iron Ore prices also tend to result in a greater likelihood of a positive Trade Balance for Australia, which is also positive of the AUD.
The Trade Balance, which is the difference between what a country earns from its exports versus what it pays for its imports, is another factor that can influence the value of the Australian Dollar. If Australia produces highly sought after exports, then its currency will gain in value purely from the surplus demand created from foreign buyers seeking to purchase its exports versus what it spends to purchase imports. Therefore, a positive net Trade Balance strengthens the AUD, with the opposite effect if the Trade Balance is negative.
Should demand expectations recover, palladium's short squeeze could be reignited. It could be set-up to notably benefit from a reversal in broad commodity demand sentiment, TDS Senior Commodity Strategist Daniel Ghali notes
A recovery in demand expectations may push Palladium higher
“Should commodity demand expectations continue to subside, a cluster of Commodity Trading Advisor (CTA) selling programs could be catalyzed, sparking selling activity that could total -55% of the algos' max size.”
“In contrast, should demand expectations recover, Palladium's short squeeze could be reignited. CTAs are effectively 'max short' and therefore unlikely to add to their size in Palladium, even in a big downtape, whereas a commensurate rally could force large-scale buying activity from trend-following algos.”
“Considering that discretionary traders also likely still hold a substantial net short position, Palladium could be set-up to notably benefit from a reversal in broad commodity demand sentiment. A tactical relative value play appears to be an efficient expression.”
Demand expectations embedded in the complex is declining at a fast clip, TDS Senior Commodity Strategist Daniel Ghali notes.
Beijing to take a more forceful approach in driving domestic demand
“Our real-time gauge of demand expectations embedded in the complex is declining at a fast clip, even as the press conference that followed the Third Plenum revealed Beijing will take more forceful action in driving domestic demand in the coming weeks, with a focus on the consumer and housing sectors.”
“The first hints of such stimulus may come at the readout of the July State Politburo meeting chaired by President Xi at end-July, with key state agencies following up soon after. For the time being, demand signals are likely to drag the base metals complex lower, particularly as supply risk premia is unlikely to offer an offset this time around.”
“Commodity Trading Advisors (CTA) selling activity may be most pronounced in Aluminium, with algos potentially selling up to -30% of their max size if the downtape extends over the coming week.”
Positioning risks are asymmetrically skewed to the downside for the first time in months, TDS Senior Commodity Strategist Daniel Ghali notes
Positioning risks seem skewed to the downside
“Commodity Trading Advisors (CTAs) are now likely to sell over the next several sessions, even in a big uptape. In fact, rising asset vol may be most likely to contribute to pain for trend following algos, whereas the scope for additional CTA buying activity is marginal at best. This set-up suggests a major driver of the recent gains towards new all-time highs is now working in favor of downside in price action.”
“This time around, we also see signs that discretionary trader positioning is bloated relative to rates market expectations, with our analytics suggesting that the Trump trade may have attracted new length. While Shanghai traders were also adding to their Shanghai Futures Exchange (SHFE) Gold length over the last week, our tracking of the top participants' positions reveals substantial liquidations overnight.”
“Further, Asia is on a buyer’s strike in physical markets, as highlighted by the plummeting SGE premium. Our analysis of flows suggests the window for downside is open in the Yellow Metal, and a pause in Gold’s bull market could be in store.”
The Pound Sterling (GBP) losses have extended to the 1.29 area following weaker than expected UK Retail Sales data for June, Scotiabank’s chief FX strategist Shaun Osborne notes.
GBP needs to break above 1.2950 to continue rising
“Sales fell 1.2% in the month, against a consensus call for a 0.6% decline. The data have not shifted BoE rate cut expectations significantly, however, with swaps pricing still sitting on the fence (12bps priced in) for the August 1 meeting. GBP is losing a little more ground on the cross against the Euro (EUR) this morning and the cross may edge up to the mid-0.84 area before steadying.”
“Cable’s strong run higher through July so far may correct a little more in the short run. Intraday price signals suggest some demand is emerging on weakness to the 1.29 area but there is perhaps stronger technical support for the GBP in the 1.2860/80 zone. Gains back above 1.2950 resistance are needed to steady the short-term outlook for the GBP.”
- USD/INR concludes the week on a promising note as US Dollar extends its upside.
- The expectations for Donald Trump winning US presidential elections have increased.
- Union Budget on July 23 will be the next trigger for the Indian Rupee.
The USD/INR pair closes the week on a positive note near 83.70 on Friday. The asset strengthens as the US Dollar (USD) extends its recovery. The US Dollar Index (DXY), which tracks the Greenback’s value against six major currencies, recovers further to near 104.40.
The US Dollar rises as its safe-haven appeal improves amid growing speculation that Republicans will defeat Democratics in United States (US) presidential elections, scheduled for later this year. The expectations for Donald Trump winning elections rose after an assassination attack on him. Also, discussions that US President Joe Biden could drop his re-election bid due to medical conditions has prompted expectations of Trump coming out victorious.
Donald Trump is known for advocating protectionist trade policies, which results in lower imports and is a favorable situation for the US Dollar.
Also, US bond yields have risen despite investors see prospects of the Federal Reserve (Fed) to begin reducing interest rates from September as certain. 10-year US Treasury yields jump to near 4.24%.
The expectations for the Fed to pivoting to policy normalization rose due to easing price pressures and cooling labor market strength.
Meanwhile, the Indian Rupee depreciates amid weakness in Indian equity markets as profit-booking kicks in. The next trigger for the Indian Rupee will be Fiscal budget announcement, which is scheduled for July 23. Prime Minister Narendra Modi-led-NDA is expected to cut fiscal deficit target, which would be favorable for the Indian Rupee.
Indian Rupee FAQs
The Indian Rupee (INR) is one of the most sensitive currencies to external factors. The price of Crude Oil (the country is highly dependent on imported Oil), the value of the US Dollar – most trade is conducted in USD – and the level of foreign investment, are all influential. Direct intervention by the Reserve Bank of India (RBI) in FX markets to keep the exchange rate stable, as well as the level of interest rates set by the RBI, are further major influencing factors on the Rupee.
The Reserve Bank of India (RBI) actively intervenes in forex markets to maintain a stable exchange rate, to help facilitate trade. In addition, the RBI tries to maintain the inflation rate at its 4% target by adjusting interest rates. Higher interest rates usually strengthen the Rupee. This is due to the role of the ‘carry trade’ in which investors borrow in countries with lower interest rates so as to place their money in countries’ offering relatively higher interest rates and profit from the difference.
Macroeconomic factors that influence the value of the Rupee include inflation, interest rates, the economic growth rate (GDP), the balance of trade, and inflows from foreign investment. A higher growth rate can lead to more overseas investment, pushing up demand for the Rupee. A less negative balance of trade will eventually lead to a stronger Rupee. Higher interest rates, especially real rates (interest rates less inflation) are also positive for the Rupee. A risk-on environment can lead to greater inflows of Foreign Direct and Indirect Investment (FDI and FII), which also benefit the Rupee.
Higher inflation, particularly, if it is comparatively higher than India’s peers, is generally negative for the currency as it reflects devaluation through oversupply. Inflation also increases the cost of exports, leading to more Rupees being sold to purchase foreign imports, which is Rupee-negative. At the same time, higher inflation usually leads to the Reserve Bank of India (RBI) raising interest rates and this can be positive for the Rupee, due to increased demand from international investors. The opposite effect is true of lower inflation.
The European Central Bank (ECB) policy decision came and went as expected—no change in rates and little in terms of forward guidance beyond reaffirming ‘data dependency’, Scotiabank’s chief FX strategist Shaun Osborne notes.
EUR sees support in the mid/upper 1.08s
“The usual post-meeting leaks around the tone of policy discussion indicated that ECB policymakers may see limited room for additional cuts and might only be able to reduce interest rates once more this year. Markets are still leaning towards the idea of two more cuts (45bps priced in for the remainder of 2024) but swaps and the Euro (EUR) will be sensitive to data that may make the hawks’ case for proceeding cautiously any stronger.”
“The EUR has lost a little ground on the session but should see support in the mid/upper 1.08s in the short run. Just when the EUR looked set to extend gains, a big setback on the daily chart yesterday suggests more range trading for spot.”
“Underlying dynamics for the EUR have weakened a little following losses Thursday and (so far) today but the broader bullish picture remains intact. That should mean that EUR losses will be corrective and might be relatively shallow before renewed gains. Look for support on dips to the low/mid 1.08s now.”
The Canadian Dollar (CAD) has slipped a little in overnight trade, Scotiabank’s chief FX strategist Shaun Osborne notes.
Resistance above the market sits at 1.3750/55
“US Dollar (USD) gains are very marginal on the day but spot looks set to close net higher on the week for the first time since early June. After testing the recent range base around 1.36 last week, spot may drift a little higher in the near-term to test the early July high around 1.3750. Canadian Retail Sales are expected to decline 0.6% in May, in line with the flash estimate released with the April data last month."
"Ex-auto sales are forecast to fall 0.5% in the month. Weak data—while not a surprise—might solidify market expectations for a cut at next week’s BoC policy decision although the consensus forecast is narrowly divided and expects a 'hold'."
"Spot gains are holding close to yesterday’s peak in the USD around 1.3720 where potential trend resistance may be developing but gains through the low 1.37 zone do tilt near-term risks towards a bit more USD strength in the short run. Resistance above the market sits at 1.3750/55 and 1.3790/00. Intraday support is 1.3680/90."
- USD/CAD gains further to near 1.3750 after downbeat Canadian Retail Sales data for May.
- Canadian Retail Sales contracted at a faster-than-expected pace, boosting BoC’s subsequent rate-cut prospects.
- The US Dollar rises as prospects of Trump’s victory in the US presidential elections improve.
The USD/CAD pair climbs to near 1.3750 in Friday’s American session. The Loonie asset strengthens as weak Canadian Retail Sales for May add to triggers pointing to subsequent rate cuts by the Bank of Canada (BoC), and the US Dollar (USD) strengthens on expectations that Donald Trump will win the United States (US) presidential elections.
Statistics Canada showed that monthly Retail Sales contracted at a faster pace by 0.8% than estimates of 0.6%. Receipts at retail stores grew by 0.6% in April, downwardly revised from 0.7%. Retail Sales, excluding automobiles, declined sharply by 1.3% from expectations of a 0.5% cut, suggesting poor demand for core goods.
Canadian Retail Sales, a key measure to consumer spendings, indicate that households struggle to bear the consequences of BoC’s higher interest rate. This would open doors for further policy easing, which is an unfavorable scenario for the Canadian Dollar.
Meanwhile, more upside in the US Dollar has also improved the Loonie’s appeal. The US Dollar Index (DXY), which tracks the Greenback’s value against six major currencies, jumps higher to near 104.40. 10-year US Treasury yields rise to 4.24%.
In Friday’s session, investors will focus on the speeches from Federal Reserve (Fed) policymakers: New York Fed Bank President John Williams and Atlanta Fed Bank President Raphael Bostic are lined-up for speech. Investors will focus on cues about when the Fed will start cutting interest rates.
Economic Indicator
Retail Sales (MoM)
The Retail Sales data, released by Statistics Canada on a monthly basis, measures the total value of goods sold by retailers in Canada based on a sampling of retail stores of different types and sizes. Changes in Retail Sales are widely followed as an indicator of consumer spending. Percent changes reflect the rate of changes in such sales, with the MoM reading comparing sales values in the reference month with the previous month. Generally, a high reading is seen as bullish for the Canadian Dollar (CAD), while a low reading is seen as bearish.
Read more.Last release: Fri Jul 19, 2024 12:30
Frequency: Monthly
Actual: -0.8%
Consensus: -0.6%
Previous: 0.7%
Source: Statistics Canada
The Gold price rose to a record high this week, buoyed by expectations of early Federal Reserve (Fed) interest rate cuts, Commerzbank’s commodity strategist Carsten Fritsch notes.
Gold price is well supported at record levels
“According to Fed Fund Futures, the market expects a first rate cut in September, almost another one in November and a total of almost three rate cuts by the end of the year. This now seems very ambitious. Our economists do not expect the first Fed rate cut until December. Accordingly, we think the Gold price has already run too far ahead.”
“Since yesterday, the price has fallen again by around $60. However, the Gold price is now being supported by significant purchases from ETF investors, which argues against a further price decline. According to Bloomberg, there have been ETF inflows of 20 tons in the last six trading days. Since the beginning of the month, inflows into the Gold ETFs tracked by Bloomberg have totalled 33 tons.”
“The inflows now also extend to ETFs listed in the US, which still recorded outflows in June. The Gold price in Euros remained just below the record level of April. Similar to the Gold price in US dollars, it has receded from this level since yesterday.”
- Silver price plummets to near $29.00 on absence of big boost economic measures from China.
- Higher US Dollar due to expectations of Trump’s victory in US presidential elections has weighed on the Silver price.
- Silver price plunges after a decisive break below advancing trendline.
Silver price (XAG/USD) plummeted to near $29.00 in Friday’s American session. The white metal faces an intense sell-off as the outcome of China’s third plenum meeting had less stimulus measures to address economic challenges and was more focusing more on “high-quality development”.
World’s second-largest economy struggles to maintain the economic growth momentum due to poor demand from domestic and the overseas market. Therefore, investors were expecting big bold fiscal measures China’s Communist Party to uplift growth prospects.
Absence of strong fiscal measures to boost industrial output has weighed on the Silver price. The application of Silver, as a metal, has application in various sectors such as Electric Vehicles, medical appliances and consumer durables.
Meanwhile, a sharp recovery in the US Dollar (USD) due to growing speculation for Donald Trump’s victory in upcoming United States (US) presidential elections has also weighed on the Silver price. The US Dollar Index (DXY), which tracks the Greenback’s value against six major currencies, advances to near 104.30 after recovering from an almost four-month low of 103.65. Improved appeal of the US Dollar makes the Silver price an expensive bet for investors.
However, the Federal Reserve (Fed) is widely anticipated to start reducing interest rates from the September meeting. The expectations rose by cooling inflationary pressures and easing labor market strength.
Silver technical analysis
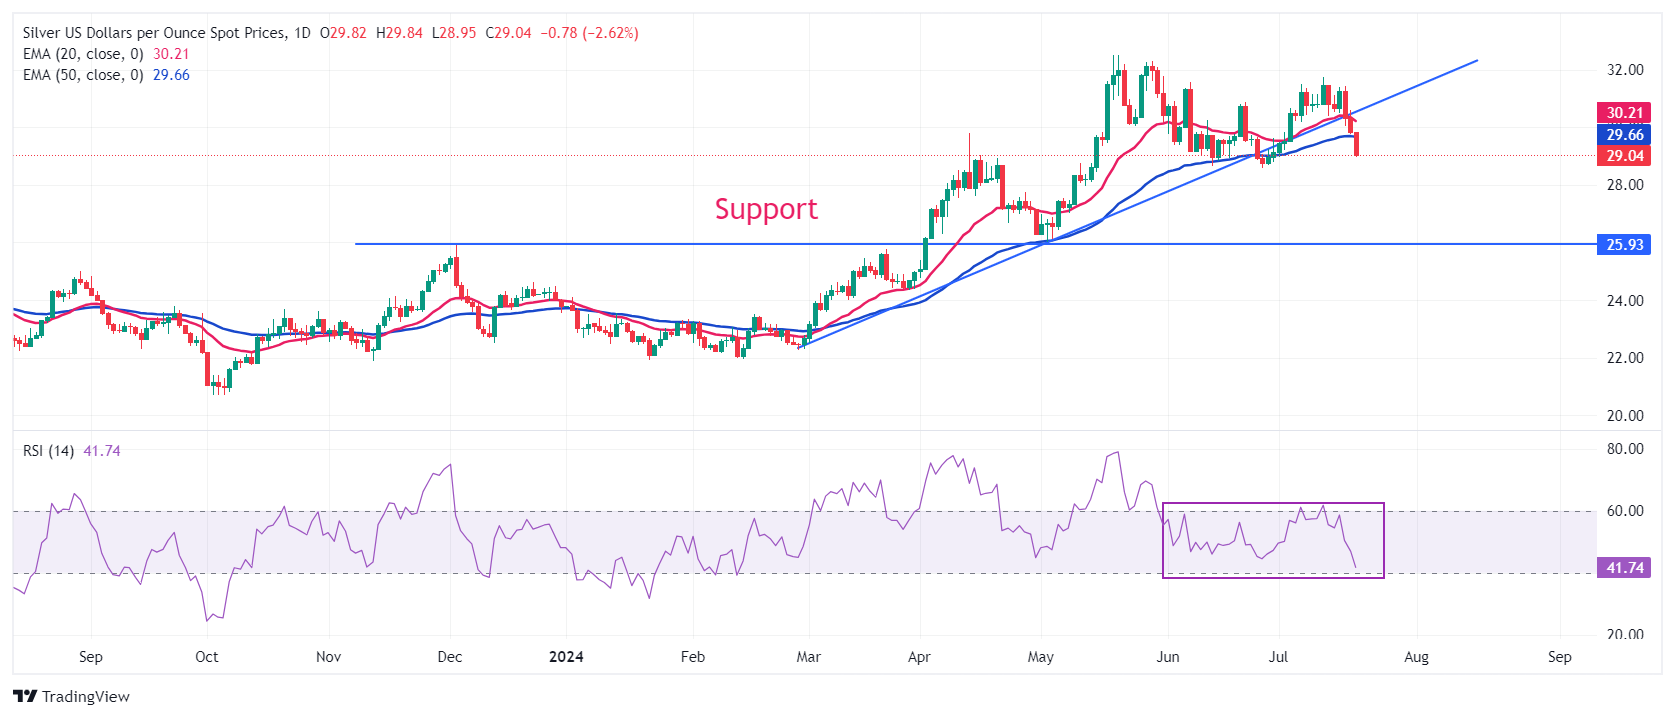
Silver price extends its losing streak for the third trading session on Friday. The white metal weakens after a breakdown below the upward-sloping trendline plotted from February 28 low at $22.28. The asset has dropped below the 20- and 50-day Exponential Moving Averages (EMAs), which trade around $30.20 and $29.66, respectively, suggesting that the near-term trend has turned bearish.
On the downside, 4 December 2023 high at $25.90 will be a major support zone for the Silver price.
The 14-day Relative Strength Index (RSI) oscillates in the 40.00-60.00 range, suggesting a sideways trend.
Silver daily chart
Silver FAQs
Silver is a precious metal highly traded among investors. It has been historically used as a store of value and a medium of exchange. Although less popular than Gold, traders may turn to Silver to diversify their investment portfolio, for its intrinsic value or as a potential hedge during high-inflation periods. Investors can buy physical Silver, in coins or in bars, or trade it through vehicles such as Exchange Traded Funds, which track its price on international markets.
Silver prices can move due to a wide range of factors. Geopolitical instability or fears of a deep recession can make Silver price escalate due to its safe-haven status, although to a lesser extent than Gold's. As a yieldless asset, Silver tends to rise with lower interest rates. Its moves also depend on how the US Dollar (USD) behaves as the asset is priced in dollars (XAG/USD). A strong Dollar tends to keep the price of Silver at bay, whereas a weaker Dollar is likely to propel prices up. Other factors such as investment demand, mining supply – Silver is much more abundant than Gold – and recycling rates can also affect prices.
Silver is widely used in industry, particularly in sectors such as electronics or solar energy, as it has one of the highest electric conductivity of all metals – more than Copper and Gold. A surge in demand can increase prices, while a decline tends to lower them. Dynamics in the US, Chinese and Indian economies can also contribute to price swings: for the US and particularly China, their big industrial sectors use Silver in various processes; in India, consumers’ demand for the precious metal for jewellery also plays a key role in setting prices.
Silver prices tend to follow Gold's moves. When Gold prices rise, Silver typically follows suit, as their status as safe-haven assets is similar. The Gold/Silver ratio, which shows the number of ounces of Silver needed to equal the value of one ounce of Gold, may help to determine the relative valuation between both metals. Some investors may consider a high ratio as an indicator that Silver is undervalued, or Gold is overvalued. On the contrary, a low ratio might suggest that Gold is undervalued relative to Silver.
Base metal prices remained under pressure this week: the Copper price slipped below $9,400 per ton yesterday. After all, market participants had to face some price-dampening news, Commerzbank’s commodity strategist Carsten Fritsch notes.
Copper stocks continue to rise
“The communiqué following the Third Plenum of the Communist Party in China was generally considered as vague. Some interpreted the emphasis on high-quality and innovative growth as a willingness to accept a slower pace of growth. Essentially, this indicates a continuation of the previous guidelines and there were no major surprises.”
“According to China's National Bureau of Statistics, refined Copper production rose slightly again in June and was therefore 3.6% higher than the previous year. This means that the correction, in the course of which Copper production had declined somewhat following the strong growth rates before, did not continue.”
“China's customs authority reported record-high exports of unwrought Copper and Copper products for the second month in a row in June. This indicates weak domestic demand. Copper stocks continue to rise: almost 230 thousand tons are now registered at the LME, 120% more than in May. Although Copper stocks on the Shanghai Future Exchange are no longer rising, they remain at a high level.”
The Joint Ministerial Monitoring Committee of OPEC+ (JMMC) is expected to reiterate confirm the decisions of the OPEC+ meeting from early June at its next meeting in early August, Commerzbank’s commodity strategist Carsten Fritsch notes.
Withdrawal of voluntary production cuts remains in place
“OPEC+’s JMMC is expected to confirm the decisions of the OPEC+ meeting from early June at its next meeting in early August. This was reported by Reuters, citing unnamed sources.”
“This means that the gradual withdrawal of voluntary production cuts planned from October will remain in place. However, these are subject to the condition that the market can absorb the additional supply, as Russian Deputy Prime Minister Novak emphasized this week.”
The Brent oil price initially fell to a monthly low of USD 83.5 per barrel this week as a result of the weak Chinese data. However, the price subsequently recovered, Commerzbank’s commodity strategist Carsten Fritsch notes.
A tight oil market is coming
The time spreads of the Brent forward curve widened over the course of the week. A significant price premium must therefore be paid for oil available at short notice, which indicates a tight oil market. This was also partially confirmed by the weekly inventory data from the American Petroleum Institute and the US Department of Energy.
According to the DOE, US crude oil inventories fell unexpectedly sharply by 4.9 million barrels in the last reporting week. This was the third consecutive weekly decline. The API had reported a decline in crude oil stocks of 4.4 million barrels the day before. However, gasoline and middle distillates saw a surprising stock build of 3.3 million and 3.5 million barrels respectively.
Net crude oil imports rose slightly compared to the previous week, while crude oil processing fell slightly but remained at a high level of just under 17 million barrels per day. In contrast, there was a significant decline in gasoline demand. This fell by around 600 thousand barrels per day compared to the previous week to less than 8.8 million barrels per day.
Communist Party leaders have been meeting for four days to discuss the broad outlines of economic reform for the next five years. And the result is: not much. The communique released yesterday contains only the usual slogans of recent months and years, such as ‘reform and opening up,’ ‘supply-side reform,’ or newer phrases like ‘new productive forces’ and ‘high-quality growth’, Commerzbank’s FX analyst Volkmar Baur notes.
Third plenum says nothing unexpected
“But, a change in thinking or new approaches are nowhere to be found. Detailed documents on the decisions taken will be published in the next few days. But even there, one will probably look in vain for ideas on how to support and revive private consumption. In the first half of this year, the Chinese economy grew by 5%. But 0.7 percentage points of that growth came from foreign trade alone.”
“This means that domestic demand grew by only 4.3%. This persistently weak domestic demand by Chinese standards is also reflected in persistently low inflation and falling government bond yields – except for the 10-year segment, where the central bank has announced that it may intervene to correct the situation.”
“As long as the domestic economy remains weak, the interest rate differential between Chinese and US Treasuries will remain high and the Chinese Yuan (CNY) will remain under pressure. For now, the only bright spot for the CNY is the upcoming interest rate cycle in the US, which should provide some relief for the CNY.
BoJ's interventions in recent days can best be described as ‘leaning against the wind’. But, at the moment, the wind continues to blow in the direction of a weaker Japanese Yen (JPY), Commerzbank’s FX analyst Volkmar Baur notes.
Inflation to fade away if the JPY stabilizes
“In addition to this week's disappointing services index, which showed a contraction in activity in May, the foreign trade figures were also unconvincing. One of the reasons for this was weaker imports, which does not bode well for a robust domestic economy. And last night's inflation was unchanged at 2.8% y/y, and actually rose slightly from 2.1% to 2.2% when fresh food and energy are excluded.”
“And momentum also picked up in June. However, core inflation remains below the central bank's target of 1.6%. And once we look at the details, an even more significant problem emerges. It is still mainly the prices of goods that are driving inflation, and not services as the Bank of Japan had hoped, which would indicate more "home-grown" inflation.”
“In the case of goods, it is still very likely that the depreciation of the JPY over the past 12 months is playing a role. If the JPY were to stabilize, this inflation driver would also be lost. The Bank of Japan must continue to hope that the headwind from US interest rates will fade significantly in the coming months, allowing the JPY to stabilize without having to constantly defend itself against it.”
The ECB decision and the subsequent press conference by ECB President Christine Lagarde were essentially non-events in terms of content. The ECB is largely satisfied with the inflation trend, Commerbank’s FX strategist Ulrich Leuchtmann notes.
September is when the next rate move is to come
“September is still the date on which the next interest rate move is highly likely to come. Everything went as expected, which is why market-based expectations of the ECB have hardly changed at all. The fact that EUR/USD had to give up the 1.0930 area during the press conference cannot seriously be explained by a surprise in Thursday's ECB communication.”
“We saw yesterday that the US Dollar (USD) weakness of the previous days was partially reversed. USD was able to regain ground yesterday against almost all G10 currencies. That part of the previous strength of the USD was due to the fact that all market participants believed that everyone else would assess the it as weaker. ‘Bubble’ is the technical term for such a phenomenon.”
“Ultimately, the market is a succession of larger and smaller bubbles. And in the long term it produces significantly less volatility than all attempts to set exchange rates by fiat. In any case, for such a bubble to burst, it is enough for EUR/USD not to rise any further and for some trivial event to occur, like an ECB press conference at which Lagarde says pretty much what was expected.”
- The US Dollar rises further as market participants see Donald Trump winning Presidential elections this year.
- Investors expect that the Fed cut interest rates twice this year.
- Fed Williams and Bostic are scheduled to speak on Friday.
The US Dollar (DXY), which tracks the Greenback’s value against six major currencies, extends its upside to near 104.30 in Friday’s European session after a sharp recovery from an almost four-month low of 103.65 this week. The US Dollar’s (USD) appeal improves amid deepening speculation that the United States (US) Republican Party will come into power in presidential elections scheduled later this year.
The assassination attempt on Donald Trump and expectations that US President Joe Biden could drop his re-election bid have increased the possibility of Republicans coming out victorious in elections.
Donald Trump is known for advocating tight trade policies, which lower the supply of the US Dollar in global markets and strengthen its appeal.
Meanwhile, the 10-year US Treasury yields have also recovered to near 4.21%. However, the broader outlook for the US Dollar and bond yields remains uncertain as investors see the prospects of the Federal Reserve (Fed) beginning to reduce interest rates in September as certain.
Cooling inflationary pressures and upside risks to US labor market strength have prompted Fed rate-cut bets. According to the CME FedWatch, 30-day Federal Funds Futures pricing data shows that traders have priced in a rate-cut move in September and a follow-up one in November or December.
In Friday’s session, Fed officials New York Fed Bank President John Williams and Atlanta Fed Bank President Raphael Bostic are lined up for speech. Investors will look for cues about whether two rate cut expectations are appropriate.
US Dollar FAQs
The US Dollar (USD) is the official currency of the United States of America, and the ‘de facto’ currency of a significant number of other countries where it is found in circulation alongside local notes. It is the most heavily traded currency in the world, accounting for over 88% of all global foreign exchange turnover, or an average of $6.6 trillion in transactions per day, according to data from 2022. Following the second world war, the USD took over from the British Pound as the world’s reserve currency. For most of its history, the US Dollar was backed by Gold, until the Bretton Woods Agreement in 1971 when the Gold Standard went away.
The most important single factor impacting on the value of the US Dollar is monetary policy, which is shaped by the Federal Reserve (Fed). The Fed has two mandates: to achieve price stability (control inflation) and foster full employment. Its primary tool to achieve these two goals is by adjusting interest rates. When prices are rising too quickly and inflation is above the Fed’s 2% target, the Fed will raise rates, which helps the USD value. When inflation falls below 2% or the Unemployment Rate is too high, the Fed may lower interest rates, which weighs on the Greenback.
In extreme situations, the Federal Reserve can also print more Dollars and enact quantitative easing (QE). QE is the process by which the Fed substantially increases the flow of credit in a stuck financial system. It is a non-standard policy measure used when credit has dried up because banks will not lend to each other (out of the fear of counterparty default). It is a last resort when simply lowering interest rates is unlikely to achieve the necessary result. It was the Fed’s weapon of choice to combat the credit crunch that occurred during the Great Financial Crisis in 2008. It involves the Fed printing more Dollars and using them to buy US government bonds predominantly from financial institutions. QE usually leads to a weaker US Dollar.
Quantitative tightening (QT) is the reverse process whereby the Federal Reserve stops buying bonds from financial institutions and does not reinvest the principal from the bonds it holds maturing in new purchases. It is usually positive for the US Dollar.
Silver prices (XAG/USD) fell on Friday, according to FXStreet data. Silver trades at $29.18 per troy ounce, down 2.14% from the $29.82 it cost on Thursday.
Silver prices have increased by 22.64% since the beginning of the year.
| Unit measure | Silver Price Today in USD |
|---|---|
| Troy Ounce | 29.18 |
| 1 Gram | 0.94 |
The Gold/Silver ratio, which shows the number of ounces of Silver needed to equal the value of one ounce of Gold, stood at 82.64 on Friday, up from 82.00 on Thursday.
Silver FAQs
Silver is a precious metal highly traded among investors. It has been historically used as a store of value and a medium of exchange. Although less popular than Gold, traders may turn to Silver to diversify their investment portfolio, for its intrinsic value or as a potential hedge during high-inflation periods. Investors can buy physical Silver, in coins or in bars, or trade it through vehicles such as Exchange Traded Funds, which track its price on international markets.
Silver prices can move due to a wide range of factors. Geopolitical instability or fears of a deep recession can make Silver price escalate due to its safe-haven status, although to a lesser extent than Gold's. As a yieldless asset, Silver tends to rise with lower interest rates. Its moves also depend on how the US Dollar (USD) behaves as the asset is priced in dollars (XAG/USD). A strong Dollar tends to keep the price of Silver at bay, whereas a weaker Dollar is likely to propel prices up. Other factors such as investment demand, mining supply – Silver is much more abundant than Gold – and recycling rates can also affect prices.
Silver is widely used in industry, particularly in sectors such as electronics or solar energy, as it has one of the highest electric conductivity of all metals – more than Copper and Gold. A surge in demand can increase prices, while a decline tends to lower them. Dynamics in the US, Chinese and Indian economies can also contribute to price swings: for the US and particularly China, their big industrial sectors use Silver in various processes; in India, consumers’ demand for the precious metal for jewellery also plays a key role in setting prices.
Silver prices tend to follow Gold's moves. When Gold prices rise, Silver typically follows suit, as their status as safe-haven assets is similar. The Gold/Silver ratio, which shows the number of ounces of Silver needed to equal the value of one ounce of Gold, may help to determine the relative valuation between both metals. Some investors may consider a high ratio as an indicator that Silver is undervalued, or Gold is overvalued. On the contrary, a low ratio might suggest that Gold is undervalued relative to Silver.
(An automation tool was used in creating this post.)
Third plenum reaffirms China’s focus on high quality development and deepening reforms across the economy. Market awaits more policy details from the third plenum and the upcoming politburo meeting, UOB Group economist Ho Woei Chen notes.
China pivots to domestic consumption and investment
“The communique reaffirms China’s focus on high quality development and deepening reforms across the economy, without announcing further stimulus for near-term growth.”
“Further deepening reform comprehensively to advance Chinese modernization was highlighted throughout the text. Policymakers will also accelerate efforts to build a unified national market and refine the systems underpinning the market economy which is increasingly important as China pivots to domestic consumption and investment to drive growth.”
“Market awaits more policy details from the third plenum and the upcoming politburo meeting end-Jul to provide more concrete measures to address the economic headwinds.”
- EUR/USD slumps to near 1.0870 amid multiple headwinds.
- ECB Villeroy sees prospects of two more rate cuts this year as appropriate.
- The US Dollar recovers amid speculation that Donald Trump will win the US presidential elections.
The EUR/USD pair corrects further to near 1.0870 in Friday’s European session. The major currency pair weakened due to multiple headwinds: firm speculation that the European Central Bank (ECB) will cut interest rates two times more this year and a sharp recovery in the US Dollar (USD).
On Thursday, the ECB left key rates unchanged at their current levels. ECB President Christine Lagarde refrained from committing to a pre-defined rate-cut path.
In Friday’s late Asian trading hours, ECB policymaker Francois Villeroy de Galhau said in an interview on French radio BFM Business that market expectations for the ECB delivering two more rate-cuts this year, with resuming the policy-tightening campaign from the September meeting and following in December as appropriate.
Meanwhile, ECB’s Survey of Professional Forecasters (SPF) showed on Friday that price pressures will remains close to 2.4% and will return to 2.0% in 2025 as projected by ECB Lagarde in the press conference on Thursday. The agency has cut growth target for 2025 to 0.7% from prior estimates of 0.5%.
On the other side of the Atlantic, the US Dollar bounces back strongly. The US Dollar Index (DXY), which tracks the Greenback’s value against six major currencies, moves higher to 104.30 from an almost four-month low of 103.70.
The US Dollar recovers amid growing speculation that Donald Trump will come out victorious in the United States (US) presidential elections later this year.
Economic Indicator
ECB Rate On Deposit Facility
One of the European Central Bank's three key interest rates, the rate on the deposit facility, is the rate at which banks earn interest when they deposit funds with the ECB. It is announced by the European Central Bank at each of its eight scheduled annual meetings.
Read more.Last release: Thu Jul 18, 2024 12:15
Frequency: Irregular
Actual: 3.75%
Consensus: 3.75%
Previous: 3.75%
Source: European Central Bank
Inflation in New Zealand slowed more than expected in 2Q24, and it is cooling faster than expected, UOB Group economist Lee Sue Ann notes.
Inflation cools down faster than expected
“Inflation in New Zealand slowed more than expected in 2Q24, to its weakest in three years. CPI rose 0.4% q/q in 2Q24, a tad lower from the 0.6% q/q reading in 1Q24. Compared to the same period a year ago, CPI eased to 3.3% y/y, from the 4.0% y/y reading in 1Q24.”
“Non-tradeable inflation, a closely watched indicator of domestic price pressures, also eased to 0.9% q/q from 1.6% q/q in 1Q24. Compared to the same period a year ago, non-tradable inflation came in at 5.4% y/y in 2Q24, compared to the previous reading of 5.8% y/y.”
“While inflation remains above the RBNZ’s 1%-3% target band, it is cooling faster than expected. This, alongside weakening momentum in the domestic economy, should provide some impetus for the central bank to begin easing later this year. We are currently maintaining our view for the first rate cut to occur in 4Q24 (Nov).”
The US Dollar (USD) is likely to trade in a range, probably between 7.2680 and 7.2880. Downward momentum is building again; USD must break and stay below 7.2600 before a decline to 7.2400 can be expected, UOB Group FX analysts Quek Ser Leang and Lee Sue Ann note.
Rangebound between 7.2680 and 7.2880
24-HOUR VIEW: “Yesterday, we held the view that ‘there is scope for USD to drop below 7.2600, but it might not be able to maintain a foothold below this level.’ USD subsequently dropped to 7.2611 and then rebounded to close largely unchanged (7.2787, +0.09%). Today, we expect USD to trade in a range, probably between 7.2680 and 7.2880.”
1-3 WEEKS VIEW: “Our update from yesterday (18 Jul, spot at 7.2680) is still valid. As highlighted, downward momentum is building, but USD must break and stay below 7.2600 before a decline to 7.2400 can be expected. The chance of USD breaking clearly below 7.2600 will remain intact provided that 7.2900 is not breached.”
The US Dollar (USD) could rebound further; overbought conditions suggest any advance is unlikely to break above 158.00. Nonetheless, a breach of 158.50 would suggest that the weakness in USD has stabilized, UOB Group FX analysts Quek Ser Leang and Lee Sue Ann note.
A break above 158.50 to signal USD stabilization
24-HOUR VIEW: “Our view for USD to decline further yesterday was incorrect. Instead of declining, USD rebounded strongly, closing on a firm note at 157.37 (+0.77%). While USD could rebound further today, overbought conditions suggest any advance is unlikely to break above 158.00. Support is at 156.90, followed by 156.30.”
1-3 WEEKS VIEW: “Last Friday (12 Jul, spot at 159.00), we highlighted that 'there is scope for JPY to continue to weaken, but it is too early to determine if the significant support level at 155.50 will come into view.' After USD broke below 155.50, we highlighted yesterday that 'the risk is for further USD weakness, and the level to watch is 154.50, followed by 153.95.' We did not expect the strong rebound and the subsequent firm daily close at 157.37 (+0.77%). From here, a breach of 158.50 (no change in ‘strong resistance’ level) would suggest that the weakness in USD has stabilized.”
The New Zealand Dollar (NZD) is likely to decline. The next support level is at 0.6005. The latter level is likely out of reach for now, UOB Group FX analysts Quek Ser Leang and Lee Sue Ann note.
Above 0.6085 the NZD is set to turn to the upside
24-HOUR VIEW: “We expected NZD to trade between 0.6045 and 0.6100 yesterday. NZD then traded in a range of 0.6044/0.6086, closing on a soft note at 0.6045 (-0.61%). Given the buildup in momentum, NZD is likely to decline today. Support levels are at 0.6030 and 0.6005. The latter level is likely out of reach for now. To maintain the buildup in momentum, NZD must not break above 0.6065 with minor resistance at 0.6055.”
1-3 WEEKS VIEW: “On Wednesday (17 Jul, spot at 0.6070), we highlighted that ‘downward momentum is building, but not sufficiently enough to suggest the start of a sustained decline.’ We also highlighted that NZD 'has to break and stay below 0.6030 before further weakness can be expected.' Yesterday, NZD fell to a low of 0.6044. Downward momentum has increased further, and the chance of NZD breaking below 0.6030 has also increased. The next level to watch below 0.6030 is 0.6005. On the upside, should NZD break above 0.6085 (‘strong resistance’ level previously at 0.6115), it would mean that the buildup in momentum has faded.”
The Australian Dollar (AUD) could dip below 0.6680; the next support at 0.6640 is highly unlikely to come into view today, UOB Group FX analysts Quek Ser Leang and Lee Sue Ann note.
The next support below 0.6680 is at 0.6640
24-HOUR VIEW: “We expected AUD to trade in a sideways range of 0.6710/0.6750 yesterday. However, it dropped to a low of 0.6698, closing on a soft note at 0.6706 (-0.33%). The decline has gathered momentum, and AUD could dip below 0.6680. The next support at 0.6640 is highly unlikely to come into view today. On the upside, 0.6735 is likely strong enough to cap any intraday rebound. Minor resistance is at 0.6720.”
1-3 WEEKS VIEW: “Two days ago (17 Jul, spot at 0.6730), we noted that ‘not only has the recent upward momentum faded, but downward momentum has also increased slightly.’ We expected AUD to trade with a downward bias, but we pointed out that ‘at this time, it does not appear to have enough momentum to break the major support at 0.6680.’ Yesterday, AUD fell to a low of 0.6698. Downward momentum has increased further, albeit not much. While there is scope for AUD to drop below 0.6680, it is too early to determine if there is enough momentum for it to reach 0.6640. On the upside, a breach of 0.6755 (‘strong resistance’ level previously at 0.6775) would indicate that AUD is not declining further.”
- Gold price falls further to near $2,410 as US political uncertainty boosts US Dollar’s appeal.
- US President Joe Biden could drop his re-election bid due to medical conditions.
- The Fed is widely anticipated to begin reducing interest rates in September.
Gold price (XAU/USD) extends its losing streak for the third trading day, declining to near $2,410 in Friday’s European session. The precious metal faces profit-booking after rallying to fresh all-time highs above $2,480 on Tuesday. The yellow metal has also been weighed down by a decent recovery in the US Dollar (USD) and bond yields amid growing speculation that the Republican Party will be victorious in the United States (US) Presidential elections later this year.
The expectations for Donald Trump returning as US President increased after an assassination attack on him. Meanwhile, increasing prospects that US President Joe Biden could drop his re-election bid due to medical conditions have also fuelled chances of Trump having a victory in the Presidential elections. Trump is known for favoring protectionist trade policies, which improves the US Dollar’s appeal.
The US Dollar Index (DXY), which tracks the Greenback’s value against six major currencies, bounces back to near 104.30. A higher US Dollar makes investment in Gold an expensive bet for investors. 10-year US Treasury yields jump to 4.21%. Higher yields on interest-bearing assets increase the opportunity cost of holding an investment in non-yielding assets, such as Gold.
Daily digest market movers: Gold price drops sharply while the near-term outlook remains firm
- Gold price slides further to near $2,410 amid strong recovery in the US Dollar. However, the near-term appeal of Gold remains firm as investors see expectations for the Federal Reserve (Fed) to begin reducing interest rates in September as certain.
- Expectations for the Fed to initiate a move toward policy normalization in September rose as policymakers gained slight confidence that inflation has returned on its path to the central bank’s target of 2%. However, officials still want to see more soft inflation data to gain greater confidence in lowering interest rates.
- Market speculation for Fed rate cuts was boosted by the June Consumer Price Index (CPI) reading, which signaled that the disinflation process has resumed after stalling in the first half of the year. Annual headline and core CPI, which excludes volatile food and energy prices, decelerated at a faster-than-expected pace. Meanwhile, monthly headline inflation deflated for the first time in more than four years.
- Apart from easing price pressures, cooling US labor market conditions have also uplifted Fed rate-cut prospects. The Unemployment Rate rose to 4.1% in June, the highest since November 2021. On Thursday, individuals claiming jobless benefits for the first time were higher than expectations for the week ending July 12. The Initial Jobless Claims came in at 243K, higher than estimates of 230K and the former release of 223K.
- Due to the absence of top-tier US data on Friday, investors will focus on speeches from Fed policymakers: New York Fed Bank President John Williams and Atlanta Fed Bank President Raphael Bostic are due to speak during the New York session. Investors will focus on cues about when the Fed will start cutting interest rates.
Technical Analysis: Gold price holds key EMAs
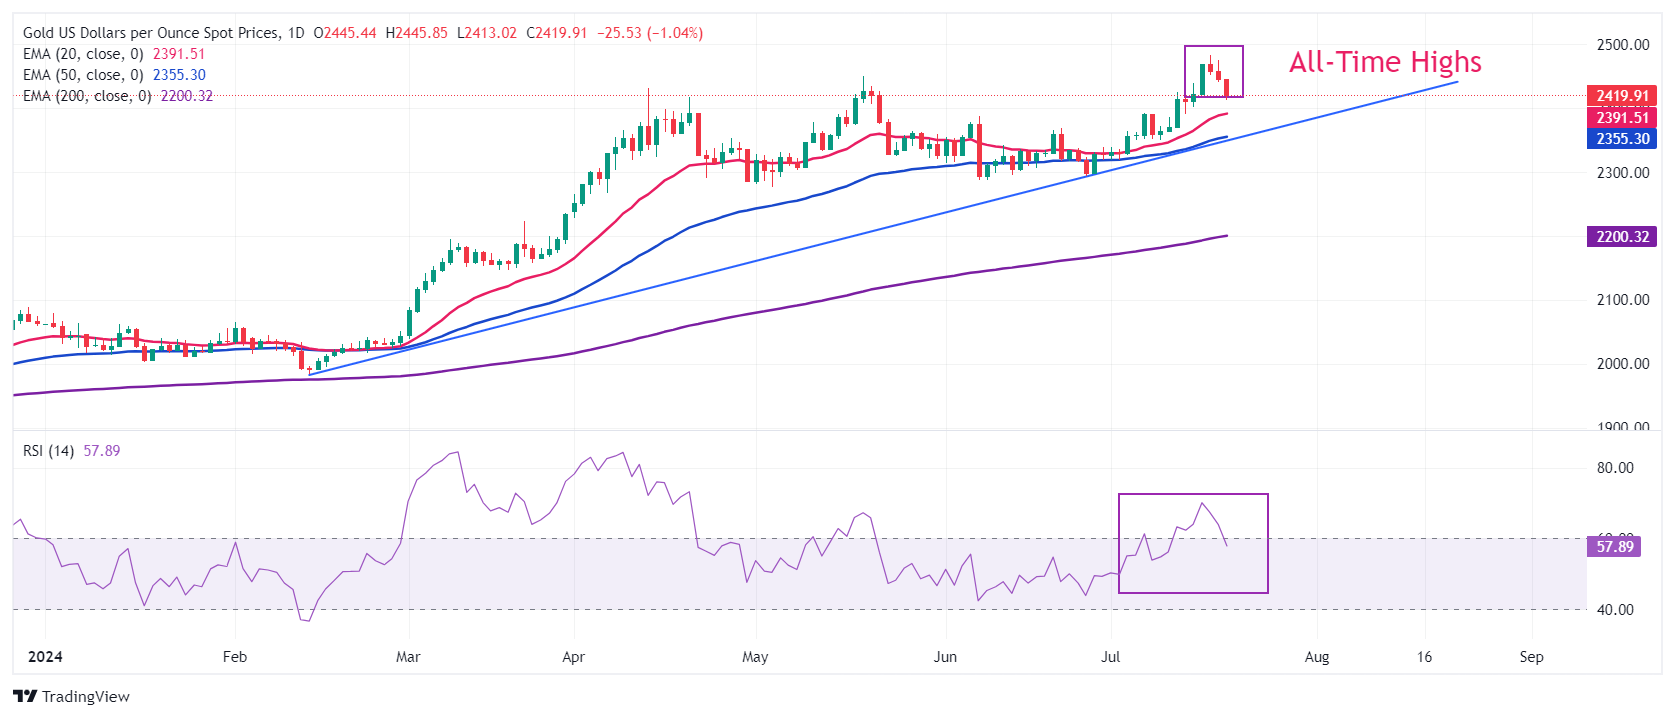
Gold price slides further to near $2,410 in Friday’s European session. The precious metal weakens after failing to sustain above the crucial figure of $2,450. The near-term outlook of the Gold price remains firm as short-to-long-term Exponential Moving Averages (EMAs) are sloping higher.
The advancing trendline plotted from the February 14 low at $1,984.30 will be a major support for Gold bulls.
The 14-day Relative Strength Index (RSI) drops to 58.00, suggesting the upside momentum has stalled. However, the upside bias remains intact.
Gold FAQs
Gold has played a key role in human’s history as it has been widely used as a store of value and medium of exchange. Currently, apart from its shine and usage for jewelry, the precious metal is widely seen as a safe-haven asset, meaning that it is considered a good investment during turbulent times. Gold is also widely seen as a hedge against inflation and against depreciating currencies as it doesn’t rely on any specific issuer or government.
Central banks are the biggest Gold holders. In their aim to support their currencies in turbulent times, central banks tend to diversify their reserves and buy Gold to improve the perceived strength of the economy and the currency. High Gold reserves can be a source of trust for a country’s solvency. Central banks added 1,136 tonnes of Gold worth around $70 billion to their reserves in 2022, according to data from the World Gold Council. This is the highest yearly purchase since records began. Central banks from emerging economies such as China, India and Turkey are quickly increasing their Gold reserves.
Gold has an inverse correlation with the US Dollar and US Treasuries, which are both major reserve and safe-haven assets. When the Dollar depreciates, Gold tends to rise, enabling investors and central banks to diversify their assets in turbulent times. Gold is also inversely correlated with risk assets. A rally in the stock market tends to weaken Gold price, while sell-offs in riskier markets tend to favor the precious metal.
The price can move due to a wide range of factors. Geopolitical instability or fears of a deep recession can quickly make Gold price escalate due to its safe-haven status. As a yield-less asset, Gold tends to rise with lower interest rates, while higher cost of money usually weighs down on the yellow metal. Still, most moves depend on how the US Dollar (USD) behaves as the asset is priced in dollars (XAU/USD). A strong Dollar tends to keep the price of Gold controlled, whereas a weaker Dollar is likely to push Gold prices up.
Room for Pound Sterling (GBP) to drop to 1.2915 before the risk of a rebound increases; the next support at 1.2860 is unlikely to come under threat, UOB Group FX analysts Quek Ser Leang and Lee Sue Ann note.
GBP may drop to 1.2915 in short-term
24-HOUR VIEW: “After GBP soared to 1.3043 on Wednesday and then pulled back, we indicated yesterday (Thursday) that ‘despite the advance, there is no significant increase in upward momentum, and GBP is unlikely to rise much further.’ We expected GBP to trade sideways between 1.2970 and 1.3045. However, instead of trading sideways, GBP dropped sharply, reaching a low of 1.2941. While the decline seems to be running ahead of itself, there is room for GBP to drop to 1.2915 before the risk of a rebound increases. The next support at 1.2860 is unlikely to come under threat. Resistance levels are at 1.2975 and 1.2995.”
1-3 WEEKS VIEW: “We have held a positive view in GBP since 04 Jul when it was trading at 1.2745 (see annotations in the chart below). We have been tracking the advance, and yesterday (18 Jul, spot at 1.3005), we indicated that ‘while the upside risk in GBP remains intact, conditions are severely overbought, and GBP might not reach 1.3100 this time around.’ We added, ‘a breach of 1.2940 would mean that GBP is not rising further.’ In NY trade, GBP fell to a low of 1.2941. While our ‘strong support’ level at 1.2940 has not been clearly breached yet, upward momentum has largely dissipated. In other words, the advance in GBP has come to an end. GBP has likely entered a consolidation phase, and it is likely to trade between 1.2850 and 1.3020 for the time being.”
The Euro (EUR) is expected to trade sideways between 1.0885 and 1.0935. Should EUR break below 1.0885, it would mean that the EUR strength from two weeks ago has come to an end, UOB Group FX analysts Quek Ser Leang and Lee Sue Ann note.
Below 1.0885 the EUR to become weak
24-HOUR VIEW: “Our expectation for EUR to test the significant resistance zone of 1.0970/1.0980 did not turn out, as EUR pulled back sharply, closing at 1.0896 (-0.37%). The pullback seems to be a bit overdone, and EUR is unlikely to weaken much further. Today, we expect EUR to trade sideways between 1.0885 and 1.0935.”
1-3 WEEKS VIEW: “Two days ago, EUR soared to a high of 1.0947. Yesterday (18 Jul, spot at 1.0940), we indicated that ‘the rejuvenated upward momentum suggests further EUR strength, even though the 1.0970/1.0980 zone is expected to pose significant resistance.’ We did not anticipate the subsequent sharp pullback that resulted in a rapid loss of momentum. Should EUR break below 1.0885 (no change in ‘strong support’ level), it would mean that the EUR strength that started two weeks ago has come to end.”
European Central Bank (ECB) policymaker Olli Rehn said Friday that “the ECB is not pre-committed to any rate path.”
Additional quotes
The risk of faster-than-expected inflation remains.
See near-term uncertainty on inflation slowdown.
See inflation slowing to the 2% target in the medium-term.
Inflation uncertainty underpins data dependence.
The latest findings from the European Central Bank’s (ECB) Survey of Professional Forecasters (SPF) showed on Friday that all inflation forecasts across the time horizons remained unchanged from the previous round of the poll conducted three months earlier.
Key takeaways
Growth is seen at 0.7% in 2025 vs. 0.5% seen earlier; the 2025 outlook cut to 1.3% from 1.4%.
Inflation is to average 2.4% in 2024 and 2.0% in 2025, both unchanged from the previous survey.
Inflation potentially seen falling to 1.9% by 2026.
Eurozone firms see moderate price hikes and slower wage growth.
Market reaction
At the time of writing, EUR/USD loses 0.15% on the day to trade at 1.0880.
European Central Bank (ECB) Governing Council member Gediminas Šimkus said on Friday “I agree with markets which see two more rate cuts this year.”
“Interest rates will keep getting lower, and quite significantly,” he added.
Further comments
Services inflation is still very strong.
Economic expansion is likely weaker than forecast.
There is no reason for cuts to exceed 25 bps each.
There is no doubt that the topic of a cut will be discussed in September.
A cut of 1% per year is significant.
Market reaction
EUR/USD is holding a lower ground on these above comments, testing 1.0880, down 0.13% on the day.
- USD/CHF has bounced back from its four-month low of 0.8820, which it hit on Thursday.
- The US Dollar continues to gain ground due to increased risk aversion.
- The Swiss Franc may struggle due to the expectations of the SNB reducing interest rates further.
USD/CHF gains ground for the second successive day, trading around 0.8880 during the European session on Friday. The USD/CHF pair has rebounded from a four-month low at 0.8820 recorded on Thursday. This upside of the pair can be attributed to the strengthening of the US Dollar amid increased risk aversion.
Additionally, The US Dollar is bolstered as US Treasury yields continue to improve. US Dollar Index (DXY), which measures the value of the US Dollar against the six other major currencies, trades around 104.30 with 2-year and 10-year yields on US Treasury bonds standing at 4.46% and 4.19%, respectively, at the time of writing.
However, the upside of the USD could be potentially constrained by soft labor data, which enhances market expectations for a Federal Reserve (Fed) rate cut in September. According to CME Group’s FedWatch Tool, markets now indicate a 93.5% probability of a 25-basis point rate cut at the September Fed meeting, up from 85.1% a week earlier.
US Initial Jobless Claims increased more than expected, data showed on Thursday, adding 243K new unemployment benefits seekers for the week ended July 12 compared to the expected 230K, and rising above the previous week’s revised 223K.
On the Swiss front, the expectation that the Swiss National Bank (SNB) might cut interest rates further could weigh on the Swiss Franc (CHF). In June, the SNB reduced its key interest rate by 25 basis points for the second consecutive meeting. This decision was driven by subdued inflationary pressures and the resilience of the CHF.
Kyle Chapman, FX markets analyst at Ballinger Group, stated, "I expect the SNB to follow up with a third cut next quarter, and there is potential for a fourth in December if there is still high conviction in the restrictive level of monetary policy."
Swiss Franc FAQs
The Swiss Franc (CHF) is Switzerland’s official currency. It is among the top ten most traded currencies globally, reaching volumes that well exceed the size of the Swiss economy. Its value is determined by the broad market sentiment, the country’s economic health or action taken by the Swiss National Bank (SNB), among other factors. Between 2011 and 2015, the Swiss Franc was pegged to the Euro (EUR). The peg was abruptly removed, resulting in a more than 20% increase in the Franc’s value, causing a turmoil in markets. Even though the peg isn’t in force anymore, CHF fortunes tend to be highly correlated with the Euro ones due to the high dependency of the Swiss economy on the neighboring Eurozone.
The Swiss Franc (CHF) is considered a safe-haven asset, or a currency that investors tend to buy in times of market stress. This is due to the perceived status of Switzerland in the world: a stable economy, a strong export sector, big central bank reserves or a longstanding political stance towards neutrality in global conflicts make the country’s currency a good choice for investors fleeing from risks. Turbulent times are likely to strengthen CHF value against other currencies that are seen as more risky to invest in.
The Swiss National Bank (SNB) meets four times a year – once every quarter, less than other major central banks – to decide on monetary policy. The bank aims for an annual inflation rate of less than 2%. When inflation is above target or forecasted to be above target in the foreseeable future, the bank will attempt to tame price growth by raising its policy rate. Higher interest rates are generally positive for the Swiss Franc (CHF) as they lead to higher yields, making the country a more attractive place for investors. On the contrary, lower interest rates tend to weaken CHF.
Macroeconomic data releases in Switzerland are key to assessing the state of the economy and can impact the Swiss Franc’s (CHF) valuation. The Swiss economy is broadly stable, but any sudden change in economic growth, inflation, current account or the central bank’s currency reserves have the potential to trigger moves in CHF. Generally, high economic growth, low unemployment and high confidence are good for CHF. Conversely, if economic data points to weakening momentum, CHF is likely to depreciate.
As a small and open economy, Switzerland is heavily dependent on the health of the neighboring Eurozone economies. The broader European Union is Switzerland’s main economic partner and a key political ally, so macroeconomic and monetary policy stability in the Eurozone is essential for Switzerland and, thus, for the Swiss Franc (CHF). With such dependency, some models suggest that the correlation between the fortunes of the Euro (EUR) and the CHF is more than 90%, or close to perfect.
Here is what you need to know on Friday, July 19:
The US Dollar (USD) benefited from the souring market mood on Thursday, with the USD Index gaining more than 0.4% on the day and erasing its weekly losses. The USD Index holds steady early Friday as investors await final comments from Federal Reserve officials before the blackout period starts on Saturday. During the American trading hours, Statistics Canada will release Retail Sales for May.
US Dollar PRICE This week
The table below shows the percentage change of US Dollar (USD) against listed major currencies this week. US Dollar was the strongest against the Australian Dollar.
| USD | EUR | GBP | JPY | CAD | AUD | NZD | CHF | |
|---|---|---|---|---|---|---|---|---|
| USD | 0.19% | 0.46% | -0.44% | 0.51% | 1.34% | 1.32% | -0.64% | |
| EUR | -0.19% | 0.31% | -0.45% | 0.52% | 1.18% | 1.32% | -0.63% | |
| GBP | -0.46% | -0.31% | -0.55% | 0.20% | 0.87% | 0.96% | -0.98% | |
| JPY | 0.44% | 0.45% | 0.55% | 0.96% | 1.57% | 1.74% | -0.41% | |
| CAD | -0.51% | -0.52% | -0.20% | -0.96% | 0.75% | 0.80% | -1.17% | |
| AUD | -1.34% | -1.18% | -0.87% | -1.57% | -0.75% | 0.14% | -1.83% | |
| NZD | -1.32% | -1.32% | -0.96% | -1.74% | -0.80% | -0.14% | -1.97% | |
| CHF | 0.64% | 0.63% | 0.98% | 0.41% | 1.17% | 1.83% | 1.97% |
The heat map shows percentage changes of major currencies against each other. The base currency is picked from the left column, while the quote currency is picked from the top row. For example, if you pick the US Dollar from the left column and move along the horizontal line to the Japanese Yen, the percentage change displayed in the box will represent USD (base)/JPY (quote).
Following the July meeting, the European Central Bank (ECB) announced that it left the key rates unchanged, as widely expected. During the post-meeting press conference, ECB President Christine Lagarde reiterated the data-dependent approach to policy and noted that they expect to reach the 2% inflation target in the second half of next year. Early Friday, some mixed comments from ECB officials seem to be making it difficult for the Euro to stay resilient against its rivals. At the time of press, EUR/USD was trading modestly lower on the day below 1.0900. In the meantime, Germany's Destatis announced earlier in the day that the Producer Price Index rose 0.2% on a monthly basis in June after staying unchanged in May.
The UK's Office for National Statistics reported on Friday that Retail Sales declined 1.2% on a monthly basis in June. This reading followed the 2.9% increase recorded in May and came in worse than the market expectation for a decrease of 0.4%. After losing 0.5% on Monday, GBP/USD continues to edge lower early Friday and was last seen trading below 1.2950.
The data from Japan showed that the National Consumer Price Index (CPI) rose 2.8% on a yearly basis in June, matching May's increase. The core CPI, which excludes volatile food and energy prices, rose 2.6% in the same period, compared to the market expectation of 2.7%. Following Wednesday's steep decline, USD/JPY gained traction and closed in positive territory on Thursday. The pair fluctuate in a tight range below 157.50 in the European morning.
Gold extended its downward correction and closed in negative territory for the second consecutive day on Thursday. XAU/USD stays under bearish pressure at the beginning of the European session on Friday and was last seen losing more than 1% on the day below $2,420.
Fed FAQs
Monetary policy in the US is shaped by the Federal Reserve (Fed). The Fed has two mandates: to achieve price stability and foster full employment. Its primary tool to achieve these goals is by adjusting interest rates. When prices are rising too quickly and inflation is above the Fed’s 2% target, it raises interest rates, increasing borrowing costs throughout the economy. This results in a stronger US Dollar (USD) as it makes the US a more attractive place for international investors to park their money. When inflation falls below 2% or the Unemployment Rate is too high, the Fed may lower interest rates to encourage borrowing, which weighs on the Greenback.
The Federal Reserve (Fed) holds eight policy meetings a year, where the Federal Open Market Committee (FOMC) assesses economic conditions and makes monetary policy decisions. The FOMC is attended by twelve Fed officials – the seven members of the Board of Governors, the president of the Federal Reserve Bank of New York, and four of the remaining eleven regional Reserve Bank presidents, who serve one-year terms on a rotating basis.
In extreme situations, the Federal Reserve may resort to a policy named Quantitative Easing (QE). QE is the process by which the Fed substantially increases the flow of credit in a stuck financial system. It is a non-standard policy measure used during crises or when inflation is extremely low. It was the Fed’s weapon of choice during the Great Financial Crisis in 2008. It involves the Fed printing more Dollars and using them to buy high grade bonds from financial institutions. QE usually weakens the US Dollar.
Quantitative tightening (QT) is the reverse process of QE, whereby the Federal Reserve stops buying bonds from financial institutions and does not reinvest the principal from the bonds it holds maturing, to purchase new bonds. It is usually positive for the value of the US Dollar.
“It's important that we wouldn't promise too much in advance,” European Central Bank (ECB) policymaker Madis Muller said on Friday.
Additional quotes
It's true that at least one more cut is expected by the market but I personally wouldn't comment.
There are still fluctuations on inflation.
Wage growth is not in line with the 2% target.
It's realistic that in next 12 months inflation will keep to decelerate.
The Eurozone economy should recover in coming quarters although the outlook deteriorated slightly.
- The Pound Sterling corrects further against the US Dollar after the release of the weaker-than-expected UK Retail Sales report for June.
- Doubts over the BoE to begin reducing interest rates from August remain afloat.
- The uncertainty over the US Presidential elections improves the safe-haven appeal of the US Dollar.
The Pound Sterling (GBP) extends its correction against majority of its peers in Friday’s London session. The British currency slides further as the United Kingdom (UK) Office for National Statistics (ONS) has reported weaker-than-expected Retail Sales data for June.
The report showed that monthly Retail Sales contracted at a faster pace of 1.2%. Economists estimated a decline by 0.4% against 2.9% growth in May. Annually, receipts at retail stores dipped by 0.2%, which were expected to have grown at a similar pace. Every retailer saw a sharp decline in sales receipts, except those who offers automotive fuel.
The Retail Sales data is a key measure of consumer spending, and a sharp decline in the same suggests that households struggle to bear the burden of higher interest rates by the Bank of England (BoE). However, individuals may not find any relief from higher interest obligations amid uncertainty over BoE rate cuts in August.
BoE officials hesitate to favor a move towards policy normalization due to the sticky US core Consumer Price Index (CPI) amid stubborn inflation in the service sector.
Meanwhile, the expected deceleration in Average Earnings data three-months-ending to May, a key measure to wage growth that prompts service inflation, fails to lift expectations for BoE rate cuts in August as the current pace is still higher what needs to be consistent for taming price pressures.
Daily digest market movers: Pound Sterling drops while US Dollar bounces back
- The Pound Sterling weakens to near 1.2930 against the US Dollar (USD) as the latter rebounds strongly after printing a fresh almost four-month low. The US Dollar Index (DXY), which tracks the Greenback’s value against six major currencies, bounces back from 103.65 and extends recovery to near 104.30.
- The safe-haven appeal for the US Dollar improves amid growing speculation that United States (US) President Joe Biden could drop his re-election bid. This has prompted upside risks to political uncertainty.
- However, the recovery move in the US Dollar is less-likely to long last as traders see Federal Reserve (Fed) reducing interest rates in September as a done deal. The Fed is also expected to cut borrowing rates twice this year instead of one as signalled by policymakers in the latest dot plot.
- In Friday’s session, policymakers, New York Fed Bank President John Williams and Atlanta Fed Bank President Raphael Bostic are lined-up for speech. Investors will focus on cues about when the Fed will start cutting interest rates.
- Meanwhile, the confidence of Fed officials that inflation has returned to the path of 2% has improved due to slower-than-expected growth in the US inflation and easing labor market conditions. Recent CPI readings from June month report showed that annual headline and core inflation decelerated at a faster-than-expected pace and monthly headline inflation declined for the first time in more than four years.
Technical Analysis: Pound Sterling falls to near 1.2930
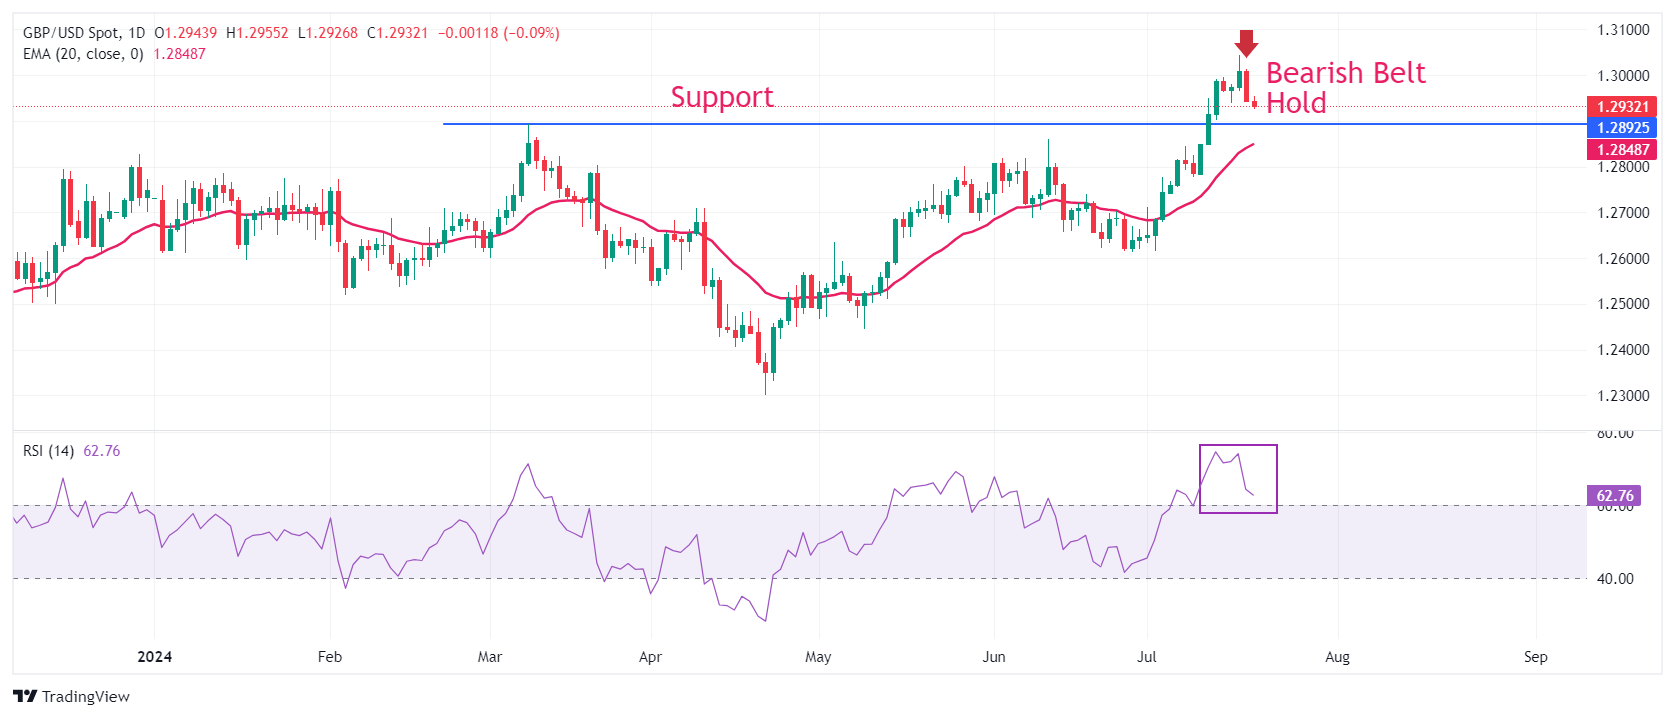
The Pound Sterling corrects sharply to near 1.2930 against the US Dollar. The GBP/USD pair weakens as the upside stalls after printing a fresh annual high at 1.3044 on Wednesday. The Cable has formed a Bearish Belt Hold candlestick pattern on a daily timeframe, a move that generally comes after a sharply rally. However, this alone is incapable of confirming a bearish reversal.
Upward-sloping 20-day Exponential Moving Average (EMA) near 1.2850 suggests that the uptrend is intact. The 14-day Relative Strength Index (RSI) declines after turning slightly overbought and is expected to find cushion near 60.00.
On the upside, two-year high near 1.3140 will be a key resistance zone for the Cable. While March 8 high near 1.2900 will be a key support for the Pound Sterling bulls, which used to be a resistance.
Pound Sterling FAQs
The Pound Sterling (GBP) is the oldest currency in the world (886 AD) and the official currency of the United Kingdom. It is the fourth most traded unit for foreign exchange (FX) in the world, accounting for 12% of all transactions, averaging $630 billion a day, according to 2022 data. Its key trading pairs are GBP/USD, aka ‘Cable’, which accounts for 11% of FX, GBP/JPY, or the ‘Dragon’ as it is known by traders (3%), and EUR/GBP (2%). The Pound Sterling is issued by the Bank of England (BoE).
The single most important factor influencing the value of the Pound Sterling is monetary policy decided by the Bank of England. The BoE bases its decisions on whether it has achieved its primary goal of “price stability” – a steady inflation rate of around 2%. Its primary tool for achieving this is the adjustment of interest rates. When inflation is too high, the BoE will try to rein it in by raising interest rates, making it more expensive for people and businesses to access credit. This is generally positive for GBP, as higher interest rates make the UK a more attractive place for global investors to park their money. When inflation falls too low it is a sign economic growth is slowing. In this scenario, the BoE will consider lowering interest rates to cheapen credit so businesses will borrow more to invest in growth-generating projects.
Data releases gauge the health of the economy and can impact the value of the Pound Sterling. Indicators such as GDP, Manufacturing and Services PMIs, and employment can all influence the direction of the GBP. A strong economy is good for Sterling. Not only does it attract more foreign investment but it may encourage the BoE to put up interest rates, which will directly strengthen GBP. Otherwise, if economic data is weak, the Pound Sterling is likely to fall.
Another significant data release for the Pound Sterling is the Trade Balance. This indicator measures the difference between what a country earns from its exports and what it spends on imports over a given period. If a country produces highly sought-after exports, its currency will benefit purely from the extra demand created from foreign buyers seeking to purchase these goods. Therefore, a positive net Trade Balance strengthens a currency and vice versa for a negative balance.
- USD/INR could test an all-time high of 83.7190 level.
- The Indian Rupee could limit its downside as traders expect potential for intervention by the RBI.
- The US Dollar continues to gain ground due to increased risk aversion.
USD/INR continues to appreciate, trading around 83.60 during the early European session on Friday. The Indian Rupee (INR) has avoided testing an all-time low at 83.7190 against the US Dollar (USD), likely due to anticipated intervention by the Reserve Bank of India (RBI), according to market participants.
The upside of the USD/INR pair can be attributed to the strengthening of the US Dollar amid increased risk aversion. The Greenback is also bolstered as US Treasury yields continue to improve. However, the USD's upside potential may be constrained by soft labor data, which enhances market expectations for a Federal Reserve (Fed) rate cut in September.
US Initial Jobless Claims increased more than expected, data showed on Thursday, adding 243K new unemployment benefits seekers for the week ended July 12 compared to the expected 230K, and rising above the previous week’s revised 223K.
On the INR front, traders are likely awaiting the release of India's FX Reserves (USD) data for the week ending July 8, scheduled for Friday. Additionally, attention is focused on the Union Budget 2024-25, which will be presented to parliament next week.
Earlier this week, the International Monetary Fund (IMF) revised its economic forecast for India, now projecting a growth rate of 7% for this year, up from the 6.8% forecast in April. This adjustment is attributed to stronger consumer spending in rural areas.
Indian Rupee FAQs
The Indian Rupee (INR) is one of the most sensitive currencies to external factors. The price of Crude Oil (the country is highly dependent on imported Oil), the value of the US Dollar – most trade is conducted in USD – and the level of foreign investment, are all influential. Direct intervention by the Reserve Bank of India (RBI) in FX markets to keep the exchange rate stable, as well as the level of interest rates set by the RBI, are further major influencing factors on the Rupee.
The Reserve Bank of India (RBI) actively intervenes in forex markets to maintain a stable exchange rate, to help facilitate trade. In addition, the RBI tries to maintain the inflation rate at its 4% target by adjusting interest rates. Higher interest rates usually strengthen the Rupee. This is due to the role of the ‘carry trade’ in which investors borrow in countries with lower interest rates so as to place their money in countries’ offering relatively higher interest rates and profit from the difference.
Macroeconomic factors that influence the value of the Rupee include inflation, interest rates, the economic growth rate (GDP), the balance of trade, and inflows from foreign investment. A higher growth rate can lead to more overseas investment, pushing up demand for the Rupee. A less negative balance of trade will eventually lead to a stronger Rupee. Higher interest rates, especially real rates (interest rates less inflation) are also positive for the Rupee. A risk-on environment can lead to greater inflows of Foreign Direct and Indirect Investment (FDI and FII), which also benefit the Rupee.
Higher inflation, particularly, if it is comparatively higher than India’s peers, is generally negative for the currency as it reflects devaluation through oversupply. Inflation also increases the cost of exports, leading to more Rupees being sold to purchase foreign imports, which is Rupee-negative. At the same time, higher inflation usually leads to the Reserve Bank of India (RBI) raising interest rates and this can be positive for the Rupee, due to increased demand from international investors. The opposite effect is true of lower inflation.
European Central Bank (ECB) Governing Council member and Bank of France President, Francois Villeroy de Galhau, commented on the inflation and interest rate outlook on Friday.
Key quotes
Market expectations on rates seem rather reasonable.
Disinflation is happening as predicted.
Inflation will continue to decline a bit slower.
We are watching services inflation carefully.
Rate decisions will depend on data.
There is more uncertainty on growth than a few months ago.
Market reaction
EUR/USD was last seen trading at 1.0887, down 0.07% on the day.
- EUR/GBP shows no movement after the release of weaker-than-expected UK Retail Sales on Friday.
- UK Retail Sales fell by 1.2% month-over-month in June, compared to the projected 0.4% decline.
- ECB President Lagarde provided no hints about the stance for the next meeting, stating that September was "wide open."
EUR/GBP holds mild gains around 0.8420 during the Asian session following the release of UK Retail Sales data on Friday. The volume of sales of goods by retailers fell by 1.2% month-over-month in June, reversing the 2.9% increase seen in May, according to the Office for National Statistics (ONS). This decline was steeper than the projected 0.4% drop.
UK Retail Sales decreased by 0.2% year-over-year in June, compared to a 1.3% increase in May. Core Retail Sales also fell by 0.8% YoY in June, down from a 1.2% growth in the previous month, missing expectations. Additionally, the GfK Group Consumer Confidence Index for July showed a decline to -13 from -14, falling short of the forecasted -12.
Investors have been pricing out the possibility of a Bank of England (BoE) rate cut following Wednesday's final UK Consumer Price Index (CPI) inflation figures, which met forecasts. However, a larger-than-expected drop in the UK Producer Price Index (PPI) inflation briefly pressured the British Pound.
On the EUR front, Germany's Producer Price Index (PPI) increased by 0.2% month-over-month in June, surpassing the anticipated 0.1% rise. Year-over-year, PPI fell by 1.6% in June, meeting expectations and improving from the previous 2.2% decline.
On Thursday, the European Central Bank (ECB) decided to maintain its main refinancing rate at 4.25%, as expected, at its July Monetary Policy Meeting. The ECB's deposit facility rate also remains unchanged at 3.75%.
At the press conference following the interest rate decision, ECB President Christine Lagarde stated, "The question of September and what we do in September is wide open." Lagarde also noted that the monetary policy decision had been unanimous and emphasized the central bank's commitment to relying on a range of data rather than any single data point, according to Reuters.
Economic Indicator
Retail Sales (MoM)
The Retail Sales data, released by the Office for National Statistics on a monthly basis, measures the volume of sales of goods by retailers in Great Britain directly to end customers. Changes in Retail Sales are widely followed as an indicator of consumer spending. Percent changes reflect the rate of changes in such sales, with the MoM reading comparing sales volumes in the reference month with the previous month. Generally, a high reading is seen as bullish for the Pound Sterling (GBP), while a low reading is seen as bearish.
Read more.Last release: Fri Jul 19, 2024 06:00
Frequency: Monthly
Actual: -1.2%
Consensus: -0.4%
Previous: 2.9%
Source: Office for National Statistics
- The UK Retail Sales dropped 1.2% MoM in June, a big beat.
- Monthly Core Retail Sales for the UK fell 1.5% in June.
- GBP/USD stays defensive below 1.2950 after downbeat UK data.
The United Kingdom (UK) Retail Sales dropped 1.2% over the month in June after rebounding 2.9% in May, the latest data published by the Office for National Statistics (ONS) showed Friday. Markets projected a 0.4% decline in the reported month.
The Core Retail Sales, stripping the auto motor fuel sales, declined by 1.5% MoM, against the previous jump of 2.9% and the estimated -0.5% print.
The annual Retail Sales in the UK dipped by 0.2% in June versus May’s 1.3% growth while the Core Retail Sales decreased by 0.8% in the same month versus +1.2% previous. Both figures fell short of expectations.
Market reaction to UK Retail Sales report
GBP/USD is unmoved by the downbeat UK data release, modestly flat on the day near 1.2935, as of writing.
British Pound PRICE Today
The table below shows the percentage change of British Pound (GBP) against listed major currencies today. British Pound was the weakest against the Canadian Dollar.
| USD | EUR | GBP | JPY | CAD | AUD | NZD | CHF | |
|---|---|---|---|---|---|---|---|---|
| USD | 0.07% | 0.06% | 0.25% | 0.00% | 0.08% | 0.22% | 0.17% | |
| EUR | -0.07% | -0.01% | 0.17% | -0.10% | 0.00% | 0.16% | 0.11% | |
| GBP | -0.06% | 0.00% | 0.02% | -0.09% | 0.02% | 0.18% | 0.11% | |
| JPY | -0.25% | -0.17% | -0.02% | -0.25% | -0.15% | -0.00% | -0.06% | |
| CAD | -0.00% | 0.10% | 0.09% | 0.25% | 0.08% | 0.24% | 0.17% | |
| AUD | -0.08% | -0.01% | -0.02% | 0.15% | -0.08% | 0.15% | 0.09% | |
| NZD | -0.22% | -0.16% | -0.18% | 0.00% | -0.24% | -0.15% | -0.07% | |
| CHF | -0.17% | -0.11% | -0.11% | 0.06% | -0.17% | -0.09% | 0.07% |
The heat map shows percentage changes of major currencies against each other. The base currency is picked from the left column, while the quote currency is picked from the top row. For example, if you pick the British Pound from the left column and move along the horizontal line to the US Dollar, the percentage change displayed in the box will represent GBP (base)/USD (quote).
Gold prices fell in India on Friday, according to data compiled by FXStreet.
The price for Gold stood at 6,520.12 Indian Rupees (INR) per gram, down compared with the INR 6,574.43 it cost on Thursday.
The price for Gold decreased to INR 76,048.16 per tola from INR 76,682.83 per tola a day earlier.
| Unit measure | Gold Price in INR |
|---|---|
| 1 Gram | 6,520.12 |
| 10 Grams | 65,202.19 |
| Tola | 76,048.16 |
| Troy Ounce | 202,801.10 |
FXStreet calculates Gold prices in India by adapting international prices (USD/INR) to the local currency and measurement units. Prices are updated daily based on the market rates taken at the time of publication. Prices are just for reference and local rates could diverge slightly.
Gold FAQs
Gold has played a key role in human’s history as it has been widely used as a store of value and medium of exchange. Currently, apart from its shine and usage for jewelry, the precious metal is widely seen as a safe-haven asset, meaning that it is considered a good investment during turbulent times. Gold is also widely seen as a hedge against inflation and against depreciating currencies as it doesn’t rely on any specific issuer or government.
Central banks are the biggest Gold holders. In their aim to support their currencies in turbulent times, central banks tend to diversify their reserves and buy Gold to improve the perceived strength of the economy and the currency. High Gold reserves can be a source of trust for a country’s solvency. Central banks added 1,136 tonnes of Gold worth around $70 billion to their reserves in 2022, according to data from the World Gold Council. This is the highest yearly purchase since records began. Central banks from emerging economies such as China, India and Turkey are quickly increasing their Gold reserves.
Gold has an inverse correlation with the US Dollar and US Treasuries, which are both major reserve and safe-haven assets. When the Dollar depreciates, Gold tends to rise, enabling investors and central banks to diversify their assets in turbulent times. Gold is also inversely correlated with risk assets. A rally in the stock market tends to weaken Gold price, while sell-offs in riskier markets tend to favor the precious metal.
The price can move due to a wide range of factors. Geopolitical instability or fears of a deep recession can quickly make Gold price escalate due to its safe-haven status. As a yield-less asset, Gold tends to rise with lower interest rates, while higher cost of money usually weighs down on the yellow metal. Still, most moves depend on how the US Dollar (USD) behaves as the asset is priced in dollars (XAU/USD). A strong Dollar tends to keep the price of Gold controlled, whereas a weaker Dollar is likely to push Gold prices up.
(An automation tool was used in creating this post.)
FX option expiries for July 19 NY cut at 10:00 Eastern Time, via DTCC, can be found below.
EUR/USD: EUR amounts
- 1.0900 936m
- 1.0950 1.2b
- 1.0970 587m
- 1.0975 434m
GBP/USD: GBP amounts
- 1.2850 646m
- 1.2975 414m
USD/JPY: USD amounts
- 157.00 621m
- 158.00 546m
- 158.85 450m
USD/CHF: USD amounts
- 0.8800 1.1b
- 0.8950 662m
- 0.9075 750m
AUD/USD: AUD amounts
- 0.6765 520m
- 0.6850 603m
USD/CAD: USD amounts
- 1.3525 1.4b
- 1.3675 403m
NZD/USD: NZD amounts
- 0.6050 527m
- WTI price extends losses as the US Dollar improves due to increased risk-off sentiment.
- Oil traders wrestle with mixed signals regarding global demand concerns and rising expectations of the Fed reducing rates.
- Higher US Treasury yields support the strength of the Greenback.
West Texas Intermediate (WTI) Oil price continues to decline, driven by a widespread selloff in risk assets and a stronger US Dollar (USD). During the Asian session on Friday, WTI trades around $80.60 per barrel during the Asian session on Friday. Investors grapple with mixed signals regarding crude demand, amid concerns over a potential global economic slowdown and rising expectations that the Federal Reserve may soon lower interest rates.
US Initial Jobless Claims increased more than expected, data showed on Thursday, adding 243K new unemployment benefits seekers for the week ended July 12 compared to the expected 230K, and rising above the previous week’s revised 223K. Soft labor data, which enhances market expectations for a Federal Reserve (Fed) rate cut in September, which could spur more spending on Oil.
On Wednesday, Fed Governor Christopher Waller said that the US central bank is ‘getting closer’ to an interest rate cut. Meanwhile, Richmond Fed President Thomas Barkin stated that easing in inflation had begun to broaden and he would like to see it continue,” per Reuters.
Crude Oil prices may face challenges due to a slowing Chinese economy in the second quarter, which impacts demand from the world's largest Oil-importing country. On Thursday, Chinese leaders indicated that Beijing would maintain its current economic policies, but provided few specific details.
China's Third Plenary Session concluded on Thursday with a lack of concrete measures to revitalize the faltering economy, failing to alleviate demand concerns from the top Oil importer. A senior Chinese official for economic affairs noted that China's economic recovery is not robust enough and emphasized the need for more effective implementation of macroeconomic policies, according to Reuters.
WTI Oil FAQs
WTI Oil is a type of Crude Oil sold on international markets. The WTI stands for West Texas Intermediate, one of three major types including Brent and Dubai Crude. WTI is also referred to as “light” and “sweet” because of its relatively low gravity and sulfur content respectively. It is considered a high quality Oil that is easily refined. It is sourced in the United States and distributed via the Cushing hub, which is considered “The Pipeline Crossroads of the World”. It is a benchmark for the Oil market and WTI price is frequently quoted in the media.
Like all assets, supply and demand are the key drivers of WTI Oil price. As such, global growth can be a driver of increased demand and vice versa for weak global growth. Political instability, wars, and sanctions can disrupt supply and impact prices. The decisions of OPEC, a group of major Oil-producing countries, is another key driver of price. The value of the US Dollar influences the price of WTI Crude Oil, since Oil is predominantly traded in US Dollars, thus a weaker US Dollar can make Oil more affordable and vice versa.
The weekly Oil inventory reports published by the American Petroleum Institute (API) and the Energy Information Agency (EIA) impact the price of WTI Oil. Changes in inventories reflect fluctuating supply and demand. If the data shows a drop in inventories it can indicate increased demand, pushing up Oil price. Higher inventories can reflect increased supply, pushing down prices. API’s report is published every Tuesday and EIA’s the day after. Their results are usually similar, falling within 1% of each other 75% of the time. The EIA data is considered more reliable, since it is a government agency.
OPEC (Organization of the Petroleum Exporting Countries) is a group of 13 Oil-producing nations who collectively decide production quotas for member countries at twice-yearly meetings. Their decisions often impact WTI Oil prices. When OPEC decides to lower quotas, it can tighten supply, pushing up Oil prices. When OPEC increases production, it has the opposite effect. OPEC+ refers to an expanded group that includes ten extra non-OPEC members, the most notable of which is Russia.
- Silver drifts lower for the third straight day on Friday and drops to over a two-week low.
- The technical setup favors bearish traders and supports prospects for a further downfall.
- A move beyond the $30.30-$30.40 support-turned-resistance will negate the negative bias.
Silver (XAG/USD) remains under some selling pressure for the third successive day on Friday and touches a two-and-half-week trough during the Asian session. The white metal currently trades around the $29.55-$29.60 region, down 0.80% for the day and the technical setup supports prospects for a further near-term depreciating move.
Against the backdrop of the recent failure to build on the momentum beyond the $31.40 supply zone, this week's breakdown through a short-term trading range support was seen as a fresh trigger for bearish traders. Moreover, oscillators on the daily chart have just started gaining negative traction and suggest that the path of least resistance for the XAG/USD remains to the downside.
Hence, a subsequent slide towards testing the next relevant support near the $29.15 region, en route to the $29.00 mark, looks like a distinct possibility. Some follow-through selling below the latter might expose the June monthly swing low, around the $28.60-$28.55 area. The XAG/USD could eventually drop to the 100-day Simple Moving Average (SMA), currently pegged near the $28.00 mark.
On the flip side, any attempted recovery might confront some hurdle near the Asian session peak, around the $29.80 region. This is closely followed by the $30.00 psychological mark, above which a bout of a short-covering move could lift the XAG/USD back to the $30.30-$30.40 trading range support breakpoint, now turned resistance. The momentum could extend towards the $31.00 round figure.
A sustained strength beyond the latter will negate any near-term negative bias and lift the XAG/USD back towards the $31.40 supply zone. Some follow-through buying, leading to a subsequent move beyond the monthly peak, around the $31.80 area, should allow bulls to retake the $32.00 mark and challenge the YTD peak, near the mid-$32.00s touched in May.
Silver 4-hour chart
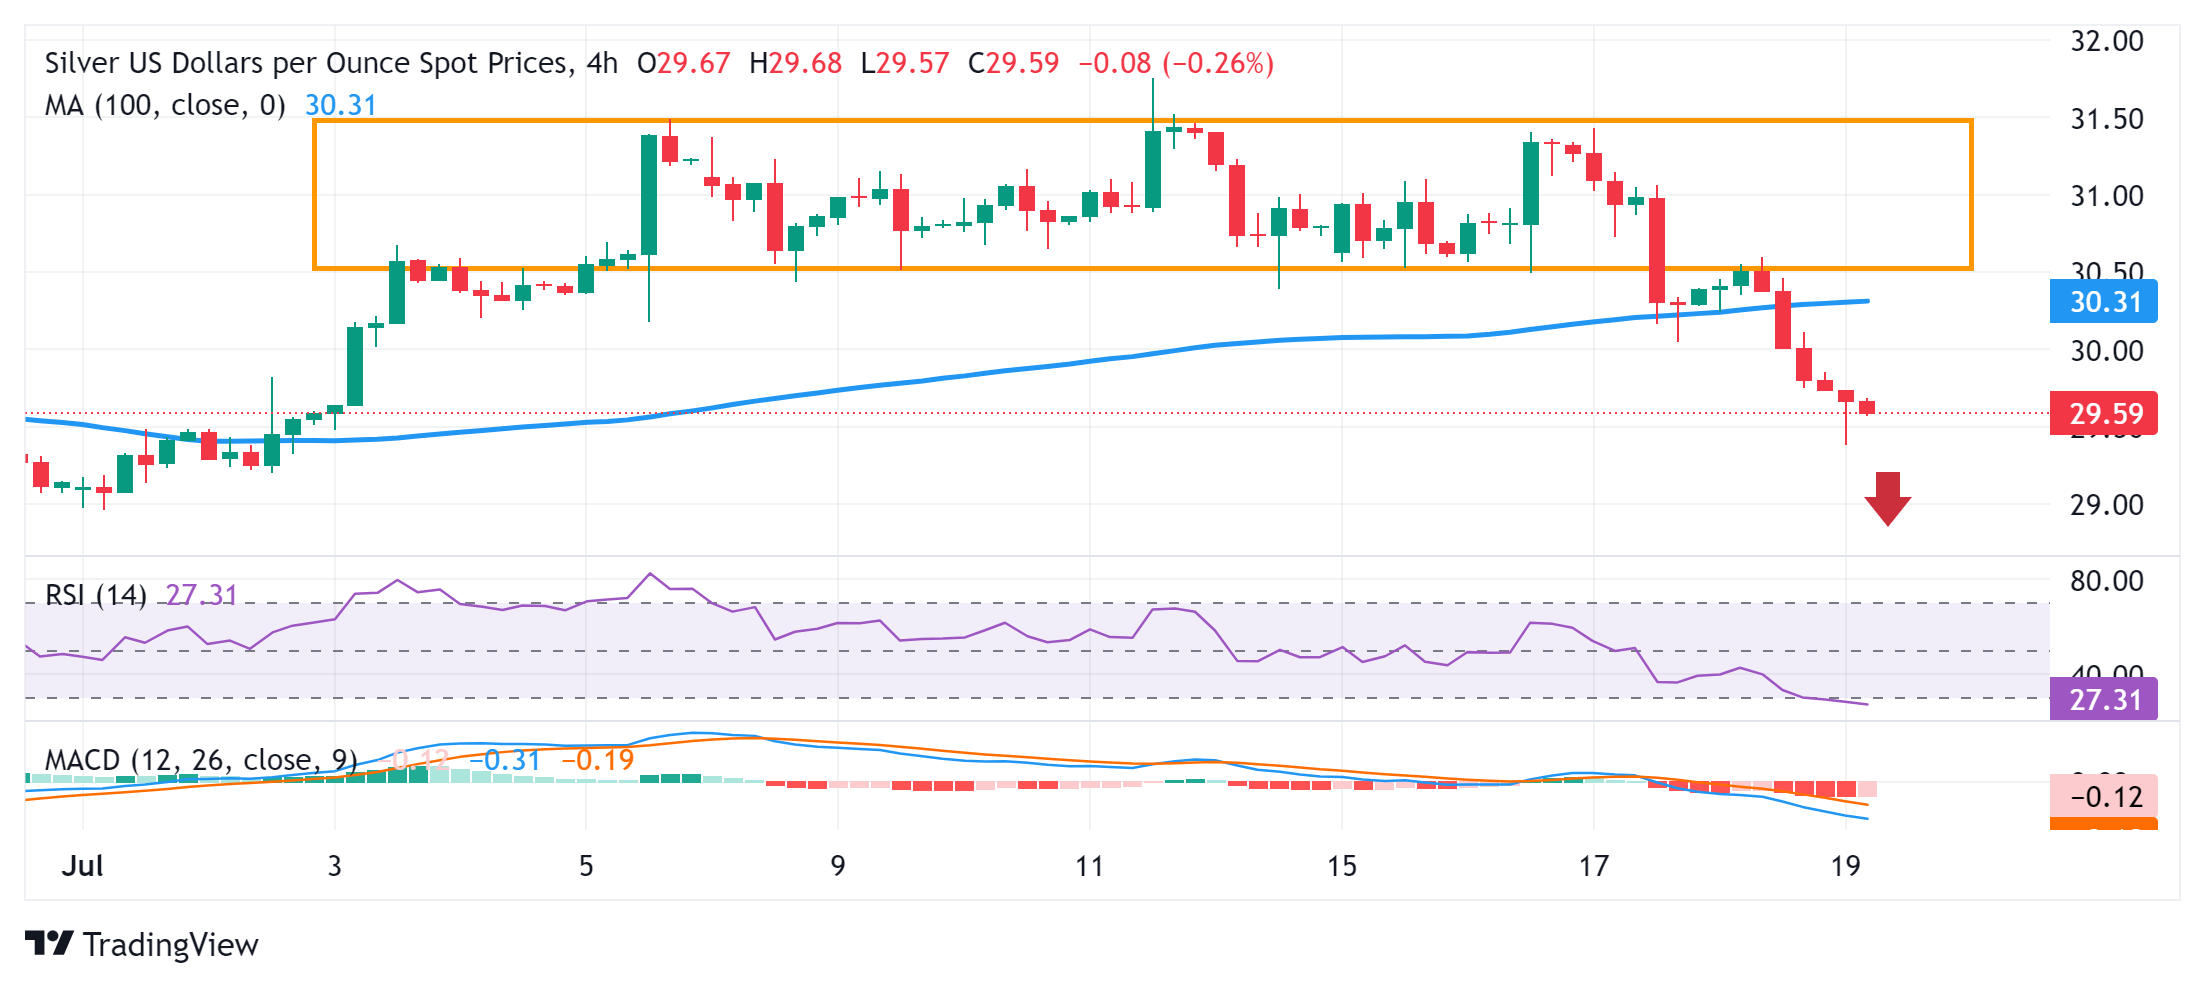
Silver FAQs
Silver is a precious metal highly traded among investors. It has been historically used as a store of value and a medium of exchange. Although less popular than Gold, traders may turn to Silver to diversify their investment portfolio, for its intrinsic value or as a potential hedge during high-inflation periods. Investors can buy physical Silver, in coins or in bars, or trade it through vehicles such as Exchange Traded Funds, which track its price on international markets.
Silver prices can move due to a wide range of factors. Geopolitical instability or fears of a deep recession can make Silver price escalate due to its safe-haven status, although to a lesser extent than Gold's. As a yieldless asset, Silver tends to rise with lower interest rates. Its moves also depend on how the US Dollar (USD) behaves as the asset is priced in dollars (XAG/USD). A strong Dollar tends to keep the price of Silver at bay, whereas a weaker Dollar is likely to propel prices up. Other factors such as investment demand, mining supply – Silver is much more abundant than Gold – and recycling rates can also affect prices.
Silver is widely used in industry, particularly in sectors such as electronics or solar energy, as it has one of the highest electric conductivity of all metals – more than Copper and Gold. A surge in demand can increase prices, while a decline tends to lower them. Dynamics in the US, Chinese and Indian economies can also contribute to price swings: for the US and particularly China, their big industrial sectors use Silver in various processes; in India, consumers’ demand for the precious metal for jewellery also plays a key role in setting prices.
Silver prices tend to follow Gold's moves. When Gold prices rise, Silver typically follows suit, as their status as safe-haven assets is similar. The Gold/Silver ratio, which shows the number of ounces of Silver needed to equal the value of one ounce of Gold, may help to determine the relative valuation between both metals. Some investors may consider a high ratio as an indicator that Silver is undervalued, or Gold is overvalued. On the contrary, a low ratio might suggest that Gold is undervalued relative to Silver.
- GBP/USD remains depressed for the second straight day amid a further USD recovery.
- The risk-off impulse benefits the safe-haven buck, though Fed rate cut bets cap gains.
- Diminishing odds for a BoE rate cut in August to lend support ahead of UK Retail Sales.
The GBP/USD pair prolongs its corrective decline from a one-year peak, around the 1.3045 region touched earlier this week and drifts lower for the second successive day on Friday. Spot prices drop to the 1.2935-1.2930 area, or a fresh weekly low during the Asian session amid some follow-through US Dollar (USD) buying, albeit lack bearish conviction.
Concerns over a renewed trade war between the US and China, along with persistent geopolitical tensions, temper investors' appetite for riskier assets. This led to the overnight slump in the US equities and led to a downfall across Asian markets, which assists the safe-haven buck to build on its recovery from nearly a four-month low and acts as a headwind for the GBP/USD pair. That said, dovish Federal Reserve (Fed) expectations might hold back the USD bulls from placing aggressive bets and lend some support to the currency pair.
Market participants now seem convinced and are pricing in a 100% chance that the US central will begin its rate-cutting cycle in September. The bets were reaffirmed by the US Initial Jobless Claims data released on Thursday, which pointed to a loosening labor market. This comes on top of ebbing inflation and sets the stage for the Fed to start lowering borrowing costs. In contrast, investors have been pricing out the possibility of a rate cut by the Bank of England (BoE) in the wake of Wednesday's higher-than-expected UK CPI print.
Apart from this, a better-than-anticipated UK GDP growth of 0.4% in May might continue to underpin the British Pound (GBP) and contribute to limiting losses for the GBP/USD pair. Traders now look forward to the release of UK monthly Retail Sales data for a fresh impetus. Later during the North American session, speeches by influential FOMC members will drive the USD demand and produce short-term trading opportunities. Nevertheless, spot prices, for now, seem poised to register weekly losses for the first time in the previous four.
Pound Sterling FAQs
The Pound Sterling (GBP) is the oldest currency in the world (886 AD) and the official currency of the United Kingdom. It is the fourth most traded unit for foreign exchange (FX) in the world, accounting for 12% of all transactions, averaging $630 billion a day, according to 2022 data. Its key trading pairs are GBP/USD, aka ‘Cable’, which accounts for 11% of FX, GBP/JPY, or the ‘Dragon’ as it is known by traders (3%), and EUR/GBP (2%). The Pound Sterling is issued by the Bank of England (BoE).
The single most important factor influencing the value of the Pound Sterling is monetary policy decided by the Bank of England. The BoE bases its decisions on whether it has achieved its primary goal of “price stability” – a steady inflation rate of around 2%. Its primary tool for achieving this is the adjustment of interest rates. When inflation is too high, the BoE will try to rein it in by raising interest rates, making it more expensive for people and businesses to access credit. This is generally positive for GBP, as higher interest rates make the UK a more attractive place for global investors to park their money. When inflation falls too low it is a sign economic growth is slowing. In this scenario, the BoE will consider lowering interest rates to cheapen credit so businesses will borrow more to invest in growth-generating projects.
Data releases gauge the health of the economy and can impact the value of the Pound Sterling. Indicators such as GDP, Manufacturing and Services PMIs, and employment can all influence the direction of the GBP. A strong economy is good for Sterling. Not only does it attract more foreign investment but it may encourage the BoE to put up interest rates, which will directly strengthen GBP. Otherwise, if economic data is weak, the Pound Sterling is likely to fall.
Another significant data release for the Pound Sterling is the Trade Balance. This indicator measures the difference between what a country earns from its exports and what it spends on imports over a given period. If a country produces highly sought-after exports, its currency will benefit purely from the extra demand created from foreign buyers seeking to purchase these goods. Therefore, a positive net Trade Balance strengthens a currency and vice versa for a negative balance.
- EUR/USD depreciates as the US Dollar continues to gain ground on Friday.
- Higher US Treasury yields contribute to underpin the Greenback.
- ECB President Lagarde provided no hints about the stance for the next meeting, stating that September was "wide open."
EUR/USD extends its losses for the second consecutive day, trading around 1.0890 during the Asian session on Friday. The decline in the EUR/USD pair can be attributed to the strengthening of the US Dollar (USD) amid increased risk aversion.
The greenback is bolstered by rising US Treasury yields, but its upside potential may be constrained by soft labor data, which enhances market expectations for a Federal Reserve (Fed) rate cut in September.
US Initial Jobless Claims increased more than expected, data showed on Thursday, adding 243K new unemployment benefits seekers for the week ended July 12 compared to the expected 230K, and rising above the previous week’s revised 223K.
According to CME Group’s FedWatch Tool, markets now indicate a 93.5% probability of a 25-basis point rate cut at the September Fed meeting, up from 85.1% a week earlier.
On the EUR front, The European Central Bank (ECB) decided to maintain its main refinancing rate at 4.25%, as expected, at its July Monetary Policy Meeting on Thursday. The ECB's deposit facility rate also remains unchanged at 3.75%.
At the press conference following the interest rate decision, ECB President Christine Lagarde stated, "The question of September and what we do in September is wide open." Lagarde also noted that the monetary policy decision had been unanimous and emphasized the central bank's commitment to relying on a range of data rather than any single data point, according to Reuters.
Euro FAQs
The Euro is the currency for the 20 European Union countries that belong to the Eurozone. It is the second most heavily traded currency in the world behind the US Dollar. In 2022, it accounted for 31% of all foreign exchange transactions, with an average daily turnover of over $2.2 trillion a day. EUR/USD is the most heavily traded currency pair in the world, accounting for an estimated 30% off all transactions, followed by EUR/JPY (4%), EUR/GBP (3%) and EUR/AUD (2%).
The European Central Bank (ECB) in Frankfurt, Germany, is the reserve bank for the Eurozone. The ECB sets interest rates and manages monetary policy. The ECB’s primary mandate is to maintain price stability, which means either controlling inflation or stimulating growth. Its primary tool is the raising or lowering of interest rates. Relatively high interest rates – or the expectation of higher rates – will usually benefit the Euro and vice versa. The ECB Governing Council makes monetary policy decisions at meetings held eight times a year. Decisions are made by heads of the Eurozone national banks and six permanent members, including the President of the ECB, Christine Lagarde.
Eurozone inflation data, measured by the Harmonized Index of Consumer Prices (HICP), is an important econometric for the Euro. If inflation rises more than expected, especially if above the ECB’s 2% target, it obliges the ECB to raise interest rates to bring it back under control. Relatively high interest rates compared to its counterparts will usually benefit the Euro, as it makes the region more attractive as a place for global investors to park their money.
Data releases gauge the health of the economy and can impact on the Euro. Indicators such as GDP, Manufacturing and Services PMIs, employment, and consumer sentiment surveys can all influence the direction of the single currency. A strong economy is good for the Euro. Not only does it attract more foreign investment but it may encourage the ECB to put up interest rates, which will directly strengthen the Euro. Otherwise, if economic data is weak, the Euro is likely to fall. Economic data for the four largest economies in the euro area (Germany, France, Italy and Spain) are especially significant, as they account for 75% of the Eurozone’s economy.
Another significant data release for the Euro is the Trade Balance. This indicator measures the difference between what a country earns from its exports and what it spends on imports over a given period. If a country produces highly sought after exports then its currency will gain in value purely from the extra demand created from foreign buyers seeking to purchase these goods. Therefore, a positive net Trade Balance strengthens a currency and vice versa for a negative balance.
At the Third Plenum conference on Friday, China's senior party official said that the economic recovery is not strong enough.
Additional takeaways
Need to implement macro policies more effectively..
Should speed up the issuance and use of special bonds.
Should give full play to the role of fiscal funds in leveraging economic growth and structural adjustment.
Monetary policy should be flexible, moderate, accurate and effective.
Maintain reasonable and abundant liquidity.
Should increase policy support so that enterprises and consumers tangibly benefit.
Make good use of funds from ultra-long term special bonds.
Should increase residents' property income through multiple channels.
Will improve the long-term expansion of consumption.
Will improve the mechanism for promoting high-quality full employment.
We should speed up the construction of a new model for real estate development.
Eliminate the past high debt, high turnover and high leverage model.
Build a model that better meets the expectations of the people, better mets demand for improved housing.
Need to establish appropriate financing, taxation, land sales systems.
High quality development of real estate still has considerable room for development.
We will expand domestic demand, especially consumer demand.
We should stabilise the basic situation of foreign trade and investment.
China's economy is big, with great potential for domestic demand.
Market reaction
AUD/USD is unimpressed by these Chinese resolutions, licking its wounds near 0.6700, at the time of writing.
Australian Dollar FAQs
One of the most significant factors for the Australian Dollar (AUD) is the level of interest rates set by the Reserve Bank of Australia (RBA). Because Australia is a resource-rich country another key driver is the price of its biggest export, Iron Ore. The health of the Chinese economy, its largest trading partner, is a factor, as well as inflation in Australia, its growth rate and Trade Balance. Market sentiment – whether investors are taking on more risky assets (risk-on) or seeking safe-havens (risk-off) – is also a factor, with risk-on positive for AUD.
The Reserve Bank of Australia (RBA) influences the Australian Dollar (AUD) by setting the level of interest rates that Australian banks can lend to each other. This influences the level of interest rates in the economy as a whole. The main goal of the RBA is to maintain a stable inflation rate of 2-3% by adjusting interest rates up or down. Relatively high interest rates compared to other major central banks support the AUD, and the opposite for relatively low. The RBA can also use quantitative easing and tightening to influence credit conditions, with the former AUD-negative and the latter AUD-positive.
China is Australia’s largest trading partner so the health of the Chinese economy is a major influence on the value of the Australian Dollar (AUD). When the Chinese economy is doing well it purchases more raw materials, goods and services from Australia, lifting demand for the AUD, and pushing up its value. The opposite is the case when the Chinese economy is not growing as fast as expected. Positive or negative surprises in Chinese growth data, therefore, often have a direct impact on the Australian Dollar and its pairs.
Iron Ore is Australia’s largest export, accounting for $118 billion a year according to data from 2021, with China as its primary destination. The price of Iron Ore, therefore, can be a driver of the Australian Dollar. Generally, if the price of Iron Ore rises, AUD also goes up, as aggregate demand for the currency increases. The opposite is the case if the price of Iron Ore falls. Higher Iron Ore prices also tend to result in a greater likelihood of a positive Trade Balance for Australia, which is also positive of the AUD.
The Trade Balance, which is the difference between what a country earns from its exports versus what it pays for its imports, is another factor that can influence the value of the Australian Dollar. If Australia produces highly sought after exports, then its currency will gain in value purely from the surplus demand created from foreign buyers seeking to purchase its exports versus what it spends to purchase imports. Therefore, a positive net Trade Balance strengthens the AUD, with the opposite effect if the Trade Balance is negative.
Japan's Digital Minister Taro Kono clarified that he is not directly requesting the Bank of Japan (BoJ) to raise rates now.
“Monetary policy decision is up to BoJ,” he added.
Responding to Kono’s comments, Finance Minister Shunichi Suzuki said he “hopes that politicians should be mindful about commenting on market-related comments due to their impact.”
Additional comments
Also will attend G7 meetings to be held on the sidelines of G20 meetings.
Plan to discuss various topics including world economy and currency at G20.
Meanwhile, Japan’s private sector economic council members said that they cant overlook the weak Yen negative effects.
The country’s Prime Minister Fumio Kishida also came out on the wires to warn about the impact on inflation due to the Yen depreciation.
He said that the “government must be vigilant about the impact of rising prices, driven in part by a weak Yen, on the economy to achieve domestic-demand driven recovery.”
Need to be cautious about effects of rising prices due to weak Yen,” PM Kishida warned.
Market reaction
USD/JPY has edged a tad lower following these comments, currently trading near 157.35, almost unchanged on the day.
Japanese Yen FAQs
The Japanese Yen (JPY) is one of the world’s most traded currencies. Its value is broadly determined by the performance of the Japanese economy, but more specifically by the Bank of Japan’s policy, the differential between Japanese and US bond yields, or risk sentiment among traders, among other factors.
One of the Bank of Japan’s mandates is currency control, so its moves are key for the Yen. The BoJ has directly intervened in currency markets sometimes, generally to lower the value of the Yen, although it refrains from doing it often due to political concerns of its main trading partners. The current BoJ ultra-loose monetary policy, based on massive stimulus to the economy, has caused the Yen to depreciate against its main currency peers. This process has exacerbated more recently due to an increasing policy divergence between the Bank of Japan and other main central banks, which have opted to increase interest rates sharply to fight decades-high levels of inflation.
The BoJ’s stance of sticking to ultra-loose monetary policy has led to a widening policy divergence with other central banks, particularly with the US Federal Reserve. This supports a widening of the differential between the 10-year US and Japanese bonds, which favors the US Dollar against the Japanese Yen.
The Japanese Yen is often seen as a safe-haven investment. This means that in times of market stress, investors are more likely to put their money in the Japanese currency due to its supposed reliability and stability. Turbulent times are likely to strengthen the Yen’s value against other currencies seen as more risky to invest in.
- The Australian Dollar depreciates for the fifth consecutive session on Friday.
- The downside for AUD may be limited due to a potential interest rate hike by the RBA.
- The US Dollar may struggle as soft labor data strengthens expectations of a Fed rate cut in September.
The Australian Dollar (AUD) extends its losing streak for the fifth successive session on Friday. This decline in the AUD/USD pair can be attributed to the strengthening of the US Dollar (USD) due to increased risk aversion. However, the downside for the AUD may be limited by higher-than-expected Employment Change figures, which indicate tight labor market conditions and raise concerns about a potential interest rate hike from the Reserve Bank of Australia (RBA).
Australian Bureau of Statistics on Thursday showed that Employment Change increased by 50,200 in June from May, surpassing market forecasts of 20,000. This data slightly shifted investors' expectations toward a potential rate hike from the Reserve Bank of Australia in August, with swaps implying a 20% probability, up from 12% previously, according to Reuters. However, the Unemployment Rate increased to 4.1% from 4.0%, contrary to forecasts of a steady outcome.
The US Dollar is supported by an increase in US Treasury yields. However, the upside for the greenback may be limited due to soft labor data, which strengthens market expectations of a rate cut decision by the Federal Reserve (Fed) in September.
According to CME Group’s FedWatch Tool, markets now indicate a 93.5% probability of a 25-basis point rate cut at the September Fed meeting, up from 85.1% a week earlier.
Daily Digest Market Movers: Australian Dollar declines due to increased risk aversion
- Reuters cited Sean Langcake, head of macroeconomic forecasting for Oxford Economics Australia, saying, "The current pace of employment growth suggests demand is resilient and cost pressures will remain. We think the RBA will stay the course and keep rates on hold, but August is certainly a live meeting."
- Westpac's summary of a note on inflation in Australia and the RBA indicates that Australia is expected to follow the same broad disinflation trend as other countries, given that they face largely similar economic shocks.
- US Initial Jobless Claims increased more than expected, data showed on Thursday, adding 243K new unemployment benefits seekers for the week ended July 12 compared to the expected 230K, and rising above the previous week’s revised 223K.
- On Wednesday, Fed Governor Christopher Waller said that the US central bank is ‘getting closer’ to an interest rate cut. Meanwhile, Richmond Fed President Thomas Barkin stated that easing in inflation had begun to broaden and he would like to see it continue,” per Reuters.
- During an interview with Bloomberg News on Tuesday, Donald Trump cautioned Fed Chair Jerome Powell against cutting US interest rates before November’s presidential vote. However, Trump also indicated that if re-elected, he would allow Powell to complete his term if he continued to "do the right thing" at the Federal Reserve.
- On Monday, Fed Chair Powell stated that the three US inflation readings from this year "add somewhat to confidence" that inflation is on track to meet the Fed’s target sustainably, suggesting that a shift to interest rate cuts may be imminent.
- The third plenum of the Chinese Communist Party's 20th National Congress continues today, being held from July 15 to 18. Standard Chartered expects cuts from the People's Bank of China, both in rates and the reserve requirement ratio (RRR), as GDP growth decelerated in Q2. China’s growth drivers remain uneven, and trade tensions are rising, with the US and EU imposing new tariffs on Chinese electric vehicles (EVs).
Technical Analysis: Australian Dollar hovers around 0.6700
The Australian Dollar trades around 0.6710 on Friday. The daily chart analysis shows that the AUD/USD pair has fallen below an ascending channel, signaling a weakening bullish bias. Although the 14-day Relative Strength Index (RSI) is slightly above the 50 level, a drop below this level would indicate the onset of bearish momentum.
Immediate support for the AUD/USD pair is seen at the psychological level of 0.6700. A decline below this level could put pressure on the pair to explore the throwback support around 0.6590.
On the upside, the AUD/USD pair might test the lower boundary of the ascending channel near the nine-day Exponential Moving Average (EMA) at 0.6726. A return into the ascending channel could bolster the bullish bias and potentially drive the pair to 0.6800 before the upper boundary of the channel at 0.6840.
AUD/USD: Daily Chart
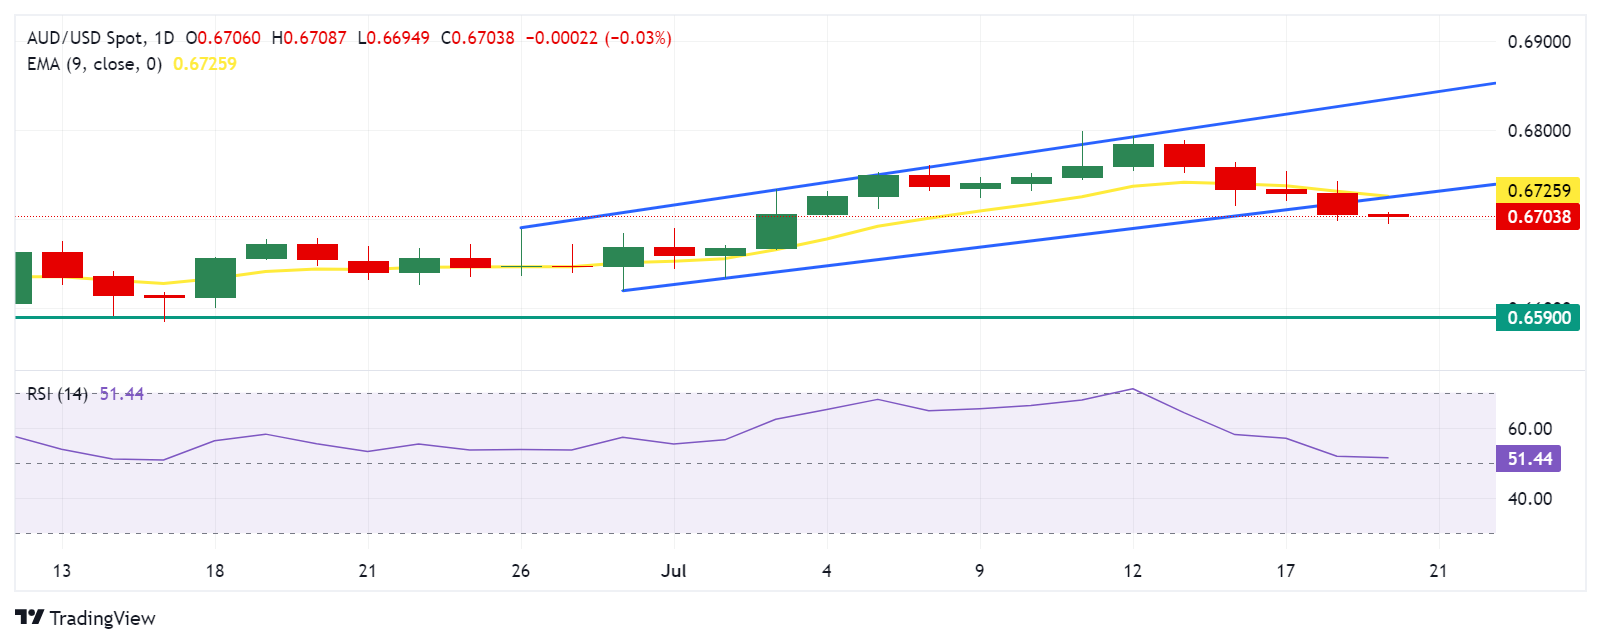
Australian Dollar PRICE Today
The table below shows the percentage change of Australian Dollar (AUD) against listed major currencies today. Australian Dollar was the weakest against the Canadian Dollar.
| USD | EUR | GBP | JPY | CAD | AUD | NZD | CHF | |
|---|---|---|---|---|---|---|---|---|
| USD | 0.07% | 0.02% | 0.03% | 0.00% | 0.06% | 0.23% | 0.11% | |
| EUR | -0.07% | -0.05% | -0.03% | -0.09% | -0.01% | 0.18% | 0.05% | |
| GBP | -0.02% | 0.05% | 0.00% | -0.05% | 0.04% | 0.23% | 0.09% | |
| JPY | -0.03% | 0.03% | 0.00% | -0.03% | 0.04% | 0.22% | 0.10% | |
| CAD | -0.00% | 0.09% | 0.05% | 0.03% | 0.06% | 0.25% | 0.11% | |
| AUD | -0.06% | 0.01% | -0.04% | -0.04% | -0.06% | 0.19% | 0.05% | |
| NZD | -0.23% | -0.18% | -0.23% | -0.22% | -0.25% | -0.19% | -0.14% | |
| CHF | -0.11% | -0.05% | -0.09% | -0.10% | -0.11% | -0.05% | 0.14% |
The heat map shows percentage changes of major currencies against each other. The base currency is picked from the left column, while the quote currency is picked from the top row. For example, if you pick the Australian Dollar from the left column and move along the horizontal line to the US Dollar, the percentage change displayed in the box will represent AUD (base)/USD (quote).
Australian Dollar FAQs
One of the most significant factors for the Australian Dollar (AUD) is the level of interest rates set by the Reserve Bank of Australia (RBA). Because Australia is a resource-rich country another key driver is the price of its biggest export, Iron Ore. The health of the Chinese economy, its largest trading partner, is a factor, as well as inflation in Australia, its growth rate and Trade Balance. Market sentiment – whether investors are taking on more risky assets (risk-on) or seeking safe-havens (risk-off) – is also a factor, with risk-on positive for AUD.
The Reserve Bank of Australia (RBA) influences the Australian Dollar (AUD) by setting the level of interest rates that Australian banks can lend to each other. This influences the level of interest rates in the economy as a whole. The main goal of the RBA is to maintain a stable inflation rate of 2-3% by adjusting interest rates up or down. Relatively high interest rates compared to other major central banks support the AUD, and the opposite for relatively low. The RBA can also use quantitative easing and tightening to influence credit conditions, with the former AUD-negative and the latter AUD-positive.
China is Australia’s largest trading partner so the health of the Chinese economy is a major influence on the value of the Australian Dollar (AUD). When the Chinese economy is doing well it purchases more raw materials, goods and services from Australia, lifting demand for the AUD, and pushing up its value. The opposite is the case when the Chinese economy is not growing as fast as expected. Positive or negative surprises in Chinese growth data, therefore, often have a direct impact on the Australian Dollar and its pairs.
Iron Ore is Australia’s largest export, accounting for $118 billion a year according to data from 2021, with China as its primary destination. The price of Iron Ore, therefore, can be a driver of the Australian Dollar. Generally, if the price of Iron Ore rises, AUD also goes up, as aggregate demand for the currency increases. The opposite is the case if the price of Iron Ore falls. Higher Iron Ore prices also tend to result in a greater likelihood of a positive Trade Balance for Australia, which is also positive of the AUD.
The Trade Balance, which is the difference between what a country earns from its exports versus what it pays for its imports, is another factor that can influence the value of the Australian Dollar. If Australia produces highly sought after exports, then its currency will gain in value purely from the surplus demand created from foreign buyers seeking to purchase its exports versus what it spends to purchase imports. Therefore, a positive net Trade Balance strengthens the AUD, with the opposite effect if the Trade Balance is negative.
- USD/CAD struggles to attract buyers and consolidates in a range on the last day of the week.
- Bulls seem unaffected by some follow-through USD strength and a further slide in Oil prices.
- Traders look to Canadian Retail Sales and speeches by FOMC members for a fresh impetus.
The USD/CAD pair seesaws between tepid gains/minor losses during the Asian session on Friday and consolidates its recent recovery gains from sub-1.3600 levels, or a three-month low touched last week. Spot prices currently trade around the 1.3700 mark, nearly unchanged for the day, and remain on track to register weekly gains for the first time in the previous six.
The US Dollar (USD) is seen building on the previous day's goodish rebound from over a three-month low and turning out to be a key factor acting as a tailwind for the USD/CAD pair. The Conference Board's leading index fell for the fourth straight month in June and pointed to a slowdown in the US economic growth. This comes on top of worries about a slowdown in China – the world's second-largest economy – and tempers investors' appetite for riskier assets, which is seen benefitting the safe-haven Greenback.
Meanwhile, a stronger buck dents demand for USD-denominated commodities, including Crude Oil prices. This, in turn, seems to undermine the commodity-linked Loonie and further lends support to the USD/CAD pair. That said, the lack of strong follow-through buying warrants some caution for bullish traders amid bets that the Federal Reserve (Fed) will start cutting interest rates in September. Traders also seem reluctant and prefer to wait on the sidelines ahead of the Bank of Canada (BoC) meeting next Wednesday.
Heading into the key central bank event risk, investors on Friday will take cues from the release of Canadian Retail Sales data, which, along with Oil price dynamics, should influence the Canadian Dollar (CAD). Furthermore, Fedspeak and the broader risk sentiment will drive the USD demand, which should provide some meaningful impetus to the USD/CAD pair and contribute to producing short-term opportunities.
Economic Indicator
Retail Sales (MoM)
The Retail Sales data, released by Statistics Canada on a monthly basis, measures the total value of goods sold by retailers in Canada based on a sampling of retail stores of different types and sizes. Changes in Retail Sales are widely followed as an indicator of consumer spending. Percent changes reflect the rate of changes in such sales, with the MoM reading comparing sales values in the reference month with the previous month. Generally, a high reading is seen as bullish for the Canadian Dollar (CAD), while a low reading is seen as bearish.
Read more.Next release: Fri Jul 19, 2024 12:30
Frequency: Monthly
Consensus: -0.6%
Previous: 0.7%
Source: Statistics Canada
| Raw materials | Closed | Change, % |
|---|---|---|
| Silver | 29.814 | -1.62 |
| Gold | 244.532 | -0.54 |
| Palladium | 927.96 | -2.59 |
- Gold price corrects further from the record high amid some follow-through USD buying.
- September Fed rate cut bets should cap the USD and help limit losses for the XAU/USD.
- The technical setup supports prospects for the emergence of dip-buying near $2,400.
Gold price (XAU/USD) prolongs its corrective decline from the record peak touched earlier this week and drifts lower for the third successive day on Friday. The US Dollar (USD) builds on the previous day's solid recovery from over a four-month trough, led by the post-ECB slump in the shared currency, and is seen as a key factor exerting downward pressure on the commodity. The downfall could further be attributed to some profit-taking, especially after the recent rally of over 6.5% since the beginning of this month.
Meanwhile, the initial jobless claims data released from the US on Thursday provided further evidence that the labor market is softening. This, along with signs of easing inflationary pressures, sets the stage for a September interest rate cut from the Federal Reserve (Fed), which, in turn, should act as a tailwind for the non-yielding Gold price. Apart from this, geopolitical tensions and central bank demand should help limit the downside for the precious metal, suggesting that any further decline could be seen as a buying opportunity.
Daily Digest Market Movers: Gold price is pressured by a further USD recovery; Fed rate cut bets to limit losses
- The US Dollar builds on the previous day's strong recovery from its lowest level since March 21 and drags the Gold price lower for the third successive day on Friday.
- The US Bureau of Labor Statistics (BLS) reported on Thursday that the number of Americans filing for unemployment benefits in the week ending July 13 rose to 243K.
- Additional details of the report revealed that the 4-week moving average swelled to the highest level in more than 2-1/2 years, pointing to a loosening labor market.
- This, along with ebbing inflation, paves the way for an imminent start of the Federal Reserve's rate-cutting cycle, offsetting the upbeat US manufacturing data.
- In fact, the Philadelphia Fed Manufacturing Index remained in positive territory for a sixth straight month and rose to 13.9 from 1.3 in the previous month.
- Nevertheless, the CME Group's FedWatch Tool indicates that markets are pricing in a 100% chance of a rate-cut in September and an additional two cuts by year-end.
- Meanwhile, former President Donald Trump said that Taiwan should pay the US for defense, raising doubts over the US commitment to defend Taiwan in the event of an attack by China.
- This comes on top of geopolitical tensions stemming from conflicts in the Middle East and the protracted Russia-Ukraine war, which should lend support to the XAU/USD.
Technical Analysis: Gold price needs to break below $2,390-2,385 support for bears to seize near-term control
From a technical perspective, any subsequent fall is likely to find decent support near the $2,413-2,412 area ahead of the $2,400 round-figure mark. This is followed by the $2,390-2,385 horizontal resistance breakpoint, now turned support, which, if broken decisively, might prompt some technical selling. The Gold price might then accelerate the downfall toward testing the 50-day Simple Moving Average (SMA) support, currently pegged near the $2,359-2,358 region. Sustained weakness below the latter could expose the 100-day SMA near the $2,311 zone, with some intermediate support near the $2,330-2,328 region.
On the flip side, the Asian session high, around the $2,445 area, now seems to act as an immediate hurdle, above which the Gold price could climb to the $2,469-2,470 region. Given that oscillators on the daily chart are still holding comfortably in positive territory, bulls might then aim to retest the all-time peak, near the $2,483-2,484 region, and conquer the $2,500 psychological mark.
Gold FAQs
Gold has played a key role in human’s history as it has been widely used as a store of value and medium of exchange. Currently, apart from its shine and usage for jewelry, the precious metal is widely seen as a safe-haven asset, meaning that it is considered a good investment during turbulent times. Gold is also widely seen as a hedge against inflation and against depreciating currencies as it doesn’t rely on any specific issuer or government.
Central banks are the biggest Gold holders. In their aim to support their currencies in turbulent times, central banks tend to diversify their reserves and buy Gold to improve the perceived strength of the economy and the currency. High Gold reserves can be a source of trust for a country’s solvency. Central banks added 1,136 tonnes of Gold worth around $70 billion to their reserves in 2022, according to data from the World Gold Council. This is the highest yearly purchase since records began. Central banks from emerging economies such as China, India and Turkey are quickly increasing their Gold reserves.
Gold has an inverse correlation with the US Dollar and US Treasuries, which are both major reserve and safe-haven assets. When the Dollar depreciates, Gold tends to rise, enabling investors and central banks to diversify their assets in turbulent times. Gold is also inversely correlated with risk assets. A rally in the stock market tends to weaken Gold price, while sell-offs in riskier markets tend to favor the precious metal.
The price can move due to a wide range of factors. Geopolitical instability or fears of a deep recession can quickly make Gold price escalate due to its safe-haven status. As a yield-less asset, Gold tends to rise with lower interest rates, while higher cost of money usually weighs down on the yellow metal. Still, most moves depend on how the US Dollar (USD) behaves as the asset is priced in dollars (XAU/USD). A strong Dollar tends to keep the price of Gold controlled, whereas a weaker Dollar is likely to push Gold prices up.
Federal Reserve Bank of San Francisco President Mary Daly participated in a 'fireside chat' at a conference early Friday, noting that she is looking for more confidence that inflation is moving back to the Fed's 2% target before calling for an interest rate cut.
Key quotes
Recent data has been really good.
Economy is not there yet on inflation.
Labor market is coming back into balance.
Risks on both side for monetary policy choices.
Fed remains data dependant for monetary policy.
Preemptive or urgent policy actions risk making mistakes.
We are not at price stability yet.
Market reaction
These prudent comments from the Fed policymaker seem to have little to no impact on the US Dollar, as the US Dollar Index ekes out weekly gains following a sharp rebound on Thursday.
- The Japanese Yen remains silent after the release of mixed inflation data on Friday.
- Japan's National Consumer Price Index held steady at 2.8% in June, remaining at the highest level since February.
- The US Dollar extends gains despite the dovish sentiment surrounding the Fed’s policy stance.
The Japanese Yen (JPY) remains stable following the release of the latest inflation data on Friday. Japan's National Consumer Price Index (CPI) for June held steady at 2.8%, matching the previous month's figure and remaining at the highest level since February. Meanwhile, Core CPI inflation rose to 2.6%, slightly above the previous reading of 2.5% but just below the consensus estimate of 2.7%.
Japan’s 10-year government bond yield trades at approximately 1.04%, recovering from three-week lows. This rebound follows Digital Minister Kono Taro's statement to Bloomberg that the Bank of Japan (BoJ) should raise interest rates again in July to support the Yen. Additionally, the BoJ is anticipated to show its bond purchase tapering plans this month.
The USD/JPY pair has retreated by as much as 4% from a 38-year high of 161.95 during July. Analysts attribute this decline to interventions by Japanese authorities. Traders remain vigilant about the possibility of further interventions.
The US Dollar receives support from a slight improvement in US Treasury yields. However, the greenback may limit its upside as soft labor data bolster market expectations of a September rate-cut decision by the Federal Reserve (Fed).
Daily Digest Market Movers: Japanese Yen holds ground amid intervention threat
- Japan’s CPI inflation, less both food and energy prices, ticks higher in June and grew 2.2% YoY rate from the previous 2.1%.
- US Initial Jobless Claims increased more than expected, data showed on Thursday, adding 243K new unemployment benefits seekers for the week ended July 12 compared to the expected 230K, and rising above the previous week’s revised 223K.
- Japan's Merchandise Trade Balance Total for the year ended in June climbed to a surplus of ¥224 billion against the expected deficit of ¥240 billion and ¥-1,220.1 billion prior.
- On Wednesday, Fed Governor Christopher Waller said that the US central bank is ‘getting closer’ to an interest rate cut. Meanwhile, Richmond Fed President Thomas Barkin stated that easing in inflation had begun to broaden and he would like to see it continue,” per Reuters.
- Reuters cited Kyodo News, reporting that Japan's top currency diplomat Masato Kanda said on Wednesday he would have to respond if speculators cause "excessive" moves in the currency market and that there was no limit to how often authorities could intervene.
- During an interview with Bloomberg News on Tuesday, Donald Trump cautioned Fed Chair Jerome Powell against cutting US interest rates before November’s presidential vote. However, Trump also indicated that if re-elected, he would allow Powell to complete his term if he continued to "do the right thing" at the Federal Reserve.
- Data released on Tuesday showed that the Bank of Japan (BoJ) entered the foreign exchange market on consecutive trading days last Thursday and Friday. The current account balance data from the BoJ, released on Tuesday, indicates an anticipated liquidity drain of approximately ¥2.74 trillion ($17.3 billion) from the financial system on Wednesday due to various government sector transactions, according to Nikkei Asia.
- Fed Chair Jerome Powell mentioned earlier this week that the three US inflation readings of this year "add somewhat to confidence" that inflation is on course to meet the Fed’s target sustainably, suggesting that a shift to interest rate cuts may not be far off.
Technical Analysis: USD/JPY hovers around 157.50
USD/JPY trades around 157.40 on Friday. The daily chart analysis indicates that the USD/JPY pair is below its 9-day Exponential Moving Average (EMA), suggesting short-term downward momentum. This implies waiting for signs of a trend reversal before buying. Additionally, the 14-day Relative Strength Index (RSI) is below 50, confirming a bearish bias.
The pair could find key support around June's low of 154.55. A break below this level could push the pair towards May’s low of 151.86.
On the upside, immediate resistance is noted around the 9-day EMA at 158.25. If the pair breaks above this level, it could revisit the pullback resistance around the psychological level of 162.00.
USD/JPY: Daily Chart
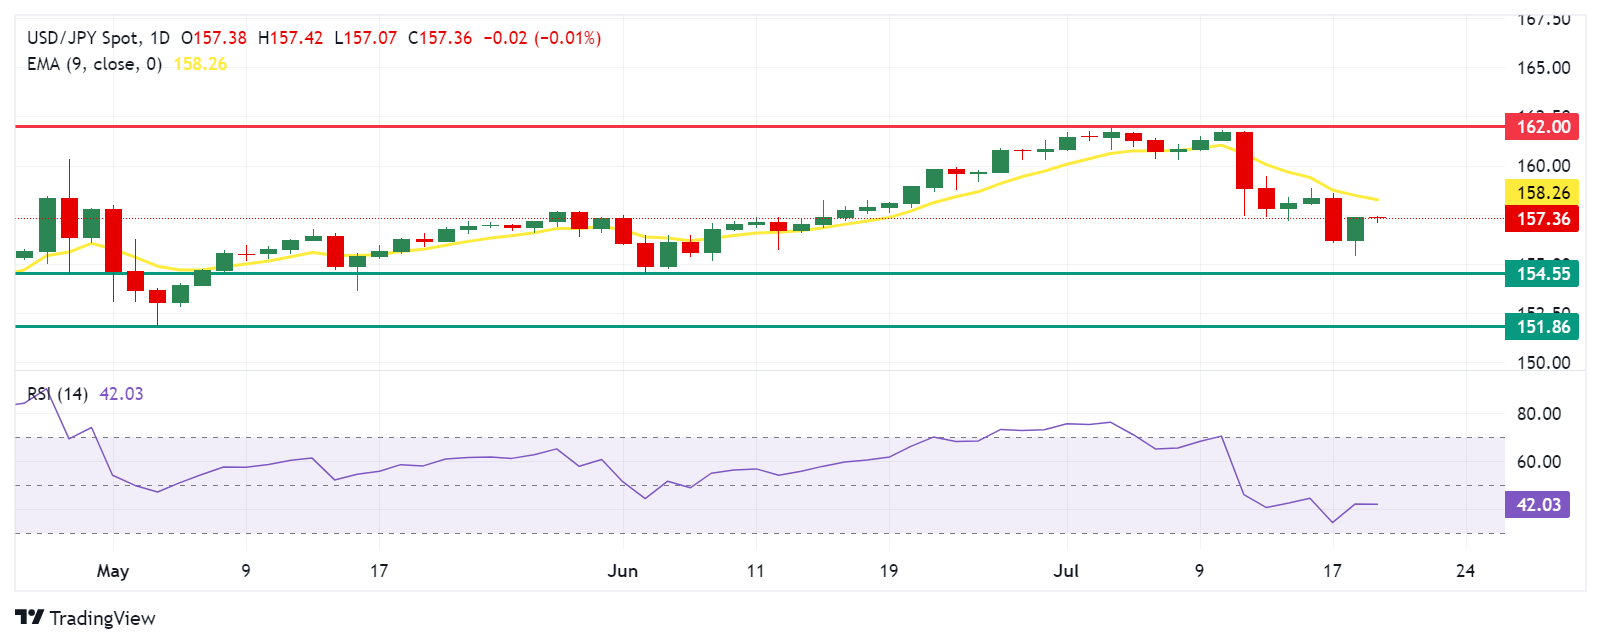
Japanese Yen PRICE Today
The table below shows the percentage change of Japanese Yen (JPY) against listed major currencies today. Japanese Yen was the strongest against the New Zealand Dollar.
| USD | EUR | GBP | JPY | CAD | AUD | NZD | CHF | |
|---|---|---|---|---|---|---|---|---|
| USD | 0.07% | 0.05% | 0.05% | 0.00% | 0.09% | 0.26% | 0.10% | |
| EUR | -0.07% | -0.02% | 0.00% | -0.06% | 0.02% | 0.20% | 0.03% | |
| GBP | -0.05% | 0.02% | 0.00% | -0.05% | 0.04% | 0.23% | 0.05% | |
| JPY | -0.05% | 0.00% | 0.00% | -0.06% | 0.05% | 0.23% | 0.06% | |
| CAD | 0.00% | 0.06% | 0.05% | 0.06% | 0.09% | 0.28% | 0.10% | |
| AUD | -0.09% | -0.02% | -0.04% | -0.05% | -0.09% | 0.19% | 0.00% | |
| NZD | -0.26% | -0.20% | -0.23% | -0.23% | -0.28% | -0.19% | -0.18% | |
| CHF | -0.10% | -0.03% | -0.05% | -0.06% | -0.10% | -0.01% | 0.18% |
The heat map shows percentage changes of major currencies against each other. The base currency is picked from the left column, while the quote currency is picked from the top row. For example, if you pick the Japanese Yen from the left column and move along the horizontal line to the US Dollar, the percentage change displayed in the box will represent JPY (base)/USD (quote).
Economic Indicator
National Consumer Price Index (YoY)
Japan’s National Consumer Price Index (CPI), released by the Statistics Bureau of Japan on a monthly basis, measures the price fluctuation of goods and services purchased by households nationwide. The YoY reading compares prices in the reference month to the same month a year earlier. Generally, a high reading is seen as bullish for the Japanese Yen (JPY), while a low reading is seen as bearish.
Read more.Last release: Thu Jul 18, 2024 23:30
Frequency: Monthly
Actual: 2.8%
Consensus: -
Previous: 2.8%
Source: Statistics Bureau of Japan
On Friday, the People’s Bank of China (PBOC) set the USD/CNY central rate for the trading session ahead at 7.1315, as against the previous day's fix of 7.1285 and 7.2706 Reuters estimates.
| Index | Change, points | Closed | Change, % |
|---|---|---|---|
| NIKKEI 225 | -971.34 | 40126.35 | -2.36 |
| Hang Seng | 39 | 17778.41 | 0.22 |
| KOSPI | -18.94 | 2824.35 | -0.67 |
| ASX 200 | -21.4 | 8036.5 | -0.27 |
| DAX | -82.54 | 18354.76 | -0.45 |
| CAC 40 | 15.74 | 7586.55 | 0.21 |
| Dow Jones | -533.06 | 40665.02 | -1.29 |
| S&P 500 | -43.68 | 5544.59 | -0.78 |
| NASDAQ Composite | -125.7 | 17871.22 | -0.7 |
Japan's headline National Consumer Price Index (CPI) held steady and came in at the 2.8% YoY rate for June. Meanwhile, Core CPI inflation – or headline CPI inflation less volatile food prices – rose by 2.6% during the reported period versus the previous 2.5% and consensus estimates for a reading of 2.7%.
Furthermore, Core-core Japanese CPI – or CPI inflation less both food and energy prices – ticks higher in June and grew 2.2% YoY rate from the previous 2.1%.
Japan's national-level CPI inflation print tends to be previewed by Tokyo CPI inflation several weeks prior, leaving a muted market impact from nationwide aggregated inflation figures.
Economic Indicator
Consumer Price Index (YoY)
Inflationary or deflationary tendencies are measured by periodically summing the prices of a basket of representative goods and services and presenting the data as The Consumer Price Index (CPI). CPI data is compiled on a monthly basis and released by the US Department of Labor Statistics. The YoY reading compares the prices of goods in the reference month to the same month a year earlier.The CPI is a key indicator to measure inflation and changes in purchasing trends. Generally speaking, a high reading is seen as bullish for the US Dollar (USD), while a low reading is seen as bearish.
Read more.Last release: Thu Jul 11, 2024 12:30
Frequency: Monthly
Actual: 3%
Consensus: 3.1%
Previous: 3.3%
Source: US Bureau of Labor Statistics
The US Federal Reserve has a dual mandate of maintaining price stability and maximum employment. According to such mandate, inflation should be at around 2% YoY and has become the weakest pillar of the central bank’s directive ever since the world suffered a pandemic, which extends to these days. Price pressures keep rising amid supply-chain issues and bottlenecks, with the Consumer Price Index (CPI) hanging at multi-decade highs. The Fed has already taken measures to tame inflation and is expected to maintain an aggressive stance in the foreseeable future.
Japanese Yen FAQs
The Japanese Yen (JPY) is one of the world’s most traded currencies. Its value is broadly determined by the performance of the Japanese economy, but more specifically by the Bank of Japan’s policy, the differential between Japanese and US bond yields, or risk sentiment among traders, among other factors.
One of the Bank of Japan’s mandates is currency control, so its moves are key for the Yen. The BoJ has directly intervened in currency markets sometimes, generally to lower the value of the Yen, although it refrains from doing it often due to political concerns of its main trading partners. The current BoJ ultra-loose monetary policy, based on massive stimulus to the economy, has caused the Yen to depreciate against its main currency peers. This process has exacerbated more recently due to an increasing policy divergence between the Bank of Japan and other main central banks, which have opted to increase interest rates sharply to fight decades-high levels of inflation.
The BoJ’s stance of sticking to ultra-loose monetary policy has led to a widening policy divergence with other central banks, particularly with the US Federal Reserve. This supports a widening of the differential between the 10-year US and Japanese bonds, which favors the US Dollar against the Japanese Yen.
The Japanese Yen is often seen as a safe-haven investment. This means that in times of market stress, investors are more likely to put their money in the Japanese currency due to its supposed reliability and stability. Turbulent times are likely to strengthen the Yen’s value against other currencies seen as more risky to invest in.
| Pare | Closed | Change, % |
|---|---|---|
| AUDUSD | 0.67066 | -0.32 |
| EURJPY | 171.437 | 0.32 |
| EURUSD | 1.08966 | -0.37 |
| GBPJPY | 203.63 | 0.2 |
| GBPUSD | 1.29423 | -0.5 |
| NZDUSD | 0.60461 | -0.57 |
| USDCAD | 1.37027 | 0.13 |
| USDCHF | 0.88719 | 0.46 |
| USDJPY | 157.325 | 0.7 |


© 2000-2026. Sva prava zaštićena.
Sajt je vlasništvo kompanije Teletrade D.J. LLC 2351 LLC 2022 (Euro House, Richmond Hill Road, Kingstown, VC0100, St. Vincent and the Grenadines).
Svi podaci koji se nalaze na sajtu ne predstavljaju osnovu za donošenje investicionih odluka, već su informativnog karaktera.
The company does not serve or provide services to customers who are residents of the US, Canada, Iran, The Democratic People's Republic of Korea, Yemen and FATF blacklisted countries.
Izvršenje trgovinskih operacija sa finansijskim instrumentima upotrebom marginalne trgovine pruža velike mogućnosti i omogućava investitorima ostvarivanje visokih prihoda. Međutim, takav vid trgovine povezan je sa potencijalno visokim nivoom rizika od gubitka sredstava. Проведение торговых операций на финанcовых рынках c маржинальными финанcовыми инcтрументами открывает широкие возможноcти, и позволяет инвеcторам, готовым пойти на риcк, получать выcокую прибыль, но при этом неcет в cебе потенциально выcокий уровень риcка получения убытков. Iz tog razloga je pre započinjanja trgovine potrebno odlučiti o izboru odgovarajuće investicione strategije, uzimajući u obzir raspoložive resurse.
Upotreba informacija: U slučaju potpunog ili delimičnog preuzimanja i daljeg korišćenja materijala koji se nalazi na sajtu, potrebno je navesti link odgovarajuće stranice na sajtu kompanije TeleTrade-a kao izvora informacija. Upotreba materijala na internetu mora biti praćena hiper linkom do web stranice teletrade.org. Automatski uvoz materijala i informacija sa stranice je zabranjen.
Ako imate bilo kakvih pitanja, obratite nam se pr@teletrade.global.
транcфери