- Analiza
- Novosti i instrumenti
- Vesti sa tržišta
Forex-novosti i prognoze od 19-06-2024
- NZD/USD gains momentum around 0.6145 following the release of New Zealand GDP on Thursday.
- New Zealand's economy grew 0.2% QoQ in Q1 versus 0% prior, stronger than expected.
- US Retail Sales data last week hinted at an economic slowdown and fuel rate cut expectations.
The NZD/USD pair gains traction near 0.6145 during the early Asian session on Thursday. The pair edges higher on the back of stronger-than-expected New Zealand GDP in the first quarter and the decline of the US Dollar (USD). Investors await the US weekly Initial Jobless Claims, Building Permits, Housing Starts, the Philly Fed Manufacturing Index, and the speech by the Fed’s Barkin for fresh impetus on Thursday.
New Zealand’s economy grew 0.2% on a quarter-on-quarter basis in Q1 from 0% in the previous quarter. The figure came in better than expected, Statistics New Zealand showed on Thursday. On an annual basis, the GDP figure expanded by 0.3% in Q1, compared to the previous quarter’s 0.2% contraction. The New Zealand Dollar (NZD) attracts some buyers after the stronger GDP growth number indicated the country exited recession.
Additionally, Westpac New Zealand's Consumer Confidence Survey reported a decline to 82.2 in consumer sentiment for the second quarter from the previous reading of 93.2.
On the other hand, the recent weaker US Retail Sales report last week spurred the likelihood that the Federal Reserve (Fed) will start to cut interest rates in a few months, which exerts some selling pressure on the Greenback. The markets are now pricing in a nearly 67% chance of a 25 basis points (bps) for a Fed rate cut in September, up from 61% a day ago, according to the CME FedWatch tool. On Tuesday, Boston Fed President Susan Collins said that there are possibilities of one or two interest rate cuts from the Fed later this year, but the central bank must be patient amid volatile readings on inflation.
- EUR/USD drifted mostly sideways on sedate Wednesday, heads into quiet Thursday.
- Fiber traders will be on the lookout for Thursday’s US unemployment applications.
- Friday looms ahead with PMI activity figures on both sides of the Pacific.
EUR/USD cycled on Wednesday with US markets out for a midweek holiday, and the Fiber heads into the back half of the trading week with mid-tier data on the offering, leaving investors to look ahead to Friday’s Purchasing Managers Index (PMI) activity figures for meaningful data releases to drive sentiment in either direction.
Forex Today: Attention shifts to the BoE and US data
American markets will be back in action on Thursday, just in time for the release of the latest US Initial Jobless Claims for the week ending June 14. The median market forecasts anticipate a modest drop in new US jobless benefit claims to 235K from the previous 242K, but they are still expected to surpass the four-week running average of 227K.
The European Central Bank’s (ECB) latest Economic Bulletin is also expected early in the Thursday market window, but little new information is expected as the ECB rehashes what has already been covered in previous public appearances from ECB policymakers following the latest rate call.
Friday will end the trading week with a hectic thump. Pan-European PMI survey figures will begin dropping on markets starting at 07:30 GMT, to be followed by US PMI figures at 13:45 GMT. The Pan-European HCOB Manufacturing Purchasing Managers' Index (PMI) is expected to increase to 47.9 month-over-month (MoM) from 47.3, with the Services component forecasted to rise to 53.5 from 53.2. On the US side, both the Manufacturing and Services components are anticipated to decrease. The Manufacturing component is expected to ease to 51.0 from 51.3, and the Services PMI is forecasted to drop to 53.3 from 54.8.
EUR/USD technical outlook
The EUR/USD is currently facing resistance from the 200-hour Exponential Moving Average (EMA) at 1.0767, making it challenging for the currency pair to surpass the 1.0750 mark. Although it has shown some recovery from recent lows near 1.0670, the upward momentum is hindered. The daily candlesticks indicate a potential bullish move towards the 200-day EMA around 1.0800.
However, the presence of technical resistance near 1.1140 from late December’s peaks is limiting bullish momentum. If this trend continues, the EUR/USD could experience a downside reversal, potentially leading to new lows for 2024, possibly falling below 1.0600.
EUR/USD hourly chart
EUR/USD daily chart
Euro FAQs
The Euro is the currency for the 20 European Union countries that belong to the Eurozone. It is the second most heavily traded currency in the world behind the US Dollar. In 2022, it accounted for 31% of all foreign exchange transactions, with an average daily turnover of over $2.2 trillion a day. EUR/USD is the most heavily traded currency pair in the world, accounting for an estimated 30% off all transactions, followed by EUR/JPY (4%), EUR/GBP (3%) and EUR/AUD (2%).
The European Central Bank (ECB) in Frankfurt, Germany, is the reserve bank for the Eurozone. The ECB sets interest rates and manages monetary policy. The ECB’s primary mandate is to maintain price stability, which means either controlling inflation or stimulating growth. Its primary tool is the raising or lowering of interest rates. Relatively high interest rates – or the expectation of higher rates – will usually benefit the Euro and vice versa. The ECB Governing Council makes monetary policy decisions at meetings held eight times a year. Decisions are made by heads of the Eurozone national banks and six permanent members, including the President of the ECB, Christine Lagarde.
Eurozone inflation data, measured by the Harmonized Index of Consumer Prices (HICP), is an important econometric for the Euro. If inflation rises more than expected, especially if above the ECB’s 2% target, it obliges the ECB to raise interest rates to bring it back under control. Relatively high interest rates compared to its counterparts will usually benefit the Euro, as it makes the region more attractive as a place for global investors to park their money.
Data releases gauge the health of the economy and can impact on the Euro. Indicators such as GDP, Manufacturing and Services PMIs, employment, and consumer sentiment surveys can all influence the direction of the single currency. A strong economy is good for the Euro. Not only does it attract more foreign investment but it may encourage the ECB to put up interest rates, which will directly strengthen the Euro. Otherwise, if economic data is weak, the Euro is likely to fall. Economic data for the four largest economies in the euro area (Germany, France, Italy and Spain) are especially significant, as they account for 75% of the Eurozone’s economy.
Another significant data release for the Euro is the Trade Balance. This indicator measures the difference between what a country earns from its exports and what it spends on imports over a given period. If a country produces highly sought after exports then its currency will gain in value purely from the extra demand created from foreign buyers seeking to purchase these goods. Therefore, a positive net Trade Balance strengthens a currency and vice versa for a negative balance.
New Zealand's QoQ Gross Domestic Product (GDP) growth recovered to 0.2% QoQ during 2024's first quarter, clawing back ground from the previous quarter's flat 0.0%. While New Zealand's over domestic economy improved in Q1, Stats NZ noted that GDP per capita still shrunk -0.3% over the same period.
Stats NZ also went on to note that despite the near-term uptick in GDP growth, New Zealand's GDP only managed a scant 0.2% YoY GDP print for the year ended in March 2024 compared to the previous annual period that ended in March 2023.
Stats NZ noted that New Zealand's Q1 GDP growth came entirely from Primary Services, with steep declines in the Goods-producing sector. New Zealand's overall GDP print was ring-fenced by 73.0% the country's economy being comprised of Services activity in the March quarter.
Economic Indicator
Gross Domestic Product (QoQ)
The Gross Domestic Product (GDP), released by Statistics New Zealand on a quarterly basis, is a measure of the total value of all goods and services produced in New Zealand during a given period. The GDP is considered as the main measure of New Zealand’s economic activity. The QoQ reading compares economic activity in the reference quarter to the previous quarter. Generally, a high reading is seen as bullish for the New Zealand Dollar (NZD), while a low reading is seen as bearish.
Read more.Last release: Wed Jun 19, 2024 22:45
Frequency: Quarterly
Actual: 0.2%
Consensus: 0%
Previous: -
Source: Stats NZ
The Gross Domestic Product (GDP), released by Statistics New Zealand, highlights the overall economic performance on a quarterly basis. The gauge has a significant influence on the Reserve Bank of New Zealand’s (RBNZ) monetary policy decision, in turn affecting the New Zealand dollar. A rise in the GDP rate signifies improvement in the economic conditions, which calls for tighter monetary policy, while a drop suggests deterioration in the activity. An above-forecast GDP reading is seen as NZD bullish.
New Zealand Dollar FAQs
The New Zealand Dollar (NZD), also known as the Kiwi, is a well-known traded currency among investors. Its value is broadly determined by the health of the New Zealand economy and the country’s central bank policy. Still, there are some unique particularities that also can make NZD move. The performance of the Chinese economy tends to move the Kiwi because China is New Zealand’s biggest trading partner. Bad news for the Chinese economy likely means less New Zealand exports to the country, hitting the economy and thus its currency. Another factor moving NZD is dairy prices as the dairy industry is New Zealand’s main export. High dairy prices boost export income, contributing positively to the economy and thus to the NZD.
The Reserve Bank of New Zealand (RBNZ) aims to achieve and maintain an inflation rate between 1% and 3% over the medium term, with a focus to keep it near the 2% mid-point. To this end, the bank sets an appropriate level of interest rates. When inflation is too high, the RBNZ will increase interest rates to cool the economy, but the move will also make bond yields higher, increasing investors’ appeal to invest in the country and thus boosting NZD. On the contrary, lower interest rates tend to weaken NZD. The so-called rate differential, or how rates in New Zealand are or are expected to be compared to the ones set by the US Federal Reserve, can also play a key role in moving the NZD/USD pair.
Macroeconomic data releases in New Zealand are key to assess the state of the economy and can impact the New Zealand Dollar’s (NZD) valuation. A strong economy, based on high economic growth, low unemployment and high confidence is good for NZD. High economic growth attracts foreign investment and may encourage the Reserve Bank of New Zealand to increase interest rates, if this economic strength comes together with elevated inflation. Conversely, if economic data is weak, NZD is likely to depreciate.
The New Zealand Dollar (NZD) tends to strengthen during risk-on periods, or when investors perceive that broader market risks are low and are optimistic about growth. This tends to lead to a more favorable outlook for commodities and so-called ‘commodity currencies’ such as the Kiwi. Conversely, NZD tends to weaken at times of market turbulence or economic uncertainty as investors tend to sell higher-risk assets and flee to the more-stable safe havens.
- GBP/USD pushed above 1.2700 in tepid Wednesday trading.
- US midweek holiday crimped market volumes, hobbling flows.
- BoE expected to hold rates, investors to look for shifts in votes.
GBP/USD elbowed its way firmly above 1.2700 in quiet Wednesday trading as GBP traders gear up for Thursday’s latest outing from the Bank of England (BoE), which is expected to keep rates on hold at 5.25% even as UK economic data continues to miss the mark, but not badly enough to spark institutional fears of an outright recession.
Forex Today: Attention shifts to the BoE and US data
Wednesday markets were throttled after US markets shuttered in observation of the midweek Juneteenth holiday, keeping broad-market volumes on the low side and giving US Dollar counterparties a chance to grind out slim gains. American markets will return to the action on Thursday, just in time for a fresh print in week-on-week US Initial Jobless Claims for the week ended June 14. Median market forecasts are expecting new US jobless benefits seekers to ease slightly to 235K from the previous 242K, but still hold above the four-week running average of 227K.
Before that, the BoE’s latest rate call and the UK central bank’s updated Monetary Policy Report will be released during the London market session. Markets broadly expect the BoE to hold interest rates at 5.25%. The BoE’s Monetary Policy Committee (MPC) voted seven-to-two to keep rates on hold, and market participants will be looking for any changes in the voting figures. Seven MPC members are currently forecast to continue voting in favor of a rate hold and two hopefuls looking for an early rate cut.
GBP/USD technical outlook
The Cable continues to grind stubbornly higher after hitting a near-term low last week around 1.2660. GBP bidding momentum may have run into a hard barrier at the 200-hour Exponential Moving Average (EMA) near 1.2725, and a hard stall could drag bids down towards 1.2650.
Despite a lack of near-term momentum, daily candles remain firmly planted above a technical floor at the 50-day EMA near 1.2675. A heavy supply zone above 1.2800 is weighing on long-term bullish potential, with the bottom end held up by the 200-day EMA at 1.2585.
GBP/USD hourly chart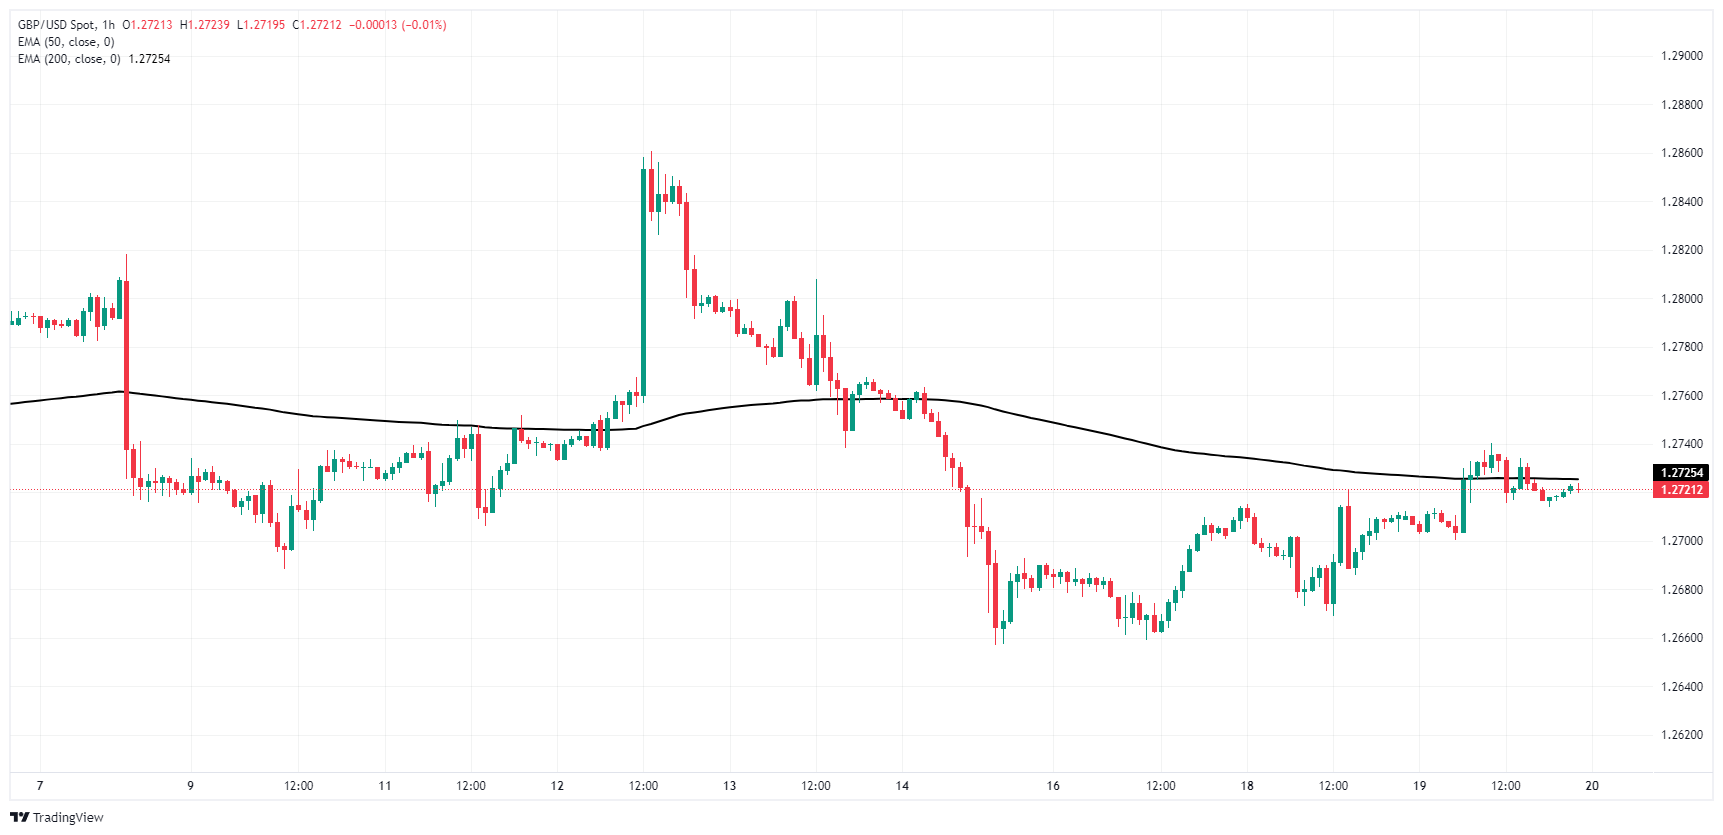
GBP/USD daily chart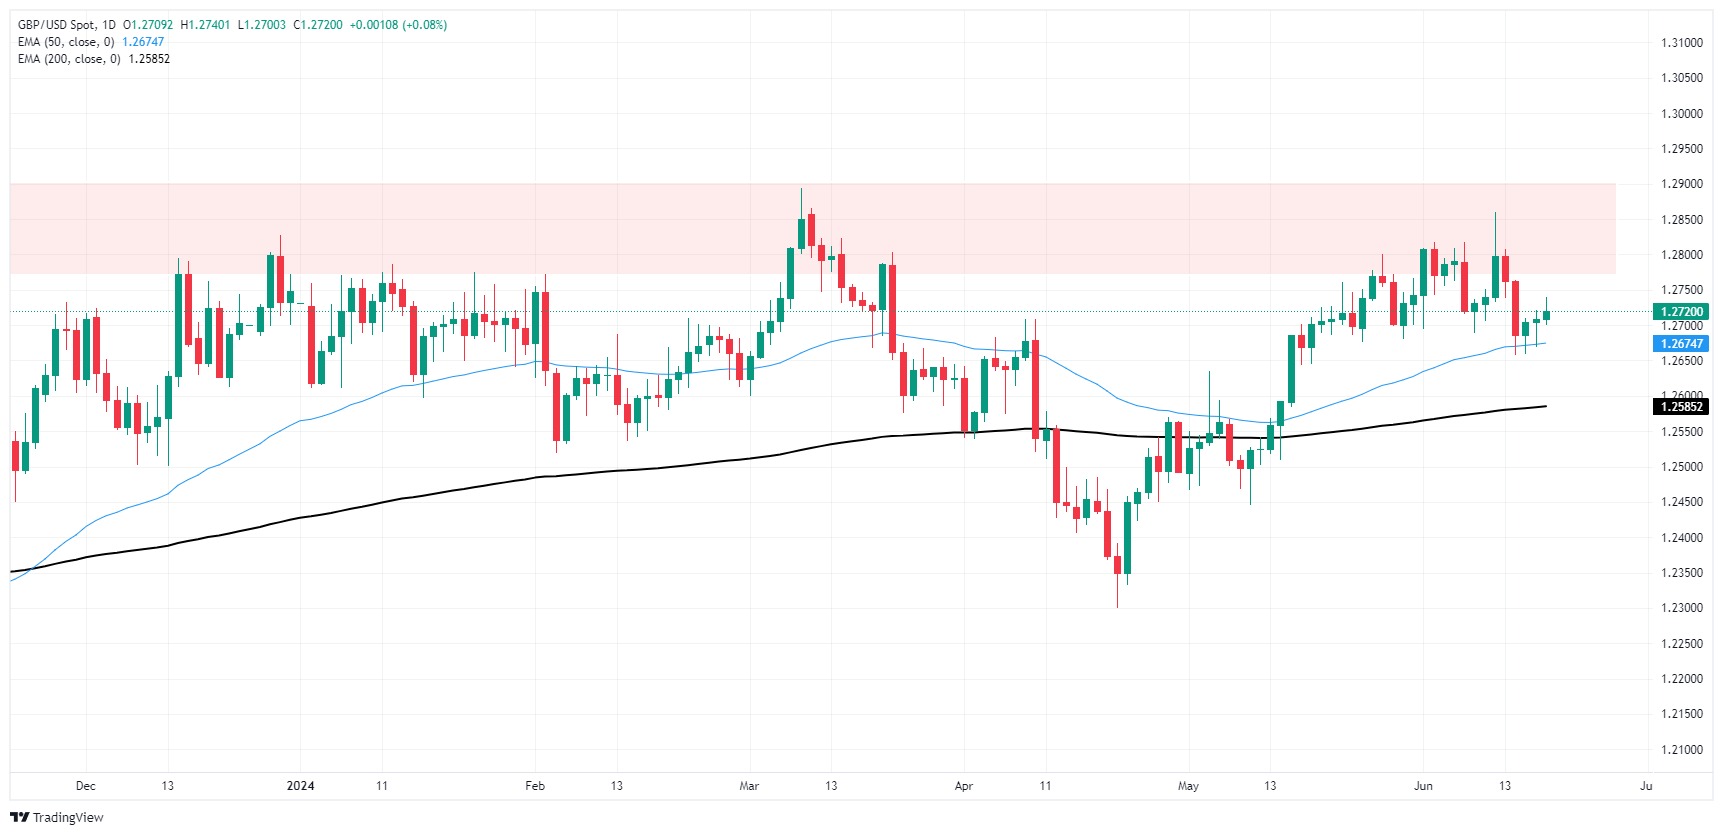
Pound Sterling FAQs
The Pound Sterling (GBP) is the oldest currency in the world (886 AD) and the official currency of the United Kingdom. It is the fourth most traded unit for foreign exchange (FX) in the world, accounting for 12% of all transactions, averaging $630 billion a day, according to 2022 data. Its key trading pairs are GBP/USD, aka ‘Cable’, which accounts for 11% of FX, GBP/JPY, or the ‘Dragon’ as it is known by traders (3%), and EUR/GBP (2%). The Pound Sterling is issued by the Bank of England (BoE).
The single most important factor influencing the value of the Pound Sterling is monetary policy decided by the Bank of England. The BoE bases its decisions on whether it has achieved its primary goal of “price stability” – a steady inflation rate of around 2%. Its primary tool for achieving this is the adjustment of interest rates. When inflation is too high, the BoE will try to rein it in by raising interest rates, making it more expensive for people and businesses to access credit. This is generally positive for GBP, as higher interest rates make the UK a more attractive place for global investors to park their money. When inflation falls too low it is a sign economic growth is slowing. In this scenario, the BoE will consider lowering interest rates to cheapen credit so businesses will borrow more to invest in growth-generating projects.
Data releases gauge the health of the economy and can impact the value of the Pound Sterling. Indicators such as GDP, Manufacturing and Services PMIs, and employment can all influence the direction of the GBP. A strong economy is good for Sterling. Not only does it attract more foreign investment but it may encourage the BoE to put up interest rates, which will directly strengthen GBP. Otherwise, if economic data is weak, the Pound Sterling is likely to fall.
Another significant data release for the Pound Sterling is the Trade Balance. This indicator measures the difference between what a country earns from its exports and what it spends on imports over a given period. If a country produces highly sought-after exports, its currency will benefit purely from the extra demand created from foreign buyers seeking to purchase these goods. Therefore, a positive net Trade Balance strengthens a currency and vice versa for a negative balance.
- USD/JPY remains above Ichimoku Cloud, Tenkan, and Kijun-Sen levels, supporting further upside potential.
- Key resistance levels: 158.25 (June 17 high), 158.44 (April 26 peak), and 160.32 (YTD high).
- Support levels: 157.00, Tenkan-Sen at 156.98, Senkou Span A at 156.16, and Kijun-Sen at 155.93.
The USD/JPY remains flat as Thursday’s Asian session begins, yet it printed minuscule gains of 0.15% on Wednesday. The lack of catalysts and US traders away from their desks in observance of the Juneteenth holiday dried up the FX space, which has remained unmoved since the London close. The major trades at 158.00, virtually unchanged
USD/JPY Price Analysis: Technical outlook
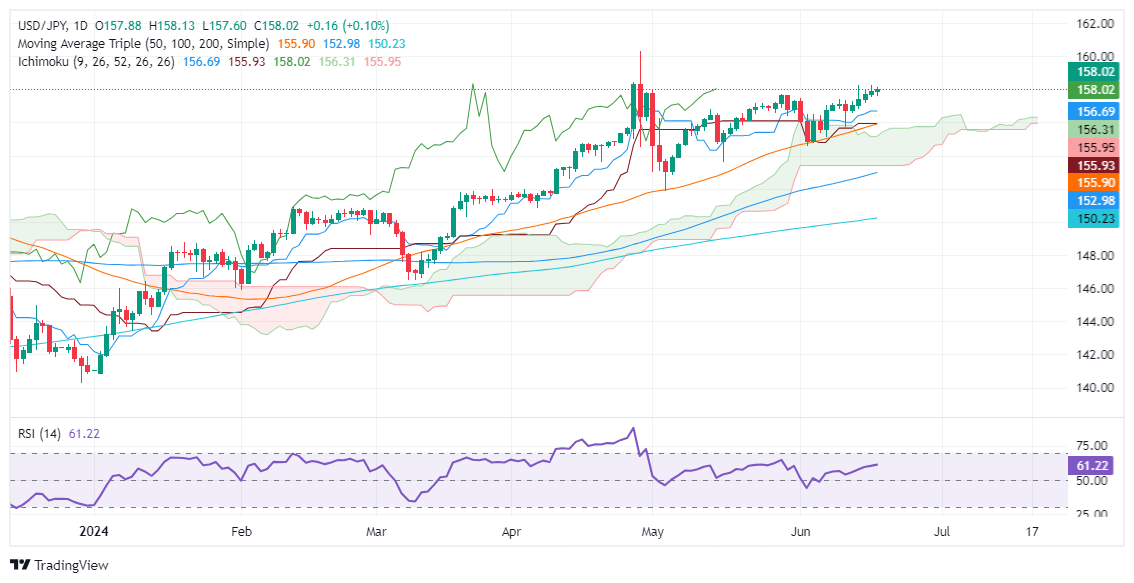
The pair’s uptrend remains intact, with the spot price remaining above the Ichimoku Cloud (Kumo) and on top of the Tenkan and Kijun-Sen levels. Those reasons justify further USD/JPY upside, but fears that Japanese authorities might intervene in the markets keep traders cautious, with the major advancing steadily.
The Relative Strength Index (RSI) remains bullish, supporting buyers.
The first key resistance level they need to clear is the June 17 high of 158.25. Once surpassed, the next stop would be the April 26 peak at 158.44 ahead of the year-to-date (YTD) high of 160.32 would be next.
Conversely, sellers can challenge key support levels if USD/JPY drops below 157.00. The first would be the Tenkan-Sen at 156.98, followed by Senkou Span A at 156.16. Once cleared, the next stop would be the Kijun-Sen at 155.93. The next demand area would be the Senkou Span B at 155.52.
USD/JPY Price Action – Daily Chart
- Barrel bids tested into fresh peaks on Wednesday, but remain subdued.
- With US markets dark for Wednesday's holiday, market flows and volatility remain thin.
- An extended uptick in US Crude Oil supplies could dampen the mood.
West Texas Intermediate (WTI) US Crude Oil tested into fresh Wednesday highs on thin volume, clipping $81.00 per barrel as commodities drift softly higher despite US exchanges shuttered for the Juneteenth holiday. WTI found a new seven-week high and is on pace to extend into a second straight week of gain as Crude Oil recovers from a recent swing low, but bolstered energy market hopes of a summertime upswing in energy demand could slump again if US Crude Oil production continues to outpace draws.
The American Petroleum Institute (API) reported another week-on-week increase in US Weekly Crude Oil Stocks this week, adding another 2.264 million barrels to counts and eating away at the previous week’s -2.428 million barrel decline as US production of Crude Oil continues to overhang on current demand levels.
The Organization of the Petroleum Exporting Countries (OPEC) and its extended network of non-ally countries, OPEC+ is on pace to end voluntary production cuts later in the year that were meant to bolster global Crude Oil prices by crimping production. However, OPEC+ nations that rely on Crude Oil output to balance their government budgets are buckling under the pressure and pumping caps are set to begin phasing out in the third quarter.
Recent demand figures from China also disappointed energy markets, however, barrel traders are pivoting to hope for an ambiguous expected uptick in summertime energy demand to press down on current oversupply. The Energy Information Administration (EIA) will be publishing its own week-on-week barrel counts on Thursday, and barrel traders are hoping for a -2.0 million barrel drawdown for the week ended June 14 after the previous week’s 3.73 million barrel buildup.
WTI technical outlook
WTI US Crude Oil has temporarily halted a technical recovery from the last major swing low into $72.45. WTI has closed in the green for all but four of the last eleven consecutive trading days, and has managed to crack north of the 200-day Exponential Moving Average (EMA) at $78.84. Slack in bullish momentum could pull US Crude Oil back below the 200-day EMA and send WTI into another leg lower, pushing bids back below a descending trendline drawn from 2024’s peak bids around $87.00 per barrel.
WTI daily chart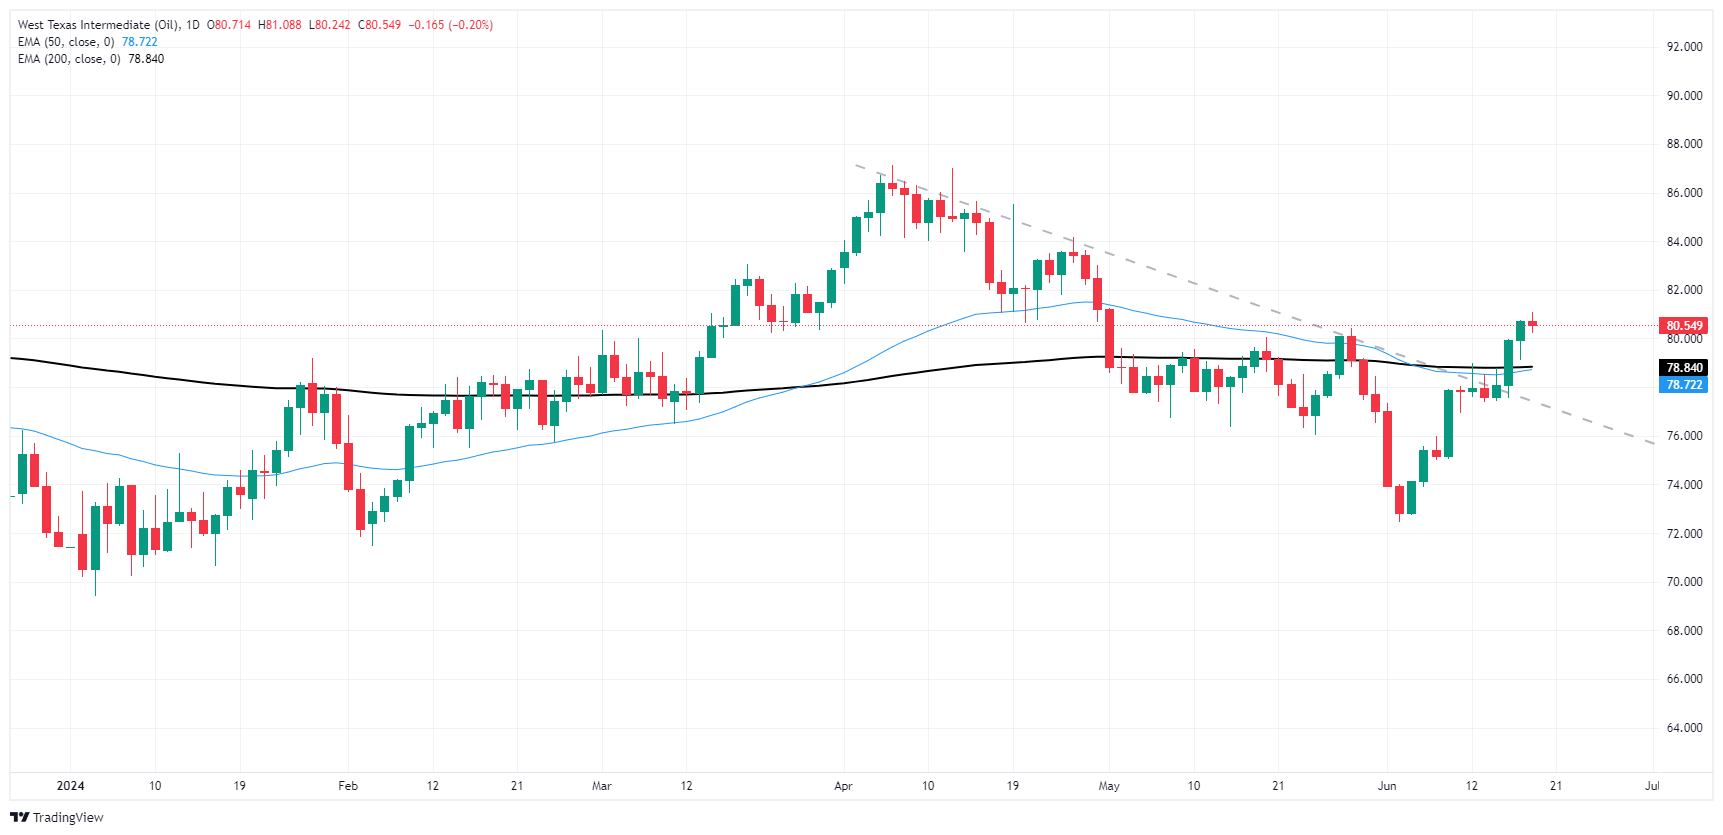
WTI Oil FAQs
WTI Oil is a type of Crude Oil sold on international markets. The WTI stands for West Texas Intermediate, one of three major types including Brent and Dubai Crude. WTI is also referred to as “light” and “sweet” because of its relatively low gravity and sulfur content respectively. It is considered a high quality Oil that is easily refined. It is sourced in the United States and distributed via the Cushing hub, which is considered “The Pipeline Crossroads of the World”. It is a benchmark for the Oil market and WTI price is frequently quoted in the media.
Like all assets, supply and demand are the key drivers of WTI Oil price. As such, global growth can be a driver of increased demand and vice versa for weak global growth. Political instability, wars, and sanctions can disrupt supply and impact prices. The decisions of OPEC, a group of major Oil-producing countries, is another key driver of price. The value of the US Dollar influences the price of WTI Crude Oil, since Oil is predominantly traded in US Dollars, thus a weaker US Dollar can make Oil more affordable and vice versa.
The weekly Oil inventory reports published by the American Petroleum Institute (API) and the Energy Information Agency (EIA) impact the price of WTI Oil. Changes in inventories reflect fluctuating supply and demand. If the data shows a drop in inventories it can indicate increased demand, pushing up Oil price. Higher inventories can reflect increased supply, pushing down prices. API’s report is published every Tuesday and EIA’s the day after. Their results are usually similar, falling within 1% of each other 75% of the time. The EIA data is considered more reliable, since it is a government agency.
OPEC (Organization of the Petroleum Exporting Countries) is a group of 13 Oil-producing nations who collectively decide production quotas for member countries at twice-yearly meetings. Their decisions often impact WTI Oil prices. When OPEC decides to lower quotas, it can tighten supply, pushing up Oil prices. When OPEC increases production, it has the opposite effect. OPEC+ refers to an expanded group that includes ten extra non-OPEC members, the most notable of which is Russia.
- The Kiwi records losses against the Yen but the outlook remains strong.
- Daily chart indicators display resilience, suggesting a potential continuation of the upward trend.
During Wednesday's session, the NZD/JPY pair experienced a mild setback, dropping below the 97.00 point. Nonetheless, the 20-day Simple Moving Average (SMA) at 96.30 demonstrated its resilience once again at the start of the week, effectively staving off the sellers' attempts to breach it.
The daily Relative Strength Index (RSI) for NZD/JPY now registers 61, indicating a decrease from Tuesday's standpoint but still showcasing an overall positive momentum. Conversely, the Moving Average Convergence Divergence (MACD) displays static red bars, suggesting a steady selling pressure.
NZD/JPY daily chart
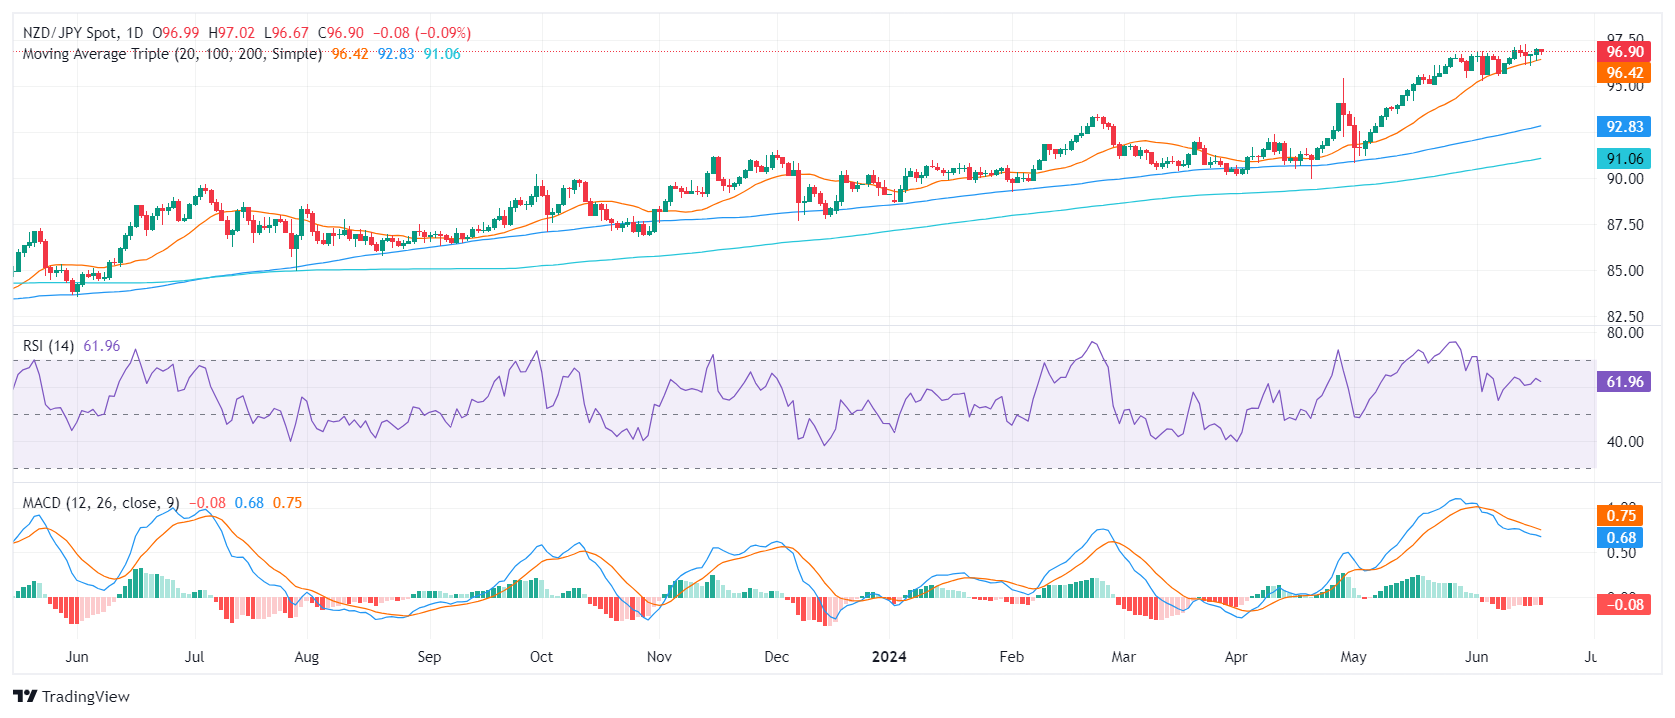
The buyers, in a show of persistence, continue to maintain their positions above the 20-day Simple Moving Average (SMA), reinforcing the bullish trend's sustainability. The persistence of the daily technical indicators suggests a determination among market players to bring an end to the consolidation phase and buyers appear to be making a comeback following a short retreat.
Upcoming trading sessions may see the pair navigate between support levels at 96.30 (20-day SMA) and the resistance level at 97.00.
Westpac New Zealand's quarterly Consumer Confidence Survey reported a decline in aggregate consumer sentiment for the second quarter, with Q2 2024's Consumer Confidence Survey dropping 11 points to 82.2 after the previous climb to 93.2. According to Westpac, surveyed consumers are reported ongoing pressure from high interest rates and large increases in living costs.
New Zealand consumer confidence has fallen once again back into all-time lows, failing to recover significantly from record lows of 75.6 in December of 2022. Westpac noted that declines in consumer confidence across all regions of New Zealand, as well as spread across all age demographics. Consumers also noted a sharp upturn in the unemployment rate specifically amongst those aged 25 years and younger.
Economic Indicator
Westpac Consumer Survey
Confidence measure is an indicator of the mood of consumers or business, released by Westpac New Zealand. It is usually based on a survey during which respondents rate their opinion on different issues concerning current and future economic conditions.
Read more.Last release: Wed Jun 19, 2024 21:00
Frequency: Quarterly
Actual: 82.2
Consensus: -
Previous: 93.2
Source: Westpac New Zealand
New Zealand Dollar FAQs
The New Zealand Dollar (NZD), also known as the Kiwi, is a well-known traded currency among investors. Its value is broadly determined by the health of the New Zealand economy and the country’s central bank policy. Still, there are some unique particularities that also can make NZD move. The performance of the Chinese economy tends to move the Kiwi because China is New Zealand’s biggest trading partner. Bad news for the Chinese economy likely means less New Zealand exports to the country, hitting the economy and thus its currency. Another factor moving NZD is dairy prices as the dairy industry is New Zealand’s main export. High dairy prices boost export income, contributing positively to the economy and thus to the NZD.
The Reserve Bank of New Zealand (RBNZ) aims to achieve and maintain an inflation rate between 1% and 3% over the medium term, with a focus to keep it near the 2% mid-point. To this end, the bank sets an appropriate level of interest rates. When inflation is too high, the RBNZ will increase interest rates to cool the economy, but the move will also make bond yields higher, increasing investors’ appeal to invest in the country and thus boosting NZD. On the contrary, lower interest rates tend to weaken NZD. The so-called rate differential, or how rates in New Zealand are or are expected to be compared to the ones set by the US Federal Reserve, can also play a key role in moving the NZD/USD pair.
Macroeconomic data releases in New Zealand are key to assess the state of the economy and can impact the New Zealand Dollar’s (NZD) valuation. A strong economy, based on high economic growth, low unemployment and high confidence is good for NZD. High economic growth attracts foreign investment and may encourage the Reserve Bank of New Zealand to increase interest rates, if this economic strength comes together with elevated inflation. Conversely, if economic data is weak, NZD is likely to depreciate.
The New Zealand Dollar (NZD) tends to strengthen during risk-on periods, or when investors perceive that broader market risks are low and are optimistic about growth. This tends to lead to a more favorable outlook for commodities and so-called ‘commodity currencies’ such as the Kiwi. Conversely, NZD tends to weaken at times of market turbulence or economic uncertainty as investors tend to sell higher-risk assets and flee to the more-stable safe havens.
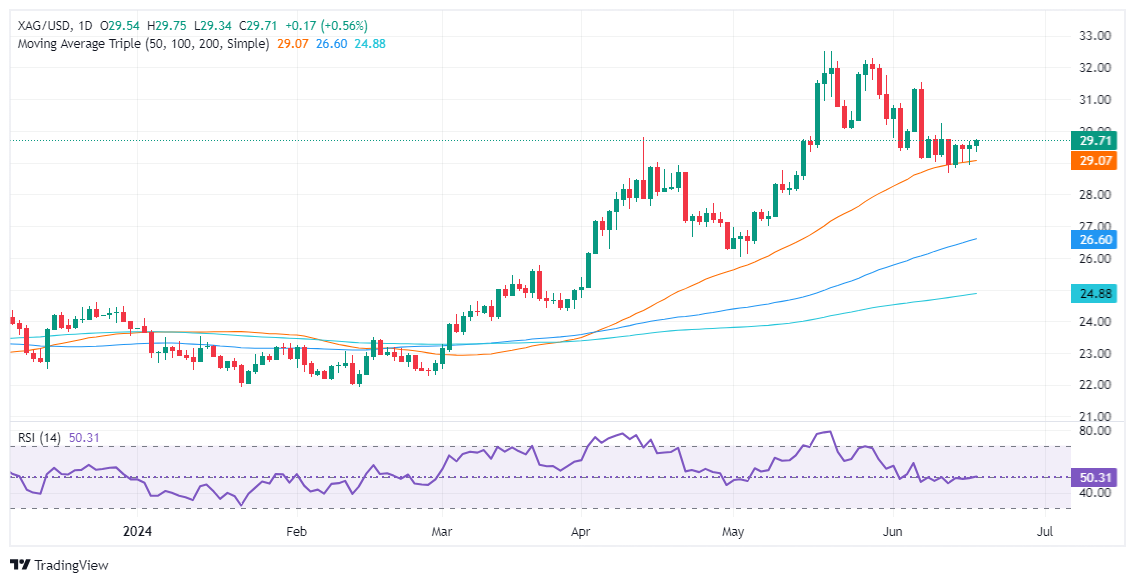
- Silver trades and gains 0.60% after touching a daily low of $29.35.
- Momentum is neutral, with RSI around the 50-neutral line, suggesting buyers and sellers are balanced.
- Key resistance at $30.25 and $31.54, with support levels at $29.05 and $28.66.
Silver climbed during the North American session, gaining more than 0.60% amid thin trading liquidity conditions. Wall Street remained closed in observance of the Juneteenth holiday. The XAG/USD trades at $29.71 after hitting a daily low of $29.35.
XAG/USD Price Analysis: Technical analysis
The grey metal remains neutral to upward bias, despite diving from year-to-date (YTD) highs reached at $32.51, below the $30.00 figure. Silver seems to have bottomed after hitting a monthly low of $28.66; since then, XAG/USD edged higher, and it’s shy of challenging the $30.00 mark.
Momentum shows that neither buyers nor sellers are in charge, as the Relative Strength Index (RSI) hovers around the 50-neutral line.
The most likely scenario would be a bullish continuation if XAG/USD buyers reclaim $30.00, which could reignite Silver’s rally and pave the way for further upside. The next resistance level would be the June 12 high at $30.25, followed by the month-to-date (MTD) high of $31.54, the June 7 peak. A breach of the latter will expose the YTD high of $32.51.
On the other hand, if XAG/USD sellers drag spot prices below the 50-day moving average (DMA) at $29.05, it will expose $29.00. Once cleared, that could expose the MTD low of $28.66, ahead of plunging toward the 100-DMA at $26.60.
XAG/USD Price Action – Daily Chart
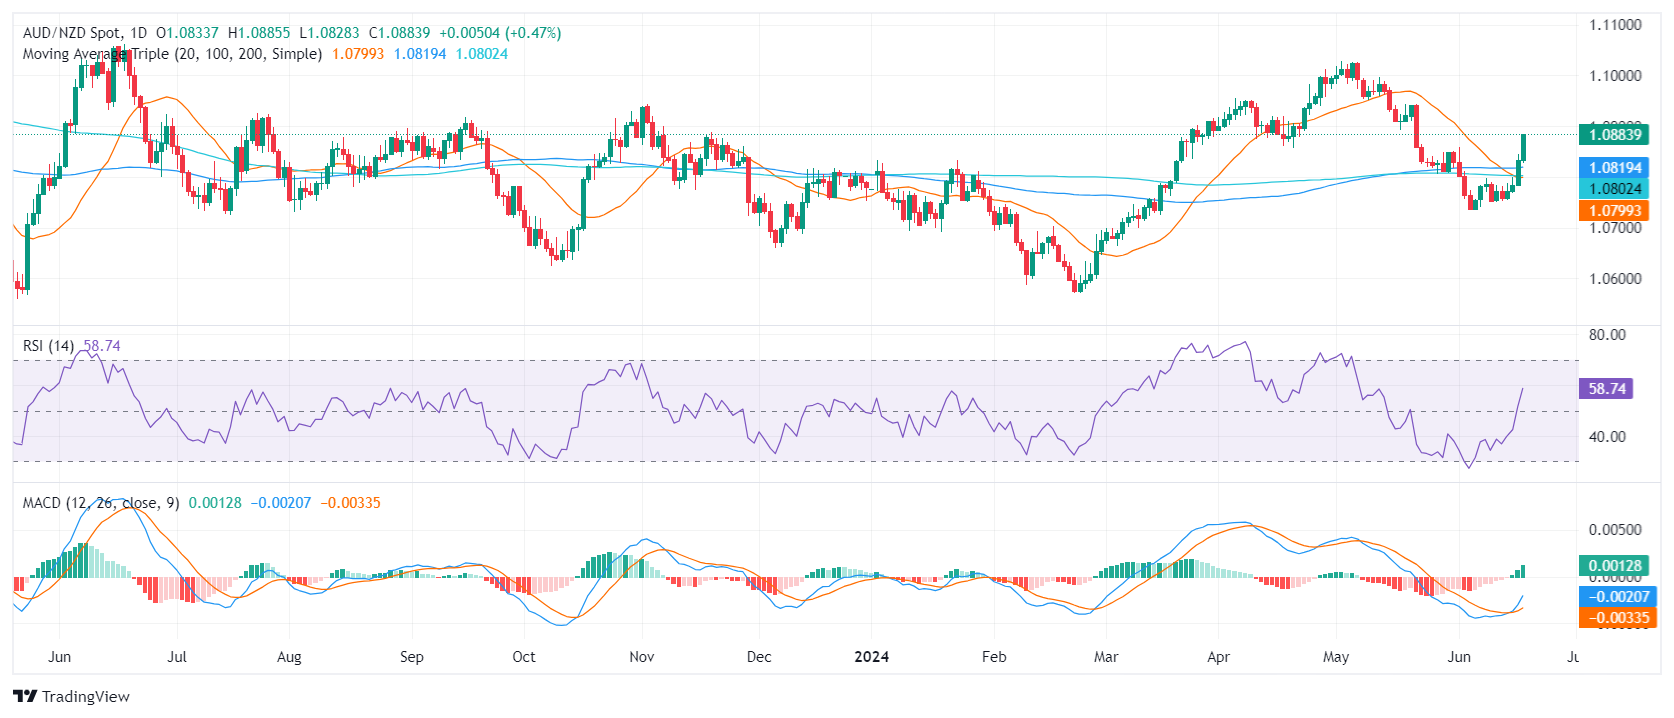
- On Wednesday, the AUD/NZD extended its gains and is up by 1% in the last four sessions.
- New Zealand's Q1 GDP figures will be closely looked at on Thursday’s Asian session.
- Australia's AUD gained momentum post-RBA's hawkish hold with the cash rate maintained at 4.35%.
The AUD/NZD extended its winning streak on Wednesday, to a four-consecutive day rise which saw the pair rise by nearly 1%. Investors are anticipating the upcoming Gross Domestic Product (GDP) revisions from Q1 from New Zealand while continuing to process the Reserve Bank of Australia's (RBA) recent decision.
In New Zealand, recent data signaled a sharp decline in the country's services sector in May. Also, GDP figures showed two consecutive quarters of negative growth, indicating a recession. This has led to heightened speculation that the Reserve Bank of New Zealand (RBNZ) will soon resort to reducing interest rates, with a 25 bps cut expected at the November meeting.
On the Australian front, the AUD found strength following the RBA's hawkish hold. As per expectations, the cash rate remained at 4.35%, with no discussions related to a rate cut. Governor Bullock confirmed that the option of raising rates was deliberated upon during the meeting. Furthermore, the RBA showcased concerns about the inflation scenario and added that they would undertake the required measures to bring inflation back within the target range. In that sense, as the RBA and RBNZ policies diverge, there might be further upside for the cross in place.
AUD/NZD technical analysis
The technical outlook for AUD/NZD appears positive in the short term, with the pair registering a four-day winning streak. In those sessions, indicators recovered with the Relative Strength Index (RSI) jumping back above 50 and the Moving Average Convergence Divergence (MACD) prints rising green bars.
However, as the 20-day Simple Moving Average (SMA) crossed below the 100 and 200-day SMAs, the upward potential may be capped.
AUD/NZD daily chart
- GBP/JPY testing highest bids since August 2008 as Yen flounders.
- Slumping UK data trims Sterling gains, but GBP march continues.
- BoE rate call due Thursday, expected to hold rates steady.
GBP/JPY is holding staunchly on the high side, trading into the 201.00 handle in thin Wednesday action and keeping pinned close to 16-year highs near 201.60. The Guppy trailed into fresh peaks last week and continues to roil close to the top end despite a near-term knockback below 199.00.
UK economic data mostly missed the mark in the front half of the trading week, with headline Consumer Price Index (CPI) inflation and the Retail Price Index both slightly flubbing forecasts. However, GBP traders will be pivoting to face down Thursday’s upcoming Bank of England (BoE) rate call. The BoE’s Monetary Policy Committee (MPC) is broadly expected to vote seven-to-two to keep rates held at 5.25%, with two members of the MPC expected to vote in favor of a rate cut, inline with the previous meeting.
Japanese National Consumer Price Index (CPI) inflation is also due early Friday, with annualized Core National CPI inflation expected to tick upwards to 2.6% from 2.2%. Japanese national-level CPI inflation tends to have a muted effect as the data event is previewed by Tokyo CPI inflation several weeks ahead of time.
Friday will follow up with UK Retail Sales, which are expected to rebound in May, forecast to print at 1.5% MoM versus the previous month’s -2.3% decline. S&P Global Purchasing Managers Index (PMI) activity figures will round out the UK’s economic calendar this week. The UK Manufacturing PMI is expected to tick up to 51.3 from 51.2, wit the Services component expect to make a similar move, forecast to rise to 53.0 from 52.9.
GBP/JPY technical outlook
GBP/JPY pulled itself back upwards after a brief dip below the 200-hour Exponential Moving Average (EMA) at 200.20, but the pair is still trudging through chart paper below last week’s fresh 16-year peak above 201.60.
Bullish momentum is firmly planted front and center, with GBP/JPY trading well north of the 200-day EMA rising towards 190.00. The pair has trading on the high side of the long-term moving average since bouncing from the key technical indicator at the beginning of 2024, and the Guppy is up 12% for the year.
GBP/JPY hourly chart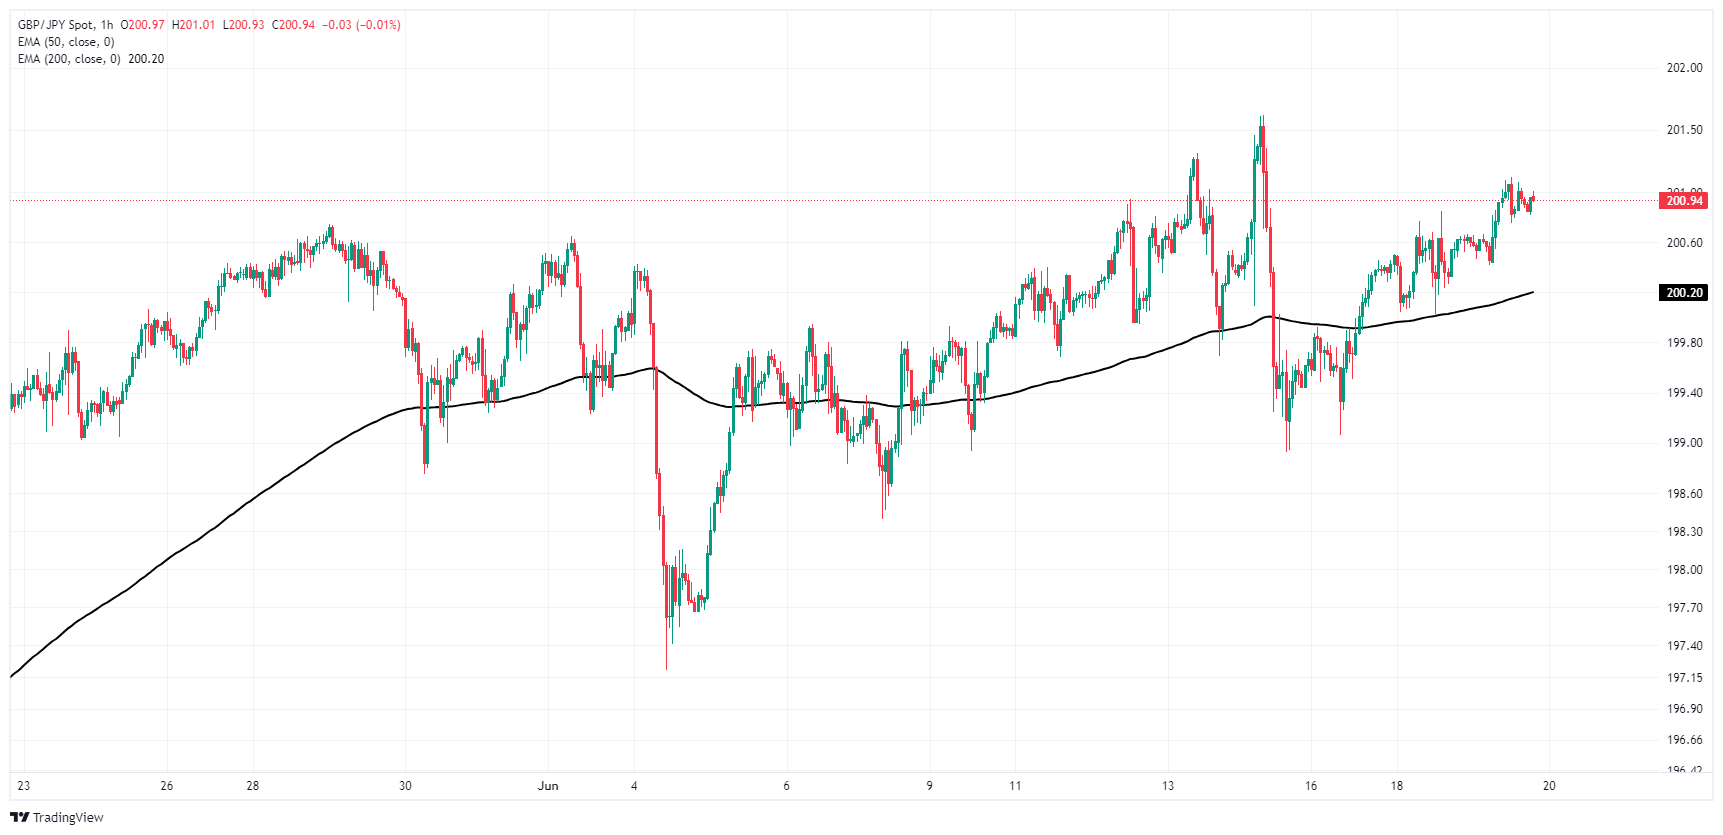
GBP/JPY daily chart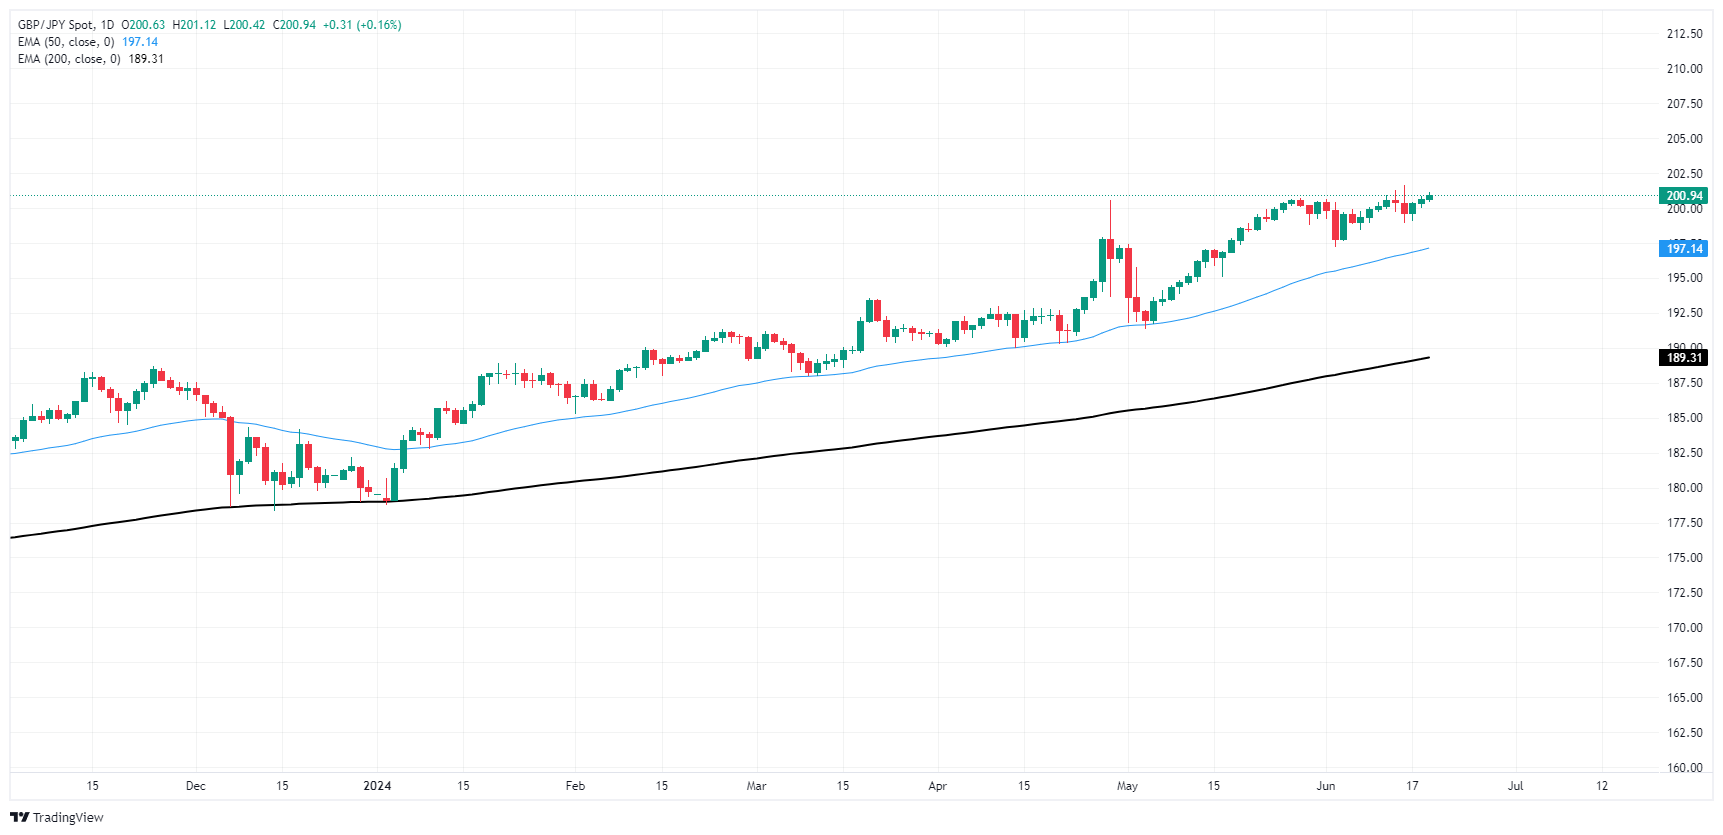
- Gold remains virtually unchanged during the North American session due to thin volume.
- US Retail Sales and Industrial Production data hint at an economic slowdown, boosting rate cut expectations.
- FedWatch Tool shows 67% chance of September rate cut with December 2024 futures implying 36 bps of easing.
Gold's price barely moved Wednesday during the North American session as traders remained absent in observance of the Juneteenth holiday. Data from the United States (US) continued to weaken, a sign of relief for traders who remain confident the Federal Reserve (Fed) will ease policy twice this year. Therefore, precious metals recover some ground, yet XAU/USD is virtually unchanged and trades at $2,328 at the time of writing.
US Retail Sales in May improved compared to April, but they were revised downward, hinting that the economy is slowing down. This data, along with last week’s big consumer inflation report, increased the odds of a September rate cut.
Other data showed that Industrial Production improved in May, followed by a downward revision in April.
The CME FedWatch Tool shows that odds for a 25 basis points (bps) rate cut for September, stands at 67%, up from 61% a day ago. In the meantime, the December 2024 Fed funds futures contract implies the Fed will cut 36 bps toward the end of the year.
In the meantime, Fed speakers entertained Gold traders on Tuesday, saying that inflation remains high and that they need more evidence that inflation is evolving to reach the 2% core inflation goal.
US Treasury bond yields remained subdued. Still, the 10-year Treasury note yield is down one-and-a-half basis points to 4.215%.
Daily digest market movers: Gold price consolidates amid thin liquidity conditions
- US Dollar Index (DXY) is flat at 105.25, a tailwind for Gold prices.
- May’s US Retail Sales improved but failed to underpin the Greenback. However, that and a solid Industrial Production report capped the non-yielding metal’s advance.
- Fed officials counseled patience on interest rate cuts and emphasized they would remain data dependent. Although last week's CPI report was positive, policymakers reiterated they need to see more reports like May’s data.
- Despite the US CPI report showing that the disinflation process continues, Fed Chair Jerome Powell commented that they remain “less confident” about the progress on inflation.
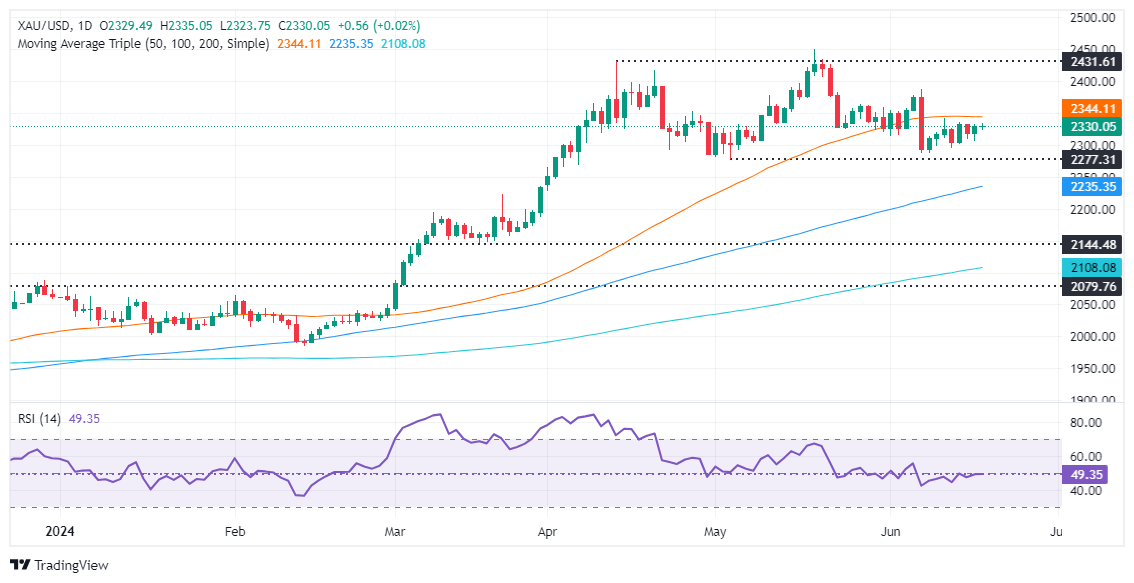
Technical analysis: Gold price remains bearishly biased despite consolidating at around $2,330
The Head-and-Shoulders pattern remains in place, hinting that Gold prices might drop toward the $2,200 figure and below. Momentum suggests that neither buyers nor sellers are in charge as the Relative Strength Index (RSI) meanders around the 50-neutral line.
Due to the presence of a Head-and-Shoulders chart pattern, XAU/USD could be headed to the downside in the near term. That said, if XAU/USD slides past $2,300, the next support would be the May 3 low of $2,277, followed by the March 21 high of $2,222. Further losses lie underneath, with sellers eyeing the Head-and-Shoulders chart pattern objective from $2,170 to $2,160.
On the flipside, if Gold extends its gains past $2,350, key resistance levels emerge like the June 7 cycle high of $2,387, ahead of challenging the $2,400 figure.
Gold FAQs
Gold has played a key role in human’s history as it has been widely used as a store of value and medium of exchange. Currently, apart from its shine and usage for jewelry, the precious metal is widely seen as a safe-haven asset, meaning that it is considered a good investment during turbulent times. Gold is also widely seen as a hedge against inflation and against depreciating currencies as it doesn’t rely on any specific issuer or government.
Central banks are the biggest Gold holders. In their aim to support their currencies in turbulent times, central banks tend to diversify their reserves and buy Gold to improve the perceived strength of the economy and the currency. High Gold reserves can be a source of trust for a country’s solvency. Central banks added 1,136 tonnes of Gold worth around $70 billion to their reserves in 2022, according to data from the World Gold Council. This is the highest yearly purchase since records began. Central banks from emerging economies such as China, India and Turkey are quickly increasing their Gold reserves.
Gold has an inverse correlation with the US Dollar and US Treasuries, which are both major reserve and safe-haven assets. When the Dollar depreciates, Gold tends to rise, enabling investors and central banks to diversify their assets in turbulent times. Gold is also inversely correlated with risk assets. A rally in the stock market tends to weaken Gold price, while sell-offs in riskier markets tend to favor the precious metal.
The price can move due to a wide range of factors. Geopolitical instability or fears of a deep recession can quickly make Gold price escalate due to its safe-haven status. As a yield-less asset, Gold tends to rise with lower interest rates, while higher cost of money usually weighs down on the yellow metal. Still, most moves depend on how the US Dollar (USD) behaves as the asset is priced in dollars (XAU/USD). A strong Dollar tends to keep the price of Gold controlled, whereas a weaker Dollar is likely to push Gold prices up.
The FX universe traded in a flattish mood on Tuesday, while investors remained mainly focused on the timing of Fed rate cuts. Next of note will be the release of UK inflation data ahead of the BoE gathering, while flash PMIs will close the week.
Here is what you need to know on Thursday, June 20:
The USD Index (DXY) ended the session barely changed amidst reduced activity in response to the Juneteenth Day holiday. The weekly Mortgage Applications by MBA are due on June 20, seconded by Building Permits, Housing Starts, the Philly Fed Manufacturing Index, the usual Initial Jobless Claims, and the speech by the Fed’s Barkin.
EUR/USD advanced marginally and managed to retest the 1.0750 zone amidst the irresolute price action in the US Dollar. On June 20, the European Commission will release its advanced gauge of Consumer Confidence.
GBP/USD edged further up and kept the optimism well in place following the UK CPI results and ahead of Thursday’s BoE event. The BoE is expected to keep its policy rate unchanged on June 20.
USD/JPY rose for the fifth session in a row, although it failed to retest or surpass the 158.00 barrier. The weekly Foreign Bond Investment figures are expected on June 20.
AUD/USD picked up extra pace and added to Tuesday’s gains, re-shifting its attention to the 0.6700 hurdle. In Oz, the next release of note will be the flash Judo Bank Manufacturing and Services PMIs on June 20.
Prices of WTI reached a new high past the $81.00 mark per barrel, although that initial move fizzled out afterwards, leaving the commodity slightly on the defensive for the day.
Prices of Gold navigated a narrow range around $2,330 per troy ounce amidst the Dollar’s inconclusive session and the inactivity in the US money markets. Silver, instead, climbed to five-day highs and approached the key $30.00 mark per ounce.
- Australian Dollar regains ground lost in recent sessions, buoyed by RBA hawkish hold.
- Aussie might gain further ground as the RBA will probably be one of the last G10 central banks to cut interest rates.
- There won’t be any relevant economic highlights on Wednesday for Aussie.
In Wednesday's session, the Australian Dollar (AUD) continued to smile and trade with gains against its peers following the Reserve Bank of Australia’s (RBA) hawkish hold on Tuesday.
While traces of weakness persist in the Australian economy, continuing high inflation prompted the RBA to delay any prospective rate cuts. This move positions the RBA to be among the last G10 central banks to initiate rate cuts, a factor that could bring sustained gains for the Aussie. The next highlights will be in Friday’s sessions when Australia releases Judo PMI figures from June.
Daily digest market movers: AUD continues strong following RBA’s decision
- In accordance with anticipation, RBA held a restrained tone and maintained its official cash rate (OCR) at 4.35%, noting that "the Board is not ruling anything in or out."
- Governor Bullock further clarified the RBA's position during her press conference by confirming rate hike discussions and negating the consideration of rate cuts at this time.
- She emphasized the RBA's persisting concerns over inflation, suggesting a high threshold for policy easing.
- RBA maintained its observation that "inflation remains above target and is proving persistent", reiterating that "the Board expects that it will be some time yet before inflation is sustainably in the target range."
- Money market anticipates approximately 50 bps of easing by December 2025, with possibilities of rate hikes in August and September not being entirely dismissed.
- On the negative side for the Aussie, the slow momentum in the Chinese economy, particularly the persistent failure to regain strong traction post-pandemic, may pose additional challenges for the Australian currency.
Technical analysis: Bullish signals rebound but await confirmation
Technical indicators show signs of recovery with the Relative Strength Index (RSI) once again moving above 50, suggesting a potential change in momentum toward buying. The Moving Average Convergence Divergence (MACD) is illustrating a decline in red bars, which hints at an easing selling pressure.
However, for the signals to switch to buying, the AUD/USD pair needs to clear the 20-day Simple Moving Average (SMA). Until this hurdle is overcome, it cannot be seen as a confirmed buying signal.
Australian Dollar FAQs
One of the most significant factors for the Australian Dollar (AUD) is the level of interest rates set by the Reserve Bank of Australia (RBA). Because Australia is a resource-rich country another key driver is the price of its biggest export, Iron Ore. The health of the Chinese economy, its largest trading partner, is a factor, as well as inflation in Australia, its growth rate and Trade Balance. Market sentiment – whether investors are taking on more risky assets (risk-on) or seeking safe-havens (risk-off) – is also a factor, with risk-on positive for AUD.
The Reserve Bank of Australia (RBA) influences the Australian Dollar (AUD) by setting the level of interest rates that Australian banks can lend to each other. This influences the level of interest rates in the economy as a whole. The main goal of the RBA is to maintain a stable inflation rate of 2-3% by adjusting interest rates up or down. Relatively high interest rates compared to other major central banks support the AUD, and the opposite for relatively low. The RBA can also use quantitative easing and tightening to influence credit conditions, with the former AUD-negative and the latter AUD-positive.
China is Australia’s largest trading partner so the health of the Chinese economy is a major influence on the value of the Australian Dollar (AUD). When the Chinese economy is doing well it purchases more raw materials, goods and services from Australia, lifting demand for the AUD, and pushing up its value. The opposite is the case when the Chinese economy is not growing as fast as expected. Positive or negative surprises in Chinese growth data, therefore, often have a direct impact on the Australian Dollar and its pairs.
Iron Ore is Australia’s largest export, accounting for $118 billion a year according to data from 2021, with China as its primary destination. The price of Iron Ore, therefore, can be a driver of the Australian Dollar. Generally, if the price of Iron Ore rises, AUD also goes up, as aggregate demand for the currency increases. The opposite is the case if the price of Iron Ore falls. Higher Iron Ore prices also tend to result in a greater likelihood of a positive Trade Balance for Australia, which is also positive of the AUD.
The Trade Balance, which is the difference between what a country earns from its exports versus what it pays for its imports, is another factor that can influence the value of the Australian Dollar. If Australia produces highly sought after exports, then its currency will gain in value purely from the surplus demand created from foreign buyers seeking to purchase its exports versus what it spends to purchase imports. Therefore, a positive net Trade Balance strengthens the AUD, with the opposite effect if the Trade Balance is negative.
The Bank of Canada's (BoC) latest Summary of Deliberations revealed little of note on Wednesday, although several members of the BoC's Governing Council are growing cautious about downside risks and the possibility of a widening divergence between Canada and the US on economic policy.
Key highlights
- Members agreed to emphasize in communications that they would take rate decisions one meeting at a time.
- Some members were more focused on the downside risks to inflation stemming from the weak economy and restrictive monetary policy.
- Members spent considerable time discussing risks around inflation path, such as large number of households renewing mortgages at higher rates in 2025.
- Ahead of the Bank of Canada's June 5th rate announcement, the governing council considered the merits of waiting until July 24th to cut rates.
- Members discussed the potential for divergence with US, agreed not close to reaching limits of such divergence.
- Others put more weight on upside risks associated with persistence in wage growth and potential for housing market rebound.
- Other risks include rate cuts leading to an overheated housing market, strong wage growth and weak productivity pushing up service price inflation.
- Mexican Peso edges down after recovering over the past five trading days, exchanging hands at 18.41 against the US Dollar.
- Political developments, including judiciary reform, weigh on sentiment, sparking flows out of the Peso.
- Fed officials maintain cautious stance on inflation, affecting market expectations on monetary policy.
The Mexican Peso registers minuscule losses versus the US Dollar on Wednesday after recovering some ground in the last five trading days. A scarce economic docket in Mexico and the United States (US) leaves the emerging market currency leaning on political developments. The USD/MXN trades at 18.41, up 0.08%.
Traders remain risk averse as European bourses finished Wednesday’s session with losses. The Greenback trades with losses against most G7 currencies while advancing against emerging market currencies.
Data from Mexico suggests the economy remains robust, while traders eye the release of April’s Retail Sales report. In the meantime, investors remain attentive to politics after President Andres Manuel Lopez Obrador (AMLO) reiterated that the judiciary reform would likely be approved in September.
On Monday, presumptive President Claudia Sheinbaum revealed a poll in which citizens approved a reform that allows the popular election of Supreme Court ministers, magistrates and judges. “These polls are information, they don't have another objective,” Sheinbaum said in a press conference. “This is just information to be considered in the discussions starting in the coming days.”
Aside from this, Federal Reserve officials remained cautious about inflation and the commencement of the easing cycle. Most considered inflation high, monetary policy appropriate, and the possibility of cutting rates once they gain confidence in the disinflation process.
Although policymakers are not considering a rate hike, St. Louis Fed President Alberto Musalem stated that if inflation stalls, he will favor an increase to the fed funds rate.
Despite that, the USD/MXN exchange rate would continue to be driven by political uncertainty as some of the reforms pushed by AMLO to change the Mexican Constitution threaten the state of law.
Daily digest market movers: Mexican Peso on defensive amid risk aversion
- Mexican Retail Sales are expected to decrease further, estimated at -0.3% MoM, worse than March’s -0.2% contraction. They are expected to jump from -1.7% to 1.5% for the twelve months to April.
- USD/MXN stabilizes following last week’s verbal intervention by Banxico Governor Victoria Rodriguez Ceja, who said the central bank is attentive to volatility in the Mexican currency exchange rate and could act to restore “order” in markets.
- Wednesday’s data and Mexican currency depreciation could deter Banxico from easing its policy at the next meeting on June 27. A rate cut could weaken the Mexican Peso and expose the USD/MXN year-to-date high at 18.99.
- CME FedWatch Tool shows odds for a 25-basis-point rate cut by the Fed stand at 59.5%, down from 62% a day ago.
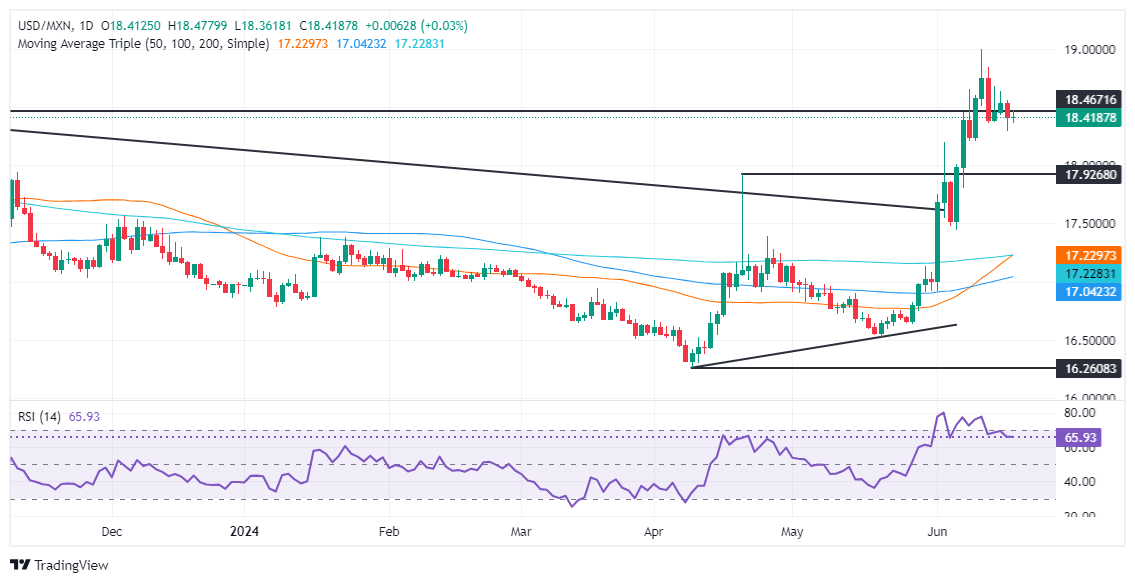
Technical analysis: Mexican Peso wavers around 18.40
The USD/MXN uptrend continues even though the pair dipped to a five-day low of 18.29 as momentum shows buyers are in charge. The Relative Strength Index (RSI) is bullish above the 50-neutral line, hinting that bullish momentum is intact.
For a bullish continuation, the USD/MXN must clear 18.50 if buyers want to retest the year-to-date high of 18.99. A breach of the latter will expose the March 20, 2023, high of 19.23. If cleared, that will sponsor an uptick to 19.50, ahead of the psychological 20.00 mark.
Conversely, if sellers push prices below the April 19 high of 18.15, the exotic pair will be kept within the 18.00-18.15 range.
Mexican Peso FAQs
The Mexican Peso (MXN) is the most traded currency among its Latin American peers. Its value is broadly determined by the performance of the Mexican economy, the country’s central bank’s policy, the amount of foreign investment in the country and even the levels of remittances sent by Mexicans who live abroad, particularly in the United States. Geopolitical trends can also move MXN: for example, the process of nearshoring – or the decision by some firms to relocate manufacturing capacity and supply chains closer to their home countries – is also seen as a catalyst for the Mexican currency as the country is considered a key manufacturing hub in the American continent. Another catalyst for MXN is Oil prices as Mexico is a key exporter of the commodity.
The main objective of Mexico’s central bank, also known as Banxico, is to maintain inflation at low and stable levels (at or close to its target of 3%, the midpoint in a tolerance band of between 2% and 4%). To this end, the bank sets an appropriate level of interest rates. When inflation is too high, Banxico will attempt to tame it by raising interest rates, making it more expensive for households and businesses to borrow money, thus cooling demand and the overall economy. Higher interest rates are generally positive for the Mexican Peso (MXN) as they lead to higher yields, making the country a more attractive place for investors. On the contrary, lower interest rates tend to weaken MXN.
Macroeconomic data releases are key to assess the state of the economy and can have an impact on the Mexican Peso (MXN) valuation. A strong Mexican economy, based on high economic growth, low unemployment and high confidence is good for MXN. Not only does it attract more foreign investment but it may encourage the Bank of Mexico (Banxico) to increase interest rates, particularly if this strength comes together with elevated inflation. However, if economic data is weak, MXN is likely to depreciate.
As an emerging-market currency, the Mexican Peso (MXN) tends to strive during risk-on periods, or when investors perceive that broader market risks are low and thus are eager to engage with investments that carry a higher risk. Conversely, MXN tends to weaken at times of market turbulence or economic uncertainty as investors tend to sell higher-risk assets and flee to the more-stable safe havens.
- Canadian Dollar trades tightly during the mid-week market session.
- Canada relegated to strictly mid-tier data releases for the rest of the week.
- BoC Summary of Deliberations is unlikely to deliver anything new.
The Canadian Dollar (CAD) is treading water on Wednesday, trading within a scant tenth of a percent against its largest peer — the US Dollar (USD). US markets are shuttered for the midweek Juneteenth holiday, thinning out market volumes as investors look ahead to key data prints on Friday.
Canada has only mid-tier data releases on the docket for the remainder of the trading week. CAD traders will watch Wednesday’s latest Summary of Deliberations from the Bank of Canada (BoC), but no major revelations are expected. With US markets shuttered for the holiday, trading volumes are thin and investors will be returning to the fold in force to hunker down and wait for Friday’s US Purchasing Managers Index (PMI) print.
Daily digest market movers: Canadian Dollar treads water on quiet Wednesday
- The Canadian Dollar has been on a slow grind this week, finding thin gains against the Greenback. From the week's opening bids, the CAD is up a scant fifth of a percent against the USD.
- The BoC’s Summary of Deliberations, slated for release midway through the US Wednesday session, is not expected to bring any new details to the BoC’s policy stance.
- Risk appetite is stubbornly holding on balance as investors brush off a wave of cautious talking points from Federal Reserve (Fed) officials this week. Policymakers still want to see more signs of cooling inflation in the US before committing to even discussing rate cuts.
- Interest rate markets are still staunchly committed to hopes for a September rate cut. According to the CME’s FedWatch tool, rate traders are pricing in nearly 70% odds of at least a quarter-point rate trim from the Federal Open Market Committee (FOMC) at the September 18 meeting.
- Before Friday’s US PMI print, Thursday will deliver a week-on-week update to US Initial Jobless Claims, a popular bellwether for near-term economic performance.
Canadian Dollar PRICE Today
The table below shows the percentage change of Canadian Dollar (CAD) against listed major currencies today. Canadian Dollar was the strongest against the New Zealand Dollar.
| USD | EUR | GBP | JPY | CAD | AUD | NZD | CHF | |
|---|---|---|---|---|---|---|---|---|
| USD | -0.07% | -0.09% | 0.06% | -0.04% | -0.23% | 0.20% | -0.01% | |
| EUR | 0.07% | -0.03% | 0.14% | 0.02% | -0.15% | 0.28% | 0.06% | |
| GBP | 0.09% | 0.03% | 0.16% | 0.05% | -0.13% | 0.31% | 0.10% | |
| JPY | -0.06% | -0.14% | -0.16% | -0.10% | -0.28% | 0.15% | -0.05% | |
| CAD | 0.04% | -0.02% | -0.05% | 0.10% | -0.18% | 0.25% | 0.05% | |
| AUD | 0.23% | 0.15% | 0.13% | 0.28% | 0.18% | 0.44% | 0.24% | |
| NZD | -0.20% | -0.28% | -0.31% | -0.15% | -0.25% | -0.44% | -0.21% | |
| CHF | 0.01% | -0.06% | -0.10% | 0.05% | -0.05% | -0.24% | 0.21% |
The heat map shows percentage changes of major currencies against each other. The base currency is picked from the left column, while the quote currency is picked from the top row. For example, if you pick the Canadian Dollar from the left column and move along the horizontal line to the US Dollar, the percentage change displayed in the box will represent CAD (base)/USD (quote).
Technical analysis: Canadian Dollar churns in place on Wednesday, USD/CAD finds a floor at 1.3700
The Canadian Dollar (CAD) is trading thin on Wednesday, holding close to flat against the Greenback and stuck within a fifth of a percent across the major currency board. USD/CAD eased back to the 1.3700 handle before finding a floor in the midweek markets session, but the pair is trading into the low side of median bids at the 200-hour Exponential Moving Average (EMA) near 1.3725.
Despite a lack of near-term momentum, the CAD is slowly grinding out thin gains against the US Dollar. The USD/CAD has closed flat or down for all but one of the last seven straight trading days, and Wednesday is firmly on pace to chalk in an eighth. The pair is still holding on the high side of the 50-day EMA at 1.3675 and remains trapped in bull country above the 200-day EMA at 1.3578.
USD/CAD hourly chart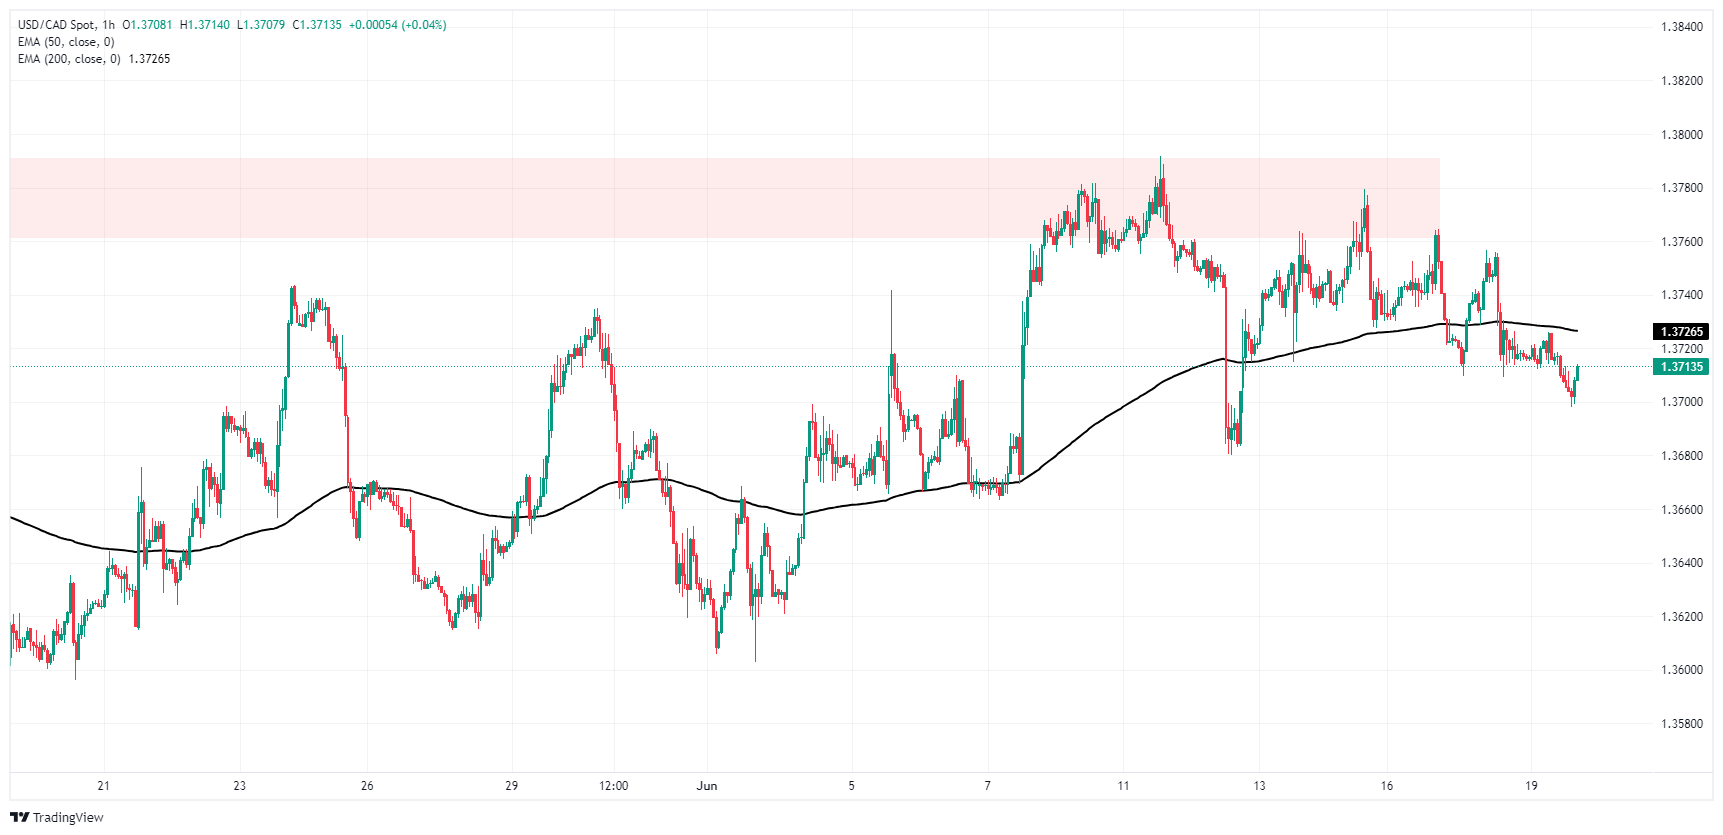
USD/CAD daily chart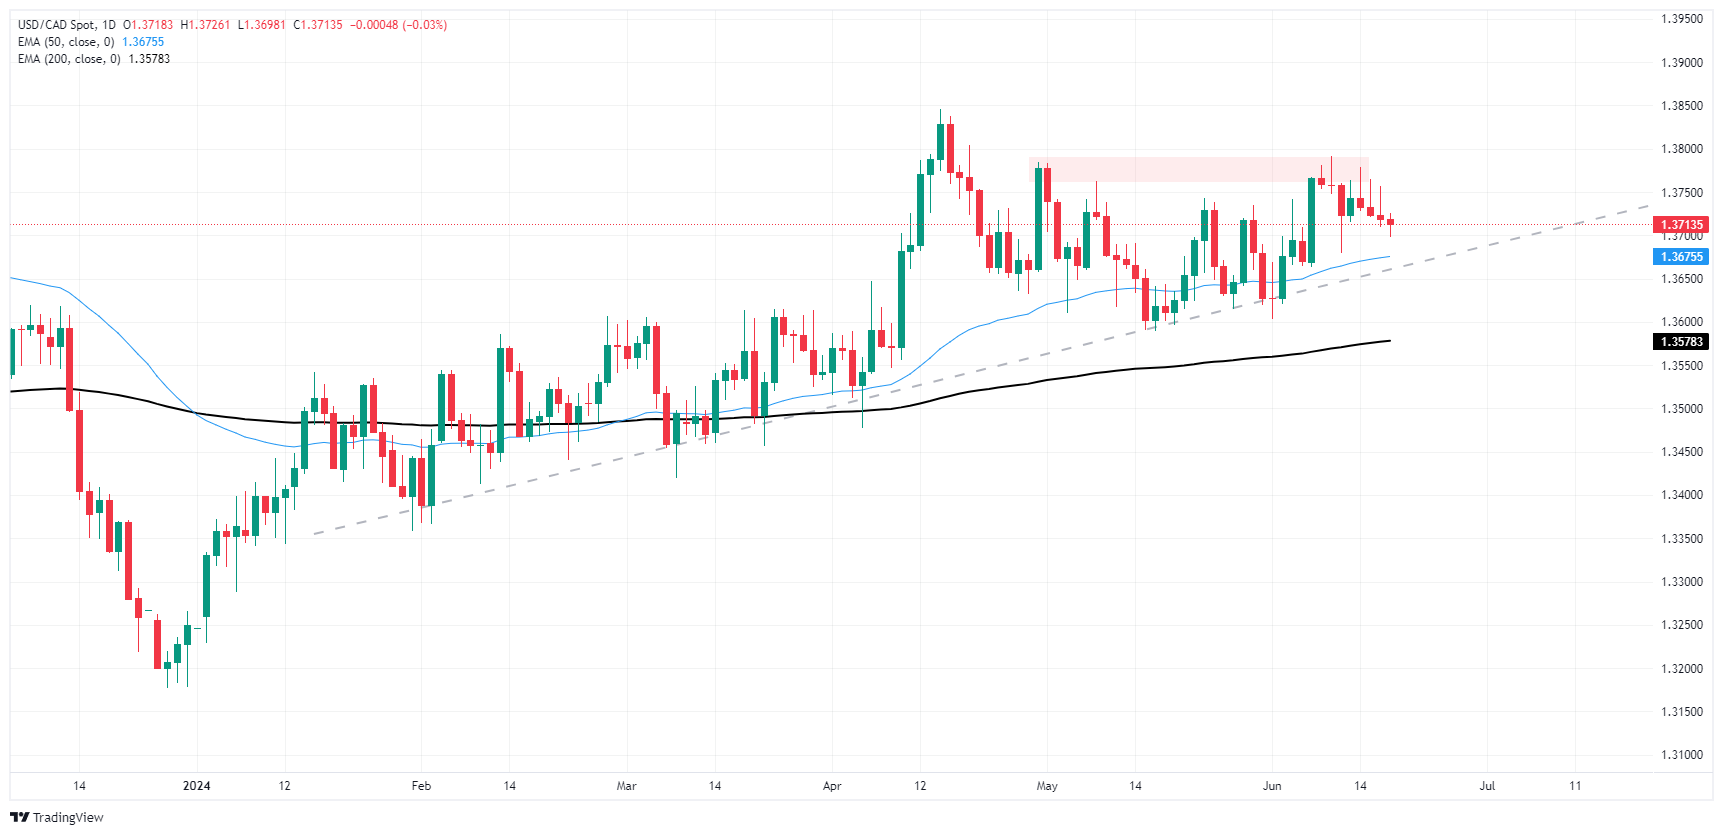
Canadian Dollar FAQs
The key factors driving the Canadian Dollar (CAD) are the level of interest rates set by the Bank of Canada (BoC), the price of Oil, Canada’s largest export, the health of its economy, inflation and the Trade Balance, which is the difference between the value of Canada’s exports versus its imports. Other factors include market sentiment – whether investors are taking on more risky assets (risk-on) or seeking safe-havens (risk-off) – with risk-on being CAD-positive. As its largest trading partner, the health of the US economy is also a key factor influencing the Canadian Dollar.
The Bank of Canada (BoC) has a significant influence on the Canadian Dollar by setting the level of interest rates that banks can lend to one another. This influences the level of interest rates for everyone. The main goal of the BoC is to maintain inflation at 1-3% by adjusting interest rates up or down. Relatively higher interest rates tend to be positive for the CAD. The Bank of Canada can also use quantitative easing and tightening to influence credit conditions, with the former CAD-negative and the latter CAD-positive.
The price of Oil is a key factor impacting the value of the Canadian Dollar. Petroleum is Canada’s biggest export, so Oil price tends to have an immediate impact on the CAD value. Generally, if Oil price rises CAD also goes up, as aggregate demand for the currency increases. The opposite is the case if the price of Oil falls. Higher Oil prices also tend to result in a greater likelihood of a positive Trade Balance, which is also supportive of the CAD.
While inflation had always traditionally been thought of as a negative factor for a currency since it lowers the value of money, the opposite has actually been the case in modern times with the relaxation of cross-border capital controls. Higher inflation tends to lead central banks to put up interest rates which attracts more capital inflows from global investors seeking a lucrative place to keep their money. This increases demand for the local currency, which in Canada’s case is the Canadian Dollar.
Macroeconomic data releases gauge the health of the economy and can have an impact on the Canadian Dollar. Indicators such as GDP, Manufacturing and Services PMIs, employment, and consumer sentiment surveys can all influence the direction of the CAD. A strong economy is good for the Canadian Dollar. Not only does it attract more foreign investment but it may encourage the Bank of Canada to put up interest rates, leading to a stronger currency. If economic data is weak, however, the CAD is likely to fall.
- US Dollar pauses as investors dissect recent comments from Federal Reserve officials.
- Markets appear skeptical about the Fed's guidance and continue to anticipate potential cuts in September.
- Fed officials' cautious remarks limit downside in the US Dollar.
On Wednesday, the US Dollar as measured by the DXY Index (DXY) remained relatively unchanged around the 105.20 mark as investors parsed words from key Federal Reserve (Fed) officials on a quiet Wednesday. Following last week’s 0.50% gain, the index is tallying a three-day losing streak.
The US economic outlook is starting to show some signs of weakness. If data continues to fuel hopes of a September interest rate cut, the USD may struggle.
Daily digest market movers: US Dollar flat as markets wrestle with Fed remarks
- Cleveland Federal Reserve President Loretta Mester voiced a preference for a "longer run of good-looking inflation data" before making a firm decision.
- Minneapolis Fed President Neel Kashkari expressed that waiting until December to cut interest rates could be a “reasonable prediction."
- Philadelphia Federal Reserve President Patrick Harker proposed the likelihood of the Fed keeping rates steady for longer than the market currently anticipates.
- On a more dovish note, Fed Governor Adriana Kugler suggested that if economic conditions continue to show improvements, the Fed could consider additional rate reductions.
- Her colleague, Richmond Federal Reserve President Thomas Barkin, similarly indicated his readiness to back a rate cut but would need more data before doing so.
- According to the CME Group's FedWatch Tool, the probability of lower interest rates by the upcoming meeting on September 18 now stands at about 67%, which clashes with Fed guidance that hinted at only one cut in 2024.
DXY technical analysis: Momentum falters, but bullish sentiment persists
Technical indicators displayed flat momentum for Wednesday's session, yet the broader outlook remains optimistic. The Relative Strength Index (RSI) maintains above 50, with the Moving Average Convergence Divergence (MACD) still showcasing green bars that point toward bullish sentiment.
Additionally, the DXY continues to hold above its 20, 100 and 200-day Simple Moving Averages (SMA), which, coupled with investors' apparent pause, presents a persistent bullish outlook for the US Dollar. However, these indicators suggest that the previous week's momentum may be starting to wane, contributing to a consolidation phase in the DXY.
US Dollar FAQs
The US Dollar (USD) is the official currency of the United States of America, and the ‘de facto’ currency of a significant number of other countries where it is found in circulation alongside local notes. It is the most heavily traded currency in the world, accounting for over 88% of all global foreign exchange turnover, or an average of $6.6 trillion in transactions per day, according to data from 2022. Following the second world war, the USD took over from the British Pound as the world’s reserve currency. For most of its history, the US Dollar was backed by Gold, until the Bretton Woods Agreement in 1971 when the Gold Standard went away.
The most important single factor impacting on the value of the US Dollar is monetary policy, which is shaped by the Federal Reserve (Fed). The Fed has two mandates: to achieve price stability (control inflation) and foster full employment. Its primary tool to achieve these two goals is by adjusting interest rates. When prices are rising too quickly and inflation is above the Fed’s 2% target, the Fed will raise rates, which helps the USD value. When inflation falls below 2% or the Unemployment Rate is too high, the Fed may lower interest rates, which weighs on the Greenback.
In extreme situations, the Federal Reserve can also print more Dollars and enact quantitative easing (QE). QE is the process by which the Fed substantially increases the flow of credit in a stuck financial system. It is a non-standard policy measure used when credit has dried up because banks will not lend to each other (out of the fear of counterparty default). It is a last resort when simply lowering interest rates is unlikely to achieve the necessary result. It was the Fed’s weapon of choice to combat the credit crunch that occurred during the Great Financial Crisis in 2008. It involves the Fed printing more Dollars and using them to buy US government bonds predominantly from financial institutions. QE usually leads to a weaker US Dollar.
Quantitative tightening (QT) is the reverse process whereby the Federal Reserve stops buying bonds from financial institutions and does not reinvest the principal from the bonds it holds maturing in new purchases. It is usually positive for the US Dollar.
USD traded modestly softer as US retail sales disappointed. Fed speakers are hesitant to define the date for the next rate cut, OCBC FX Strategist Christopher Wong notes.
Fed is hesitant to sound dovish
“US retail sales rose by 0.1% MoM in May following a downwardly revised 0.2% drop in April, falling short of the 0.3% growth consensus. Core retail sales, excluding autos, gasoline, and building materials, rose 0.4% MoM, slightly below the 0.5% MoM consensus. This week, focus is on jobless claims (Thu) and prelim PMIs (Fri). Softer data should weigh on USD.”
“On Fedspeaks, Musalem acknowledged that recent data on real consumer spending and nominal retail sales have mostly underwhelmed. He also said that he will need to observe a period of favorable inflation, moderating demand and expanding supply before becoming confident that a rate cut is appropriate. Separately, Collins said Fed should be patient as it considers when to lower rates.”
|DXY was last at 104.84. Mild bullish momentum on daily chart intact while RSI moderated. Support at 104.80 (61.8% fibo retracement of Oct high to 2024 low), 104 (50% fibo). Resistance at 105.50, 105.75 (76.4% fibo). 2-way trade likely in the range of 104.80 – 105.50 in absence of key catalyst.”
The latest UK services inflation numbers are a bit disappointing for the Bank of England (BoE), and the latest figure is 0.4ppt above what it had forecast back in the May monetary policy report, ING’ FX Strategist Francesco Pesole suggests.
BOE isn't cutting rates any time soon
“Things like rental growth are still pretty strong, though in line with prior months. The data all but confirms the BOE won't be cutting rates when it meets tomorrow. But we still have another report in July, and unless that's a material surprise, we suspect it will still leave the BoE on track for a cut in August.”
“In the FX market, EUR/GBP is trading at 0.8444, just slightly lower after the release, and markets are pricing in a 43% chance of a first cut in August with a total of 46bp by year-end.”
“Although today's inflation data is a bit of a mixed bag, we still see higher EUR/GBP in the medium term. While political risk in the EU may slow the Euro (EUR) gains in the near term, we believe the policy narrative will ultimately drive a substantial move higher in EUR/GBP, and we expect a move to 0.87 by late summer.”
US data and communication from the Federal Reserve (Fed) appear to be in a 'tug-of-war'. If the Fed stayed relatively dovish in the first quarter despite the slow disinflation, last week’s FOMC meeting and communication afterwards were relatively hawkish, ING FX Strategist Francesco Pesole notes.
Fed is still hawkish, US is on holiday
“Retail sales for May were weaker than expected yesterday and a downward revision to the April print was also published. The reading is in line with our view that consumer spending has peaked in the US. On the flipside, May’s industrial production rebounded more than expected.”
“The general message from Fed sent to markets is one of caution on disinflation. New York Fed President John Williams refused to comment on the timing of the first rate cut and while he admitted some encouraging signs on inflation. Seems, there is not enough confidence in the data to trigger a dovish turn in communication.”
“US markets are closed for a federal holiday today. Even on Thursday and Friday, the data calendar in the US is not very heavy: central bank developments and political risk swings in Europe will be more central. We still think that the US Dollar should keep finding some support against European pro-cyclical currencies.”
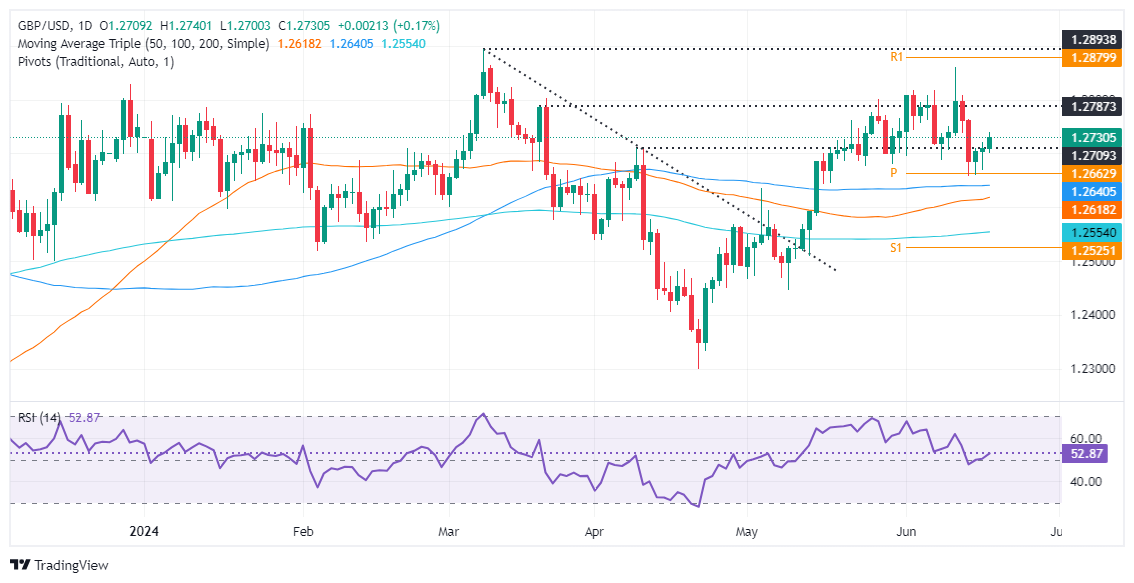
- GBP/USD tests key-support trendline turned resistance at around 1.2730.
- Technical outlook shows momentum favoring buyers, but unable to sustain gains above 1.2800.
- Key resistance at 1.2739 and 1.2800, with support levels at 1.2700, 1.2643, and 1.2617.
The Pound Sterling modestly gains versus the Greenback on Wednesday, amid thin liquidity conditions, due to US traders being in observance of Juneteenth. Therefore, with US markets being closed, the GBP/USD could remain subdued, and trade at 1.2729 at the time of writing.
GBP/USD Price Analysis: Technical outlook
After hitting a three-month high at 1.2860, the GBP/SD dropped more than 100 pips and cleared a support trendline drawn from lows of May 17 that passes at around 1.2730.
Although momentum favors buyers with the Relative Strength Index (RSI) above the 50-neutral line, the major has failed to sustain the uptrend above 1.2800.
Risk events, like the latest inflation report, could not lift the GBP/USD close to 1.2800. That, along with Thursday’s Bank of England decision, will keep the pair trading volatile in the upcoming days.
Key resistance levels lie at 1.2739, the current week’s high, followed by 1.2800. Once cleared, the next stop would be the monthly high of 1.2860.
Conversely, if GBP/USD stumbles past 1.2700, that will expose the confluence of technical indicators, like the May 3 high turned support and the 50-day moving average (DMA) at 1.2643/39, ahead of the 50-DMA at 1.2617. Further losses lie once cleared, like the 1.2600 figure and the 200-DMA at 1.2550.
GBP/USD Price Action – Daily Chart
The EUR/USD pair has continued to stabilize, but still seems to lack enough steam to meaningfully rebound given lingering political risk and fiscal concerns weighing on the common currency, ING FX strategists note.
EU members to face the excessive deficit procedure
“What shouldn’t help the mood in European markets today is the EU Commission’s announcement of which countries will face the excessive deficit procedure. Italy and Poland already said they will be included in the list, and media reports suggest five more countries will face the infringement procedure – including France.”
“Our rates team believes there are lingering risks that EU bond spreads re-widen into the 30 June French vote after a couple of calm sessions this week. The 10-year OAT-Bund rate gap was 77bp at yesterday’s close, 5bp below Monday’s peak.”
“The eurozone calendar only includes a speech by the European Central Bank's Mario Centeno today, and we still think the unstable risk environment and downside risks for peripheral bonds will keep EUR/USD capped in the near term.”
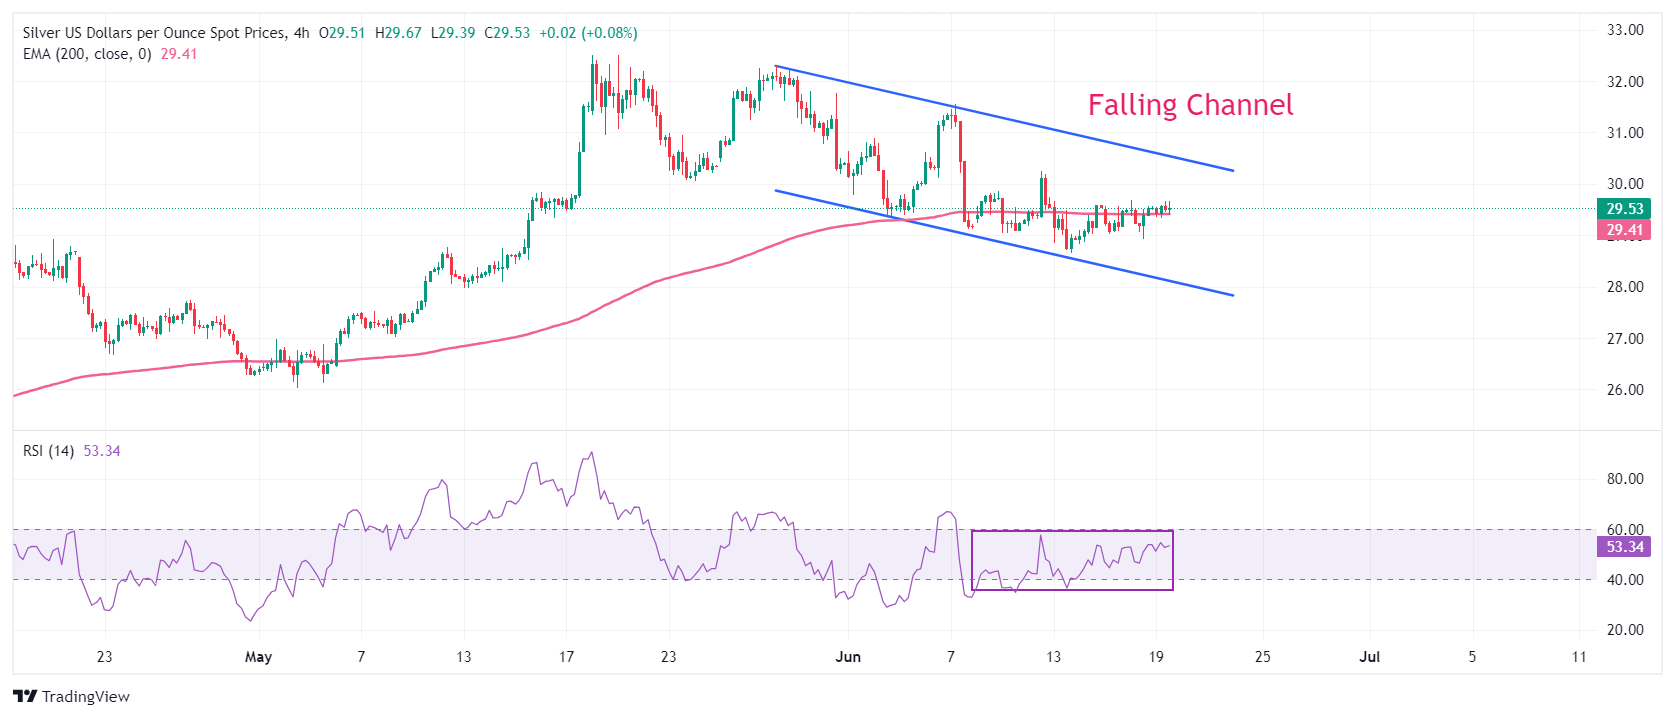
- Silver price holds the crucial support of $29.00 as Fed rate-cut bets surge.
- The expectations for Fed rate-cut increase as progress in the US disinflation process has resumed.
- Investors shift focus to the preliminary US S&P Global PMIs for June.
Silver price (XAG/USD) gains ground above the crucial support of $29.00 in Wednesday’s New York session. The white metal finds buyers amid growing speculation that the Federal Reserve (Fed) will start reducing interest rates from the September meeting.
The expectations for the Fed to begin unwinding its restrictive monetary policy framework rise due to a higher-than-expected United States (US) decline in the Consumer Price Index (CPI) and slower than forecasted growth in Retail Sales data for May. May’s data showed that progress in the disinflation process has resumed, and consumers cut heavily on discretionary spending as high inflation and interest rates by the Federal Reserve (Fed) have reduced the purchasing power of households.
Meanwhile, the market sentiment remains quiet as US markets are closed on Wednesday on account of Juneteenth. The US Dollar Index (DXY) edges down to near 105.20.
This week, investors will focus on the preliminary US S&P Global PMIs data for June, which will be published on Friday. The agency is expected to show a decline in the Composite PMI due to weakness in manufacturing as well as the service sector.
Silver technical analysis
Silver price trades in a Falling Channel chart pattern in which each pullback is considered a selling opportunity by market participants. The asset trades close to the 200-period Exponential Moving Average (EMA), which trades around $29.40, suggesting a consolidating ahead.
The 14-period Relative Strength Index (RSI) oscillates in the 40.00-60.00 range, indicating indecisiveness among market participants.
Silver four-hour chart
The Biden administration is weighing new tech sanctions on China to restrict its’ AI development, Danske Bank’s Chief Analyst Allan Von Mehren and Chief Analyst Minna Kuusisto note.
US to restrict China using cutting-edge AI technology
“The Biden administration considers new sanctions against China’s AI development industry. The measures on the table regard a cutting-edge chip architecture know as GAA (gate all-around), which helps improve chip performance and reduces power consumption. The US will probably continue to take measures to hold back China’s AI and chip development going forward.”
“The question is how will China respond? It could get more serious with export controls on for example rare earth minerals. But it remains to be seen how much China retaliates.”
Last week, the result of the EU Commission’s anti-subsidy investigation on Chinese Electric Vehicles (EVs) was finally released. EU tariffs on Chinese vehicles will increase from 10% to 27- 48% depending on the car brand, Danske Bank Chief Analyst Allan Von Mehren notes.
Trade war is an unlikely scenario
“EU tariffs on Chinese vehicles will increase from 10% to 27- 48% depending on the car brand. The tariff lift will create a higher barrier for Chinese EVs but they are likely to still be able to compete.”
“China denounced the move as “a blatant act of protectionism” and this week hit back with an anti-dumping investigation into imports of EU pork, which is says is supported by subsidies with EU exporting its’ overcapacity to China. It thus returns EUs accusations that China is exporting its’ overcapacity to Europe.”
“While the EU-China trade tensions are clearly on the rise, it is still in quite narrow sectors and in our view not big enough to be a trade war. We also doubt it will evolve into a wider trade war as neither EU nor China have any interest in this given economic vulnerabilities in both areas. Also, the EU is divided over the issue with especially German car companies speaking up against the tariffs.”
Upside momentum firming and Commodity Trading Advisors (CTAs) in Crude Oil remain on the bid, TDS commodity strategists note.
Markets look to take profits on Oil
“Crude oil continues to prove resilient, with upside momentum firming and CTAs remaining on the bid. However, we still argue that the rally could start to fade as these CTA flows taper.”
“Indeed, any drop below $80.33/bbl and $84.92/bbl for WTI and Brent crude, respectively, would see CTAs ease up on their buying and liquidate a portion of the recently acquired length.”
“Aside from the resurgent CTA flows, there is still more relative concern about Q4 balances and beyond, which should serve as a resistance to major upside.”
Optimism around potential new Chinese stimulus to be announced at the July third plenum is helping industrial metal prices find some support after the recent bout of weakness, TDS commodity strategists note.
Metals seem strong despite weakening environment
“Our gauge of commodity demand is weakening amid a precarious global macro landscape, and our return decompositions across the complex confirm the demand side is finally starting to weigh heavy on the metals as the early summer euphoria fades.”
“In Copper, our return decomposition framework is also showing a major drag from idiosyncratic factors, such as positioning. This suggests that the red metal could still be prone to additional downside in the near-term as bloated positions are cut.”
“On the Commodity Trading Advisor (CTA) front, the Red Metal could see some length added back at prices above $9,769/t, while Aluminium, Zinc, Lead and Nickel were all able to withstand the pressure without triggering CTA selling, and could all see modest buying on the recovery with the nearest triggers to the upside.”
- NZD/USD falls to near 0.6130 as the New Zealand Dollar exhibits weakness ahead of the Q1 GDP data.
- The USD Index holds its immediate support of 105.00 in a holiday market mood.
- NZD/USD declines toward the horizontal support of the Broadening Triangle pattern.
The NZD/USD pair slumps to near 0.6130 in Wednesday’s American session. The Kiwi asset drops as the New Zaland Dollar comes under pressure ahead of the New Zealand (NZ) Q1 Gross Domestic Product (GDP) data, which will be published on Thursday. The NZ economy is estimated to have remained stagnant.
Weak economic performance would boost expectations of early rate cuts by the Reserve Bank of New Zealand (RBNZ). The RBNZ has been keeping its Official Cash Rate (OCR) higher at 5.5% for more than a year due to stubborn inflationary pressures.
Meanwhile, the US Dollar (USD) edges down in a thin volume trading session due to a holiday in United States (US) markets on account of Juneteenth. The US Dollar Index (DXY) holds its crucial support of 105.00. However, the near-term outlook has become uncertain as market participants expect the Federal Reserve (Fed) to cut interest rates twice this year.
This week, the US Dollar will be guided by preliminary S&P Global PMIs for June, which will be published on Thursday. The agency is expected to show a decline in the Composite PMI due to weakness in manufacturing as well as the service sector.
NZD/USD trades in a Broadening Triangle chart pattern on a four-hour timeframe in which the downside remains cushioned with the horizontal support, which is plotted from May 16 low around 0.6100. While the upside in the above-mentioned chart formation remains limited to the upward-sloping border, which in this case is marked from May 16 high around 0.6140.
The 200-period Exponential Moving Average (EMA) near 0.6101 continues to provide support to the New Zealand Dollar bulls.
The 14-period Relative Strength index (RSI) hovers near 40.00. A break below the same will trigger a bearish momentum.
Fresh downside would appear if the asset delivers a decisive break below the round-level support of 0.6100. This would drag the asset towards April 4 high around 0.6050 and psychological support of 0.6000.
On the contrary, a reversal move above June 12 high of 0.6222, which will expose the asset January 15 high near 0.6250, followed by January 12 high near 0.6280.
NZD/USD four-hour chart
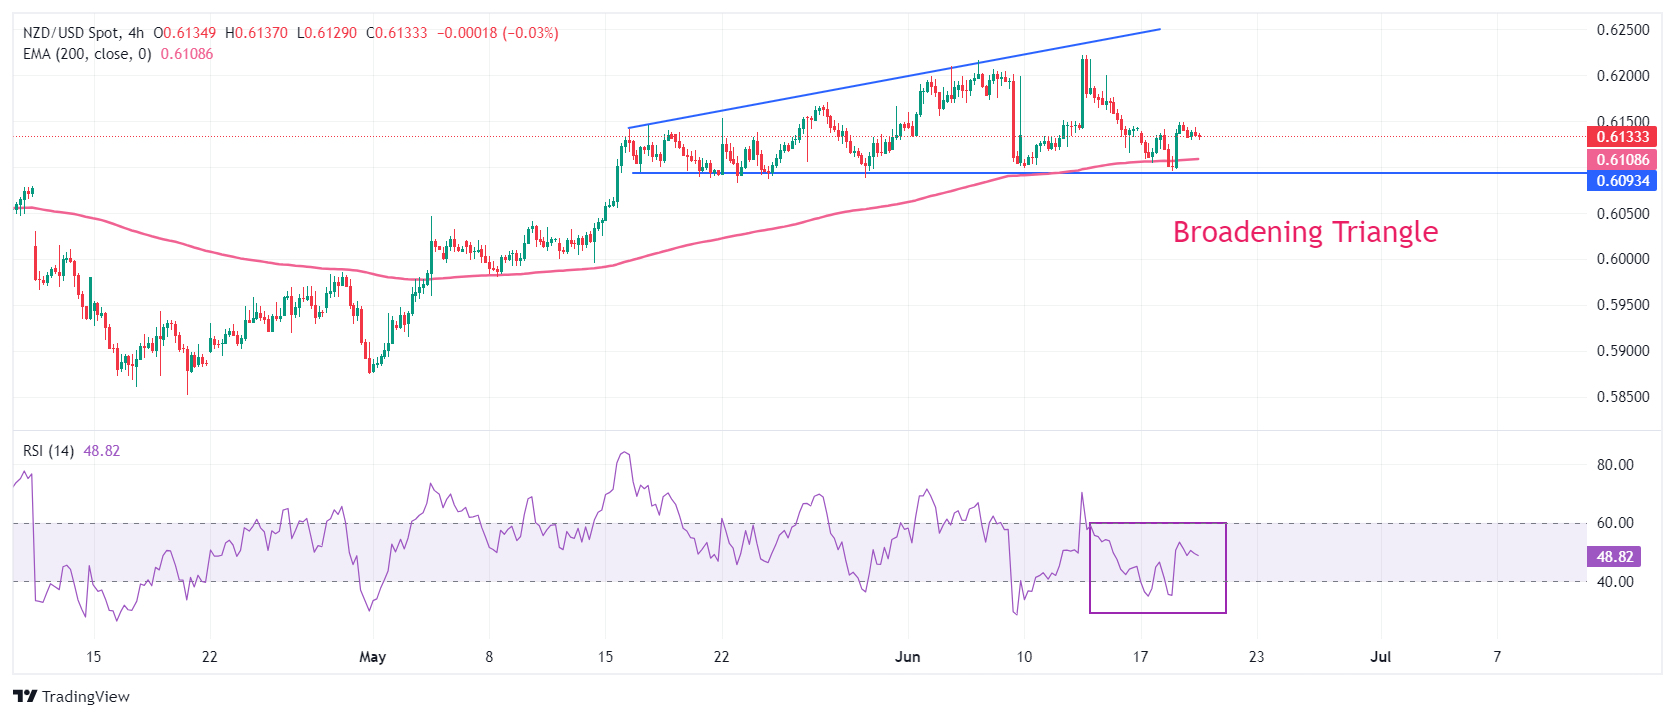
- Gold trades flat on low holiday volumes as US bond markets close for Juneteenth-day celebrations.
- Fed officials continue to toe the official line on interest rates, advocating a cautious, data-driven approach.
- XAU/USD continues forming a bearish Head-and-Shoulders pattern on the daily chart.
Gold (XAU/USD) trades in a tight range in the $2,320s in quiet markets on Wednesday. A lack of risk sentiment and low holiday volume caps volatility in the safe-haven asset.
The US Dollar (USD) – to which Gold is negatively correlated – trades broadly unchanged and since US bond markets are closed for the Juneteenth day holiday, the benchmark US 10-year Treasury bond yield remains stuck at 4.2270%, Tuesday’s close, according to data from Trading Economics.
Gold edged up on Tuesday after weak US Retail Sales
Gold closed higher on Tuesday after the release of weak US Retail Sales data led to a downward revision in the outlook for US interest rates. The lower-than-expected Retail Sales in May suggests lower consumer spending, which would likely also result in a fall in inflation. Lower inflation, in turn, would result in the Federal Reserve (Fed) moving to cut interest rates.
From markets seeing only a 50/50 chance of the Federal Reserve (Fed) cutting interest rates at its September meeting, the probability rose to 60% after the data release, according to the CME FedWatch Tool, which bases its estimates on the market price of Fed Funds Futures.
However, futures markets appear to be more optimistic than recent Fed commentary would seem to suggest. At its June meeting the Fed revised its projections for the Fed Funds Rate higher. From expecting three 0.25% cuts in 2024 in their March meeting projections, Fed officials saw only one cut in 2024 in June, on account of stubborn inflation. The expectation of interest rates remaining higher for longer was negative for non-yielding Gold, as it raises the opportunity cost of holding the precious metal.
On Tuesday a long list of Fed officials made public their opinions about monetary policy. Most towed the official line that more data was needed showing inflation coming down in a sustainable manner before they would cut interest rates (bullish for Gold). Their views are summarized below:
- Boston Fed President Susan Collins said it was too soon to conclude inflation was falling.
- Progress on inflation remained gradual, according to Fed Board of Governors member Adriana Kugler.
- If inflation figures became stuck above the Fed's 2.0% target, St. Louis Fed President Alberto Musalem would be prepared to raise interest rates. Musalem added that it could take months or even entire quarters before Fed policy wins the battle against above-target inflation.
- Lorie Logan, the President of the Dallas Federal Reserve, said that the recent data indicating a slowdown in inflation is "encouraging," but emphasized that the Fed must remain cautious and patient regarding interest-rate policy.
- The latest update to the Consumer Price Index (CPI) was "excellent", according to Chicago Fed President Austan Goolsbee, referring to the below-expectations May data. Goolsbee added he hoped to see more of the same in future inflation prints.
Technical Analysis: Gold forms Head-and-Shoulders top
Gold seems to be completing a bearish Head-and-Shoulders (H&S) price pattern on the daily chart. These patterns tend to occur at market tops and signal a change of trend.
XAU/USD Daily Chart
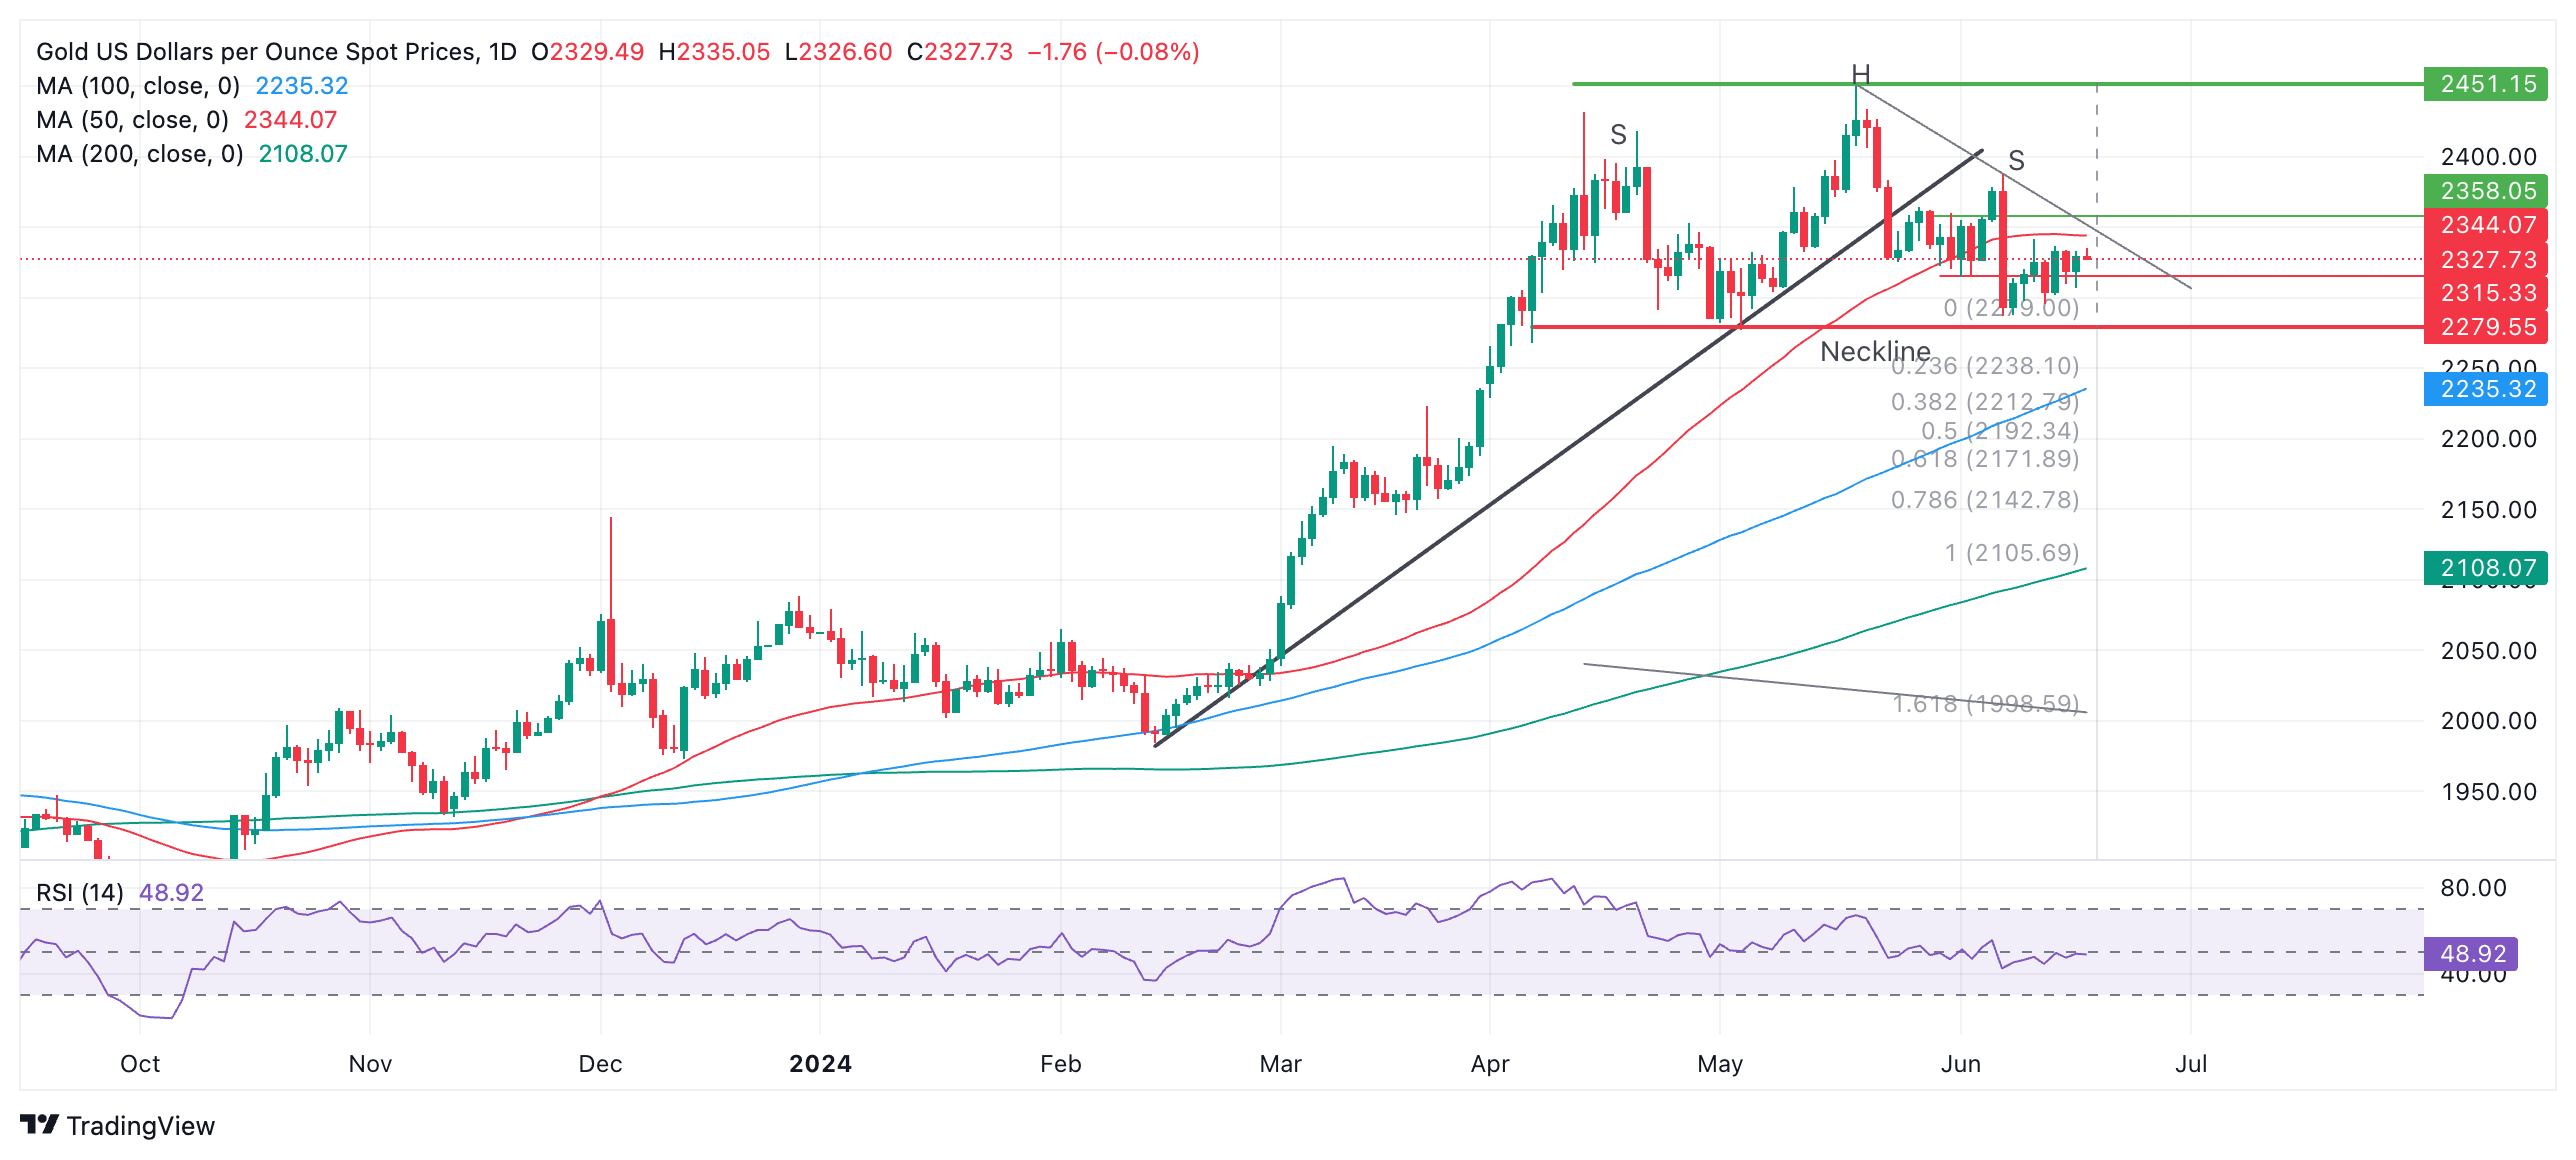
The H&S on Gold has completed a left and right shoulder (labeled “S”) and a “head” (labeled “H”). The so-called “neckline” of the pattern appears to be at the $2,279 support level (red line).
The declining momentum signaled by the Relative Strength Index (RSI) during its development corroborates the pattern.
A decisive break below the neckline would validate the H&S pattern and activate downside targets. The first more conservative target would be $2,171, calculated by taking the 0.618 Fibonacci ratio of the height of the pattern and extrapolating it lower from the neckline. The second target would be at $2,106, the full height of the pattern extrapolated lower.
A break above $2,345, however, would bring the H&S into doubt and could signal a continuation higher, to an initial target at the $2,450 peak.
Gold FAQs
Gold has played a key role in human’s history as it has been widely used as a store of value and medium of exchange. Currently, apart from its shine and usage for jewelry, the precious metal is widely seen as a safe-haven asset, meaning that it is considered a good investment during turbulent times. Gold is also widely seen as a hedge against inflation and against depreciating currencies as it doesn’t rely on any specific issuer or government.
Central banks are the biggest Gold holders. In their aim to support their currencies in turbulent times, central banks tend to diversify their reserves and buy Gold to improve the perceived strength of the economy and the currency. High Gold reserves can be a source of trust for a country’s solvency. Central banks added 1,136 tonnes of Gold worth around $70 billion to their reserves in 2022, according to data from the World Gold Council. This is the highest yearly purchase since records began. Central banks from emerging economies such as China, India and Turkey are quickly increasing their Gold reserves.
Gold has an inverse correlation with the US Dollar and US Treasuries, which are both major reserve and safe-haven assets. When the Dollar depreciates, Gold tends to rise, enabling investors and central banks to diversify their assets in turbulent times. Gold is also inversely correlated with risk assets. A rally in the stock market tends to weaken Gold price, while sell-offs in riskier markets tend to favor the precious metal.
The price can move due to a wide range of factors. Geopolitical instability or fears of a deep recession can quickly make Gold price escalate due to its safe-haven status. As a yield-less asset, Gold tends to rise with lower interest rates, while higher cost of money usually weighs down on the yellow metal. Still, most moves depend on how the US Dollar (USD) behaves as the asset is priced in dollars (XAU/USD). A strong Dollar tends to keep the price of Gold controlled, whereas a weaker Dollar is likely to push Gold prices up.
- Natural Gas bounced back up to near $3.0 on Tuesday.
- Traders are looking at the weak spots in the European Gas supply.
- The US Dollar index trades around 105.00 and could face another leg lower.
Natural Gas price (XNG/USD) trades slightly higher on Wednesday after a nice technical bounce. Although Norwegian Gas is flowing again at full throttle into Europe, the recent unforeseen outage from the Nyhamna Gas Plant in Norway shows how fragile and dependent Europe is on other countries to fill the gap from Russian Gas. This might create a synthetic floor in the Gas price action as any disruption will have ripple effects for Europe.
Meanwhile, the US Dollar Index (DXY), which tracks the Greenback’s value against six major currencies, is easing a touch this week. Although the US markets are closed in observance of Juneteenth, traders will be trying to wrap their heads around the downbeat US Retail Sales report for May, released on Tuesday. The softer-than-expected Retail Sales may signal that consumers can no longer cope or bear with these elevated interest rates.
Natural Gas is trading at $2.98 per MMBtu at the time of writing.
Natural Gas news and market movers: Europe’s inflow is exposed
- On Wednesday, Norwegian Gas regulator Gassco reported that the unforeseen maintenance at the Nyhamna Gas Plant was resolved, and the site is back in full production, Bloomberg reports.
- Recent Gas supply data shows that, although European gas reserves are building, they are doing so at a slower pace, Reuters reports.
- Uniper and the German government still have not taken a stance on how or when they will try to reclaim the billions in undelivered Gas from Gazprom PJSC.
Natural Gas Technical Analysis: Europe’s reserves steady building
Natural Gas prices have little reason to go either way in these conditions. Gas flow into Europe remains fragile and exposed, with any interruption enough to send Gas prices a few percentages higher. Meanwhile, easing tensions in the Middle East and Europe’s ability to secure enough Gas before the next heating season looks to be a bearish element that limits continuous upside price moves.
The pivotal level near $3.08 (March 6, 2023, high) remains key after its false break last week. In addition, the red descending trendline at $3.10 will also weigh on this area as a cap. Further up, the fresh year-to-date high at $3.16 is the level to beat.
On the downside, the 200-day Simple Moving Average (SMA) acts as the first support near $2.54. Should that support area fail to hold, the next target could be the pivotal level near $2.14, with interim support by the 55-day SMA near $2.46. Further down, the biggest support comes at $2.19 with the 100-day SMA.
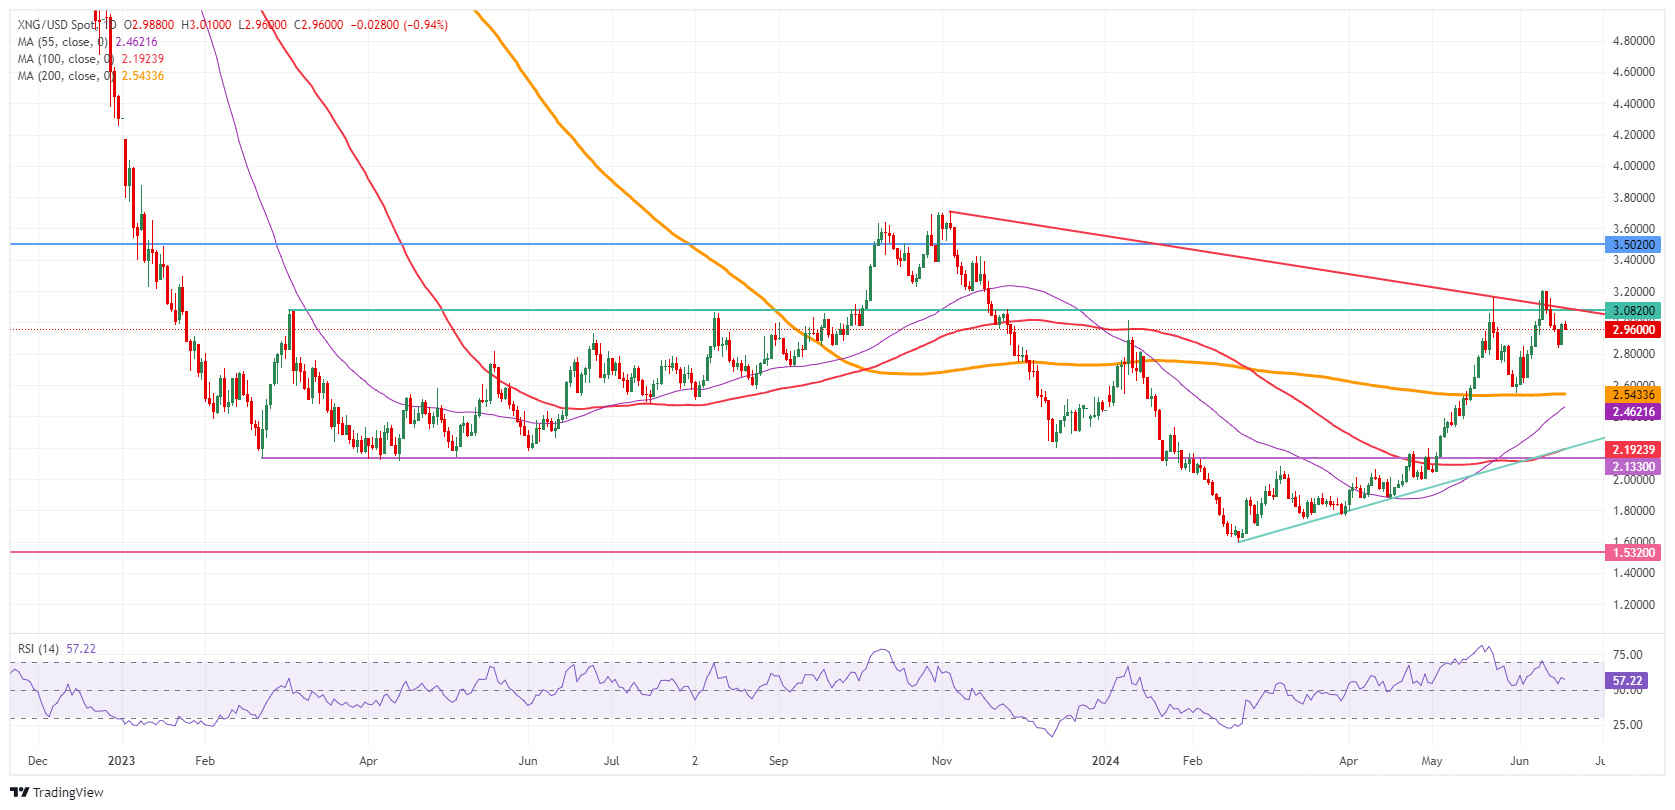
Natural Gas: Daily Chart
Natural Gas FAQs
Supply and demand dynamics are a key factor influencing Natural Gas prices, and are themselves influenced by global economic growth, industrial activity, population growth, production levels, and inventories. The weather impacts Natural Gas prices because more Gas is used during cold winters and hot summers for heating and cooling. Competition from other energy sources impacts prices as consumers may switch to cheaper sources. Geopolitical events are factors as exemplified by the war in Ukraine. Government policies relating to extraction, transportation, and environmental issues also impact prices.
The main economic release influencing Natural Gas prices is the weekly inventory bulletin from the Energy Information Administration (EIA), a US government agency that produces US gas market data. The EIA Gas bulletin usually comes out on Thursday at 14:30 GMT, a day after the EIA publishes its weekly Oil bulletin. Economic data from large consumers of Natural Gas can impact supply and demand, the largest of which include China, Germany and Japan. Natural Gas is primarily priced and traded in US Dollars, thus economic releases impacting the US Dollar are also factors.
The US Dollar is the world’s reserve currency and most commodities, including Natural Gas are priced and traded on international markets in US Dollars. As such, the value of the US Dollar is a factor in the price of Natural Gas, because if the Dollar strengthens it means less Dollars are required to buy the same volume of Gas (the price falls), and vice versa if USD strengthens.
- USD/JPY trades sideways near 158.00 as investors look for fresh cues on the Fed’s rate-cut timeframe.
- US Retail Sales barely grew in May against expectations of 0.2%.
- The BoJ minutes for the June meeting showed that policymakers discussed hiking interest rates sooner.
The USD/JPY pair trades close to seven-week high near 158.00 in Wednesday’s European session. The rally appears to have paused for the time-being amid uncertainty over Federal Reserve’s (Fed) interest rate path and the release of the Japan’s National Consumer Price Index (CPI) data for May, which will be published on Friday.
Market sentiment remains positive for risk-perceived assets amid growing speculation that the Fed will start reducing interest rates from the September meeting. S&P 500 futures have posted some gains in European trading hours. The US Dollar Index (DXY), which tracks the Greenback’s value against six major currencies, edges down to 105.15.
Market expectations for the Fed to begin reducing interest rates from the September meeting strengthen after the United States (US) Retail Sales data for May missed estimates. Monthly Retail Sales grew by 0.1%, slower than expectations of 0.2%. The Retail Sales report also showed that households cut discretionary spending, which indicates weak purchasing power due to high inflation interest rates.
Meanwhile, investors also expect that the Fed will reduce interest rates twice this year against one projected by policymakers in their latest dot plot. However, officials emphasize keeping interest rates at their current levels until they get see good inflation data for months.
On the Tokyo front, the Japanese Yen weakens even though Bank of Japan (BoJ) minutes for the June meeting showed that Governor Kazuo Ueda advocated for increasing interest rates sooner than expected. BoJ Ueda favors tightening the policy further due to upside risks to inflation prompted by the weak Yen. Japan’s exports have become competitive in global markets and cost of imposts have risen, which could push price pressures higher.
This week, the major trigger for the Japanese Yen will be the National CPI data. Annual National CPI excluding Fresh Food is expected to have accelerated to 2.6% from the prior reading of 2.2%.
- The US Dollar trades flat on Wednesday despite sluggish US Retail Sales.
- Markets face a relatively quiet trading day, with US markets closed in observance of Juneteenth.
- The US Dollar index holds above 105.00, though this week's upcoming US data might trigger a break.
The US Dollar (USD) trades flat on Wednesday, with US markets closed in observance of Juneteenth. US bond markets are closed and US equities will only see the futures markets moving. Traders will be able to let the dust settle after the downbeat Retail Sales report for May, released on Tuesday.
On the US economic data front, there are two data points to digest on a very light trading day. The Mortgage Bankers Association will release its Mortgage Applications number for the week of June 14. The number has some importance because it was in contraction for a few weeks in a row until the previous week was a staggering 15.6% uptick.
Daily digest market movers: A day off ahead
- Although US markets are closed on Wednesday, there are some key headlines to report:
- Japan's opposition front asked Japanese Prime Minister Fumio Kishida to call for snap elections, Bloomberg reported.
- The US has given the green light for an arms deal with Taiwan, triggering fury with China on the matter, Baha news reported.
- France, Italy, Belgium, and five other European countries are set to be reprimanded and fined for their deficits breaching EU finance rules, according to Bloomberg.
- At 11:00 GMT, the Mortgage Bankers Association releases its Mortgage Applications survey. Last week’s number snapped the contraction path with a staggering 15.6%.
- At 14:00 GMT, the National Association of Home Builders will release its June Housing Market Index. The previous number was 45, and a steady 45 is expected again.
- Equity markets are not doing well again, with all indices in Europe in the red. US futures are marginally in the green.
- The CME FedWatch Tool shows a 32.8% chance of the Fed interest rate remaining at the current level in September. Odds for a 25-basis-points rate cut stand at 60.0%, while a very slim 7.2% chance is priced in for a 50-basis-points rate cut.
- The benchmark 10-year US Treasury Note trades at its lowest level in a month, at 4.22%. No further moves expected today as bond markets are closed.
US Dollar Index Technical Analysis: How long until reality kicks in
The US Dollar Index (DXY) is trying to hold firm, though it is starting to lose its shine. With the European political turmoil starting to ease and fading into the background, US data comes to the forefront again. With downbeat US Retail Sales data for May released on Tuesday, the always resilient Dollar bulls must also start to doubt their beliefs. Under these current economic conditions, the Greenback is still a touch overvalued and needs another correction to head back to its fair value.
On the upside, there are no big changes to the levels traders need to watch out for. The first is 105.52, a barrier that held during most of April. The next level to watch is 105.88, which triggered a rejection at the start of May and will likely play its role as resistance again. Further up, the biggest challenge remains at 106.51, the year-to-date high from April 16.
On the downside, the trifecta of Simple Moving Averages (SMA) is still playing as support. First is the 55-day SMA at 105.12, safeguarding the 105.00 figure. A touch lower, near 104.59 and 104.47, both the 100-day and the 200-day SMA are forming a double layer of protection to support any declines. Should this area be broken, look for 104.00 to salvage the situation.
US Dollar FAQs
The US Dollar (USD) is the official currency of the United States of America, and the ‘de facto’ currency of a significant number of other countries where it is found in circulation alongside local notes. It is the most heavily traded currency in the world, accounting for over 88% of all global foreign exchange turnover, or an average of $6.6 trillion in transactions per day, according to data from 2022. Following the second world war, the USD took over from the British Pound as the world’s reserve currency. For most of its history, the US Dollar was backed by Gold, until the Bretton Woods Agreement in 1971 when the Gold Standard went away.
The most important single factor impacting on the value of the US Dollar is monetary policy, which is shaped by the Federal Reserve (Fed). The Fed has two mandates: to achieve price stability (control inflation) and foster full employment. Its primary tool to achieve these two goals is by adjusting interest rates. When prices are rising too quickly and inflation is above the Fed’s 2% target, the Fed will raise rates, which helps the USD value. When inflation falls below 2% or the Unemployment Rate is too high, the Fed may lower interest rates, which weighs on the Greenback.
In extreme situations, the Federal Reserve can also print more Dollars and enact quantitative easing (QE). QE is the process by which the Fed substantially increases the flow of credit in a stuck financial system. It is a non-standard policy measure used when credit has dried up because banks will not lend to each other (out of the fear of counterparty default). It is a last resort when simply lowering interest rates is unlikely to achieve the necessary result. It was the Fed’s weapon of choice to combat the credit crunch that occurred during the Great Financial Crisis in 2008. It involves the Fed printing more Dollars and using them to buy US government bonds predominantly from financial institutions. QE usually leads to a weaker US Dollar.
Quantitative tightening (QT) is the reverse process whereby the Federal Reserve stops buying bonds from financial institutions and does not reinvest the principal from the bonds it holds maturing in new purchases. It is usually positive for the US Dollar.
- USD/CAD stays on the sidelines above 1.3700 amid uncertainty over the timeframe for Fed rate cuts.
- US customers cut heavily on discretionary spending, which indicates a decline in purchasing power.
- Canadian Retail Sales are expected to have returned in a positive trajectory.
The USD/CAD pair trades in a tight range but comfortably holds the crucial support of 1.3700 in Wednesday’s European session. The Loonie asset consolidates amid uncertainty over the Federal Reserve’s (Fed) rate-cut path due to the divergence between the Fed’s projections and market expectations for how much interest rates will be reduced this year.
Fed policymakers signalled one rate-cut this year in its last dot plot. However, financial markets strongly expect two as the latest United States (US) Consumer Price Index (CPI) report for May indicated that the progress in the disinflation process has resumed. Also, the Retail Sales for May indicated that consumers cut heavily on discretionary spending. This has built confidence among investors that inflation is progressively declining towards the 2% target.
Meanwhile, Fed officials want to see inflation declining for months before considering rate cuts. Improving expectations for Fed rate cuts have limited the upside in the US Dollar (USD). The US Dollar Index (DXY), which tracks the greenback’s value against six major currencies, trades sideways around 105.20.
On the Loonie front, investors await the Canadian Retail Sales data for April, which will be published on Friday. Monthly Retail Sales are anticipated to have returned to a positive trajectory after contracting for three straight months. The economic data is estimated to have increased by 0.7%.
USD/CAD continues to consolidate in the 1.3600-1.3800 range from almost seven weeks. The Loonie asset holds the 200-day Exponential Moving Average (EMA), which trades around 1.3690, suggesting that the overall trend is bullish.
The 14-period Relative Strength Index (RSI) oscillates in the 40.00-60.00 range, indicating indecisiveness among market participants.
A fresh buying opportunity would emerge if the asset breaks above the April 17 high at 1.3838. This would drive the asset towards 1 November 2023 high at 1.3900, followed by the psychological resistance of 1.4000.
In an alternate scenario, a breakdown below June 7 low at 1.3663 will expose the asset to May 3 low around 1.3600 and April 9 low around 1.3547.
USD/CAD four-hour chart
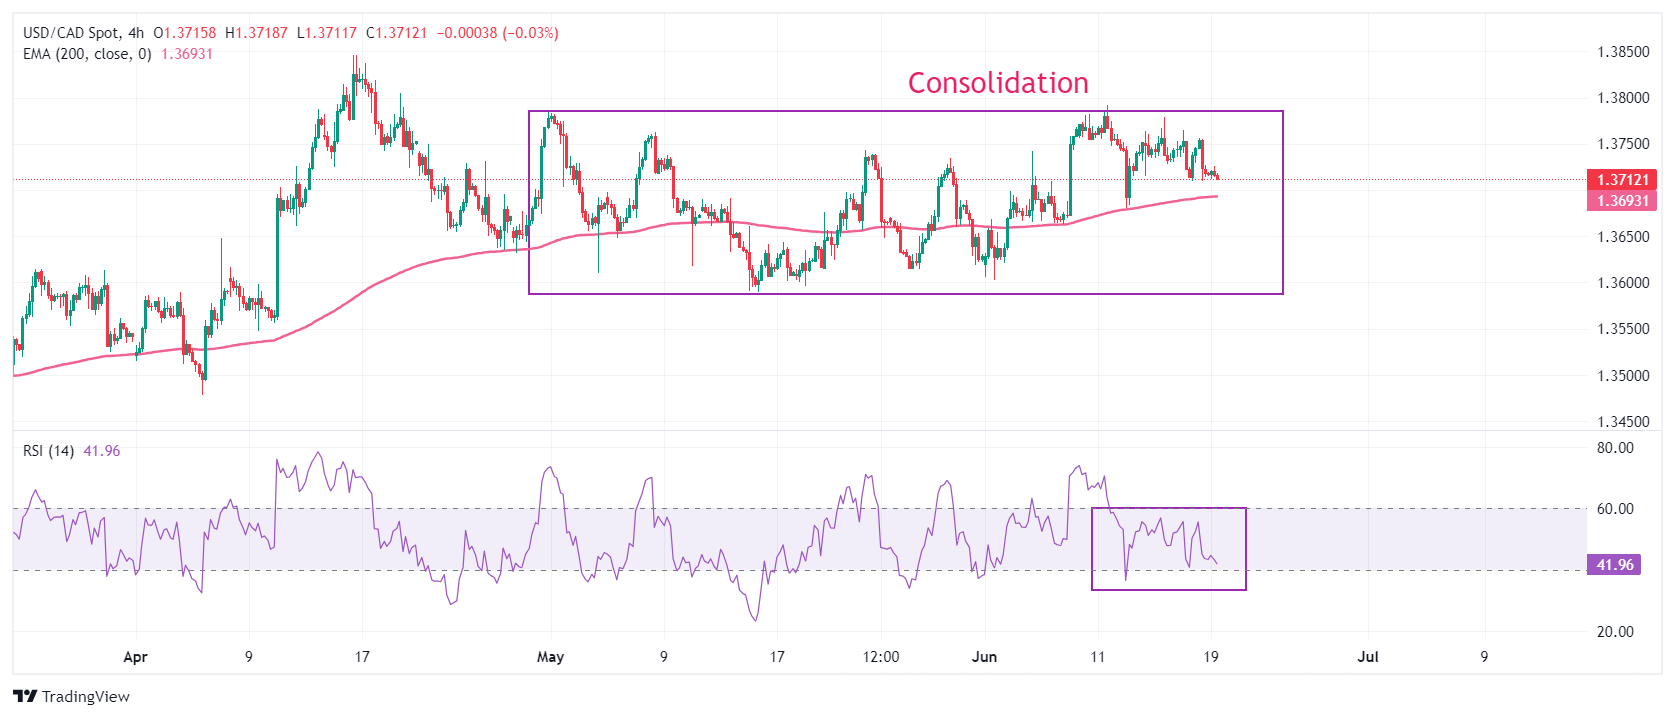
- EUR/USD trades sideways above 1.0700 as investors look for fresh cues on the Fed and the ECB interest-rate outlook.
- ECB policymakers remain concerned over stubborn service inflation.
- Investors see the Fed reducing interest rates twice this year.
EUR/USD consolidates in a tight range above the round-level support of 1.0700 in Wednesday’s European session. The major currency pair trades sideways as investors look for fresh cues about when the European Central Bank (ECB) will deliver its second rate cut this year.
The ECB began reducing its key interest rates earlier in June as policymakers believe that inflation in the Eurozone is on course to return to the desired rate of 2%. However, ECB officials have been refraining from committing to any specific interest rate-cut path as they remain concerned over high inflation in the services sector.
ECB policymakers worry that the adaptation of an aggressive policy easing approach could revamp price pressures again. Officials have projected a bumpier inflation path and see price pressures declining to the 2% target in 2025.
Meanwhile, French political uncertainty continues to keep the Euro on the tenterhooks. Investors worry that the formation of Marine Le Pen 's-led-National Rally’s (RN) government after the Parliament elections would trigger financial distress in the European Union’s (EU) second-largest economy. The RN has promised a lower retirement age, energy price cuts, more public spending and "France first" economic policies in its manifesto.
Daily digest market movers: EUR/USD consolidates amid uncertainty over French elections
- EUR/USD trades in a tight range, slightly above 1.0700, as the US Dollar (USD) consolidates inside Tuesday’s trading range. The near-term outlook of the US Dollar has become uncertain as slower-than-expected United States (US) Retail Sales growth in May has boosted market expectations for Federal Reserve (Fed) rate cuts in the September meeting.
- The monthly Retail Sales report showed on Tuesday that lower gasoline prices, subdued demand for building materials, and a decline in sales at food services and drinking places were major drags. Still, retail sales grew slightly in May after contracting by 0.2% in April, downwardly revised from a stagnant performance. However, the growth rate was only 0.1%, lower than the estimates of 0.2%.
- According to the CME FedWatch tool, 30-day Fed Fund Futures pricing data shows a 67% chance for a rate cut in September, up from 61.5% recorded before the release of the May Retail Sales report. The tool also shows that policymakers will announce one more rate cut in the November or December meeting, which is contrary to the Fed’s dot plot, in which officials signaled only one rate cut this year.
- Fed policymakers keep favoring the maintenance of current interest rates until the last quarter this year as encouragement from higher-than-expected decline in price pressures in May is insufficient to build confidence for rate cuts. Officials have been emphasizing the need of more good inflation data before pivoting to policy normalization.
Technical Analysis: EUR/USD faces heat near 1.0740
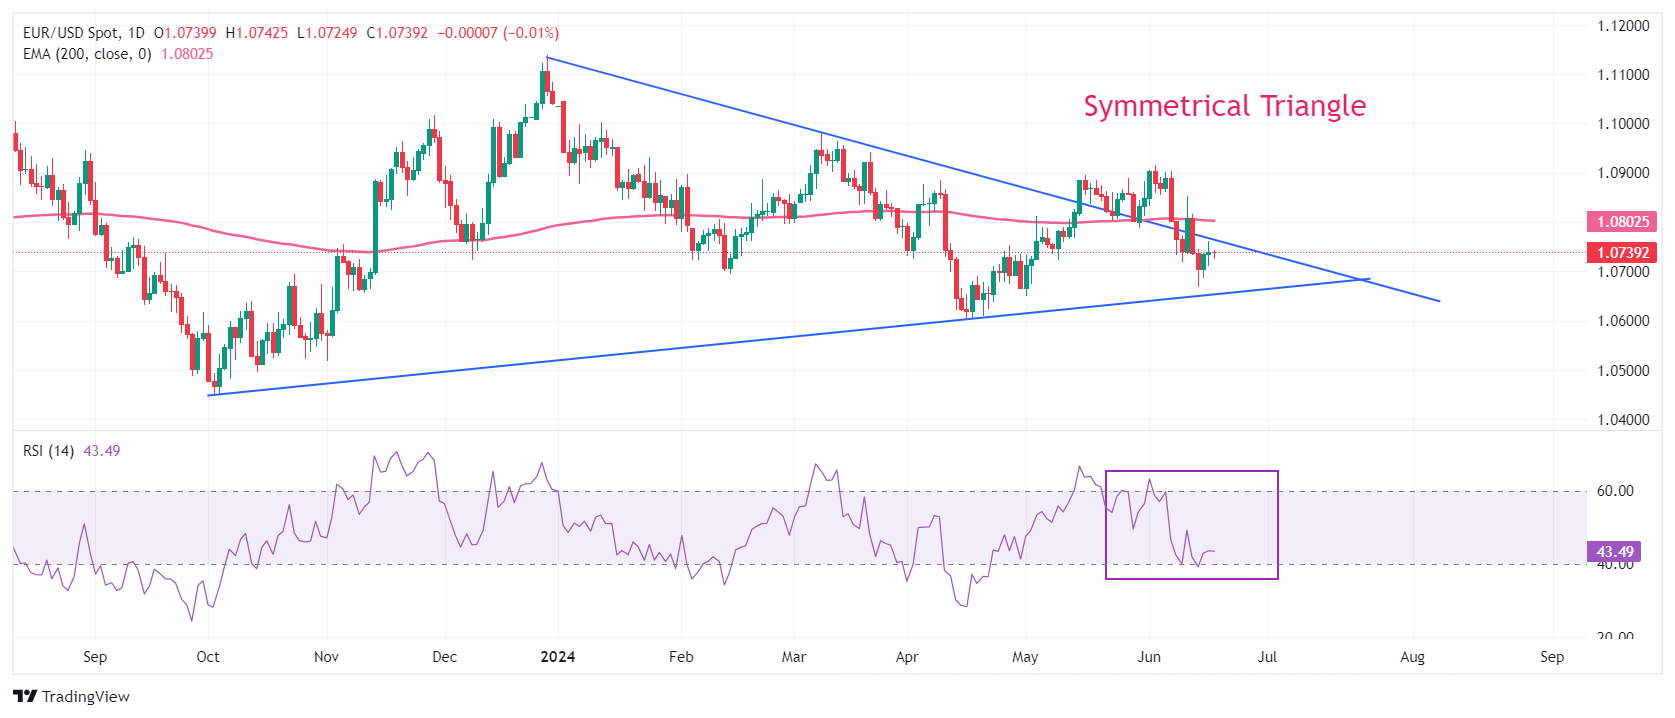
EUR/USD faces pressure in an attempt to surpass the immediate resistance of 1.0740. The downward-sloping border of the Symmetrical Triangle formation on a daily time frame, plotted from 28 December 2023 at 1.1140, is acting as a major barrier for the Euro bulls.
The major currency pair is expected to find support at 1.0636, near the upward-sloping order of the chart pattern plotted from 3 October 2023 low at 1.0448 and the horizontal cushion plotted from April 16 low around 1.0600.
The long-term outlook of the shared currency pair has also turned negative as prices dropped below the 200-day Exponential Moving Average (EMA), which trades around 1.0800.
The 14-period Relative Strength Index (RSI) falls below 40.00. Momentum could turn bearish if the RSI sustains below this level.
Euro FAQs
The Euro is the currency for the 20 European Union countries that belong to the Eurozone. It is the second most heavily traded currency in the world behind the US Dollar. In 2022, it accounted for 31% of all foreign exchange transactions, with an average daily turnover of over $2.2 trillion a day. EUR/USD is the most heavily traded currency pair in the world, accounting for an estimated 30% off all transactions, followed by EUR/JPY (4%), EUR/GBP (3%) and EUR/AUD (2%).
The European Central Bank (ECB) in Frankfurt, Germany, is the reserve bank for the Eurozone. The ECB sets interest rates and manages monetary policy. The ECB’s primary mandate is to maintain price stability, which means either controlling inflation or stimulating growth. Its primary tool is the raising or lowering of interest rates. Relatively high interest rates – or the expectation of higher rates – will usually benefit the Euro and vice versa. The ECB Governing Council makes monetary policy decisions at meetings held eight times a year. Decisions are made by heads of the Eurozone national banks and six permanent members, including the President of the ECB, Christine Lagarde.
Eurozone inflation data, measured by the Harmonized Index of Consumer Prices (HICP), is an important econometric for the Euro. If inflation rises more than expected, especially if above the ECB’s 2% target, it obliges the ECB to raise interest rates to bring it back under control. Relatively high interest rates compared to its counterparts will usually benefit the Euro, as it makes the region more attractive as a place for global investors to park their money.
Data releases gauge the health of the economy and can impact on the Euro. Indicators such as GDP, Manufacturing and Services PMIs, employment, and consumer sentiment surveys can all influence the direction of the single currency. A strong economy is good for the Euro. Not only does it attract more foreign investment but it may encourage the ECB to put up interest rates, which will directly strengthen the Euro. Otherwise, if economic data is weak, the Euro is likely to fall. Economic data for the four largest economies in the euro area (Germany, France, Italy and Spain) are especially significant, as they account for 75% of the Eurozone’s economy.
Another significant data release for the Euro is the Trade Balance. This indicator measures the difference between what a country earns from its exports and what it spends on imports over a given period. If a country produces highly sought after exports then its currency will gain in value purely from the extra demand created from foreign buyers seeking to purchase these goods. Therefore, a positive net Trade Balance strengthens a currency and vice versa for a negative balance.
Silver prices (XAG/USD) broadly unchanged on Wednesday, according to FXStreet data. Silver trades at $29.55 per troy ounce, steady from Tuesday.
Silver prices have increased by 16.02% since the beginning of the year.
| Unit measure | Today Price |
|---|---|
| Silver price per troy ounce | $29.55 |
| Silver price per gram | $0.95 |
The Gold/Silver ratio, which shows the number of troy ounces of Silver needed to equal the value of one troy ounce of Gold, stood at 78.93 on Wednesday, up from 78.86 on Tuesday.
Investors might use this ratio to determine the relative valuation of Gold and Silver. Some may consider a high ratio as an indicator that Silver is undervalued – or Gold is overvalued – and might buy Silver or sell Gold accordingly. Conversely, a low ratio might suggest that Gold is undervalued relative to Silver.
Silver FAQs
Silver is a precious metal highly traded among investors. It has been historically used as a store of value and a medium of exchange. Although less popular than Gold, traders may turn to Silver to diversify their investment portfolio, for its intrinsic value or as a potential hedge during high-inflation periods. Investors can buy physical Silver, in coins or in bars, or trade it through vehicles such as Exchange Traded Funds, which track its price on international markets.
Silver prices can move due to a wide range of factors. Geopolitical instability or fears of a deep recession can make Silver price escalate due to its safe-haven status, although to a lesser extent than Gold's. As a yieldless asset, Silver tends to rise with lower interest rates. Its moves also depend on how the US Dollar (USD) behaves as the asset is priced in dollars (XAG/USD). A strong Dollar tends to keep the price of Silver at bay, whereas a weaker Dollar is likely to propel prices up. Other factors such as investment demand, mining supply – Silver is much more abundant than Gold – and recycling rates can also affect prices.
Silver is widely used in industry, particularly in sectors such as electronics or solar energy, as it has one of the highest electric conductivity of all metals – more than Copper and Gold. A surge in demand can increase prices, while a decline tends to lower them. Dynamics in the US, Chinese and Indian economies can also contribute to price swings: for the US and particularly China, their big industrial sectors use Silver in various processes; in India, consumers’ demand for the precious metal for jewellery also plays a key role in setting prices.
Silver prices tend to follow Gold's moves. When Gold prices rise, Silver typically follows suit, as their status as safe-haven assets is similar. The Gold/Silver ratio, which shows the number of ounces of Silver needed to equal the value of one ounce of Gold, may help to determine the relative valuation between both metals. Some investors may consider a high ratio as an indicator that Silver is undervalued, or Gold is overvalued. On the contrary, a low ratio might suggest that Gold is undervalued relative to Silver.
(An automation tool was used in creating this post.)
- The Mexican Peso could recover to the 17.00s according to analysts, as election risk eases.
- Mexico’s high interest rates are likely to be the driver as they draw foreign investors seeking returns.
- USD/MXN continues pulling back in the midst of a short and medium-term uptrend.
The Mexican Peso (MXN) trades within a tight range on Wednesday as market calm descends and the post-election volatility, which saw the Peso sell-off by over 10% in its key pairs, eases.
Several market analysts are now saying the Mexican Peso will drift higher as firm fundamentals and a carry-trade advantage counteract the damage caused by the recent politically-driven volatility.
At the time of writing, a single US Dollar (USD) buys 18.42 Mexican Pesos, EUR/MXN is trading at 19.77 and GBP/MXN at 23.44.
Mexican Peso to regain strength, say analysts
The Mexican Peso is likely to recover after its deep decline after the elections, according to analysts at Rabobank, who forecast USD/MXN rebounding to a base case target of 18.10, but possibly even lower, over the next month.
“We see USD/MXN trending back down to the 17.80 region with the potential for a move as low as 17.20 if vols subdue, though we think a return below 17.00 is unlikely,” said the bank in a note on Wednesday.
The Peso still has a big “carry” advantage over rivals, says Rabobank, due to the high interest rates in Mexico. This factor is likely to keep demand relatively high.
“MXN remains the most attractive carry currency in the world when adjusting for volatility and liquidity, despite the recent surge in vols,” says the note.
The carry trade is a type of strategy in which investors borrow in a currency where interest rates are low – such as Japanese Yen (Apr. of circa 0.0% - 0.1%) and park their money in a currency with a higher interest, such as the Peso (Apr. of circa 11.00%). The profit in the trade is the difference between what is earned from the interest and the cost of borrowing. In the above example, assuming the Yen does not appreciate against the Peso, the trade would make the investor almost all the 11.00% interest earned in a year.
Mexican Peso to bounce back as sell-off overdone, says top currency forecaster
Mexico’s relatively high interest rates are also the reason why another analyst – ranked top for his MXN calls by Bloomberg – thinks the Mexican Peso will recover after the election sell-off.
Bartosz Sawicki, Market Analyst at Polish brokerage Cinkciarz.pl, thinks the move down after the elections is “overdone” and the Peso is due a correction back to 17.00 in USD/MXN.
The Peso’s recovery will be driven primarily by the Bank of Mexico’s (Banxico) determination to keep interest rates high. Although the bank lowered rates in March from 11.25% to 11.00%, it has been reluctant to follow up with further cuts, and Sawicki thinks this hawkish stance “will remain in place and this will act in favor of the Mexican Peso.”
However, the Peso faces considerable risks in the longer term, according to Sawicki, who sees the November US Presidential elections as a “huge risk event”. If Donald Trump wins, it could undermine trade and immigration agreements between the two nations, leading to a weakening of the Peso. Not only trade but remittances from Mexicans working in the US are key components of USD/MXN flows.
Investors are carrying their money away from emerging markets
Mexico is not alone when it comes to volatile election outcomes. Financial markets and the domestic currencies of both India and South Africa also experienced turbulence after recent elections. This has led many carry traders to reconsider where they invest, according to Sawacki.
“All the investors that we spoke to in the last couple of days said they might look for other carry trade opportunities in different regions, or will probably try to wait until US presidential elections in the fourth quarter,” Sawacki said in an interview with Bloomberg News.
Technical Analysis: USD/MXN steadies after pullback
USD/MXN treads water after pulling back following the 18.99 peak reached on June 12.
Whilst it is possible the correction could have further to run, the short and medium-term trends are now bullish, suggesting price will eventually turn around and start rising again. The next target higher is situated at 19.22 (March 2023 high).
USD/MXN Daily Chart
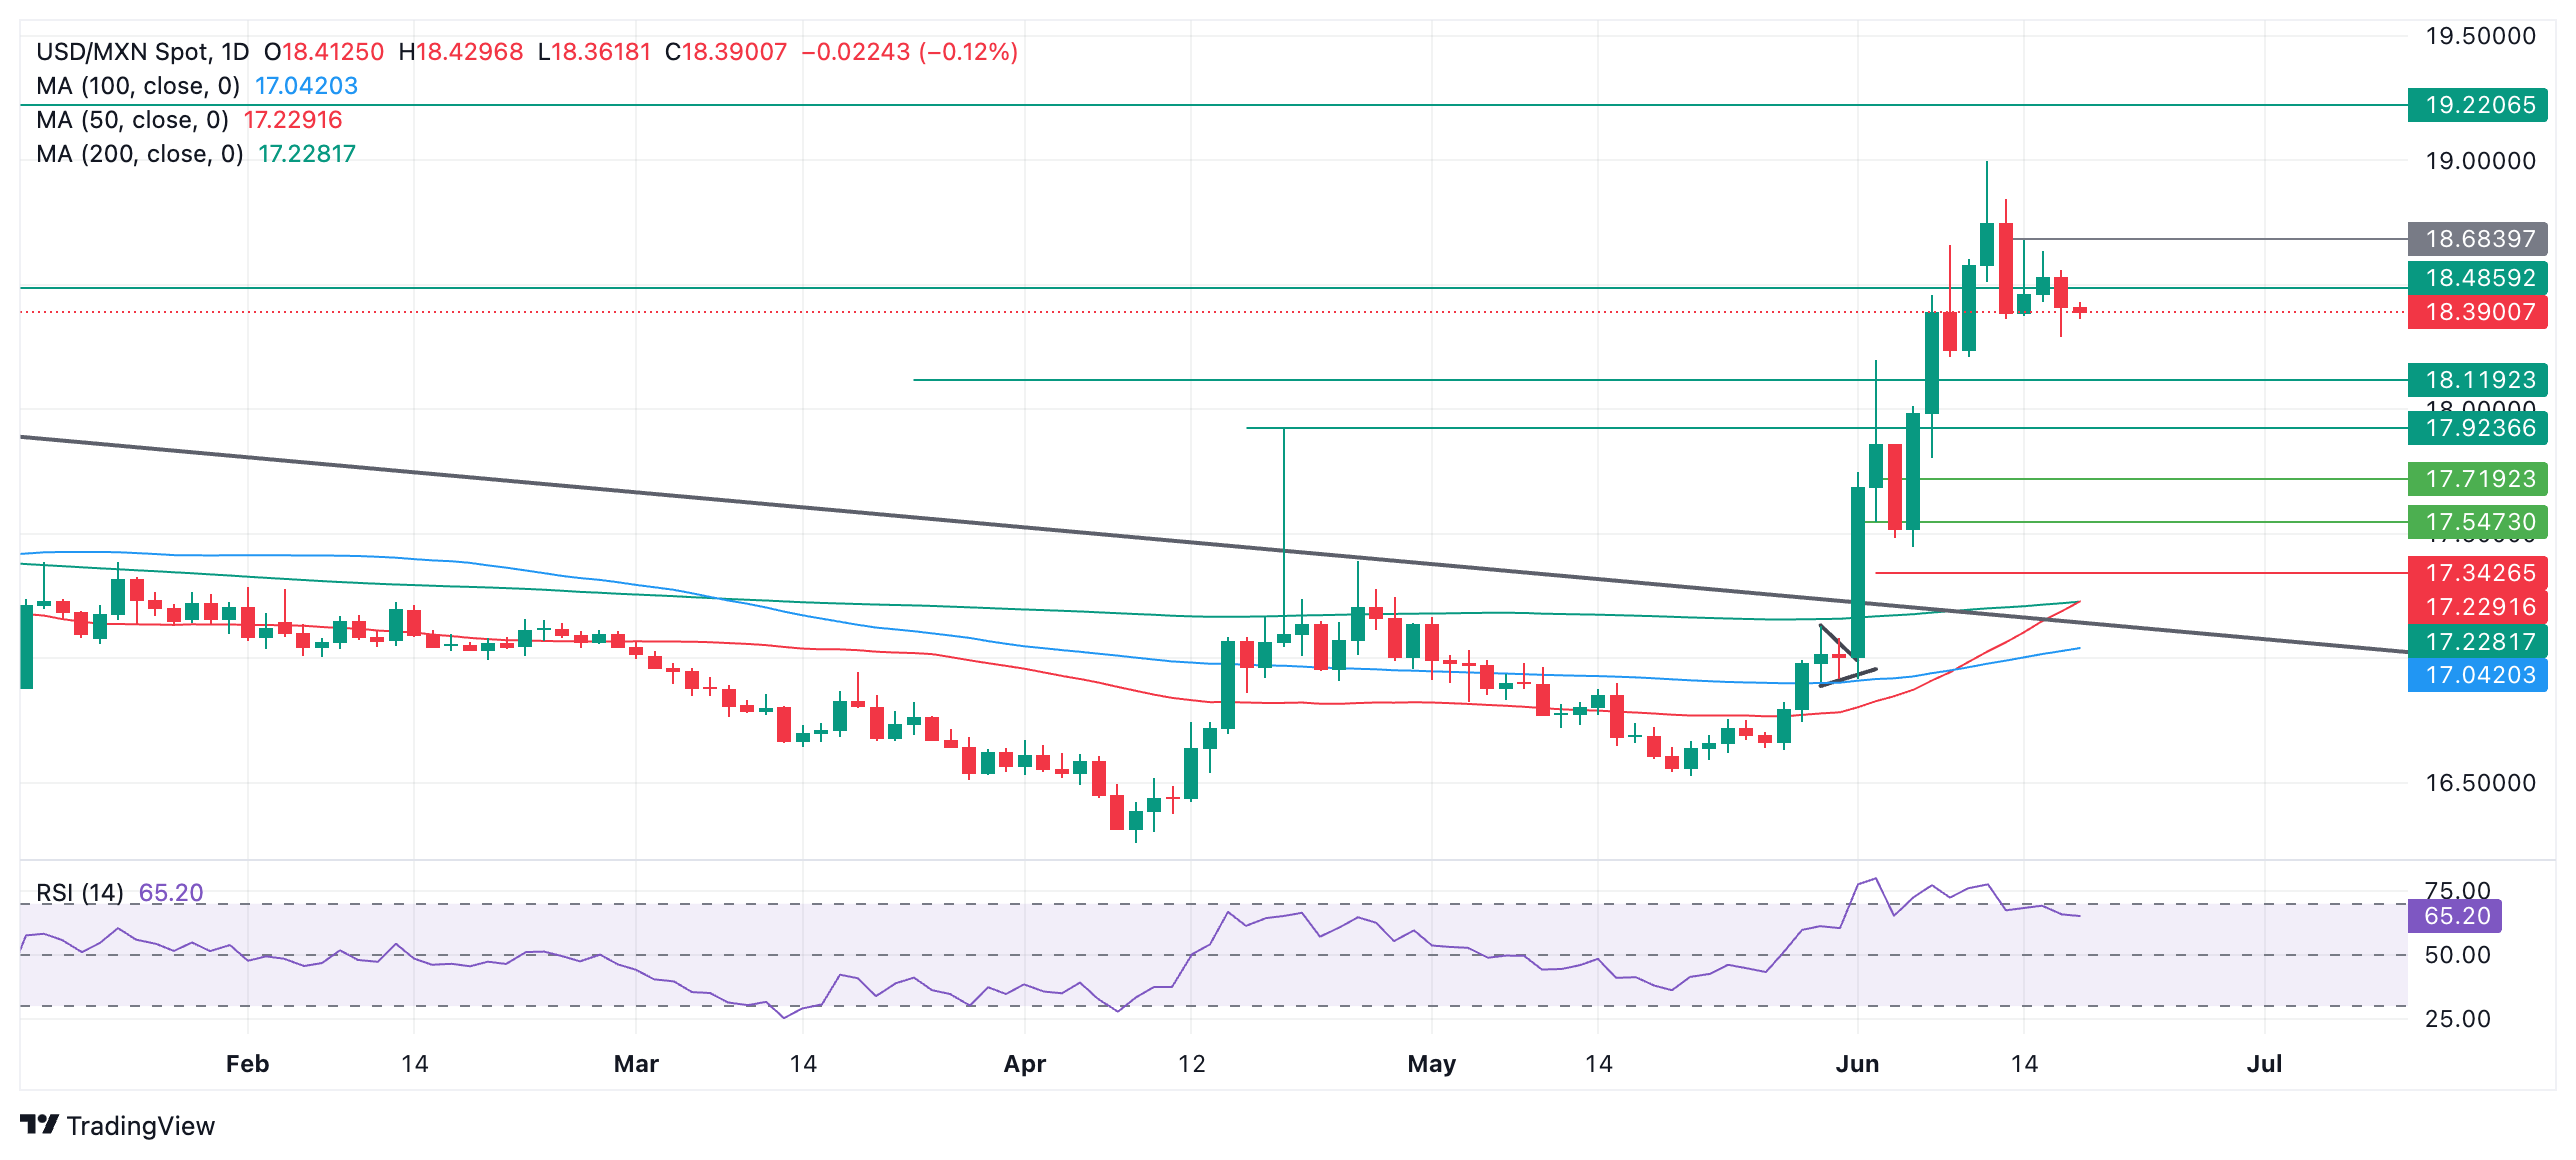
A break above Friday’s high at 18.68 would provide additional confirmation of more upside towards the target at 19.22.
The Relative Strength Index (RSI) has just exited the overbought zone, however, further suggesting a risk the correction could still go deeper. That said, the established uptrend is likely to resume eventually.
The direction of the long-term trend remains in doubt after the break above the October 2023 high. Previous to that, it was bearish.
Mexican Peso FAQs
The Mexican Peso (MXN) is the most traded currency among its Latin American peers. Its value is broadly determined by the performance of the Mexican economy, the country’s central bank’s policy, the amount of foreign investment in the country and even the levels of remittances sent by Mexicans who live abroad, particularly in the United States. Geopolitical trends can also move MXN: for example, the process of nearshoring – or the decision by some firms to relocate manufacturing capacity and supply chains closer to their home countries – is also seen as a catalyst for the Mexican currency as the country is considered a key manufacturing hub in the American continent. Another catalyst for MXN is Oil prices as Mexico is a key exporter of the commodity.
The main objective of Mexico’s central bank, also known as Banxico, is to maintain inflation at low and stable levels (at or close to its target of 3%, the midpoint in a tolerance band of between 2% and 4%). To this end, the bank sets an appropriate level of interest rates. When inflation is too high, Banxico will attempt to tame it by raising interest rates, making it more expensive for households and businesses to borrow money, thus cooling demand and the overall economy. Higher interest rates are generally positive for the Mexican Peso (MXN) as they lead to higher yields, making the country a more attractive place for investors. On the contrary, lower interest rates tend to weaken MXN.
Macroeconomic data releases are key to assess the state of the economy and can have an impact on the Mexican Peso (MXN) valuation. A strong Mexican economy, based on high economic growth, low unemployment and high confidence is good for MXN. Not only does it attract more foreign investment but it may encourage the Bank of Mexico (Banxico) to increase interest rates, particularly if this strength comes together with elevated inflation. However, if economic data is weak, MXN is likely to depreciate.
As an emerging-market currency, the Mexican Peso (MXN) tends to strive during risk-on periods, or when investors perceive that broader market risks are low and thus are eager to engage with investments that carry a higher risk. Conversely, MXN tends to weaken at times of market turbulence or economic uncertainty as investors tend to sell higher-risk assets and flee to the more-stable safe havens.
Here is what you need to know on Wednesday, June 19:
Pound Sterling clings to small gains early Wednesday as investors assess May inflation data ahead of the Bank of England's (BoE) monetary policy announcements on Thursday. The economic calendar will not offer any high-tier data releases and financial markets in the US will remain closed in observance of the Juneteenth holiday.
The UK's Office for National Statistics (ONS) reported that inflation, as measured by the change in the Consumer Price Index (CPI), declined to 2% on a yearly basis in May from 2.3% in April. This reading came in line with the market expectation. The Core CPI, which excludes volatile food and energy prices, rose 3.5% in the same period, while the Retail Price Index increased 3%. Despite softer inflation readings, GBP/USD edged higher and was last seen trading near 1.2720.
UK CPI inflation falls to 2.0% YoY in May, returns to BoE’s target.
British Pound PRICE Today
The table below shows the percentage change of British Pound (GBP) against listed major currencies today. British Pound was the strongest against the New Zealand Dollar.
| USD | EUR | GBP | JPY | CAD | AUD | NZD | CHF | |
|---|---|---|---|---|---|---|---|---|
| USD | 0.09% | -0.11% | -0.09% | 0.01% | -0.23% | 0.10% | -0.08% | |
| EUR | -0.09% | -0.21% | -0.17% | -0.09% | -0.31% | 0.03% | -0.17% | |
| GBP | 0.11% | 0.21% | 0.02% | 0.12% | -0.11% | 0.23% | 0.05% | |
| JPY | 0.09% | 0.17% | -0.02% | 0.10% | -0.13% | 0.21% | 0.02% | |
| CAD | -0.01% | 0.09% | -0.12% | -0.10% | -0.24% | 0.08% | -0.08% | |
| AUD | 0.23% | 0.31% | 0.11% | 0.13% | 0.24% | 0.36% | 0.17% | |
| NZD | -0.10% | -0.03% | -0.23% | -0.21% | -0.08% | -0.36% | -0.19% | |
| CHF | 0.08% | 0.17% | -0.05% | -0.02% | 0.08% | -0.17% | 0.19% |
The heat map shows percentage changes of major currencies against each other. The base currency is picked from the left column, while the quote currency is picked from the top row. For example, if you pick the British Pound from the left column and move along the horizontal line to the US Dollar, the percentage change displayed in the box will represent GBP (base)/USD (quote).
The US Dollar (USD) struggled to gather strength on Tuesday following the mixed macroeconomic data releases and comments from Federal Reserve (Fed) officials. Retail Sales in the US rose less than expected in May but Industrial Production grew at a faster pace than forecast. The USD Index registered small losses on the day but held comfortably above 105.00. Early Wednesday, the USD Index fluctuates in a tight channel at around 105.30.
EUR/USD climbed to a daily high above 1.0760 but failed to gather bullish momentum. The pair stays under modest bearish pressure and trades below 1.0750 in the European morning on Wednesday.
The minutes of the Bank of Japan's April policy meeting showed that policymakers discussed how recent depreciation in the Japanese Yen could affect underlying inflation. Earlier in the day, the data from Japan showed that Exports grew 13.5% on a yearly basis in May, while Imports increased 9.5%. After closing the last four trading days in positive territory, USD/JPY edges lower and trades below 158.00 in the European morning on Wednesday.
Gold registered small gains on Tuesday as the benchmark 10-year US Treasury bond yield failed to built on Monday's rebound. XAU/USD stays in a consolidation phase at around $2,330 in the early European session.
Inflation FAQs
Inflation measures the rise in the price of a representative basket of goods and services. Headline inflation is usually expressed as a percentage change on a month-on-month (MoM) and year-on-year (YoY) basis. Core inflation excludes more volatile elements such as food and fuel which can fluctuate because of geopolitical and seasonal factors. Core inflation is the figure economists focus on and is the level targeted by central banks, which are mandated to keep inflation at a manageable level, usually around 2%.
The Consumer Price Index (CPI) measures the change in prices of a basket of goods and services over a period of time. It is usually expressed as a percentage change on a month-on-month (MoM) and year-on-year (YoY) basis. Core CPI is the figure targeted by central banks as it excludes volatile food and fuel inputs. When Core CPI rises above 2% it usually results in higher interest rates and vice versa when it falls below 2%. Since higher interest rates are positive for a currency, higher inflation usually results in a stronger currency. The opposite is true when inflation falls.
Although it may seem counter-intuitive, high inflation in a country pushes up the value of its currency and vice versa for lower inflation. This is because the central bank will normally raise interest rates to combat the higher inflation, which attract more global capital inflows from investors looking for a lucrative place to park their money.
Formerly, Gold was the asset investors turned to in times of high inflation because it preserved its value, and whilst investors will often still buy Gold for its safe-haven properties in times of extreme market turmoil, this is not the case most of the time. This is because when inflation is high, central banks will put up interest rates to combat it. Higher interest rates are negative for Gold because they increase the opportunity-cost of holding Gold vis-a-vis an interest-bearing asset or placing the money in a cash deposit account. On the flipside, lower inflation tends to be positive for Gold as it brings interest rates down, making the bright metal a more viable investment alternative.
- The Pound Sterling moves higher above 1.2700 as the UK inflation cools down further in line with expectations.
- UK service inflation remains sticky, which could restrict the BoE from committing rate cuts in the near term.
- Slower-than-expected US Retail Sales growth has limited the US Dollar upside.
The Pound Sterling (GBP) edges higher above the round-level resistance of 1.2700 on Wednesday after the United Kingdom (UK) Office for National Statistics (ONS) showed that price pressures declined as expected in May. UK’s annual headline inflation returned to the central bank’s target of 2% for the first time in more than three years from April’s reading of 2.3%. In the same period, the core Consumer Price Index (CPI), which excludes volatile food and energy prices, declined to 3.5% from the former reading of 3.9%.
Monthly headline inflation grew steadily by 0.3% but lower than estimates of 0.4%. The report also showed that the annual Producer Price Index (PPI) for Core Output grew significantly by 1.0% in May, compared with the 0.3% increase a month earlier.
In spite of a decline in the annual headline CPI to 2%, Bank of England (BoE) policymakers might not be comfortable with discussions on early rate cuts as annual service inflation barely decelerated. Inflation in the service sector grew by 5.9%, slightly lower than the prior release of 6.0%, but is almost double that which is needed to contain price pressures.
The next trigger for the Pound Sterling will be the BoE’s monetary policy decision, which will be announced on Thursday. The BoE is widely anticipated to keep the interest rate unchanged at 5.25%. Therefore, investors will focus on vote split and fresh cues about when the BoE will start reducing interest rates.
Daily digest market movers: Pound Sterling moves higher as UK service inflation barely declines
- The Pound Sterling strengthens against the US Dollar (USD) as UK service inflation grew by 5.9% year-over-year in May, slightly declining from 6.0%, but keeping broadly stubborn. Meanwhile, the US Dollar steadies after a modest correction led by slower-than-expected United States (US) monthly Retail Sales growth for May, which allowed financial markets to raise their bets for early rate cuts by the Federal Reserve (Fed). The US Dollar Index (DXY), which tracks the Greenback’s value against six major currencies, holds the crucial support of 105.00 after correcting from a fresh six-week high of 105.80.
- The US Census Bureau showed on Tuesday that Retail Sales missed estimates of 0.2% growth but increased an uptick of 0.1% in May after contracting by 0.2% in April, downwardly revised from 0%. Core Retail Sales excluding automobiles contracted steadily by 0.2%, deepening fears of a slower Q2 Gross Domestic Product (GDP). Core Retail Sales data is a key measure of consumer spending, which is a crucial component of GDP.
- Investors noticed that sales were hit by lower ticket sizes at service stations due to lower gasoline and motor vehicle prices, weak demand for building materials, and a decline in footprints at food services and drinking places. This suggests that households cut spending on discretionary items, which is generally the outcome of soft purchasing power due to higher inflation and interest rates.
- According to the CME FedWatch tool, 30-day Fed Funds futures pricing data suggest two interest rate cuts this year against only one signaled by Fed policymakers in their latest interest rate projections. Investors see the Fed reducing interest rates twice this year as a soft US inflation report for May indicated that the progress in the disinflation process has resumed.
- On Tuesday, Dallas Fed Bank President Lorie Logan said the latest inflation figures showing that price pressures are cooling is welcome news. However, policymakers need to see more good data before considering rate cuts.
Technical Analysis: Pound Sterling recovers further above 1.2700
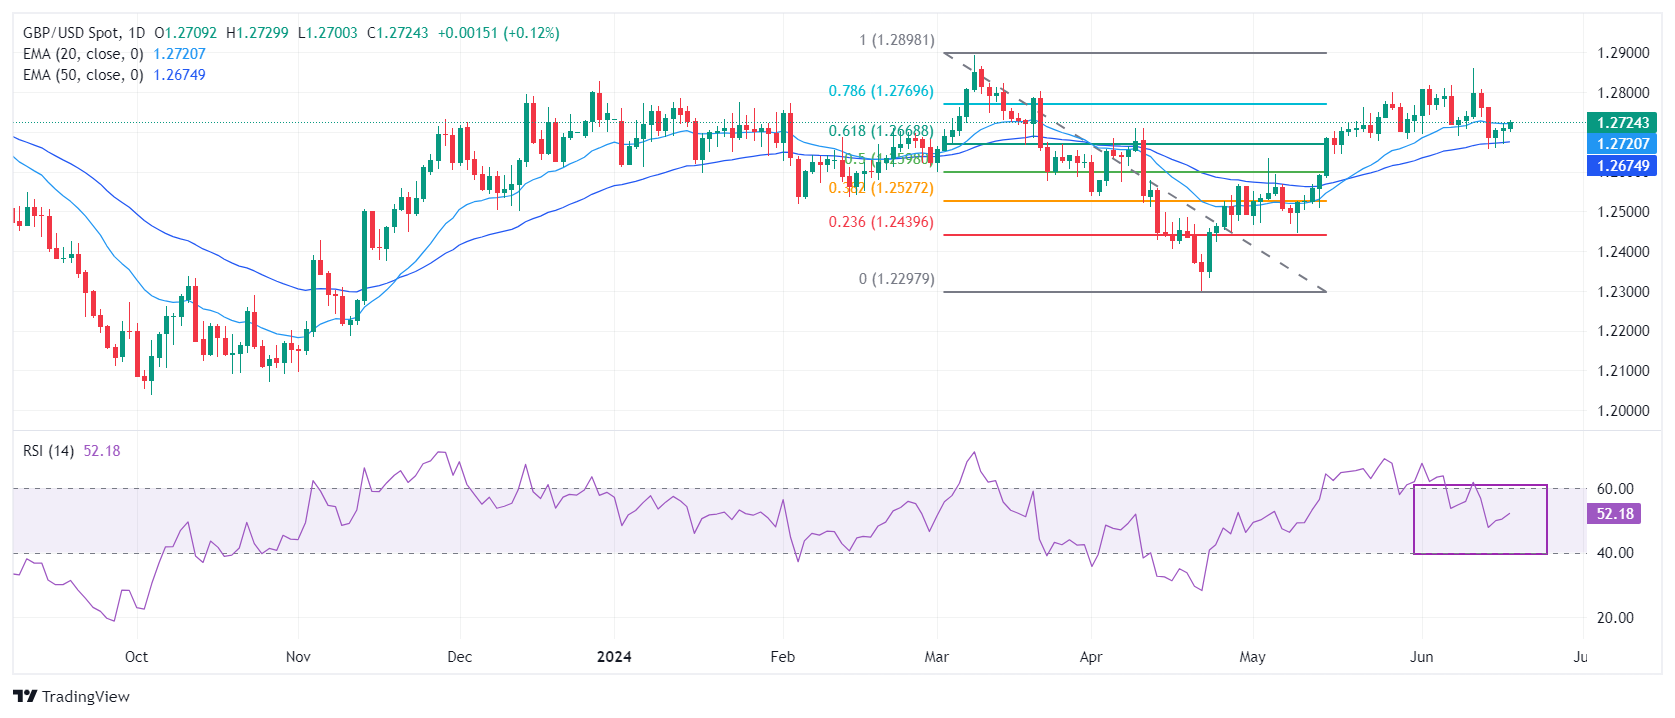
The Pound Sterling extends its recovery above 1.2700 on sticky UK service inflation data. The GBP/USD pair rises to near the 20-day Exponential Moving Average (EMA) at 1.2720, though the near-term trend is still uncertain. The 50-day EMA near 1.2670 is acting as a major support for the Pound Sterling bulls.
Currently, the Cable holds the 61.8% Fibonacci retracement support (plotted from the March 8 high of 1.2900 to the April 22 low at 1.2300) at 1.2667.
The 14-period Relative Strength Index (RSI) falls back into the 40.00-60.00 range, indicating that the upside momentum has faded.
Pound Sterling FAQs
The Pound Sterling (GBP) is the oldest currency in the world (886 AD) and the official currency of the United Kingdom. It is the fourth most traded unit for foreign exchange (FX) in the world, accounting for 12% of all transactions, averaging $630 billion a day, according to 2022 data. Its key trading pairs are GBP/USD, aka ‘Cable’, which accounts for 11% of FX, GBP/JPY, or the ‘Dragon’ as it is known by traders (3%), and EUR/GBP (2%). The Pound Sterling is issued by the Bank of England (BoE).
The single most important factor influencing the value of the Pound Sterling is monetary policy decided by the Bank of England. The BoE bases its decisions on whether it has achieved its primary goal of “price stability” – a steady inflation rate of around 2%. Its primary tool for achieving this is the adjustment of interest rates. When inflation is too high, the BoE will try to rein it in by raising interest rates, making it more expensive for people and businesses to access credit. This is generally positive for GBP, as higher interest rates make the UK a more attractive place for global investors to park their money. When inflation falls too low it is a sign economic growth is slowing. In this scenario, the BoE will consider lowering interest rates to cheapen credit so businesses will borrow more to invest in growth-generating projects.
Data releases gauge the health of the economy and can impact the value of the Pound Sterling. Indicators such as GDP, Manufacturing and Services PMIs, and employment can all influence the direction of the GBP. A strong economy is good for Sterling. Not only does it attract more foreign investment but it may encourage the BoE to put up interest rates, which will directly strengthen GBP. Otherwise, if economic data is weak, the Pound Sterling is likely to fall.
Another significant data release for the Pound Sterling is the Trade Balance. This indicator measures the difference between what a country earns from its exports and what it spends on imports over a given period. If a country produces highly sought-after exports, its currency will benefit purely from the extra demand created from foreign buyers seeking to purchase these goods. Therefore, a positive net Trade Balance strengthens a currency and vice versa for a negative balance.
- Silver price holds the $29.00 support as investors see the Fed returning to policy-normalization from September.
- US bond yields rebound as Fed officials continue to advocate only one rate cut this year.
- Investors shift focus to preliminary US S&P Global PMIs for June.
Silver price (XAG/USD) continues to hold the crucial support of $29.00 in Wednesday’s early European session. The white metal is consistently seeing buying interest near above-mentioned support amid growing speculation that the Federal Reserve (Fed) will start reducing interest rates from the September meeting.
According to the CME FedWatch tool, 30-day Fed Fund Futures pricing data shows a 67% chance for rate cuts in September, rising from 61.5% as the United States (US) Retail Sales grew at a slower pace than expected in May. The CME FedWatch tool also shows that there will be two rate cuts this year against one signaled by policymakers in their latest interest rate projections report.
Fed officials continue to argue in favor of lowering interest rates only once this year as they want to see inflation declining for months to gain confidence that price pressures are on course to return to the 2% target.
Meanwhile, some recovery in US bond yields due to the Fed’s hawkish narrative has weighed on the Silver price. A recovery move in yields on interest-bearing assets increases the opportunity cost of holding an investment in non-yielding assets, such as Silver.
Going forward, investors will shift focus to preliminary S&P Global PMIs for June, which will be published on Friday.
Silver technical analysis
Silver price oscillates in a Falling Channel chart pattern, on a four-hour timeframe, in which each pullback is considered as selling opportunity by market participants. The asset hovers near the 200-period Exponential Moving Average (EMA), which trades around $29.40, indicating indecisiveness among market participants.
The 14-period Relative Strength Index (RSI) oscillates in the 40.00-60.00 range, suggesting a consolidating ahead.
Silver four-hour chart
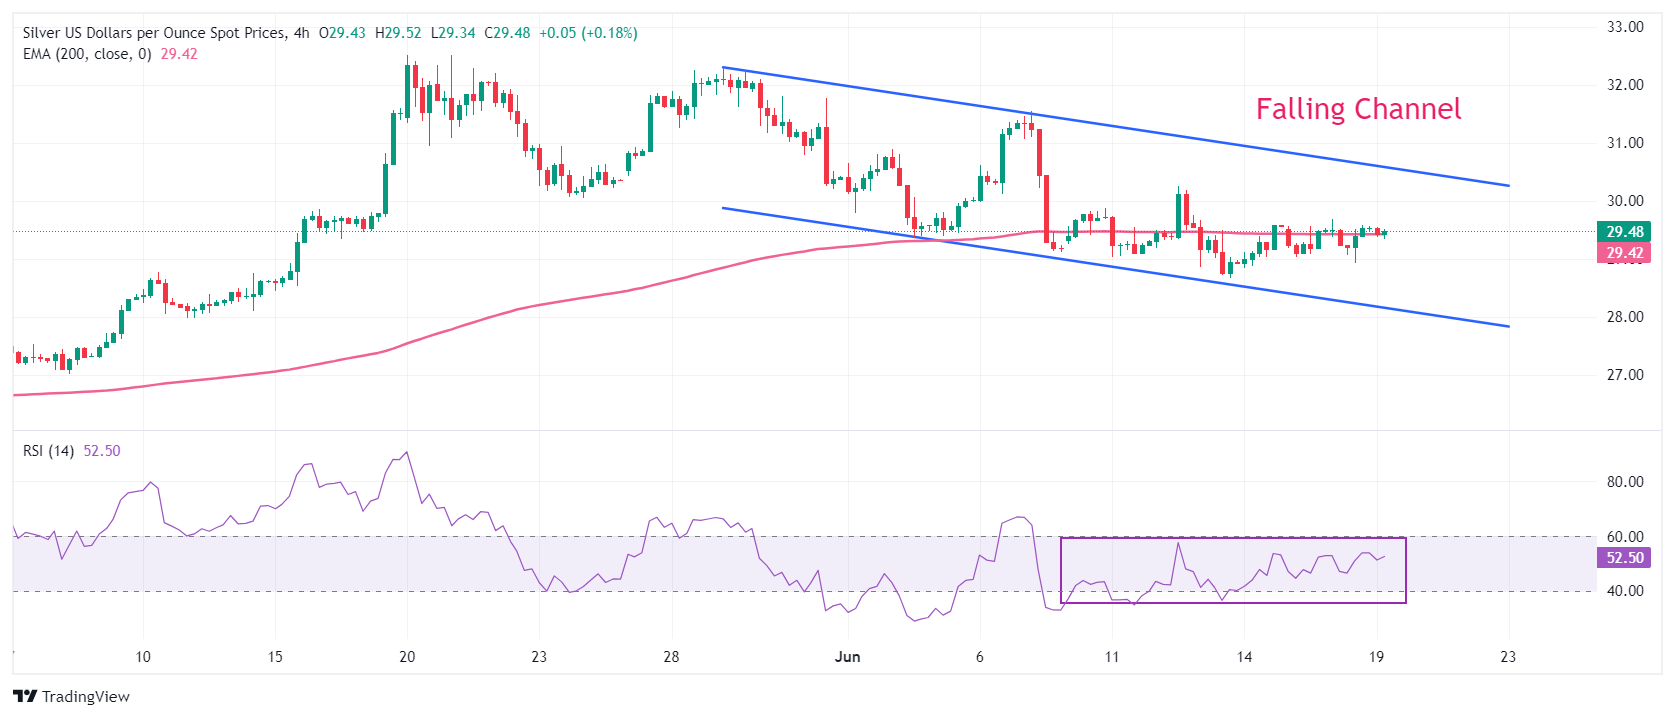
Gold prices remained broadly unchanged in India on Wednesday, according to data compiled by FXStreet.
The price for Gold stood at 6,250.22 Indian Rupees (INR) per gram, broadly stable compared with the INR 6,248.45 it cost on Tuesday.
The price for Gold was broadly steady at INR 72,901.34 per tola from INR 72,880.70 per tola a day earlier.
| Unit measure | Gold Price in INR |
|---|---|
| 1 Gram | 6,250.22 |
| 10 Grams | 62,502.20 |
| Tola | 72,901.34 |
| Troy Ounce | 194,403.70 |
FXStreet calculates Gold prices in India by adapting international prices (USD/INR) to the local currency and measurement units. Prices are updated daily based on the market rates taken at the time of publication. Prices are just for reference and local rates could diverge slightly.
Global Market Movers: Comex Gold price keeps range as traders await more Fed policy cues
- Investors remain uncertain about the Federal Reserve's rate-cut path, which, in turn, fails to provide any meaningful impetus to the Comex Gold price and leads to subdued range-bound price action.
- The Fed last week lowered its projection for the number of rate cuts in 2024 to one from three in March, though the incoming US macro data keeps hopes alive for the first rate cut in September.
- The bets were lifted by softer US consumer and producer prices data released last week, which suggested that inflation is subsiding, and disappointing US Retail Sales figures on Tuesday.
- The Commerce Department reported that US Retail Sales rose 0.1% on a monthly basis in May as against the previous month's downwardly revised fall of 0.2% and the 0.2% increase anticipated.
- The softer print pointed to signs of exhaustion among US consumers and that the economic activity was slowing, strengthening the case for the Fed to lower borrowing costs sooner than expected.
- In an interview with Fox Business, New York Fed President John Williams noted that the recent inflation data have been encouraging and added that he expects inflation to continue to come down.
- Richmond Fed President Thomas Barkin said that May inflation data was encouraging but it is hard to know how much signal to take from inflation last year, this quarter, or the last couple of weeks.
- Meanwhile, Boston Fed President Susan Collins said that inflation remains stubbornly high, and it will take more time than many had initially hoped to bring price growth back down to the 2% target.
- Fed Governor Adriana Kugler noted that economic conditions are moving in the right direction, and it is likely appropriate to begin easing policy sometime later this year if the economy evolves as expected.
- Dallas Fed President Lorie Logan reiterated that although tremendous progress has been made, inflation remains too high and will need to see 'several more months' to have confidence that it is heading to 2%.
- St. Louis Fed President Alberto Musalem noted that the labor market remains particularly tight and that it could take entire months or quarters before policies drag inflation back to the target levels.
- The US Dollar bulls remain on the defensive in the wake of the overnight decline in the US Treasury bond yields, lending some support to the non-yielding yellow metal amid absent relevant economic data.
Gold FAQs
Gold has played a key role in human’s history as it has been widely used as a store of value and medium of exchange. Currently, apart from its shine and usage for jewelry, the precious metal is widely seen as a safe-haven asset, meaning that it is considered a good investment during turbulent times. Gold is also widely seen as a hedge against inflation and against depreciating currencies as it doesn’t rely on any specific issuer or government.
Central banks are the biggest Gold holders. In their aim to support their currencies in turbulent times, central banks tend to diversify their reserves and buy Gold to improve the perceived strength of the economy and the currency. High Gold reserves can be a source of trust for a country’s solvency. Central banks added 1,136 tonnes of Gold worth around $70 billion to their reserves in 2022, according to data from the World Gold Council. This is the highest yearly purchase since records began. Central banks from emerging economies such as China, India and Turkey are quickly increasing their Gold reserves.
Gold has an inverse correlation with the US Dollar and US Treasuries, which are both major reserve and safe-haven assets. When the Dollar depreciates, Gold tends to rise, enabling investors and central banks to diversify their assets in turbulent times. Gold is also inversely correlated with risk assets. A rally in the stock market tends to weaken Gold price, while sell-offs in riskier markets tend to favor the precious metal.
The price can move due to a wide range of factors. Geopolitical instability or fears of a deep recession can quickly make Gold price escalate due to its safe-haven status. As a yield-less asset, Gold tends to rise with lower interest rates, while higher cost of money usually weighs down on the yellow metal. Still, most moves depend on how the US Dollar (USD) behaves as the asset is priced in dollars (XAU/USD). A strong Dollar tends to keep the price of Gold controlled, whereas a weaker Dollar is likely to push Gold prices up.
(An automation tool was used in creating this post.)
FX option expiries for June 19 NY cut at 10:00 Eastern Time, via DTCC, can be found below
- EUR/USD: EUR amounts
- 1.0715 712m
- 1.0745 1.7b
- 1.0870 638m
- GBP/USD: GBP amounts
- 1.2725 597m
- USD/JPY: USD amounts
- 155.00 1.1b
- 156.00 510m
- USD/CHF: USD amounts
- 0.8830 600m
- 0.9000 690m
- AUD/USD: AUD amounts
- 0.6540 456m
- USD/CAD: USD amounts
- 1.3585 663m
- 1.3625 400m
- 1.3690 1.4b
- 1.3755 486m
- 1.3765 569m
- NZD/USD: NZD amounts
- 0.6070 500m
- EUR/GBP: EUR amounts
- 0.8525 405m
- 0.8550 484m
- 0.8600 502m
- USD/CHF posts modest gains near 0.8840 in Wednesday’s early European session.
- The Swiss National Bank (SNB) is expected to keep its interest rate steady at 1.5% in the June meeting on Thursday.
- The US Retail Sales were weaker than expected, rising 0.1% MoM in May.
The USD/CHF pair trades with mild gains near three-month lows around 0.8840 during the early European session on Wednesday. The modest rebound of the pair might be limited as traders raised their bets on the US Federal Reserve (Fed) rate cut this year. US markets will be closed on Wednesday due to Juneteenth National Independence Day. Investors await the Swiss National Bank (SNB) Interest Rate Decision on Thursday, with no change in rate expected.
The Swiss central bank is anticipated to keep its interest rate on hold at 1.5% as the nation's inflation remains elevated for the second consecutive month in May. Ahead of the policy meeting, investors have priced in nearly 60% odds of an SNB rate cut, down from 97% in April, according to Bloomberg. However, economists are roughly split on the decision. ”We expect the policy rate to be cut by 25bp to 1.25% at this upcoming meeting ... it is our base case because inflation is within the target range, it is expected to remain there, and the SNB thinks the policy is currently restrictive," said Nomura European economist George Moran.
On the other hand, the weaker-than-expected US Retail Sales report on Tuesday has triggered speculation that the Fed will start to cut interest rates in a few months, which drag the Greenback lower against its rivals. The US Retail Sales rose 0.1% on a monthly in May following a decline of 0.2% in April, below the consensus of a 0.2% increase, the Commerce Department reported Tuesday.
- WTI price trades close to a six-week high on multiple tailwinds.
- Firm Fed rate-cut prospects improve the Oil demand outlook.
- Geopolitical tensions in the Middle East and Europe have raised supply concerns.
West Texas Intermediate (WTI), futures on NYMEX, hold gains near fresh six-week high near $80.70 in Wednesday’s Asian session. The Oil price strengthens due to an improvement in expectations that the Federal Reserve (Fed) will start reducing interest rates from the September meeting and deepening tensions in the Middle East and Europe.
The CME FedWatch tool shows that traders see a 67% chance of the Fed reducing key rates in September. Traders are also pricing in two rate cuts, this one against one signaled by policymakers in their latest interest rate projections.
Increased confidence in investors for Fed rate cuts in September is the outcome of the soft United States (US) Consumer Price Index (CPI) report for May, which indicated that the progress in the disinflation process has resumed. Also, lower-than-expected growth in the US Retail Sales for May has boosted early rate-cut expectations. The Retail Sales data excluding automobiles- a measure of consumer spending- contracted for the second straight month by 0.1%.
The high possibility of early rate cuts by the Fed is a favorable situation for the Oil price, as it improves sentiment for the global economic outlook.
On the geopolitical front, Ukraine’s drone attack on an oil terminal in Russia's southern port of Azov and the announcement of an all-out war by Israeli Foreign Minister Israel Katz against Lebanon's Hezbollah have triggered supply concerns.
Going forward, the next trigger for the Oil price will be Energy Information Administration (EIA) Crude Oil Stocks Change data for the week ending June 14, which will be published on Thursday due to a holiday in US markets on account of Juneteenth.
- EUR/USD trades with a mild negative bias, though the downside remains cushioned.
- September Fed rate cut bets keep the USD bulls on the defensive and lend support.
- The technical setup favors bearish traders and supports prospects for further losses.
The EUR/USD pair ticks lower during the Asian session on Wednesday and moves further away from the weekly high touched the previous day. Spot prices remain on the defensive below mid-1.0700s, though the downside seems cushioned in the wake of subdued US Dollar (USD) price action.
Political uncertainty in France – the Eurozone's second-largest economy – continues to undermine the shared currency and turns out to be a key factor acting as a headwind for the EUR/USD pair. The USD, on the other hand, languishes near the weekly low touched on Tuesday in reaction to weaker US Retail Sales data, which lifted bets for a rate cut by the Federal Reserve (Fed) in September. This, in turn, could act as a tailwind for the currency pair.
From a technical perspective, the recent breakdown through the 1.0800-1.0790 confluence, comprising the 100-day and the 200-day Simple Moving Averages (SMA) was seen as a fresh trigger for bearish traders. Moreover, oscillators on the daily chart are holding in the negative territory and are still far from being in the oversold zone. This adds credence to the negative outlook and suggests that the path of least resistance for the EUR/USD pair is to the downside.
Traders, however, might wait for a convincing break and acceptance below the 1.0700 mark before positioning for further losses. The EUR/USD pair might then accelerate the fall towards the 1.0650-1.0640 support zone before dropping to the 1.0600 mark, or the YTD low touched in April. Some follow-through selling should pave the way for an extension of the recent downtrend witnessed over the past two weeks or so, from levels just above the 1.0900 round figure.
On the flip side, any attempted positive move is likely to attract fresh sellers and remain capped near the 1.0800 confluence support-turned-resistance. The said handle should act as a key pivotal point, which if cleared decisively might prompt a short-covering rally and lift the EUR/USD pair towards the 1.0865-1.0870 supply zone en route to the 1.0900 round-figure mark.
EUR/USD daily chart
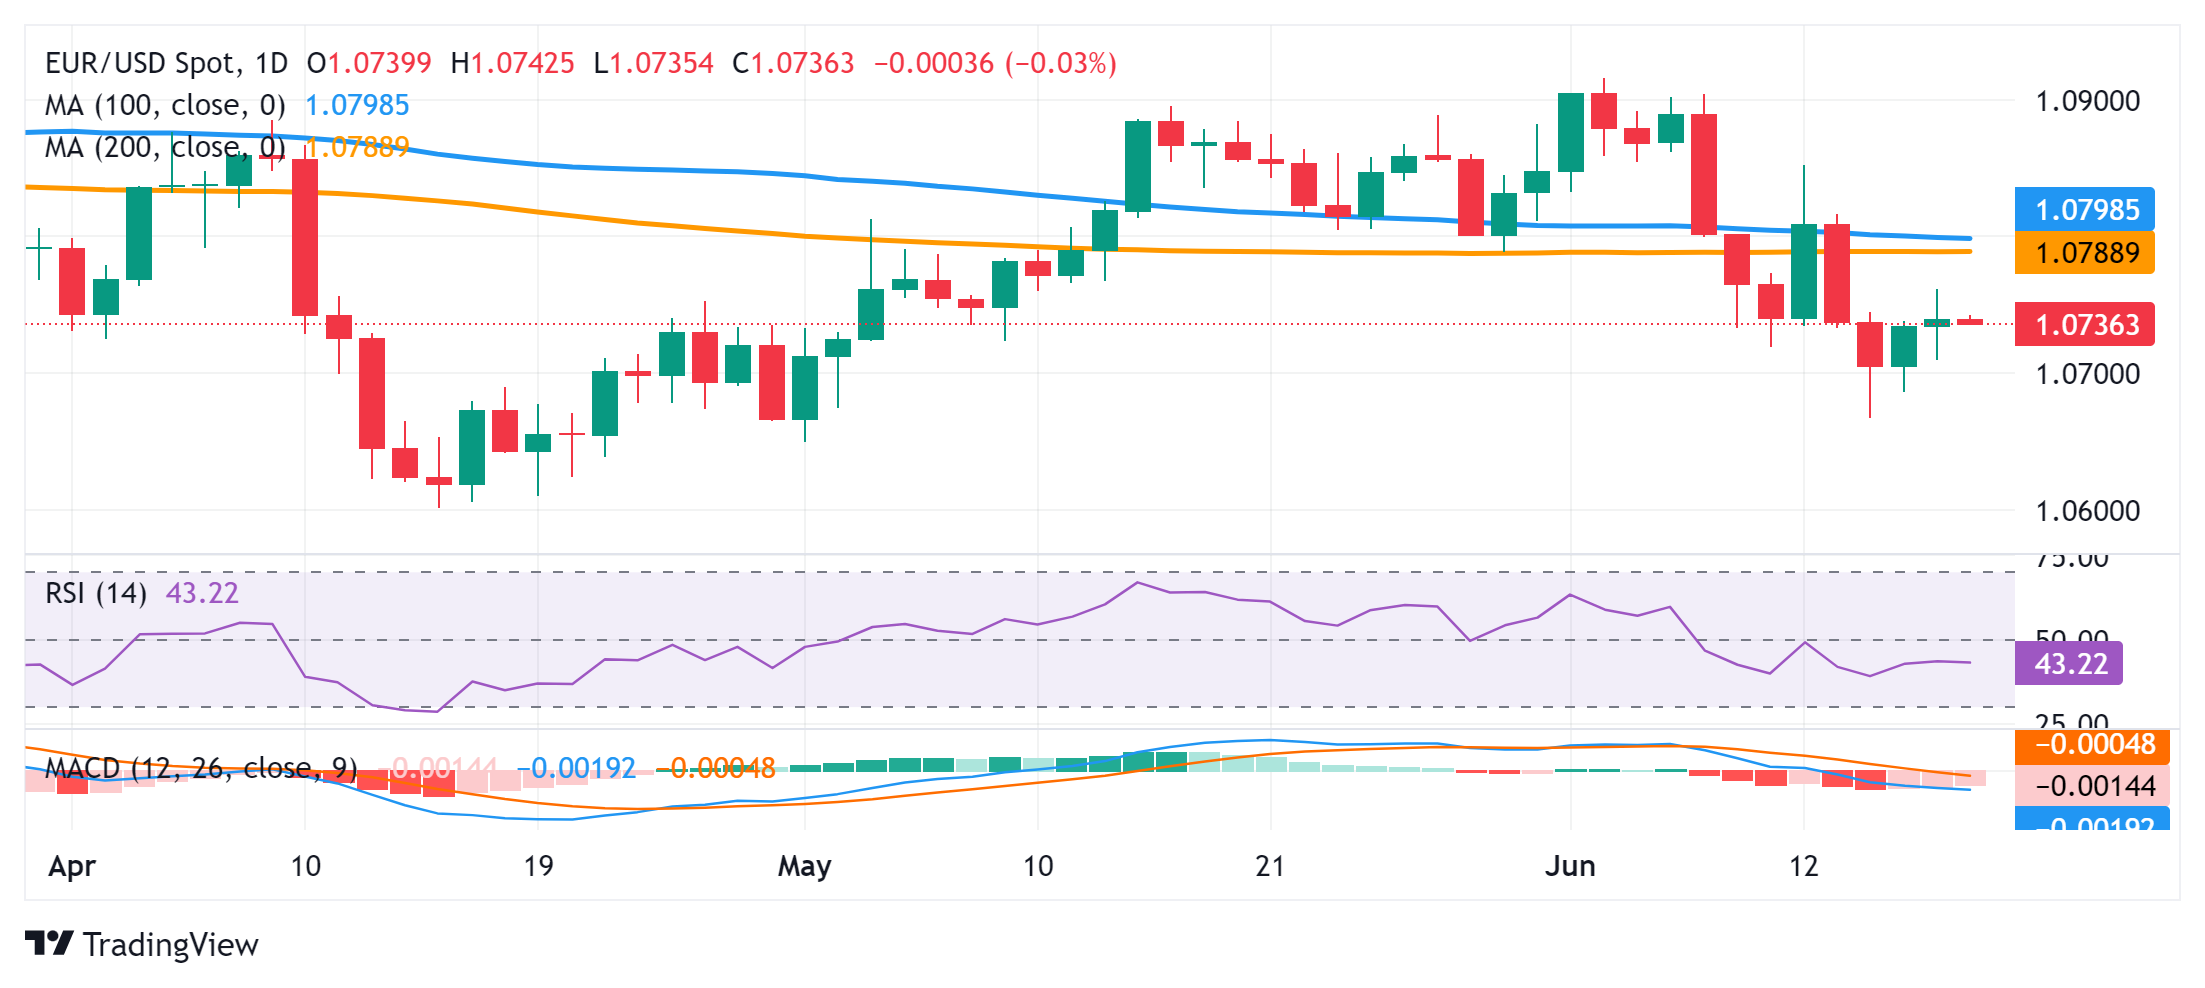
Having reviewed a draft proposal, Reuters reported that the Japanese Finance Ministry panel is likely to urge the government to issue shorter-duration debt to reduce interest-rate risk.
Additional takeaways
Govt could adjust issuance size of super-long JGBs as life insurers unlikely to significantly increase holdings.
Banks have scope to increase holdings of JGBs, can play big role in ensuring smooth debt issuance.
Market reaction
At the time of writing, USD/JPY is trading flat near 157.85, unperturbed by the above headlines.
Japanese Yen FAQs
The Japanese Yen (JPY) is one of the world’s most traded currencies. Its value is broadly determined by the performance of the Japanese economy, but more specifically by the Bank of Japan’s policy, the differential between Japanese and US bond yields, or risk sentiment among traders, among other factors.
One of the Bank of Japan’s mandates is currency control, so its moves are key for the Yen. The BoJ has directly intervened in currency markets sometimes, generally to lower the value of the Yen, although it refrains from doing it often due to political concerns of its main trading partners. The current BoJ ultra-loose monetary policy, based on massive stimulus to the economy, has caused the Yen to depreciate against its main currency peers. This process has exacerbated more recently due to an increasing policy divergence between the Bank of Japan and other main central banks, which have opted to increase interest rates sharply to fight decades-high levels of inflation.
The BoJ’s stance of sticking to ultra-loose monetary policy has led to a widening policy divergence with other central banks, particularly with the US Federal Reserve. This supports a widening of the differential between the 10-year US and Japanese bonds, which favors the US Dollar against the Japanese Yen.
The Japanese Yen is often seen as a safe-haven investment. This means that in times of market stress, investors are more likely to put their money in the Japanese currency due to its supposed reliability and stability. Turbulent times are likely to strengthen the Yen’s value against other currencies seen as more risky to invest in.
- NZD/USD meets with a fresh supply on Wednesday and snaps a two-day winning streak.
- The USD struggles to lure buyers amid September Fed rate cut bets and could lend support.
- The focus, meanwhile, remains on the release of the Q1 New Zealand GDP print on Thursday.
The NZD/USD pair struggles to capitalize on the previous day's goodish rebound from sub-0.6100 levels, or over a one-week low and attracts some sellers during the Asian session on Wednesday. Spot prices currently trade around the 0.6135 region, down 0.10% for the day, though lack follow-through selling in the wake of a softer tone surrounding the US Dollar (USD).
The USD Index (DXY), which tracks the Greenback against a basket of currencies, languishes near the weekly low touched the previous day amid expectations that the Federal Reserve (Fed) will cut interest rates soon. The bets were lifted by softer US Retail Sales figures on Tuesday, which pointed to signs of exhaustion among US consumers. This comes on the back of last week's weaker US consumer and producer prices, supporting prospects for an imminent start of the Fed's rate-cutting cycle in September.
Apart from this, a bullish tone across the global equity markets is seen undermining the safe-haven buck and might lend support to the risk-sensitive Kiwi. That said, mixed economic data released from China on Monday underlined a bumpy recovery in the world's second-largest economy and is seen weighing on antipodean currencies, including the New Zealand Dollar (NZD). Apart from this, comments by the Reserve Bank of New Zealand (RBNZ) Chief Economist Paul Conway exert pressure on the NZD/USD pair.
Conway noted that inflation may be stickier in the short term, though could fall more quickly than expected in the medium term. This, in turn, could keep bullish traders on the back foot ahead of the New Zealand economic growth data for the first quarter, which is due for release on Thursday. In the meantime, the USD price dynamics might continue to influence the NZD/USD pair in the absence of any relevant market-moving economic data and relatively thin trading volumes on the back of a US bank holiday on Wednesday.
- Gold price is seen consolidating near the top end of a short-term trading range.
- Fed rate-cut uncertainty holds back traders from placing fresh directional bets.
- The USD is undermined by Tuesday’s weaker US Retail Sales and lends support.
Gold price (XAU/USD) struggles to capitalize on the previous day's bounce from the vicinity of the $2,300 mark and oscillates in a narrow band during the Asian session on Wednesday. The precious metal is currently placed around the $2,330 area, or the top boundary of a short-term trading range held over the past one-and-half-week or so as traders seek clarity about the likely timing when the Federal Reserve (Fed) will start cutting interest rates.
The US central bank adopted a more hawkish stance at the end of the June policy meeting and forecasted only one interest rate cut in 2024. The markets, however, are still pricing in the possibility of two rate cuts this year amid signs that inflation in the US is subsiding. Moreover, weaker US Retail Sales data released on Tuesday pointed to signs of exhaustion among US consumers and lifted bets for a rate cut in September and another in December.
Meanwhile, expectations that the Fed will begin its rate-cutting cycle soon triggered the overnight fall in the US Treasury bond yields, which keeps the US Dollar (USD) bulls on the defensive and acts as a tailwind for the non-yielding Gold price. That said, the underlying bullish tone across the global equity markets is holding back traders from placing aggressive bullish bets around the safe-haven XAU/USD and should cap any meaningful upside.
Daily Digest Market Movers: Gold price struggles for firm near-term direction amid Fed rate cut uncertainty
- Investors remain uncertain about the Federal Reserve's rate-cut path, which, in turn, fails to provide any meaningful impetus to the Gold price and leads to subdued range-bound price action.
- The Fed last week lowered its projection for the number of rate cuts in 2024 to one from three in March, though the incoming US macro data keeps hopes alive for the first rate cut in September.
- The bets were lifted by softer US consumer and producer prices data released last week, which suggested that inflation is subsiding, and disappointing US Retail Sales figures on Tuesday.
- The Commerce Department reported that US Retail Sales rose 0.1% on a monthly basis in May as against the previous month's downwardly revised fall of 0.2% and the 0.2% increase anticipated.
- The softer print pointed to signs of exhaustion among US consumers and that the economic activity was slowing, strengthening the case for the Fed to lower borrowing costs sooner than expected.
- In an interview with Fox Business, New York Fed President John Williams noted that the recent inflation data have been encouraging and added that he expects inflation to continue to come down.
- Richmond Fed President Thomas Barkin said that May inflation data was encouraging but it is hard to know how much signal to take from inflation last year, this quarter, or the last couple of weeks.
- Meanwhile, Boston Fed President Susan Collins said that inflation remains stubbornly high, and it will take more time than many had initially hoped to bring price growth back down to the 2% target.
- Fed Governor Adriana Kugler noted that economic conditions are moving in the right direction, and it is likely appropriate to begin easing policy sometime later this year if the economy evolves as expected.
- Dallas Fed President Lorie Logan reiterated that although tremendous progress has been made, inflation remains too high and will need to see 'several more months' to have confidence that it is heading to 2%.
- St. Louis Fed President Alberto Musalem noted that the labor market remains particularly tight and that it could take entire months or quarters before policies drag inflation back to the target levels.
- The US Dollar bulls remain on the defensive in the wake of the overnight decline in the US Treasury bond yields, lending some support to the non-yielding yellow metal amid absent relevant economic data.
Technical Analysis: Gold price bulls need to wait for a breakout through the 50-day SMA support-turned-resistance
From a technical perspective, bulls need to wait for a sustained strength beyond the 50-day Simple Moving Average (SMA) support breakpoint-turned-resistance, currently pegged near the $2,344-2,345 region, before placing fresh bets. The subsequent move up has the potential to lift the Gold price beyond the $2,360-2,362 supply zone, towards the $2,387-2,388 intermediate hurdle en route to the $2,400 mark. A sustained strength beyond the latter will negate any near-term negative outlook and allow the XAU/USD to aim back to retest the all-time peak, around the $2,450 area touched in May.
On the flip side, the $2,300 mark might continue to protect the immediate downside ahead of the $2,285 horizontal support. A convincing break below the latter should pave the way for the resumption of the recent pullback from the record high and drag the Gold price towards the next relevant support near the $2,254-2,253 region. The downward trajectory could extend further towards the $2,225-2,220 support before the commodity eventually drops to the $2,200 round-figure mark.
Gold FAQs
Gold has played a key role in human’s history as it has been widely used as a store of value and medium of exchange. Currently, apart from its shine and usage for jewelry, the precious metal is widely seen as a safe-haven asset, meaning that it is considered a good investment during turbulent times. Gold is also widely seen as a hedge against inflation and against depreciating currencies as it doesn’t rely on any specific issuer or government.
Central banks are the biggest Gold holders. In their aim to support their currencies in turbulent times, central banks tend to diversify their reserves and buy Gold to improve the perceived strength of the economy and the currency. High Gold reserves can be a source of trust for a country’s solvency. Central banks added 1,136 tonnes of Gold worth around $70 billion to their reserves in 2022, according to data from the World Gold Council. This is the highest yearly purchase since records began. Central banks from emerging economies such as China, India and Turkey are quickly increasing their Gold reserves.
Gold has an inverse correlation with the US Dollar and US Treasuries, which are both major reserve and safe-haven assets. When the Dollar depreciates, Gold tends to rise, enabling investors and central banks to diversify their assets in turbulent times. Gold is also inversely correlated with risk assets. A rally in the stock market tends to weaken Gold price, while sell-offs in riskier markets tend to favor the precious metal.
The price can move due to a wide range of factors. Geopolitical instability or fears of a deep recession can quickly make Gold price escalate due to its safe-haven status. As a yield-less asset, Gold tends to rise with lower interest rates, while higher cost of money usually weighs down on the yellow metal. Still, most moves depend on how the US Dollar (USD) behaves as the asset is priced in dollars (XAU/USD). A strong Dollar tends to keep the price of Gold controlled, whereas a weaker Dollar is likely to push Gold prices up.
- Australian Dollar (AUD) trades on a stronger note on Wednesday amid the weaker US Dollar.
- The hawkish messages from the RBA and weaker-than-expected US Retail Sales data support the pair.
- US markets are closed for Juneteenth; US S&P Global PMI reports will be in the spotlight on Friday.
The Australian Dollar (AUD) gains momentum on Wednesday, backed by the hawkish hold by the Reserve Bank of Australia (RBA) at its June meeting. The markets have pushed back RBA rate cut expectations and see the start of the easing cycle in 2025, which continues to boost the Aussie. Furthermore, weaker-than-expected Retail Sales prompted the case for US Federal Reserve (Fed) rate cuts later this year, which undermine the Greenback across the board.
The US markets will be closed on Wednesday due to Juneteenth National Independence Day. Investors will focus on the US S&P Global Manufacturing and Services PMI reports at the end of the week. Any signs of expanding US business activity could lift the US Dollar (USD) and cap the upside for the pair.
Daily Digest Market Movers: Australian Dollar extends upside due to RBA’s hawkish hold and weaker US data
- The Reserve Bank of Australia (RBA) held the Official Cash Rate (OCR) steady at 4.35% for the fifth meeting in a row at its June meeting. It marks the longest on-hold period since May 2022, when the rate hike cycle began.
- The RBA board noted in a statement that "the economic outlook remains uncertain and recent data have demonstrated that the process of returning inflation to target is unlikely to be smooth.”
- It would be some time yet before inflation is sustainably in the target range and the recent data had reinforced the need to remain vigilant to upside risks to inflation, according to a statement.
- The US Retail Sales increased 0.1% MoM in May following the 0.2% decline in April, missing the estimation for an increase of 0.2%, the Commerce Department reported Tuesday.
- Boston Fed President Susan Collins stated on Tuesday that there are possibilities of one or two interest rate cuts from the Fed later this year, but the central bank must be patient amid volatile readings on inflation, per Reuters.
- Richmond Fed President Thomas Barkin said on Tuesday that he needs to parse several more months of economic data before considering cutting the interest rate.
Technical Analysis: AUD/USD maintains a positive stance within symmetrical triangle pattern
The Australian Dollar trades firmer on the day. The AUD/USD pair has formed a symmetical triangle pattern since May 8. The bullish outlook prevails as the pair stays beyond the key 100-day Exponential Moving Average (EMA) on the daily chart. The upward momentum is also supported by the 14-day Relative Strength Index (RSI), which holds in bullish territory around 54.0.
A decisive break above the upper boundary of the symmetrical descending triangle of 0.6670 will see a rally to 0.6700, the psychological level and a high of May 17. The additional upside filter to watch is 0.6760, a high of January 4.
On the downside, the crucial support level for the pair will emerge near the confluence of the 100-day EMA and the lower limit of triangle patterns at the 0.6590-0.6600 regions. Any follow-through selling will see a drop to 0.6510, a low of March 22, followed by 0.6465, a low of May 1.
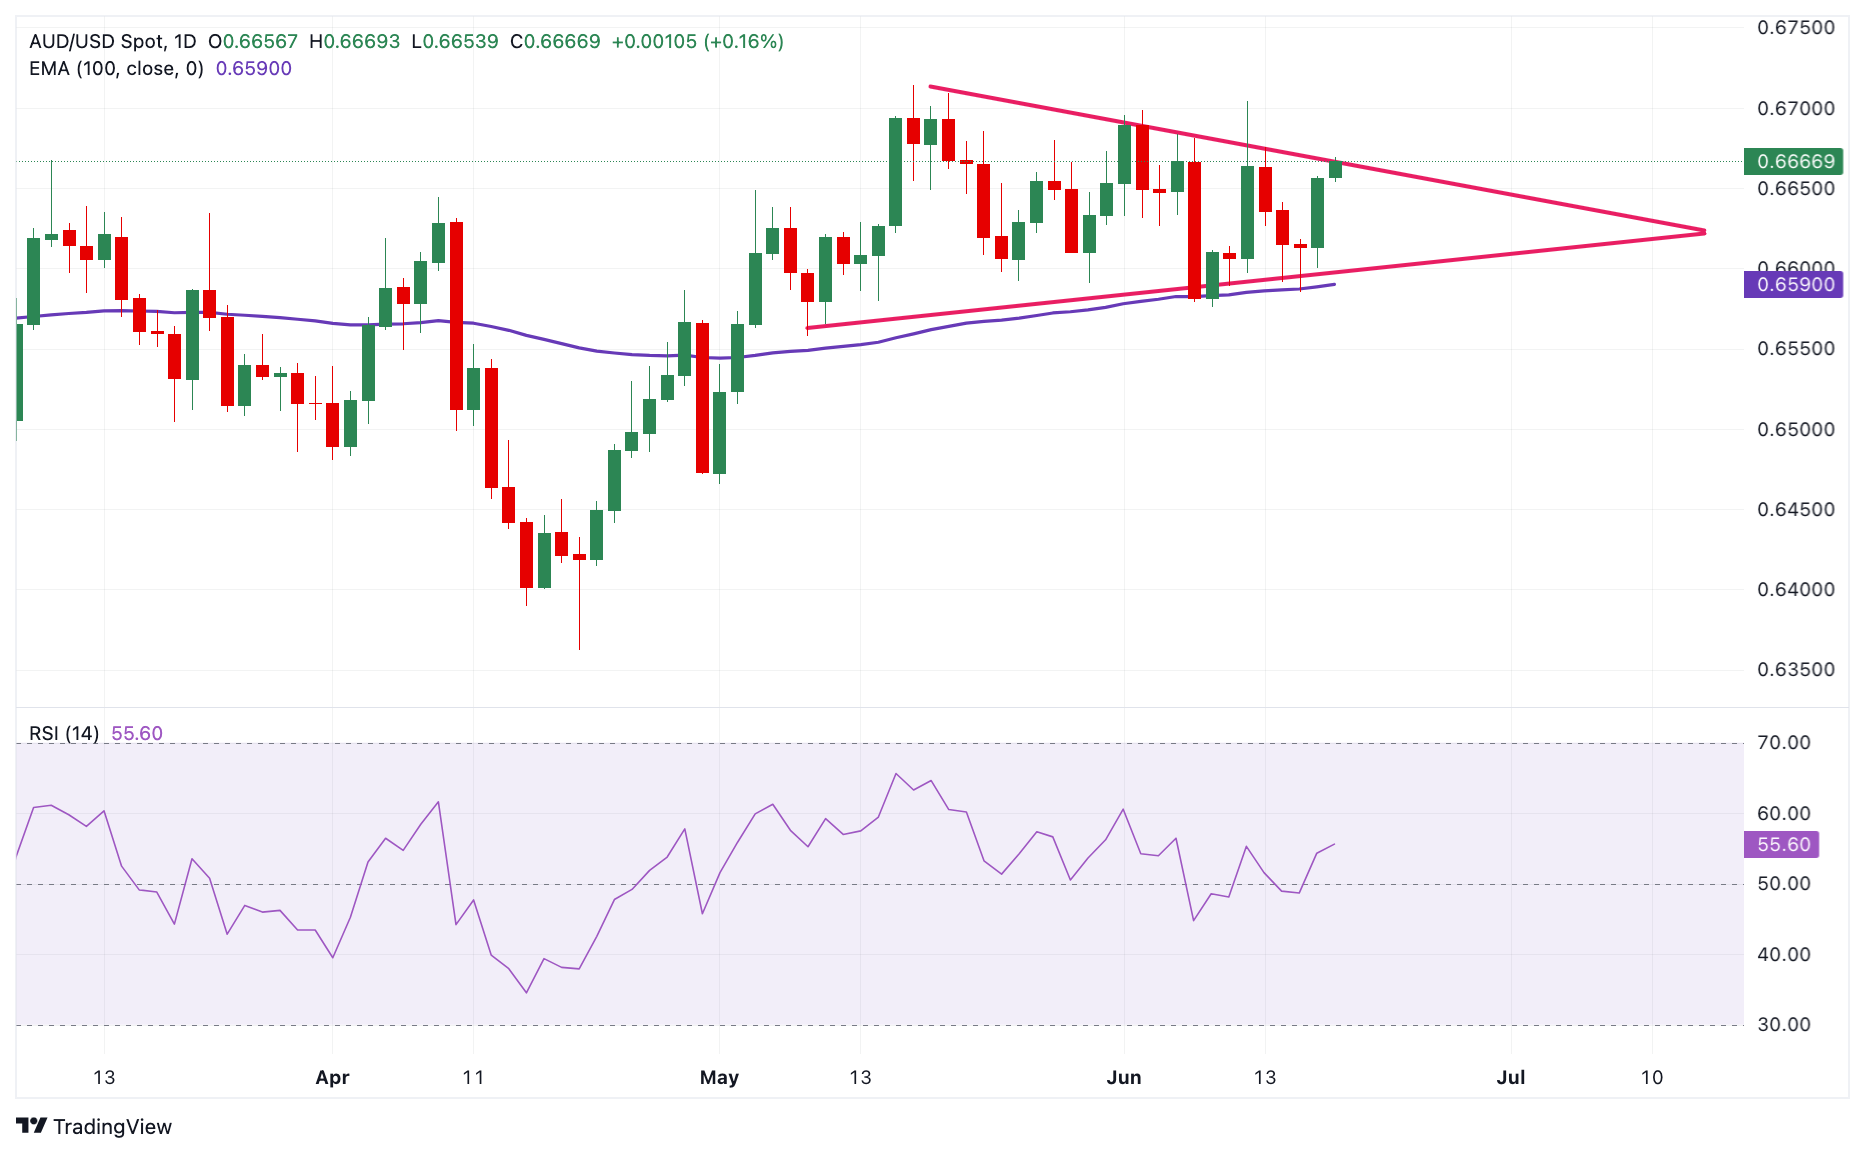
Australian Dollar price today
The table below shows the percentage change of Australian Dollar (AUD) against listed major currencies today. Australian Dollar was the strongest against the New Zealand Dollar.
| USD | EUR | GBP | CAD | AUD | JPY | NZD | CHF | |
| USD | 0.02% | -0.02% | -0.03% | -0.08% | 0.00% | 0.08% | 0.00% | |
| EUR | -0.01% | -0.03% | -0.03% | -0.08% | -0.01% | 0.07% | -0.01% | |
| GBP | 0.03% | 0.03% | 0.01% | -0.06% | 0.02% | 0.10% | 0.01% | |
| CAD | 0.01% | 0.03% | -0.01% | -0.06% | 0.01% | 0.10% | 0.01% | |
| AUD | 0.08% | 0.09% | 0.05% | 0.05% | 0.08% | 0.16% | 0.07% | |
| JPY | 0.00% | 0.02% | -0.03% | -0.02% | -0.08% | 0.08% | 0.00% | |
| NZD | -0.08% | -0.07% | -0.10% | -0.12% | -0.16% | -0.09% | -0.08% | |
| CHF | 0.01% | 0.02% | -0.02% | -0.01% | -0.07% | 0.00% | 0.09% |
The heat map shows percentage changes of major currencies against each other. The base currency is picked from the left column, while the quote currency is picked from the top row. For example, if you pick the Euro from the left column and move along the horizontal line to the Japanese Yen, the percentage change displayed in the box will represent EUR (base)/JPY (quote).
Australian Dollar FAQs
One of the most significant factors for the Australian Dollar (AUD) is the level of interest rates set by the Reserve Bank of Australia (RBA). Because Australia is a resource-rich country another key driver is the price of its biggest export, Iron Ore. The health of the Chinese economy, its largest trading partner, is a factor, as well as inflation in Australia, its growth rate and Trade Balance. Market sentiment – whether investors are taking on more risky assets (risk-on) or seeking safe-havens (risk-off) – is also a factor, with risk-on positive for AUD.
The Reserve Bank of Australia (RBA) influences the Australian Dollar (AUD) by setting the level of interest rates that Australian banks can lend to each other. This influences the level of interest rates in the economy as a whole. The main goal of the RBA is to maintain a stable inflation rate of 2-3% by adjusting interest rates up or down. Relatively high interest rates compared to other major central banks support the AUD, and the opposite for relatively low. The RBA can also use quantitative easing and tightening to influence credit conditions, with the former AUD-negative and the latter AUD-positive.
China is Australia’s largest trading partner so the health of the Chinese economy is a major influence on the value of the Australian Dollar (AUD). When the Chinese economy is doing well it purchases more raw materials, goods and services from Australia, lifting demand for the AUD, and pushing up its value. The opposite is the case when the Chinese economy is not growing as fast as expected. Positive or negative surprises in Chinese growth data, therefore, often have a direct impact on the Australian Dollar and its pairs.
Iron Ore is Australia’s largest export, accounting for $118 billion a year according to data from 2021, with China as its primary destination. The price of Iron Ore, therefore, can be a driver of the Australian Dollar. Generally, if the price of Iron Ore rises, AUD also goes up, as aggregate demand for the currency increases. The opposite is the case if the price of Iron Ore falls. Higher Iron Ore prices also tend to result in a greater likelihood of a positive Trade Balance for Australia, which is also positive of the AUD.
The Trade Balance, which is the difference between what a country earns from its exports versus what it pays for its imports, is another factor that can influence the value of the Australian Dollar. If Australia produces highly sought after exports, then its currency will gain in value purely from the surplus demand created from foreign buyers seeking to purchase its exports versus what it spends to purchase imports. Therefore, a positive net Trade Balance strengthens the AUD, with the opposite effect if the Trade Balance is negative.
| Raw materials | Closed | Change, % |
|---|---|---|
| Silver | 29.53 | 0.17 |
| Gold | 2329.26 | 0.39 |
| Palladium | 888.82 | -0.16 |
- The UK Office for National Statistics will publish the May CPI report on Wednesday.
- UK inflation is expected to cool down, falling back to the BoE´s target.
- The Bank of England will announce its decision on monetary policy on Thursday.
- The Pound Sterling is expected to post a wild reaction to inflation data.
The United Kingdom’s (UK) Office for National Statistics (ONS) will release the May Consumer Price Index (CPI) report on Wednesday at 06:00 GMT. At the same time, the ONS will publish the Producer Price Index (PPI) figures for the same period.
Inflation in the United Kingdom remains above the Bank of England’s (BoE) 2% target. According to the latest data, the UK CPI grew by 2.3% year-over-year (YoY), while core annual inflation posted 3.9% in April. Market participants expect the CPI to have risen 2% YoY in May, matching the BoE’s goal for the first time in roughly three years.
What to expect from the May UK inflation report?
Financial markets anticipate the UK headline CPI rose 2% YoY, while the core annual reading is foreseen at 3.5%. Those figures would be an improvement from April readings, when the CPI rose 2.3%, while the core reading, excluding volatile food and energy prices, hit 3.9%.
However, May monthly inflation is seen up 0.4%, following the 0.3% posted in the previous month. It may not be a really worrisome outcome, yet markets may be discouraged by an uptick in price pressures, even if it’s this low.
The BoE´s Monetary Policy Committee (MPC) left interest rates unchanged at a multi-year high of 5.25% when it met in May, although two out of the nine voting members preferred to trim rates by 25 basis points (bps).
"We are not yet at a point where we can cut the base rate," BoE Governor Andrew Bailed said, although policymakers acknowledged the steady decline in inflation. The central bank economic projections released alongside the May meeting showed consumer inflation is projected to approach the 2% target in the near term but could edge up later in the year due to the unwinding of energy-related base effects. Policymakers also remarked that service sector inflation remained at 6.0% as of March, more than doubling the BoE’s goal.
Would a 2% print be enough to trigger a rate cut as soon as this week? That seems tough but not impossible. Market players may pay attention to headline figures, but policymakers will rather focus on service inflation. A sharp drop in the latest, alongside headline readings in line with expectations, will definitely lift the odds of an interest rate cut in June. Before the inflation-data release, however, market participants believe the BoE will keep rates on hold for one more time.
When will the UK Consumer Price Index report be released and how could it affect GBP/USD?
The UK will publish CPI and PPI data on Wednesday at 06:00 GMT. The Pound Sterling (GBP) is trading below the 1.2700 mark against the US Dollar (USD), with the latter maintaining a firmer tone ever since the United States (US) reported price pressures kept easing in May. The US Federal Reserve (Fed) kept rates unchanged regardless and announced it may deliver one or two rate cuts before year-end.
For a change, the Fed did not deliver ahead of its major counterparts, as the Bank of Canada (BoC) and the European Central Bank (ECB) have already trimmed rates. That means the BoE may proceed with more confidence once inflation falls into policymakers’ comfort zone.
With that in mind, the figures released on Wednesday could trigger some wild price action around GBP crosses. Generally speaking, higher-than-anticipated readings should signal a steady BoE and, hence, underpin the Pound.
Should inflation-related figures come in below the market expectations, speculative interest will rush to price in a rate cut as soon as this week and put pressure on GBP. Bear in mind market players may opt to remain pat ahead of the BoE’s announcement 24 hours later.
Valeria Bednarik, Chief Analyst at FXStreet, says: “The GBP/USD pair has held around the 1.2700 mark for five consecutive weeks, showing little sign of directional progress. It reached a peak at 1.2859 on June 12, while the bottom has been set in the 1.2660 price zone. Ahead of the announcement, GBP/USD loses strength and nears the lower end of the aforementioned range. Technically speaking, the case for a bearish extension has become firmer in the daily chart as the pair develops below a now flat 20 Simple Moving Average (SMA) while approaching a directionless 100 SMA, providing dynamic support at around 1.2640. Technical indicators, in the meantime, hold within negative levels, although with uneven strength, not enough to anticipate a directional movement.”
Bednarik adds: “If GBP/USD breaks below the 1.2640/50 area, the pair can quickly reach the 1.2600 mark en route to 1.2520. The upside seems more messy. Sellers have rejected advances around 1.2800, while the peak at 1.2859 is also relevant. A sharp rally could be expected on a breakout beyond the latter, but this is not likely until after the BoE’s announcement on monetary policy.
Economic Indicator
Consumer Price Index (YoY)
The United Kingdom (UK) Consumer Price Index (CPI), released by the Office for National Statistics on a monthly basis, is a measure of consumer price inflation – the rate at which the prices of goods and services bought by households rise or fall – produced to international standards. It is the inflation measure used in the government’s target. The YoY reading compares prices in the reference month to a year earlier. Generally, a high reading is seen as bullish for the Pound Sterling (GBP), while a low reading is seen as bearish.
Read more.Next release: Wed Jun 19, 2024 06:00
Frequency: Monthly
Consensus: 2%
Previous: 2.3%
Source: Office for National Statistics
The Bank of England is tasked with keeping inflation, as measured by the headline Consumer Price Index (CPI) at around 2%, giving the monthly release its importance. An increase in inflation implies a quicker and sooner increase of interest rates or the reduction of bond-buying by the BOE, which means squeezing the supply of pounds. Conversely, a drop in the pace of price rises indicates looser monetary policy. A higher-than-expected result tends to be GBP bullish.
Economic Indicator
Producer Price Index - Output (YoY) n.s.a
The Producer Price Index released by the National Statistics is a monthly measurement of the price changes of goods produced by UK manufacturers. Generally speaking, a price hike generates higher retail prices for consumers. Thus, a high reading is positive (or bullish) for the GBP, while a low reading is seen as negative (or bearish).
Read more.Next release: Wed Jun 19, 2024 06:00
Frequency: Monthly
Consensus: -
Previous: 1.1%
Source: Office for National Statistics
People's Bank of China (PBOC) Governor Pan Gongsheng is speaking at the 2024 Lujiazui Forum in Shanghai on Wednesday.
Pan said, “monetary policy will provide support for China's economic recovery.”
Additional comments
Will resolutely prevent exchange rate from overshooting.
Will make flexible use of deposit reserves and other measures.
It is difficult to maintain the overall credit growth rate above 10% as in the past.
Conditions for PBOC to trade treasury bonds in secondary market to inject base money have become gradually ripe.
At present, it is particularly important to pay attention to the risks of holding a large amount of long-term government bonds and maintain a normal upward sloping yield.
Will particularly focus on long-term treasury bond risk to keep normal upward yield curve.
It is necessary to study the inclusion of M1 statistics to better reflect the real situation of money supply.
Earlier on, China's securities regulator said that they “will make every effort to promote high-quality development of the capital market.”
Market reaction
AUD/USD posts moderate gains in Wednesday’s Asian trading, holding near 0.6665, as of writing.
Australian Dollar FAQs
One of the most significant factors for the Australian Dollar (AUD) is the level of interest rates set by the Reserve Bank of Australia (RBA). Because Australia is a resource-rich country another key driver is the price of its biggest export, Iron Ore. The health of the Chinese economy, its largest trading partner, is a factor, as well as inflation in Australia, its growth rate and Trade Balance. Market sentiment – whether investors are taking on more risky assets (risk-on) or seeking safe-havens (risk-off) – is also a factor, with risk-on positive for AUD.
The Reserve Bank of Australia (RBA) influences the Australian Dollar (AUD) by setting the level of interest rates that Australian banks can lend to each other. This influences the level of interest rates in the economy as a whole. The main goal of the RBA is to maintain a stable inflation rate of 2-3% by adjusting interest rates up or down. Relatively high interest rates compared to other major central banks support the AUD, and the opposite for relatively low. The RBA can also use quantitative easing and tightening to influence credit conditions, with the former AUD-negative and the latter AUD-positive.
China is Australia’s largest trading partner so the health of the Chinese economy is a major influence on the value of the Australian Dollar (AUD). When the Chinese economy is doing well it purchases more raw materials, goods and services from Australia, lifting demand for the AUD, and pushing up its value. The opposite is the case when the Chinese economy is not growing as fast as expected. Positive or negative surprises in Chinese growth data, therefore, often have a direct impact on the Australian Dollar and its pairs.
Iron Ore is Australia’s largest export, accounting for $118 billion a year according to data from 2021, with China as its primary destination. The price of Iron Ore, therefore, can be a driver of the Australian Dollar. Generally, if the price of Iron Ore rises, AUD also goes up, as aggregate demand for the currency increases. The opposite is the case if the price of Iron Ore falls. Higher Iron Ore prices also tend to result in a greater likelihood of a positive Trade Balance for Australia, which is also positive of the AUD.
The Trade Balance, which is the difference between what a country earns from its exports versus what it pays for its imports, is another factor that can influence the value of the Australian Dollar. If Australia produces highly sought after exports, then its currency will gain in value purely from the surplus demand created from foreign buyers seeking to purchase its exports versus what it spends to purchase imports. Therefore, a positive net Trade Balance strengthens the AUD, with the opposite effect if the Trade Balance is negative.
- Indian Rupee (INR) loses ground on Wednesday despite the weaker US Dollar.
- The ongoing India inflows might support the INR, while higher crude oil prices could limit its gains.
- The Indian HSBC PMI and US S&P Global PMI reports will be the highlights on Friday.
The Indian Rupee (INR) edges lower on Wednesday despite the softer Greenback. The local currency strengthened on Tuesday, supported by US Dollar (USD) sales by state-run banks and likely foreign inflows in Indian bonds and equities. Analysts expect India’s upcoming inclusion in the JPMorgan emerging market debt index could boost the Indian Rupee in the near term.
Additionally, the weaker-than-expected US Retail Sales report spurred the likelihood that the Federal Reserve (Fed) will start to cut interest rates in a few months, which might weigh on the Greenback. However, the rise of crude oil prices to two-month highs might also cap the upside of the INR as India is the third largest consumer of Oil behind the US and China.
The Indian and US economic docket will be empty on Wednesday. Investors await the Indian HSBC Manufacturing and Services PMI on Friday for fresh impetus, along with the Reserve Bank of India (RBI) Meeting Minutes. On the US front, the S&P Global PMI reports will be released at the end of the week.
Daily Digest Market Movers: Indian Rupee weakens despite the country’s positive economic outlook
- Indian Equity indices touched record highs on Tuesday, with the benchmark BSE Sensex ending at 77,301, up 308 points or 0.4%, while the Nifty50 closed at 23,558, up 92 points or 0.39%.
- The Indian Rupee may strengthen beyond 83.20 once inflows from India's inclusion in the JPMorgan emerging market debt index start later this month, said Sajal Gupta, head of forex and commodities at Nuvama Wealth Management's institutional desk.
- The US Retail Sales rose 0.1% MoM in May from a 0.2% decline in April, below the market expectation for an increase of 0.2%, the Commerce Department reported Tuesday.
- New York Fed President John Williams said on Tuesday that he expected interest rates to come down gradually as inflation eases.
- Boston Fed President Susan Collins stated that despite progress on inflation, price growth remained persistently over the Fed's 2% inflation objective, adding that it is still too early to say whether or not inflation is on course toward the target.
- Richmond Fed President Thomas Barkin said the recent data showed consumer prices did not rise at all from April to May, but the choppiness in data since last year means the policy path ahead is not clear.
Technical analysis: USD/INR remains constructive in the longer term
The Indian Rupee trades on a softer note on the day. According to the daily timeframe, the positive outlook of the USD/INR pair remains unchanged as the pair holds above the key 100-day Exponential Moving Average (EMA). However, the 14-day Relative Strength Index (RSI) returns bearish territory around 48.0, indicating that consolidation or further downside cannot be ruled out.
Extended losses below the 100-day EMA at 83.25 will see a drop to the 83.00 psychological level, followed by 82.78 (low of January 15).
On the upside, the first upside barrier for the pair is seen at 83.55 (high of June 18). Further north, the next hurdle will emerge at 83.72 (high of April 17) en route to 84.00 (round mark).
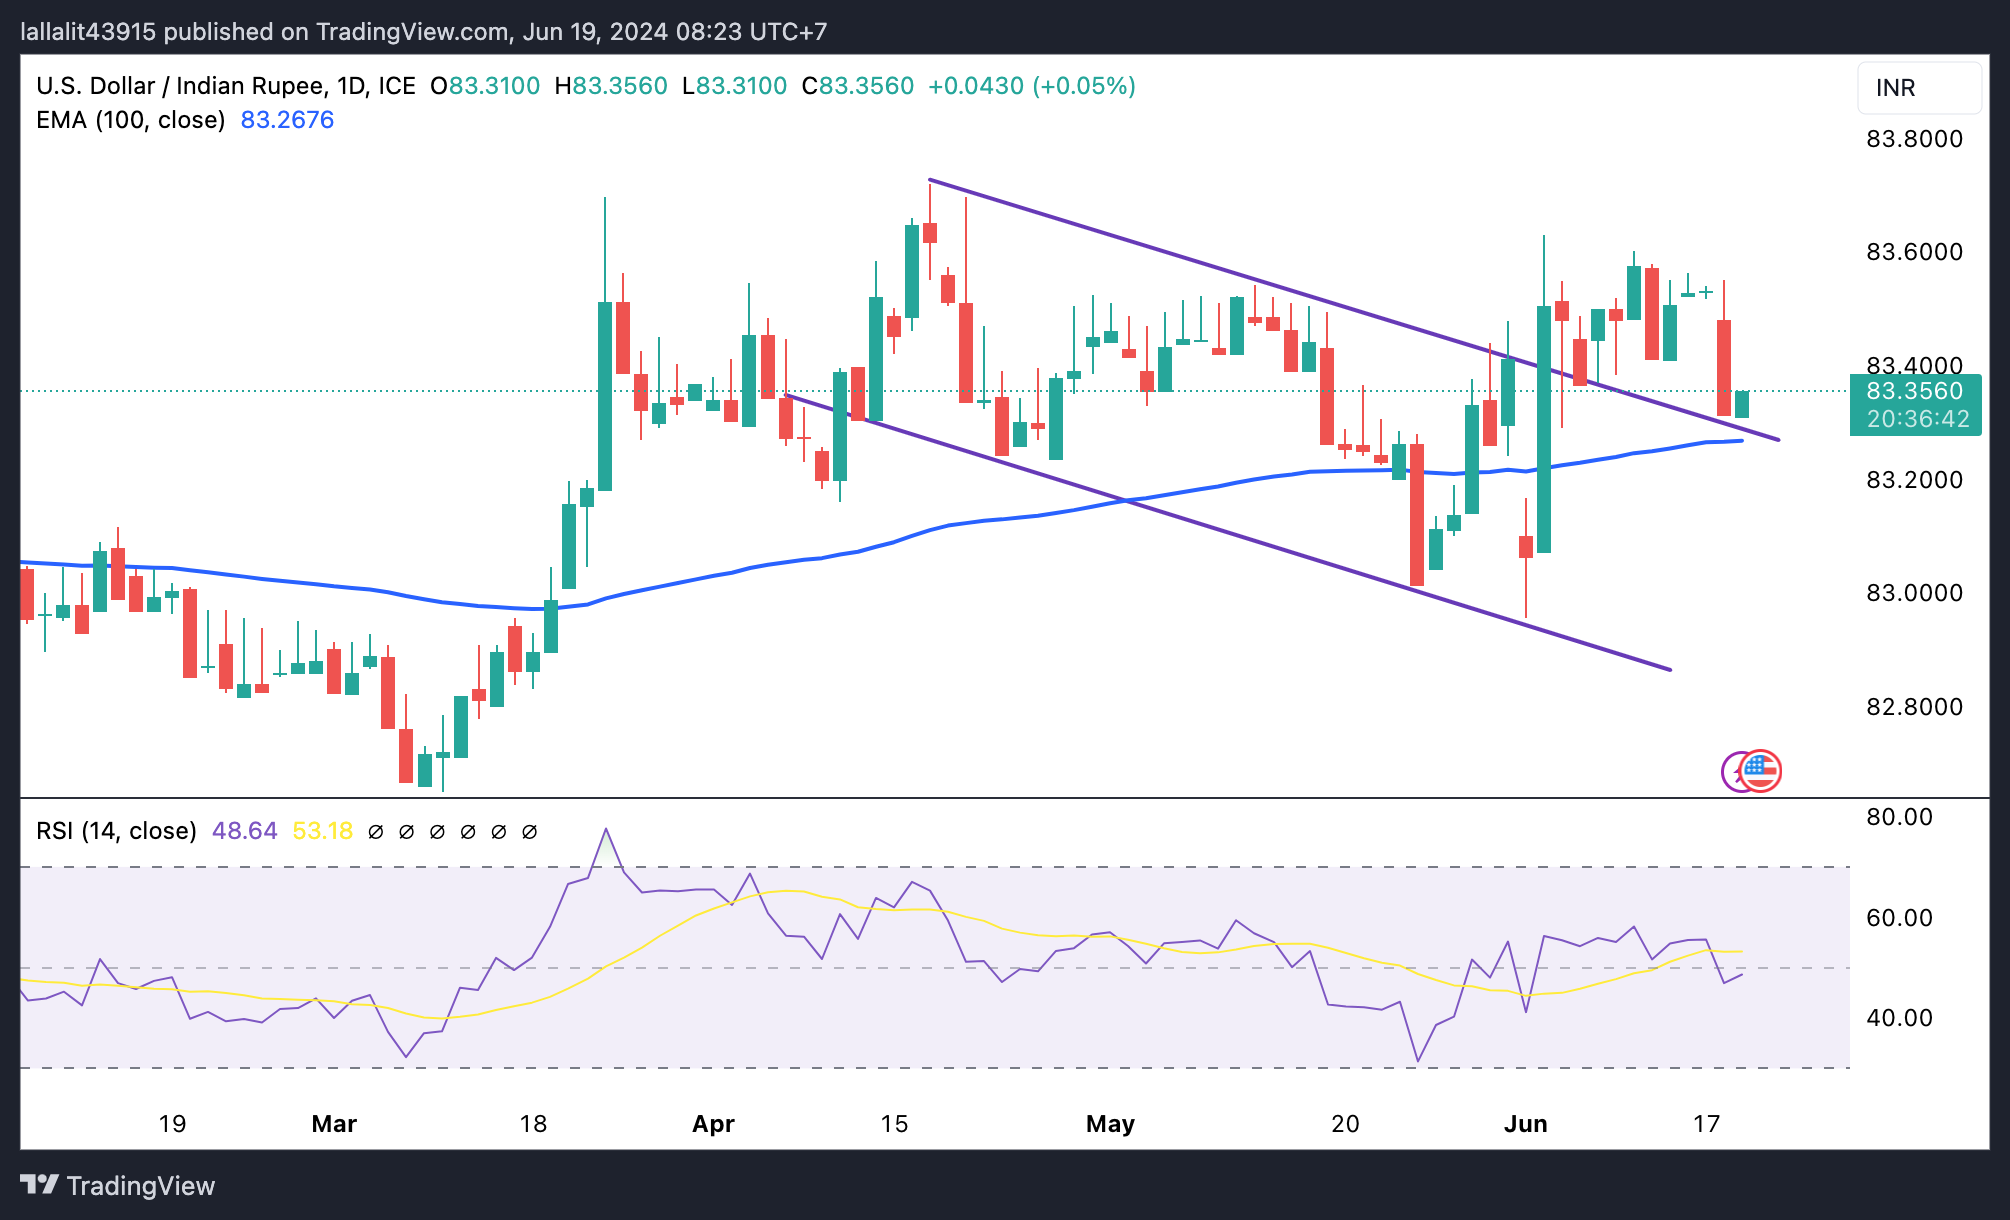
Indian Rupee FAQs
The Indian Rupee (INR) is one of the most sensitive currencies to external factors. The price of Crude Oil (the country is highly dependent on imported Oil), the value of the US Dollar – most trade is conducted in USD – and the level of foreign investment, are all influential. Direct intervention by the Reserve Bank of India (RBI) in FX markets to keep the exchange rate stable, as well as the level of interest rates set by the RBI, are further major influencing factors on the Rupee.
The Reserve Bank of India (RBI) actively intervenes in forex markets to maintain a stable exchange rate, to help facilitate trade. In addition, the RBI tries to maintain the inflation rate at its 4% target by adjusting interest rates. Higher interest rates usually strengthen the Rupee. This is due to the role of the ‘carry trade’ in which investors borrow in countries with lower interest rates so as to place their money in countries’ offering relatively higher interest rates and profit from the difference.
Macroeconomic factors that influence the value of the Rupee include inflation, interest rates, the economic growth rate (GDP), the balance of trade, and inflows from foreign investment. A higher growth rate can lead to more overseas investment, pushing up demand for the Rupee. A less negative balance of trade will eventually lead to a stronger Rupee. Higher interest rates, especially real rates (interest rates less inflation) are also positive for the Rupee. A risk-on environment can lead to greater inflows of Foreign Direct and Indirect Investment (FDI and FII), which also benefit the Rupee.
Higher inflation, particularly, if it is comparatively higher than India’s peers, is generally negative for the currency as it reflects devaluation through oversupply. Inflation also increases the cost of exports, leading to more Rupees being sold to purchase foreign imports, which is Rupee-negative. At the same time, higher inflation usually leads to the Reserve Bank of India (RBI) raising interest rates and this can be positive for the Rupee, due to increased demand from international investors. The opposite effect is true of lower inflation.
- GBP/USD remains confined in a narrow range on Wednesday ahead of the UK CPI.
- Tuesday’s softer US Retail Sales undermine the USD and lend support to the major.
- The subdued price action warrants caution before positioning for meaningful gains.
The GBP/USD pair struggles to gain any meaningful traction on Wednesday and oscillates in a narrow trading band, around the 1.2700 round-figure mark during the Asian session. Spot prices, meanwhile, hold above a one-month low touched last Friday as traders keenly await the release of the latest UK consumer inflation figures before positioning for the next leg of a directional move.
The headline UK CPI is expected to tick higher and come in at 0.4% in May versus the previous print of 0.3%, while the yearly rate is seen decelerating to 3.5% from 3.9% in April. The data will play a key role in influencing the British Pound (GBP) and provide some impetus to the GBP/USD pair. The market attention will then turn to the Bank of England (BoE) monetary policy meeting on Thursday, which will help determine the near-term trajectory for the currency pair.
Heading into the key data/central bank event risks, subdued US Dollar (USD) price action turns out to be a key factor acting as a tailwind for the GBP/USD pair. The softer-than-expected US Retail Sales report released on Tuesday pointed to signs of exhaustion among consumers and reaffirmed bets that the Federal Reserve (Fed) might start cutting interest rates in September. This led to the overnight decline in the US Treasury bond yields and is seen undermining the buck.
The aforementioned fundamental backdrop supports prospects for some meaningful appreciating move for the GBP/USD pair. That said, the lack of any follow-through buying warrants some caution before positioning for an extension of the recent bounce from the vicinity of mid-1.2600s, or a one-month low touched last Friday.
The People’s Bank of China (PBoC) set the USD/CNY central rate for the trading session ahead on Wednesday at 7.1159, as against the previous day's fix of 7.1148 and 7.2482 Reuters estimates.
- USD/JPY consolidates its recent gains to the highest level since late April.
- The BoJ April meeting minutes fail to provide any impetus to the major.
- Tuesday’s disappointing US data weigh on the USD and cap the upside.
The USD/JPY pair is seen oscillating in a narrow band during the Asian session on Wednesday and currently trading just below the 158.00 round-figure mark. Spot prices, meanwhile, move little following the release of the Bank of Japan (BoJ) April meeting minutes and remain well within the striking distance of the highest level since late April retested the previous day.
The minutes revealed that BoJ board members debated the risks associated with the impact of weak Japanese Yen (JPY) on the underlying inflation and flagged the chance of raising interest rates sooner than expected if inflation overshoots. This, however, does little to impress the JPY bulls or provide any meaningful impetus to the USD/JPY pair, though subdued US Dollar (USD) price action continues to act as a headwind for spot prices.
The USD Index (DXY), which tracks the Greenback against a basket of currencies, hangs near the weekly low touched in the aftermath of weaker US Retail Sales released on Tuesday. The data pointed to signs of exhaustion among US consumers, lifting bets for an imminent rate cut by the Federal Reserve (Fed) later this year. This led to the overnight decline in the US Treasury bond yields and keeps the USD bulls on the defensive.
Meanwhile, the Bank of Japan (BoJ) Governor Kazuo Ueda's hawkish remarks on Tuesday, saying that the central bank could raise rates in July depending on economic data, underpin the JPY. Apart from this, speculations that Japanese authorities might intervene to prop up the domestic currency further contribute to capping the USD/JPY pair. Hence, any subsequent move up might continue to attract some sellers and remain limited.
| Index | Change, points | Closed | Change, % |
|---|---|---|---|
| NIKKEI 225 | 379.67 | 38482.11 | 1 |
| Hang Seng | -20.57 | 17915.55 | -0.11 |
| KOSPI | 19.82 | 2763.92 | 0.72 |
| ASX 200 | 77.8 | 7778.1 | 1.01 |
| DAX | 63.76 | 18131.97 | 0.35 |
| CAC 40 | 57.23 | 7628.8 | 0.76 |
| Dow Jones | 56.76 | 38834.86 | 0.15 |
| S&P 500 | 13.8 | 5487.03 | 0.25 |
| NASDAQ Composite | 5.21 | 17862.23 | 0.03 |
| Pare | Closed | Change, % |
|---|---|---|
| AUDUSD | 0.66555 | 0.63 |
| EURJPY | 169.5 | 0.13 |
| EURUSD | 1.07398 | 0.05 |
| GBPJPY | 200.549 | 0.1 |
| GBPUSD | 1.27074 | 0.03 |
| NZDUSD | 0.61415 | 0.17 |
| USDCAD | 1.37151 | -0.04 |
| USDCHF | 0.88378 | -0.66 |
| USDJPY | 157.817 | 0.07 |
The Bank of Japan (BoJ) board members shared their views on monetary policy outlook on Wednesday, per the BoJ Minutes of the April meeting.
Key quotes
Member agreed consumption likely to increase moderately.
A few members said companies might become more active in raising prices, wages than initially expected.
Members discussed risks associated with impact of weak yen on inflation.
One member said impact of weak yen on inflation, wages may not prove temporary.
One member said weak yen could lead to overshoot in underlying inflation.
One member said the BOJ must scrutinise without any preset idea the chance firms may renew efforts to pass on rising import costs via price hikes.
Members shared view the BOJ must scrutinise how recent yen falls could affect underlying inflation.
One member said key to future monetary policy outlook would be capex, consumption.
One member said there were various upward risks to inflation.
A few members said fx is among key factors affecting economy, prices, boj must respond with monetary policy if outlook and risks change.
One member said the BOJ must respond with monetary policy if fx volatility affects firms' medium-, long-term inflation expectations.
One member said the BOJ must deepen debate on timing, degree of future interest rate hikes.
One member said the BOJ could raise rates moderately before it's sufficiently convinced about chance of durably hitting price goal, to avoid being forced to hike rates rapidly later.
One member said boj must raise rates at appropriate, timely manner to avoid causing stress on economy.
One member said there is sufficient chance pace of policy normalisation could accelerate if underlying inflation continues to overshoot due in part to weak yen.
Market reaction to the BoJ Minutes
At the time of writing, USD/JPY was down 0.02% on the day at 157.83.
Bank of Japan FAQs
The Bank of Japan (BoJ) is the Japanese central bank, which sets monetary policy in the country. Its mandate is to issue banknotes and carry out currency and monetary control to ensure price stability, which means an inflation target of around 2%.
The Bank of Japan has embarked in an ultra-loose monetary policy since 2013 in order to stimulate the economy and fuel inflation amid a low-inflationary environment. The bank’s policy is based on Quantitative and Qualitative Easing (QQE), or printing notes to buy assets such as government or corporate bonds to provide liquidity. In 2016, the bank doubled down on its strategy and further loosened policy by first introducing negative interest rates and then directly controlling the yield of its 10-year government bonds.
The Bank’s massive stimulus has caused the Yen to depreciate against its main currency peers. This process has exacerbated more recently due to an increasing policy divergence between the Bank of Japan and other main central banks, which have opted to increase interest rates sharply to fight decades-high levels of inflation. The BoJ’s policy of holding down rates has led to a widening differential with other currencies, dragging down the value of the Yen.
A weaker Yen and the spike in global energy prices have led to an increase in Japanese inflation, which has exceeded the BoJ’s 2% target. Still, the Bank judges that the sustainable and stable achievement of the 2% target has not yet come in sight, so any sudden change in the current policy looks unlikely.


© 2000-2026. Sva prava zaštićena.
Sajt je vlasništvo kompanije Teletrade D.J. LLC 2351 LLC 2022 (Euro House, Richmond Hill Road, Kingstown, VC0100, St. Vincent and the Grenadines).
Svi podaci koji se nalaze na sajtu ne predstavljaju osnovu za donošenje investicionih odluka, već su informativnog karaktera.
The company does not serve or provide services to customers who are residents of the US, Canada, Iran, The Democratic People's Republic of Korea, Yemen and FATF blacklisted countries.
Izvršenje trgovinskih operacija sa finansijskim instrumentima upotrebom marginalne trgovine pruža velike mogućnosti i omogućava investitorima ostvarivanje visokih prihoda. Međutim, takav vid trgovine povezan je sa potencijalno visokim nivoom rizika od gubitka sredstava. Проведение торговых операций на финанcовых рынках c маржинальными финанcовыми инcтрументами открывает широкие возможноcти, и позволяет инвеcторам, готовым пойти на риcк, получать выcокую прибыль, но при этом неcет в cебе потенциально выcокий уровень риcка получения убытков. Iz tog razloga je pre započinjanja trgovine potrebno odlučiti o izboru odgovarajuće investicione strategije, uzimajući u obzir raspoložive resurse.
Upotreba informacija: U slučaju potpunog ili delimičnog preuzimanja i daljeg korišćenja materijala koji se nalazi na sajtu, potrebno je navesti link odgovarajuće stranice na sajtu kompanije TeleTrade-a kao izvora informacija. Upotreba materijala na internetu mora biti praćena hiper linkom do web stranice teletrade.org. Automatski uvoz materijala i informacija sa stranice je zabranjen.
Ako imate bilo kakvih pitanja, obratite nam se pr@teletrade.global.
транcфери