- Analiza
- Novosti i instrumenti
- Vesti sa tržišta
Forex-novosti i prognoze od 17-09-2024
Israel said on Tuesday that halting Hezbollah’s attacks in the country’s north to allow thousands of residents to go back to their homes is now an official war goal, as it considers a wider military operation in Lebanon that could ignite an all-out conflict, according to the AP News.
Israeli leaders have often vowed to take more military action to halt the near-daily strikes, which started shortly after the outbreak of the nearly yearlong Israel-Hamas war in Gaza. Israel carried out many airstrikes on Lebanon, targeting and killing prominent Hezbollah leaders.
Market reaction
At the time of press, Gold price was up 0.19% on the day at $2,575.
Risk sentiment FAQs
In the world of financial jargon the two widely used terms “risk-on” and “risk off'' refer to the level of risk that investors are willing to stomach during the period referenced. In a “risk-on” market, investors are optimistic about the future and more willing to buy risky assets. In a “risk-off” market investors start to ‘play it safe’ because they are worried about the future, and therefore buy less risky assets that are more certain of bringing a return, even if it is relatively modest.
Typically, during periods of “risk-on”, stock markets will rise, most commodities – except Gold – will also gain in value, since they benefit from a positive growth outlook. The currencies of nations that are heavy commodity exporters strengthen because of increased demand, and Cryptocurrencies rise. In a “risk-off” market, Bonds go up – especially major government Bonds – Gold shines, and safe-haven currencies such as the Japanese Yen, Swiss Franc and US Dollar all benefit.
The Australian Dollar (AUD), the Canadian Dollar (CAD), the New Zealand Dollar (NZD) and minor FX like the Ruble (RUB) and the South African Rand (ZAR), all tend to rise in markets that are “risk-on”. This is because the economies of these currencies are heavily reliant on commodity exports for growth, and commodities tend to rise in price during risk-on periods. This is because investors foresee greater demand for raw materials in the future due to heightened economic activity.
The major currencies that tend to rise during periods of “risk-off” are the US Dollar (USD), the Japanese Yen (JPY) and the Swiss Franc (CHF). The US Dollar, because it is the world’s reserve currency, and because in times of crisis investors buy US government debt, which is seen as safe because the largest economy in the world is unlikely to default. The Yen, from increased demand for Japanese government bonds, because a high proportion are held by domestic investors who are unlikely to dump them – even in a crisis. The Swiss Franc, because strict Swiss banking laws offer investors enhanced capital protection.
Bank of Canada (BoC) Senior Deputy Governor Carolyn Rogers said on Wednesday that she still sees work to do on inflation, but the core Consumer Price Index (CPI) measures should decrease.
Key quotes
Sees ongoing work to do on inflation.
Core measures of CPI should decline.
Market reaction
At the time of press, the USD/CAD pair was down 0.03% on the day at 1.3593.
Bank of Canada FAQs
The Bank of Canada (BoC), based in Ottawa, is the institution that sets interest rates and manages monetary policy for Canada. It does so at eight scheduled meetings a year and ad hoc emergency meetings that are held as required. The BoC primary mandate is to maintain price stability, which means keeping inflation at between 1-3%. Its main tool for achieving this is by raising or lowering interest rates. Relatively high interest rates will usually result in a stronger Canadian Dollar (CAD) and vice versa. Other tools used include quantitative easing and tightening.
In extreme situations, the Bank of Canada can enact a policy tool called Quantitative Easing. QE is the process by which the BoC prints Canadian Dollars for the purpose of buying assets – usually government or corporate bonds – from financial institutions. QE usually results in a weaker CAD. QE is a last resort when simply lowering interest rates is unlikely to achieve the objective of price stability. The Bank of Canada used the measure during the Great Financial Crisis of 2009-11 when credit froze after banks lost faith in each other’s ability to repay debts.
Quantitative tightening (QT) is the reverse of QE. It is undertaken after QE when an economic recovery is underway and inflation starts rising. Whilst in QE the Bank of Canada purchases government and corporate bonds from financial institutions to provide them with liquidity, in QT the BoC stops buying more assets, and stops reinvesting the principal maturing on the bonds it already holds. It is usually positive (or bullish) for the Canadian Dollar.
- EUR/USD flattened just below 1.1150 on Tuesday.
- Markets are pulling into the midrange ahead of the Fed’s Wednesday rate call.
- Markets are still split on the depth of an initial Fed rate cut.
EUR/USD halted a near-term bullish recovery on Tuesday, easing off of bullish pressure and chalking in an indecision pattern just above 1.1100 as Fiber traders buckle down for the wait to Wednesday’s appearance from the Federal Reserve (Fed).
It’s a low-tier showing on the European side of the economic calendar this week, leaving traders to spin their tires ahead of the Fed’s hotly-anticipated midweek rate trim.
Forex Today: What if the Fed…?
US Retail Sales figures in August helped to keep market Fed expectations anchored, rising 0.1% compared to the median forecast of a -0.2% contraction. July’s Retail Sales figure was also revised higher to 1.1%, though core Retail Sales (excluding automotive purchases) only rose 0.1% compared to the 0.2% forecast.
The only meaningful event remaining on the data docket this week is the Fed’s upcoming rate call on Wednesday. Markets have been angling for a reduction in the Fed funds rate since the beginning of the year when investors were clamoring for a March cut. According to the CME’s FedWatch Tool, rate markets are still split on the depth of the Fed’s first expected rate trim since early 2020, with rate traders pricing in 60% odds of a 50 bps double cut to kick off the Fed’s next rate cutting cycle. The remaining 40% of rate cut expectations are stacked on a more reasonable 25 bps.
EUR/USD price forecast
Tuesday snapped a near-term recovery in the Fiber, and long-term bulls remain notably skittish on the chart. Price action is still mired in a technical trap after tumbling back from one-year highs in late August, and top-side momentum remains tepid despite a bullish bounce from the 1.1000 handle last week.
EUR/USD daily chart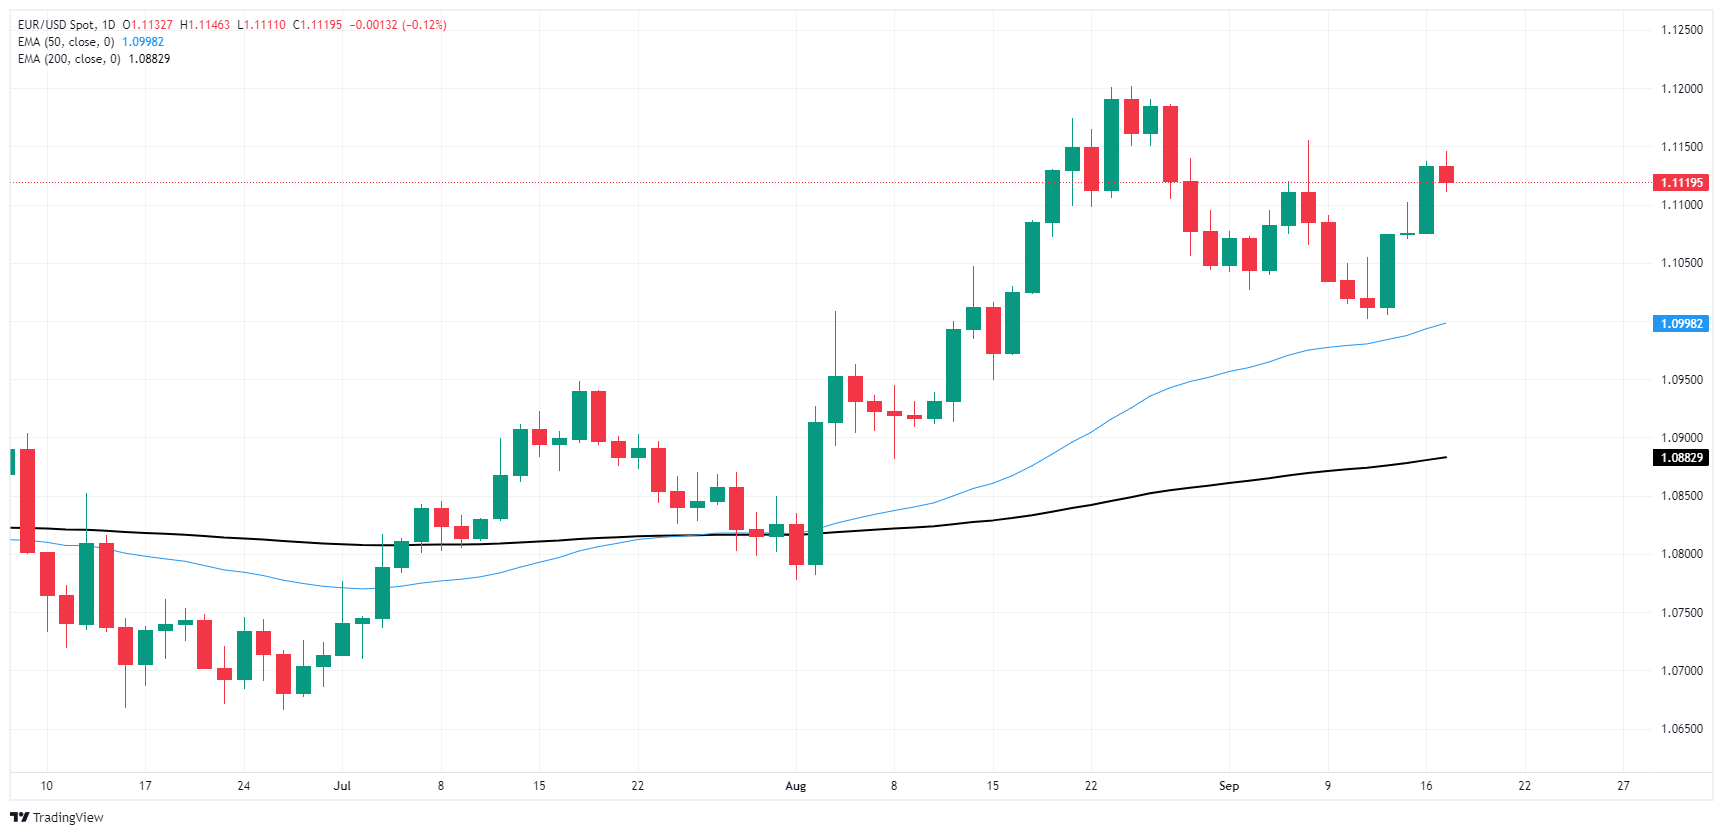
Euro FAQs
The Euro is the currency for the 20 European Union countries that belong to the Eurozone. It is the second most heavily traded currency in the world behind the US Dollar. In 2022, it accounted for 31% of all foreign exchange transactions, with an average daily turnover of over $2.2 trillion a day. EUR/USD is the most heavily traded currency pair in the world, accounting for an estimated 30% off all transactions, followed by EUR/JPY (4%), EUR/GBP (3%) and EUR/AUD (2%).
The European Central Bank (ECB) in Frankfurt, Germany, is the reserve bank for the Eurozone. The ECB sets interest rates and manages monetary policy. The ECB’s primary mandate is to maintain price stability, which means either controlling inflation or stimulating growth. Its primary tool is the raising or lowering of interest rates. Relatively high interest rates – or the expectation of higher rates – will usually benefit the Euro and vice versa. The ECB Governing Council makes monetary policy decisions at meetings held eight times a year. Decisions are made by heads of the Eurozone national banks and six permanent members, including the President of the ECB, Christine Lagarde.
Eurozone inflation data, measured by the Harmonized Index of Consumer Prices (HICP), is an important econometric for the Euro. If inflation rises more than expected, especially if above the ECB’s 2% target, it obliges the ECB to raise interest rates to bring it back under control. Relatively high interest rates compared to its counterparts will usually benefit the Euro, as it makes the region more attractive as a place for global investors to park their money.
Data releases gauge the health of the economy and can impact on the Euro. Indicators such as GDP, Manufacturing and Services PMIs, employment, and consumer sentiment surveys can all influence the direction of the single currency. A strong economy is good for the Euro. Not only does it attract more foreign investment but it may encourage the ECB to put up interest rates, which will directly strengthen the Euro. Otherwise, if economic data is weak, the Euro is likely to fall. Economic data for the four largest economies in the euro area (Germany, France, Italy and Spain) are especially significant, as they account for 75% of the Eurozone’s economy.
Another significant data release for the Euro is the Trade Balance. This indicator measures the difference between what a country earns from its exports and what it spends on imports over a given period. If a country produces highly sought after exports then its currency will gain in value purely from the extra demand created from foreign buyers seeking to purchase these goods. Therefore, a positive net Trade Balance strengthens a currency and vice versa for a negative balance.
European Central Bank (ECB) Governing Council member François Villeroy de Galhau said on Wednesday that the French goal to cut the deficit to 3% of GDP by 2027 is not realistic.
Key quotes
Most of the effort on deficits should come from spending reductions but targeted tax hikes are needed too.
It would be better to take 5 years to get to 3%, which would remain in line with EU rules.
Sees 2025 GDP growth of 1.2%, unchanged from prior.
Sees 2026 GDP growth of 1.5% vs 1.6% prior.
Still sees 2024 HICP inflation at 2.5%.
Sees 2025 HICP inflation at 1.5% vs 1.7%.
Market reaction
At the time of press, the EUR/USD pair was up 0.04% on the day at 1.1118.
ECB FAQs
The European Central Bank (ECB) in Frankfurt, Germany, is the reserve bank for the Eurozone. The ECB sets interest rates and manages monetary policy for the region. The ECB primary mandate is to maintain price stability, which means keeping inflation at around 2%. Its primary tool for achieving this is by raising or lowering interest rates. Relatively high interest rates will usually result in a stronger Euro and vice versa. The ECB Governing Council makes monetary policy decisions at meetings held eight times a year. Decisions are made by heads of the Eurozone national banks and six permanent members, including the President of the ECB, Christine Lagarde.
In extreme situations, the European Central Bank can enact a policy tool called Quantitative Easing. QE is the process by which the ECB prints Euros and uses them to buy assets – usually government or corporate bonds – from banks and other financial institutions. QE usually results in a weaker Euro. QE is a last resort when simply lowering interest rates is unlikely to achieve the objective of price stability. The ECB used it during the Great Financial Crisis in 2009-11, in 2015 when inflation remained stubbornly low, as well as during the covid pandemic.
Quantitative tightening (QT) is the reverse of QE. It is undertaken after QE when an economic recovery is underway and inflation starts rising. Whilst in QE the European Central Bank (ECB) purchases government and corporate bonds from financial institutions to provide them with liquidity, in QT the ECB stops buying more bonds, and stops reinvesting the principal maturing on the bonds it already holds. It is usually positive (or bullish) for the Euro.
- USD/CAD strengthens around 1.3600 in Wednesday’s early Asian session.
- Traders are pricing in nearly 60% odds of a 50 bps Fed rate cut.
- Canadian CPI rose 2.0% YoY in August vs. 2.5% prior, softer than expected.
The USD/CAD pair trades in positive territory for a fourth consecutive day near 1.3600 during the early Asian session on Wednesday. The US Dollar (USD) gains ground after the better-than-expected Retail Sales data. Traders brace for the Federal Reserve (Fed) interest rate decision on Wednesday, which is widely anticipated to lower its interest rate for the first time in more than four years.
Data released by the Commerce Department on Tuesday showed that US Retail Sales unexpectedly rose 0.1% MoM in August versus 1.1% prior. This figure was above the market consensus of -0.2% and suggested a sign of resilience among US households. Meanwhile, Industrial Production came in better than the estimation, climbing 0.8% MoM in August, compared to a decline of 0.6% in the previous reading.
However, the August Retail Sales and Industrial Production reports did not convince the Fed officials much about the size of the rate cut at its September meeting. According to the CME Fedwatch Tool, Fed funds futures have priced in a nearly 63% chance of a 50 basis points (bps) rate cut, up from 30% a week ago, while the odds of a 25 bps cut were at 37%. The jumbo Fed rate cut could further undermine the USD against its rivals.
The Canadian Consumer Price Index (CPI) hit the 2% target in August as inflation continued a downward trajectory. The country’s CPI rose 2.0% YoY in August, compared to 2.5% in July, softer than the 2.1% expected, Statistics Canada showed Tuesday. On a monthly basis, the CPI figure was -0.2% in August versus 0.4% prior.
The rising speculation that the Bank of Canada (BoC) will cut additional interest rates weighs on the Canadian Dollar (CAD) and acts as a tailwind for USD/CAD. Money markets are fully pricing in 25 bps rate cuts at each of the last two monetary policy meetings this year. Meanwhile, expectations of a 50 bps cut in the October meeting rose to 47.5% from 46% before the CPI data.
Canadian Dollar FAQs
The key factors driving the Canadian Dollar (CAD) are the level of interest rates set by the Bank of Canada (BoC), the price of Oil, Canada’s largest export, the health of its economy, inflation and the Trade Balance, which is the difference between the value of Canada’s exports versus its imports. Other factors include market sentiment – whether investors are taking on more risky assets (risk-on) or seeking safe-havens (risk-off) – with risk-on being CAD-positive. As its largest trading partner, the health of the US economy is also a key factor influencing the Canadian Dollar.
The Bank of Canada (BoC) has a significant influence on the Canadian Dollar by setting the level of interest rates that banks can lend to one another. This influences the level of interest rates for everyone. The main goal of the BoC is to maintain inflation at 1-3% by adjusting interest rates up or down. Relatively higher interest rates tend to be positive for the CAD. The Bank of Canada can also use quantitative easing and tightening to influence credit conditions, with the former CAD-negative and the latter CAD-positive.
The price of Oil is a key factor impacting the value of the Canadian Dollar. Petroleum is Canada’s biggest export, so Oil price tends to have an immediate impact on the CAD value. Generally, if Oil price rises CAD also goes up, as aggregate demand for the currency increases. The opposite is the case if the price of Oil falls. Higher Oil prices also tend to result in a greater likelihood of a positive Trade Balance, which is also supportive of the CAD.
While inflation had always traditionally been thought of as a negative factor for a currency since it lowers the value of money, the opposite has actually been the case in modern times with the relaxation of cross-border capital controls. Higher inflation tends to lead central banks to put up interest rates which attracts more capital inflows from global investors seeking a lucrative place to keep their money. This increases demand for the local currency, which in Canada’s case is the Canadian Dollar.
Macroeconomic data releases gauge the health of the economy and can have an impact on the Canadian Dollar. Indicators such as GDP, Manufacturing and Services PMIs, employment, and consumer sentiment surveys can all influence the direction of the CAD. A strong economy is good for the Canadian Dollar. Not only does it attract more foreign investment but it may encourage the Bank of Canada to put up interest rates, leading to a stronger currency. If economic data is weak, however, the CAD is likely to fall.
- GBP/USD eased back on Tuesday as markets brace for Fed appearance.
- UK CPI inflation data due early Wednesday, but unlikely to spark meaningful momentum.
- Markets are in a toss-up on Fed rate cut forecast.
GBP/USD pared back on Thursday, declining back toward 1.3150 as investors buckle down for the wait to Wednesday’s broadly-antiicpated rate cut from the Federal Reserve (Fed), where the US central bank is expected to kick off a rate cutting cycle.
UK CPI inflation figures are due early Wednesday, but the non-preliminary inflation print is unlikely to generate significant momentum with the figures all but fully priced in. Final UK CPI inflation figures for August are expected to print at 0.3% MoM compared to the previous -0.2% contraction, while the annualized CPI print is forecast to come in at 3.5% YoY, up from the previous 3.3%.
Forex Today: What if the Fed…?
US Retail Sales figures in August helped to keep market Fed expectations anchored, rising 0.1% compared to the median forecast of a -0.2% contraction. July’s Retail Sales figure was also revised higher to 1.1%, though core Retail Sales (excluding automotive purchases) only rose 0.1% compared to the 0.2% forecast.
The only meaningful event remaining on the data docket this week is the Fed’s upcoming rate call on Wednesday. Markets have been angling for a reduction in the fed funds rate since the beginning of the year when investors were clamoring for a March cut. According to the CME’s FedWatch Tool, rate markets are still split on the depth of the Fed’s first expected rate trim since early 2020, with rate traders pricing in 60% odds of a 50 bps double cut to kick off the Fed’s next rate cutting cycle. The remaining 40% of rate cut expectations are stacked on a more reasonable 25 bps.
GBP/USD price forecast
Cable’s 0.6% surge to kick off the trading week has fizzled on Tuesday, with daily candlesticks continuing to grind back into the high side, with multi-year highs sitting just north of 1.3250.
Despite an overall bullish tilt, GBP/USD price action is running the risk of getting caught in a bull trap, with the pair having run hot in a 1.66% technical recovery from the last swing low into the 1.3000 handle.
GBP/USD daily chart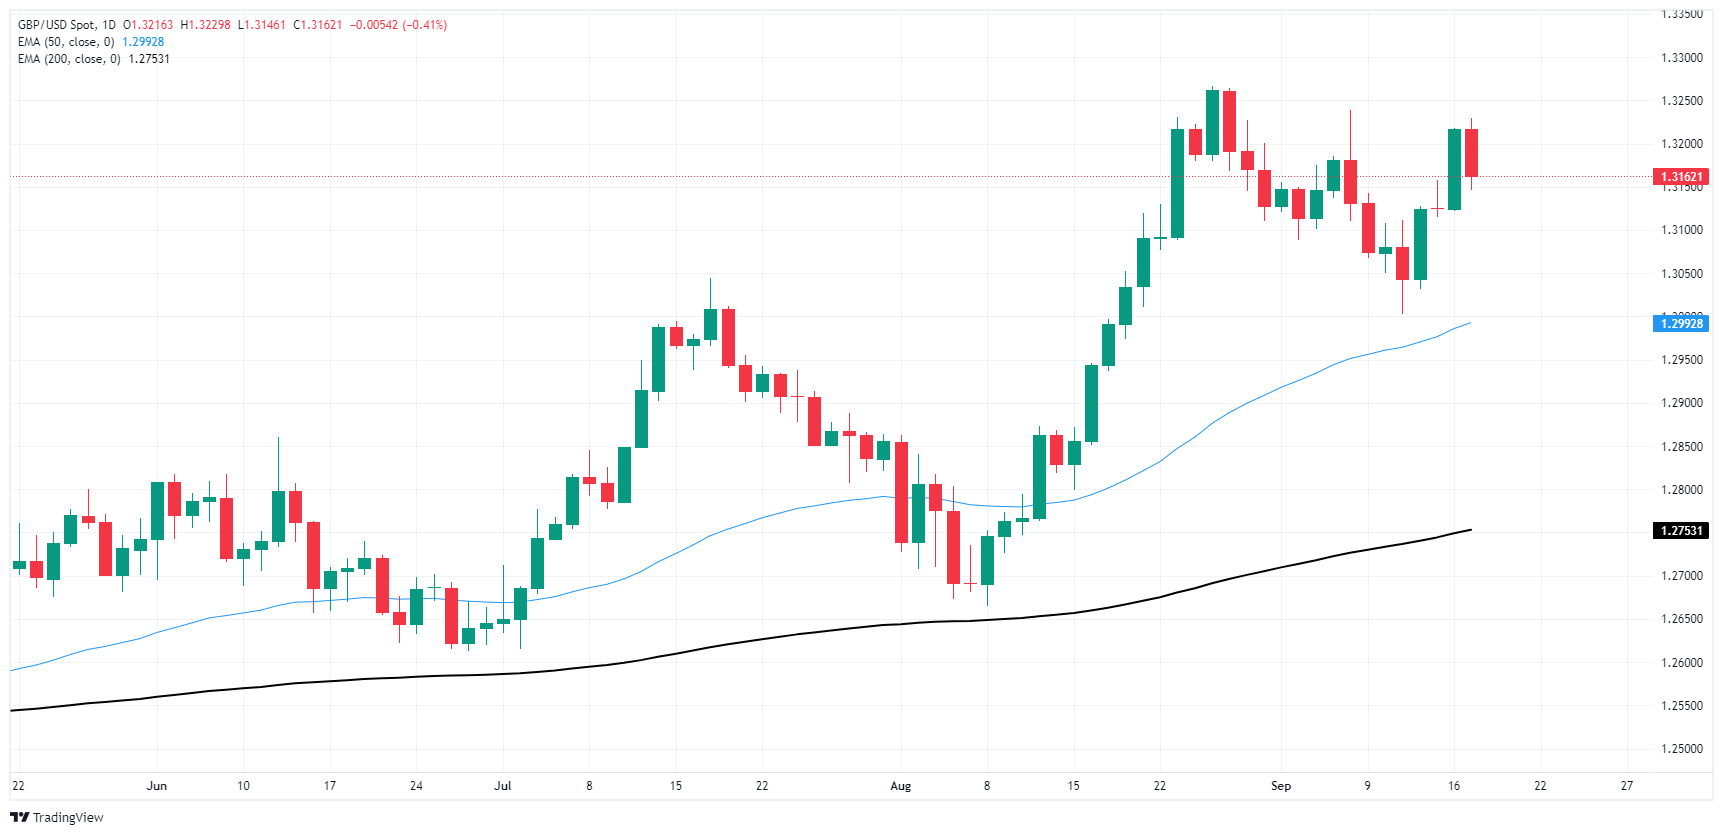
Pound Sterling FAQs
The Pound Sterling (GBP) is the oldest currency in the world (886 AD) and the official currency of the United Kingdom. It is the fourth most traded unit for foreign exchange (FX) in the world, accounting for 12% of all transactions, averaging $630 billion a day, according to 2022 data. Its key trading pairs are GBP/USD, aka ‘Cable’, which accounts for 11% of FX, GBP/JPY, or the ‘Dragon’ as it is known by traders (3%), and EUR/GBP (2%). The Pound Sterling is issued by the Bank of England (BoE).
The single most important factor influencing the value of the Pound Sterling is monetary policy decided by the Bank of England. The BoE bases its decisions on whether it has achieved its primary goal of “price stability” – a steady inflation rate of around 2%. Its primary tool for achieving this is the adjustment of interest rates. When inflation is too high, the BoE will try to rein it in by raising interest rates, making it more expensive for people and businesses to access credit. This is generally positive for GBP, as higher interest rates make the UK a more attractive place for global investors to park their money. When inflation falls too low it is a sign economic growth is slowing. In this scenario, the BoE will consider lowering interest rates to cheapen credit so businesses will borrow more to invest in growth-generating projects.
Data releases gauge the health of the economy and can impact the value of the Pound Sterling. Indicators such as GDP, Manufacturing and Services PMIs, and employment can all influence the direction of the GBP. A strong economy is good for Sterling. Not only does it attract more foreign investment but it may encourage the BoE to put up interest rates, which will directly strengthen GBP. Otherwise, if economic data is weak, the Pound Sterling is likely to fall.
Another significant data release for the Pound Sterling is the Trade Balance. This indicator measures the difference between what a country earns from its exports and what it spends on imports over a given period. If a country produces highly sought-after exports, its currency will benefit purely from the extra demand created from foreign buyers seeking to purchase these goods. Therefore, a positive net Trade Balance strengthens a currency and vice versa for a negative balance.
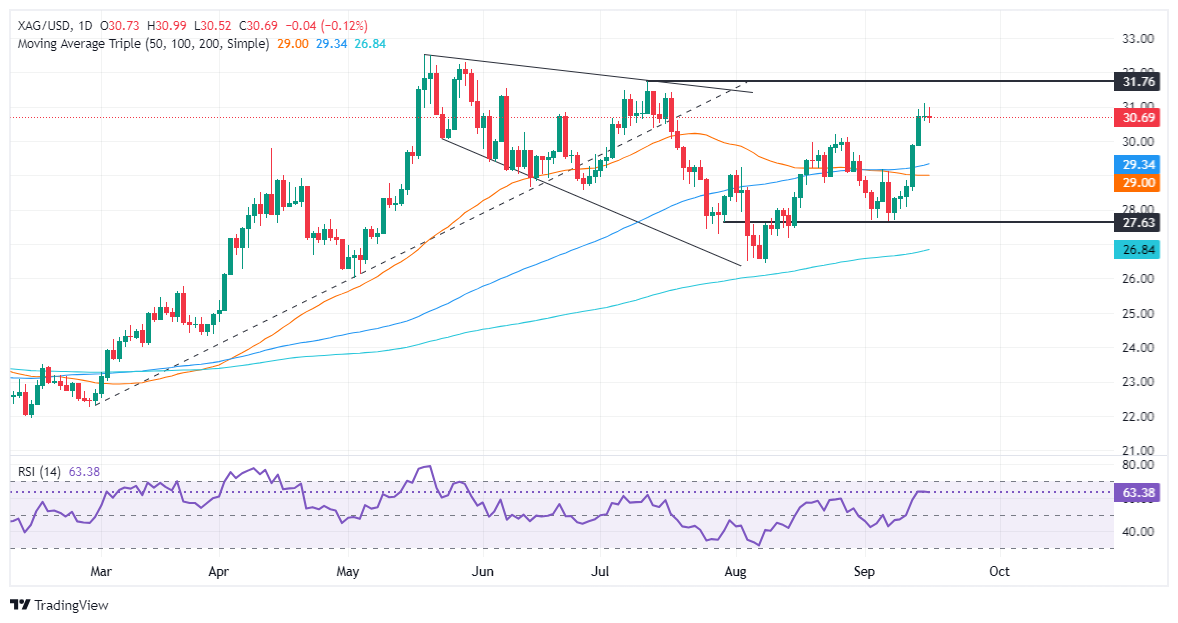
- Silver is range-bound, amid bullish momentum, but flattening RSI signals indecision.
- A break above $31.09 could see Silver testing $31.75 and the YTD high at $32.51.
- On the downside, $30.52 is first support, followed by $29.86, with additional levels at the 100-DMA ($29.36) and 50-DMA ($28.98).
Silver price consolidates for the second straight day, prints back-to-back doji’s a sign that neither buyers nor sellers control the grey’s metal price action. At the time of writing, XAG/USD trades at $30.69, virtually unchanged, as the Wednesday Asian session commences.
XAG/USD Price Forecast: Technical outlook
Silver has been subdued during the last few days as traders brace for the Fed’s decision.
Momentum remains bullish, as portrayed by the Relative Strength Index (RSI), but its slope turned flat, hitting indecision amongst investors.
If XAG/USD clears the current week’s high of $31.09, this could underpin Siver’s to challenge the July 11 high at $31.75 ahead of the year-to-date (YTD) high of $32.51. On the other hand, if Silver drops below the September 17 daily low of $30.52, it would expose the September 13 low of $29.86, followed by the 100-day moving average (DMA) at $29.36, followed by the 50-DMA at $28.98.
XAG/USD Price Action – Daily Chart
Silver FAQs
Silver is a precious metal highly traded among investors. It has been historically used as a store of value and a medium of exchange. Although less popular than Gold, traders may turn to Silver to diversify their investment portfolio, for its intrinsic value or as a potential hedge during high-inflation periods. Investors can buy physical Silver, in coins or in bars, or trade it through vehicles such as Exchange Traded Funds, which track its price on international markets.
Silver prices can move due to a wide range of factors. Geopolitical instability or fears of a deep recession can make Silver price escalate due to its safe-haven status, although to a lesser extent than Gold's. As a yieldless asset, Silver tends to rise with lower interest rates. Its moves also depend on how the US Dollar (USD) behaves as the asset is priced in dollars (XAG/USD). A strong Dollar tends to keep the price of Silver at bay, whereas a weaker Dollar is likely to propel prices up. Other factors such as investment demand, mining supply – Silver is much more abundant than Gold – and recycling rates can also affect prices.
Silver is widely used in industry, particularly in sectors such as electronics or solar energy, as it has one of the highest electric conductivity of all metals – more than Copper and Gold. A surge in demand can increase prices, while a decline tends to lower them. Dynamics in the US, Chinese and Indian economies can also contribute to price swings: for the US and particularly China, their big industrial sectors use Silver in various processes; in India, consumers’ demand for the precious metal for jewellery also plays a key role in setting prices.
Silver prices tend to follow Gold's moves. When Gold prices rise, Silver typically follows suit, as their status as safe-haven assets is similar. The Gold/Silver ratio, which shows the number of ounces of Silver needed to equal the value of one ounce of Gold, may help to determine the relative valuation between both metals. Some investors may consider a high ratio as an indicator that Silver is undervalued, or Gold is overvalued. On the contrary, a low ratio might suggest that Gold is undervalued relative to Silver.
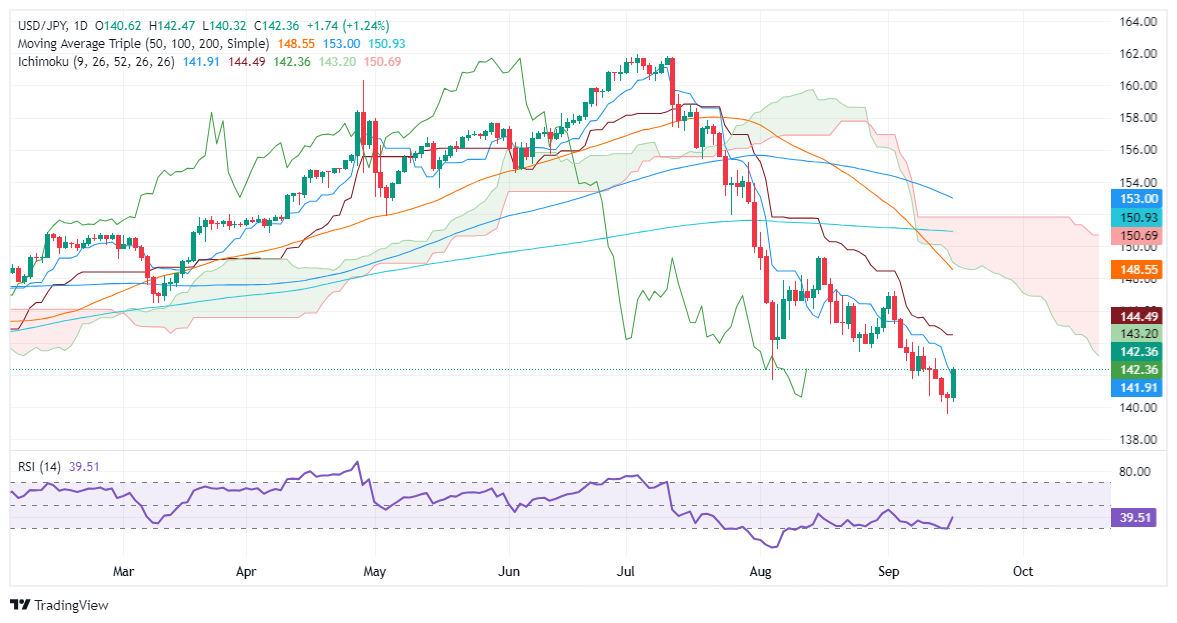
- USD/JPY climbs over 180 pips, testing key resistance at 142.35 (Tenkan-Sen).
- A break above 143.04 could target resistance at 143.15 (Senkou Span A) and 144.48 (Kijun-Sen).
- A drop below 142.00 could see the pair resume its downtrend, with support at 139.58 (YTD low) and 139.00.
The USD/JPY skyrocketed late in the North American session, trading at 142.44, up by over 1% after bouncing off a daily low of 140.32. Solid US data added to investors' uncertainty about the size of a Federal Reserve rate cut as they eyed its monetary policy decision on Wednesday. Therefore, traders shorting the US Dollar trimmed their positions, as seen as price action in the USD/JPY pair.
USD/JPY Price Forecast: Technical outlook
From a technical perspective, the USD/JPY is still downward biased despite rising over 180 pips to test the Tenkan-Sen at 142.35. The Relative Strength Index (RSI) remains bearishly biased, though aimed up, but has turned flat as Wednesday’s Asian session looms.
If USD/JPY climbs above the September 12 daily high of 143.04, this could pave the way for a leg-up, exposing key resistance levels: the Senkou Span A at 143.15, followed by the Kijun-Sen at 144.48.
However, if USD/JPY drops below 142.00, it will exacerbate a resumption of the downtrend. The following support would be the year-to-date (YTD) low of 139.58, followed by the 139.00 mark.
USD/JPY Price Action – Daily Chart
Japanese Yen FAQs
The Japanese Yen (JPY) is one of the world’s most traded currencies. Its value is broadly determined by the performance of the Japanese economy, but more specifically by the Bank of Japan’s policy, the differential between Japanese and US bond yields, or risk sentiment among traders, among other factors.
One of the Bank of Japan’s mandates is currency control, so its moves are key for the Yen. The BoJ has directly intervened in currency markets sometimes, generally to lower the value of the Yen, although it refrains from doing it often due to political concerns of its main trading partners. The current BoJ ultra-loose monetary policy, based on massive stimulus to the economy, has caused the Yen to depreciate against its main currency peers. This process has exacerbated more recently due to an increasing policy divergence between the Bank of Japan and other main central banks, which have opted to increase interest rates sharply to fight decades-high levels of inflation.
The BoJ’s stance of sticking to ultra-loose monetary policy has led to a widening policy divergence with other central banks, particularly with the US Federal Reserve. This supports a widening of the differential between the 10-year US and Japanese bonds, which favors the US Dollar against the Japanese Yen.
The Japanese Yen is often seen as a safe-haven investment. This means that in times of market stress, investors are more likely to put their money in the Japanese currency due to its supposed reliability and stability. Turbulent times are likely to strengthen the Yen’s value against other currencies seen as more risky to invest in.
- The NZD/JPY pair's latest price action shows a reversal of last week's losses with the pair extending gains from Tuesday’s session.
- RSI is sharply rising, showing that buying pressure is recovering.
- Decreasing red bars in the MACD suggests that selling pressure is weakening.
In Tuesday's session, the NZD/JPY pair rose by 0.95% above 88.00. Considering the fresh gains and the latest technical outlook, a reversal of last week's losses is on the cards.
The Relative Strength Index (RSI) is currently at 45, which is still in negative area. However, the slope of the RSI is sharply rising, indicating that buying pressure is recovering. The Moving Average Convergence Divergence (MACD) is also red, but the histogram is decreasing, suggesting that selling pressure is declining. This mixed technical outlook suggests that the NZD/JPY pair may continue to consolidate in the short term after the latest sharp losses.
NZD/JPY daily chart
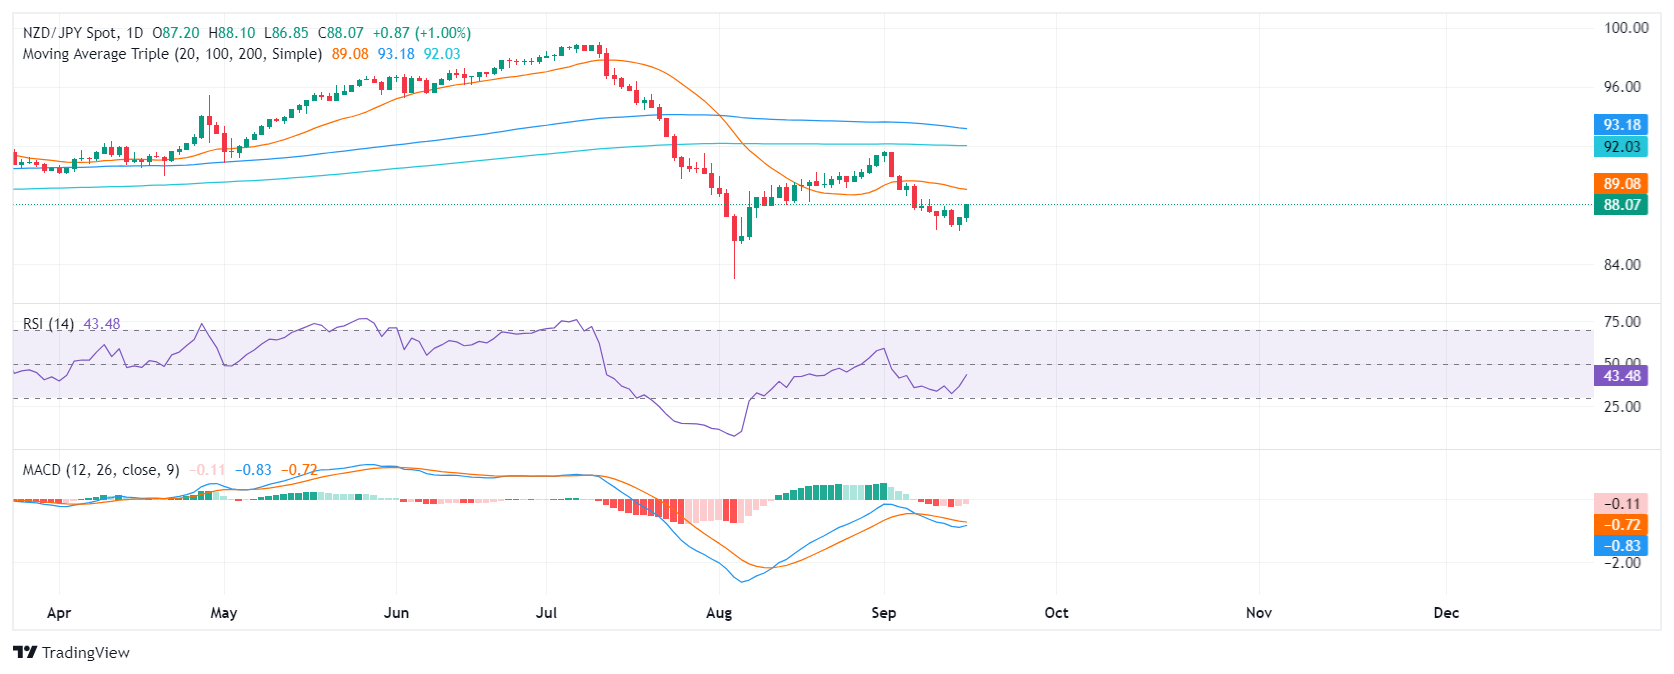
Supports to the downside are located at 86.50, 86.30, and 86.00, while resistances are seen at 87.50, 87.70, and 88.00. Traders should watch for a break above 88.50 or below 86.50 to confirm a breakout in either direction.
- AUD/USD regains ground ahead of FOMC, while the USD consolidates losses.
- Chinese data concerns weigh on the AUD.
- Hawkish RBA keeps the Aussie afloat on Tuesday.
The AUD/USD has regained ground in Tuesday's session and has attracted some follow-through buyers, climbing to a nearly two-week high of 0.6755. The Australian Dollar is feeling the effect of consolidating losses by the US Dollar, as well as concerns about economic data coming from China. Furthermore, a positive risk tone has undermined the USD, adding to the AUD/USD's gains.
Due to conflicting economic signals and the Reserve Bank of Australia's (RBA) strict stance on inflation, the market's expectations for interest rate cuts have been scaled back. Market watchers now anticipate only a modest 25-basis-point reduction in 2024, reflecting a more cautious outlook on the Australian economy.
On Tuesday, the US released Retail Sales data from August that didn’t impact the USD but did surpass expectations as the focus is set on Wednesday’s Fed decision.
Daily digest market movers: Australian Dollar steady ahead of Fed
- US Dollar consolidates recent losses on bets for a 50 bps rate cut by the Fed.
- RBA’s hawkish outlook supports the risk-sensitive Australian Dollar.
- Fundamental backdrop favors the AUD, but concerns about China's economic slowdown could act as a headwind.
- Soft Retail Sales data from the US had little market reaction though US data may be limited as focus remains on Fed interest rate decision come Wednesday.
- Fed is expected to cut interest rates by 25 bps, according to analysts, but a 50 bps cut remains more likely, according to CME FedWatch Tool.
- A smaller-than-expected rate cut could boost the US Dollar and weigh on the AUD.
- A dovish Fed stance could benefit the AUD, while a hawkish stance could bolster the USD.
AUD/USD technical outlook: Pair extends gains on US Dollar weakness
The AUD/USD pair extended gains for the second consecutive day, marking a week-long uptrend. Early during the European session, the Ausie reached its highest point in a week, hovering above the mid-0.6700s.
Indicators are promising, and if the pair holds above the 20-day Simple Moving Average (SMA), the outlook will turn positive.
Australian Dollar FAQs
One of the most significant factors for the Australian Dollar (AUD) is the level of interest rates set by the Reserve Bank of Australia (RBA). Because Australia is a resource-rich country another key driver is the price of its biggest export, Iron Ore. The health of the Chinese economy, its largest trading partner, is a factor, as well as inflation in Australia, its growth rate and Trade Balance. Market sentiment – whether investors are taking on more risky assets (risk-on) or seeking safe-havens (risk-off) – is also a factor, with risk-on positive for AUD.
The Reserve Bank of Australia (RBA) influences the Australian Dollar (AUD) by setting the level of interest rates that Australian banks can lend to each other. This influences the level of interest rates in the economy as a whole. The main goal of the RBA is to maintain a stable inflation rate of 2-3% by adjusting interest rates up or down. Relatively high interest rates compared to other major central banks support the AUD, and the opposite for relatively low. The RBA can also use quantitative easing and tightening to influence credit conditions, with the former AUD-negative and the latter AUD-positive.
China is Australia’s largest trading partner so the health of the Chinese economy is a major influence on the value of the Australian Dollar (AUD). When the Chinese economy is doing well it purchases more raw materials, goods and services from Australia, lifting demand for the AUD, and pushing up its value. The opposite is the case when the Chinese economy is not growing as fast as expected. Positive or negative surprises in Chinese growth data, therefore, often have a direct impact on the Australian Dollar and its pairs.
Iron Ore is Australia’s largest export, accounting for $118 billion a year according to data from 2021, with China as its primary destination. The price of Iron Ore, therefore, can be a driver of the Australian Dollar. Generally, if the price of Iron Ore rises, AUD also goes up, as aggregate demand for the currency increases. The opposite is the case if the price of Iron Ore falls. Higher Iron Ore prices also tend to result in a greater likelihood of a positive Trade Balance for Australia, which is also positive of the AUD.
The Trade Balance, which is the difference between what a country earns from its exports versus what it pays for its imports, is another factor that can influence the value of the Australian Dollar. If Australia produces highly sought after exports, then its currency will gain in value purely from the surplus demand created from foreign buyers seeking to purchase its exports versus what it spends to purchase imports. Therefore, a positive net Trade Balance strengthens the AUD, with the opposite effect if the Trade Balance is negative.
- Gold price rally stalls after strong US macroeconomic data.
- US Retail Sales exceed expectations, Industrial Production improved in August, boostinge US Dollar Index (DXY) to 100.92.
- Geopolitical tensions in the Middle East escalate with Hezbollah blaming Israel for recent blasts.
Gold prices fall ahead of the US Federal Reserve’s (Fed) monetary policy decision on Wednesday as the Greenback stages a recovery following a strong (relative to consensus) August US Retail Sales report. Therefore, US Treasury yields advanced, and the buck edged higher, a headwind for the golden metal.
The XAU/USD trades at $2,569, losing 0.50%. Expectations that the Fed will lower borrowing costs by 50 basis points (bps) remain at 63%, while odds for a 25 bps cut are 37%, according to CME FedWatch Tool data.
Data-wise, US Retail Sales were higher than expected, though they trailed July’s number, while Industrial Production improved in August.
TDS Senior Commodity Analyst Daniel Ghali noted that Gold’s last leg up “may have been a stop hunt, given the odd timing for an incursion into new all-time highs alongside evidence of new shorts being added by proprietary traders.”
At the time of writing, the US Dollar Index (DXY), which tracks the buck’s value against another six currencies, advanced 0.21% to 100.92, a headwind for Bullion prices. Meanwhile, US Treasury yields along the short and long ends of the curve rose.
Meanwhile, the Middle East conflict is at the risk of a possible escalation. Al-Jazeera reported that Lebanon’s Hezbollah blamed Israel for the spree of pager explosions, saying it will get “its fair punishment.”
US Department of State spokesperson Mathew Miller said the United States was not involved in the incident and did not know who was responsible.
Looking ahead, the US economic schedule will feature housing data ahead of the Fed's interest rate decision and Chair Jerome Powell's press conference on Wednesday.
Daily digest market movers: Gold price falls following US Retail Sales, Industrial Production reports
- US Retail Sales in August rose by 0.1% MoM, surpassing expectations of a -0.2% decline. Annually, Retail Sales grew by 2.1%, down from July's 2.9%.
- Industrial Production increased by 0.8% MoM in August, rebounding from a -0.9% contraction in the previous month.
- Data from the Chicago Board of Trade suggests the Federal Reserve is expected to cut at least 111 basis points this year, according to the fed funds rate futures contract for December 2024.
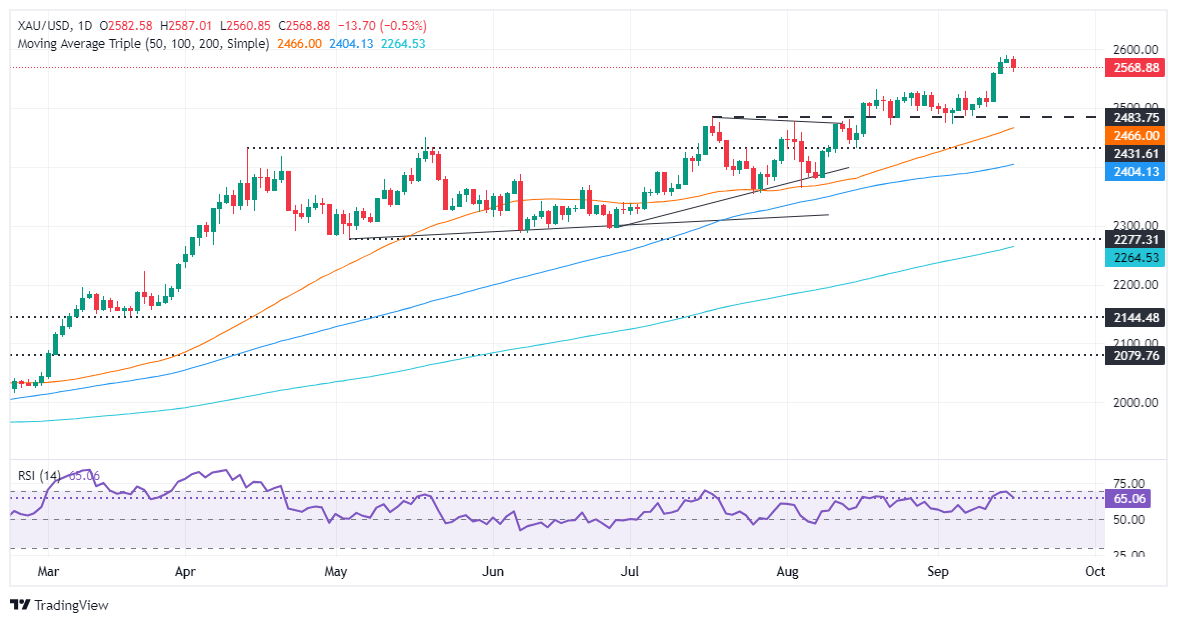
XAU/USD technical outlook: Gold price dips below $2,570
Gold prices remain upwardly biased despite retreating somewhat. The precious metal is about to form a three-candle ‘evening star’ — a bearish chart pattern. In the short term, momentum favors sellers as portrayed by the descending Relative Strength Index (RSI), breaking a previous peak level and indicating bears' strength.
In that outcome, Bullion prices could be set to test the $2,550 psychological barrier. Once cleared, the next stop will be the August 20 high, which turned support at $2,531, before aiming toward the September 6 low of $2,485.
Conversely, the XAU/USD uptrend will resume if buyers drag prices to the all-time high of $2,589. If surpassed, further upside could be expected with the psychological levels of $2,600, $2,650 and $2,700.
Gold FAQs
Gold has played a key role in human’s history as it has been widely used as a store of value and medium of exchange. Currently, apart from its shine and usage for jewelry, the precious metal is widely seen as a safe-haven asset, meaning that it is considered a good investment during turbulent times. Gold is also widely seen as a hedge against inflation and against depreciating currencies as it doesn’t rely on any specific issuer or government.
Central banks are the biggest Gold holders. In their aim to support their currencies in turbulent times, central banks tend to diversify their reserves and buy Gold to improve the perceived strength of the economy and the currency. High Gold reserves can be a source of trust for a country’s solvency. Central banks added 1,136 tonnes of Gold worth around $70 billion to their reserves in 2022, according to data from the World Gold Council. This is the highest yearly purchase since records began. Central banks from emerging economies such as China, India and Turkey are quickly increasing their Gold reserves.
Gold has an inverse correlation with the US Dollar and US Treasuries, which are both major reserve and safe-haven assets. When the Dollar depreciates, Gold tends to rise, enabling investors and central banks to diversify their assets in turbulent times. Gold is also inversely correlated with risk assets. A rally in the stock market tends to weaken Gold price, while sell-offs in riskier markets tend to favor the precious metal.
The price can move due to a wide range of factors. Geopolitical instability or fears of a deep recession can quickly make Gold price escalate due to its safe-haven status. As a yield-less asset, Gold tends to rise with lower interest rates, while higher cost of money usually weighs down on the yellow metal. Still, most moves depend on how the US Dollar (USD) behaves as the asset is priced in dollars (XAU/USD). A strong Dollar tends to keep the price of Gold controlled, whereas a weaker Dollar is likely to push Gold prices up.
- The Canadian Dollar churned in familiar territory on Tuesday.
- CPI inflation data from Canada did little to spark faith in CAD.
- Looming Fed rate call pushes markets into standby mode.
The Canadian Dollar (CAD) settled into familiar territory in the midrange on Tuesday after unimpressive Canadian Consumer Price Index (CPI) inflation data failed to spark a bid in CAD flows. The Federal Reserve’s (Fed) rate call due on Wednesday looms large over global markets, quashing any one-sided moves in market flows.
Canada printed a raft of CPI data broadly below expectations, with August’s headline CPI figure contracting for the second time in 2024. National YoY figures also came in below expectations, and the Bank of Canada’s (BoC) own measure of core CPI inflation cooled further on an annualized basis.
Daily digest market movers
- Canadian CPI figures for August broadly came in below expectations on Tuesday, hobbling the CAD’s chances of finding momentum before the Fed’s expected rate cut comes in for a landing during the midweek market session.
- Canadian headline CPI inflation eased to 2.0% for the year ended in August, below the forecast 2.1% and easing back even further from the previous 2.5%.
- MoM Canadian CPI inflation contracted by -0.2% in August, missing the expected 0.1% print and down from the previous month’s 0.4% uptick.
- The BoC’s own measure of annualized core inflation eased back to 1.5% from the previous 1.7%.
- Global markets are pivoting to face the Fed’s upcoming rate call on Wednesday, which is universally expected to kick off a new rate cutting cycle.
- The Fed is expected to cut its main reference rate by 25-50 bps for the first time in over four years.
Canadian Dollar PRICE Today
The table below shows the percentage change of Canadian Dollar (CAD) against listed major currencies today. Canadian Dollar was the strongest against the Japanese Yen.
| USD | EUR | GBP | JPY | CAD | AUD | NZD | CHF | |
|---|---|---|---|---|---|---|---|---|
| USD | 0.13% | 0.40% | 1.04% | 0.07% | -0.08% | 0.23% | 0.23% | |
| EUR | -0.13% | 0.28% | 0.90% | -0.10% | -0.21% | 0.10% | 0.10% | |
| GBP | -0.40% | -0.28% | 0.65% | -0.34% | -0.49% | -0.17% | -0.20% | |
| JPY | -1.04% | -0.90% | -0.65% | -0.97% | -1.11% | -0.79% | -0.82% | |
| CAD | -0.07% | 0.10% | 0.34% | 0.97% | -0.14% | 0.19% | 0.14% | |
| AUD | 0.08% | 0.21% | 0.49% | 1.11% | 0.14% | 0.31% | 0.26% | |
| NZD | -0.23% | -0.10% | 0.17% | 0.79% | -0.19% | -0.31% | -0.03% | |
| CHF | -0.23% | -0.10% | 0.20% | 0.82% | -0.14% | -0.26% | 0.03% |
The heat map shows percentage changes of major currencies against each other. The base currency is picked from the left column, while the quote currency is picked from the top row. For example, if you pick the Canadian Dollar from the left column and move along the horizontal line to the US Dollar, the percentage change displayed in the box will represent CAD (base)/USD (quote).
Canadian Dollar price forecast
The Canadian Dollar (CAD) continues to struggle to find footing in broader FX markets. The CAD is waffling in familiar territory against the USD, keeping USD/CAD hobbled just south of the 200-day Exponential Moving Average (EMA) at 1.3617.
1.3600 continues to be a long-term inflection point for USD/CAD. Greenback bidders remain unable to muscle the US Dollar over the key technical level, but a lack of bullish interest in the CAD has left the Loonie pairing to spin circles.
USD/CAD daily chart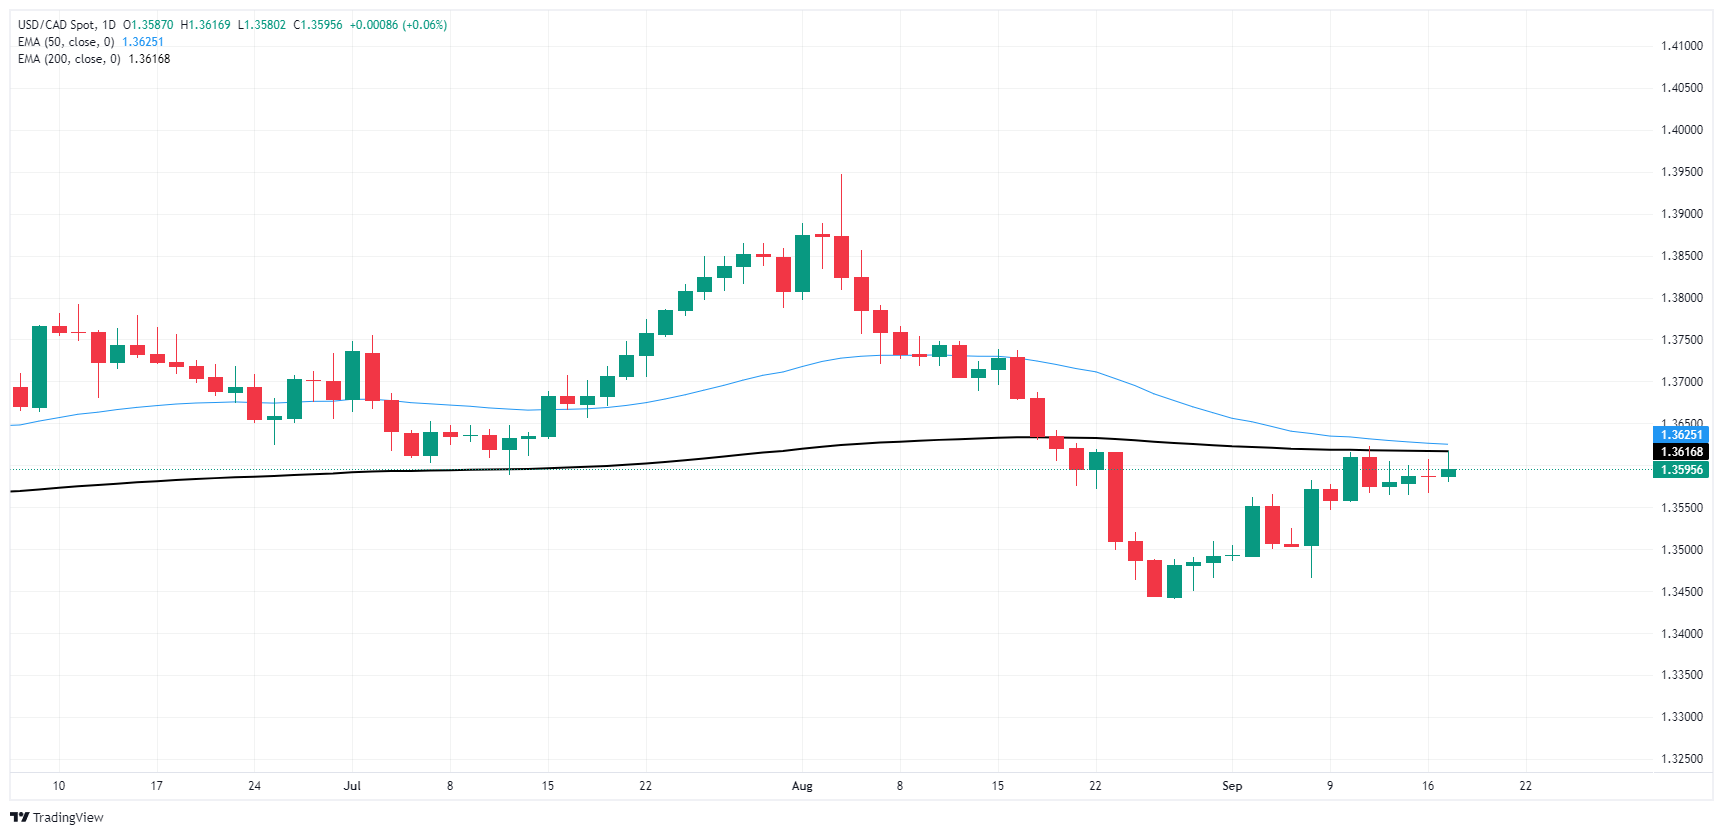
Canadian Dollar FAQs
The key factors driving the Canadian Dollar (CAD) are the level of interest rates set by the Bank of Canada (BoC), the price of Oil, Canada’s largest export, the health of its economy, inflation and the Trade Balance, which is the difference between the value of Canada’s exports versus its imports. Other factors include market sentiment – whether investors are taking on more risky assets (risk-on) or seeking safe-havens (risk-off) – with risk-on being CAD-positive. As its largest trading partner, the health of the US economy is also a key factor influencing the Canadian Dollar.
The Bank of Canada (BoC) has a significant influence on the Canadian Dollar by setting the level of interest rates that banks can lend to one another. This influences the level of interest rates for everyone. The main goal of the BoC is to maintain inflation at 1-3% by adjusting interest rates up or down. Relatively higher interest rates tend to be positive for the CAD. The Bank of Canada can also use quantitative easing and tightening to influence credit conditions, with the former CAD-negative and the latter CAD-positive.
The price of Oil is a key factor impacting the value of the Canadian Dollar. Petroleum is Canada’s biggest export, so Oil price tends to have an immediate impact on the CAD value. Generally, if Oil price rises CAD also goes up, as aggregate demand for the currency increases. The opposite is the case if the price of Oil falls. Higher Oil prices also tend to result in a greater likelihood of a positive Trade Balance, which is also supportive of the CAD.
While inflation had always traditionally been thought of as a negative factor for a currency since it lowers the value of money, the opposite has actually been the case in modern times with the relaxation of cross-border capital controls. Higher inflation tends to lead central banks to put up interest rates which attracts more capital inflows from global investors seeking a lucrative place to keep their money. This increases demand for the local currency, which in Canada’s case is the Canadian Dollar.
Macroeconomic data releases gauge the health of the economy and can have an impact on the Canadian Dollar. Indicators such as GDP, Manufacturing and Services PMIs, employment, and consumer sentiment surveys can all influence the direction of the CAD. A strong economy is good for the Canadian Dollar. Not only does it attract more foreign investment but it may encourage the Bank of Canada to put up interest rates, leading to a stronger currency. If economic data is weak, however, the CAD is likely to fall.
The Greenback managed to recoup part of the ground lost in recent days on the back of firmer results from US data releases, which helped quash somewhat concerns over a significant slowdown of the US economy, all prior to the Fed’s interest rate decision on Wednesday.
Here is what you need to know on Wednesday, September 18:
The US Dollar Index (DXY) reversed three consecutive daily pullbacks helped by a decent bounce in US yields while investors continued to price in a 50-bps rate cut by the Fed on Wednesday. The salient event of the week will be the FOMC meeting on September 18, seconded by the weekly Mortgage Applications by MBA, Building Permits, Housing Starts, and Net TIC Flows.
Renewed buying pressure in the Greenback kept EUR/USD’s price action subdued in the low-1.1100s ahead of the FOMC gathering. On September 18, the final Inflation Rate and Construction Output in the euro zone are due, along with speeches by the ECB’s Buch and McCaul.
GBP/USD traded on the defensive and retreated from earlier peaks near 1.3230 in response to the data-led bounce in the US Dollar. The UK Inflation Rate will be published on September 18.
USD/JPY rose to three-day highs and revisited the 142.00 neighbourhood on the back of fresh gains in the Greenback and higher US yields across the board. The Balance of Trade results and Machinery Orders will be unveiled on September 18.
AUD/USD alternated gains with losses around 0.6750, reaching new multi-day highs despite the better tone in the US Dollar. The Westpac Leading Index is expected on September 18 followed by the speech by the RBA’s Jones.
Prices of WTI came under pressure near the $70.00 mark per barrel as Chinese demand concerns returned to the fore.
Gold prices saw their recent strong advance trimmed on the back of the firmer US Dollar and the recovery in US yields. Silver prices extended Monday’s inconclusive price action, trading in a narrow range below the $31.00 mark per ounce.
- Fed easing expectations continue to mount, and markets are pricing in high odds of 50 bps cut.
- Analysts expect 25 bps cut on Wednesday.
- US Retail Sales data has little impact on the USD.
The US Dollar remained stable at the start of the US trading session on Tuesday, showing little response to the release of Retail Sales data as anticipated. The US Dollar Index (DXY), which is a measure of the Greenback against a basket of six currencies, edged slightly higher, pulling away from its low for the year but with only a minimal recovery. Federal Reserve (Fed) easing has become more likely, with market pricing implying a 50 bps cut, while most analysts still predict a 25 bps cut.
The US economy is experiencing growth above historical norms, indicating that the market is pricing in overly optimistic expectations of monetary policy easing. This surge in optimism may be excessive as the economic data suggests that the Fed is likely to maintain its current stance of gradual interest rate increases.
Daily digest market movers: US Dollar rises mildly, investors still anticipate aggressive Fed easing
- Market expectations for aggressive Fed easing have increased ahead of Wednesday's FOMC decision.
- Most analysts anticipate a 25-basis-point cut, but a handful predict a larger 50-basis-point cut.
- The market is pricing in a 65% chance of a 50 bps cut and 250 bps of easing over the next 12 months.
- The market's aggressive rate path expectations are unlikely to be validated by the updated Dot Plot.
- Risks of a dovish surprise from the Fed remain, but not all members are expected to support such a move.
- On the data front, according to the US Census Bureau's report on Tuesday, Retail Sales in the US grew by 0.1% in August, reaching $710.8 billion.
- This followed a 1.1% rise in July and surpassed market predictions, which had anticipated a 0.2% decline. However, excluding automobile sales, Retail Sales increased by 0.1%, falling short of the expected 0.2% growth.
DXY technical outlook: DXY indicators signal bearish momentum but find support
DXY technical indicators moved lower into a bearish zone. The index fell beneath its 20-day Simple Moving Average (SMA), signaling a decrease in buying momentum. The Relative Strength Index (RSI) remains below 50, indicating a bearish trend but somewhat flattening. The Moving Average Convergence Divergence (MACD) indicator is displaying diminished green bars, suggesting weak buying pressure.
Support levels lie at 100.50, 100.30 and 100.00, while resistance is found at 101.00, 101.30 and 101.60.
US Dollar FAQs
The US Dollar (USD) is the official currency of the United States of America, and the ‘de facto’ currency of a significant number of other countries where it is found in circulation alongside local notes. It is the most heavily traded currency in the world, accounting for over 88% of all global foreign exchange turnover, or an average of $6.6 trillion in transactions per day, according to data from 2022. Following the second world war, the USD took over from the British Pound as the world’s reserve currency. For most of its history, the US Dollar was backed by Gold, until the Bretton Woods Agreement in 1971 when the Gold Standard went away.
The most important single factor impacting on the value of the US Dollar is monetary policy, which is shaped by the Federal Reserve (Fed). The Fed has two mandates: to achieve price stability (control inflation) and foster full employment. Its primary tool to achieve these two goals is by adjusting interest rates. When prices are rising too quickly and inflation is above the Fed’s 2% target, the Fed will raise rates, which helps the USD value. When inflation falls below 2% or the Unemployment Rate is too high, the Fed may lower interest rates, which weighs on the Greenback.
In extreme situations, the Federal Reserve can also print more Dollars and enact quantitative easing (QE). QE is the process by which the Fed substantially increases the flow of credit in a stuck financial system. It is a non-standard policy measure used when credit has dried up because banks will not lend to each other (out of the fear of counterparty default). It is a last resort when simply lowering interest rates is unlikely to achieve the necessary result. It was the Fed’s weapon of choice to combat the credit crunch that occurred during the Great Financial Crisis in 2008. It involves the Fed printing more Dollars and using them to buy US government bonds predominantly from financial institutions. QE usually leads to a weaker US Dollar.
Quantitative tightening (QT) is the reverse process whereby the Federal Reserve stops buying bonds from financial institutions and does not reinvest the principal from the bonds it holds maturing in new purchases. It is usually positive for the US Dollar.
- Mexican Peso remains soft as US Retail Sales, Industrial Production beat estimates.
- Mexico’s Q2 Aggregate Demand and Private Spending data will be released Wednesday, while the Fed’s rate decision looms.
- US Dollar Index climbs 0.20% to 100.92, as traders maintain 61% odds for a 50 bps Fed rate cut.
The Mexican Peso erased some of its losses against the US Dollar, gains some 0.30% after US Retail Sales data was better than expected. Despite that, expectations that the Federal Reserve (Fed) will cut rates by 50 basis points (bps) remained unchanged as the Fed begins its two-day meeting. The USD/MXN trades at 19.18 after hitting a daily high of 19.40.
The US Commerce Department revealed that August Retail Sales fared better than the consensus. The data revealed that consumers remain resilient even though hiring and wage growth show signs of moderation. Other data showed that Industrial Production in August rose after posting a contraction in July.
Following the data, the Greenback extended its gains, as seen by the USD/MXN pair. According to the US Dollar Index (DXY), it climbed some 0.20% to 100.92, even though odds for a 50 bps rate cut by the Fed remained at 61%, while the chances for a quarter of a percentage point are 39%.
In the meantime, the Atlanta Fed GDP Now Index, which calculates estimates for Q3 Gross Domestic Product (GDP) figures, rose from 2.5% to 3%.
On Wednesday, Mexico’s economic docket will feature Aggregate Demand for Q2 alongside Private Spending figures. Across the border, the US economic schedule will feature housing data ahead of the Federal Open Market Committee (FOMC) monetary policy decision. After that, Fed Chairman Jerome Powell will cross the wires.
Daily digest market movers: Mexican Peso advances despite solid US data
- USD/MXN would continue to be driven by market mood and expectations for a bigger Fed rate cut.
- US Retail Sales in August rose 0.1% MoM above estimates of -0.2%. Every year, the figures expanded by 2.1%, down from 2.9% in July.
- Industrial Production rose by 0.8% MoM in August, up from a -0.9% contraction in the previous month.
- Data from the Chicago Board of Trade suggests the Fed will cut at least 111 basis points this year, according to the fed funds rate futures contract for December 2024.
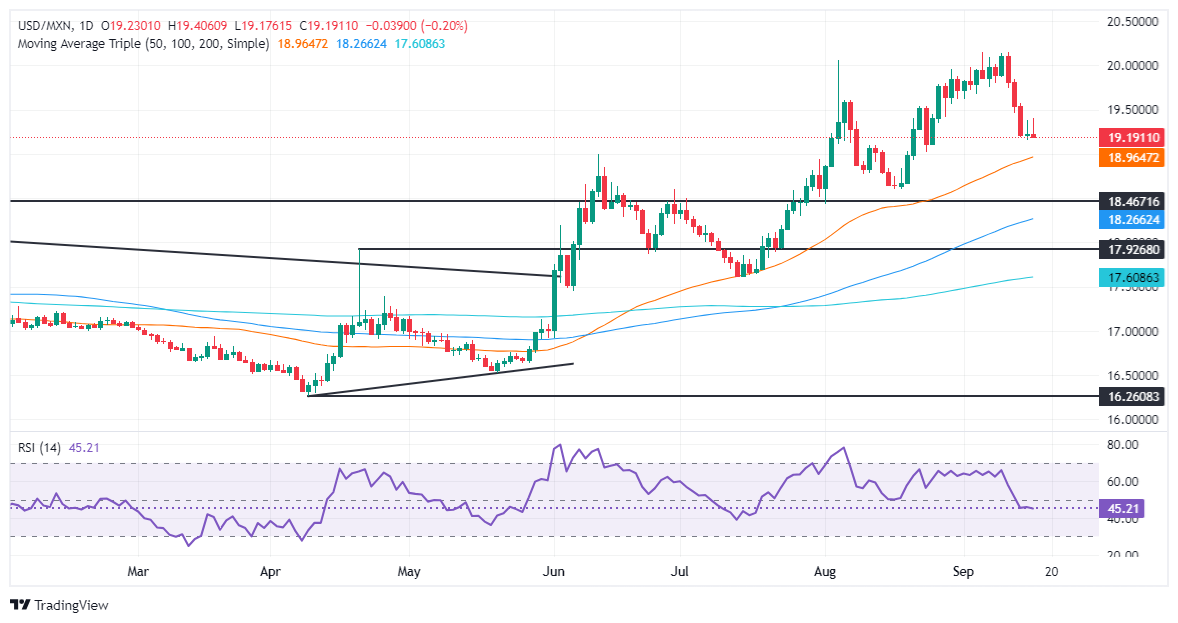
USD/MXN technical outlook: Mexican Peso rises as USD/MXN drops below 19.20
The USD/MXN remains upwardly biased despite dipping to 19.15 last week. Momentum suggests that the exotic pair might consolidate in the near term as depicted by the Relative Strength Index (RSI) turning flat.
That said, if USD/MXN climbs above 19.50, the next resistance would be the 20.00 psychological figure. Conversely, if USD/MXN drops below 19.15, key support levels emerge like the August 23 daily low of 19.02, ahead of the 50-day Simple Moving Average (SMA) at 18.99.
Mexican Peso FAQs
The Mexican Peso (MXN) is the most traded currency among its Latin American peers. Its value is broadly determined by the performance of the Mexican economy, the country’s central bank’s policy, the amount of foreign investment in the country and even the levels of remittances sent by Mexicans who live abroad, particularly in the United States. Geopolitical trends can also move MXN: for example, the process of nearshoring – or the decision by some firms to relocate manufacturing capacity and supply chains closer to their home countries – is also seen as a catalyst for the Mexican currency as the country is considered a key manufacturing hub in the American continent. Another catalyst for MXN is Oil prices as Mexico is a key exporter of the commodity.
The main objective of Mexico’s central bank, also known as Banxico, is to maintain inflation at low and stable levels (at or close to its target of 3%, the midpoint in a tolerance band of between 2% and 4%). To this end, the bank sets an appropriate level of interest rates. When inflation is too high, Banxico will attempt to tame it by raising interest rates, making it more expensive for households and businesses to borrow money, thus cooling demand and the overall economy. Higher interest rates are generally positive for the Mexican Peso (MXN) as they lead to higher yields, making the country a more attractive place for investors. On the contrary, lower interest rates tend to weaken MXN.
Macroeconomic data releases are key to assess the state of the economy and can have an impact on the Mexican Peso (MXN) valuation. A strong Mexican economy, based on high economic growth, low unemployment and high confidence is good for MXN. Not only does it attract more foreign investment but it may encourage the Bank of Mexico (Banxico) to increase interest rates, particularly if this strength comes together with elevated inflation. However, if economic data is weak, MXN is likely to depreciate.
As an emerging-market currency, the Mexican Peso (MXN) tends to strive during risk-on periods, or when investors perceive that broader market risks are low and thus are eager to engage with investments that carry a higher risk. Conversely, MXN tends to weaken at times of market turbulence or economic uncertainty as investors tend to sell higher-risk assets and flee to the more-stable safe havens.
- The Dow Jones clipped into yet another record bid on Tuesday.
- Investors are tilting into the risk-on side ahead of expected Fed rate cut.
- Markets are split on the depth of anticipated first Fed rate cut in over four years.
The Dow Jones Industrial Average (DJIA) rose into a fresh record high for the second day in a row on Tuesday as investors jostle for position ahead of the Federal Reserve’s (Fed) hotly-anticipated rate cut during the midweek market session. Despite a strong start to the day, the Dow Jones turned away from record peaks and dipped back into the previous day’s trading range.
US Retail Sales figures in August helped to keep market Fed expectations anchored, rising 0.1% compared to the median forecast of a -0.2% contraction. July’s Retail Sales figure was also revised higher to 1.1%, though core Retail Sales (excluding automotive purchases) only rose 0.1% compared to the 0.2% forecast.
The only meaningful event remaining on the data docket for stocks this week is the Fed’s upcoming rate call on Wednesday. Markets have been angling for a reduction in the Fed funds rate since the beginning of the year when investors were clamoring for a March cut. According to the CME’s FedWatch Tool, rate markets are still split on the depth of the Fed’s first expected rate trim since early 2020, with rate traders pricing in 60% odds of a 50 bps double cut to kick off the Fed’s next rate cutting cycle. The remaining 40% of rate cut expectations are stacked on a more reasonable 25 bps.
Dow Jones news
Despite an early pop into a fresh all-time intraday high on Tuesday, the Dow Jones remains broadly on-balance for the day. The DJIA is mixed, with half of the major index’s listed securities testing into the red.
Walmart Inc. (WMT) pared back recents gains, falling 2% on the day after hitting a fresh record high of $80.96 on Monday. The retail giant’s share price is now paring back, declining below $79 per share.
On the high end, Intel Corp (INTC) rallied another 3.3% to clear $21 per share after announcing plans to spin off the chipmaker’s foundry business into a subsidiary division, which would allow the computer hardware giant to raise additional outside funds. The news comes on the heels of an announcement this week that Intel would receive an additional $3 billion in federal grant funding despite plans to axe over 10% of the entire company’s workforce. Despite a near-term recovery, Intel’s valuation remains down around 60% for the year.
Dow Jones price forecast
Tuesday is proving to be a truly mixed day for the Dow Jones; despite setting a fresh record high bid above 41,750, the index is also testing into the low end and set to snap a four-day win streak. Investors are holding steady as the calendar runs down to the Fed’s upcoming rate call, but nerves are still on the frayed end, but a fast tumble to the 50-day Exponential Moving Average (EMA) at 40,493 can’t be ruled out.
A lack of meaningful technical resistance above price action makes it difficult for bulls to price out a logical target, but intraday bidders will be cautious with early pullback signs forming on the daily candlesticks.
Dow Jones daily chart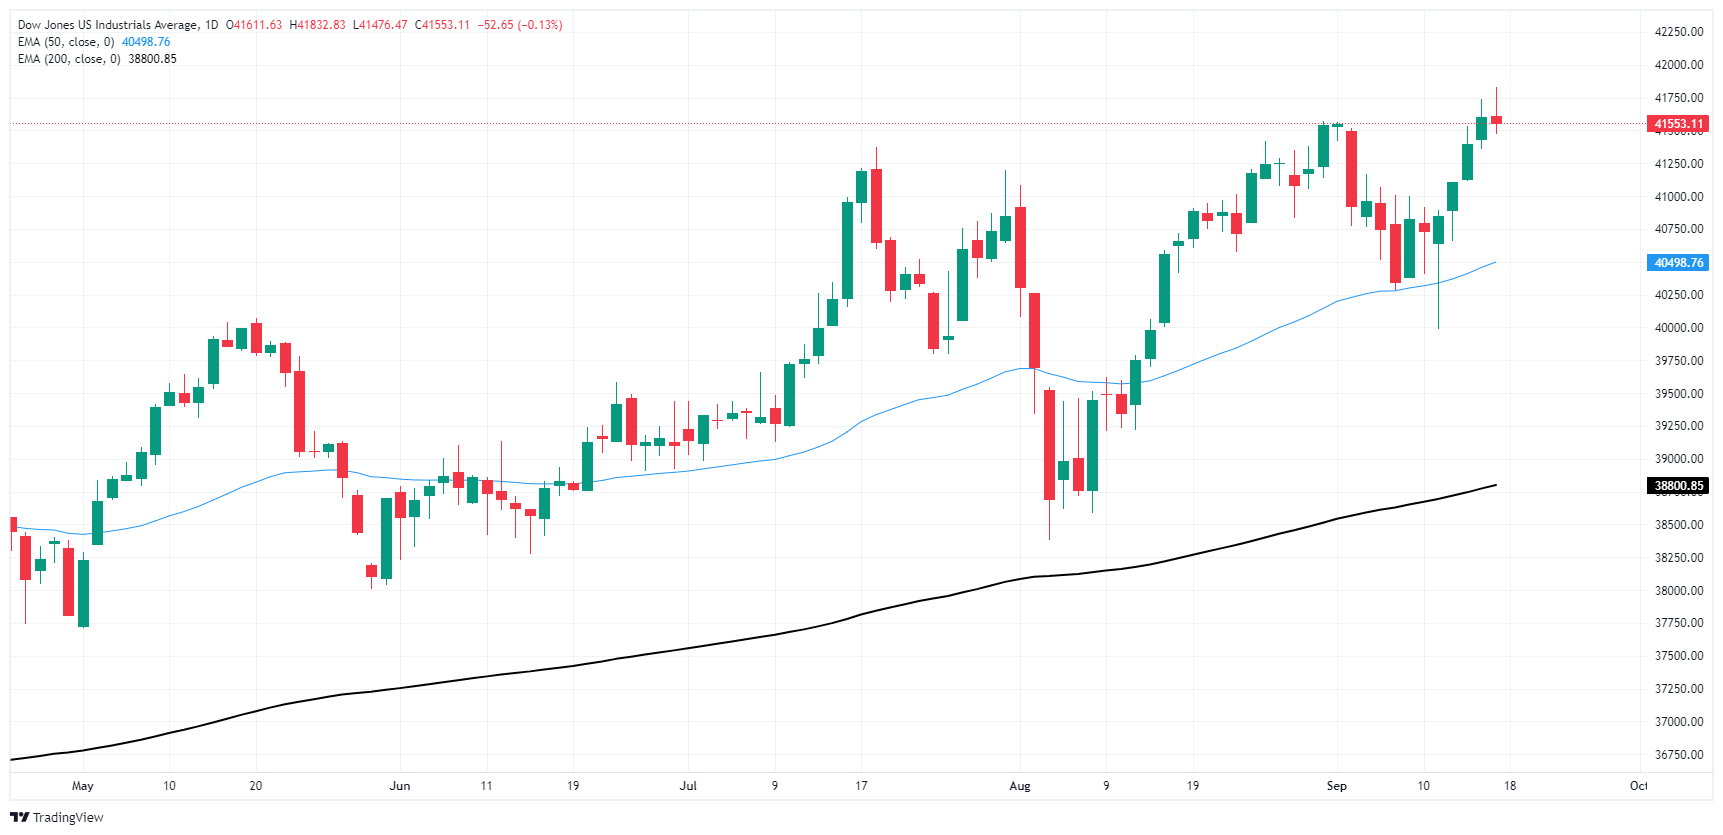
Dow Jones FAQs
The Dow Jones Industrial Average, one of the oldest stock market indices in the world, is compiled of the 30 most traded stocks in the US. The index is price-weighted rather than weighted by capitalization. It is calculated by summing the prices of the constituent stocks and dividing them by a factor, currently 0.152. The index was founded by Charles Dow, who also founded the Wall Street Journal. In later years it has been criticized for not being broadly representative enough because it only tracks 30 conglomerates, unlike broader indices such as the S&P 500.
Many different factors drive the Dow Jones Industrial Average (DJIA). The aggregate performance of the component companies revealed in quarterly company earnings reports is the main one. US and global macroeconomic data also contributes as it impacts on investor sentiment. The level of interest rates, set by the Federal Reserve (Fed), also influences the DJIA as it affects the cost of credit, on which many corporations are heavily reliant. Therefore, inflation can be a major driver as well as other metrics which impact the Fed decisions.
Dow Theory is a method for identifying the primary trend of the stock market developed by Charles Dow. A key step is to compare the direction of the Dow Jones Industrial Average (DJIA) and the Dow Jones Transportation Average (DJTA) and only follow trends where both are moving in the same direction. Volume is a confirmatory criteria. The theory uses elements of peak and trough analysis. Dow’s theory posits three trend phases: accumulation, when smart money starts buying or selling; public participation, when the wider public joins in; and distribution, when the smart money exits.
There are a number of ways to trade the DJIA. One is to use ETFs which allow investors to trade the DJIA as a single security, rather than having to buy shares in all 30 constituent companies. A leading example is the SPDR Dow Jones Industrial Average ETF (DIA). DJIA futures contracts enable traders to speculate on the future value of the index and Options provide the right, but not the obligation, to buy or sell the index at a predetermined price in the future. Mutual funds enable investors to buy a share of a diversified portfolio of DJIA stocks thus providing exposure to the overall index.
- The EUR/GBP rose to 0.8450 aiming for the 20-day SMA
- The RSI and MACD are projecting that buying pressure is increasing.
- If the buyers regain the 20-day SMA, the outlook will improve.
In Tuesday's session, the EUR/GBP rose by 0.28% to 0.8450 and extended its sideways trading range tracking the narrow-range movements of the past sessions. A break above the 20-day Simple Moving Average (SMA) which convergences at 0.8450, would confirm a break of the side-ways movements.
The Relative Strength Index (RSI), currently at 50, indicates that the pair is in neutral territory, while the RSI slope is rising sharply, suggesting that buying pressure is recovering. The Moving Average Convergence Divergence (MACD) shows a green histogram with rising bars, revealing that buying pressure is increasing. Combining these technical indicators suggests that bulls are regaining some control.
EUR/GBP daily chart
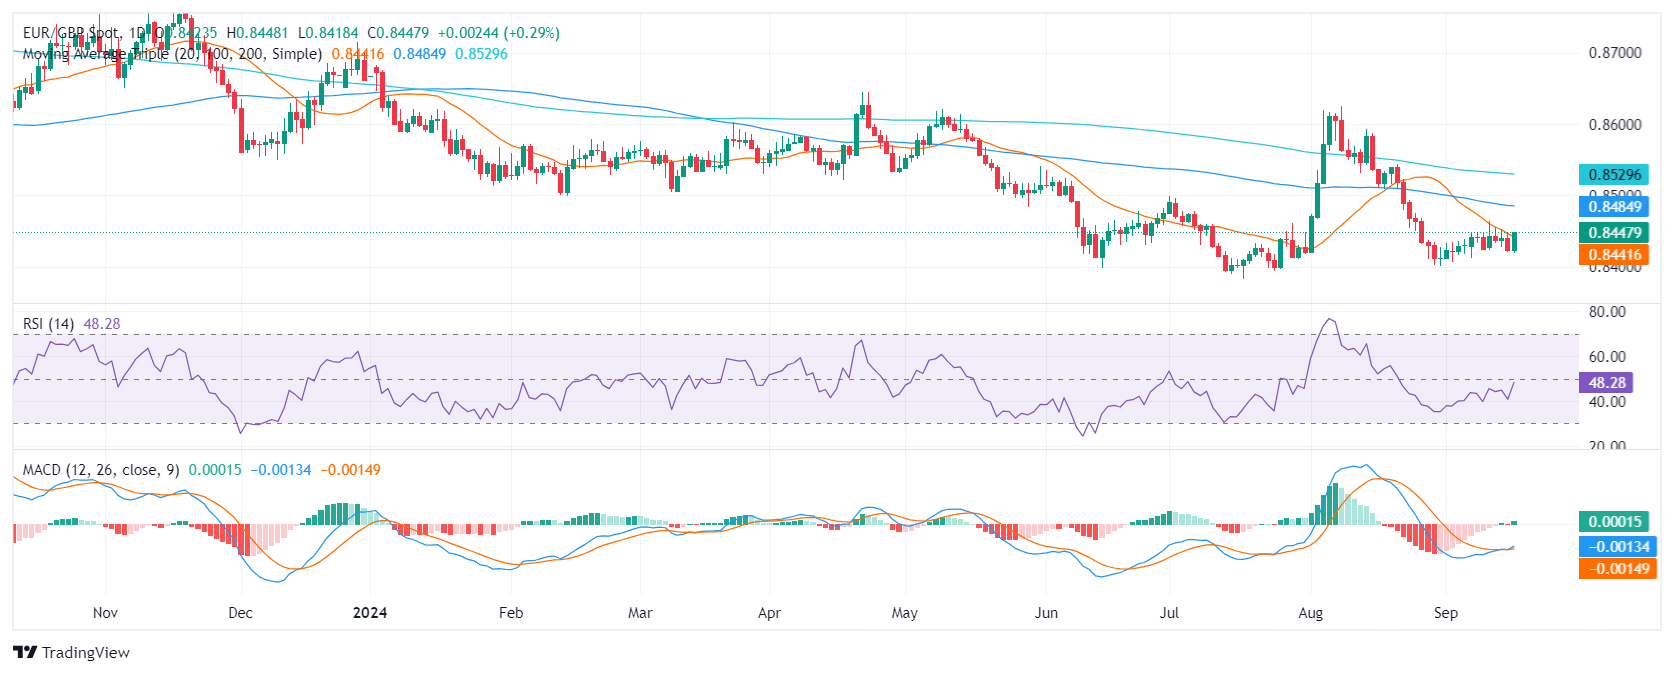
The EUR/GBP pair has been consolidating within a narrow range for the last seven sessions, with little upward or downward momentum. Nonetheless, the pair is trading slightly higher at 0.8450 and has traded primarily within the 0.8420-0.8460 range. If the pair breaks above the immediate resistance level of 0.8460, it could potentially target 0.8480 and 0.8500. Conversely, a break below 0.8420 could open up further downside potential below 0.8400 and 0.8380.
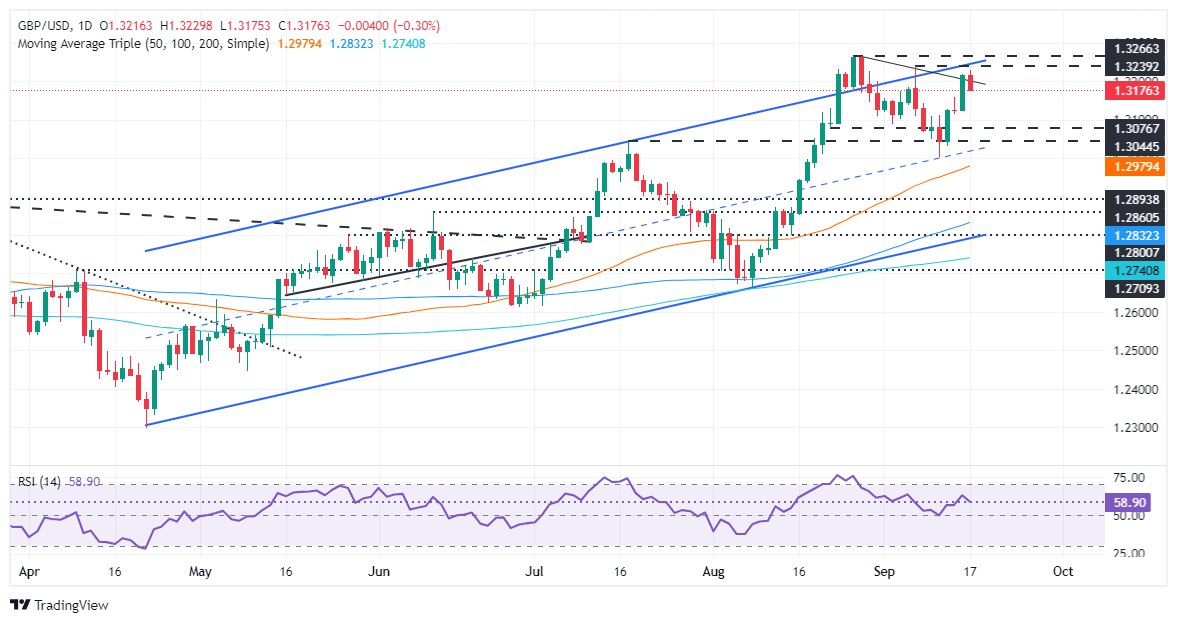
- GBP/USD remains upward biased, but short-term momentum has shifted bearish after dipping below 1.3200.
- Key support lies at 1.3146, with further downside targets at 1.3100 and the recent low of 1.3001.
- On a rebound, resistance levels include 1.3200, the YTD high of 1.3266, and the March 22 peak at 1.3298.
The British Pound erased its earlier gains and dropped below 1.3200 against the Greenback after the US Census Bureau reported stronger-than-expected US Retail Sales. Even though the data didn’t change expectations for a 50-basis points (bps) Fed rate cut, the GBP/USD posted losses of over 0.20% and exchanged hands at 1.3186.
GBP/USD Price Forecast: Technical outlook
The GBP/USD is upward biased even though the pair fell below 1.3200 following US Retail Sales data. Momentum shifted slightly bearishly in the short term, but the Relative Strength Index (RSI) suggests that buyers are in charge and that the dips should be bought.
If the market continues to fall, the GBP/USD's first support would be the September 15 low of 1.3146. Once cleared, the next stop would be 1.3100, followed by the latest swing low at 1.3001.
On further strength, the GBP/USD first resistance would be 1.3200, followed by the year-to-date (YTD) high at 1.3266, ahead of the March 22, 2023 peak at 1.3298.
GBP/USD Price Action – Daily Chart
Pound Sterling FAQs
The Pound Sterling (GBP) is the oldest currency in the world (886 AD) and the official currency of the United Kingdom. It is the fourth most traded unit for foreign exchange (FX) in the world, accounting for 12% of all transactions, averaging $630 billion a day, according to 2022 data. Its key trading pairs are GBP/USD, aka ‘Cable’, which accounts for 11% of FX, GBP/JPY, or the ‘Dragon’ as it is known by traders (3%), and EUR/GBP (2%). The Pound Sterling is issued by the Bank of England (BoE).
The single most important factor influencing the value of the Pound Sterling is monetary policy decided by the Bank of England. The BoE bases its decisions on whether it has achieved its primary goal of “price stability” – a steady inflation rate of around 2%. Its primary tool for achieving this is the adjustment of interest rates. When inflation is too high, the BoE will try to rein it in by raising interest rates, making it more expensive for people and businesses to access credit. This is generally positive for GBP, as higher interest rates make the UK a more attractive place for global investors to park their money. When inflation falls too low it is a sign economic growth is slowing. In this scenario, the BoE will consider lowering interest rates to cheapen credit so businesses will borrow more to invest in growth-generating projects.
Data releases gauge the health of the economy and can impact the value of the Pound Sterling. Indicators such as GDP, Manufacturing and Services PMIs, and employment can all influence the direction of the GBP. A strong economy is good for Sterling. Not only does it attract more foreign investment but it may encourage the BoE to put up interest rates, which will directly strengthen GBP. Otherwise, if economic data is weak, the Pound Sterling is likely to fall.
Another significant data release for the Pound Sterling is the Trade Balance. This indicator measures the difference between what a country earns from its exports and what it spends on imports over a given period. If a country produces highly sought-after exports, its currency will benefit purely from the extra demand created from foreign buyers seeking to purchase these goods. Therefore, a positive net Trade Balance strengthens a currency and vice versa for a negative balance.
The Dollar Index (DXY) depreciated a third session by 0.4% to 100.76, approaching 100.55, the year’s weakest close on August 27, DBS FX strategist Philip Wee notes.
The Fed’s rate cut trajectory matters more
“The futures market has increased the probability of a 50 bps rate cut at the September 18 FOMC meeting to 170% from 118% last Wednesday. Over the same period, the US Treasury 2Y yield eased by 9.1 bps to 3.551%, while the 10Y yield fell 3.6 bps to 3.618%.”
“Conversely, economists polled by Bloomberg expect the Fed to mirror its peers and commence with a 25 bps reduction.”
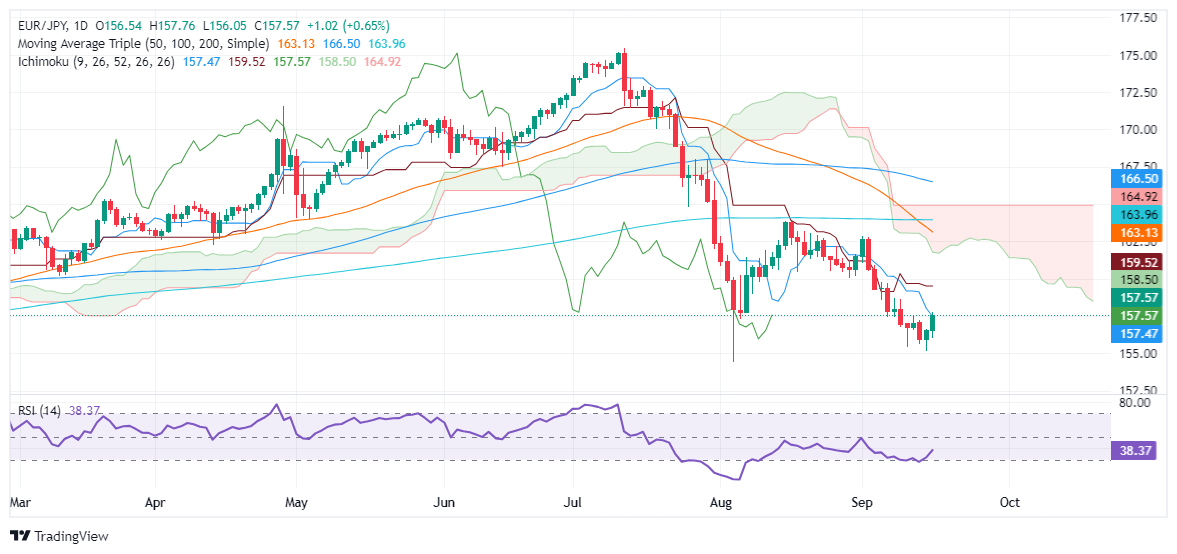
- EUR/JPY ignores weaker-than-expected ZEW data from the Eurozone and Germany, buoyed by USD/JPY strength.
- Positive US Retail Sales figures drive the USD/JPY higher, despite no clear indications of the Fed’s rate cut size ahead of the FOMC meeting.
- ECB Member Simkus dismisses a rate cut in October, while analysts speculate the BoJ could raise rates to 0.50% by year’s end.
The EUR/JPY trades in the green, up by 0.48%, shrugging off worse-than-expected ZEW data from the Eurozone (EU) and Germany. The recovery of the USD/JPY pair boosted the pair. At the time of writing, the cross-pair trades at 157.28 after touching a low of 156.05.
EUR/JPY climbs to 157.28 as strong US Retail Sales data weighs on Japanese Yen
Data from the United States (US) underpinned the USD/JPY after Retail Sales exceeded estimates of -0.2% contraction, expanded by 0.1% MoM in August. Although the data is positive, failed to provide hints on the size of the Federal Reserve rate cut on Wednesday.
Markets reacted positively to the announcement as Wall Street extended its gains, and the Greenback recovered ahead of the Federal Open Market Committee (FOMC) decision.
In addition, the EU ZEW Survey of Expectations dipped to an eleven-month low, from 17.9 to 9.3 in September, marking the third consecutive month of deterioration amid ongoing uncertainty about the economic outlook and monetary policy direction.
In the meantime, European Central Bank (ECB) Member Gediminas Simkus said the economy is developing as foreseen and disregarded a rate cut in October.
On the Japanese Yen front, the Bank of Japan (BoJ) will hold its latest monetary policy meeting. The consensus suggests the BoJ will stay put, yet analysts at Standard Chartered suggest that rates could reach 0.50% by year’s end.
EUR/JPY Price Forecast: Technical outlook
Given the fundamental backdrop, the FOMC’s meeting could weigh on both countries. If the Fed’s decision triggers a risk-off environment, look for further downside on the EUR/JPY pair.
However, as of writing, the cross has cleared the Tenkan-Sen at 157.46. It aims to challenge the Senkou Spa A at 158.49, but first, traders should reclaim 158.00. If those levels are cleared, the next stop would be the Kijun-Sen at 159.51.
On further weakness, the EUR/JPY could retest the latest trough at 155.14, the September 16 daily low.
Euro PRICE Today
The table below shows the percentage change of Euro (EUR) against listed major currencies today. Euro was the strongest against the Japanese Yen.
| USD | EUR | GBP | JPY | CAD | AUD | NZD | CHF | |
|---|---|---|---|---|---|---|---|---|
| USD | 0.08% | 0.15% | 0.74% | 0.01% | -0.18% | 0.13% | 0.23% | |
| EUR | -0.08% | 0.07% | 0.63% | -0.10% | -0.28% | 0.05% | 0.16% | |
| GBP | -0.15% | -0.07% | 0.58% | -0.13% | -0.35% | -0.01% | 0.06% | |
| JPY | -0.74% | -0.63% | -0.58% | -0.72% | -0.91% | -0.60% | -0.52% | |
| CAD | -0.01% | 0.10% | 0.13% | 0.72% | -0.19% | 0.13% | 0.20% | |
| AUD | 0.18% | 0.28% | 0.35% | 0.91% | 0.19% | 0.31% | 0.39% | |
| NZD | -0.13% | -0.05% | 0.01% | 0.60% | -0.13% | -0.31% | 0.07% | |
| CHF | -0.23% | -0.16% | -0.06% | 0.52% | -0.20% | -0.39% | -0.07% |
The heat map shows percentage changes of major currencies against each other. The base currency is picked from the left column, while the quote currency is picked from the top row. For example, if you pick the Euro from the left column and move along the horizontal line to the US Dollar, the percentage change displayed in the box will represent EUR (base)/USD (quote).
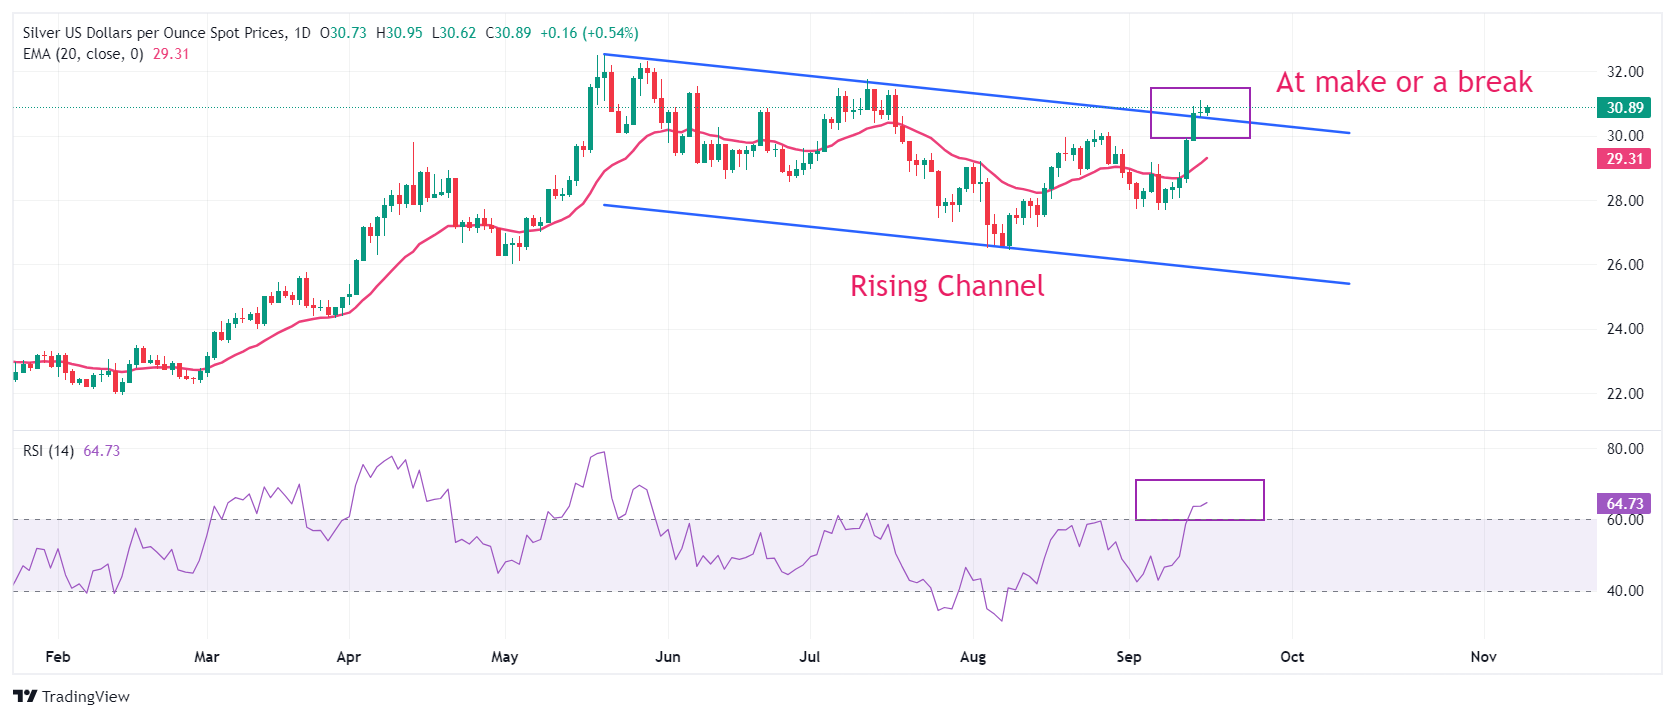
- Silver price trades sideways below $31.00 with Fed policy taking center stage.
- Market speculation for the Fed to start reducing interest rates aggressively remains firm.
- US Retail Sales surprisingly rose at a meager growth of 0.1% in August.
Silver price (XAG/USD) stays in tight range below the crucial resistance of $31.00 in Tuesday’s North American session. The white metal consolidates as investors have sidelined, focusing on the Federal Reserve’s (Fed) monetary policy decision, which will be announced on Wednesday.
The Fed is widely anticipated to start reducing interest rates. This would be the first interest rate cut decision by the Fed in more than four years. Investors will keenly focus on the likely Fed rate cut size. According to the CME FedWatch tool, the probability of the Fed reducing interest rates by 50 bps to 4.75%-5.00% in September has increased sharply to 67% from 34% a week ago.
Market speculation for the Fed pivoting to policy normalization aggressively has increased lately after the release of the softer-than-expected United States (US) annual headline Producer Price Index (PPI) data for August, published last week.
Meanwhile, the US Dollar (USD) bounced back sharply after the release of the United States (US) Retail Sales data for August. The Retail Sales data, a key measure of consumer spending, surprisingly rose but at a meager growth of 0.1%. Economists estimated the consumer spending measure to have contracted by 0.2%.
The US Dollar Index (DXY), which tracks the Greenback’s value against six major currencies, rebounds strongly to near 101.00 after declining to near the year-to-date low around 100.50.
Silver technical analysis
Silver price is at a make or a break near $31.00 ahead of the Fed’s monetary policy decision. The white metal could a fresh upside if it manages to break above September 16 high of $31.10. The near-term outlook of the Silver price strengthens as the asset holds above the 20-day Exponential Moving Average (EMA), which trades around $29.30.
The 14-day Relative Strength Index (RSI) rises above 60.00. A fresh round of bullish momentum could occur if the oscillator sustains about this level.
Silver daily chart
Silver FAQs
Silver is a precious metal highly traded among investors. It has been historically used as a store of value and a medium of exchange. Although less popular than Gold, traders may turn to Silver to diversify their investment portfolio, for its intrinsic value or as a potential hedge during high-inflation periods. Investors can buy physical Silver, in coins or in bars, or trade it through vehicles such as Exchange Traded Funds, which track its price on international markets.
Silver prices can move due to a wide range of factors. Geopolitical instability or fears of a deep recession can make Silver price escalate due to its safe-haven status, although to a lesser extent than Gold's. As a yieldless asset, Silver tends to rise with lower interest rates. Its moves also depend on how the US Dollar (USD) behaves as the asset is priced in dollars (XAG/USD). A strong Dollar tends to keep the price of Silver at bay, whereas a weaker Dollar is likely to propel prices up. Other factors such as investment demand, mining supply – Silver is much more abundant than Gold – and recycling rates can also affect prices.
Silver is widely used in industry, particularly in sectors such as electronics or solar energy, as it has one of the highest electric conductivity of all metals – more than Copper and Gold. A surge in demand can increase prices, while a decline tends to lower them. Dynamics in the US, Chinese and Indian economies can also contribute to price swings: for the US and particularly China, their big industrial sectors use Silver in various processes; in India, consumers’ demand for the precious metal for jewellery also plays a key role in setting prices.
Silver prices tend to follow Gold's moves. When Gold prices rise, Silver typically follows suit, as their status as safe-haven assets is similar. The Gold/Silver ratio, which shows the number of ounces of Silver needed to equal the value of one ounce of Gold, may help to determine the relative valuation between both metals. Some investors may consider a high ratio as an indicator that Silver is undervalued, or Gold is overvalued. On the contrary, a low ratio might suggest that Gold is undervalued relative to Silver.
- Industrial Production increased at a stronger pace than expected in August.
- US Dollar Index stays in positive territory slightly below 101.00.
Industrial Production in the US rose 0.8% on a monthly basis in August, the Federal Reserve (Fed) reported on Tuesday. This reading followed the 0.6% decrease recorded in July and came in better than the market expectation of 0.2%.
Further details of the publication showed that the Capacity Utilization improved to 78% from 77.8% in the same period.
Market reaction
These figures don't seem to be having a noticeable impact on the US Dollar's valuation against its major rivals. At the time of press, the USD Index was up 0.15% on the day at 100.85.
There is evidence that the last leg of the rally in Gold may have been a stop hunt, given the odd timing for an incursion into new all-time highs alongside evidence of new shorts being added by proprietary traders, family offices and macro funds while Gold ranged near the highs, TDS Senior Commodity Strategist Daniel Ghali notes.
Balance of risks is skewed significantly to the downside
“We still think the balance of risks is skewed significantly to the downside, with macro fund positioning at levels that have marked historical local tops including in Jul2016 (Brexit referendum), Sep2019 ("stealth QE") and during the depths of the pandemic in Mar2020. Shanghai traders are also holding onto record length, and CTAs are already max long.
“With nearly 120bps of cuts priced into year-end and fast return towards ‘neutral’ into the New Year without a recessionary consensus, this Goldilocks pricing could be easily challenged over the coming months.”
“Momentum in labour market weakness is driving convictions. While labour market weakness has historically led to further weakness, it remains to be seen whether that will be the case this time around since prior cases of labour market weakness have also been accompanied by layoffs, which have not yet been a feature of this cycle.”
- EUR/CHF bottomed and formed a Bullish Engulfing candlestick pattern on September 11.
- Since then it has recovered then pulled back – it could soon resume upside again.
EUR/CHF reached a temporary bottom on September 11 and recovered. It is currently trading above 0.9400. There are signs that suggest it could continue higher despite the overall bearish medium-term trend.
EUR/CHF Daily Chart
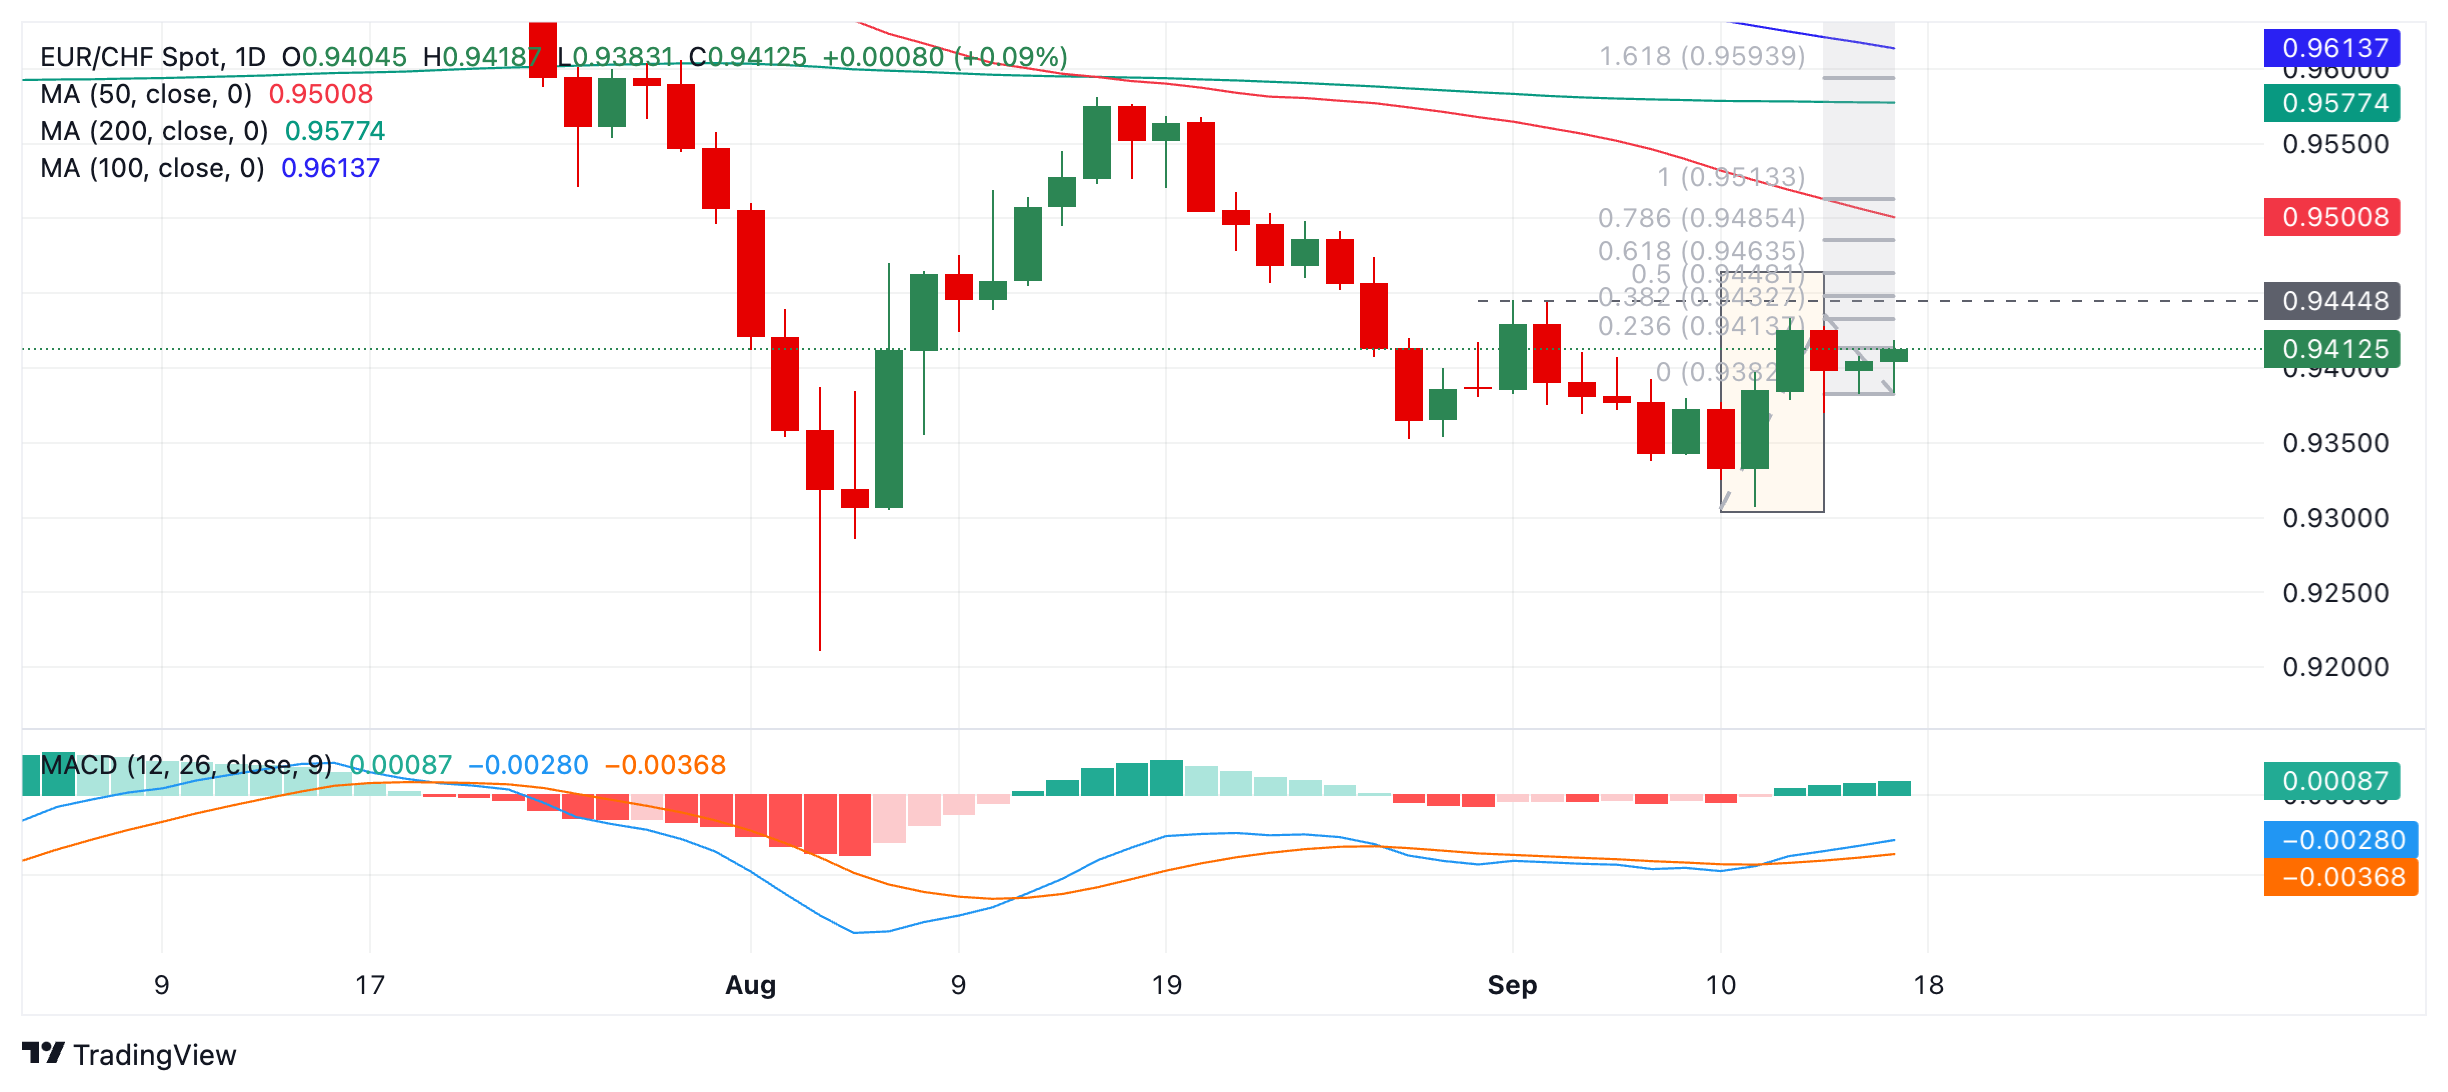
EUR/CHF formed a Bullish Engulfing Japanese candlestick pattern when it touched bottom on September 11. This occurs when price bottoms out, recovers and during the recovery day encloses – or "engulfs" – the whole of the preceding day's body in new day's body. The initial engulfing candle was followed by a confirmatory green follow-up day (shaded rectangle) adding confidence. This pattern is a short-term bullish signal.
The pair has pulled back slightly since peaking on September 12, however, the correction has been shallow so far and it is possible the pair will resume moving higher.
A break above the 0.9434 high (September 12) would confirm a continuation higher, with the next target at 0.9464, followed by 0.9513 in the case of a particularly bullish move.
A break below 0.9369 would invalidate the bullish hypothesis and suggest a more neutral or bearish outlook.
Germany’s ZEW index reflected a sharper than expected fall in current conditions and expectations in September, Scotiabank’s Chief FX Strategist Shaun Osborne notes.
Technicals remains bullish
“This index tends to be volatile, reflecting sentiment sometimes shaped by market volatility, but German investors are clearly concerned by signs of slowing growth. The EUR drifted back marginally from its intraday peak around the data’s release but remains comfortable trading above the 1.11 area.”
“The EUR’s progress through the ceiling of the downward-sloping consolidation range in development since the end of August suggests more gains in the near/medium term for spot. The range break out has triggered a bull flag pattern on the charts which suggests the recent uptrend in spot can resume.”
“The only caveat is that spot seems—so far—reluctant to push on higher towards 1.12. That is not too surprising, given the fundamental backdrop for markets this week. But it highlights the risk that a failure to develop gains risks dumping spot back to the lower end of the range in the upper 1.09s.”
- USD/CAD rises to near 1.3600 as soft Canadian CPI boosts BoC rate cut prospects.
- The US Retail Sales surprisingly rose by 0.1% in August, while investors expected it to have contracted.
- Investors expect the Fed to pivot to policy normalization from Wednesday’s meeting.
The USD/CAD pair climbs above the round-level resistance of 1.3600 in Tuesday’s North American session. The Loonie asset strengthens after the release of the soft Canadian Consumer Price Index (CPI) and upbeat United States (US) Retail Sales data for August.
The Canadian CPI report showed that the headline inflation returns to the bank’s target of 2%, grew slower than the estimates of 2.1% and the former release of 2.5%. Monthly headline CPI deflated by 0.2%, while economists expected it to rise by 0.1%, slower than 0.4% in July. The Bank of Canada’s (BoC) core CPI measure decelerated further to 1.5% from 1.7% in July. Soft inflation data would prompt market expectations for the BoC reducing interest rates further. The BoC has already cut its key borrowing rates by 75 basis points (bps) to 4.25%.
Meanwhile, the US Retail Sales rose by 0.1%, which was expected to have declined by 0.2%. The US Dollar Index (DXY), which tracks the Greenback’s value against six major currencies, recovers intraday losses and edges higher to near 100.80.
However, the near-term outlook of the US Dollar remains uncertain ahead of the Federal Reserve’s (Fed) monetary policy meeting on Wednesday. The Fed is widely anticipated to deliver its first-ever interest rate cut in more than four years as the central bank is concerned over slowing labor market conditions. However, traders remain divided over the likely Fed interest rate cut size.
According to the CME FedWatch tool, the probability of the Fed reducing interest rates by 50 bps to 4.75%-5.00% in September has increased sharply to 67% from 34% a week ago.
Investors will also focus on the Fed’s dot plot and economic projections. The Fed dot plot indicates the collective forecast Federal fund rate by all policymakers in the medium and long-term.
- Retail Sales in the US increased slightly in August.
- US Dollar Index stays in daily range below 101.00.
Retail Sales in the US rose 0.1% to $710.8 billion in August, the US Census Bureau reported on Tuesday. This reading followed the 1.1% increase recorded in July and came in better than the market expectation for a decline of 0.2%.
Retail Sales ex Autos expanded 0.1%, missing analysts' estimate for an increase of 0.2%.
"Total sales for the June 2024 through August 2024 period were up 2.3% from the same period a year ago," the press release read. "The June 2024 to July 2024 percent change was revised from up 1.0% to up 1.1%."
Market reaction
The US Dollar Index edged higher with the immediate reaction and was last seen rising 0.08% on the day at 100.78.
The Pound Sterling (GBP) is firm but little changed on the day, Scotiabank’s Chief FX Strategist Shaun Osborne notes.
UK CPI data tomorrow may show hot services prices
Aside from the Fed decision tomorrow, UK markets will have to negotiate UK August CPI. Headline inflation is expected to remain at 2.2% over the year but firm core prices and— especially—service sector inflation (expected to pick up to 5.6% in the August year, from 5.2%) suggest BoE policymakers will sit on their hands at Thursday’s policy decision and leave the policy rate at 5.00%.
“Sterling looks comfortable trading on a 1.32 handle on the charts. Cable gains are backed by solidly bullish trend strength oscillators which should mean limited scope for counter-trend corrections and ongoing pressure for gains to develop and retest the recent peak at 1.3266 (and beyond). Support is 1.3155/60.”
While the Fed’s guidance and policy decision tomorrow will signal whether the selloff in the USD over the past few sessions is overdone, the US election will set the scene for the greenback into year-end and through the start of the new year, Rabobank’s Senior FX Strategist Jane Foley notes.
The 1.12 level to be tough resistance for EUR/USD
“The inflation impulse is expected to be greater under a Trump presidency given his preference for more tariffs and his desire to make permanent most of the tax cuts he enacted during his first term. Looser fiscal conditions suggests that the Fed easing cycle could come to an abrupt halt next year.”
“Rabobank expects that a Harris election victory would allow for a more extended series of Fed rate cuts which would imply a softer profile for the greenback then under a Trump presidency. That said, the outlook for the USD crosses also depends on the relative performance of other currencies. It is hoped that this week’s BoJ policy meeting will offer some sense of the timing of further BoJ rate hikes.”
“In view of the contrasting BoJ and Fed policy directions, we continue to favour selling USD/JPY on rallies. By contrast the direction of interest rate policy at the ECB is the same as the Fed. Since it could be argued that a sharp rise in the value of the EUR vs. the USD could allow the ECB to step up the pace of its easing, we expect EUR/USD 1.12 to be tough resistance.”
- GBP/CAD is closing in on the upper channel line of a rising channel.
- It is likely to meet firm resistance at the line and price is diverging bearishly with MACD.
GBP/CAD is trending higher in a rising channel, however, it is close to touching the upper trendline of the channel where it is likely to meet firm resistance and will probably pull back down as a consequence.
GBP/CAD Daily Chart
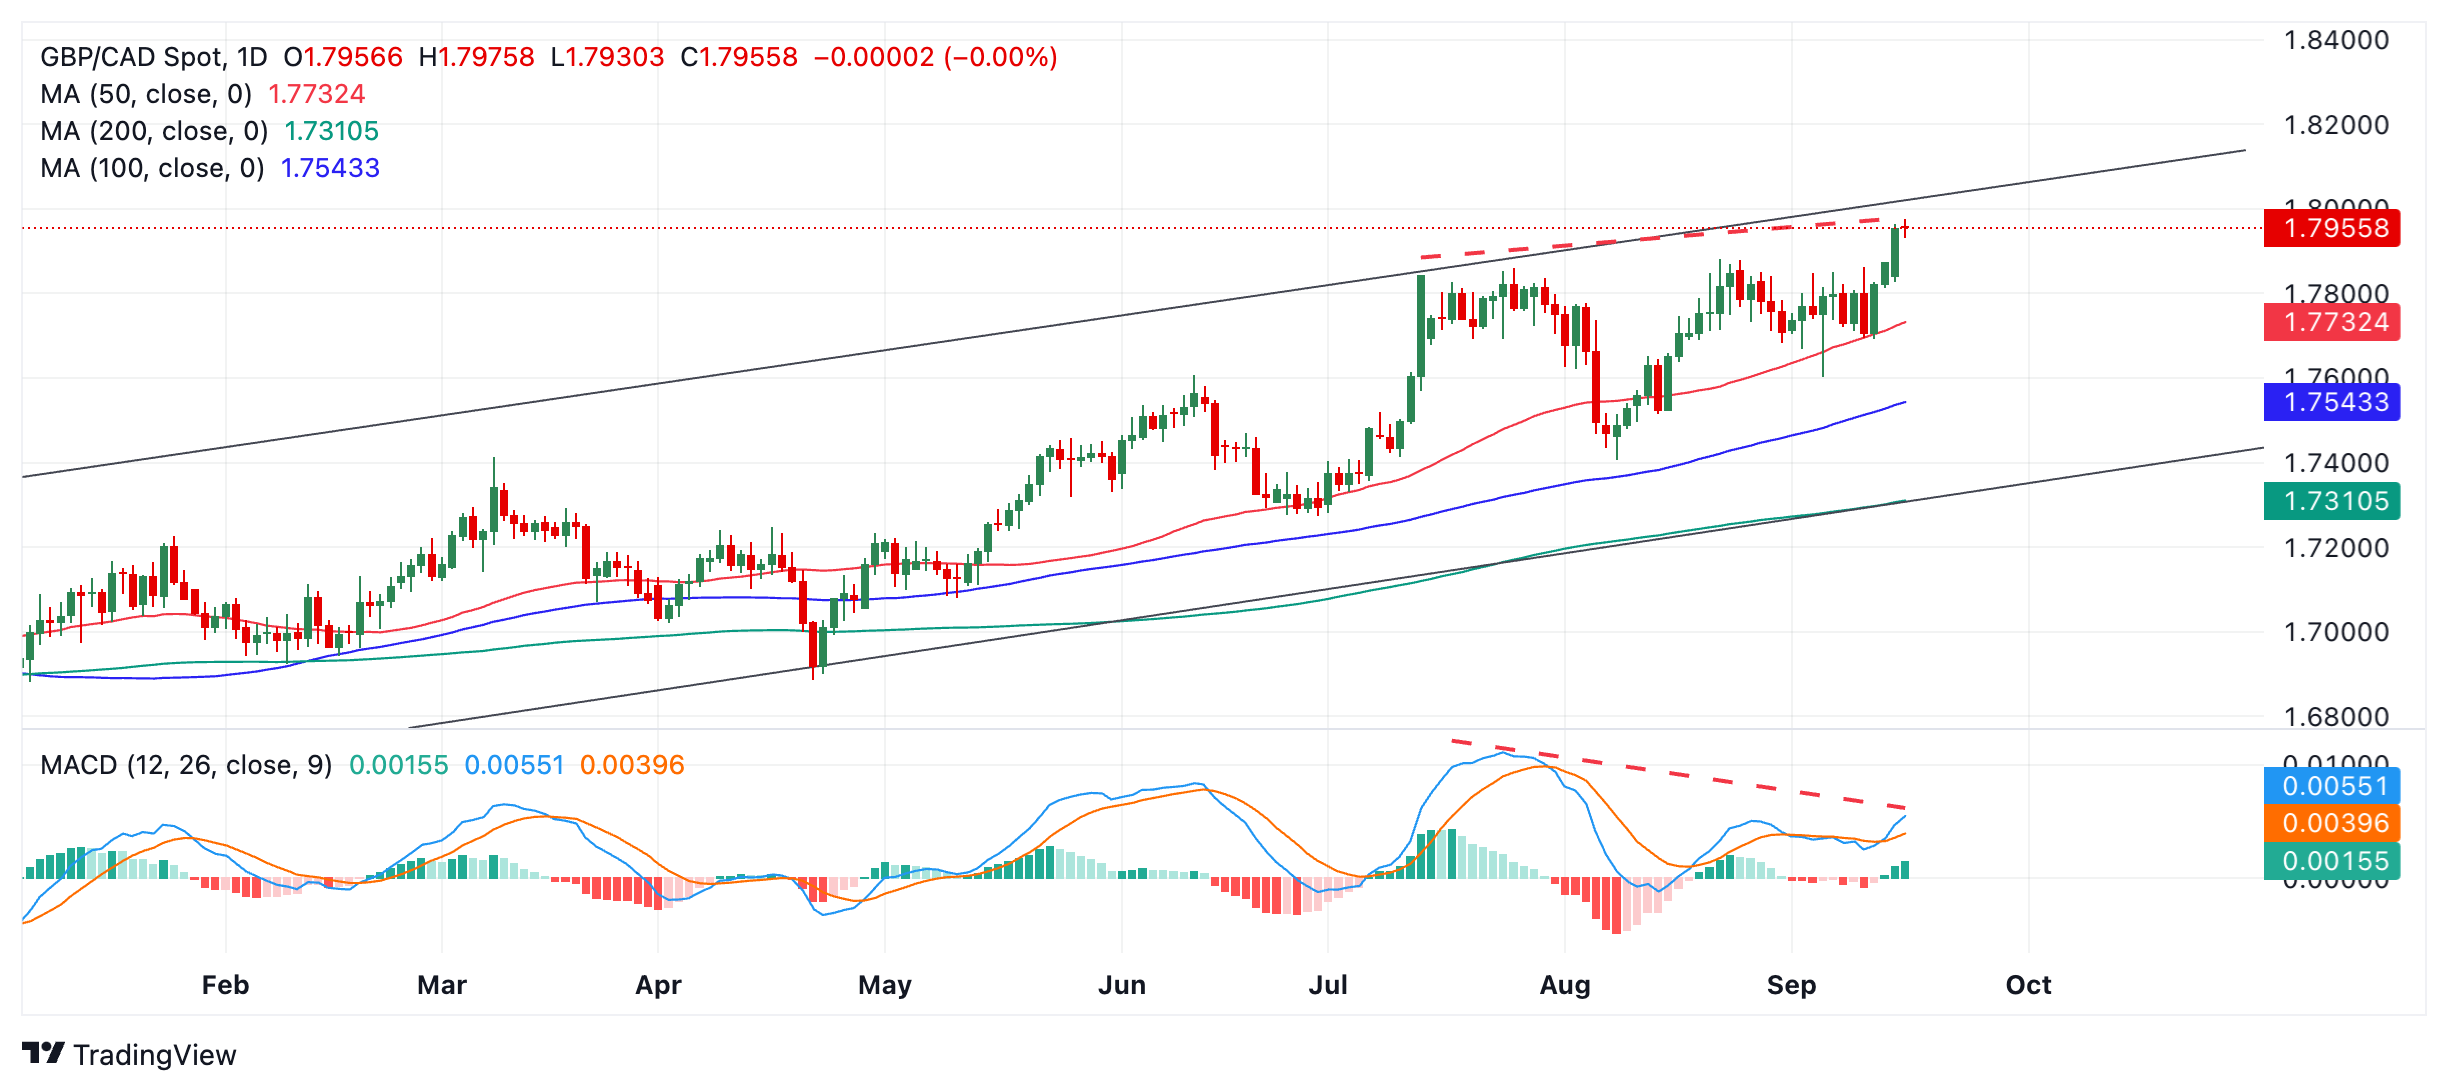
GBP/CAD is showing bearish divergence with the Moving Average Convergence Divergence (MACD) momentum indicator (red dashed lines). This means that although price has risen to a higher high compared to the July 12 high, MACD is actually lower than where it was on July 12. This is a bearish sign and suggests a higher chance of a pull back evolving.
Taken together with the looming overhead channel line it indicates a risk of price correcting back down within the channel. An initial target for a pull back would be the 50-day Simple Moving Average (SMA) at 1.7733.
Price itself has not formed a reversal pattern yet. If it does form a candlestick reversal pattern such as a Shooting Star, Bearish Engulfing or Hanging Man, for example, then that will be even more evidence of a correction unfolding.
The case for the Reserve Bank of India (RBI) to focus more on growth and less on inflation continues to strengthen, Commerzbank’s FX analyst Charlie Lay notes.
USD/INR can hold below 84.00 in the near term
“August inflation held below RBI’s mid-target of 4% for the second consecutive month at 3.7% yoy vs 3.6% in July. It has averaged 4.6% year-to-date, which is within RBI’s 2-6% target range. Core inflation, which strips out food and energy, also remained well-behaved. It was unchanged from July at 3.4% yoy in August. Year-to-date, it has moderated to 3.3%, down sharply from 5.1% in 2023, partly due to RBI’s restrictive stance.”
“Given that inflation is contained, signs of moderation in growth, albeit still relatively firm, and expectations of Fed rate cuts in the coming months, there is a case for RBI to consider shifting to a neutral stance. They could do so either in October or December. One other key determinant will be continued INR stability. INR has been the currency of stability in Asia this year.”
“In the first six months of the year, INR was down just 0.2% against the USD vs the average for Asian currencies of -4.2%. Since the end of June, Asian currencies have rallied sharply due to the weaker USD. They gained by 4.9% on average while INR is down 0.6% vs USD. INR has not experienced the sharp swings that the rest of the Asian currencies have, and this has been a deliberate policy from RBI. We could see this continuing and USD/INR could hold below the 84.00 level in the near term.”
The Canadian Dollar (CAD) is little changed ahead of the 8.30ET August CPI release, Scotiabank’s Chief FX Strategist Shaun Osborne notes.
CAD holds breath ahead of CPI data
“Headline inflation is forecast to be unchanged over the August month, pulling the year-on -year pace of price growth down to 2.1%. Core Median and Trim CPI measures are both called down 0.2 percentage points on the year to 2.2% and 2.5% respectively. Results in line with expectations will reflect the moderation in inflation tracking close to BoC expectations for Q3 so far, suggesting little need for the Bank to up the pace of easing.”
“Inevitably, a more aggressive move from the FOMC this week will spill over into domestic rate expectations to some degree but with 75bps of cuts already in the bag, BoC policymakers can remain measured. Note that Senior DG Rogers is speaking this evening at 18ET Meanwhile, a byelection loss in Montreal for the Liberal Party yesterday will increase pressure on the minority government in Ottawa as parliament returns from its summer break this week.”
“Spot remains range bound in the upper 1.35 area, with the market continuing to pivot around the 200-day MA (1.3587). The USD’s technical undertone remains firm but the lack of progress over the past week does suggest some loss of upward momentum. Short-term technical resistance remains 1.3635 (38.2% retracement of the USD’s August decline) and 1.3695 (50% Fibonacci). Support is 1.3550 (minor, last Monday’s low) and 1.3465.”
The US Dollar (USD) is flat to slightly softer on the session but retains a weak undertone overall, Scotiabank’s Chief FX Strategist Shaun Osborne notes.
USD remains soft but holds range
“FX movement is mostly limited as markets mark time ahead of today’s data releases and the FOMC on Wednesday. European stocks and US equity futures are firmer, with tech leading moderate gains, while bonds are slightly firmer. US Retail Sales data this morning are expected to decline 0.2% in April, weighed down by soft auto sales (ex-autos data is expected to be up 0.2%). August Industrial Production is forecast to rise 0.2% after July’s drop but sluggish PMI/ISM data suggest some risk of soft data.”
“Business Inventories and the NAHB Housing market Index are out at 10ET but are unlikely to be market moving. Soft Retail and IP data may weigh on the USD tone as markets continue to mull the likely scale of Fed easing. Swaps are pricing in 38bps of easing risk for Wednesday, leaning slightly in favour of a more aggressive cut but still somewhat equivocal pricing means that the outcome Wednesday will disappoint some sections of the market and will likely boost volatility in the short run at least.”
“The DXY retains a weak undertone on the charts, with the index pinned back against the recent range lows at 100.50/60. Technical trends and underlying momentum indicators are tilted bearish, suggesting more losses ahead for the index. DXY spread-based fair value is estimated at 99.6 this morning.”
- The US Dollar trades steady against most major currencies on Tuesday.
- Traders await Wednesday’s Fed decision, with limited reaction expected from the Retail Sales data.
- The US Dollar Index is under selling pressure near the yearly lows ahead of the central bank key event.
The US Dollar (USD) trades flat on Tuesday, with traders sitting on their hands ahead of Wednesday’s main event. The Federal Open Market Committee (FOMC) convenes on Tuesday to debate the upcoming US Federal Reserve’s (Fed) policy decision on Wednesday and how big the initial Fed’s interest rate cut will be. Then, the markets will finally hear from Fed Chairman Jerome Powell at the press conference.
On the economic data front, the Retail Sales are due on Tuesday. Although it is normally very market-moving, expect the reaction to be somewhat subdued, with traders waiting for the Fed meeting outcome before piling into a trade. The only scenario in which a substantial move could happen is if the Retail Sales contracted in August, which would support the case for the Fed to deliver a bigger 0.50% rate cut.
Daily digest market movers: Retail Sales do not create waves
- Retail Sales data for August are due to come out at 12:30 GMT. Monthly Retail Sales are expected to increase by 0.2% after growing by 1.0% in July. Sales excluding Cars and Transportation are expected to marginally move by 0.3%, from 0.4% the prior month.
- At 13:15 GMT, Industrial Production data for August is expected to turn flat at 0.0%, out of contraction of 0.6% in July.
- At 14:00 GMT, Federal Reserve Bank of Dallas President Lorie Logan will deliver welcoming remarks at the Eleventh District Banking Conference in Dallas. Logan isn't expected to talk about monetary policy because the Fed is within its blackout period ahead of its meeting on Wednesday.
- At that same time, 14:00 GMT, the National Association of Home Builders (NAHB) will release September’s Housing Market Index, with a steady 40 expected against the previous reading of 39.
- Japanese equities started their week after the bank holiday on Monday. Both the Topix and the Nikkei are down over 0.50%. European and US equities are looking in another direction and are heading in the green.
- The CME Fedwatch Tool shows a further declining chance of a 25 basis points (bps) interest rate cut by the Fed on Wednesday, by only 33.0%, further down from the 66% seen a week ago. Meanwhile, markets have increased the chances of a 50 bps cut to 67.0%. For the November 7 meeting, another 25 bps cut (if September is a 25 bps cut) is expected by 18.0%, while there is a 52.3% chance that rates will be 75 bps (25 bps + 50 bps) and a 29.7% probability of rates being 100 (25 bps + 75 bps) basis points lower compared to current levels.
- The US 10-year benchmark rate trades at 3.61%, nearing the 15-month low of 3.60%.
Economic Indicator
Retail Sales (MoM)
The Retail Sales data, released by the US Census Bureau on a monthly basis, measures the value in total receipts of retail and food stores in the United States. Monthly percent changes reflect the rate of changes in such sales. A stratified random sampling method is used to select approximately 4,800 retail and food services firms whose sales are then weighted and benchmarked to represent the complete universe of over three million retail and food services firms across the country. The data is adjusted for seasonal variations as well as holiday and trading-day differences, but not for price changes. Retail Sales data is widely followed as an indicator of consumer spending, which is a major driver of the US economy. Generally, a high reading is seen as bullish for the US Dollar (USD), while a low reading is seen as bearish.
Read more.Next release: Tue Sep 17, 2024 12:30
Frequency: Monthly
Consensus: -0.2%
Previous: 1%
Source: US Census Bureau
Retail Sales data published by the US Census Bureau is a leading indicator that gives important information about consumer spending, which has a significant impact on the GDP. Although strong sales figures are likely to boost the USD, external factors, such as weather conditions, could distort the data and paint a misleading picture. In addition to the headline data, changes in the Retail Sales Control Group could trigger a market reaction as it is used to prepare the estimates of Personal Consumption Expenditures for most goods.
US Dollar Index Technical Analysis: Range bound again
The US Dollar Index (DXY) respects the boundaries in which it has been trading during the last month, nearly the yearly lows. A very small bounce is noticeable on the chart, though it is not really running away from that lower band. The risk is that the DXY could snap below it when the Fed delivers its rate cut.
The upper level of the recent range is 101.90. Further up, a steep 1.2% uprising would be needed to get the index to 103.18, with the 55-day Simple Moving Average (SMA) at 102.89 on the way. The next tranche up is very misty, with the 200-day SMA at 103.81 and the 100-day SMA at 103.88, just ahead of the big 104.00 round level.
On the downside, 100.62 (the low from December 28, 2023) holds strong and has already made the DXY rebound two times in recent weeks. Should it break, the low from July 14, 2023, at 99.58, will be the next level to look out for. If that level gives way, early levels from 2023 are coming in near 97.73.
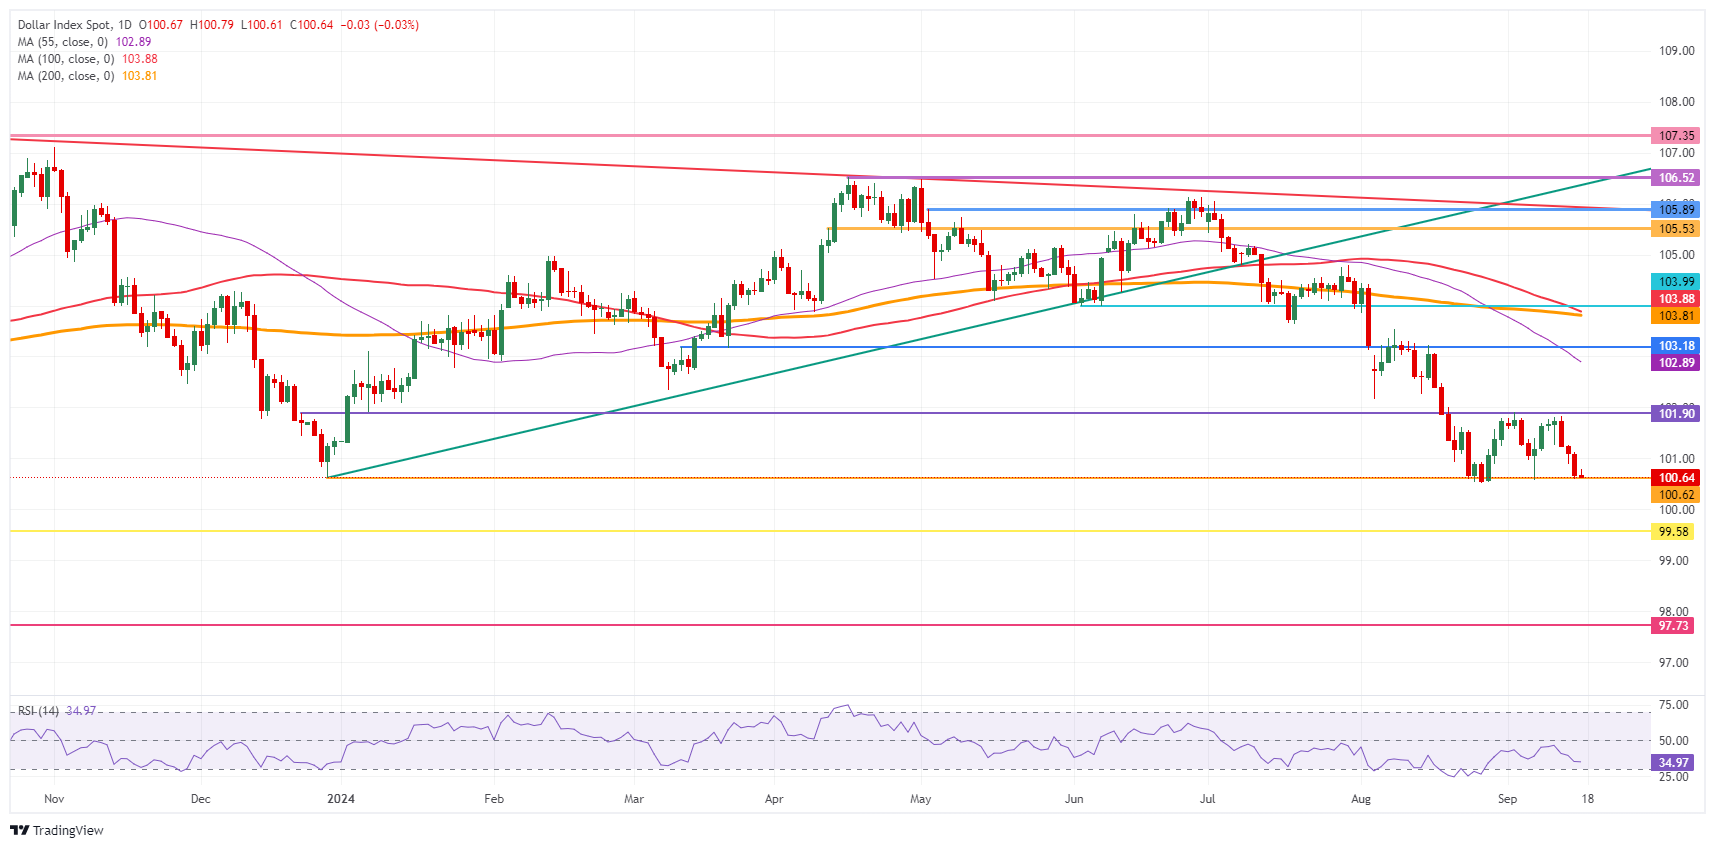
US Dollar Index: Daily Chart
US Dollar FAQs
The US Dollar (USD) is the official currency of the United States of America, and the ‘de facto’ currency of a significant number of other countries where it is found in circulation alongside local notes. It is the most heavily traded currency in the world, accounting for over 88% of all global foreign exchange turnover, or an average of $6.6 trillion in transactions per day, according to data from 2022. Following the second world war, the USD took over from the British Pound as the world’s reserve currency. For most of its history, the US Dollar was backed by Gold, until the Bretton Woods Agreement in 1971 when the Gold Standard went away.
The most important single factor impacting on the value of the US Dollar is monetary policy, which is shaped by the Federal Reserve (Fed). The Fed has two mandates: to achieve price stability (control inflation) and foster full employment. Its primary tool to achieve these two goals is by adjusting interest rates. When prices are rising too quickly and inflation is above the Fed’s 2% target, the Fed will raise rates, which helps the USD value. When inflation falls below 2% or the Unemployment Rate is too high, the Fed may lower interest rates, which weighs on the Greenback.
In extreme situations, the Federal Reserve can also print more Dollars and enact quantitative easing (QE). QE is the process by which the Fed substantially increases the flow of credit in a stuck financial system. It is a non-standard policy measure used when credit has dried up because banks will not lend to each other (out of the fear of counterparty default). It is a last resort when simply lowering interest rates is unlikely to achieve the necessary result. It was the Fed’s weapon of choice to combat the credit crunch that occurred during the Great Financial Crisis in 2008. It involves the Fed printing more Dollars and using them to buy US government bonds predominantly from financial institutions. QE usually leads to a weaker US Dollar.
Quantitative tightening (QT) is the reverse process whereby the Federal Reserve stops buying bonds from financial institutions and does not reinvest the principal from the bonds it holds maturing in new purchases. It is usually positive for the US Dollar.
The US Dollar (USD) is likely to trade in a range between 7.0900 and 7.1100. In the longer run, USD is likely to trade in a sideways range of 7.0700/7.1300, UOB Group FX strategists Quek Ser Leang and Lee Sue Ann note.
Rangebound within the 7.0900/7.1100 range in short term
24-HOUR VIEW: “Yesterday, USD traded between 7.0882 and 7.1046, closing largely unchanged at 7.0983 (-0.01%). There has been no increase in either downward or upward momentum. Today, USD is likely to trade in a range, probably between 7.0900 and 7.1100.”
1-3 WEEKS VIEW: “USD traded sideways over the past week or so. Momentum indicators are mostly neutral, and further sideways trading seems likely, expected to be in a range of 7.0700/7.1300.”
- EUR/GBP has broken out of a channel and closed below the lower channel line.
- It will probably continue falling to bearish targets.
EUR/GBP has broken out of the underside of a shallow rising channel. It has closed below the channel line suggesting the breakout will probably follow-through and go lower, possibly to a target at 0.8406.
EUR/GBP Daily Chart
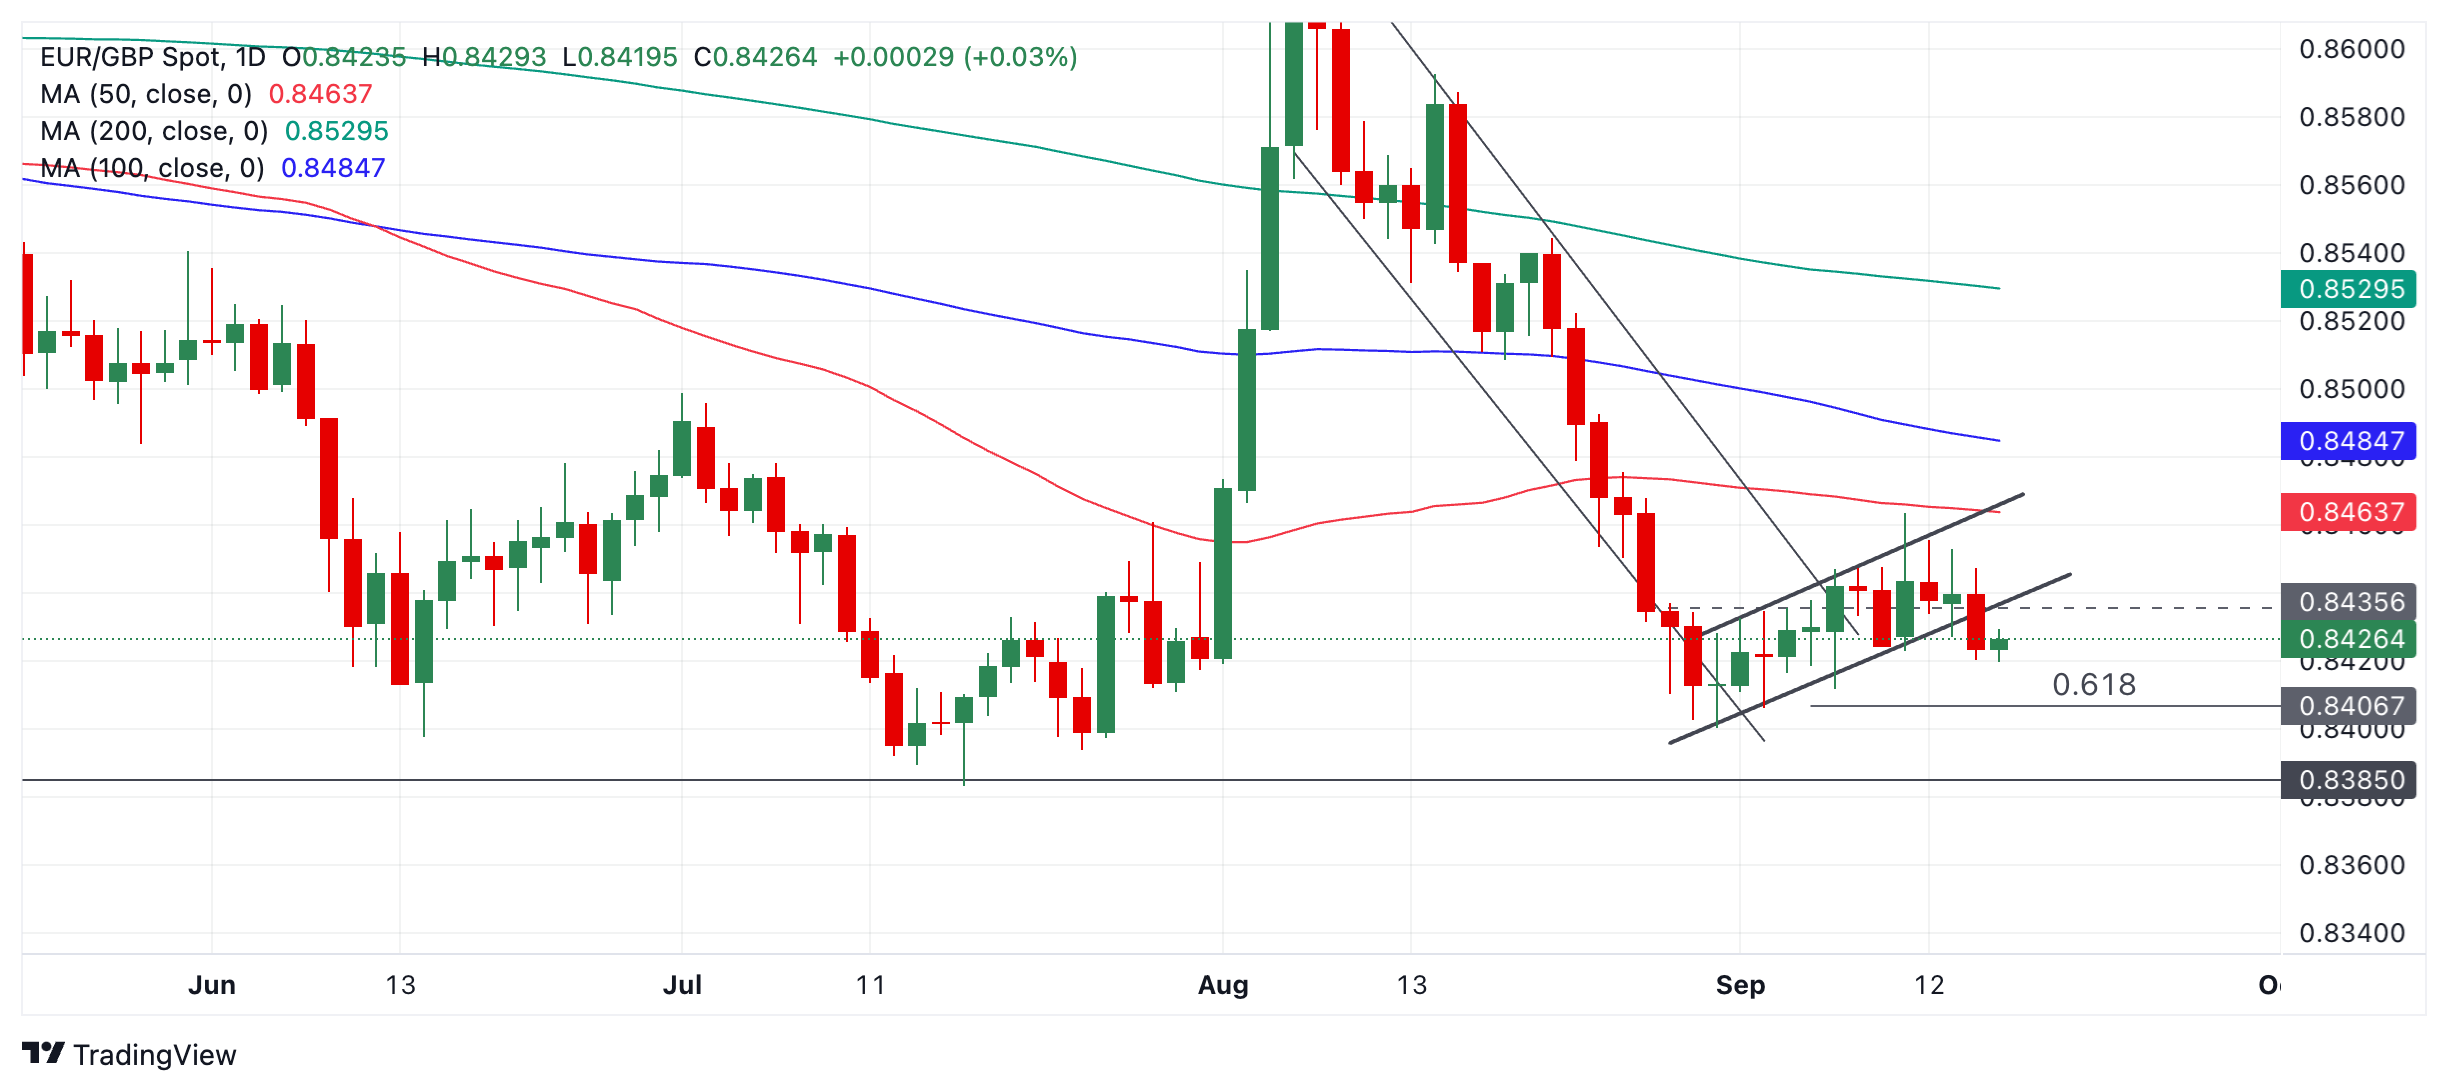
It is possible the bearish bias evident during the steep fall in August is reaserting itself. A break below 0.8419 would provide confirmation of further downside toward a target at 0.8406, the 0.618 Fib extension of the height of the rising channel lower. Below that it is possible prices could fall to support at 0.8385.
Alternatively, it is still possible – though unlikely – that the break proves false. If so, price could recover back inside the shallow rising channel and extend, with circa 0.8460 as a possible upside target thereafter.
What is interesting about today's Canadian inflation figures is that they could provide an indication of how much further the Bank of Canada (BoC) could lower its rates. That further cuts are likely was clear from the BoC's statement at the last meeting. After all, in his opening remarks at the last meeting, central bank governor Tiff Macklem said that further rate cuts can be expected as long as inflation continues to weaken as expected, Commerzbank’s FX analyst Antje Praefcke notes.
Movements in the CAD are likely to be limited
“As a reminder, the BoC has cut rates by 25 basis points at each of the last three meetings, leaving the key rate at 4.25%. We see a good chance that the BoC will cut by a further 25bp at each of the last two remaining interest rate meetings this year, leaving the key rate at 3.75% at the end of the year. The market is even a bit more aggressive in its expectations and sees a chance that the BoC could even take a larger step.”
“In addition to the comments by the central bank governor, this may be due to the fact that the labor market report for August, which was published after the last BoC meeting, was quite weak: the unemployment rate rose further to 6.6%. At the same time, the ISM index for the manufacturing sector fell below the 50 mark in August, which could mean weaker growth for the second half of the year if the downward trend continues.”
“Inflation is likely to have continued to fall in August, maintaining the picture of further falling key rates in Canada. If the headline and core rates fall less than expected, the market could price out some of the current rate cut expectations and the CAD could appreciate somewhat in the short term. If the figures surprise on the downside, the market may feel confirmed in its view. However, movements in the CAD are likely to be limited, except for a possible brief back and forth immediately after the figures.”
- USD/CHF remains feeble near 0.8450 as traders raise the Fed 50 bps interest rate cut for Wednesday’s meeting.
- Investors expect the Fed to cut interest rates by 100 bps this year.
- The SNB is expected to cut its key borrowing rates for the third time in a row.
The USD/CHF pair extends its losing streak for the fourth trading session on Tuesday. The Swiss Franc asset remains sluggish near 0.8450 as the US Dollar (USD) continues to face selling pressure due to growing market expectations that the Federal Reserve (Fed) will deliver a 50 basis points (bps) interest rate cut on Wednesday.
The prospects for the Fed to begin reducing interest rates aggressively have been prompted by a sharp decline in the annual United States (US) headline Producer Price Index (PPI) data for August released last week. The underlying inflation decelerated at a faster-than-expected pace to 1.7%.
Investors will also focus on the Fed’s dot plot and economic projections. The Fed dot plot indicates where policymakers see the Federal fund rate heading in the medium and long term. According to the CME FedWatch tool, the Fed will cut interest rates by 100 bps by year-end.
Meanwhile, the Swiss Franc (CHF) remains firm even though market participants see the Swiss National Bank (SNB) reducing interest rates again later this month. The SNB has already cut its key borrowing rates by 50 bps this year to 1.25%.
USD/CHF remains on track toward the horizontal support plotted from the 28 December 2023 low of 0.8333 on a daily timeframe. The near-term and broader-term outlooks of the Swiss Franc asset remain bearish as all short-to-long-term Exponential Moving Averages (EMAs) are declining.
The 14-day Relative Strength Index (RSI) oscillates in the bearish range of 20.00-40.00, suggesting that a strong bearish momentum is intact.
More downside would appear if the asset breaks below the round-level support of 0.8400, which would drag the major towards the 28 December 2023 low of 0.8333 and round-level support of 0.8300.
On the flip side, a recovery move above the 10-day high of 0.8540 will drive the asset toward the round-level resistance of 0.8600, followed by the August 20 high of 0.8632.
USD/CHF daily chart

Swiss Franc FAQs
The Swiss Franc (CHF) is Switzerland’s official currency. It is among the top ten most traded currencies globally, reaching volumes that well exceed the size of the Swiss economy. Its value is determined by the broad market sentiment, the country’s economic health or action taken by the Swiss National Bank (SNB), among other factors. Between 2011 and 2015, the Swiss Franc was pegged to the Euro (EUR). The peg was abruptly removed, resulting in a more than 20% increase in the Franc’s value, causing a turmoil in markets. Even though the peg isn’t in force anymore, CHF fortunes tend to be highly correlated with the Euro ones due to the high dependency of the Swiss economy on the neighboring Eurozone.
The Swiss Franc (CHF) is considered a safe-haven asset, or a currency that investors tend to buy in times of market stress. This is due to the perceived status of Switzerland in the world: a stable economy, a strong export sector, big central bank reserves or a longstanding political stance towards neutrality in global conflicts make the country’s currency a good choice for investors fleeing from risks. Turbulent times are likely to strengthen CHF value against other currencies that are seen as more risky to invest in.
The Swiss National Bank (SNB) meets four times a year – once every quarter, less than other major central banks – to decide on monetary policy. The bank aims for an annual inflation rate of less than 2%. When inflation is above target or forecasted to be above target in the foreseeable future, the bank will attempt to tame price growth by raising its policy rate. Higher interest rates are generally positive for the Swiss Franc (CHF) as they lead to higher yields, making the country a more attractive place for investors. On the contrary, lower interest rates tend to weaken CHF.
Macroeconomic data releases in Switzerland are key to assessing the state of the economy and can impact the Swiss Franc’s (CHF) valuation. The Swiss economy is broadly stable, but any sudden change in economic growth, inflation, current account or the central bank’s currency reserves have the potential to trigger moves in CHF. Generally, high economic growth, low unemployment and high confidence are good for CHF. Conversely, if economic data points to weakening momentum, CHF is likely to depreciate.
As a small and open economy, Switzerland is heavily dependent on the health of the neighboring Eurozone economies. The broader European Union is Switzerland’s main economic partner and a key political ally, so macroeconomic and monetary policy stability in the Eurozone is essential for Switzerland and, thus, for the Swiss Franc (CHF). With such dependency, some models suggest that the correlation between the fortunes of the Euro (EUR) and the CHF is more than 90%, or close to perfect.
- Crude Oil edges down, partly reversing Monday’s gains.
- Oil fails to rebound sharply despite markets pricing in a large Fed rate cut and tropical storm Francine wipes out 3.6m barrels of output.
- The US Dollar Index remains under pressure, trading at the lower boundary of September’s bandwidth.
Crude Oil falls on Tuesday, hovering around $68 and partly reversing Monday’s rally, which stalled close to the $70 handle. The decline comes even as Oil is supported by some bullish drivers coming into play for this week. The first element is the numbers from tropical storm Francine’s passage in the Gulf region as the evacuation of the area will account for nearly 3.6 million barrels less in oil output for last week.
Another driver that should support prices is the growing expectations that the US Federal Reserve (Fed) will opt for a large 50-basis-points interest-rate cut on Wednesday. This helps Crude Oil prices higher in the assumption that a bigger rate cut would give a brief push to the economic activity, which in turn would benefit Oil demand.
At the time of writing, Crude Oil (WTI) trades at $68.78 and Brent Crude at $72.01.
Oil news and market movers: Some short-term reprieve
- More than 12% of crude output in the US Gulf and 16% of Natural Gas output remain offline after tropical storm Francine hit the area, MT Newswires reports. Bloomberg reports that Francine has wiped out roughly 3.6 million barrels of Oil output last week, with lingering disruptions still in play for this week.
- The restart of a key Iraqi Oil pipeline which was already closed for over a year is facing more delays with disagreements over costs, the nation’s prime minister Mohammed Shia AL-Sudani said. In this case, bad news is good news, as the pipeline outage is helping Iraq to uphold its OPEC production quota, Reuters reports.
- At 20:30 GMT, the weekly stockpile numbers will come out from the American Petroleum Institute for the week ending September 13. Analysts expect a small decline of 100,000 barrels, much less than the drawdown of 2.79 million barrels seen a week earlier.
Oil Technical Analysis: A breather for Crude Oil
Crude Oil price could be catching a bid with recent data about tropical storm Francine providing some short-term tailwinds for the commodity. The question, however, is how much further the reprieve can go. With $70.00 in reach, at least one attempt to pop above the big figure level should be possible.
As already mentioned, the first level to watch on the upside remains $70.00. Once there has been a daily close above it, $71.46 gets back on the table as the next level to look out for. Ultimately, a return to $75.27 is still possible, but would likely come after a seismic shift in current balances.
Support should be very close by at $68.19, which was the triple bottom back in the summer of 2023. The next level further down the line is $64.38, the low from March and May 2023. Should that level face a second test and snap, $61.65 becomes a target, with of course $60.00 as a psychologically big figure just below it, at least tempting to be tested.
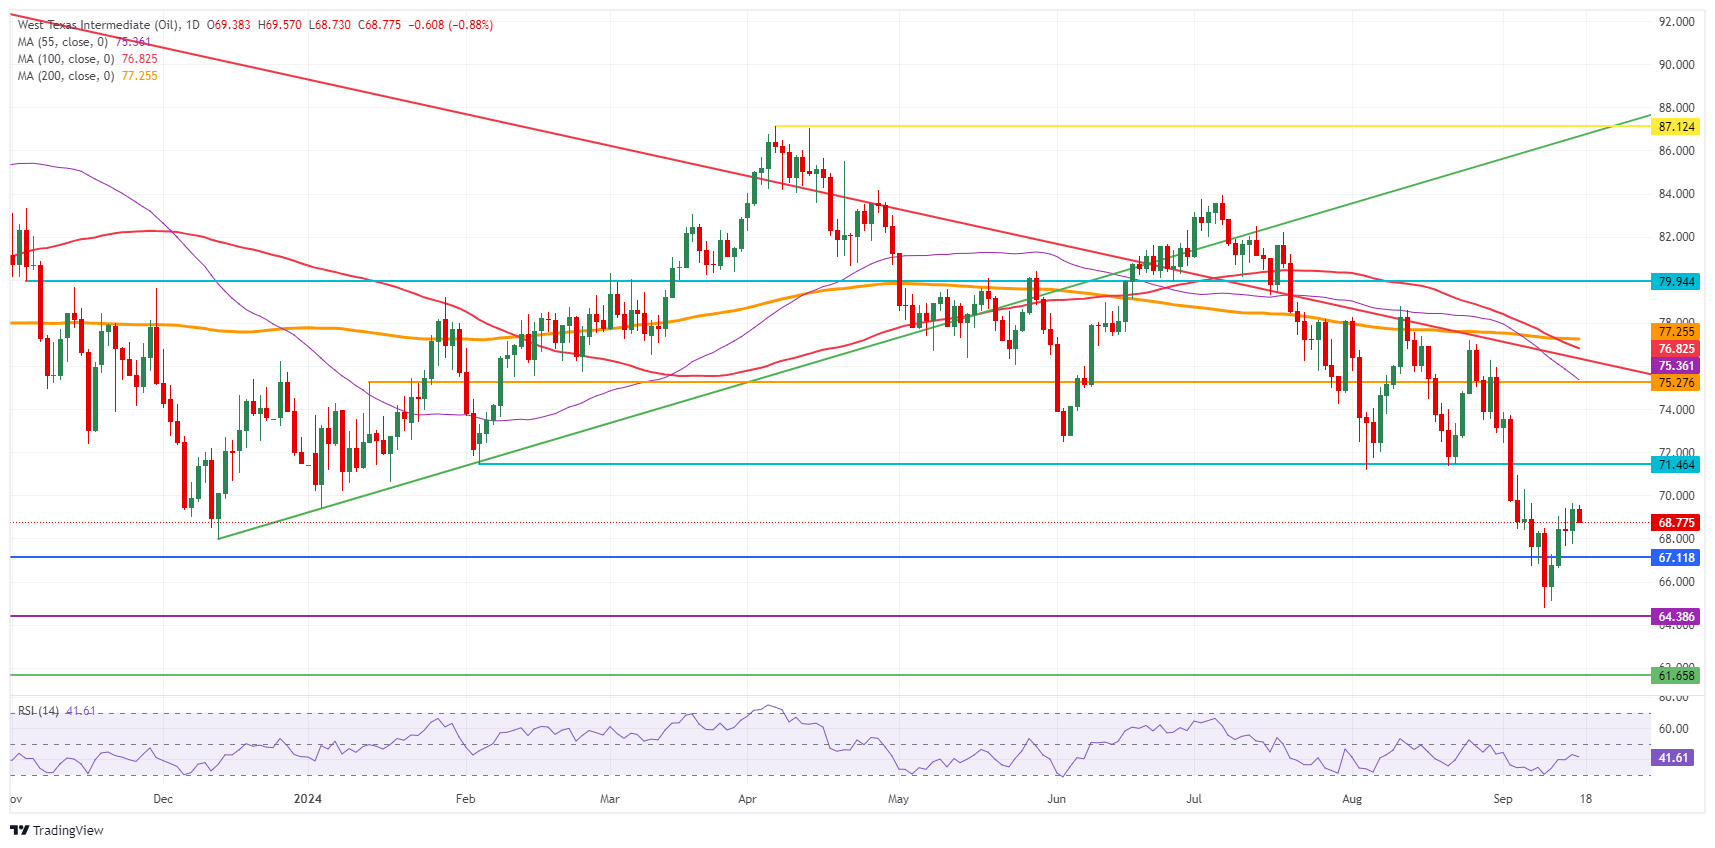
US WTI Crude Oil: Daily Chart
WTI Oil FAQs
WTI Oil is a type of Crude Oil sold on international markets. The WTI stands for West Texas Intermediate, one of three major types including Brent and Dubai Crude. WTI is also referred to as “light” and “sweet” because of its relatively low gravity and sulfur content respectively. It is considered a high quality Oil that is easily refined. It is sourced in the United States and distributed via the Cushing hub, which is considered “The Pipeline Crossroads of the World”. It is a benchmark for the Oil market and WTI price is frequently quoted in the media.
Like all assets, supply and demand are the key drivers of WTI Oil price. As such, global growth can be a driver of increased demand and vice versa for weak global growth. Political instability, wars, and sanctions can disrupt supply and impact prices. The decisions of OPEC, a group of major Oil-producing countries, is another key driver of price. The value of the US Dollar influences the price of WTI Crude Oil, since Oil is predominantly traded in US Dollars, thus a weaker US Dollar can make Oil more affordable and vice versa.
The weekly Oil inventory reports published by the American Petroleum Institute (API) and the Energy Information Agency (EIA) impact the price of WTI Oil. Changes in inventories reflect fluctuating supply and demand. If the data shows a drop in inventories it can indicate increased demand, pushing up Oil price. Higher inventories can reflect increased supply, pushing down prices. API’s report is published every Tuesday and EIA’s the day after. Their results are usually similar, falling within 1% of each other 75% of the time. The EIA data is considered more reliable, since it is a government agency.
OPEC (Organization of the Petroleum Exporting Countries) is a group of 13 Oil-producing nations who collectively decide production quotas for member countries at twice-yearly meetings. Their decisions often impact WTI Oil prices. When OPEC decides to lower quotas, it can tighten supply, pushing up Oil prices. When OPEC increases production, it has the opposite effect. OPEC+ refers to an expanded group that includes ten extra non-OPEC members, the most notable of which is Russia.
The US Dollar (USD) is likely to trade in a sideways range of 140.10-141.40 against the Japanese Yen (JPY), UOB Group FX strategists Quek Ser Leang and Lee Sue Ann note. In the longer run, downward momentum has not increased much, they say, adding that the USD could continue to weaken but that it remains to be seen if 139.00 is within reach.
USD could continue to weaken towards 139.00
“USD fell below 140.00 yesterday, reaching a 14-month low of 139.56. USD rebounded strongly from the low to close slightly lower at 140.60 (-0.16%). The rebound in severely oversold conditions and slowing momentum indicates that instead of continuing to weaken, USD is more likely to trade sideways. Expected range for today: 140.10-141.40.”
“While USD fell and broke below the round-number support of 140.00 yesterday (low of 139.56), downward momentum has not increased much. However, the weakness has not stabilised, and USD could continue to weaken even though it remains to be seen if 139.00 is within reach this time round. On the upside, a breach of 142.20 would indicate that the weakness has stabilised.”
It is still much too early for an SNB outlook as the Swiss monetary authorities will not decide on the interest rate level until September 26, Commerzbank’s Head of FX and Commodity Research Ulrich Leuchtmann notes. An interest rate move seems a foregone conclusion; the only question seems to be by how much, he says.
Higher EUR/CHF exchange rates are coming
“Both the ECB and the SNB are currently lowering their key rates. What is unusual about the status quo is that the SNB is ahead. It started cutting interest rates earlier than the ECB and is expected to deliver its third interest rate cut next week, while the ECB only lowered its deposit rate for the second time last week. The general CHF story, by which the franc is less affected by interest rate cuts than other currencies, is therefore not very convincing at the moment. This would of course be the case in particular if the SNB were to make a 50-basis-point move.”
“In Switzerland, nobody seriously expects a return to negative interest rate policy for Switzerland. Expectations of interest rate cuts are therefore naturally limited. But exactly therefore they are realistic to a large extent. Not only did the global inflation shock only reach Switzerland in homeopathic doses, but this little inflation has already evaporated. Hardly anyone is likely to assess the risk of inflation being too high as higher than the risk of it being too low.”
“This means that at the moment, expectations of the ECB lowering interest rates are weighing on the EUR/CHF exchange rate. We believe that these expectations will largely disappear. And that is why we believe that higher EUR/CHF exchange rates await us in the coming quarters. Regardless of whether the SNB cuts 25 or 50 basis points next week.”
- AUD/USD has broken above a trendline and established a new short-term uptrend.
- It will probably extend to the August highs.
AUD/USD has begun a new leg higher after bottoming out on September 11. This new leg has broken above a key trendline for the correction of the August rally – a bullish sign – which, amongst other things, suggests it is now in a short-term uptrend.
AUD/USD Daily Chart

It is a principle of technical analysis that “the trend is your friend” which suggests the Aussie is likely to continue higher. It will probably match or almost match the 0.6824 August 29 high. The resistance level at 0.6799 ( July high) might, however, slow it down along the way.
Momentum, as measured by the Relative Strength Index (RSI) is mirroring price, a fact that is supportive of the current mini-rally.
The New Zealand (NZD) is unlikely to rise much further, it is more likely to trade in a range between 0.6160 and 0.6205. In the longer run, NZD is likely to trade in a broader 0.6135/0.6235 range, UOB Group FX strategists Quek Ser Leang and Lee Sue Ann note.
Likely to trade in a broader 0.6135/0.6235
24-HOUR VIEW: “Yesterday, NZD rose, reaching a high of 0.6202. While AUD closed on a strong note tat 0.6201, there has been no significant increase in momentum, and NZD is unlikely to rise much further. Today, NZD is more likely to trade in a range, probably between 0.6160 and 0.6205.”
1-3 WEEKS VIEW: “Last week, NZD dipped to 0.6107 before rebounding. The rebound lacks momentum and is likely part of a range trading phase. For the time being, NZD is likely to trade in a 0.6135/0.6235 range.”
- EUR/JPY holds the recovery move from an almost six-week low of 155.15.
- The BoJ is expected to leave interest rates unchanged at 0.25% on Friday but will deliver hawkish guidance.
- ECB officials refrain from committing a pre-defined interest rate cut path.
The EUR/JPY pair holds a slight recovery move above 156.00 in Tuesday’s European session from a fresh, almost six-week low of 155.15 recorded on Monday. The cross holds recovery for now but its outlook remains uncertain amid growing speculation that the Bank of Japan (BoJ) will raise interest rates further this year.
The BoJ has already raised interest rates to 0.25% in its last three meetings. Analysts at Standard Chartered see the BoJ interest rates rising to 0.5% by the year-end. The confidence of market experts has increased due to inflation remaining above 2% for the past 21 months.
In the monetary policy meeting on Friday, the BoJ is expected to leave key borrowing rates unchanged at their current levels.
Meanwhile, the Euro (EUR) gains as market speculation for the European Central Bank (ECB) delivering a consecutive interest rate cut in the October meeting has waned. The comments from ECB Governing Council member Peter Kazimir on Monday indicated that the central bank will wait for more good data to meet their projections before easing the monetary policy further.
“The ECB needed to be sure that incoming data confirmed its projections, otherwise policymakers might regret rushing to cut borrowing costs before inflation has been sustainably defeated,” Kazimir said, Reuters reported.
On the economic data front, the Eurozone ZEW Survey – Economic Sentiment – which measures institutional investor sentiment – has declined to 9.3 in September, the lowest level seen since November 2023. The sentiment data was expected to fall slightly to 17.6 from 17.9 in August.
Economic Indicator
BoJ Interest Rate Decision
The Bank of Japan (BoJ) announces its interest rate decision after each of the Bank’s eight scheduled annual meetings. Generally, if the BoJ is hawkish about the inflationary outlook of the economy and raises interest rates it is bullish for the Japanese Yen (JPY). Likewise, if the BoJ has a dovish view on the Japanese economy and keeps interest rates unchanged, or cuts them, it is usually bearish for JPY.
Read more.Next release: Fri Sep 20, 2024 03:00
Frequency: Irregular
Consensus: -
Previous: 0.15%
Source: Bank of Japan
Canada’s inflation is expected to slow further today. The consensus for August headline CPI is 2.1%, essentially at the Bank of Canada’s target mid-point, while all core measures of inflation are seen decelerating by around 0.2%YoY. Remember that core inflation is already well within the BoC’s 2-3% target band, and we believe today’s print will do very little to discourage the ongoing dovish bets on BoC easing, ING’s FX strategist Francesco Pesole notes.
CAD remains less attractive than other high-beta currencies
“If growing expectations for a 50bp Fed cut largely stem from the notion that the FOMC is starting its easing cycle too late, the same cannot be said for the BoC, whose policy rate has already been cut three times and is sitting at 5.25%, 125bp below the Fed funds rate. However, as it often happens, Fed pricing has a huge influence on BoC pricing, and markets have recently moved to price in 75bp worth of cuts in Canada over the next two meetings.”
“The September policy announcement is next week, and we suspect the BoC may opt for a 25bp even if the Fed cuts 50bp tomorrow and Canada’s inflation slows as expected today. We cannot exclude that this will be followed by a 50bp reduction at the December meeting, but we continue to favour 25bp steps by the BoC.”
“Accordingly, we think that the Canadian dollar can benefit from some hawkish repricing over the coming months. USD/CAD is struggling to make its way steadily below 1.35 and recently jumped back to 1.36 as oil prices fell. Our view remains that Fed easing can ultimately help a multi-quarter USD/CAD decline materialise, but for the moment some stabilisation is more likely, as CAD remains less attractive than many other high-beta currencies.”
- EUR/USD rises to near 1.1150 as firm Fed large rate cut prospects weigh on the US Dollar.
- The Fed is expected to cut interest rates by 100 bps by year-end.
- ECB policymakers push back against market October rate cut prospects.
EUR/USD extends Monday’s upside to near the crucial resistance of 1.1150 in Tuesday’s European session. The major currency pair exhibits strength at the expense of the US Dollar (USD), which is weighed by increasing bets that the Federal Reserve (Fed) will opt for a large interest-rate cut on Wednesday.
The US Dollar trades near a year-to-date-low as the market speculation for a large Fed rate cut has been strengthened after softer-than-expected Producer Price Index (PPI) data for August and media reports pointing that officials keep the door open to such a cut. The US Dollar Index (DXY), which tracks the Greenback’s value against six major currencies, hovers near 100.50.
According to the CME FedWatch tool, the probability of the Fed reducing interest rates by 50 basis points (bps) to 4.75%-5.00% has increased sharply to 69% from 34% a week ago. Apart from the Fed’s interest rate decision, investors will also focus on the dot plot and economic projections.
The Fed’s dot plot indicates where policymakers see the federal fund rate heading in the medium and long term. Traders see the Fed cutting interest rates by 100 bps to 4.25%-4.50% by year-end, suggesting that the central bank will opt for a large interest rate cut in one of three meetings remaining this year.
In Tuesday’s session, investors will pay close attention to the monthly US Retail Sales data for August, which will be published at 12:30 GMT. Economists estimate the Retail Sales to have grown by 0.2%, slower than the 1.0% increase in July. A slower increase in Retail Sales would indicate a soft inflation outlook.
Daily digest market movers: EUR/USD gains as ECB Kazimir pushes back October rate cut expectations
- EUR/USD rises to near the key resistance of 1.1150 in European trading hours. The major currency pair holds gains as the Euro (EUR) performs strongly as European Central Bank (ECB) officials avoid committing a pre-defined interest rate cut path and prefer to decide on interest rates meeting by meeting. This occurs amid lingering concerns about economic growth in Germany and a decline in Eurozone inflation to 2.2% in August, the lowest rate in three years.
- Less dovish interest-rate guidance from ECB Governing Council member Peter Kazimir on Monday has also contributed to strength in the Euro. Kazimir pushed back market expectations for the ECB cutting interest rates in October by saying in a blog post: "We will almost surely need to wait until December for a clearer picture before making our next move," Reuters reported. “The ECB needed to be sure that incoming data confirmed its projections. Otherwise, policymakers might regret rushing to cut borrowing costs before inflation has been sustainably defeated,” he added. Also, ECB Governing Council member Gediminas Šimkus said on Tuesday that the probability of an October rate cut is very small.
- Meanwhile, the ZEW Survey – which measures sentiment from institutional investors – showed that Economic Sentiment in the Eurozone has declined significantly to 9.3 in September, the lowest since November 2023. The sentiment data was estimated to have fallen slightly to 17.6 from 17.9 in August.
Technical Analysis: EUR/USD rises further to near 1.1150
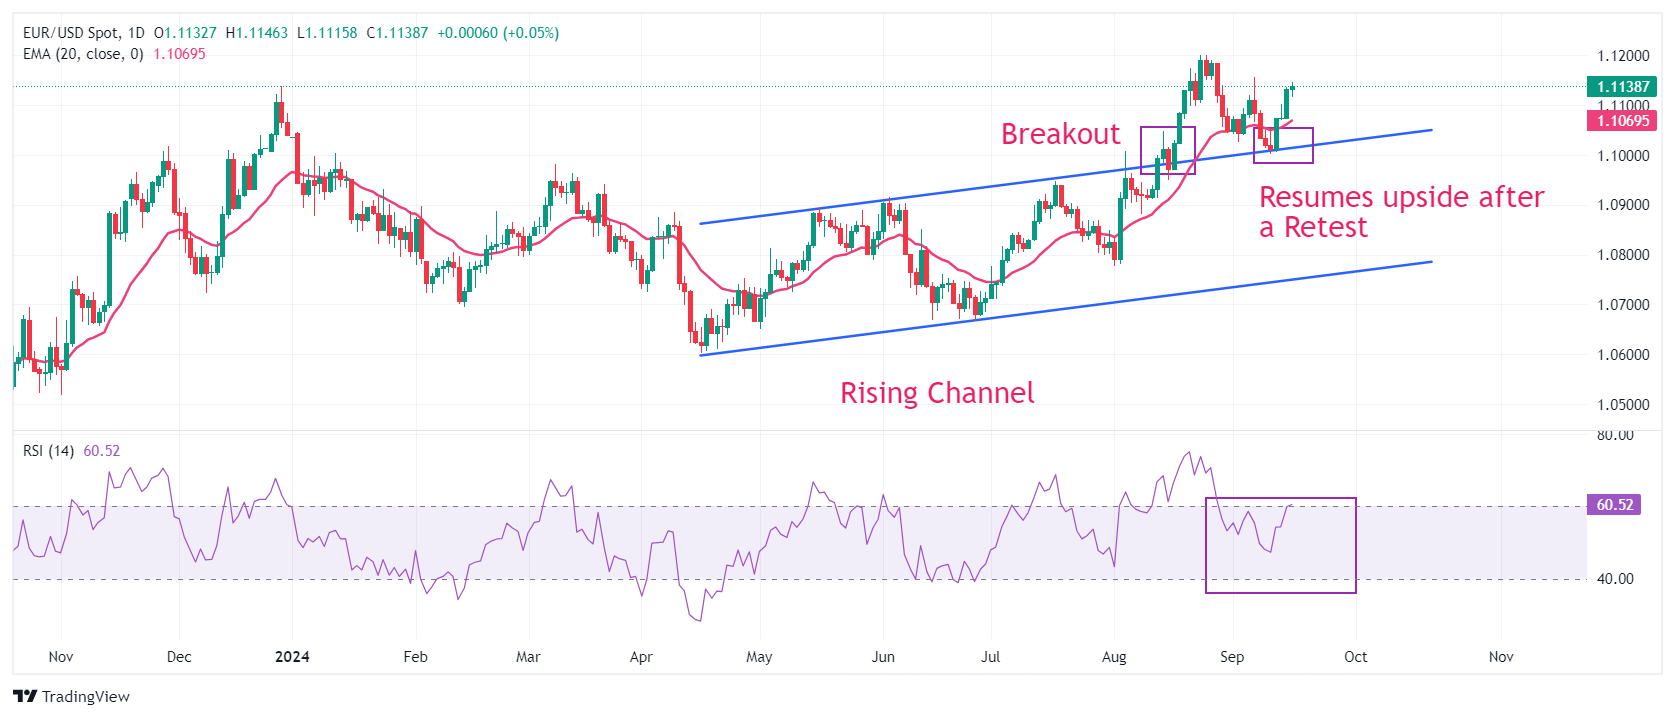
EUR/USD gains further to near 1.1150. The major currency pair strengthened after retesting the breakout of the Rising Channel chart pattern formed on a daily time frame near the psychological support of 1.1000. The near-term outlook of the major currency pair has strengthened as the asset steadies above the 20-day Exponential Moving Average (EMA), which trades around 1.1060.
The 14-day Relative Strength Index (RSI) moves higher to near 60.00. A bullish momentum would trigger if it sustains above the aforementioned level.
Looking up, the high of 1.1155 from September 6 and the round-level resistance of 1.1200 will act as major barricades for the Euro bulls. On the downside, the psychological level of 1.1000 and the July 17 high near 1.0950 will be major support zones.
Euro FAQs
The Euro is the currency for the 20 European Union countries that belong to the Eurozone. It is the second most heavily traded currency in the world behind the US Dollar. In 2022, it accounted for 31% of all foreign exchange transactions, with an average daily turnover of over $2.2 trillion a day. EUR/USD is the most heavily traded currency pair in the world, accounting for an estimated 30% off all transactions, followed by EUR/JPY (4%), EUR/GBP (3%) and EUR/AUD (2%).
The European Central Bank (ECB) in Frankfurt, Germany, is the reserve bank for the Eurozone. The ECB sets interest rates and manages monetary policy. The ECB’s primary mandate is to maintain price stability, which means either controlling inflation or stimulating growth. Its primary tool is the raising or lowering of interest rates. Relatively high interest rates – or the expectation of higher rates – will usually benefit the Euro and vice versa. The ECB Governing Council makes monetary policy decisions at meetings held eight times a year. Decisions are made by heads of the Eurozone national banks and six permanent members, including the President of the ECB, Christine Lagarde.
Eurozone inflation data, measured by the Harmonized Index of Consumer Prices (HICP), is an important econometric for the Euro. If inflation rises more than expected, especially if above the ECB’s 2% target, it obliges the ECB to raise interest rates to bring it back under control. Relatively high interest rates compared to its counterparts will usually benefit the Euro, as it makes the region more attractive as a place for global investors to park their money.
Data releases gauge the health of the economy and can impact on the Euro. Indicators such as GDP, Manufacturing and Services PMIs, employment, and consumer sentiment surveys can all influence the direction of the single currency. A strong economy is good for the Euro. Not only does it attract more foreign investment but it may encourage the ECB to put up interest rates, which will directly strengthen the Euro. Otherwise, if economic data is weak, the Euro is likely to fall. Economic data for the four largest economies in the euro area (Germany, France, Italy and Spain) are especially significant, as they account for 75% of the Eurozone’s economy.
Another significant data release for the Euro is the Trade Balance. This indicator measures the difference between what a country earns from its exports and what it spends on imports over a given period. If a country produces highly sought after exports then its currency will gain in value purely from the extra demand created from foreign buyers seeking to purchase these goods. Therefore, a positive net Trade Balance strengthens a currency and vice versa for a negative balance.
The Australian Dollar (AUD) could continue to rise, but any advance is likely part of a higher range of 0.6745/0.6765. In the longer run, AUD must break and remain above 0.6765 before an advance to 0.6825 can be expected, UOB Group FX strategists Quek Ser Leang and Lee Sue Ann note.
An advance to 0.6825 can be expected
24-HOUR VIEW: “While AUD gained 0.70% (0.6752) yesterday, upward momentum has not increased much. Today, it could continue to rise, but any advance is likely part of a higher range of 0.6725/0.6765. In other words, AUD is unlikely to break clearly below 0.6725 or above 0.6745.” 1-3 WEEKS VIEW: “AUD dropped to 0.6622 last week and then rebounded. There has been a tentative buildup in momentum. From here, AUD must break and remain above 0.6765 before an advance to 0.6825 can be expected. The likelihood of AUD breaking clearly above 0.6765 will increase in the next few days as long as 0.6700 is not breached.”
Silver prices (XAG/USD) broadly unchanged on Tuesday, according to FXStreet data. Silver trades at $30.72 per troy ounce, broadly unchanged 0.04% from the $30.73 it cost on Monday.
Silver prices have increased by 29.08% since the beginning of the year.
| Unit measure | Silver Price Today in USD |
|---|---|
| Troy Ounce | 30.72 |
| 1 Gram | 0.99 |
The Gold/Silver ratio, which shows the number of ounces of Silver needed to equal the value of one ounce of Gold, stood at 83.88 on Tuesday, down from 84.05 on Monday.
Silver FAQs
Silver is a precious metal highly traded among investors. It has been historically used as a store of value and a medium of exchange. Although less popular than Gold, traders may turn to Silver to diversify their investment portfolio, for its intrinsic value or as a potential hedge during high-inflation periods. Investors can buy physical Silver, in coins or in bars, or trade it through vehicles such as Exchange Traded Funds, which track its price on international markets.
Silver prices can move due to a wide range of factors. Geopolitical instability or fears of a deep recession can make Silver price escalate due to its safe-haven status, although to a lesser extent than Gold's. As a yieldless asset, Silver tends to rise with lower interest rates. Its moves also depend on how the US Dollar (USD) behaves as the asset is priced in dollars (XAG/USD). A strong Dollar tends to keep the price of Silver at bay, whereas a weaker Dollar is likely to propel prices up. Other factors such as investment demand, mining supply – Silver is much more abundant than Gold – and recycling rates can also affect prices.
Silver is widely used in industry, particularly in sectors such as electronics or solar energy, as it has one of the highest electric conductivity of all metals – more than Copper and Gold. A surge in demand can increase prices, while a decline tends to lower them. Dynamics in the US, Chinese and Indian economies can also contribute to price swings: for the US and particularly China, their big industrial sectors use Silver in various processes; in India, consumers’ demand for the precious metal for jewellery also plays a key role in setting prices.
Silver prices tend to follow Gold's moves. When Gold prices rise, Silver typically follows suit, as their status as safe-haven assets is similar. The Gold/Silver ratio, which shows the number of ounces of Silver needed to equal the value of one ounce of Gold, may help to determine the relative valuation between both metals. Some investors may consider a high ratio as an indicator that Silver is undervalued, or Gold is overvalued. On the contrary, a low ratio might suggest that Gold is undervalued relative to Silver.
(An automation tool was used in creating this post.)
The week after an ECB meeting is often filled with various members’ comments aimed at fine-tuning the Governing Council’s policy message. So far, the remarks have been quite heterogeneous, ING’s FX strategist Francesco Pesole notes.
Consolidation in EUR/USD above the 1.110
“While Chief Economist Philip Lane said there is a clear path ahead for rate cuts, Slovak central bank chief Peter Kazimir probably summed up the ECB hawks’ current view by explicitly ruling out another cut before December. Ultimately, all this post-meeting noise sounds like a signal that President Christine Lagarde’s attempt at defaulting to strict data dependency is both hard to enforce and perhaps not unanimously shouldered by GC members.”
“EUR/USD has found good support on the back of USD softness and has moved in line with our recent expectations. We see no strong reasons for a correction before tomorrow’s Fed meeting. The German ZEW figures today will likely be poor again. The current situation index is expected to slip further to -80, and the expectation metric from 19 to 17.”
“But the euro’s strong momentum has gone through several concerning eurozone activity prints, and the ZEW should merely confirm the widely-priced notion that Germany’s outlook remains grim. We expect a consolidation in EUR/USD above the 1.110 gravity line into the FOMC risk event.”
Since the middle of last week, the USD has weakened day by day, causing higher EUR/USD levels. There is still no sign of anything on the EUR side that could contribute to this movement, Commerzbank’s Head of FX and Commodity Research Ulrich Leuchtmann notes.
A USD-negative view is justified
“The market considers a large 50-basis-point move by the Fed at tomorrow's meeting to be increasingly likely (now more likely than a small 25-basis-point step), and that has taken its toll on the USD. A large move does not necessarily imply that the rate-cut cycle will end lower than the market had previously expected. A terminal rate of around 2¾ % is still the scenario priced in by the market. And yet a more aggressive start to the rate cuts is rightly seen as USD-negative.”
“We have recently tried to show that (1) inflation expectations point to the 2% inflation target being reached, but so far there is no evidence of a significant undershoot. And we showed (2) that the US labor market has cooled, but continues to perform almost as well as in the goldilocks year of 2019. Sure, there are risks. The labor market could cool down rapidly, and of course inflation could plummet. But of course, things could also turn out differently.”
“A 50-basis-point move would suggest that the Fed's reaction function is more negative for USD than could be assumed just recently. And that would not only be relevant for the current interest rate, but would increase the risk that in the future the Fed would be more likely to cut rates in case of doubt. This basically confirms our USD-negative view: in interest-rate-cutting cycles, the Fed is more aggressive than most other central banks. Such phases tend to be USD-negative because they make the dollar appear riskier. A higher risk premium on USD positions, i.e. a weaker US dollar, is the logical consequence.”
- Gold stabilizes at all-time highs as traders await US Retail Sales data and the key Fed policy decision on interest rates.
- Probabilities now favor a larger 0.50% cut to Fed base rates, which would boost the attractiveness of Gold.
- Analysts call a 10-year secular bull trend starting for commodities, including Gold.
Gold (XAU/USD) plateaus in the $2,580s on Tuesday, ahead of the release of potentially market-moving US data later in the day and the Federal Reserve (Fed) meeting on Wednesday.
Gold surges as bets increase the Fed will double cut
Gold shot to an all-time-high (ATH) of $2,589 on Monday after market bets that the Fed will make a double-dose 0.50% cut to interest rates at its meeting on Wednesday rose sharply, according to market-based gauges.
The expectation that the Fed will slash interest rates is positive for Gold because it lowers the opportunity cost of holding the yellow metal, which is a non-interest-paying asset, thus making it more attractive to investors.
US Retail Sales data, released at 12:30 GMT, could impact the Fed rates’ decision. If the data comes out above the 0.2% expected (0.3% ex autos) it will suggest the US economy is holding up better than expected and the Fed may not need to cut interest rates by such a large amount to help stimulate growth and employment. This scenario would be negative for Gold.
Alternatively, if Retail Sales undershoots expectations, it will further increase speculation of a half a percentage point cut coming on Wednesday, and positively impact Gold, which could rise to new highs.
Gold is entering a bullish super-cycle, analysts say
Longer-term prospects for the previous metal remain upbeat, according to several leading analysts, who are arguing there is evidence that commodities – including Gold – are entering a new bullish super-cycle.
“The last [two] times we saw these valuations for commodities was 1971 and 2000,” tweeted Michaël van de Poppe, Founder of MN Consultancy. “Commodities & #Crypto are extremely undervalued and it's likely that commodities go into a 10-year long bull market.”
Van de Poppe is not the only commentator saying commodities are entering a secular bull market. According to a recent “Flow Show” note from Bank of America Investment Strategist Jared Woodard, a “commodity secular bull market in the 2020s is just getting started as debt, deficits, demographics, reverse-globalization, AI & net-zero policies are all inflationary,” reported Kitco News.
Technical Analysis: Gold stalls in uptrend
Gold’s price has peaked and plateaued in the $2,580s. The trend is bullish in the short, medium, and long-term. Given that it is a principle of technical analysis that “the trend is your friend,” the odds favor more upside. If there is a correction, therefore, it is likely to be short-lived before Gold resumes its broader uptrend.
XAU/USD Daily Chart
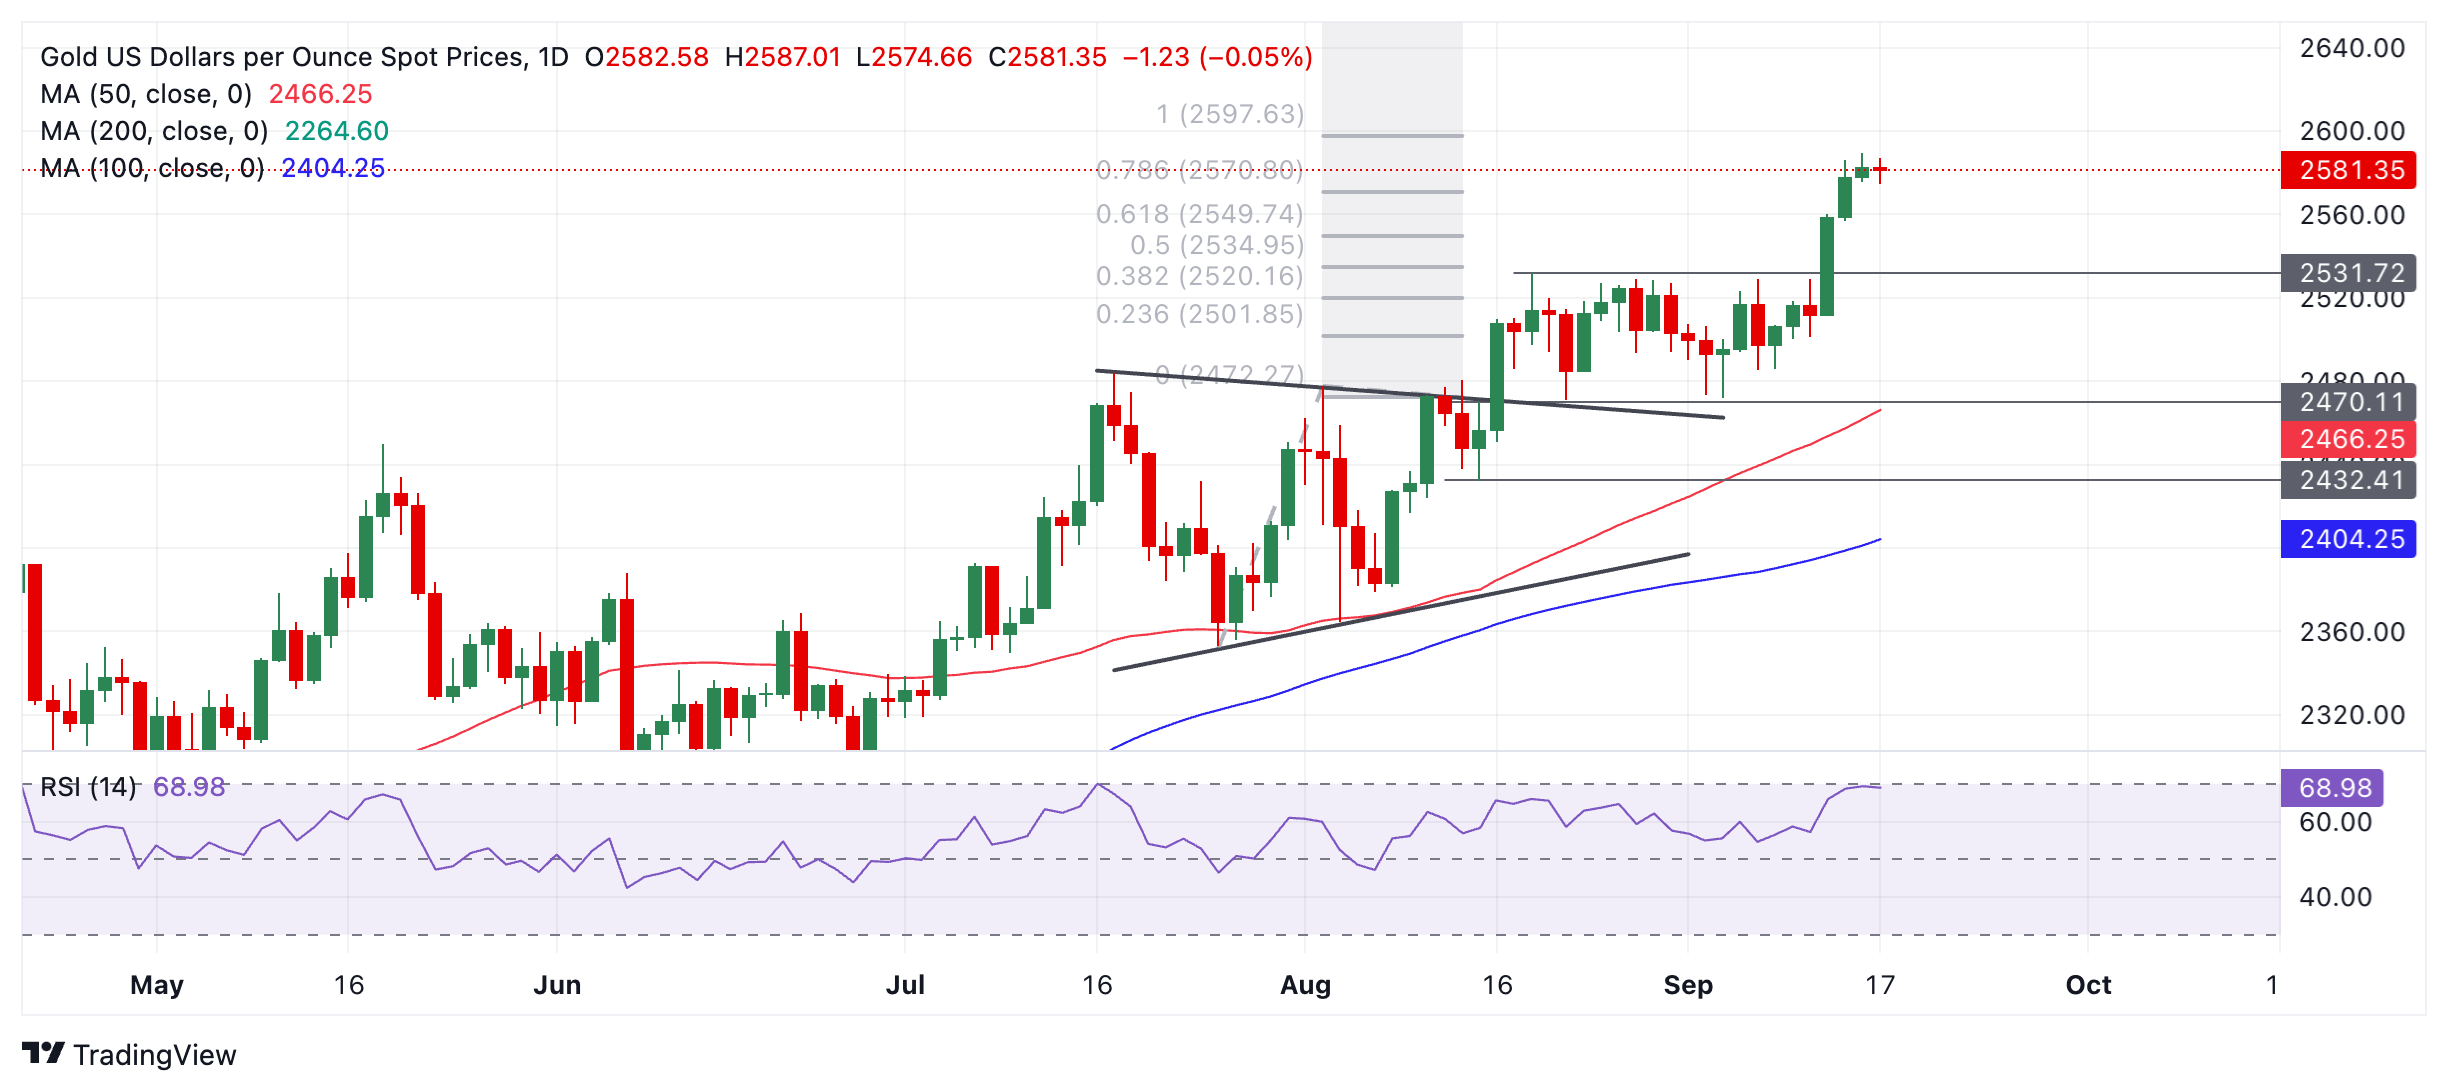
Gold is not yet overbought according to the Relative Strength Index (RSI), but it is close to overbought. If it enters the zone on a closing basis it will advise traders not to add to their long positions, although the rally may continue. If it enters overbought and then exits back into neutral it will be a sign of a deeper correction.
In the event of a correction, firm support lies at $2,550, $2,544 (0.382 Fibonacci retracement of the September rally), and $2,530 (former range high).
Economic Indicator
Retail Sales (MoM)
The Retail Sales data, released by the US Census Bureau on a monthly basis, measures the value in total receipts of retail and food stores in the United States. Monthly percent changes reflect the rate of changes in such sales. A stratified random sampling method is used to select approximately 4,800 retail and food services firms whose sales are then weighted and benchmarked to represent the complete universe of over three million retail and food services firms across the country. The data is adjusted for seasonal variations as well as holiday and trading-day differences, but not for price changes. Retail Sales data is widely followed as an indicator of consumer spending, which is a major driver of the US economy. Generally, a high reading is seen as bullish for the US Dollar (USD), while a low reading is seen as bearish.
Read more.Next release: Tue Sep 17, 2024 12:30
Frequency: Monthly
Consensus: 0.2%
Previous: 1%
Source: US Census Bureau
Retail Sales data published by the US Census Bureau is a leading indicator that gives important information about consumer spending, which has a significant impact on the GDP. Although strong sales figures are likely to boost the USD, external factors, such as weather conditions, could distort the data and paint a misleading picture. In addition to the headline data, changes in the Retail Sales Control Group could trigger a market reaction as it is used to prepare the estimates of Personal Consumption Expenditures for most goods.
- The Mexican Peso tardes slightly lower, extending the mild weakening from Monday.
- US Retail Sales data, the Fed policy meeting and BoE meeting are key events this week.
- USD/MXN forms a bearish “Three Black Crows” Japanese candlestick pattern.
The Mexican Peso (MXN) edges lower on Tuesday morning after mildly retreating the prior day. This may be as a result of profit-taking after MXN’s average 3.9% rally last week against its most heavily-traded counterparts (the US Dollar (USD), the Euro (EUR), and the Pound Sterling (GBP)), or possibly trader caution ahead of the much-anticipated Federal Reserve (Fed) policy meeting announcement on Wednesday.
Mexican Peso trades tight ahead of Fed meeting
The Mexican Peso trades flat as the market debates the possibility that the Fed will cut interest rates by a double-dose 0.50% at their meeting on Wednesday, with the CME FedWatch tool now referencing a 67% probability of such a “jumbo” cut. This is more than double the probability of a 0.25% cut alone (33%). The chances of 0.50% have risen eight percentage points higher than yesterday’s 59%.
A cut to base interest rates in the US would widen the already substantial gap between the two countries and weaken the USD/MXN. In Mexico, the Bank of Mexico (Banxico) has set a base rate of 10.75% versus the Fed’s 5.25%-5.50% band. If the Fed cuts by 0.50%, as now seems likely, the Fed’s rate will fall to 4.75%-5.25%. This, in turn, will favor capital flowing to Mexico, where it can earn substantially more interest, resulting in increased demand for the Mexican Peso and its appreciation.
US Retail Sales data for August out at 12:30 GMT on Tuesday is the last major economic data release for the US prior to the conclusion of the Fed meeting on Wednesday. Economists expect a 0.2% rise month-over-month after a 1.0% rise in July. If the data undershoots, it will ratchet up the chances of a 0.50% cut even higher, and the opposite if it beats them.
Against the GBP, the Mexican Peso has weakened a little more over recent sessions as the Bank of England (BoE), scheduled to meet on Thursday, is seen as much less likely to cut interest rates. Yet the outlook for the Pound is far from positive as the latest Gross Domestic Product (GDP) data came out flat for July, undershooting economists’ expectations of 0.2% growth, so cuts are probably coming in the future, but with delays due to stickier inflation.
It is a similar story for the Euro, with Germany suffering slower growth but wage inflation remaining too high for the European Central Bank (ECB) to aggressively cut interest rates. Plus, the ECB has already begun cutting interest rates, so unlike the Fed, it is not playing “catch-up”. The just-released German and Eurozone ZEW sentiment survey showed a sharp fall in September suggesting more bad news on the economic front, and EUR/MXN pair is losing ground as a result.
Domestic politics has been another factor influencing the Mexican Peso ever since the June election. Initially, markets discounted the Peso due to fears about a fall in foreign investment due to proposed constitutional reforms by the Morena-led coalition government. These concerns have subsided recently, and one of the most controversial of them – the election rather than appointment of judges – passed into law on Sunday when outgoing president Andres Manuel Lopez Obrador signed an official decree, according to El Financiero.
At the time of writing, one US Dollar (USD) buys 19.25 Mexican Pesos, EUR/MXN trades at 21.44, and GBP/MXN at 25.44.
Technical Analysis: USD/MXN forms bearish “Three Black Crows” pattern
USD/MXN has broken out of a rising mini-channel within a wider rising channel and fallen for three days in a row. This has now formed a bearish Three Black Crows Japanese candlestick pattern on the daily chart (shaded rectangle), which indicates the probability that prices will fall even lower in the short term.
USD/MXN Daily Chart
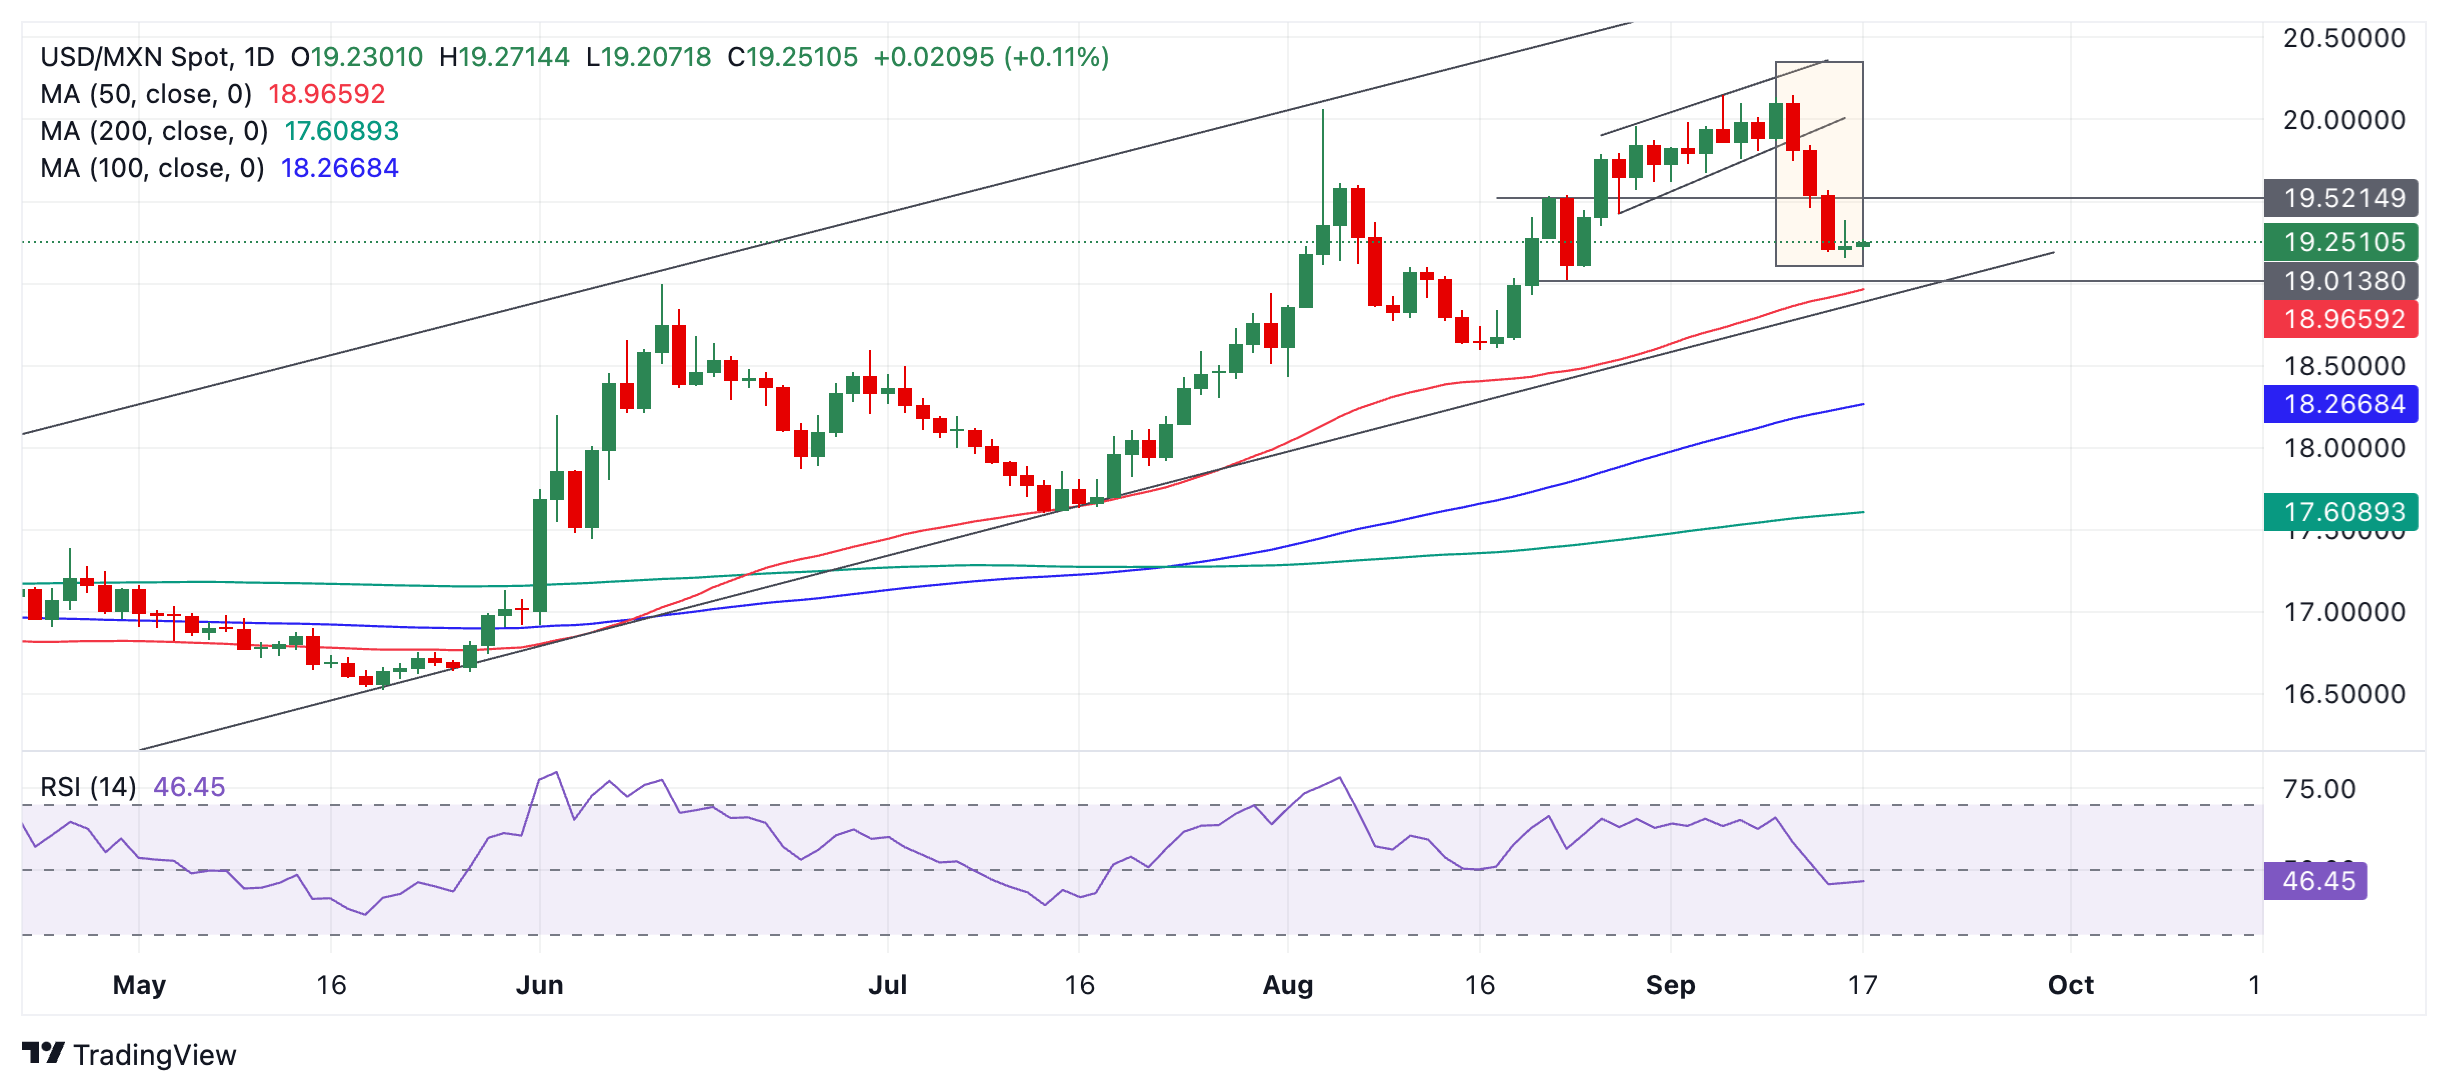
The odds now favor the pair falling to the next downside support level at 19.01 (August 23 low), followed perhaps by further weakness to the 50-day Simple Moving Average (SMA) at 18.94 and the lower trendline of the larger channel a few pips below. At that level, the price will probably find firm support to stabilize and perhaps recover.
Even though the short-term trend is bearish, the medium and long-term trends are still bullish, suggesting the possibility that the pair could recover eventually and continue to trade higher.
Economic Indicator
Retail Sales (MoM)
The Retail Sales data, released by the US Census Bureau on a monthly basis, measures the value in total receipts of retail and food stores in the United States. Monthly percent changes reflect the rate of changes in such sales. A stratified random sampling method is used to select approximately 4,800 retail and food services firms whose sales are then weighted and benchmarked to represent the complete universe of over three million retail and food services firms across the country. The data is adjusted for seasonal variations as well as holiday and trading-day differences, but not for price changes. Retail Sales data is widely followed as an indicator of consumer spending, which is a major driver of the US economy. Generally, a high reading is seen as bullish for the US Dollar (USD), while a low reading is seen as bearish.
Read more.Next release: Tue Sep 17, 2024 12:30
Frequency: Monthly
Consensus: 0.2%
Previous: 1%
Source: US Census Bureau
Retail Sales data published by the US Census Bureau is a leading indicator that gives important information about consumer spending, which has a significant impact on the GDP. Although strong sales figures are likely to boost the USD, external factors, such as weather conditions, could distort the data and paint a misleading picture. In addition to the headline data, changes in the Retail Sales Control Group could trigger a market reaction as it is used to prepare the estimates of Personal Consumption Expenditures for most goods.
- Germany’s ZEW Economic Sentiment Index falls further to 3.6 in September.
- EUR/USD holds gains below 1.1150 after German and Eurozone ZEW surveys.
The headline German ZEW Economic Sentiment Index dropped further to 3.6 in September from 19.2 reported in August, missing the market expectations of 17.1 by a wide margin.
The Current Situation Index, however, deteriorated further to -84.5 in the ninth month of the year, compared to August’s -77.3.
The Eurozone ZEW Economic Sentiment Index arrived at 9.3 in September versus the August figure of 17.9. The data fell short of the market forecast of 17.6.
Key points
Hope for a swift improvement in the economic situation is visibly fading.
Once again observe a noticeable decline in economic expectations for Germany.
Number of optimists and pessimists is now evenly balanced.
Most respondents appear to have already factored the ECB's interest rate decision into their expectations.
Market reaction
The EUR/USD pair is unperturbed by discouraging German and Eurozone ZEW surveys. The pair is adding 0.09% on the day to trade near 1.1142, at the press time.
Euro PRICE Today
The table below shows the percentage change of Euro (EUR) against listed major currencies today. Euro was the strongest against the US Dollar.
| USD | EUR | GBP | JPY | CAD | AUD | NZD | CHF | |
|---|---|---|---|---|---|---|---|---|
| USD | -0.06% | -0.07% | -0.06% | -0.02% | -0.20% | -0.10% | -0.16% | |
| EUR | 0.06% | -0.01% | -0.02% | 0.00% | -0.14% | -0.04% | -0.09% | |
| GBP | 0.07% | 0.01% | 0.00% | 0.04% | -0.13% | -0.04% | -0.10% | |
| JPY | 0.06% | 0.02% | 0.00% | 0.05% | -0.14% | -0.04% | -0.12% | |
| CAD | 0.02% | 0.00% | -0.04% | -0.05% | -0.17% | -0.07% | -0.16% | |
| AUD | 0.20% | 0.14% | 0.13% | 0.14% | 0.17% | 0.09% | 0.02% | |
| NZD | 0.10% | 0.04% | 0.04% | 0.04% | 0.07% | -0.09% | -0.08% | |
| CHF | 0.16% | 0.09% | 0.10% | 0.12% | 0.16% | -0.02% | 0.08% |
The heat map shows percentage changes of major currencies against each other. The base currency is picked from the left column, while the quote currency is picked from the top row. For example, if you pick the Euro from the left column and move along the horizontal line to the US Dollar, the percentage change displayed in the box will represent EUR (base)/USD (quote).
- USD/CAD continues with its struggle to gain any meaningful traction amid mixed cues.
- The USD languishes near the YTD low amid dovish Fed expectations and cap the upside.
- A downtick in Crude Oil prices undermines the Loonie and acts as a tailwind for the pair.
The USD/CAD pair extends its sideways consolidative price move on Tuesday and remains confined in a familiar range held over the past week or so. Spot prices, meanwhile, remain below the 1.3600 mark through the early European session amid a bearish US Dollar (USD), though the downside seems cushioned ahead of the key central bank event risk.
The markets are now pricing in a greater chance of an oversized interest rate cut by the Federal Reserve (Fed) amid signs that inflation in the US was subsiding. This, in turn, drags the US Treasury bond yields to one or two-year lows, which, along with the upbeat market mood, keeps the USD depressed near the 2024 trough touched on Monday and acts as a headwind for the USD/CAD pair.
That said, a modest pullback in Crude Oil prices from a nearly two-week high and bets for additional interest rate cuts by the Bank of Canada (BoC) undermines the commodity-linked Loonie. This could hold back traders from placing aggressive bearish bets around the USD/CAD pair and help limit deeper losses ahead of the Canadian consumer inflation figures, due later this Tuesday.
From a technical perspective, the recent repeated failures to find acceptance above the 1.3600 mark favor bearish traders. That said, the range-bound price action around the very important 200-day Simple Moving Average (SMA) constitutes the formation of a rectangle and marks a consolidation phase. Moreover, neutral oscillators on the daily chart warrant some caution before placing directional bets.
Meanwhile, strength beyond the 1.3600 mark is likely to confront some resistance near the monthly peak, around the 1.3620-1.3625 region touched last week. Some follow-through buying will set the stage for an extension of the recent recovery from the multi-month low touched in August and lift the USD/CAD pair further beyond the 1.3665-1.3670 intermediate hurdle, towards the 1.3700 round figure.
On the flip side, the 1.3565 horizontal zone now seems to have emerged as immediate support, below which spot prices could accelerate the fall towards the 1.3500 psychological mark. A convincing break below the latter will expose the multi-month low, around the 1.3440 area, and drag the USD/CAD pair further towards the 1.3400 mark en route to the February swing low, around the 1.3365 region.
USD/CAD 4-hour chart
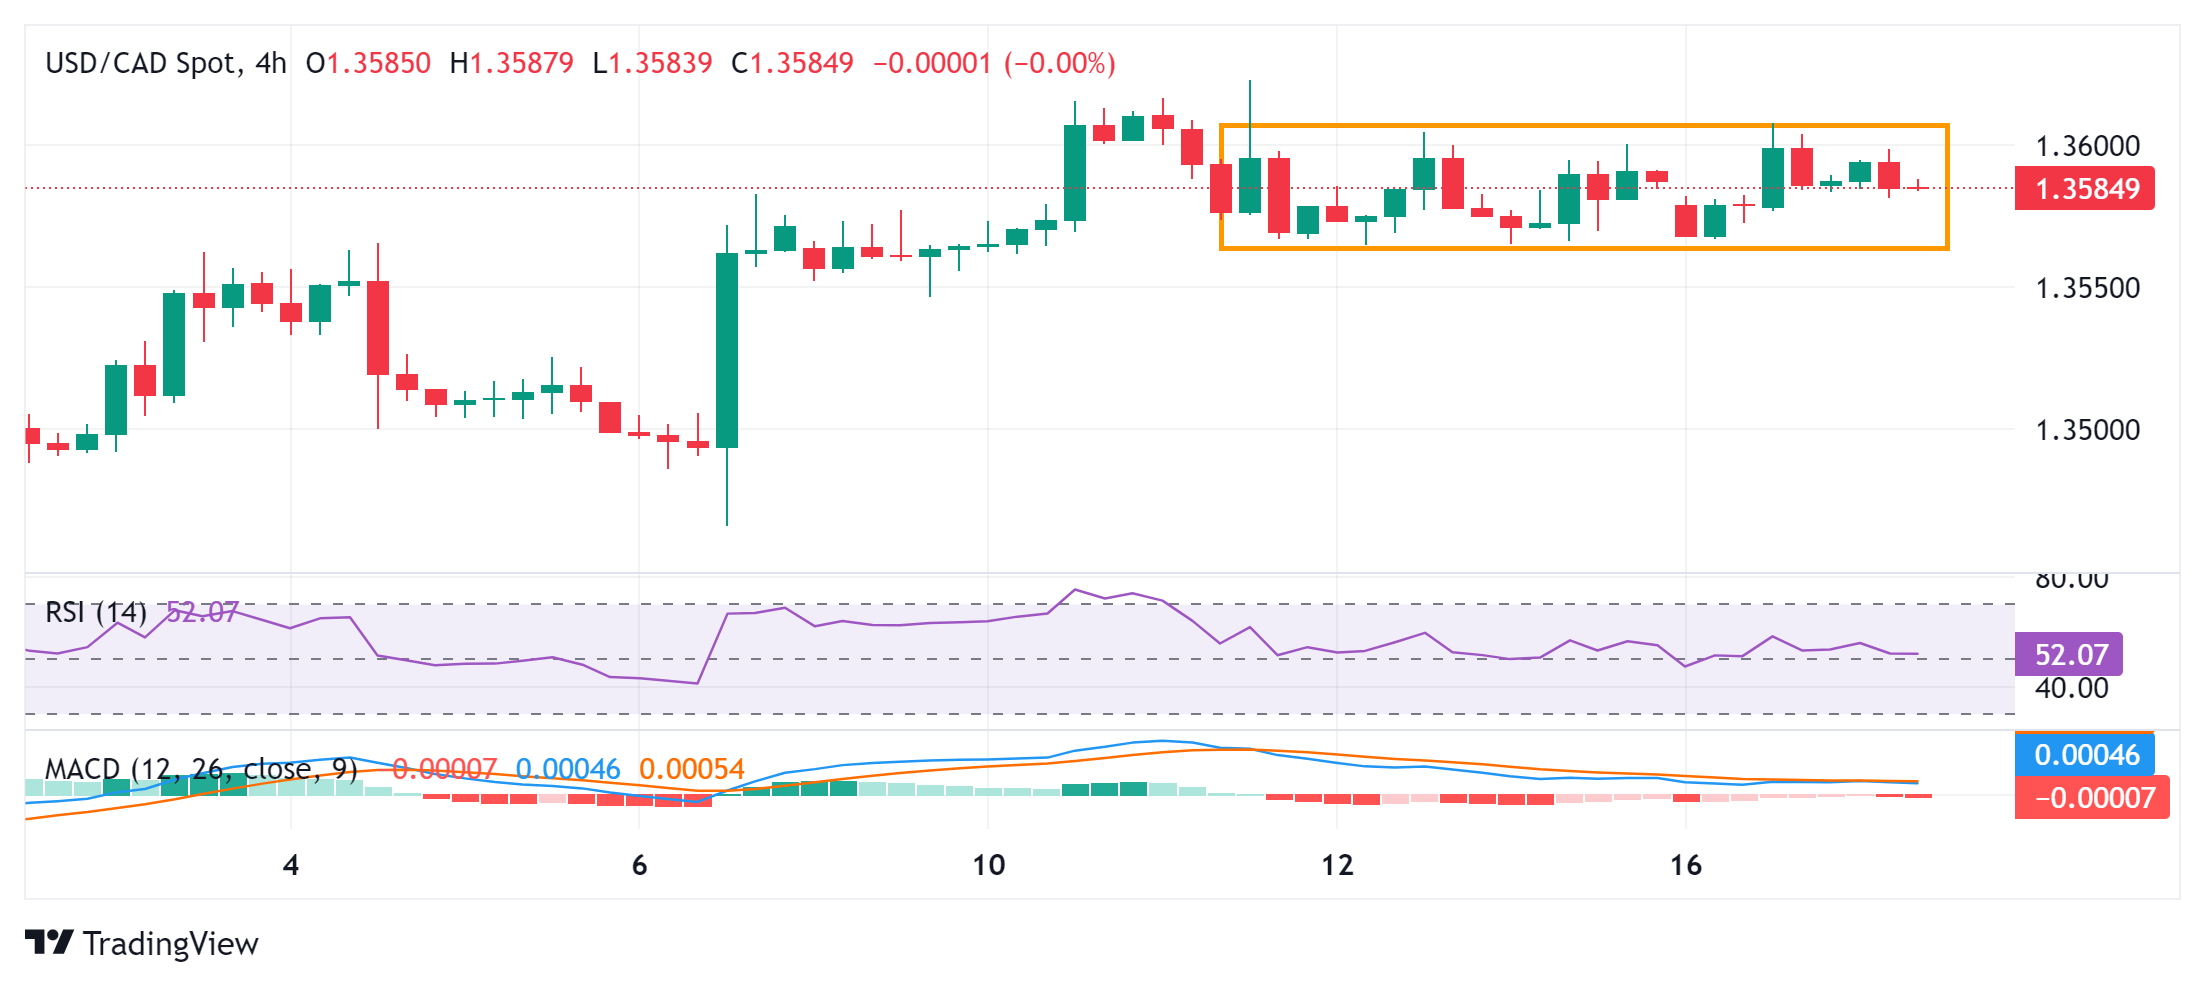
Economic Indicator
Consumer Price Index (YoY)
The Consumer Price Index (CPI), released by Statistics Canada on a monthly basis, represents changes in prices for Canadian consumers by comparing the cost of a fixed basket of goods and services. The YoY reading compares prices in the reference month to the same month a year earlier. Generally, a high reading is seen as bullish for the Canadian Dollar (CAD), while a low reading is seen as bearish.
Read more.Next release: Tue Sep 17, 2024 12:30
Frequency: Monthly
Consensus: -
Previous: 2.5%
Source: Statistics Canada
USD continued to trade on a back foot as markets re-price for higher likelihood of 50bps cut at upcoming FOMC, OCBC Frances Cheung and Christopher Wong note.
Clean break below 100.50 puts 99.60 in focus
“It remains a close call whether Fed cuts 50 or 25bp. While the magnitude of Fed cut may impact USD moves, Fed’s commentary and dot plot guidance should play a slightly more lasting effect than a 25 or 50bp first cut. The dot plot should provide a reality check on market expectations with regards to rate cut trajectory. As of writing, markets are still expecting 120bps cut for 2024 (with 3 more Fed meetings to go).”
“Apart from rate cut trajectory, global growth momentum matters for USD. If Fed cut is non-recessionary driven and that growth outside-US continues to trudge along (not-hot-not cold), then it is more likely that the USD can remain back footed while other FX, sensitive to growth and rates can outperform (i.e. KRW, MYR, THB). DXY gapped lower in the open again. Last at 100.98. Mild bullish momentum on daily chart intact but RSI fell. 2-way trades likely in the interim.”
“Support at 100.50 levels. Clean break puts 99.60 in focus. Resistance at 101.40 (21 DMA), 102.20 (23.6% fibo retracement of 2023 high to 2024 low), 102.86 (50 DMA). Today is fairly light in terms of data docket, with empire manufacturing on tap.”
European Central Bank (ECB) Governing Council member Gediminas Šimkus said on Tuesday, “the likelihood of an October rate cut is very small.”
Additional quotes
We won't have many new data points in October.
The economy is developing in line with forecasts.
Market reaction
These comments somewhat seem to be supporting the Euro, driving EUR/USD 0.09% higher on the day at 1.1140, as of writing.
Euro PRICE Today
The table below shows the percentage change of Euro (EUR) against listed major currencies today. Euro was the strongest against the US Dollar.
| USD | EUR | GBP | JPY | CAD | AUD | NZD | CHF | |
|---|---|---|---|---|---|---|---|---|
| USD | -0.10% | -0.07% | -0.04% | -0.02% | -0.20% | -0.11% | -0.15% | |
| EUR | 0.10% | 0.02% | 0.05% | 0.04% | -0.11% | 0.02% | -0.05% | |
| GBP | 0.07% | -0.02% | 0.02% | 0.05% | -0.13% | -0.04% | -0.10% | |
| JPY | 0.04% | -0.05% | -0.02% | 0.04% | -0.14% | -0.04% | -0.11% | |
| CAD | 0.02% | -0.04% | -0.05% | -0.04% | -0.18% | -0.07% | -0.15% | |
| AUD | 0.20% | 0.11% | 0.13% | 0.14% | 0.18% | 0.08% | 0.02% | |
| NZD | 0.11% | -0.02% | 0.04% | 0.04% | 0.07% | -0.08% | -0.07% | |
| CHF | 0.15% | 0.05% | 0.10% | 0.11% | 0.15% | -0.02% | 0.07% |
The heat map shows percentage changes of major currencies against each other. The base currency is picked from the left column, while the quote currency is picked from the top row. For example, if you pick the Euro from the left column and move along the horizontal line to the US Dollar, the percentage change displayed in the box will represent EUR (base)/USD (quote).
Markets have continued to consolidate their bearish dollar positions ahead of tomorrow’s FOMC announcement. This FX dynamics is a direct consequence of the steady dovish repricing in rate expectations, with the swap market now attaching around 70% implied probability (43bp) of a 50bp cut tomorrow, ING’s FX strategist Francesco Pesole notes.
DXY can slip through the 100.50 August lows
“Remember that the last two key data releases (jobs and inflation) did not really point to a half-point cut, and growing dovish bets actually started late last week on the back of some media reports that tomorrow would be a tight decision between 25bp and 50bp. Our economics team is narrowly favouring 25bp, but admit it’s a very close call. One way to read the recent market moves is that investors may be attempting to be the deciding factor in a potentially split FOMC decision.”
“The reasoning here follows that of former FOMC member Bill Dudley, who late last week said that the Fed does not like to surprise markets as he made the case for a 50bp cut. In other words, if markets price in 50bp, the Fed will be more likely to deliver 50bp. Needless to say, this is a dollar-negative mechanism, and we struggle to see a rebound in the greenback today unless retail sales surprise enough to discourage dovish speculators.”
“The consensus call is that retail sales marginally declined (-0.2% MoM) in August, although the index excluding auto and gas is seen only slowing from +0.4% to +0.3% MoM. Industrial production figures for August are also released and expected at +0.2% MoM after a poor July read. USD/JPY briefly explored sub-140.0 levels before rebounding yesterday and is currently trading at 140.65. The yen has a 14% weight in the DXY dollar index: a decisive move below 140.0 can see DXY slip through the 100.50 August lows.”
- Silver price holds its position below a two-month high of $31.09, which was recorded on Monday.
- The non-yielding Silver becomes more attractive to investors amid rising odds of a bumper Fed rate cut.
- The dollar-denominated commodity becomes cheaper for buyers using other currencies as the US Dollar remains tepid.
Silver price (XAG/USD) trades around $30.80 per troy ounce during Tuesday’s European hours, maintaining its position near a two-month high of $31.09, marked on Monday. Silver price is gaining ground due to rising expectations of a significant 50 basis points rate cut by the Federal Reserve on Wednesday.
As a non-yielding commodity asset, Silver becomes more attractive to investors in a lower interest rate environment, where the opportunity cost of holding it decreases, potentially offering better returns compared to other assets.
According to the CME FedWatch Tool, markets are pricing in a 33.0% chance of a 25 basis point Federal Reserve interest rate cut at the September meeting, while the probability of a 50 basis point cut has surged to 67.0%, up from 50.0% just a day earlier. This shift reflects heightened anticipation of more aggressive monetary easing.
The US Dollar (USD) faces challenges due to lower Treasury yields. The US Dollar Index (DXY), which measures the value of the US Dollar against its six other major peers, trading around 100.60 with 2-year and 10-year standing at 3.55% and 3.61%, respectively, at the time of writing.
Silver, being a dollar-denominated commodity, becomes more affordable for buyers using other currencies when the US Dollar weakens. This price advantage can help boost demand for the precious metal, as it becomes less expensive for international buyers to purchase.
However, demand for Silver could be negatively impacted due to disappointing economic data from China, raising concerns about consumption in the world's largest metals market. Over the weekend, data revealed that China's industrial output, retail sales, and fixed asset investments fell short of expectations for August.
Silver plays a crucial role in several industrial sectors, including electronics, solar panels, and automotive components. As one of the largest manufacturing hubs globally, China's industrial demand for silver is a key factor in the precious metal's overall consumption.
Silver FAQs
Silver is a precious metal highly traded among investors. It has been historically used as a store of value and a medium of exchange. Although less popular than Gold, traders may turn to Silver to diversify their investment portfolio, for its intrinsic value or as a potential hedge during high-inflation periods. Investors can buy physical Silver, in coins or in bars, or trade it through vehicles such as Exchange Traded Funds, which track its price on international markets.
Silver prices can move due to a wide range of factors. Geopolitical instability or fears of a deep recession can make Silver price escalate due to its safe-haven status, although to a lesser extent than Gold's. As a yieldless asset, Silver tends to rise with lower interest rates. Its moves also depend on how the US Dollar (USD) behaves as the asset is priced in dollars (XAG/USD). A strong Dollar tends to keep the price of Silver at bay, whereas a weaker Dollar is likely to propel prices up. Other factors such as investment demand, mining supply – Silver is much more abundant than Gold – and recycling rates can also affect prices.
Silver is widely used in industry, particularly in sectors such as electronics or solar energy, as it has one of the highest electric conductivity of all metals – more than Copper and Gold. A surge in demand can increase prices, while a decline tends to lower them. Dynamics in the US, Chinese and Indian economies can also contribute to price swings: for the US and particularly China, their big industrial sectors use Silver in various processes; in India, consumers’ demand for the precious metal for jewellery also plays a key role in setting prices.
Silver prices tend to follow Gold's moves. When Gold prices rise, Silver typically follows suit, as their status as safe-haven assets is similar. The Gold/Silver ratio, which shows the number of ounces of Silver needed to equal the value of one ounce of Gold, may help to determine the relative valuation between both metals. Some investors may consider a high ratio as an indicator that Silver is undervalued, or Gold is overvalued. On the contrary, a low ratio might suggest that Gold is undervalued relative to Silver.
Room for GBP to rise to 1.3240 before levelling off. In the longer run, increase in momentum is likely to lead to further GBP strength, potentially breaking this year’s high, near 1.3270, UOB Group FX strategists Quek Ser Leang and Lee Sue Ann note.
Room for GBP to rise to 1.3240
24-HOUR VIEW: “GBP rose sharply yesterday, closing at 1.3216 (+0.69%). While the sharp advance seems to be overdone, there is room for GBP to rise 1.3240 before levelling off. The major resistance at 1.3270 is unlikely to come under threat. To keep the momentum going, GBP must not break below 1.3170 with minor support at 1.3195.”
1-3 WEEKS VIEW: “GBP fell to within a couple of pips of 1.3000 last week, then rebounded strongly. Yesterday, it closed on a strong note at 1.3216 (+0.69%). The increase in momentum is likely to lead to further GBP strength, potentially breaking above this year’s high, near 1.3270. On the downside, should GBP break below 1.3120, it would mean that the buildup in momentum has faded.”
Our headline SMEI inched up 0.1pt to 49.7 in September as services remained a key drag. Performance sub-index stayed below 50 for a fourth straight month; expectations turned contractionary. Manufacturing activity picked up; most services sectors reported a m/m decline in sales, Standard Chartered’s economists Hunter Chan and Shuang Ding note.
Subdued domestic demand dragged down Q3 performance
“Our proprietary Small and Medium Enterprise Confidence Index (SMEI; Bloomberg: SCCNSMEI <Index>) picked up 0.1pts to 49.7 in early September (the survey closed early due to the Mid-Autumn festival) after falling to a 20-month low in August. The overall performance sub-index picked up by only 0.1pts to 48.9 in September, as manufacturing activity rebounded but services-sector performance weakened. The average performance sub-index edged down to 49.1 in Q3 from 50.8 in Q2, indicating a q/q decline in SMEs’ activity.”
“In addition, the expectations index edged down to 49.6 in September, the first below-50 reading since end-2023. All expectations sub-indices, including sales, new orders and profitability, fell below 50. The average expectations index fell 0.8pts from Q2 to 50.1 in Q3, indicating softer SME sentiment. While the credit sub-index recovered on lower funding costs for SMEs in September, the average reading fell 1pt to 50.5 in Q3 on a deterioration in liquidity conditions.”
“The manufacturing performance sub-index recovered to 51.2 after falling below 50 in August as production activity reaccelerated. New orders from emerging markets rebounded, according to cross-border trading SMEs. Meanwhile, the performance and expectations sub-indices for most services sectors, except IT services, stayed in contractionary territory. Average SMEI for manufacturing and services SMEs eased 1pt and 1.1pts from Q2 to 51.4 and 49.5 in Q3, respectively, as demand softened.”
Scope for the Euro (EUR) to test 1.1155; a sustained break above this level seems unlikely. IN the longer run, EUR is likely to continue to rise, but it is unclear if it has sufficient momentum to break above the y-t-d high, near 1.1200, UOB Group FX strategists Quek Ser Leang and Lee Sue Ann note.
Above 1.1155 bulls may push towards 1.1200
24-HOUR VIEW: “Yesterday, EUR rose and closed on a strong note at 1.1132 (+0.51%). Strong momentum suggests there is scope for EUR to test 1.1155. A sustained break above this level seems unlikely, and the year-to-date high, near 1.1200, is not expected to come under threat. Support levels are at 1.1105 and 1.1085.”
1-3 WEEKS VIEW: “After dropping to a low of 1.1001 in the middle of last week, EUR rebounded strongly, reaching a high of 1.1137 yesterday. Upward momentum has increased. From here, EUR is likely to continue to rise, but it is unclear at this time if it has sufficient momentum to break above the year-to-date high, near 1.1200. To maintain momentum, EUR must remain above 1.1040.”
- The daily chart analysis of the NZD/USD pair suggests that selling pressure is weakening and signals a potential bullish reversal.
- The pair may explore the area around its seven-month high of 0.6247.
- The nine-day EMA at 0.6181 level appears as an immediate support, followed by the upper boundary of the descending wedge.
NZD/USD trades around 0.6200 during the European session on Tuesday. On the daily chart, the NZD/USD pair has breached the upper boundary of the descending wedge. This suggests that selling pressure is weakening, and it can signal a potential bullish reversal, especially if followed by an upward breakout.
The 14-day Relative Strength Index (RSI) remains above the 50 level, signaling a bullish trend. Furthermore, the nine-day Exponential Moving Average (EMA) is above the 14-day EMA, indicating that the NZD/USD pair is experiencing short-term upward momentum and is expected to continue its rise.
On the upside, the NZD/USD pair seems to explore the region around its seven-month high of 0.6247 recorded on August 21. A break above this level could drive the pair toward the psychological level of 0.6300.
In terms of support, the NZD/USD pair may test the immediate nine-day EMA at 0.6181 level, followed by the upper boundary of the descending wedge at 0.6150 level. A return to the descending wedge may reinforce the bearish bias and put pressure on the pair to test the 50-day EMA at the 0.6122 level, followed by the lower boundary of the descending wedge at the 0.6080 level.
NZD/USD: Daily Chart
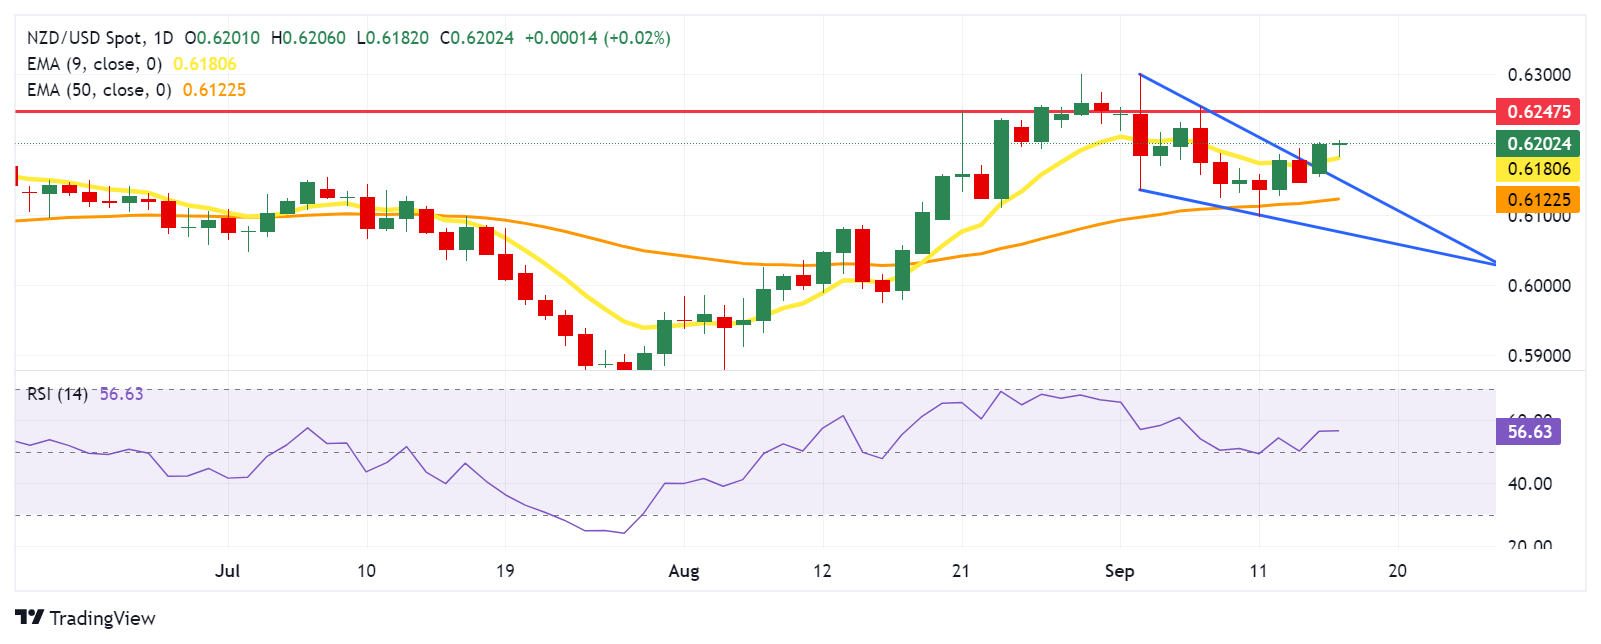
New Zealand Dollar PRICE Today
The table below shows the percentage change of New Zealand Dollar (NZD) against listed major currencies today. New Zealand Dollar was the strongest against the US Dollar.
| USD | EUR | GBP | JPY | CAD | AUD | NZD | CHF | |
|---|---|---|---|---|---|---|---|---|
| USD | -0.03% | -0.01% | 0.00% | -0.01% | -0.15% | -0.05% | -0.16% | |
| EUR | 0.03% | 0.02% | 0.02% | -0.01% | -0.14% | -0.03% | -0.12% | |
| GBP | 0.00% | -0.02% | 0.00% | 0.00% | -0.16% | -0.04% | -0.18% | |
| JPY | 0.00% | -0.02% | 0.00% | -0.01% | -0.15% | -0.05% | -0.19% | |
| CAD | 0.00% | 0.01% | -0.00% | 0.01% | -0.14% | -0.03% | -0.18% | |
| AUD | 0.15% | 0.14% | 0.16% | 0.15% | 0.14% | 0.10% | -0.05% | |
| NZD | 0.05% | 0.03% | 0.04% | 0.05% | 0.03% | -0.10% | -0.14% | |
| CHF | 0.16% | 0.12% | 0.18% | 0.19% | 0.18% | 0.05% | 0.14% |
The heat map shows percentage changes of major currencies against each other. The base currency is picked from the left column, while the quote currency is picked from the top row. For example, if you pick the New Zealand Dollar from the left column and move along the horizontal line to the US Dollar, the percentage change displayed in the box will represent NZD (base)/USD (quote).
- The Canadian Consumer Price Index is expected to lose further traction in August.
- The Bank of Canada has reduced its policy rate by 75 bps so far this year.
- The Canadian Dollar seems to have embarked on a consolidative phase.
Canada is set to release the latest inflation data on Tuesday, with Statistics Canada publishing the Consumer Price Index (CPI) figures for July. Projections indicate a continuation of disinflationary trends in both the headline and the core CPI.
In addition to the headline CPI data, the Bank of Canada (BoC) will release its core CPI, which excludes volatile items such as food and energy. In July, the BoC's core CPI showed a 0.3% gain from July and a 1.7% increase over the past year. Meanwhile, the headline CPI rose by 2.5% over the last 12 months, the lowest level in the last 40 months and 0.4% from a month earlier.
These figures are being closely watched, as they could affect the Canadian Dollar (CAD) in the near term via the Bank of Canada's monetary policy, particularly following the central bank's additional 25-basis-point cut to its policy rate earlier in the month, bringing it to 4.25%.
In the FX market, the Canadian Dollar remains sidelined below 1.3600, a region also coincident with the key 200-day SMA. The ongoing rangebound theme follows monthly peaks in the 1.3625-1.3620 band recorded on September 11.
What can we expect from Canada’s inflation rate?
Analysts expect price pressure in Canada to continue their downward trend in August, although they are still likely to remain above the Bank of Canada's target. However, the persistence of disinflationary pressure should lead the BoC to maintain its easing cycle unchanged at its upcoming meetings. It is worth recalling that the central bank has already lowered its interest rate by 75 bps since it started its easing cycle earlier in the year.
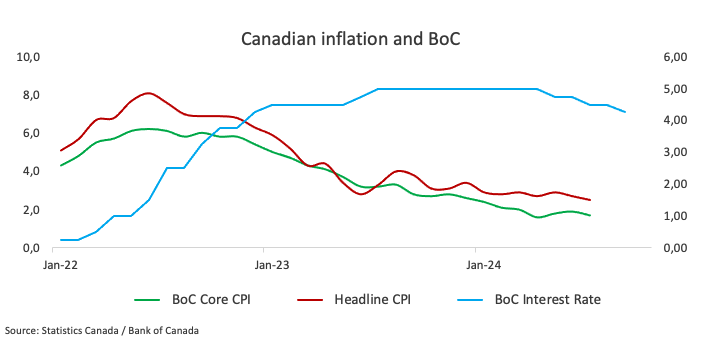
Following the BoC’s rate cut on September 4, Governor Tiff Macklem noted that a 25 bps rate cut was appropriate, although a larger rate cut could be considered in case the economy was weaker than expected.
Regarding inflation, BoC Governor Tiff Macklem argued in a speech to the Canada-UK Chamber of Commerce in London on September 10 that global trade disruptions could make it more challenging for the central bank to consistently achieve its 2% inflation target. He explained that the BoC would need to balance the risks of controlling rising prices while supporting economic growth.
Macklem noted that with globalization slowing down, the cost of global goods might not decrease as much as before, potentially leading to increased upward pressure on inflation. He mentioned that "trade disruptions may also increase the variability of inflation," pointing out the impact that supply shocks can have on prices. He added that such disruptions could result in "larger deviations of inflation from the 2% target." Consequently, he said the Bank of Canada is focussing on risk management to balance inflation and economic growth and is investing in efforts to better understand global supply chains.
Analysts at TD Securities noted, “Base effects will contribute to a sharp (0.4pp) deceleration for headline CPI alongside further progress on core measures as softer energy prices and seasonal headwinds hold prices unchanged m/m”.
When is the Canada CPI data due, and how could it affect USD/CAD?
Canada is set to release its July CPI on Tuesday at 12:30 GMT. The Canadian Dollar's reaction will largely depend on how the data impacts expectations for the Bank of Canada's (BoC) monetary policy. Unless the figures contain significant surprises, the BoC is anticipated to maintain its current easing approach.
USD/CAD started the month with a decent upward bias, reaching monthly highs around 1.3620 last week. The monthly advance has so far been on the back of further depreciation of the Canadian currency, which has been losing momentum since the August tops near 1.3440 vs. the US Dollar (USD).
Pablo Piovano, a senior analyst at FXStreet, points out that USD/CAD appears well-supported around the critical 200-day Simple Moving Average (SMA) near 1.3590. A break below this level could trigger further weakness, potentially targeting the next support level at the August bottom of 1.3436 (August 28), just ahead of the March low of 1.3419 (March 8), and the weekly low of 1.3358 (January 31).
On the upside, Pablo notes that immediate resistance is located at the September peak of 1.3622 (September 11). The breakout of this region could expose provisional barriers at the 55-day and 100-day SMAs of 1.3659 and 1.3664, respectively, prior to the 2024 top of 1.3946 (August 5).
Pablo also mentioned that any significant increases in CAD volatility would likely hinge on unexpected CPI results. If inflation data comes in below expectations, it could strengthen the case for another BoC interest rate cut at the next meeting, potentially leading to a rise in USD/CAD. Conversely, if inflation exceeds expectations, the Canadian Dollar might experience only modest gains.
Economic Indicator
Consumer Price Index (YoY)
The Consumer Price Index (CPI), released by Statistics Canada on a monthly basis, represents changes in prices for Canadian consumers by comparing the cost of a fixed basket of goods and services. The YoY reading compares prices in the reference month to the same month a year earlier. Generally, a high reading is seen as bullish for the Canadian Dollar (CAD), while a low reading is seen as bearish.
Read more.Last release: Tue Aug 20, 2024 12:30
Frequency: Monthly
Actual: 2.5%
Consensus: 2.5%
Previous: 2.7%
Source: Statistics Canada
Inflation FAQs
Inflation measures the rise in the price of a representative basket of goods and services. Headline inflation is usually expressed as a percentage change on a month-on-month (MoM) and year-on-year (YoY) basis. Core inflation excludes more volatile elements such as food and fuel which can fluctuate because of geopolitical and seasonal factors. Core inflation is the figure economists focus on and is the level targeted by central banks, which are mandated to keep inflation at a manageable level, usually around 2%.
The Consumer Price Index (CPI) measures the change in prices of a basket of goods and services over a period of time. It is usually expressed as a percentage change on a month-on-month (MoM) and year-on-year (YoY) basis. Core CPI is the figure targeted by central banks as it excludes volatile food and fuel inputs. When Core CPI rises above 2% it usually results in higher interest rates and vice versa when it falls below 2%. Since higher interest rates are positive for a currency, higher inflation usually results in a stronger currency. The opposite is true when inflation falls.
Although it may seem counter-intuitive, high inflation in a country pushes up the value of its currency and vice versa for lower inflation. This is because the central bank will normally raise interest rates to combat the higher inflation, which attract more global capital inflows from investors looking for a lucrative place to park their money.
Formerly, Gold was the asset investors turned to in times of high inflation because it preserved its value, and whilst investors will often still buy Gold for its safe-haven properties in times of extreme market turmoil, this is not the case most of the time. This is because when inflation is high, central banks will put up interest rates to combat it. Higher interest rates are negative for Gold because they increase the opportunity-cost of holding Gold vis-a-vis an interest-bearing asset or placing the money in a cash deposit account. On the flipside, lower inflation tends to be positive for Gold as it brings interest rates down, making the bright metal a more viable investment alternative.
- AUD/USD attracts some follow-through buyers and climbs to a nearly two-week high.
- 50 bps Fed rate cut bets, and a positive risk tone undermines the USD, lending support.
- Traders look to US Retail Sales data for some impetus ahead of the Fed on Wednesday.
The AUD/USD pair gains traction for the second straight day on Tuesday – also marking the fourth day of a positive move – and climbs to a one-and-half-week high during the early part of the European session. Spot prices currently trade above mid-0.6700s, up around 0.15% for the day, as investors look to the outcome of a two-day Federal Open Market Committee (FOMC) meeting on Wednesday for a fresh directional impetus.
Heading into the key central bank event risk, the US Dollar (USD) consolidates its recent heavy losses to the lowest level since July 2023 amid bets for an oversized 50 basis points interest rate cut by the Federal Reserve (Fed). This, along with the Reserve Bank of Australia's (RBA) hawkish outlook and a generally positive tone around the equity markets, turns out to be a key factor benefiting the risk-sensitive Aussie and lending some support to the AUD/USD pair.
With the latest leg up, spot prices have now rallied nearly 150 pips from the vicinity of the very important 200-day Simple Moving Average (SMA) support, around the 0.6620 region, or a nearly four-week low touched last Wednesday. Moreover, the fundamental backdrop seems tilted in favor of the USD bears and suggests that the path of least resistance for the AUD/USD pair is to the upside. That said, concerns about a slowdown in China could act as a headwind.
In fact, a string of downbeat Chinese data released over the weekend pointed to more economic weakness and challenges in reaching the official target of around 5% GDP growth rate in 2024. This, in turn, could act as a headwind for the China-proxy Australian Dollar (USD). Traders might also prefer to wait for more cues about the Fed's rate-cut path, warranting some caution before placing fresh bullish bets around the AUD/USD pair.
Next on tap is the release of the US monthly Retail Sales figures, which, along with the US bond yields and the broader risk sentiment, will drive the USD demand and provide some impetus to the currency pair. The market reaction to the US macro data, meanwhile, is more likely to be limited as the focus remains glued to the crucial Fed policy decision.
Economic Indicator
Industrial Production (YoY)
Industrial output is released by the National Bureau of Statistics of China. It shows the volume of production of Chinese Industries such as factories and manufacturing facilities. A surge in output is regarded as inflationary which would prompt the People’s Bank of China would tighten monetary policy and fiscal policy risk. Generally speaking, if high industrial production growth comes out, this may generate a positive sentiment (or bullish) for the CNY, whereas a low reading is seen as negative (or Bearish) for the CNY.
Read more.Last release: Sat Sep 14, 2024 02:00
Frequency: Monthly
Actual: 4.5%
Consensus: 4.8%
Previous: 5.1%
- The Pound Sterling holds gains near 1.3200 against the US Dollar as bets supporting the Fed to opt for a large interest-rate cut surge.
- Investors expect the BoE to leave interest rates unchanged at 5% on Thursday.
- The UK core CPI is estimated to have accelerated to 3.5% in August.
The Pound Sterling (GBP) edges lower against the US Dollar (USD) but clings to gains near the round-level support of 1.3200 in Tuesday’s London session. The outlook of the GBP/USD pair remains firm as the US Dollar remains under pressure ahead of the Federal Reserve’s (Fed) monetary policy decision on Wednesday.
The US Dollar Index (DXY), which tracks the Greenback’s value against six major currencies, hovers close to a year-to-date (YTD) low near 100.50 amid firm speculation that the Fed will start its policy-easing cycle aggressively.
The Fed is widely expected to cut interest rates for the first time in more than four years. The Fed has maintained a restrictive monetary policy stance due to a fierce battle against stubborn inflation, which was prompted by pandemic-led stimulus.
Market expectations for the Fed to begin reducing interest rates by a wide margin have risen overnight after dovish comments from Jon Faust, a former senior adviser to Fed Chairman Jerome Powell, in comments to the Wall Street Journal (WSJ). Faust said that his preference “would be slightly toward starting with 50 (basis-points interest-rate cut)” as he thinks that several policymakers would forecast a 100-bps interest rate cut by the year-end. “If that is the case, leading off with a 25-basis-point cut risks raising awkward questions over why officials expect to deliver a larger rate cut later this year but didn’t lead with it”, he said.
According to the CME FedWatch tool, the probability of the Fed reducing interest rates by 50 bps to 4.75%-5.00% in September has increased sharply to 69% from 34% a week ago.
In Tuesday’s session, investors will focus on the monthly United States Retail Sales data for August, which will be published at 12:30 GMT. The Census Bureau is expected to report that Retail Sales, a key measure for consumer spending, grew by 0.2%, slower than the 1% increase seen in July.
Daily digest market movers: Pound Sterling to be influenced by UK August inflation data
- The Pound Sterling weakens slightly against its major peers on Tuesday. The British currency appears to perform cautiously as investors await the United Kingdom (UK) Consumer Price Index (CPI) data for August, which will be published on Wednesday. The inflation data will significantly influence market speculation for the Bank of England (BoE) interest rate path for the last quarter of the year as it is expected to leave interest rates unchanged on Thursday.
- The UK CPI report is expected to show that the annual core inflation – which excludes volatile components such as food, energy, alcohol, and tobacco – grew at a faster pace of 3.5% from 3.3% in July, with headline inflation steady at 2.2%. Any signs showing that UK inflation remains persistent would result in the BoE emphasizing the need to keep interest rates unchanged at their current levels in November’s policy meeting. On the contrary, soft inflation figures would allow the BoE to deliver dovish guidance. Currently, financial market participants expect that the BoE will cut interest rates one more time, either in November or in December.
- In the UK CPI report, investors will keenly focus on the Service inflation data, which is closely tracked by BoE officials. In July, annual service inflation decelerated sharply to 5.2%, the lowest figure in more than two years.
Technical Analysis: Pound Sterling grips gains near 1.3200
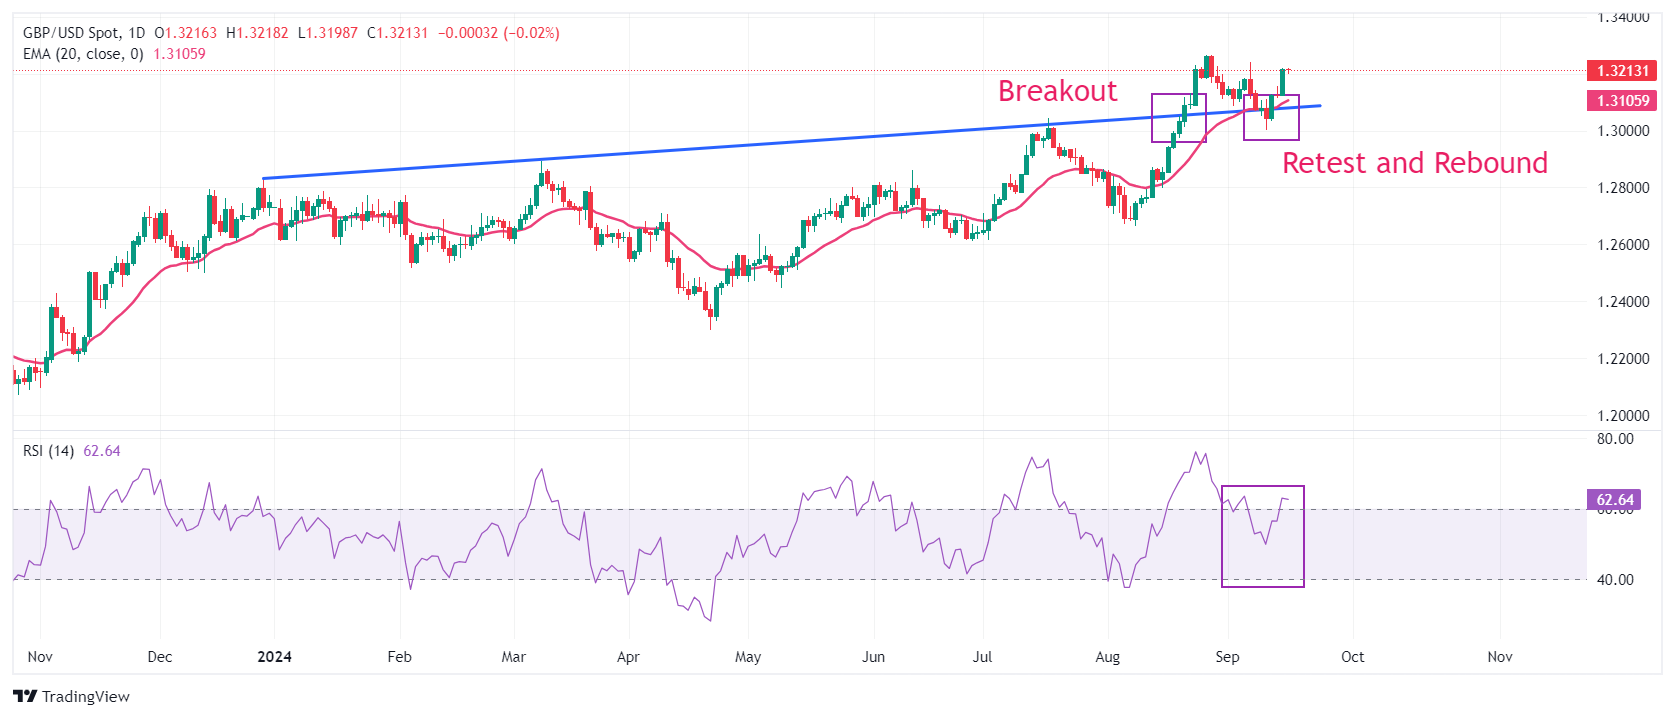
The Pound Sterling holds gains near 1.3200 against the US Dollar in European trading hours. The near-term outlook of the GBP/USD pair remains firm as it holds above the 20-day Exponential Moving Average (EMA) near 1.3100. Earlier, the Cable strengthened after recovering from a corrective move to near the trendline plotted from the December 28, 2023, high of 1.2828, from where it delivered a sharp increase after a breakout on August 21.
The 14-day Relative Strength Index (RSI) stands above 60.00. A fresh round of bullish momentum could occur if the oscillator sustains around this level.
Looking up, the Cable will face resistance near the August 27 high of 1.3266 and the psychological level of 1.3500. On the downside, the psychological level of 1.3000 emerges as crucial support.
Pound Sterling FAQs
The Pound Sterling (GBP) is the oldest currency in the world (886 AD) and the official currency of the United Kingdom. It is the fourth most traded unit for foreign exchange (FX) in the world, accounting for 12% of all transactions, averaging $630 billion a day, according to 2022 data. Its key trading pairs are GBP/USD, aka ‘Cable’, which accounts for 11% of FX, GBP/JPY, or the ‘Dragon’ as it is known by traders (3%), and EUR/GBP (2%). The Pound Sterling is issued by the Bank of England (BoE).
The single most important factor influencing the value of the Pound Sterling is monetary policy decided by the Bank of England. The BoE bases its decisions on whether it has achieved its primary goal of “price stability” – a steady inflation rate of around 2%. Its primary tool for achieving this is the adjustment of interest rates. When inflation is too high, the BoE will try to rein it in by raising interest rates, making it more expensive for people and businesses to access credit. This is generally positive for GBP, as higher interest rates make the UK a more attractive place for global investors to park their money. When inflation falls too low it is a sign economic growth is slowing. In this scenario, the BoE will consider lowering interest rates to cheapen credit so businesses will borrow more to invest in growth-generating projects.
Data releases gauge the health of the economy and can impact the value of the Pound Sterling. Indicators such as GDP, Manufacturing and Services PMIs, and employment can all influence the direction of the GBP. A strong economy is good for Sterling. Not only does it attract more foreign investment but it may encourage the BoE to put up interest rates, which will directly strengthen GBP. Otherwise, if economic data is weak, the Pound Sterling is likely to fall.
Another significant data release for the Pound Sterling is the Trade Balance. This indicator measures the difference between what a country earns from its exports and what it spends on imports over a given period. If a country produces highly sought-after exports, its currency will benefit purely from the extra demand created from foreign buyers seeking to purchase these goods. Therefore, a positive net Trade Balance strengthens a currency and vice versa for a negative balance.
- EUR/GBP trades on a flat note near 0.8420 in Tuesday’s Asian session.
- ECB’s Kazaks said the central bank will ease monetary policy further, though it shouldn’t do so too hastily.
- The BoE is anticipated to leave the interest rate unchanged at its September meeting on Thursday.
The EUR/GBP cross remains steady around 0.8420 on Tuesday during the early European trading hours. The European Central Bank (ECB) rate cut and lower growth forecasts might further weigh on the Euro (EUR) in the near term. Investors await the UK and Eurozone August inflation data on Wednesday for fresh impetus. On Thursday, the Bank of England's (BoE) interest rate decision will be in the spotlight.
The ECB decided to reduce its key deposit rate a quarter point to 3.5% last week as inflation eases. It was the second cut, after the first move in June. ECB President stated during the press conference that the interest rate path ahead was "not pre-determined” and the central bank shall be "data dependent.” On Monday, ECB Governing Council member Martins Kazaks said that the central bank will ease monetary policy further, though it shouldn’t do so too hastily due to lingering inflation risks.
The release of the Eurozone Harmonized Index of Consumer Prices (HICP) on Wednesday could offer some hints about the inflation trajectory in the Eurozone and might influence the ECB about the next move. The headline and core inflation are projected to remain unchanged on a yearly basis in August. However, the hotter-than-expected outcome might prompt the ECB to slow its interest rate cut pace, which might lift the shared currency.
On the other hand, the Bank of England (BoE) is expected to hold an interest rate at 5.0% on Thursday. However, cooling wage growth might trigger the UK central bank to cut at least once more by the end of the year. “The tone of the August meeting and subsequent speeches have made it abundantly clear that officials don’t want markets running away with the idea that this is going to be a rapid easing cycle,” said James Smith, an economist at ING.
On Wednesday, the UK Consumer Price Index (CPI) inflation data will be released. The CPI is expected to show an increase of 2.2% YoY in August, while the core CPI is estimated to rise 3.5% in the same reported period. The softer reading could prompt the BoE to consider another cut in November.
BoE FAQs
The Bank of England (BoE) decides monetary policy for the United Kingdom. Its primary goal is to achieve ‘price stability’, or a steady inflation rate of 2%. Its tool for achieving this is via the adjustment of base lending rates. The BoE sets the rate at which it lends to commercial banks and banks lend to each other, determining the level of interest rates in the economy overall. This also impacts the value of the Pound Sterling (GBP).
When inflation is above the Bank of England’s target it responds by raising interest rates, making it more expensive for people and businesses to access credit. This is positive for the Pound Sterling because higher interest rates make the UK a more attractive place for global investors to park their money. When inflation falls below target, it is a sign economic growth is slowing, and the BoE will consider lowering interest rates to cheapen credit in the hope businesses will borrow to invest in growth-generating projects – a negative for the Pound Sterling.
In extreme situations, the Bank of England can enact a policy called Quantitative Easing (QE). QE is the process by which the BoE substantially increases the flow of credit in a stuck financial system. QE is a last resort policy when lowering interest rates will not achieve the necessary result. The process of QE involves the BoE printing money to buy assets – usually government or AAA-rated corporate bonds – from banks and other financial institutions. QE usually results in a weaker Pound Sterling.
Quantitative tightening (QT) is the reverse of QE, enacted when the economy is strengthening and inflation starts rising. Whilst in QE the Bank of England (BoE) purchases government and corporate bonds from financial institutions to encourage them to lend; in QT, the BoE stops buying more bonds, and stops reinvesting the principal maturing on the bonds it already holds. It is usually positive for the Pound Sterling.
Here is what you need to know on Tuesday, September 17:
The US Dollar (USD) continued to weaken against its major rivals at the beginning of the week, with the USD Index losing 0.4% on the day. As market attention turns to US data releases ahead of Wednesday's all-important Federal Reserve (Fed) monetary policy announcements, investors seem to be moving to the sidelines. In the European session, Germany's ZEW Institute will publish September Economic Sentiment data for Germany and the Eurozone. In the second half of the day, August Retail Sales and Industrial Production data will be featured in the US economic docket.
US Dollar PRICE Last 7 days
The table below shows the percentage change of US Dollar (USD) against listed major currencies last 7 days. US Dollar was the weakest against the Japanese Yen.
| USD | EUR | GBP | JPY | CAD | AUD | NZD | CHF | |
|---|---|---|---|---|---|---|---|---|
| USD | -0.84% | -1.04% | -1.83% | 0.21% | -1.41% | -0.76% | -0.62% | |
| EUR | 0.84% | -0.20% | -1.00% | 1.06% | -0.58% | 0.04% | 0.21% | |
| GBP | 1.04% | 0.20% | -0.80% | 1.22% | -0.37% | 0.25% | 0.44% | |
| JPY | 1.83% | 1.00% | 0.80% | 2.07% | 0.43% | 1.07% | 1.23% | |
| CAD | -0.21% | -1.06% | -1.22% | -2.07% | -1.62% | -0.97% | -0.82% | |
| AUD | 1.41% | 0.58% | 0.37% | -0.43% | 1.62% | 0.65% | 0.81% | |
| NZD | 0.76% | -0.04% | -0.25% | -1.07% | 0.97% | -0.65% | 0.16% | |
| CHF | 0.62% | -0.21% | -0.44% | -1.23% | 0.82% | -0.81% | -0.16% |
The heat map shows percentage changes of major currencies against each other. The base currency is picked from the left column, while the quote currency is picked from the top row. For example, if you pick the US Dollar from the left column and move along the horizontal line to the Japanese Yen, the percentage change displayed in the box will represent USD (base)/JPY (quote).
Following Monday's slide, the USD Index holds steady below 101.00 in the European morning on Tuesday. In the meantime, the benchmark 10-year US Treasury bond yield clings to small daily gains above 3.6%, while US stock index futures trade flat.
EUR/USD gathered bullish momentum and Monday and climbed to a fresh 10-day high above 1.1100. Early Tuesday, the pair stays in a consolidation phase near Monday's closing level.
GBP/USD extended its rebound to begin the week and rose above 1.3200 for the first time in over a week. The pair fluctuates in a narrow channel at around 1.3210 in the European morning. Early Wednesday, the UK's Office for National Statistics will release the August inflation report.
Statistics Canada will publish Consumer Price Index (CPI) data for August later in the day. On a monthly basis, the CPI is forecast to rise 0.1% following the 0.4% increase recorded in July. After closing the first day of the week virtually unchanged, USD/CAD holds steady to start the European session and trades slightly below 1.3600.
AUD/USD started the week on a firm footing and gained 0.7% despite the latest batch of disappointing macroeconomic data releases from China. The pair stays relatively quiet on Tuesday and moves up and down in a narrow band at around 0.6750.
After touching its lowest level in over a year below 140.00 on Monday, USD/JPY staged a rebound and erased the majority of its daily losses. The pair stays calm near 140.50 in the European morning.
Gold set a new record-high near $2,590 on Monday but failed to preserve its bullish momentum. XAU/USD trades above $2,580 early Tuesday.
Central banks FAQs
Central Banks have a key mandate which is making sure that there is price stability in a country or region. Economies are constantly facing inflation or deflation when prices for certain goods and services are fluctuating. Constant rising prices for the same goods means inflation, constant lowered prices for the same goods means deflation. It is the task of the central bank to keep the demand in line by tweaking its policy rate. For the biggest central banks like the US Federal Reserve (Fed), the European Central Bank (ECB) or the Bank of England (BoE), the mandate is to keep inflation close to 2%.
A central bank has one important tool at its disposal to get inflation higher or lower, and that is by tweaking its benchmark policy rate, commonly known as interest rate. On pre-communicated moments, the central bank will issue a statement with its policy rate and provide additional reasoning on why it is either remaining or changing (cutting or hiking) it. Local banks will adjust their savings and lending rates accordingly, which in turn will make it either harder or easier for people to earn on their savings or for companies to take out loans and make investments in their businesses. When the central bank hikes interest rates substantially, this is called monetary tightening. When it is cutting its benchmark rate, it is called monetary easing.
A central bank is often politically independent. Members of the central bank policy board are passing through a series of panels and hearings before being appointed to a policy board seat. Each member in that board often has a certain conviction on how the central bank should control inflation and the subsequent monetary policy. Members that want a very loose monetary policy, with low rates and cheap lending, to boost the economy substantially while being content to see inflation slightly above 2%, are called ‘doves’. Members that rather want to see higher rates to reward savings and want to keep a lit on inflation at all time are called ‘hawks’ and will not rest until inflation is at or just below 2%.
Normally, there is a chairman or president who leads each meeting, needs to create a consensus between the hawks or doves and has his or her final say when it would come down to a vote split to avoid a 50-50 tie on whether the current policy should be adjusted. The chairman will deliver speeches which often can be followed live, where the current monetary stance and outlook is being communicated. A central bank will try to push forward its monetary policy without triggering violent swings in rates, equities, or its currency. All members of the central bank will channel their stance toward the markets in advance of a policy meeting event. A few days before a policy meeting takes place until the new policy has been communicated, members are forbidden to talk publicly. This is called the blackout period.
- USD/CAD appreciates due to the rising likelihood of further interest rate cuts by the Bank of Canada.
- BoC Governor Tiff Macklem stated that policymakers could switch to a 50 basis point rate cut if economic growth underperforms.
- CME FedWatch Tool suggests odds of a 50 basis points Fed interest rate cut have surged to 62.0%.
USD/CAD recovers its recent losses registered in the previous session, trading around 1.3600 during Tuesday’s Asian hours. The Canadian Dollar (CAD) might have received downward pressure from growing expectations of further interest rate cuts by the Bank of Canada (BoC).
Additionally, the recent comments of Bank of Canada (BoC) Governor Tiff Macklem might have put downward pressure on the Canadian Dollar. Macklem has opened the door to accelerating the pace of interest rate reductions. He further stated that policymakers could switch to a 50 basis point (bps) rate cut if economic growth underperforms, per the Financial Times.
Traders will likely monitor Canada's Consumer Price Index (CPI) data for August, scheduled for release later in the North American session. This inflation report could offer fresh insights into the Bank of Canada's outlook ahead of its October policy decision.
However, the upside of the USD/CAD pair may be limited as the US Dollar faces challenges amid increasing expectations of an aggressive 50 basis points Fed rate cut on Wednesday. However, the improved US Treasury yields could support for Greenback.
The US Dollar Index (DXY), which measures the value of the US Dollar against its six other major peers, trading around 100.70 with 2-year and 10-year standing at 3.56% and 3.63%, respectively, at the time of writing.
According to the CME FedWatch Tool, markets are pricing in a 38.0% chance of a 25 basis point Federal Reserve interest rate cut at the September meeting, while the probability of a 50 basis point cut has surged to 62.0%, up from 50.0% just a day earlier. This shift reflects heightened anticipation of more aggressive monetary easing.
Canadian Dollar FAQs
The key factors driving the Canadian Dollar (CAD) are the level of interest rates set by the Bank of Canada (BoC), the price of Oil, Canada’s largest export, the health of its economy, inflation and the Trade Balance, which is the difference between the value of Canada’s exports versus its imports. Other factors include market sentiment – whether investors are taking on more risky assets (risk-on) or seeking safe-havens (risk-off) – with risk-on being CAD-positive. As its largest trading partner, the health of the US economy is also a key factor influencing the Canadian Dollar.
The Bank of Canada (BoC) has a significant influence on the Canadian Dollar by setting the level of interest rates that banks can lend to one another. This influences the level of interest rates for everyone. The main goal of the BoC is to maintain inflation at 1-3% by adjusting interest rates up or down. Relatively higher interest rates tend to be positive for the CAD. The Bank of Canada can also use quantitative easing and tightening to influence credit conditions, with the former CAD-negative and the latter CAD-positive.
The price of Oil is a key factor impacting the value of the Canadian Dollar. Petroleum is Canada’s biggest export, so Oil price tends to have an immediate impact on the CAD value. Generally, if Oil price rises CAD also goes up, as aggregate demand for the currency increases. The opposite is the case if the price of Oil falls. Higher Oil prices also tend to result in a greater likelihood of a positive Trade Balance, which is also supportive of the CAD.
While inflation had always traditionally been thought of as a negative factor for a currency since it lowers the value of money, the opposite has actually been the case in modern times with the relaxation of cross-border capital controls. Higher inflation tends to lead central banks to put up interest rates which attracts more capital inflows from global investors seeking a lucrative place to keep their money. This increases demand for the local currency, which in Canada’s case is the Canadian Dollar.
Macroeconomic data releases gauge the health of the economy and can have an impact on the Canadian Dollar. Indicators such as GDP, Manufacturing and Services PMIs, employment, and consumer sentiment surveys can all influence the direction of the CAD. A strong economy is good for the Canadian Dollar. Not only does it attract more foreign investment but it may encourage the Bank of Canada to put up interest rates, leading to a stronger currency. If economic data is weak, however, the CAD is likely to fall.
FX option expiries for Sept 17 NY cut at 10:00 Eastern Time, via DTCC, can be found below.
EUR/USD: EUR amounts
- 1.1025 1.7b
- 1.1030 1.9b
- 1.1050 779m
- 1.1100 909m
- 1.1125 1.4b
- 1.1140 728m
GBP/USD: GBP amounts
- 1.3000 532m
- 1.3100 765m
- 1.3300 511m
USD/JPY: USD amounts
- 138.00 545m
- 140.85 1.2b
- 141.00 560m
USD/CHF: USD amounts
- 0.8630 798m
AUD/USD: AUD amounts
- 0.6630 1.2b
- 0.6845 994m
USD/CAD: USD amounts
- 1.3550 446m
- 1.3650 1.9b
NZD/USD: NZD amounts
- 0.6005 1b
- 0.6355 434m
EUR/GBP: EUR amounts
- 0.8400 771m
- 0.8440 400m
- USD/CHF edges lower to near 0.8440 in Tuesday’s Asian session.
- The US Dollar remains under pressure amid dovish Fed.
- Economists see the SNB cut rates by another quarter-point cut on September 26.
The USD/CHF pair trades in negative territory for the fourth consecutive day around 0.8440 during the early European session on Tuesday. The rising expectation that the US Federal Reserve (Fed) will cut a larger interest rate at its upcoming monetary policy meeting on Wednesday weighs on the US Dollar (USD). Ahead of the key event, the US Retail Sales for August are due on Tuesday.
The USD traded near the lowest levels of the year in the previous session as markets are betting on an outsized rate cut by the Fed. Fed Chair Jerome Powel said last month at the Jackson Hole that inflation had come under control just enough for the Fed to finally feel comfortable dialing back policy.
The Federal Reserve is widely anticipated to cut the interest rate at its September on Wednesday, the first time in four years. Investors will also take more cues from interest rate projections, known as the "dot plot”. The expectation of aggressive rate cuts might continue to undermine the Greenback in the near term.
On the Swiss front, economists forecast the Swiss National Bank (SNB) will lower rates by another quarter-point cut on September 26, Markets are now pricing in a roughly one-in-three chance, up from zero just a month ago, per Bloomberg. Meanwhile, the ongoing geopolitical tensions in the Middle East could boost the safe-haven demand, benefitting the Swiss Franc (CHF). Israeli Prime Minister Benjamin Netanyahu said on Sunday that Yemen's Houthis will pay a "heavy price" after a missile fired by the group landed in central Israel, according to the BBC.
Swiss Franc FAQs
The Swiss Franc (CHF) is Switzerland’s official currency. It is among the top ten most traded currencies globally, reaching volumes that well exceed the size of the Swiss economy. Its value is determined by the broad market sentiment, the country’s economic health or action taken by the Swiss National Bank (SNB), among other factors. Between 2011 and 2015, the Swiss Franc was pegged to the Euro (EUR). The peg was abruptly removed, resulting in a more than 20% increase in the Franc’s value, causing a turmoil in markets. Even though the peg isn’t in force anymore, CHF fortunes tend to be highly correlated with the Euro ones due to the high dependency of the Swiss economy on the neighboring Eurozone.
The Swiss Franc (CHF) is considered a safe-haven asset, or a currency that investors tend to buy in times of market stress. This is due to the perceived status of Switzerland in the world: a stable economy, a strong export sector, big central bank reserves or a longstanding political stance towards neutrality in global conflicts make the country’s currency a good choice for investors fleeing from risks. Turbulent times are likely to strengthen CHF value against other currencies that are seen as more risky to invest in.
The Swiss National Bank (SNB) meets four times a year – once every quarter, less than other major central banks – to decide on monetary policy. The bank aims for an annual inflation rate of less than 2%. When inflation is above target or forecasted to be above target in the foreseeable future, the bank will attempt to tame price growth by raising its policy rate. Higher interest rates are generally positive for the Swiss Franc (CHF) as they lead to higher yields, making the country a more attractive place for investors. On the contrary, lower interest rates tend to weaken CHF.
Macroeconomic data releases in Switzerland are key to assessing the state of the economy and can impact the Swiss Franc’s (CHF) valuation. The Swiss economy is broadly stable, but any sudden change in economic growth, inflation, current account or the central bank’s currency reserves have the potential to trigger moves in CHF. Generally, high economic growth, low unemployment and high confidence are good for CHF. Conversely, if economic data points to weakening momentum, CHF is likely to depreciate.
As a small and open economy, Switzerland is heavily dependent on the health of the neighboring Eurozone economies. The broader European Union is Switzerland’s main economic partner and a key political ally, so macroeconomic and monetary policy stability in the Eurozone is essential for Switzerland and, thus, for the Swiss Franc (CHF). With such dependency, some models suggest that the correlation between the fortunes of the Euro (EUR) and the CHF is more than 90%, or close to perfect.
- AUD/JPY depreciates due to the hawkish mood surrounding the BoJ interest rates outlook.
- Rabobank economists highlighted that JPY net long positions were at their highest level since October 2016.
- The Australian Dollar struggles due to rising concerns over China's economic outlook.
AUD/JPY holds losses, trading around 94.90 during the Asian hours on Tuesday. The downside of the AUD/JPY cross is driven by the hawkish sentiment surrounding the Bank of Japan (BoJ) interest rates outlook.
Rabobank economists Jane Foley and Molly Schwartz highlighted on Monday that JPY net long positions were at their highest level since October 2016. While there is minimal expectation for a rate hike by the Bank of Japan at its policy meeting on Friday, traders will be closely watching for any hints that October could potentially be a more active meeting.
Reuters reported on Tuesday that Japanese Finance Minister Shunichi Suzuki stated that rapid foreign exchange (FX) fluctuations are undesirable. Suzuki emphasized that officials will closely monitor how FX movements affect the Japanese economy and people's livelihoods. The government will continue to assess the impact of a stronger Japanese Yen and respond accordingly.
The Australian Dollar (AUD) receives downward pressure from rising fears over China's economic outlook. Analysts noted that the latest weak economic data indicates serious challenges for the world's second-largest economy. Since China is a key trading partner for Australia, fluctuations in China's economic health can have a significant effect on the Australian market.
Economists at Goldman Sachs and Citi have reduced their 2024 GDP growth forecasts for China to 4.7%, falling short of Beijing's target of around 5.0%. SocGen describes the situation as a "downward spiral," while Barclays calls it "from bad to worse" and a "vicious cycle." Morgan Stanley also cautions that "things could get worse before they get better," according to a Reuters report.
Interest rates FAQs
Interest rates are charged by financial institutions on loans to borrowers and are paid as interest to savers and depositors. They are influenced by base lending rates, which are set by central banks in response to changes in the economy. Central banks normally have a mandate to ensure price stability, which in most cases means targeting a core inflation rate of around 2%. If inflation falls below target the central bank may cut base lending rates, with a view to stimulating lending and boosting the economy. If inflation rises substantially above 2% it normally results in the central bank raising base lending rates in an attempt to lower inflation.
Higher interest rates generally help strengthen a country’s currency as they make it a more attractive place for global investors to park their money.
Higher interest rates overall weigh on the price of Gold because they increase the opportunity cost of holding Gold instead of investing in an interest-bearing asset or placing cash in the bank. If interest rates are high that usually pushes up the price of the US Dollar (USD), and since Gold is priced in Dollars, this has the effect of lowering the price of Gold.
The Fed funds rate is the overnight rate at which US banks lend to each other. It is the oft-quoted headline rate set by the Federal Reserve at its FOMC meetings. It is set as a range, for example 4.75%-5.00%, though the upper limit (in that case 5.00%) is the quoted figure. Market expectations for future Fed funds rate are tracked by the CME FedWatch tool, which shapes how many financial markets behave in anticipation of future Federal Reserve monetary policy decisions.
Gold prices fell in India on Tuesday, according to data compiled by FXStreet.
The price for Gold stood at 6,946.79 Indian Rupees (INR) per gram, down compared with the INR 6,961.83 it cost on Monday.
The price for Gold decreased to INR 81,025.94 per tola from INR 81,201.39 per tola a day earlier.
| Unit measure | Gold Price in INR |
|---|---|
| 1 Gram | 6,946.79 |
| 10 Grams | 69,467.85 |
| Tola | 81,025.94 |
| Troy Ounce | 216,069.30 |
FXStreet calculates Gold prices in India by adapting international prices (USD/INR) to the local currency and measurement units. Prices are updated daily based on the market rates taken at the time of publication. Prices are just for reference and local rates could diverge slightly.
Gold FAQs
Gold has played a key role in human’s history as it has been widely used as a store of value and medium of exchange. Currently, apart from its shine and usage for jewelry, the precious metal is widely seen as a safe-haven asset, meaning that it is considered a good investment during turbulent times. Gold is also widely seen as a hedge against inflation and against depreciating currencies as it doesn’t rely on any specific issuer or government.
Central banks are the biggest Gold holders. In their aim to support their currencies in turbulent times, central banks tend to diversify their reserves and buy Gold to improve the perceived strength of the economy and the currency. High Gold reserves can be a source of trust for a country’s solvency. Central banks added 1,136 tonnes of Gold worth around $70 billion to their reserves in 2022, according to data from the World Gold Council. This is the highest yearly purchase since records began. Central banks from emerging economies such as China, India and Turkey are quickly increasing their Gold reserves.
Gold has an inverse correlation with the US Dollar and US Treasuries, which are both major reserve and safe-haven assets. When the Dollar depreciates, Gold tends to rise, enabling investors and central banks to diversify their assets in turbulent times. Gold is also inversely correlated with risk assets. A rally in the stock market tends to weaken Gold price, while sell-offs in riskier markets tend to favor the precious metal.
The price can move due to a wide range of factors. Geopolitical instability or fears of a deep recession can quickly make Gold price escalate due to its safe-haven status. As a yield-less asset, Gold tends to rise with lower interest rates, while higher cost of money usually weighs down on the yellow metal. Still, most moves depend on how the US Dollar (USD) behaves as the asset is priced in dollars (XAU/USD). A strong Dollar tends to keep the price of Gold controlled, whereas a weaker Dollar is likely to push Gold prices up.
(An automation tool was used in creating this post.)
- EUR/USD loses traction around 1.1125 in Tuesday’s Asian session.
- Investors raise their speculation about the Fed's significant rate reduction at its September meeting on Wednesday.
- Eurozone HICP inflation data will be released on Wednesday.
The EUR/USD pair trades on a softer note near 1.1125 amid the modest recovery in US Dollar (USD) during the Asian trading hours on Tuesday. Traders brace for the release of US Retail Sales data, which is due later in the day. On Wednesday, the US Federal Reserve (Fed) interest rate decision will take center stage.
The two-day Fed meeting is scheduled for Tuesday and Wednesday. The markets will monitor whether the US central bank will implement a 50 basis points (bps) cut or stick to a 25 bps cut at its September meeting. Traders raise their bets that the Fed will cut a jumbo rate on Wednesday, pricing in a nearly 67% possibility of a reduction of 50 bps, up from 50% on Friday, according to the CME FedWatch Tool. The aggressive rate reduction from the Fed might underline the Greenback and act as a tailwind for EUR/USD.
The European Central Bank (ECB) decided to lower its interest rates last week, marking its second reduction in the deposit rate this year. ECB Governing Council member Martins Kazaks said on Monday that the central bank will ease monetary policy further, though it shouldn’t do so too hastily due to lingering inflation risks. Meanwhile, ECB policymaker Gabriel Makhlouf stated on Friday that the central bank will remain data-dependent when it comes to making future monetary policy decisions.
Investors await the Eurozone Harmonized Index of Consumer Prices (HICP) data for fresh impetus. The headline inflation is estimated to remain unchanged on a yearly basis in August. If the reading shows a hotter-than-expected outcome, this could lift the Euro (EUR) against the USD.
Euro FAQs
The Euro is the currency for the 20 European Union countries that belong to the Eurozone. It is the second most heavily traded currency in the world behind the US Dollar. In 2022, it accounted for 31% of all foreign exchange transactions, with an average daily turnover of over $2.2 trillion a day. EUR/USD is the most heavily traded currency pair in the world, accounting for an estimated 30% off all transactions, followed by EUR/JPY (4%), EUR/GBP (3%) and EUR/AUD (2%).
The European Central Bank (ECB) in Frankfurt, Germany, is the reserve bank for the Eurozone. The ECB sets interest rates and manages monetary policy. The ECB’s primary mandate is to maintain price stability, which means either controlling inflation or stimulating growth. Its primary tool is the raising or lowering of interest rates. Relatively high interest rates – or the expectation of higher rates – will usually benefit the Euro and vice versa. The ECB Governing Council makes monetary policy decisions at meetings held eight times a year. Decisions are made by heads of the Eurozone national banks and six permanent members, including the President of the ECB, Christine Lagarde.
Eurozone inflation data, measured by the Harmonized Index of Consumer Prices (HICP), is an important econometric for the Euro. If inflation rises more than expected, especially if above the ECB’s 2% target, it obliges the ECB to raise interest rates to bring it back under control. Relatively high interest rates compared to its counterparts will usually benefit the Euro, as it makes the region more attractive as a place for global investors to park their money.
Data releases gauge the health of the economy and can impact on the Euro. Indicators such as GDP, Manufacturing and Services PMIs, employment, and consumer sentiment surveys can all influence the direction of the single currency. A strong economy is good for the Euro. Not only does it attract more foreign investment but it may encourage the ECB to put up interest rates, which will directly strengthen the Euro. Otherwise, if economic data is weak, the Euro is likely to fall. Economic data for the four largest economies in the euro area (Germany, France, Italy and Spain) are especially significant, as they account for 75% of the Eurozone’s economy.
Another significant data release for the Euro is the Trade Balance. This indicator measures the difference between what a country earns from its exports and what it spends on imports over a given period. If a country produces highly sought after exports then its currency will gain in value purely from the extra demand created from foreign buyers seeking to purchase these goods. Therefore, a positive net Trade Balance strengthens a currency and vice versa for a negative balance.
- Silver struggles to gain any meaningful traction and oscillates in a range on Tuesday.
- The technical setup favors bullish traders and supports prospects for further gains.
- Any meaningful downfall could be seen as a buying opportunity and remain limited.
Silver (XAG/USD) trades with a positive bias around the $30.80-$30.85 area during the Asian session on Tuesday and remains well within the striking distance of a two-month peak touched the previous day.
From a technical perspective, Friday's convincing breakout through the $30.00 psychological mark barrier, which coincided with a short-term descending trend line, was seen as a fresh trigger for bullish traders. Moreover, oscillators on the daily chart have just started gaining positive traction and support prospects for a further near-term appreciating move for the XAG/USD.
Acceptance above the $31.00 mark will reaffirm the constructive outlook and lift the white metal to the next relevant hurdle near the $31.45-$31.50 supply zone. Some follow-through buying should allow bulls to aim back to reclaim the $32.00 mark. The momentum should allow the XAG/USD to aim back to challenge a one-decade high, around mid-$32.00s touched in May.
On the flip side, any meaningful corrective slide below the $30.50 immediate support is likely to attract fresh buyers and remain cushioned near the aforementioned descending trend-line resistance breakpoint, now turned support, near the $30.00 mark. The latter could act as a key pivotal point, which if broken might prompt some technical selling and make the XAG/USD vulnerable.
The subsequent fall could get extended towards the $29.40-$29.35 intermediate support en route to the $29.00 round figure. Some follow-through selling could drag the XAG/USD to the next relevant support near the $28.20-$28.15 zone. This is followed by the $28.00 mark and the monthly low, around the $27.70 area, which if broken might shift the bias back in favor of bearish traders.
XAG/USD daily chart
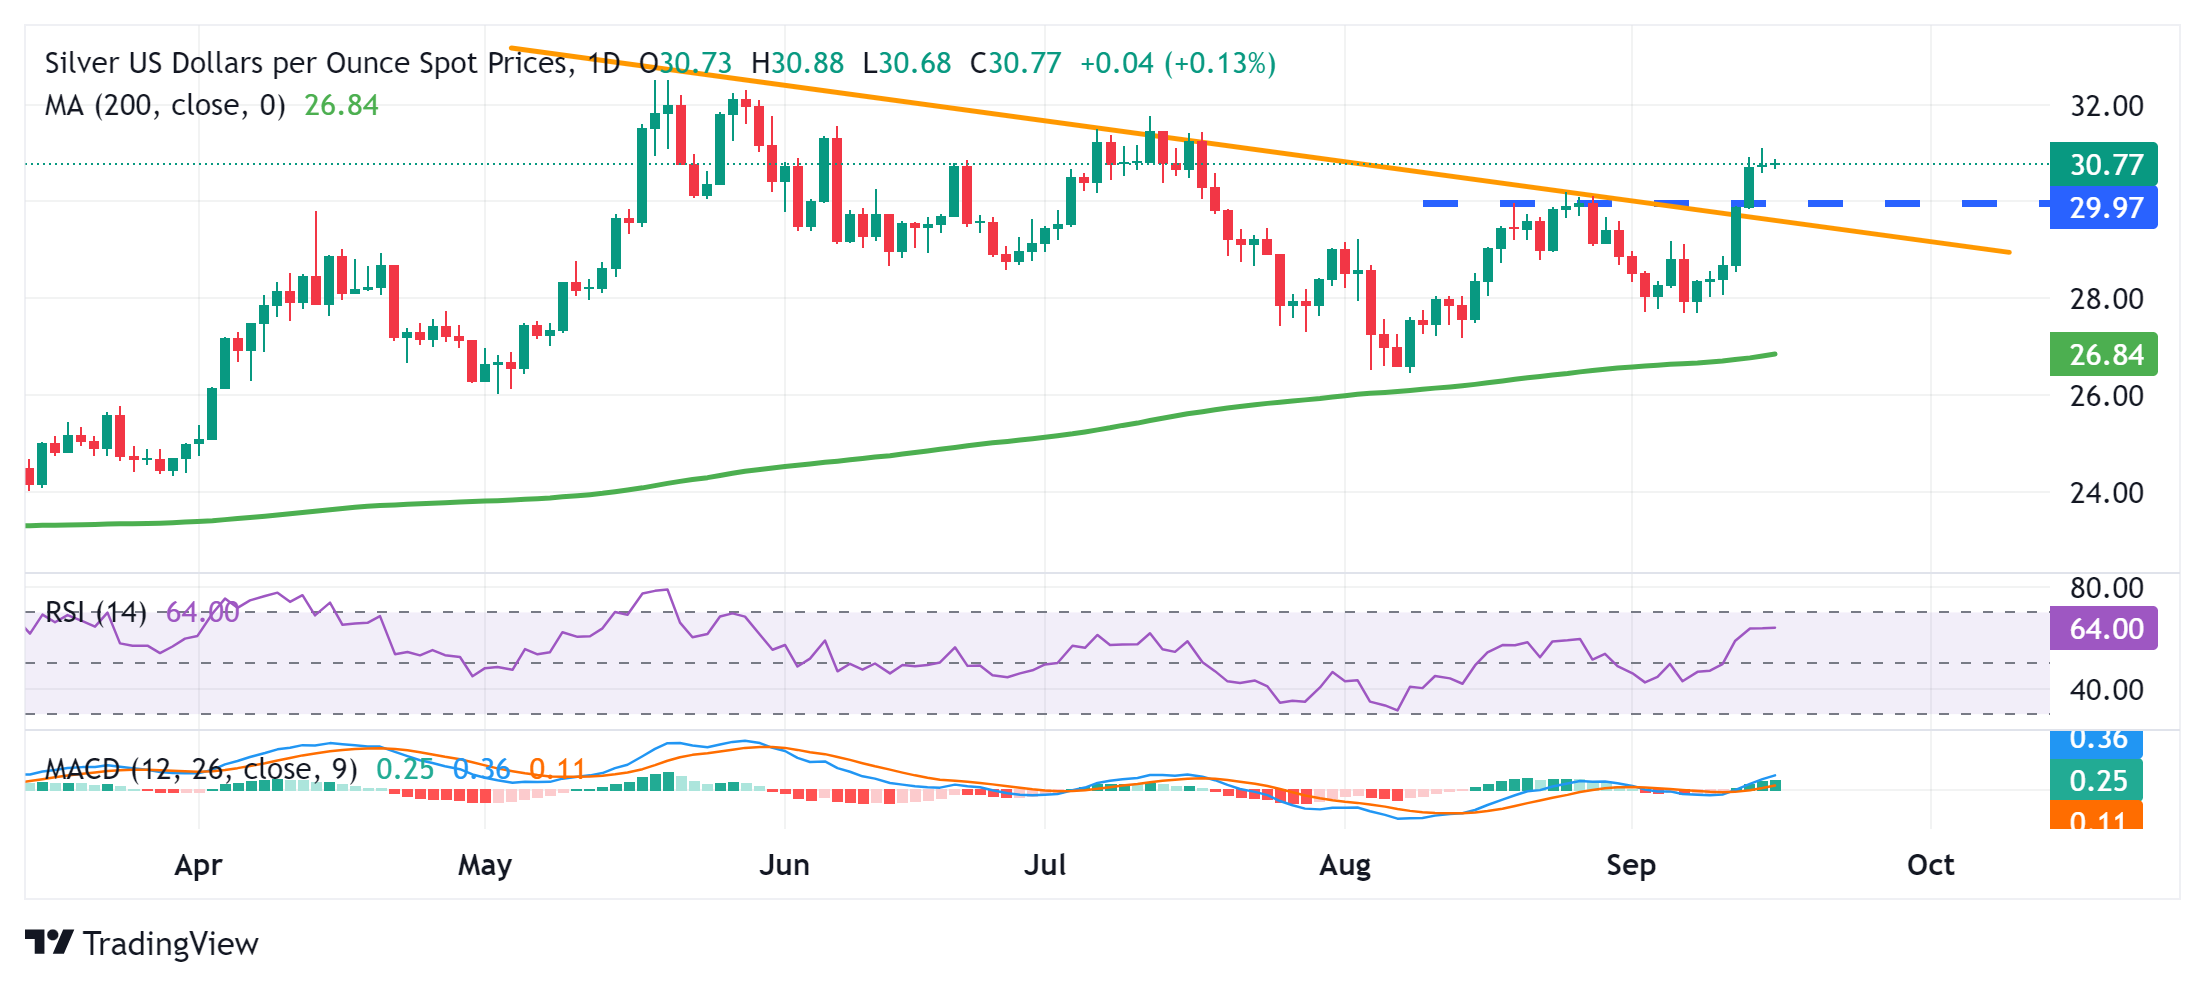
Silver FAQs
Silver is a precious metal highly traded among investors. It has been historically used as a store of value and a medium of exchange. Although less popular than Gold, traders may turn to Silver to diversify their investment portfolio, for its intrinsic value or as a potential hedge during high-inflation periods. Investors can buy physical Silver, in coins or in bars, or trade it through vehicles such as Exchange Traded Funds, which track its price on international markets.
Silver prices can move due to a wide range of factors. Geopolitical instability or fears of a deep recession can make Silver price escalate due to its safe-haven status, although to a lesser extent than Gold's. As a yieldless asset, Silver tends to rise with lower interest rates. Its moves also depend on how the US Dollar (USD) behaves as the asset is priced in dollars (XAG/USD). A strong Dollar tends to keep the price of Silver at bay, whereas a weaker Dollar is likely to propel prices up. Other factors such as investment demand, mining supply – Silver is much more abundant than Gold – and recycling rates can also affect prices.
Silver is widely used in industry, particularly in sectors such as electronics or solar energy, as it has one of the highest electric conductivity of all metals – more than Copper and Gold. A surge in demand can increase prices, while a decline tends to lower them. Dynamics in the US, Chinese and Indian economies can also contribute to price swings: for the US and particularly China, their big industrial sectors use Silver in various processes; in India, consumers’ demand for the precious metal for jewellery also plays a key role in setting prices.
Silver prices tend to follow Gold's moves. When Gold prices rise, Silver typically follows suit, as their status as safe-haven assets is similar. The Gold/Silver ratio, which shows the number of ounces of Silver needed to equal the value of one ounce of Gold, may help to determine the relative valuation between both metals. Some investors may consider a high ratio as an indicator that Silver is undervalued, or Gold is overvalued. On the contrary, a low ratio might suggest that Gold is undervalued relative to Silver.
- The Japanese Yen receives support from the ongoing hawkish sentiment surrounding the Bank of Japan interest rates outlook.
- Japan’s Shunichi Suzuki stated that the government will continue to evaluate the stronger JPY and respond as necessary.
- CME FedWatch Tool suggests odds of a 50 basis points Fed interest rate cut have surged to 62.0%.
The Japanese Yen (JPY) remains solid for the sixth successive day against the US Dollar (USD) on Tuesday, driven by the hawkish sentiment surrounding the Bank of Japan interest rates outlook. Traders await the BoJ policy decision on Friday, with expectations of keeping rates unchanged while leaving the possibility open for rate hikes in October and December.
Japanese Finance Minister Shunichi Suzuki stated on Tuesday that rapid foreign exchange (FX) fluctuations are undesirable. Suzuki emphasized that officials will closely monitor how FX movements affect the Japanese economy and people's livelihoods. The government will continue to assess the impact of a stronger Japanese Yen and respond accordingly, according to Reuters.
The US Dollar remains under pressure as expectations grow that the Federal Open Market Committee (FOMC) may opt for a significant 50 basis point rate cut on Wednesday. According to the CME FedWatch Tool, markets are pricing in a 38.0% chance of a 25 basis points Federal Reserve interest rate cut at the September meeting, while the probability of a 50 basis point cut has surged to 62.0%, up from 50.0% just a day earlier.
Daily Digest Market Movers: Japanese Yen remains solid amid dovish Fed
- Rabobank economists Jane Foley and Molly Schwartz highlighted on Monday that JPY net long positions were at their highest level since October 2016. While there is minimal expectation for a rate hike by the Bank of Japan at its policy meeting on September 20, traders will be closely watching for any hints that October could potentially be a more active meeting.
- Commerzbank FX analyst Volkmar Baur anticipated that the Bank of Japan will remain on the sidelines this week. Baur noted that the Federal Reserve's actions are likely to have a greater impact on the USD/JPY pair, suggesting that the JPY could have a strong chance of falling below 140.00 per USD even without a rate hike from the BoJ.
- On Friday, Fitch Ratings' latest report on the Bank of Japan's policy outlook suggests that the BoJ might raise rates to 0.5% by the end of 2024, 0.75% in 2025, and 1.0% by the end of 2026.
- The University of Michigan’s Consumer Sentiment Index rose to 69.0 in September, exceeding the market expectations of 68.0 reading and marking a four-month high. This increase reflects a gradual improvement in consumers' outlook on the US economy after months of declining economic expectations.
- The hawkish BoJ policymaker Naoki Tamura stated on Thursday that the central bank should raise interest rates to at least 1% as early as the second half of the next fiscal year. This comment reinforces the BoJ's commitment to ongoing monetary tightening.
- The US Producer Price Index (PPI) rose to 0.2% month-on-month in August, exceeding the forecasted 0.1% increase and the previous 0.0%. Meanwhile, core PPI accelerated to 0.3% MoM, against the expected 0.2% rise and July’s 0.2% decline.
Technical Analysis: USD/JPY remains tepid around 140.50 amid 14-month lows
USD/JPY trades around 140.60 on Tuesday. An analysis of the daily chart showed the USD/JPY pair moves downward within a descending channel, indicating a confirmed bearish bias. The 14-day Relative Strength Index (RSI), a momentum indicator, is positioned below the 30 level, suggesting an oversold situation for the pair and a potential for an upward correction soon.
In terms of support, the USD/JPY pair is testing 140.25, which is the lowest level since July 2023, followed by the psychological level of 140.00. A successful breach below this level could reinforce the bearish bias and put pressure on the pair to test the lower boundary of the descending channel at the level of 138.30.
On the upside, the USD/JPY pair might first encounter a barrier at the nine-day EMA around 141.95 level, followed by the 21-day EMA at 143.78 level. A break above these EMAs might weaken the bearish sentiment and push the pair to test the upper boundary of the descending channel at the 145.40 level.
USD/JPY: Daily Chart
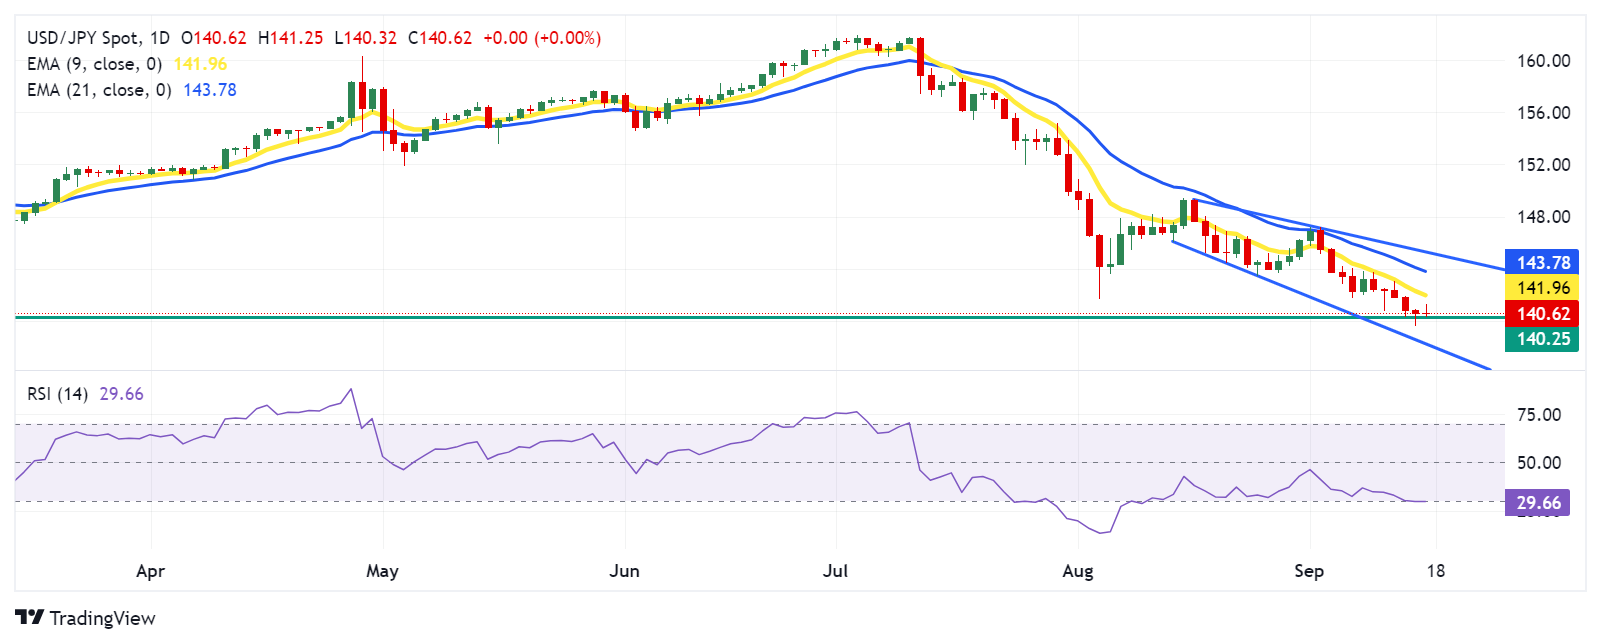
Japanese Yen PRICE Today
The table below shows the percentage change of Japanese Yen (JPY) against listed major currencies today. Japanese Yen was the strongest against the New Zealand Dollar.
| USD | EUR | GBP | JPY | CAD | AUD | NZD | CHF | |
|---|---|---|---|---|---|---|---|---|
| USD | 0.09% | 0.11% | 0.08% | 0.08% | 0.12% | 0.20% | -0.02% | |
| EUR | -0.09% | 0.03% | -0.02% | -0.05% | 0.03% | 0.11% | -0.10% | |
| GBP | -0.11% | -0.03% | -0.02% | -0.03% | 0.01% | 0.11% | -0.15% | |
| JPY | -0.08% | 0.02% | 0.02% | -0.01% | 0.04% | 0.13% | -0.12% | |
| CAD | -0.08% | 0.05% | 0.03% | 0.01% | 0.05% | 0.14% | -0.11% | |
| AUD | -0.12% | -0.03% | -0.01% | -0.04% | -0.05% | 0.08% | -0.17% | |
| NZD | -0.20% | -0.11% | -0.11% | -0.13% | -0.14% | -0.08% | -0.25% | |
| CHF | 0.02% | 0.10% | 0.15% | 0.12% | 0.11% | 0.17% | 0.25% |
The heat map shows percentage changes of major currencies against each other. The base currency is picked from the left column, while the quote currency is picked from the top row. For example, if you pick the Japanese Yen from the left column and move along the horizontal line to the US Dollar, the percentage change displayed in the box will represent JPY (base)/USD (quote).
Japanese Yen FAQs
The Japanese Yen (JPY) is one of the world’s most traded currencies. Its value is broadly determined by the performance of the Japanese economy, but more specifically by the Bank of Japan’s policy, the differential between Japanese and US bond yields, or risk sentiment among traders, among other factors.
One of the Bank of Japan’s mandates is currency control, so its moves are key for the Yen. The BoJ has directly intervened in currency markets sometimes, generally to lower the value of the Yen, although it refrains from doing it often due to political concerns of its main trading partners. The current BoJ ultra-loose monetary policy, based on massive stimulus to the economy, has caused the Yen to depreciate against its main currency peers. This process has exacerbated more recently due to an increasing policy divergence between the Bank of Japan and other main central banks, which have opted to increase interest rates sharply to fight decades-high levels of inflation.
The BoJ’s stance of sticking to ultra-loose monetary policy has led to a widening policy divergence with other central banks, particularly with the US Federal Reserve. This supports a widening of the differential between the 10-year US and Japanese bonds, which favors the US Dollar against the Japanese Yen.
The Japanese Yen is often seen as a safe-haven investment. This means that in times of market stress, investors are more likely to put their money in the Japanese currency due to its supposed reliability and stability. Turbulent times are likely to strengthen the Yen’s value against other currencies seen as more risky to invest in.
- GBP/USD traders move to the sidelines ahead of the FOMC/BoE policy meetings this week.
- Rising Bets for a 50 bps Fed rate cut keep the USD bulls on the defensive and lend support.
- Traders now look to the US Retail Sales to grab short-term opportunities later this Tuesday.
The GBP/USD pair oscillates in a narrow trading band just above the 1.3200 mark during the Asian session on Tuesday and consolidates the previous day's strong move up to over a one-week high. Investors opt to move to the sidelines ahead of the key central bank event risks – the highly-anticipated two-day FOMC meeting starting this Tuesday and the Bank of England (BoE) policy update on Thursday.
The Federal Reserve (Fed) is scheduled to announce its decision on Wednesday and the markets are currently pricing in over a 60% chance of an oversized 50-basis points interest rate cut amid signs of easing inflationary pressures. This keeps the US Treasury bond yields depressed at one or two-year lows and fails to assist the US Dollar (USD) to register any meaningful recovery from the YTD low, which, in turn, is seen acting as a tailwind for the GBP/USD pair.
The British Pound (GBP), on the other hand, is underpinned by expectations that the BoE's rate-cutting cycle is more likely to be slower than in the United States (US). That said, investors are still betting on more BoE rate cuts, especially after data released last week pointed to a slowdown in the UK wage growth and a flat GDP print for the second straight month in July. This might hold back traders from placing aggressive bullish bets around the GBP/USD pair and cap the upside.
Moving ahead, there isn't any relevant market-moving economic data due from the UK on Tuesday, leaving spot prices at the mercy of the USD. Later during the early North American session, traders will take cues from the release of US Retail Sales data, which, along with the US bond yields, will influence the USD demand and provide some impetus to the GBP/USD pair. Nevertheless, the aforementioned fundamental backdrop warrants some caution for aggressive traders.
BoE FAQs
The Bank of England (BoE) decides monetary policy for the United Kingdom. Its primary goal is to achieve ‘price stability’, or a steady inflation rate of 2%. Its tool for achieving this is via the adjustment of base lending rates. The BoE sets the rate at which it lends to commercial banks and banks lend to each other, determining the level of interest rates in the economy overall. This also impacts the value of the Pound Sterling (GBP).
When inflation is above the Bank of England’s target it responds by raising interest rates, making it more expensive for people and businesses to access credit. This is positive for the Pound Sterling because higher interest rates make the UK a more attractive place for global investors to park their money. When inflation falls below target, it is a sign economic growth is slowing, and the BoE will consider lowering interest rates to cheapen credit in the hope businesses will borrow to invest in growth-generating projects – a negative for the Pound Sterling.
In extreme situations, the Bank of England can enact a policy called Quantitative Easing (QE). QE is the process by which the BoE substantially increases the flow of credit in a stuck financial system. QE is a last resort policy when lowering interest rates will not achieve the necessary result. The process of QE involves the BoE printing money to buy assets – usually government or AAA-rated corporate bonds – from banks and other financial institutions. QE usually results in a weaker Pound Sterling.
Quantitative tightening (QT) is the reverse of QE, enacted when the economy is strengthening and inflation starts rising. Whilst in QE the Bank of England (BoE) purchases government and corporate bonds from financial institutions to encourage them to lend; in QT, the BoE stops buying more bonds, and stops reinvesting the principal maturing on the bonds it already holds. It is usually positive for the Pound Sterling.
Ahead of New Zealand’s (NZ) second-quarter Gross Domestic Product (GDP) data release on Thursday, the country’s Treasury published on Tuesday, noting that “indicators for June quarter GDP point to a drop in economic activity.”
Additional takeaways
We anticipate the economy contracted by 0.4% in the quarter, down from a forecast of 0.2% growth at our Budget Update.
Economic data has been weak despite a period of record migrationled population growth. However, with migration levels normalizing, weakness is emerging across more services industries.
House sales continue to drop and, while interest rates are falling, average mortgage rates are still elevated limiting retail spending and house price growth.
There may be some light at the end of the economic tunnel with two weeks left in the September quarter, more timely indicators signal flat rather than falling activity for that quarter.
Market reaction
NZD/USD is under moderate selling pressure following this report, last seen trading 0.12% lower at 0.6190.
New Zealand Dollar FAQs
The New Zealand Dollar (NZD), also known as the Kiwi, is a well-known traded currency among investors. Its value is broadly determined by the health of the New Zealand economy and the country’s central bank policy. Still, there are some unique particularities that also can make NZD move. The performance of the Chinese economy tends to move the Kiwi because China is New Zealand’s biggest trading partner. Bad news for the Chinese economy likely means less New Zealand exports to the country, hitting the economy and thus its currency. Another factor moving NZD is dairy prices as the dairy industry is New Zealand’s main export. High dairy prices boost export income, contributing positively to the economy and thus to the NZD.
The Reserve Bank of New Zealand (RBNZ) aims to achieve and maintain an inflation rate between 1% and 3% over the medium term, with a focus to keep it near the 2% mid-point. To this end, the bank sets an appropriate level of interest rates. When inflation is too high, the RBNZ will increase interest rates to cool the economy, but the move will also make bond yields higher, increasing investors’ appeal to invest in the country and thus boosting NZD. On the contrary, lower interest rates tend to weaken NZD. The so-called rate differential, or how rates in New Zealand are or are expected to be compared to the ones set by the US Federal Reserve, can also play a key role in moving the NZD/USD pair.
Macroeconomic data releases in New Zealand are key to assess the state of the economy and can impact the New Zealand Dollar’s (NZD) valuation. A strong economy, based on high economic growth, low unemployment and high confidence is good for NZD. High economic growth attracts foreign investment and may encourage the Reserve Bank of New Zealand to increase interest rates, if this economic strength comes together with elevated inflation. Conversely, if economic data is weak, NZD is likely to depreciate.
The New Zealand Dollar (NZD) tends to strengthen during risk-on periods, or when investors perceive that broader market risks are low and are optimistic about growth. This tends to lead to a more favorable outlook for commodities and so-called ‘commodity currencies’ such as the Kiwi. Conversely, NZD tends to weaken at times of market turbulence or economic uncertainty as investors tend to sell higher-risk assets and flee to the more-stable safe havens.
- EUR/JPY meets with a fresh supply on Tuesday and stalls its recovery from over a one-month low.
- The divergent BoJ-ECB outlook continues to act as a headwind for the cross and exerts pressure.
- Traders might prefer to wait for the key BoJ policy meeting before placing fresh directional bets.
The EUR/JPY cross attracts fresh sellers following an Asian session uptick to the 157.10 area and stalls its modest recovery move from the vicinity of the 155.00 psychological mark, or the lowest level since August touched the previous day. Spot prices drop to the 154.25-154.20 region in the last hour and seem vulnerable to prolong the recent downward trajectory witnessed over the past two weeks or so.
The Japanese Yen (JPY) continues to be underpinned by the recent hawkish signals from the Bank of Japan (BoJ) officials that the central bank will raise interest rates further by the end of this year. Apart from this, the market nervousness ahead of this week's key central bank event risks turns out to be another factor that benefits the JPY's relative safe-haven status and exerts downward pressure on the EUR/JPY cross.
The US Federal Reserve (Fed) is scheduled to announce its policy decision at the end of a two-day meeting on Wednesday, which will be followed by the Bank of England (BoE) policy update. The focus, however, will remain glued to the highly anticipated BoJ policy update on Friday, which will influence the near-term JPY price dynamics and determine the next leg of a directional move for the EUR/JPY cross.
In the meantime, the prevalent US Dollar (USD) selling bias, amid bets for an oversized rate cut by the Federal Reserve (Fed), is seen lending some support to the shared currency. This might hold back traders from placing aggressive bearish bets around the EUR/JPY cross and help limit deeper losses. That said, the divergent BoJ-ECB policy outlook suggests that the path of least resistance for spot prices remains to the downside.
It is worth recalling that the European Central Bank (ECB) decided last week to cut interest rates for the second time this cycle and indicated a declining path for borrowing costs in the months ahead. However, reports that the ECB policymakers see an interest rate cut in October as unlikely, barring a major deterioration in the outlook for growth, might continue to offer some support to the Euro and the EUR/JPY cross.
Bank of Japan FAQs
The Bank of Japan (BoJ) is the Japanese central bank, which sets monetary policy in the country. Its mandate is to issue banknotes and carry out currency and monetary control to ensure price stability, which means an inflation target of around 2%.
The Bank of Japan has embarked in an ultra-loose monetary policy since 2013 in order to stimulate the economy and fuel inflation amid a low-inflationary environment. The bank’s policy is based on Quantitative and Qualitative Easing (QQE), or printing notes to buy assets such as government or corporate bonds to provide liquidity. In 2016, the bank doubled down on its strategy and further loosened policy by first introducing negative interest rates and then directly controlling the yield of its 10-year government bonds.
The Bank’s massive stimulus has caused the Yen to depreciate against its main currency peers. This process has exacerbated more recently due to an increasing policy divergence between the Bank of Japan and other main central banks, which have opted to increase interest rates sharply to fight decades-high levels of inflation. The BoJ’s policy of holding down rates has led to a widening differential with other currencies, dragging down the value of the Yen.
A weaker Yen and the spike in global energy prices have led to an increase in Japanese inflation, which has exceeded the BoJ’s 2% target. With wage inflation becoming a cause of concern, the BoJ looks to move away from ultra loose policy, while trying to avoid slowing the activity too much.
- NZD/USD receives downward pressure from the deteriorating economic outlook, in its key trading partner, China.
- Economists at Goldman Sachs and Citi have downgraded their GDP growth forecasts for China to 4.7% in 2024.
- The US Dollar struggles due to increasing expectations of a 50 basis points Fed interest rate cut on Wednesday.
NZD/USD retraces its recent gains from the previous session, trading around 0.6190 during the Asian hours on Tuesday. The antipodean New Zealand Dollar (NZD) faces challenges due to growing concerns over the health, of its key trading partner, China's economy. Analysts point out that the latest round of weak economic data indicates serious challenges for the world's second-largest economy.
Economists at Goldman Sachs and Citi have reduced their 2024 GDP growth forecasts for China to 4.7%, falling short of Beijing's target of around 5.0%. SocGen describes the situation as a "downward spiral," while Barclays calls it "from bad to worse" and a "vicious cycle." Morgan Stanley also cautions that "things could get worse before they get better," according to a Reuters report.
Traders are expected to closely monitor the People's Bank of China's (PBoC) Monetary Policy Committee (MPC) monthly review of its key lending rates on Friday, following disappointing industrial output growth and retail sales figures for August. This review could provide further insight into China's economic trajectory and its potential impact on global markets.
New Zealand's Gross Domestic Product (GDP) for Q2 is set to be released on Thursday, with markets anticipating a 0.4% quarter-on-quarter contraction following a 0.2% expansion in Q1. The decline is likely driven by continued weakness in consumer spending, raising concerns about the overall health of the economy.
The US Dollar (USD) is under pressure as expectations grow that the Federal Open Market Committee (FOMC) may opt for a significant 50 basis point rate cut on Wednesday. According to the CME FedWatch Tool, markets are pricing in a 38.0% chance of a 25 basis point Federal Reserve interest rate cut at the September meeting, while the probability of a 50 basis point cut has surged to 62.0%, up from 50.0% just a day earlier. This shift reflects heightened anticipation of more aggressive monetary easing.
New Zealand Dollar FAQs
The New Zealand Dollar (NZD), also known as the Kiwi, is a well-known traded currency among investors. Its value is broadly determined by the health of the New Zealand economy and the country’s central bank policy. Still, there are some unique particularities that also can make NZD move. The performance of the Chinese economy tends to move the Kiwi because China is New Zealand’s biggest trading partner. Bad news for the Chinese economy likely means less New Zealand exports to the country, hitting the economy and thus its currency. Another factor moving NZD is dairy prices as the dairy industry is New Zealand’s main export. High dairy prices boost export income, contributing positively to the economy and thus to the NZD.
The Reserve Bank of New Zealand (RBNZ) aims to achieve and maintain an inflation rate between 1% and 3% over the medium term, with a focus to keep it near the 2% mid-point. To this end, the bank sets an appropriate level of interest rates. When inflation is too high, the RBNZ will increase interest rates to cool the economy, but the move will also make bond yields higher, increasing investors’ appeal to invest in the country and thus boosting NZD. On the contrary, lower interest rates tend to weaken NZD. The so-called rate differential, or how rates in New Zealand are or are expected to be compared to the ones set by the US Federal Reserve, can also play a key role in moving the NZD/USD pair.
Macroeconomic data releases in New Zealand are key to assess the state of the economy and can impact the New Zealand Dollar’s (NZD) valuation. A strong economy, based on high economic growth, low unemployment and high confidence is good for NZD. High economic growth attracts foreign investment and may encourage the Reserve Bank of New Zealand to increase interest rates, if this economic strength comes together with elevated inflation. Conversely, if economic data is weak, NZD is likely to depreciate.
The New Zealand Dollar (NZD) tends to strengthen during risk-on periods, or when investors perceive that broader market risks are low and are optimistic about growth. This tends to lead to a more favorable outlook for commodities and so-called ‘commodity currencies’ such as the Kiwi. Conversely, NZD tends to weaken at times of market turbulence or economic uncertainty as investors tend to sell higher-risk assets and flee to the more-stable safe havens.
| Raw materials | Closed | Change, % |
|---|---|---|
| Silver | 30.729 | -0.11 |
| Gold | 258.312 | 0.18 |
| Palladium | 1077.87 | 1.06 |
- Indian Rupee (INR) loses ground in Tuesday’s Asian session.
- Renewed USD demand, higher oil prices undermine the INR; growing expectation of deeper Fed rate cut might cap its downside.
- Indian WPI Inflation and US Retail Sales data will be the highlights later on Tuesday.
The Indian Rupee (INR) edges lower on Tuesday, snapping the three-day winning streak. The robust US Dollar (USD) demand from local importers, particularly oil companies, weighs on the local currency. Additionally, the rebound in crude oil prices might limit the INR’s upside as India is the third-largest oil consumer after the United States (US) and China.
Nonetheless, the firmer bets on the jumbo Federal Reserve (Fed) rate cut, weaker Greenback and significant foreign fund inflows into Indian equities might support the appreciation of the INR. Investors will keep an eye on the Indian Wholesale Price Index (WPI) Inflation, Food and Fuel reports for August on Tuesday. On the US docket, the Retail Sales will be published, which is expected to rise 0.2% MoM in August versus a 1.0% rise in July.
Daily Digest Market Movers: Indian Rupee seems vulnerable as traders await the key events
- The Indian Wholesale Price Index (WPI) Inflation is expected to ease to 1.80% YoY in August from 2.04% in July.
- India's economy is estimated to grow at a rate of around 7.5% or more, according to Reserve Bank of India (RBI) Governor Shaktikanta Das. This projection surpasses the RBI's current forecast of 7.2% for the ongoing financial year.
- The US NY Empire State Manufacturing Index improved to 11.5 in September from a decline of 4.7 in August, better than the estimation of a 3.9% decrease.
- Fed fund futures show investors are increasingly betting the US Fed will cut by 50 basis points (bps) instead of 25 bps. Traders are now pricing in a nearly 67% chance of a reduction of 50 bps, up from 50% on Friday, according to the CME FedWatch Tool.
- "We had favoured a 50bp cut, but the latest job and inflation numbers suggest officials will more likely vote in favour of 25bps”, said ING Bank analysts.
Technical Analysis: USD/INR still maintains constructive bias
The Indian Rupee weakens on the day. According to the daily chart, the bullish outlook of the USD/INR pair remains intact as the price holds above the key 100-day Exponential Moving Average (EMA). However, further downside cannot be ruled out as the 14-day Relative Strength Index (RSI) stands in the bearish zone below the midline.
A decisive break above the 83.90-84.00 region, support-turned resistance level and psychological mark, could spur another bounce back to the immediate upside barrier around 84.50.
On the downside, the low of September 16 at 83.82 acts as an initial support level for USD/INR. Any follow-through selling below this level will expose the 100-day EMA at 83.64.
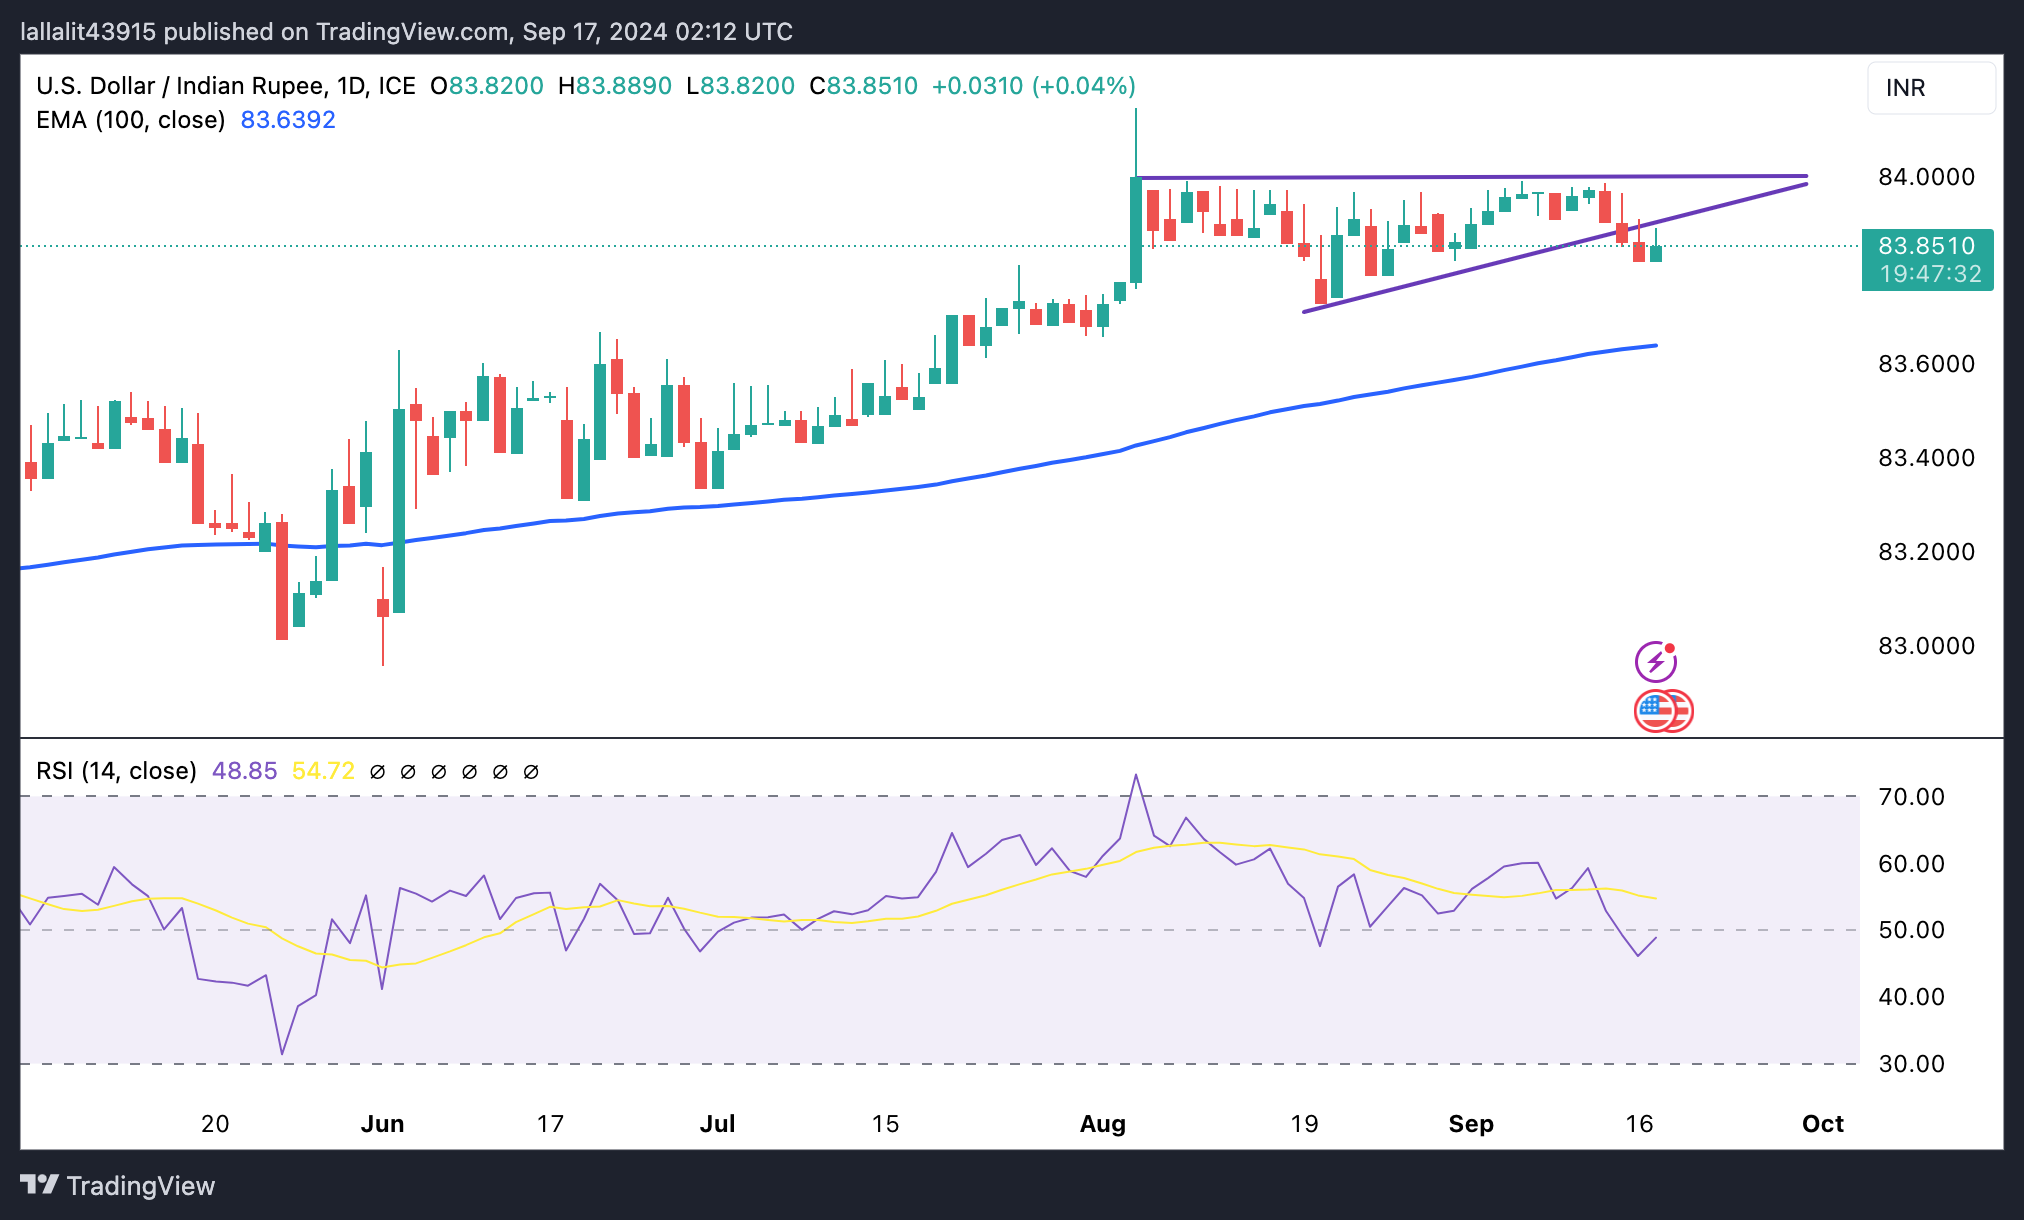
Indian Rupee FAQs
The Indian Rupee (INR) is one of the most sensitive currencies to external factors. The price of Crude Oil (the country is highly dependent on imported Oil), the value of the US Dollar – most trade is conducted in USD – and the level of foreign investment, are all influential. Direct intervention by the Reserve Bank of India (RBI) in FX markets to keep the exchange rate stable, as well as the level of interest rates set by the RBI, are further major influencing factors on the Rupee.
The Reserve Bank of India (RBI) actively intervenes in forex markets to maintain a stable exchange rate, to help facilitate trade. In addition, the RBI tries to maintain the inflation rate at its 4% target by adjusting interest rates. Higher interest rates usually strengthen the Rupee. This is due to the role of the ‘carry trade’ in which investors borrow in countries with lower interest rates so as to place their money in countries’ offering relatively higher interest rates and profit from the difference.
Macroeconomic factors that influence the value of the Rupee include inflation, interest rates, the economic growth rate (GDP), the balance of trade, and inflows from foreign investment. A higher growth rate can lead to more overseas investment, pushing up demand for the Rupee. A less negative balance of trade will eventually lead to a stronger Rupee. Higher interest rates, especially real rates (interest rates less inflation) are also positive for the Rupee. A risk-on environment can lead to greater inflows of Foreign Direct and Indirect Investment (FDI and FII), which also benefit the Rupee.
Higher inflation, particularly, if it is comparatively higher than India’s peers, is generally negative for the currency as it reflects devaluation through oversupply. Inflation also increases the cost of exports, leading to more Rupees being sold to purchase foreign imports, which is Rupee-negative. At the same time, higher inflation usually leads to the Reserve Bank of India (RBI) raising interest rates and this can be positive for the Rupee, due to increased demand from international investors. The opposite effect is true of lower inflation.
- Gold price bulls turn cautious ahead of the crucial FOMC policy meeting starting this Tuesday.
- The USD languishes near the YTD low amid bets for a 50 bps Fed rate cut and offers support.
- China’s economic woes, the US political uncertainty and geopolitical risks also act as a tailwind.
Gold price (XAU/USD) is seen oscillating in a narrow trading band during the Asian session on Tuesday and consolidating its recent gains to a fresh all-time peak, around the $2,589-2,590 region touched the previous day. Traders now seem reluctant and opt to move to the sidelines ahead of the highly anticipated two-day Federal Open Market Committee (FOMC) meeting starting today. Heading into the key central bank event risk, the prospects for a more aggressive policy easing by the Federal Reserve (Fed) keep the US Dollar (USD) depressed near the 2024 low and continue to act as a tailwind for the non-yielding yellow metal.
Meanwhile, disappointing Chinese macro data released over the weekend added to concerns about a slowdown in the world's second-largest economy. Apart from this, persistent geopolitical risks, which tend to benefit traditional safe-haven assets, turn out to be another factor lending support to the Gold price. The fundamental backdrop suggests that the path of least resistance for the XAU/USD is to the upside, though investors might prefer to wait for the crucial FOMC policy decision on Wednesday. Moreover, slightly overstretched conditions on the daily chart warrant some caution before placing fresh bullish bets.
Daily Digest Market Movers: Gold price remains supported by a dovish Fed, safe-haven flow
- Rising bets for an oversized interest rate cut by the Federal Reserve drag the US Dollar to its lowest level since July 2023 and lift the non-yielding Gold price to a fresh record high on Monday.
- According to the CME Group's FedWatch Tool, the markets are currently pricing in over a 60% chance that the US central bank will lower borrowing costs by 50 basis points on Wednesday.
- The yield on the rate-sensitive 2-year US government bond fell to the lowest since September 2022 and the benchmark 10-year US Treasury yield slipped to the weakest since June 2023.
- The New York Empire State Manufacturing Index came in at 11.5 for September, much better than the -3.9 expected and the -4.7 previous, albeit did little to impress the USD bulls.
- A string of downbeat Chinese data released over the weekend pointed to more economic weakness and challenges in reaching the official target of around 5% GDP growth rate in 2024.
- Hamas issued a warning stating that hostages would be sent out in coffins if Israel continues its military strikes and didn't agree to a deal, raising the risk of a wider conflict in the Middle East.
- Adding to this, reports of a second attempted assassination attempt on Republican presidential candidate Donald Trump add to the nervousness and act as a tailwind for the XAU/USD.
- Bullish traders, however, take a brief pause and now await the outcome of a two-day FOMC monetary policy meeting before positioning for the next leg of a directional move.
- The Fed will announce its decision on Wednesday, which will be accompanied by new economic projections, including the so-called dot-plot, and followed by the post-meeting presser.
- Investors will closely scrutinize Fed Chair Jerome Powell's comments for cues about the rate-cut path, which, in turn, will drive the USD demand and provide a fresh impetus to the commodity.
Technical Outlook: Gold price seems poised to challenge the trend-channel boundary, around the $2,600 mark
From a technical perspective, the Relative Strength Index (RSI) on the daily chart has moved on the verge of breaking into the overbought zone and holding back bulls from placing fresh bets. That said, the move-up along an ascending channel since June points to a well-established short-term uptrend. Furthermore, the recent breakout through the $2,525-2,530 supply zone supports prospects for additional gains. Any subsequent move up, however, is likely to confront stiff resistance near the $2,600 round figure, above which the Gold price could climb to test the ascending channel barrier, currently pegged around the $2,620-2,625 region. A sustained strength beyond the latter will mark a fresh breakout and pave the way for a further near-term appreciating move.
On the flip side, any corrective decline now seems to attract some buyers near the $2,555 horizontal zone. This should help limit the downside near the $2,530-2,525 resistance breakpoint, now turned support, below which the Gold price could slide back to the $2,500 psychological mark. A convincing break below the latter might prompt some technical selling and make the XAU/USD vulnerable to accelerate the slide towards the $2,470 horizontal support. This is closely followed by the $2,464 confluence, comprising the ascending channel support and the 50-day Simple Moving Average (SMA), which if broken might shift the bias in favor of bearish traders.
Gold FAQs
Gold has played a key role in human’s history as it has been widely used as a store of value and medium of exchange. Currently, apart from its shine and usage for jewelry, the precious metal is widely seen as a safe-haven asset, meaning that it is considered a good investment during turbulent times. Gold is also widely seen as a hedge against inflation and against depreciating currencies as it doesn’t rely on any specific issuer or government.
Central banks are the biggest Gold holders. In their aim to support their currencies in turbulent times, central banks tend to diversify their reserves and buy Gold to improve the perceived strength of the economy and the currency. High Gold reserves can be a source of trust for a country’s solvency. Central banks added 1,136 tonnes of Gold worth around $70 billion to their reserves in 2022, according to data from the World Gold Council. This is the highest yearly purchase since records began. Central banks from emerging economies such as China, India and Turkey are quickly increasing their Gold reserves.
Gold has an inverse correlation with the US Dollar and US Treasuries, which are both major reserve and safe-haven assets. When the Dollar depreciates, Gold tends to rise, enabling investors and central banks to diversify their assets in turbulent times. Gold is also inversely correlated with risk assets. A rally in the stock market tends to weaken Gold price, while sell-offs in riskier markets tend to favor the precious metal.
The price can move due to a wide range of factors. Geopolitical instability or fears of a deep recession can quickly make Gold price escalate due to its safe-haven status. As a yield-less asset, Gold tends to rise with lower interest rates, while higher cost of money usually weighs down on the yellow metal. Still, most moves depend on how the US Dollar (USD) behaves as the asset is priced in dollars (XAU/USD). A strong Dollar tends to keep the price of Gold controlled, whereas a weaker Dollar is likely to push Gold prices up.
- The Australian Dollar depreciates as analysts noted that the weak economic data indicates serious challenges for the China’s economic outlook.
- The Aussie Dollar’s downside could be restrained due to hawkish sentiment surrounding the Reserve Bank of Australia’s policy outlook.
- The US Dollar struggles due to rising odds of the Federal Reserve implementing a bumper rate cut on Wednesday.
The Australian Dollar (AUD) retraces its recent gains against the US Dollar (USD) on Tuesday, largely due to growing concerns over the health of China's economy. Analysts point out that the latest round of weak economic data indicates serious challenges for the world's second-largest economy. Since China is a key trading partner for Australia, fluctuations in China's economic health can have a significant effect on the Australian market.
Economists at Goldman Sachs and Citi have reduced their 2024 GDP growth forecasts for China to 4.7%, falling short of Beijing's target of around 5.0%. SocGen describes the situation as a "downward spiral," while Barclays calls it "from bad to worse" and a "vicious cycle." Morgan Stanley also cautions that "things could get worse before they get better," according to a Reuters report.
The AUD/USD pair’s downside may be limited, as the Australian Dollar remains supported by the Reserve Bank of Australia's (RBA) hawkish stance. Meanwhile, the US Dollar faces pressure amid increasing expectations that the US Federal Reserve (Fed) may implement an aggressive 50 basis points rate cut on Wednesday.
According to the CME FedWatch Tool, markets anticipate 38.0% odds of a 25 basis point (bps) rate cut by the Fed at its September meeting. The likelihood of a 50 bps rate cut has increased to 62.0%, up from 50.0% a day ago.
Daily Digest Market Movers: Australian Dollar inches lower due to fears over China's outlook
- ANZ-Roy Morgan Consumer Confidence climbed 1.8 points, reaching an eight-week high of 84.1. While ANZ notes that the rise was broad-based, confidence remains firmly in pessimistic territory.
- The University of Michigan’s Consumer Sentiment Index rose to 69.0 in September, exceeding the market expectations of 68.0 reading and marking a four-month high. This increase reflects a gradual improvement in consumers' outlook on the US economy after months of declining economic expectations.
- China's economy weakened in August, with a continued slowdown in industrial activity and declining real estate prices, as Beijing faces growing pressure to increase spending to boost demand. According to Business Standard, this was reported by the National Bureau of Statistics on Saturday.
- China's Retail Sales grew by 2.1% year-on-year in August, slowing from 2.7% in the previous month and falling short of the market consensus of 2.5%.
- The US Producer Price Index (PPI) rose to 0.2% month-on-month in August, exceeding the forecasted 0.1% increase and the previous 0.0%. Meanwhile, core PPI accelerated to 0.3% MoM, against the expected 0.2% rise and July’s 0.2% contraction.
- Australia’s Consumer Inflation Expectations eased to 4.4% in September, down slightly from August's four-month high of 4.5%. This decline highlights the central bank's efforts to balance bringing inflation down within a reasonable timeframe and maintaining gains in the labor market.
- The Reserve Bank of Australia (RBA) has maintained a hawkish stance, with RBA Governor Michele Bullock stating that it is premature to consider rate cuts due to persistently high inflation. RBA Assistant Governor Sarah Hunter also noted that while the labor market remains tight, wage growth appears to have peaked and is expected to slow further.
Technical Analysis: Australian Dollar rises to 0.6750; next barrier at seven-month highs
The AUD/USD pair trades near 0.6750 on Tuesday. Technical analysis of the daily chart indicates that the pair has broken above the upper boundary of a descending channel, indicating a weakening of a bearish bias. Additionally, the 14-day Relative Strength Index (RSI) is positioned slightly above the 50 level, suggesting a shift in momentum from a bearish to a bullish trend.
Regarding the upside, a breach above the descending channel has triggered a bullish bias for the AUD/USD pair. This could push the pair toward its seven-month high of 0.6798 and test the psychological level of 0.6800.
On the downside, the AUD/USD pair could find immediate support around the nine-day Exponential Moving Average (EMA) at the 0.6719 level, followed by the upper boundary of the descending channel at 0.6690. A return to the descending channel would reinforce the bearish bias and lead the pair to navigate the region around the throwback support zone near 0.6575, followed by the lower boundary of the descending channel at 0.6550 level.
AUD/USD: Daily Chart
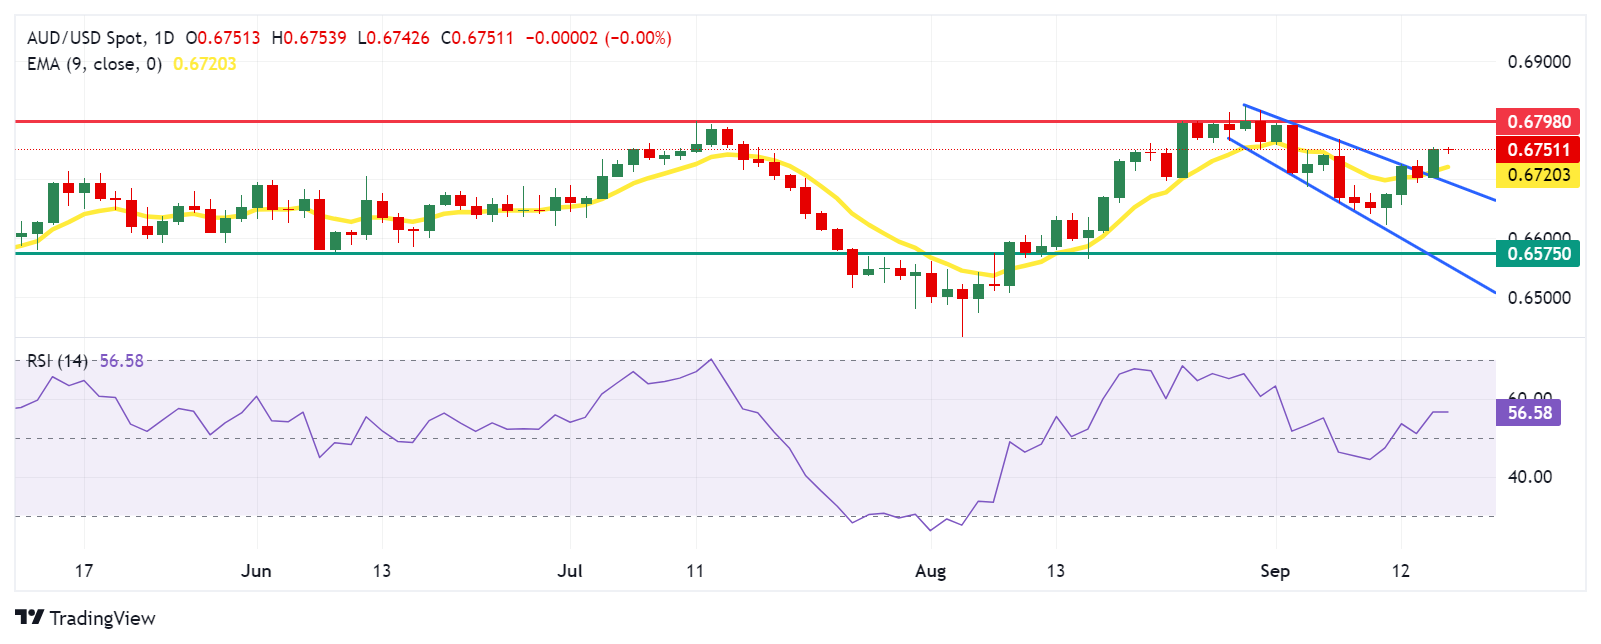
Australian Dollar PRICE Today
The table below shows the percentage change of Australian Dollar (AUD) against listed major currencies today. Australian Dollar was the weakest against the Japanese Yen.
| USD | EUR | GBP | JPY | CAD | AUD | NZD | CHF | |
|---|---|---|---|---|---|---|---|---|
| USD | 0.05% | 0.08% | -0.10% | 0.03% | 0.00% | 0.18% | -0.05% | |
| EUR | -0.05% | 0.03% | -0.16% | -0.06% | -0.06% | 0.12% | -0.10% | |
| GBP | -0.08% | -0.03% | -0.19% | -0.06% | -0.08% | 0.10% | -0.15% | |
| JPY | 0.10% | 0.16% | 0.19% | 0.14% | 0.12% | 0.30% | 0.05% | |
| CAD | -0.03% | 0.06% | 0.06% | -0.14% | -0.02% | 0.17% | -0.09% | |
| AUD | -0.01% | 0.06% | 0.08% | -0.12% | 0.02% | 0.17% | -0.08% | |
| NZD | -0.18% | -0.12% | -0.10% | -0.30% | -0.17% | -0.17% | -0.25% | |
| CHF | 0.05% | 0.10% | 0.15% | -0.05% | 0.09% | 0.08% | 0.25% |
The heat map shows percentage changes of major currencies against each other. The base currency is picked from the left column, while the quote currency is picked from the top row. For example, if you pick the Australian Dollar from the left column and move along the horizontal line to the US Dollar, the percentage change displayed in the box will represent AUD (base)/USD (quote).
Australian Dollar FAQs
One of the most significant factors for the Australian Dollar (AUD) is the level of interest rates set by the Reserve Bank of Australia (RBA). Because Australia is a resource-rich country another key driver is the price of its biggest export, Iron Ore. The health of the Chinese economy, its largest trading partner, is a factor, as well as inflation in Australia, its growth rate and Trade Balance. Market sentiment – whether investors are taking on more risky assets (risk-on) or seeking safe-havens (risk-off) – is also a factor, with risk-on positive for AUD.
The Reserve Bank of Australia (RBA) influences the Australian Dollar (AUD) by setting the level of interest rates that Australian banks can lend to each other. This influences the level of interest rates in the economy as a whole. The main goal of the RBA is to maintain a stable inflation rate of 2-3% by adjusting interest rates up or down. Relatively high interest rates compared to other major central banks support the AUD, and the opposite for relatively low. The RBA can also use quantitative easing and tightening to influence credit conditions, with the former AUD-negative and the latter AUD-positive.
China is Australia’s largest trading partner so the health of the Chinese economy is a major influence on the value of the Australian Dollar (AUD). When the Chinese economy is doing well it purchases more raw materials, goods and services from Australia, lifting demand for the AUD, and pushing up its value. The opposite is the case when the Chinese economy is not growing as fast as expected. Positive or negative surprises in Chinese growth data, therefore, often have a direct impact on the Australian Dollar and its pairs.
Iron Ore is Australia’s largest export, accounting for $118 billion a year according to data from 2021, with China as its primary destination. The price of Iron Ore, therefore, can be a driver of the Australian Dollar. Generally, if the price of Iron Ore rises, AUD also goes up, as aggregate demand for the currency increases. The opposite is the case if the price of Iron Ore falls. Higher Iron Ore prices also tend to result in a greater likelihood of a positive Trade Balance for Australia, which is also positive of the AUD.
The Trade Balance, which is the difference between what a country earns from its exports versus what it pays for its imports, is another factor that can influence the value of the Australian Dollar. If Australia produces highly sought after exports, then its currency will gain in value purely from the surplus demand created from foreign buyers seeking to purchase its exports versus what it spends to purchase imports. Therefore, a positive net Trade Balance strengthens the AUD, with the opposite effect if the Trade Balance is negative.
Japanese Finance Minister Shunichi Suzuki said on Tuesday that the rapid foreign exchange (FX) move is undesirable and the officials will monitor the effect of FX on the Japanese economy and livelihoods.
Key quotes
Forex fluctuations have both positive and negative impacts on the Japanese economy.
Will respond appropriately after analyzing the impact of Forex moves.
Rapid FX moves are undesirable.
Important for currencies to move in a stable manner, reflecting fundamentals.
Market reaction
At the time of writing, USD/JPY is trading 0.03% higher on the day at 140.65.
Japanese Yen FAQs
The Japanese Yen (JPY) is one of the world’s most traded currencies. Its value is broadly determined by the performance of the Japanese economy, but more specifically by the Bank of Japan’s policy, the differential between Japanese and US bond yields, or risk sentiment among traders, among other factors.
One of the Bank of Japan’s mandates is currency control, so its moves are key for the Yen. The BoJ has directly intervened in currency markets sometimes, generally to lower the value of the Yen, although it refrains from doing it often due to political concerns of its main trading partners. The current BoJ ultra-loose monetary policy, based on massive stimulus to the economy, has caused the Yen to depreciate against its main currency peers. This process has exacerbated more recently due to an increasing policy divergence between the Bank of Japan and other main central banks, which have opted to increase interest rates sharply to fight decades-high levels of inflation.
The BoJ’s stance of sticking to ultra-loose monetary policy has led to a widening policy divergence with other central banks, particularly with the US Federal Reserve. This supports a widening of the differential between the 10-year US and Japanese bonds, which favors the US Dollar against the Japanese Yen.
The Japanese Yen is often seen as a safe-haven investment. This means that in times of market stress, investors are more likely to put their money in the Japanese currency due to its supposed reliability and stability. Turbulent times are likely to strengthen the Yen’s value against other currencies seen as more risky to invest in.
- WTI holds positive ground near $70.35 in Tuesday’s Asian session.
- The impact of Hurricane Francine on oil output and firmer Fed rate cut bets support the WTI price.
- China demand worries might cap the WTI’s upside in the near term.
West Texas Intermediate (WTI), the US crude Oil benchmark, is trading around $70.35 on Tuesday. WTI price gains momentum as Hurricane Francine disrupts production in the US Gulf of Mexico.
The US Bureau of Safety and Environmental Enforcement (BSEE) reported on Monday that Hurricane Francine disrupted about 12% of the crude oil production and 16% of natural gas output in the Gulf of Mexico. This, in turn, boosts the WTI price to two-week highs.
Furthermore, the Federal Open Market Committee (FOMC) will announce its interest rate decision on Wednesday. According to CME FedWatch, Fed fund futures show investors are increasingly betting the US Fed will cut by 50 basis points (bps) instead of 25 bps. Lower interest rates will reduce the cost of borrowing, which generally lifts the demand for oil.
On the other hand, persistent Chinese demand concerns might exert some selling pressure on black gold as China is the world’s biggest oil importer. Data released on the weekend showed that Chinese Industrial Production growth slowed to a five-month low in August, while Retail Sales and new home prices deteriorated further.
IG market strategist Yeap Jun Rong noted that the recent weaker-than-expected Chinese economic data dampened market sentiment, with the low-for-longer growth outlook in the world's second-largest economy reinforcing doubts over oil demand.
WTI Oil FAQs
WTI Oil is a type of Crude Oil sold on international markets. The WTI stands for West Texas Intermediate, one of three major types including Brent and Dubai Crude. WTI is also referred to as “light” and “sweet” because of its relatively low gravity and sulfur content respectively. It is considered a high quality Oil that is easily refined. It is sourced in the United States and distributed via the Cushing hub, which is considered “The Pipeline Crossroads of the World”. It is a benchmark for the Oil market and WTI price is frequently quoted in the media.
Like all assets, supply and demand are the key drivers of WTI Oil price. As such, global growth can be a driver of increased demand and vice versa for weak global growth. Political instability, wars, and sanctions can disrupt supply and impact prices. The decisions of OPEC, a group of major Oil-producing countries, is another key driver of price. The value of the US Dollar influences the price of WTI Crude Oil, since Oil is predominantly traded in US Dollars, thus a weaker US Dollar can make Oil more affordable and vice versa.
The weekly Oil inventory reports published by the American Petroleum Institute (API) and the Energy Information Agency (EIA) impact the price of WTI Oil. Changes in inventories reflect fluctuating supply and demand. If the data shows a drop in inventories it can indicate increased demand, pushing up Oil price. Higher inventories can reflect increased supply, pushing down prices. API’s report is published every Tuesday and EIA’s the day after. Their results are usually similar, falling within 1% of each other 75% of the time. The EIA data is considered more reliable, since it is a government agency.
OPEC (Organization of the Petroleum Exporting Countries) is a group of 13 Oil-producing nations who collectively decide production quotas for member countries at twice-yearly meetings. Their decisions often impact WTI Oil prices. When OPEC decides to lower quotas, it can tighten supply, pushing up Oil prices. When OPEC increases production, it has the opposite effect. OPEC+ refers to an expanded group that includes ten extra non-OPEC members, the most notable of which is Russia.
| Index | Change, points | Closed | Change, % |
|---|---|---|---|
| Hang Seng | 53.03 | 17422.12 | 0.31 |
| ASX 200 | 21.7 | 8121.6 | 0.27 |
| DAX | -66.29 | 18633.11 | -0.35 |
| CAC 40 | -15.81 | 7449.44 | -0.21 |
| Dow Jones | 228.3 | 41622.08 | 0.55 |
| S&P 500 | 7.07 | 5633.09 | 0.13 |
| NASDAQ Composite | -91.85 | 17592.13 | -0.52 |
| Pare | Closed | Change, % |
|---|---|---|
| AUDUSD | 0.67503 | 0.65 |
| EURJPY | 156.51 | 0.37 |
| EURUSD | 1.11308 | 0.45 |
| GBPJPY | 185.798 | 0.56 |
| GBPUSD | 1.32153 | 0.65 |
| NZDUSD | 0.61988 | 0.61 |
| USDCAD | 1.35842 | -0 |
| USDCHF | 0.84469 | -0.41 |
| USDJPY | 140.613 | -0.07 |
- USD/JPY rebounds to near 140.80 in Tuesday’s early Asian session.
- The US Fed is widely expected to cut interest rates at the conclusion of its meeting Wednesday.
- Analysts see no change in rates at the BOJ meeting on Friday.
The USD/JPY pair recovers some lost ground near 140.80, snapping the five-day losing streak during the early Asian session on Tuesday. However, the upside of the pair might be limited amid the growing expectation that the US Federal Reserve (Fed) will start its easing cycle at the September meeting. Later this week, the US Fed and the Bank of Japan (BoJ) monetary policy meeting will be in the spotlight.
The US Dollar (USD) remains under pressure as Fed easing expectations intensify. Fed Chair Jerome Powel signaled at the Kansas City Fed’s annual economic symposium in Jackson Hole last month that inflation had come under control just enough for the Fed to finally feel comfortable dialing back policy. Powell added that the job market’s fragile health is a key reason why the Fed is poised to act.
The market ramps up expectations for a jumbo 50 basis points (bps) cut at the September Fed meeting on Wednesday, with nearly 67% odds pricing in, up from 50% last Friday. Ahead of the key interest rate decision from both the US and Japan, the US Census Bureau will release the Retail Sales report on Tuesday. The figure is estimated to increase by 0.2% MoM in August versus 1.0% prior.
On the other hand, the BoJ is not expected to raise interest rates on Friday, but a majority of economists polled by Reuters expect a hike by year-end. Richard Kaye, a portfolio manager for Japan equities at Comgest, noted "The main determinant of the yen is the rate or yield gap with the U.S., and the main actor in that is the Fed, and the Fed seems ready to cut."
Japanese Yen FAQs
The Japanese Yen (JPY) is one of the world’s most traded currencies. Its value is broadly determined by the performance of the Japanese economy, but more specifically by the Bank of Japan’s policy, the differential between Japanese and US bond yields, or risk sentiment among traders, among other factors.
One of the Bank of Japan’s mandates is currency control, so its moves are key for the Yen. The BoJ has directly intervened in currency markets sometimes, generally to lower the value of the Yen, although it refrains from doing it often due to political concerns of its main trading partners. The current BoJ ultra-loose monetary policy, based on massive stimulus to the economy, has caused the Yen to depreciate against its main currency peers. This process has exacerbated more recently due to an increasing policy divergence between the Bank of Japan and other main central banks, which have opted to increase interest rates sharply to fight decades-high levels of inflation.
The BoJ’s stance of sticking to ultra-loose monetary policy has led to a widening policy divergence with other central banks, particularly with the US Federal Reserve. This supports a widening of the differential between the 10-year US and Japanese bonds, which favors the US Dollar against the Japanese Yen.
The Japanese Yen is often seen as a safe-haven investment. This means that in times of market stress, investors are more likely to put their money in the Japanese currency due to its supposed reliability and stability. Turbulent times are likely to strengthen the Yen’s value against other currencies seen as more risky to invest in.


© 2000-2024. Sva prava zaštićena.
Sajt je vlasništvo kompanije Teletrade D.J. LLC 2351 LLC 2022 (Euro House, Richmond Hill Road, Kingstown, VC0100, St. Vincent and the Grenadines).
Svi podaci koji se nalaze na sajtu ne predstavljaju osnovu za donošenje investicionih odluka, već su informativnog karaktera.
The company does not serve or provide services to customers who are residents of the US, Canada, Iran, The Democratic People's Republic of Korea, Yemen and FATF blacklisted countries.
Izvršenje trgovinskih operacija sa finansijskim instrumentima upotrebom marginalne trgovine pruža velike mogućnosti i omogućava investitorima ostvarivanje visokih prihoda. Međutim, takav vid trgovine povezan je sa potencijalno visokim nivoom rizika od gubitka sredstava. Проведение торговых операций на финанcовых рынках c маржинальными финанcовыми инcтрументами открывает широкие возможноcти, и позволяет инвеcторам, готовым пойти на риcк, получать выcокую прибыль, но при этом неcет в cебе потенциально выcокий уровень риcка получения убытков. Iz tog razloga je pre započinjanja trgovine potrebno odlučiti o izboru odgovarajuće investicione strategije, uzimajući u obzir raspoložive resurse.
Upotreba informacija: U slučaju potpunog ili delimičnog preuzimanja i daljeg korišćenja materijala koji se nalazi na sajtu, potrebno je navesti link odgovarajuće stranice na sajtu kompanije TeleTrade-a kao izvora informacija. Upotreba materijala na internetu mora biti praćena hiper linkom do web stranice teletrade.org. Automatski uvoz materijala i informacija sa stranice je zabranjen.
Ako imate bilo kakvih pitanja, obratite nam se pr@teletrade.global.
транcфери