- Analiza
- Novosti i instrumenti
- Vesti sa tržišta
Forex-novosti i prognoze od 17-07-2024
- NZD/USD edges lower to 0.6080 in Thursday’s early Asian session, down 0.10% on the day.
- Fed officials said the central bank is 'closer' to cutting interest rates.
- The softer New Zealand CPI inflation data triggered rate-cut bets by the RBNZ this year.
Fed Governor Christopher Waller said on Wednesday that the US central bank is ‘getting closer’ to an interest rate cut as inflation's improved trajectory and the labor market are in better balance. Richmond Fed President Thomas Barkin said he is "very encouraged" that easing in inflation has begun to broaden and he would like to see it continue.”
Earlier this week, Fed Chair Jerome Powell said on Monday that the US central bank will not wait until inflation hits 2% to cut interest rates. The dovish comments from Fed officials might weigh on the Greenback and act as a tailwind for NZD/USD for the time being.
About the US economic data, the Building Permits increased by 3.4% to 1.446 million in June from 1.3999 million in May, while Housing Starts for the same period rose by 3.0% to 1.353 million from 1.314 million. US Industrial Production climbed 0.6% MoM in June from the previous reading of 1.0%, beating the estimation of a 0.3% increase.
New Zealand Consumer Price Index (CPI) inflation eased more than expected in the second quarter, prompting the expectation that the Reserve Bank of New Zealand would cut interest rates this year. The RBNZ signaled at its July meeting that the decision on rate cuts would be dependent on easing inflation. The country’s CPI rose 0.4% QoQ in Q2, compared to 0.6% in Q1, and was below analysts' forecasts of 0.6%. The annual rate of CPI inflation fell to its lowest rate in three years, arriving at 3.3% YoY in Q2 from a 4% rise in the 12 months to the March 2024 quarter.
New Zealand Dollar FAQs
The New Zealand Dollar (NZD), also known as the Kiwi, is a well-known traded currency among investors. Its value is broadly determined by the health of the New Zealand economy and the country’s central bank policy. Still, there are some unique particularities that also can make NZD move. The performance of the Chinese economy tends to move the Kiwi because China is New Zealand’s biggest trading partner. Bad news for the Chinese economy likely means less New Zealand exports to the country, hitting the economy and thus its currency. Another factor moving NZD is dairy prices as the dairy industry is New Zealand’s main export. High dairy prices boost export income, contributing positively to the economy and thus to the NZD.
The Reserve Bank of New Zealand (RBNZ) aims to achieve and maintain an inflation rate between 1% and 3% over the medium term, with a focus to keep it near the 2% mid-point. To this end, the bank sets an appropriate level of interest rates. When inflation is too high, the RBNZ will increase interest rates to cool the economy, but the move will also make bond yields higher, increasing investors’ appeal to invest in the country and thus boosting NZD. On the contrary, lower interest rates tend to weaken NZD. The so-called rate differential, or how rates in New Zealand are or are expected to be compared to the ones set by the US Federal Reserve, can also play a key role in moving the NZD/USD pair.
Macroeconomic data releases in New Zealand are key to assess the state of the economy and can impact the New Zealand Dollar’s (NZD) valuation. A strong economy, based on high economic growth, low unemployment and high confidence is good for NZD. High economic growth attracts foreign investment and may encourage the Reserve Bank of New Zealand to increase interest rates, if this economic strength comes together with elevated inflation. Conversely, if economic data is weak, NZD is likely to depreciate.
The New Zealand Dollar (NZD) tends to strengthen during risk-on periods, or when investors perceive that broader market risks are low and are optimistic about growth. This tends to lead to a more favorable outlook for commodities and so-called ‘commodity currencies’ such as the Kiwi. Conversely, NZD tends to weaken at times of market turbulence or economic uncertainty as investors tend to sell higher-risk assets and flee to the more-stable safe havens.
- EUR/USD extended into bullish territory on Wednesday.
- ECB rate call looms ahead, rate hold expected for now.
- Markets have fully priced in a September rate cut from the Fed.
EUR/USD rallied into fresh 18-week highs on Wednesday as market sentiment tilts firmly into the risk-on side ahead of the European Central Bank’s (ECB) latest rate call slated for Thursday. Broad-market risk appetite remains pinned into the ceiling as markets fully price in a rate cut from the Federal Reserve (Fed) on September 18.
Forex Today: The ECB and Lagarde steal the show
Fiber traders will be keeping eyes pinned to the ECB’s latest rate call slated for Thursday. The ECB is broadly expected to keep rates on hold for the time being as policymakers waver after an early quarter-point rate cut in June. With the ECB forecast to keep rates steady, traders will be looking for any shifts in policy speech talking points from ECB President Christine Lagarde later in the European market session.
Read more:
Fed's Barkin: Will debate at July meeting whether still appropriate to describe inflation as elevated
Fed's Waller: Most likely direction for monetary policy is rate cuts
Rate markets have fully priced in at least a quarter-point rate trim when the Federal Open Market Committee (FOMC) gathers for a rate call on September 18, and July’s month-end meeting is still expected to keep rates flat. According to the CME’s FedWatch Tool, 98% odds of a September rate cut are fully priced in, with rate traders seeing three cuts in 2024 compared to the Fed’s own modest projections of one or two.
Despite a broad-market dog-pile into Fed rate cut bets, Fedspeak from key policymakers maintains a dark tint to otherwise sunny skies. Both Fed Governor Christopher Waller and Richmond Fed President Thomas Barkin noted that labor markets remain particularly robust despite easing inflation pressures.
Euro PRICE This week
The table below shows the percentage change of Euro (EUR) against listed major currencies this week. Euro was the strongest against the Australian Dollar.
| USD | EUR | GBP | JPY | CAD | AUD | NZD | CHF | |
|---|---|---|---|---|---|---|---|---|
| USD | -0.29% | -0.15% | -1.56% | 0.26% | 0.80% | 0.46% | -1.35% | |
| EUR | 0.29% | 0.18% | -1.07% | 0.75% | 1.13% | 0.95% | -0.87% | |
| GBP | 0.15% | -0.18% | -1.17% | 0.57% | 0.95% | 0.72% | -1.04% | |
| JPY | 1.56% | 1.07% | 1.17% | 1.84% | 2.17% | 2.01% | 0.03% | |
| CAD | -0.26% | -0.75% | -0.57% | -1.84% | 0.47% | 0.20% | -1.60% | |
| AUD | -0.80% | -1.13% | -0.95% | -2.17% | -0.47% | -0.18% | -1.97% | |
| NZD | -0.46% | -0.95% | -0.72% | -2.01% | -0.20% | 0.18% | -1.79% | |
| CHF | 1.35% | 0.87% | 1.04% | -0.03% | 1.60% | 1.97% | 1.79% |
The heat map shows percentage changes of major currencies against each other. The base currency is picked from the left column, while the quote currency is picked from the top row. For example, if you pick the Euro from the left column and move along the horizontal line to the US Dollar, the percentage change displayed in the box will represent EUR (base)/USD (quote).
EUR/USD technical outlook
Fiber tilted into the top end on Wednesday, looking upwards through the midweek trading session and EUR/USD is on pace to chalk in a fourth straight week in the green, assuming buyers are able to maintain topside pressure.
EUR/USD follows a near-term rising trendline from late June’s bottom bids near 1.0670, clipping into an 18-week peak just shy of 1.0950. An extension of the Fiber’s topside recovery has sent bids through the top end of a rough descending channel, and bidders are running out of footholds as short pressure gathers to drag the pair back down to the 200-day Exponential Moving Average (EMA) at 1.0800.
EUR/USD hourly chart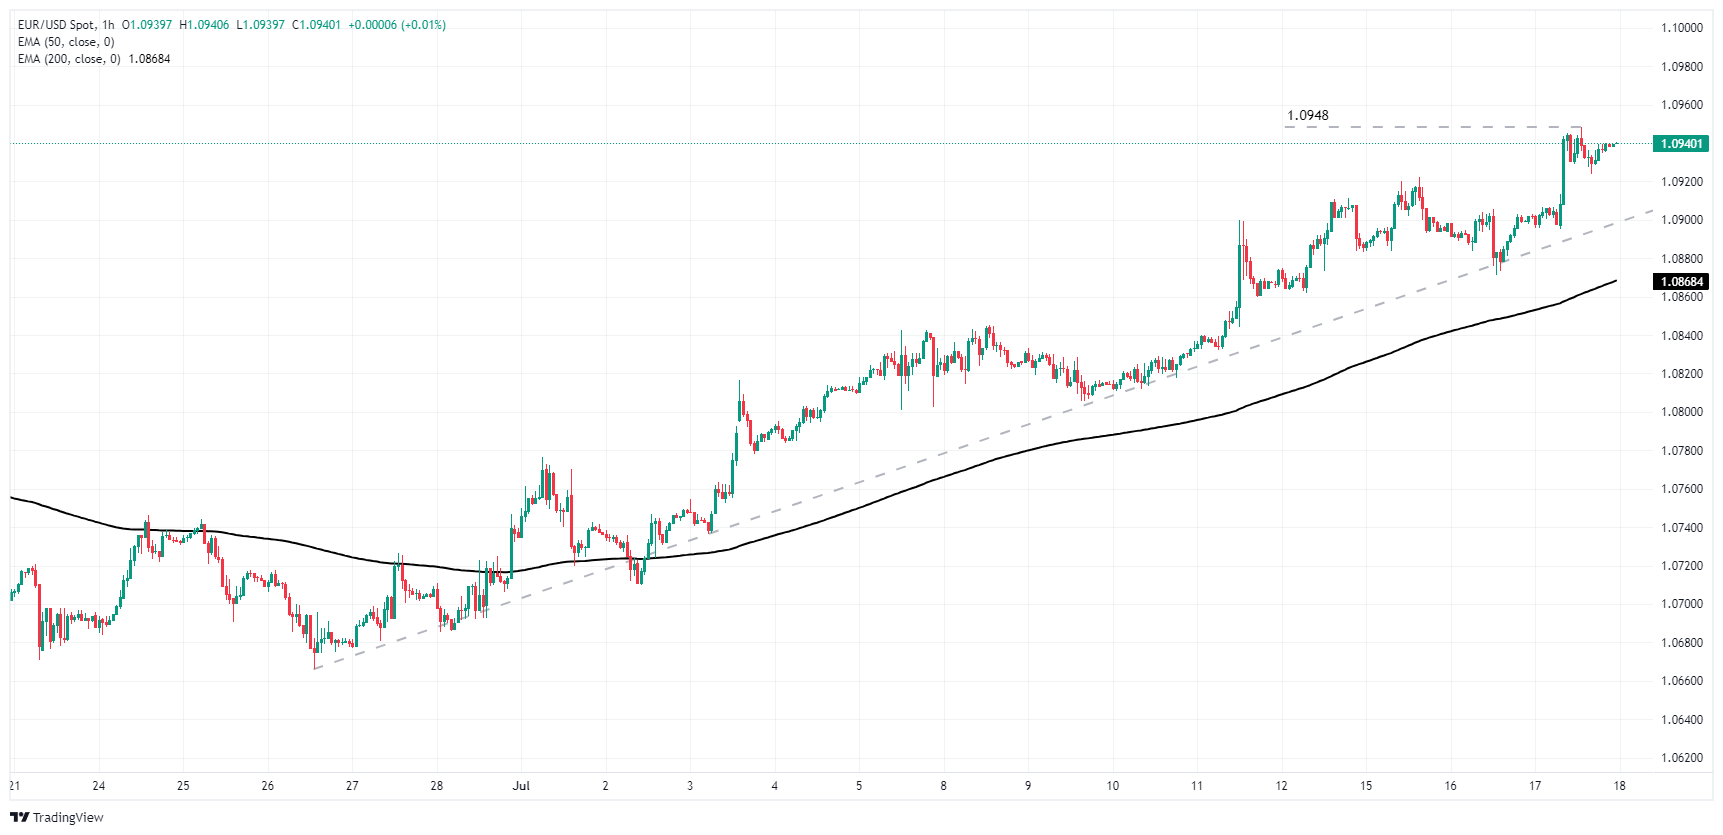
EUR/USD daily chart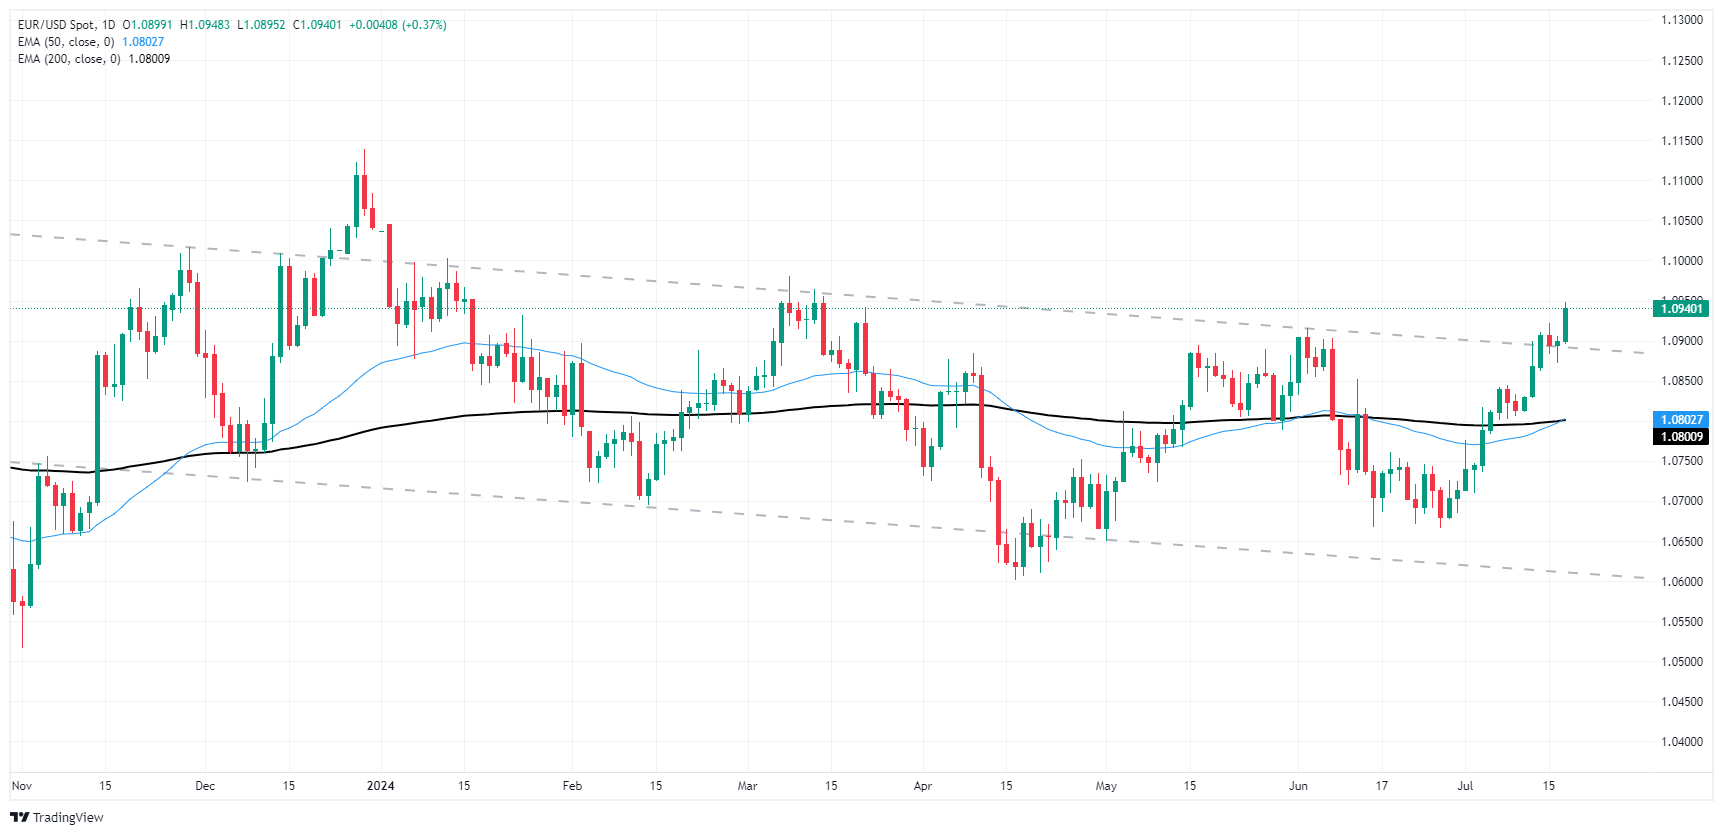
Euro FAQs
The Euro is the currency for the 20 European Union countries that belong to the Eurozone. It is the second most heavily traded currency in the world behind the US Dollar. In 2022, it accounted for 31% of all foreign exchange transactions, with an average daily turnover of over $2.2 trillion a day. EUR/USD is the most heavily traded currency pair in the world, accounting for an estimated 30% off all transactions, followed by EUR/JPY (4%), EUR/GBP (3%) and EUR/AUD (2%).
The European Central Bank (ECB) in Frankfurt, Germany, is the reserve bank for the Eurozone. The ECB sets interest rates and manages monetary policy. The ECB’s primary mandate is to maintain price stability, which means either controlling inflation or stimulating growth. Its primary tool is the raising or lowering of interest rates. Relatively high interest rates – or the expectation of higher rates – will usually benefit the Euro and vice versa. The ECB Governing Council makes monetary policy decisions at meetings held eight times a year. Decisions are made by heads of the Eurozone national banks and six permanent members, including the President of the ECB, Christine Lagarde.
Eurozone inflation data, measured by the Harmonized Index of Consumer Prices (HICP), is an important econometric for the Euro. If inflation rises more than expected, especially if above the ECB’s 2% target, it obliges the ECB to raise interest rates to bring it back under control. Relatively high interest rates compared to its counterparts will usually benefit the Euro, as it makes the region more attractive as a place for global investors to park their money.
Data releases gauge the health of the economy and can impact on the Euro. Indicators such as GDP, Manufacturing and Services PMIs, employment, and consumer sentiment surveys can all influence the direction of the single currency. A strong economy is good for the Euro. Not only does it attract more foreign investment but it may encourage the ECB to put up interest rates, which will directly strengthen the Euro. Otherwise, if economic data is weak, the Euro is likely to fall. Economic data for the four largest economies in the euro area (Germany, France, Italy and Spain) are especially significant, as they account for 75% of the Eurozone’s economy.
Another significant data release for the Euro is the Trade Balance. This indicator measures the difference between what a country earns from its exports and what it spends on imports over a given period. If a country produces highly sought after exports then its currency will gain in value purely from the extra demand created from foreign buyers seeking to purchase these goods. Therefore, a positive net Trade Balance strengthens a currency and vice versa for a negative balance.
- GBP/USD edged up a third of a percent on Wednesday.
- UK PPI inflation limited gains, but GBP traders look ahead to more UK data.
- Markets have fully priced in a September Fed rate cut.
GBP/USD inched further into fresh highs, testing chart territory north of the 1.3000 handle on Wednesday. Broad-market hopes of a rate cut from the Federal Reserve (Fed) in September kept the Greenback underbid and gave the Pound Sterling (GBP) a leg up in the mid-week market session. Recent Fedspeak has been interpreted as firmly dovish, with market participants seeing the writing on the wall they wish to as Fed officials give a head nod to recent progress on inflation measures. Cable traders will also want to keep an eye out for any knock-on volatility from the European Central Bank's (ECB) Thursday rate call.
Forex Today: The ECB and Lagarde steal the show
Rate markets have fully priced in at least a quarter-point rate trim when the Federal Open Market Committee (FOMC) gathers for a rate call on September 18, and July’s month-end meeting is still expected to keep rates flat. According to the CME’s FedWatch Tool, 98% odds of a September rate cut are fully priced in, with rate traders seeing three cuts in 2024 compared to the Fed’s own modest projections of one or two.
Final UK Consumer Price Index (CPI) inflation figures early Wednesday printed firmly within forecasts, giving GBP traders little to chew on, but a steeper-than-expected decline in UK Producer Price Index (PPI) inflation briefly weighed on the Pound Sterling. PPI producer-level inflation contracted by 0.3% MoM in June compared to the previous month’s revised 0.0% and entirely missing the forecast uptick to 0.1%.
Read more:
Fed's Barkin: Will debate at July meeting whether still appropriate to describe inflation as elevated
Fed's Waller: Most likely direction for monetary policy is rate cuts
Despite a broad-market dog-pile into Fed rate cut bets, Fedspeak from key policymakers maintains a dark tint to otherwise sunny skies. Both Fed Governor Christopher Waller and Richmond Fed President Thomas Barkin noted that labor markets remain particularly robust despite easing inflation pressures.
Thursday’s upcoming UK labor data dump will give GBP traders a firm directional tilt for the back half of the trading week. June’s Claimant Count Change is forecast to ease sharply to 23.4K MoM compared to the previous month’s 50.4K, while annualized quarterly Average Earnings Excluding Bonus is expected to tick down to 5.7% from the previous 6.0%.
Friday’s UK Retail Sales will round out the week’s UK data docket, and market model forecasts are calling for a -0.4% contraction in June’s retail spending volumes compared to the previous month’s wide surge of 2.9%.
British Pound PRICE Today
The table below shows the percentage change of British Pound (GBP) against listed major currencies today. British Pound was the strongest against the New Zealand Dollar.
| USD | EUR | GBP | JPY | CAD | AUD | NZD | CHF | |
|---|---|---|---|---|---|---|---|---|
| USD | -0.01% | -0.01% | -0.26% | -0.02% | -0.01% | 0.06% | -0.09% | |
| EUR | 0.00% | 0.01% | -0.26% | -0.01% | 0.02% | 0.07% | -0.08% | |
| GBP | 0.00% | -0.01% | -0.28% | -0.05% | 0.00% | 0.07% | -0.09% | |
| JPY | 0.26% | 0.26% | 0.28% | 0.25% | 0.27% | 0.25% | 0.20% | |
| CAD | 0.02% | 0.01% | 0.05% | -0.25% | 0.02% | 0.09% | -0.06% | |
| AUD | 0.01% | -0.02% | -0.01% | -0.27% | -0.02% | 0.06% | -0.07% | |
| NZD | -0.06% | -0.07% | -0.07% | -0.25% | -0.09% | -0.06% | -0.15% | |
| CHF | 0.09% | 0.08% | 0.09% | -0.20% | 0.06% | 0.07% | 0.15% |
The heat map shows percentage changes of major currencies against each other. The base currency is picked from the left column, while the quote currency is picked from the top row. For example, if you pick the British Pound from the left column and move along the horizontal line to the US Dollar, the percentage change displayed in the box will represent GBP (base)/USD (quote).
GBP/USD technical outlook
Cable traders have driven GBP/USD into 52-week highs above the 1.3000 handle, and bullish momentum has accelerated into the top end and dragged intraday price action further north of the 200-hour Exponential Moving Average (EMA). A lack of sustained buying wil easily see GBP/USD fall back into a near-term rising trendline from early July’s bottom bids just above the 1.2600 handle.
Daily candlesticks have run far ahead of technical levels, and Cable is stranded deep in bull country above the 200-day EMA at 1.2630. 2023’s peak bids near 1.3150 remains a tricky technical ceiling, while a pullback will have short pressure looking for a sustained fall back to the 50-day EMA at 1.2746.
GBP/USD hourly chart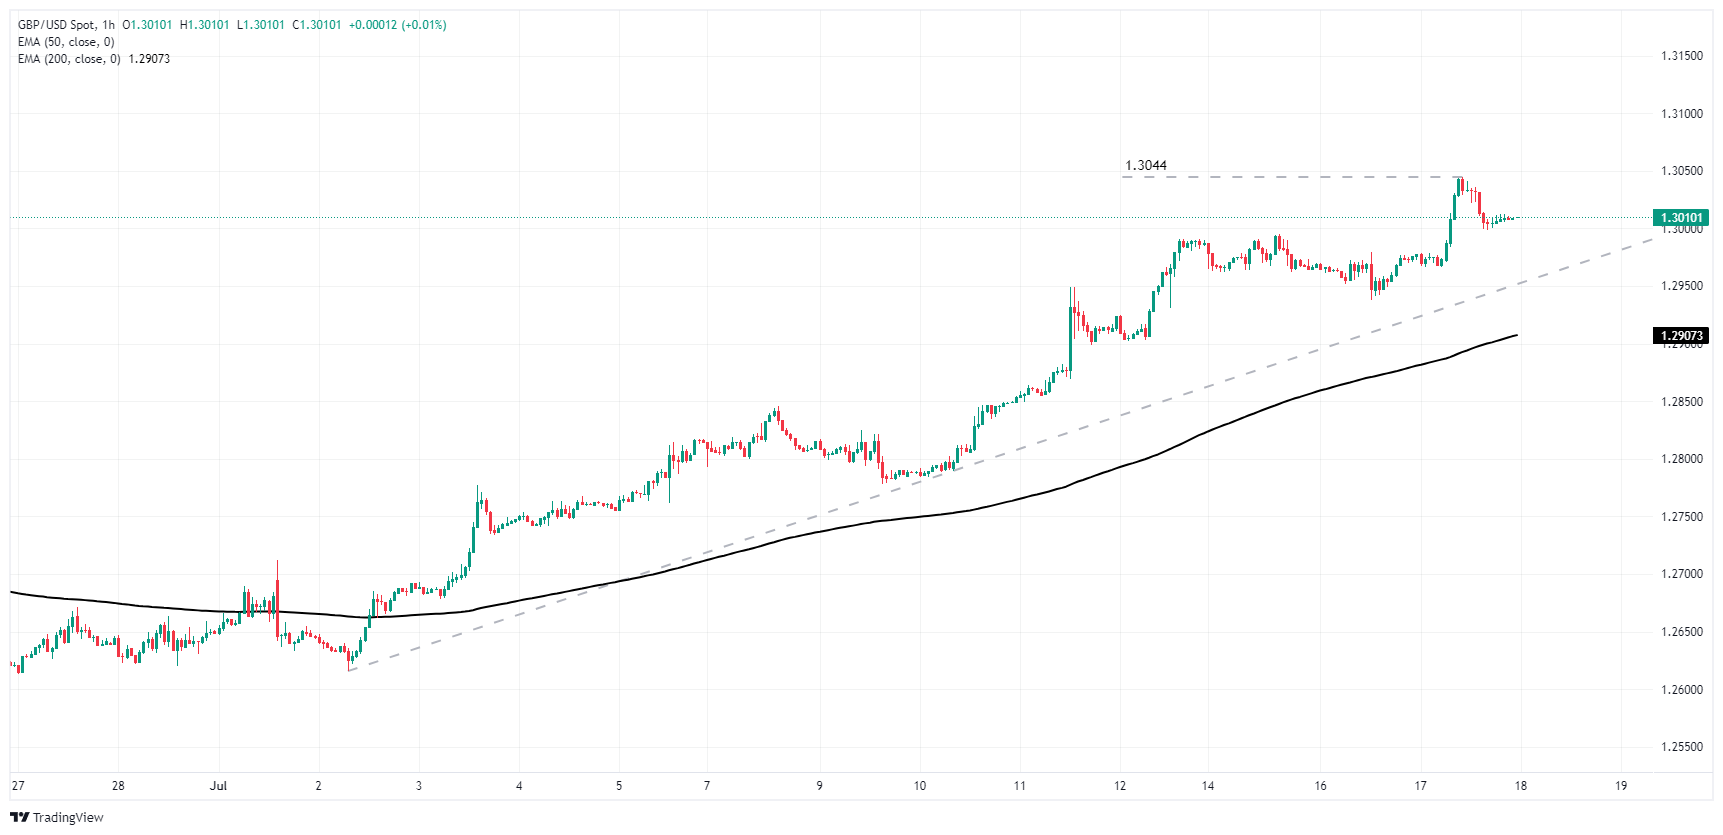
GBP/USD daily chart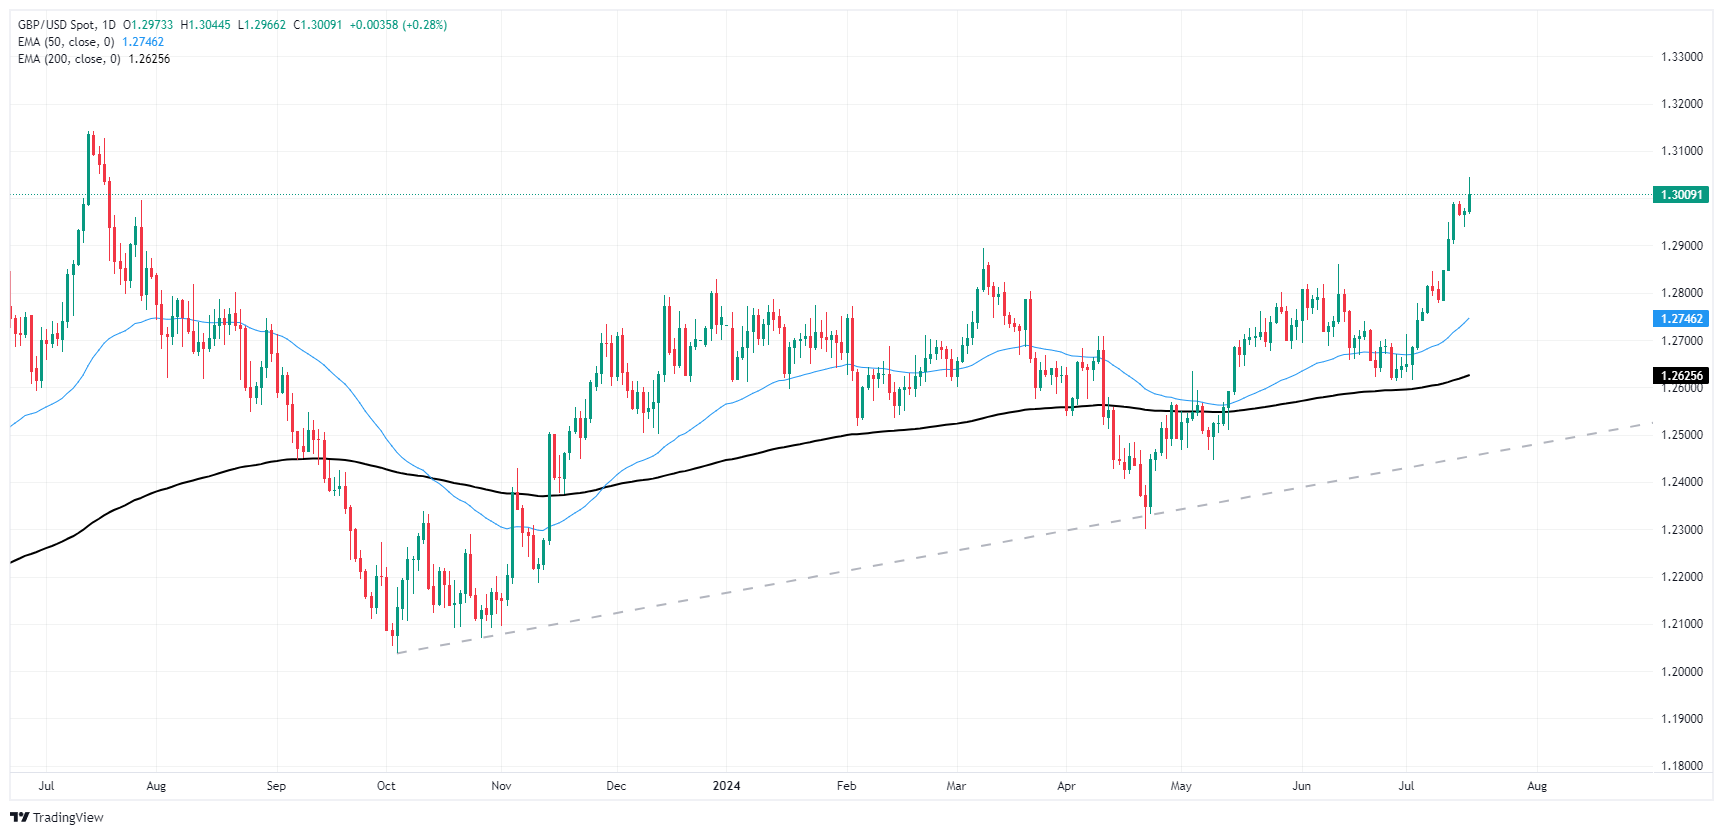
Pound Sterling FAQs
The Pound Sterling (GBP) is the oldest currency in the world (886 AD) and the official currency of the United Kingdom. It is the fourth most traded unit for foreign exchange (FX) in the world, accounting for 12% of all transactions, averaging $630 billion a day, according to 2022 data. Its key trading pairs are GBP/USD, aka ‘Cable’, which accounts for 11% of FX, GBP/JPY, or the ‘Dragon’ as it is known by traders (3%), and EUR/GBP (2%). The Pound Sterling is issued by the Bank of England (BoE).
The single most important factor influencing the value of the Pound Sterling is monetary policy decided by the Bank of England. The BoE bases its decisions on whether it has achieved its primary goal of “price stability” – a steady inflation rate of around 2%. Its primary tool for achieving this is the adjustment of interest rates. When inflation is too high, the BoE will try to rein it in by raising interest rates, making it more expensive for people and businesses to access credit. This is generally positive for GBP, as higher interest rates make the UK a more attractive place for global investors to park their money. When inflation falls too low it is a sign economic growth is slowing. In this scenario, the BoE will consider lowering interest rates to cheapen credit so businesses will borrow more to invest in growth-generating projects.
Data releases gauge the health of the economy and can impact the value of the Pound Sterling. Indicators such as GDP, Manufacturing and Services PMIs, and employment can all influence the direction of the GBP. A strong economy is good for Sterling. Not only does it attract more foreign investment but it may encourage the BoE to put up interest rates, which will directly strengthen GBP. Otherwise, if economic data is weak, the Pound Sterling is likely to fall.
Another significant data release for the Pound Sterling is the Trade Balance. This indicator measures the difference between what a country earns from its exports and what it spends on imports over a given period. If a country produces highly sought-after exports, its currency will benefit purely from the extra demand created from foreign buyers seeking to purchase these goods. Therefore, a positive net Trade Balance strengthens a currency and vice versa for a negative balance.
- USD/CAD consolidates in a trading range near 1.3685 in Thursday’s early Asian session.
- Fed’s Waller signalled a potential interest rate cut this year.
- Softer Canadian CPI inflation data has triggered the BoC rate cut expectation next week.
The USD/CAD pair oscillates in a familiar trading range around 1.3685 during the early Asian session on Thursday. The further decline in the USD Index (DXY) amid the firmer rate-cut bets by the Federal Reserve (Fed) might cap the pair’s upside. Investors will monitor the US weekly Initial Jobless Claims and the Philly Fed Manufacturing Index later on Thursday, along with the speech by the Fed’s Lorie Logan.
On Wednesday, Fed Governor Christopher Waller said that the US central bank is ‘getting closer’ to an interest rate cut as long as there are no major surprises on inflation and employment. Meanwhile, Richmond Fed President Tom Barkin said that the central bank needs more evidence that the process of disinflation is sustained before cutting the key interest rate.
According to the CME Group’s FedWatch Tool, traders in the fed funds futures market are pricing in an initial quarter percentage point rate cut in September followed by at least one more before the end of this year. The growing speculation of Fed rate cuts and dovish comments from Fed officials is likely to undermine the Greenback in the near term.
On the Loonie front, slower-than-expected Canadian Consumer Price Index (CPI) inflation data has spurred the expectation that the Bank of Canada (BoC) might cut another interest rate next week, which exerts some selling pressure on the Canadian Dollar (CAD). Financial markets have priced in nearly 93% odds of July rate cuts by the BoC, up from 82% before the inflation data was released.
On the other hand, the higher crude oil prices amid a larger-than-expected weekly drop in US crude oil inventories might lift the commodity-linked Loonie. It’s worth noting that Canada is the biggest Oil exporter to the United States (US).
Canadian Dollar FAQs
The key factors driving the Canadian Dollar (CAD) are the level of interest rates set by the Bank of Canada (BoC), the price of Oil, Canada’s largest export, the health of its economy, inflation and the Trade Balance, which is the difference between the value of Canada’s exports versus its imports. Other factors include market sentiment – whether investors are taking on more risky assets (risk-on) or seeking safe-havens (risk-off) – with risk-on being CAD-positive. As its largest trading partner, the health of the US economy is also a key factor influencing the Canadian Dollar.
The Bank of Canada (BoC) has a significant influence on the Canadian Dollar by setting the level of interest rates that banks can lend to one another. This influences the level of interest rates for everyone. The main goal of the BoC is to maintain inflation at 1-3% by adjusting interest rates up or down. Relatively higher interest rates tend to be positive for the CAD. The Bank of Canada can also use quantitative easing and tightening to influence credit conditions, with the former CAD-negative and the latter CAD-positive.
The price of Oil is a key factor impacting the value of the Canadian Dollar. Petroleum is Canada’s biggest export, so Oil price tends to have an immediate impact on the CAD value. Generally, if Oil price rises CAD also goes up, as aggregate demand for the currency increases. The opposite is the case if the price of Oil falls. Higher Oil prices also tend to result in a greater likelihood of a positive Trade Balance, which is also supportive of the CAD.
While inflation had always traditionally been thought of as a negative factor for a currency since it lowers the value of money, the opposite has actually been the case in modern times with the relaxation of cross-border capital controls. Higher inflation tends to lead central banks to put up interest rates which attracts more capital inflows from global investors seeking a lucrative place to keep their money. This increases demand for the local currency, which in Canada’s case is the Canadian Dollar.
Macroeconomic data releases gauge the health of the economy and can have an impact on the Canadian Dollar. Indicators such as GDP, Manufacturing and Services PMIs, employment, and consumer sentiment surveys can all influence the direction of the CAD. A strong economy is good for the Canadian Dollar. Not only does it attract more foreign investment but it may encourage the Bank of Canada to put up interest rates, leading to a stronger currency. If economic data is weak, however, the CAD is likely to fall.
- GBP/JPY tumbled back to 203.00 as markets suspect continued market intervention.
- The Yen soared a full percent against the Pound Sterling on Wednesday.
- This follows last week’s 2% sudden decline and a surge in BoJ spending.
GBP/JPY continued a pattern of sharp declines on Wednesday, tumbling over a full percent on the day as markets continue to suspect further direct intervention spending in an attempt to bolster the battered Yen.
According to reporting by Bloomberg, it is suspected that the Bank of Japan (BoJ) overspent on market operations to the tune of ¥2.14 trillion last Friday after week-on-week current account figures wildly overclocked money broker forecasts. No official statements from Japanese officials are expected, but if Wednesday’s extended downswing and last Friday’s Yen surge were a result of policymakers stepping into FX markets, it would represent the third and fourth instances of Yen defending just in 2024.
The Yen remains a deeply bearish currency that has become a sell-side favorite across the global fx markets. Even the Guppy’s -2.44% five day decline leaves GBP/JPY trading at 16-year highs, and direct market intervention is becoming increasingly expensive for Japan, a country with an already hefty debt ratio.
UK labor data, Japanese national CPI inflation numbers in the barrel
UK Producer Price Index (PPI) figures released early Wednesday did little to support the Pound Sterling with PPI inflation contracting 0.3% MoM in June, down from the previous revised 0.0% and entirely reversing direction on the forecast uptick to 0.1%.
UK labor data is in the barrel for Thursday, which is expected to show a sharp decline in unemployment claims. Claimant Count Change figures in June are forecast to ease to 23.4K from the previous 50.4K, and a misfire in the headline unemployment figure could shred further support for the GBP.
Japanese National Consumer Price Index (CPI) inflation is due on Friday, and while June’s annualized CPI inflation print is expected to tick up to 2.7% from the previous 2.5%, the figure is unlikely to be a strong enough inflation print to spark a topside move in interest rates from the BoJ. Japanese National CPI inflation figures are also forecast by Tokyo CPI inflation data which releases several weeks earlier, so market effects at the print tend to be muted.
GBP/JPY technical outlook
The Guppy tumbled back on Wednesday, falling toward the 203.00 handle amid broad-market strength in the Yen and flipping the pair into the red for the month of July, erasing the month’s gains and dragging bids down nearly 2.5% from July’s 16-year peak of 208.11.
A thin near-term consolidation range near 205.50 could provide an intraday technical support level for bids if they continue to circle the drain, but downside momentum still sees significant upside pressure. Daily candlesticks are still soaring well above the 200-day Exponential Moving Average (EMA) at 192.07, and bids would still need to drop another 0.8% before even coming within range of the 50-day EMA at 201.29.
GBP/JPY hourly chart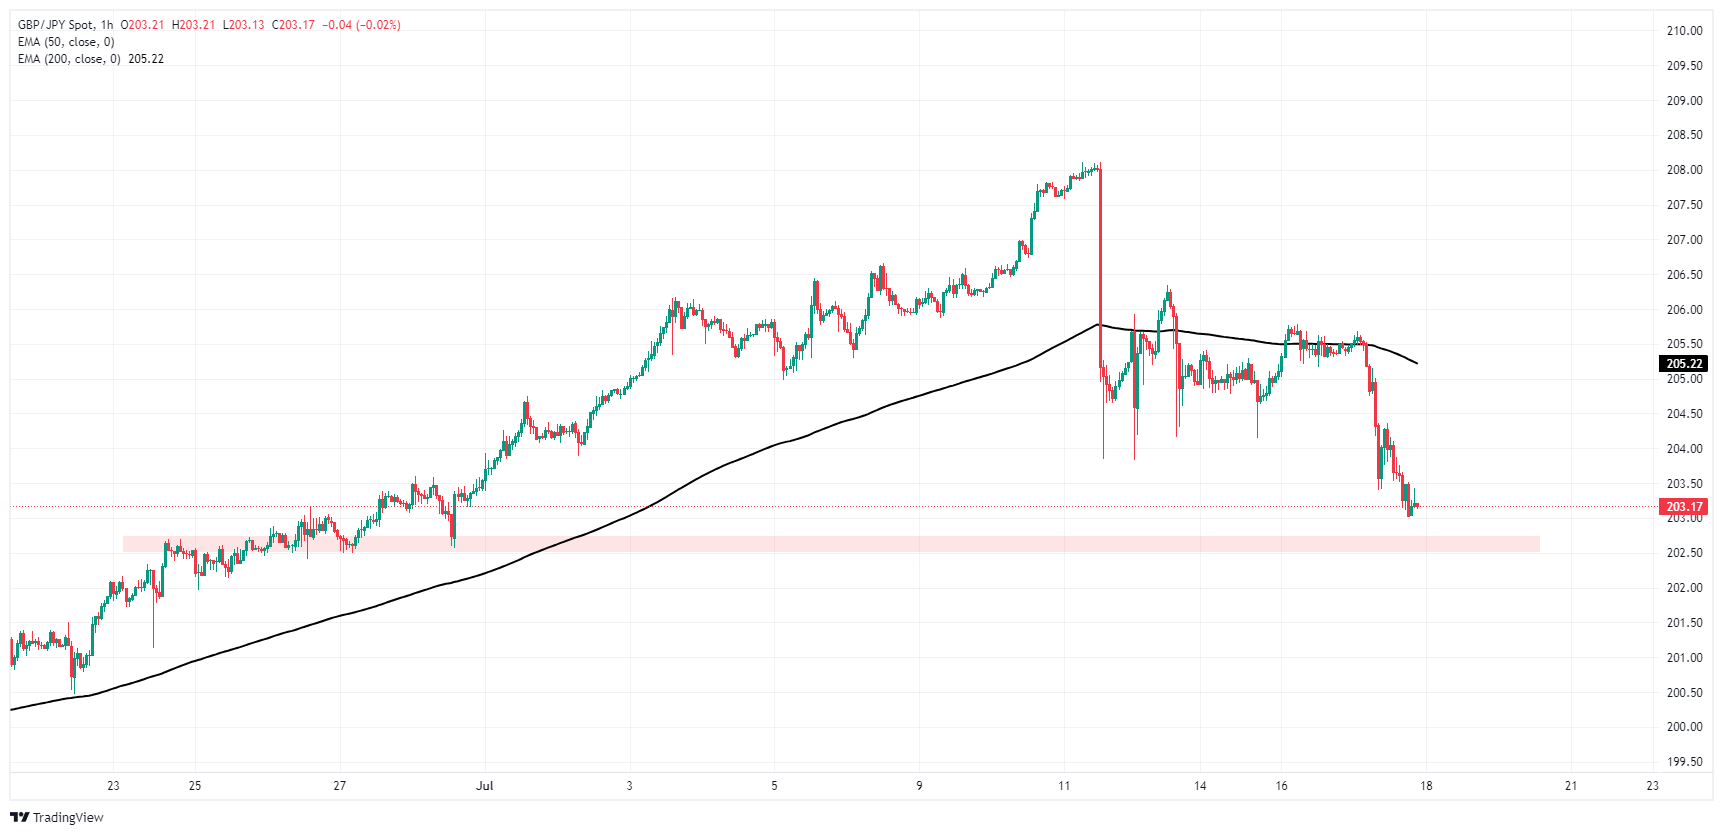
GBP/JPY daily chart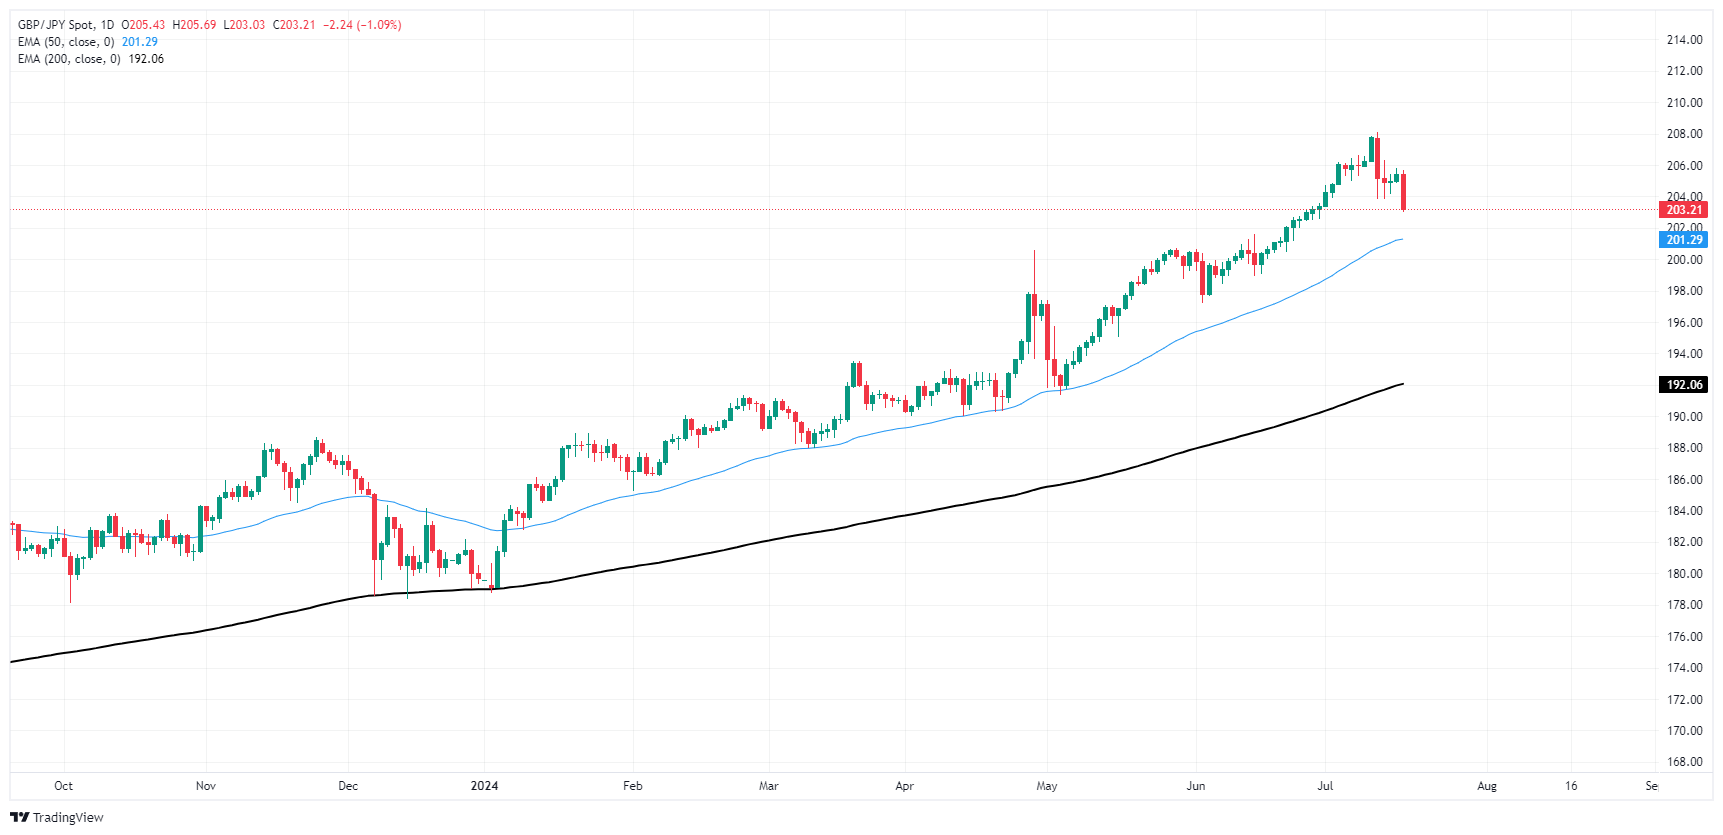
Japanese Yen FAQs
The Japanese Yen (JPY) is one of the world’s most traded currencies. Its value is broadly determined by the performance of the Japanese economy, but more specifically by the Bank of Japan’s policy, the differential between Japanese and US bond yields, or risk sentiment among traders, among other factors.
One of the Bank of Japan’s mandates is currency control, so its moves are key for the Yen. The BoJ has directly intervened in currency markets sometimes, generally to lower the value of the Yen, although it refrains from doing it often due to political concerns of its main trading partners. The current BoJ ultra-loose monetary policy, based on massive stimulus to the economy, has caused the Yen to depreciate against its main currency peers. This process has exacerbated more recently due to an increasing policy divergence between the Bank of Japan and other main central banks, which have opted to increase interest rates sharply to fight decades-high levels of inflation.
The BoJ’s stance of sticking to ultra-loose monetary policy has led to a widening policy divergence with other central banks, particularly with the US Federal Reserve. This supports a widening of the differential between the 10-year US and Japanese bonds, which favors the US Dollar against the Japanese Yen.
The Japanese Yen is often seen as a safe-haven investment. This means that in times of market stress, investors are more likely to put their money in the Japanese currency due to its supposed reliability and stability. Turbulent times are likely to strengthen the Yen’s value against other currencies seen as more risky to invest in.
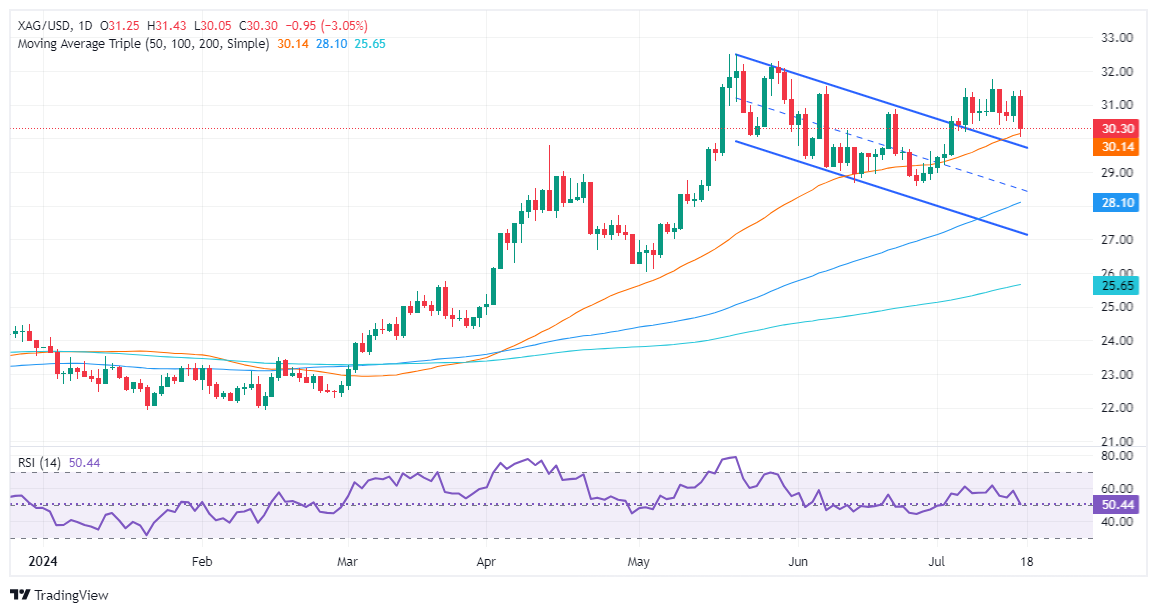
- Silver drops sharply, with a 3.13% decline from weekly highs, driven by profit-taking.
- Despite the fall, XAG/USD retains an upward bias, with support from the 50-day moving average at $30.12.
- Watch for potential bearish continuation below $30.00; resistance levels are at $31.00 and the July 11 peak of $31.75.
Silver prices tumbled from weekly highs hit on Tuesday at around $31.42 as traders took profits following a rally that lifted the grey metal’s prices more than 10% since the beginning of July. The XAG/USD trades at $30.28, down 3.13%.
XAG/USD Price Analysis: Technical outlook
Despite retreating, the XAG/USD is still upward biased, supported by the 50-day moving average (DMA) at $30.12, a level pierced during Wednesday’s session as Silver hit a daily low at $30.05.
From a momentum standpoint, sellers are gathering traction, with the Relative Strength Index (RSI) aiming lower yet remaining in bullish territory.
XAG/USD must clear the 50-DMA for a bearish continuation, followed by the $30.00 mark. If those two levels are surpassed, the next support would be the June 26 swing low of $28.57. On further weakness, Silver could fall to $28.00.
On the flip side, if buyers stepped in and pushed prices above $31.00, that could expose the July 11 peak at $31.75. Further gains lie overhead at $32.00.
XAG/USD Price Action – Daily Chart
Silver FAQs
Silver is a precious metal highly traded among investors. It has been historically used as a store of value and a medium of exchange. Although less popular than Gold, traders may turn to Silver to diversify their investment portfolio, for its intrinsic value or as a potential hedge during high-inflation periods. Investors can buy physical Silver, in coins or in bars, or trade it through vehicles such as Exchange Traded Funds, which track its price on international markets.
Silver prices can move due to a wide range of factors. Geopolitical instability or fears of a deep recession can make Silver price escalate due to its safe-haven status, although to a lesser extent than Gold's. As a yieldless asset, Silver tends to rise with lower interest rates. Its moves also depend on how the US Dollar (USD) behaves as the asset is priced in dollars (XAG/USD). A strong Dollar tends to keep the price of Silver at bay, whereas a weaker Dollar is likely to propel prices up. Other factors such as investment demand, mining supply – Silver is much more abundant than Gold – and recycling rates can also affect prices.
Silver is widely used in industry, particularly in sectors such as electronics or solar energy, as it has one of the highest electric conductivity of all metals – more than Copper and Gold. A surge in demand can increase prices, while a decline tends to lower them. Dynamics in the US, Chinese and Indian economies can also contribute to price swings: for the US and particularly China, their big industrial sectors use Silver in various processes; in India, consumers’ demand for the precious metal for jewellery also plays a key role in setting prices.
Silver prices tend to follow Gold's moves. When Gold prices rise, Silver typically follows suit, as their status as safe-haven assets is similar. The Gold/Silver ratio, which shows the number of ounces of Silver needed to equal the value of one ounce of Gold, may help to determine the relative valuation between both metals. Some investors may consider a high ratio as an indicator that Silver is undervalued, or Gold is overvalued. On the contrary, a low ratio might suggest that Gold is undervalued relative to Silver.
- Wednesday's session saw the NZD/JPY pair continue its decline.
- The cross has now marked a six-day losing streak now down 1.50% over the week.
- Oversold conditions might signal a looming correction.
On Wednesday, the NZD/JPY pair witnessed a further drop to land at 95.00. This continuous decline has extended the ongoing six-day losing streak. The overall loss, compared to the previous week is now seen at over 1.50% which has continued to defy the short-term outlook. That being said, as the downwards movements might be over-extended, the pair might correct to the upside somewhere in the next sessions.
The daily technical indicators not only persist under the bear's control but also enter the oversold conditions. The Relative Strength Index (RSI), currently at 28, has descended further into oversold territory, supporting a strengthened bearish sentiment. Concurrently, the Moving Average Convergence Divergence (MACD) is seen to print rising red bars, portraying continuous selling pressure.
NZD/JPY daily chart
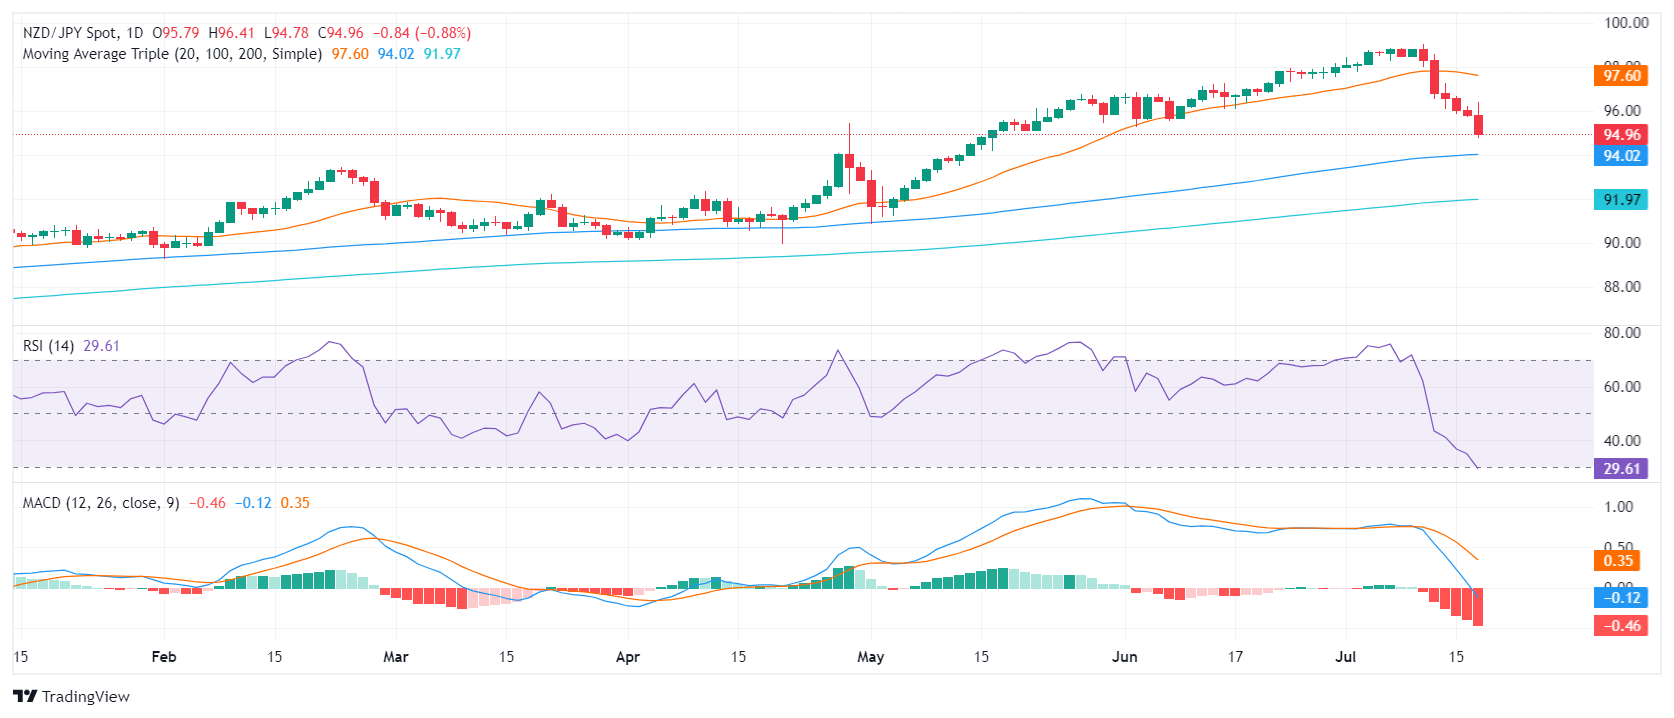
Synchronizing with the ongoing bearish tone, immediate support levels are now spotted lower at 94.50 and the key level at 94.00. A drop below these levels, especially the strong support at 94.00, may affirm the bear's dominance in the short term. On the flip side, the resistance levels are now repositioned at the previous support levels of 95.00, 95.50, and 96.00.
- The Australian Unemployment Rate is foreseen unchanged at 4% in June.
- Employment Change expected at 20K, down from the previous 39.7K.
- AUD/USD struggles to extend gains ahead of the announcement.
With sentiment dominating financial markets, the Australian Bureau of Statistics (ABS) will release the monthly employment report on Thursday at 1:30 GMT. The country is expected to have added 20K new positions in June, while the Unemployment Rate is foreseen to remain steady at 4%. The Australian Dollar (AUD) heads into the event with a firmer tone against its United States (US) rival, with AUD/USD trimming part of its early week losses.
The ABS splits the headline Employment Change figure into full-time and part-time positions. As a rule of thumb, full-time jobs imply working 38 hours per week or more and usually include additional benefits, but they mostly represent consistent income. On the other hand, part-time employment generally means higher hourly rates but lacks consistency and benefits. That’s why full-time jobs have more weight than part-time ones when setting an AUD directional path.
Back in May, the monthly employment report showed that Australia managed to create 41.7K full-time jobs but lost part-time positions, resulting in a net Employment Change of 39.7K. The Unemployment Rate contracted from the previous 4.1% to 4%.
Australian Unemployment Rate seen stable in June
As previously noted, financial markets anticipate the Unemployment Rate will remain steady at 4% and that the economy created 20K new positions in June.
The Australian Unemployment Rate peaked at 4.1% in April, matching the January reading and a level not seen since 2022. A higher unemployment rate usually signals a loosening labor market, allowing central banks to cut interest rates.
The Reserve Bank of Australia (RBA), however, maintained the Cash Rate at 4.35% in its June meeting and seems in no rush to cut interest rates. It is worth reminding that the RBA’s “duty is to contribute to the stability of the currency, full employment, and the economic prosperity and welfare of the Australian people.”
With that in mind, an easing Unemployment Rate and solid job creation will be seen as a tightening labor market, which means a further delay in potential interest rate cuts. In fact, the stronger the labor market, the higher the odds for a rate hike. The latest scenario is quite unlikely, given the risk it poses to economic growth, but speculative interest has not yet fully disregarded a potential rate hike. On rate cuts, bets keep moving forward, with the first potential trim in Australia foreseen in 2025.
When will the Australian employment report be released, and how could it affect AUD/USD?
The ABS will publish the June employment report early on Thursday. As previously stated, Australia is expected to have added 20K new job positions in the month, while the Unemployment Rate is foreseen at 4%. Finally, the Participation Rate is foreseen to hold at 66.8%.
The AUD/USD pair fell towards 0.6713 on Tuesday, clinching two consecutive daily losses despite an upbeat market mood that sent Wall Street into unexplored territory. However, stocks lost momentum, and the USD shed some ground with the pair bouncing from such a low and holding on to modest intraday gains at around 0.6740 ahead of the announcement.
From a technical perspective, Valeria Bednarik, Chief Analyst at FXStreet, notes: “The AUD/USD pair is bullish, although the momentum is missing. The daily chart shows a bullish 20 Simple Moving Average (SMA), partially losing its upward strength but still advancing below the current level and above mildly bullish 100 and 200 SMAs. Meanwhile, technical indicators hold onto positive levels, in line with the bullish case, but lack directional strength, suggesting investors are unsure where to go next.”
Bednarik adds: “AUD/USD has a strong static resistance level at 0.6770, with gains beyond it exposing the 0.6820/40 price zone. In the case of a bearish reaction, the pair will find support initially at around 0.6700, followed by the 0.6660 mark. As usual, the market will react not directly to the figures but to how those would affect the upcoming RBA monetary policy decision.”
Employment FAQs
Labor market conditions are a key element in assessing the health of an economy and thus a key driver for currency valuation. High employment, or low unemployment, has positive implications for consumer spending and economic growth, boosting the value of the local currency. Moreover, a very tight labor market – a situation in which there is a shortage of workers to fill open positions – can also have implications on inflation levels because low labor supply and high demand leads to higher wages.
The pace at which salaries are growing in an economy is key for policymakers. High wage growth means that households have more money to spend, usually leading to price increases in consumer goods. In contrast to more volatile sources of inflation such as energy prices, wage growth is seen as a key component of underlying and persisting inflation as salary increases are unlikely to be undone. Central banks around the world pay close attention to wage growth data when deciding on monetary policy.
The weight that each central bank assigns to labor market conditions depends on its objectives. Some central banks explicitly have mandates related to the labor market beyond controlling inflation levels. The US Federal Reserve (Fed), for example, has the dual mandate of promoting maximum employment and stable prices. Meanwhile, the European Central Bank’s (ECB) sole mandate is to keep inflation under control. Still, and despite whatever mandates they have, labor market conditions are an important factor for policymakers given their significance as a gauge of the health of the economy and their direct relationship to inflation.
Economic Indicator
Unemployment Rate s.a.
The Unemployment Rate, released by the Australian Bureau of Statistics, is the number of unemployed workers divided by the total civilian labor force, expressed as a percentage. If the rate increases, it indicates a lack of expansion within the Australian labor market and a weakness within the Australian economy. A decrease in the figure is seen as bullish for the Australian Dollar (AUD), while an increase is seen as bearish.
Read more.Next release: Thu Jul 18, 2024 01:30
Frequency: Monthly
Consensus: 4%
Previous: 4%
Source: Australian Bureau of Statistics
The Australian Bureau of Statistics (ABS) publishes an overview of trends in the Australian labour market, with unemployment rate a closely watched indicator. It is released about 15 days after the month end and throws light on the overall economic conditions, as it is highly correlated to consumer spending and inflation. Despite the lagging nature of the indicator, it affects the Reserve Bank of Australia’s (RBA) interest rate decisions, in turn, moving the Australian dollar. Upbeat figure tends to be AUD positive.
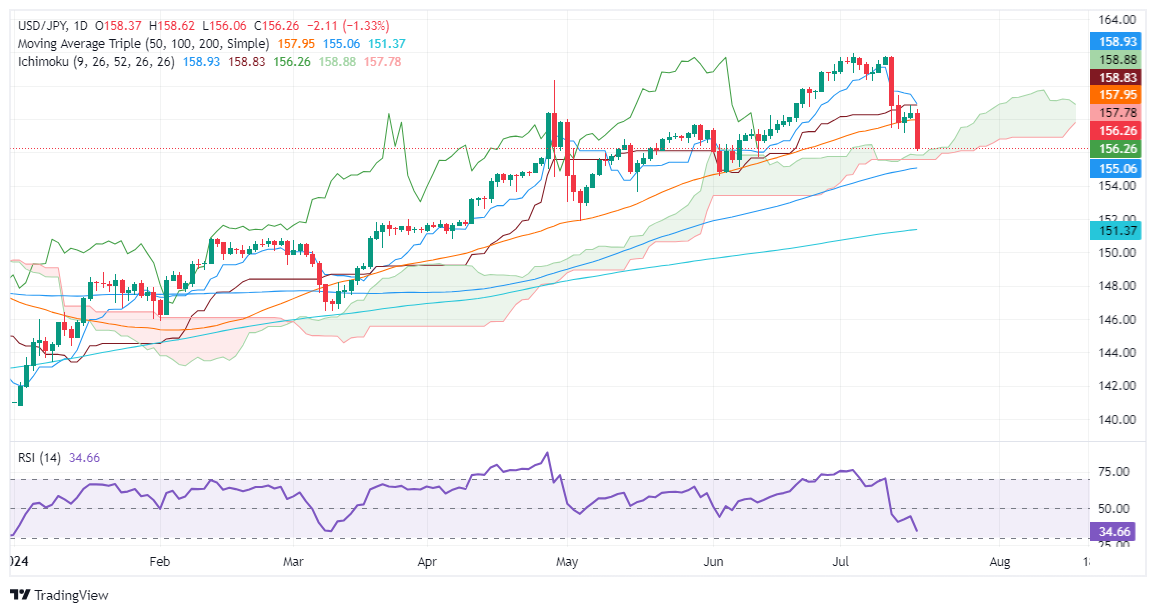
- USD/JPY drops to a three-week low of 156.32, diving from a daily high of 158.62.
- Bearish signals: Chikou Span crosses below June’s candle; Tenkan-Sen nearing cross below Kijun-Sen.
- Key supports at 155.50/60 and 153.61; resistance at 157.00 with potential re-test of 158.85.
The USD/JPY falls sharply on Wednesday, down by more than 1.30% and approaching the top of the Ichimoku Cloud (Kumo) at around 156.00. At the time of writing, the pair exchanged hands at 156.32 after diving from a daily high of 158.62.
USD/JPY Price Analysis: Technical outlook
The USD/JPY has dropped to a three-week low slightly above the Kumo, as more technical signals suggest the pair could extend its losses.
The Chikou Span crossed below June’s 12 candle, a bearish signal, while the Tenkan-Sen is about to cross below the Kijun-Sen at around 158.80/91. This and the USD/JPY clearing key support levels seen at 157.14 opened the door for further downside.
If USD/JPY clears the narrowest part of the Kumo sliding beneath 155.50/60, that would expose the May 16 swing low of 153.61. A breach of the latter will expose the May 2 pivot low at 151.87, ahead of testing the 151.00 mark.
On the other hand, if buyers stepped in and pushed the USD/JPY above 157.00, look for a re-test of the July 16 peak at 158.85.
USD/JPY Price Action – Daily Chart
Japanese Yen FAQs
The Japanese Yen (JPY) is one of the world’s most traded currencies. Its value is broadly determined by the performance of the Japanese economy, but more specifically by the Bank of Japan’s policy, the differential between Japanese and US bond yields, or risk sentiment among traders, among other factors.
One of the Bank of Japan’s mandates is currency control, so its moves are key for the Yen. The BoJ has directly intervened in currency markets sometimes, generally to lower the value of the Yen, although it refrains from doing it often due to political concerns of its main trading partners. The current BoJ ultra-loose monetary policy, based on massive stimulus to the economy, has caused the Yen to depreciate against its main currency peers. This process has exacerbated more recently due to an increasing policy divergence between the Bank of Japan and other main central banks, which have opted to increase interest rates sharply to fight decades-high levels of inflation.
The BoJ’s stance of sticking to ultra-loose monetary policy has led to a widening policy divergence with other central banks, particularly with the US Federal Reserve. This supports a widening of the differential between the 10-year US and Japanese bonds, which favors the US Dollar against the Japanese Yen.
The Japanese Yen is often seen as a safe-haven investment. This means that in times of market stress, investors are more likely to put their money in the Japanese currency due to its supposed reliability and stability. Turbulent times are likely to strengthen the Yen’s value against other currencies seen as more risky to invest in.
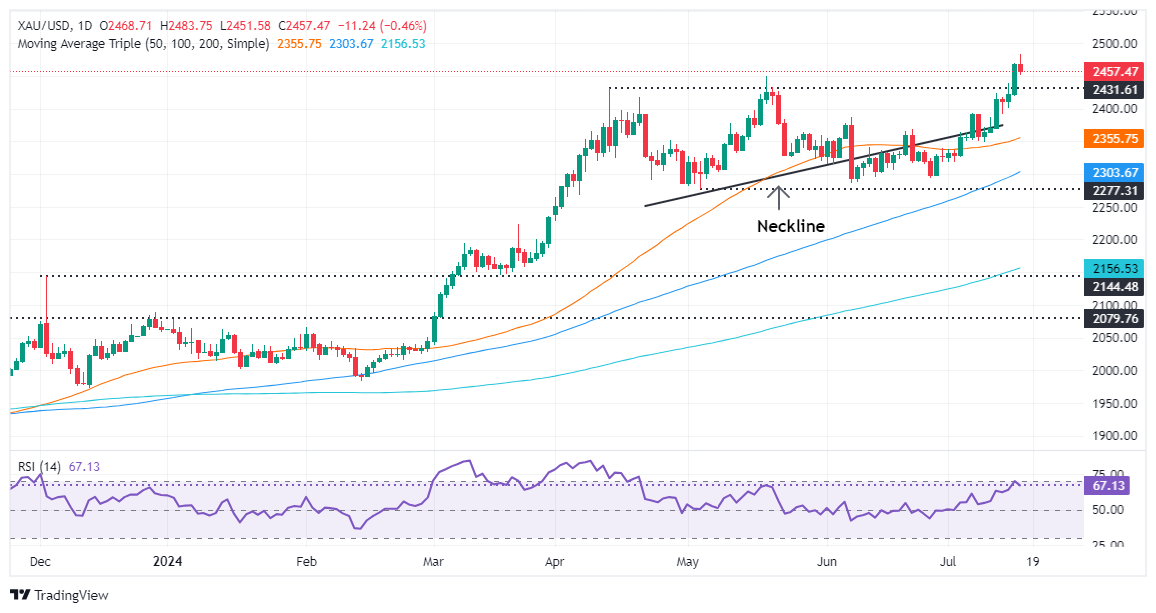
- Gold prices fall to $2,457 after hitting an all-time high of $2,483 due to profit-taking.
- Fed officials signal potential rate cuts; Governor Waller suggests downward trend for Fed funds rate.
- US Dollar Index drops to 103.72, its lowest since March 2024, while US Treasury yields decline.
Gold prices retreated as investors took profits after the yellow metal rallied to an all-time high of $2,483 earlier during the North American session on expectations that the Federal Reserve would lower borrowing costs. At the time of writing, the XAU/USD trades at $2457, down more than 0.40%.
Federal Reserve officials, led by Governor Christopher Waller, crossed the wires on Wednesday. He said the time to cut the policy rate is approaching, suggesting that the most likely direction for the Fed funds rate is downwards.
Earlier, Richmond Fed President Thomas Barkin mentioned that inflation has decreased over the last quarter, acknowledging that the current policy is restrictive. However, he is open to the possibility that the policy "is not as restrictive as thought."
Meanwhile, US housing data fared better than expected in June, hinting the economy remains solid. Building Permits and Housing Starts improved compared to May, while Industrial Production decelerated but exceeded estimates.
The non-yielding metal's last leg-up was also driven by former President Donald Trump's comments, in which he favors tax reductions, lower interest rates, and increased tariffs. These would likely be inflationary for the economy and weaken the Greenback.
The US Dollar Index, which tracks the performance of the currency against other six, sinks some 0.49% at 103.72, its lowest level since March 21, 2024. US Treasury bond yields are also falling across the yield curve, with the 10-year Treasury note yielding 4.14%, down almost one and a half basis point (bps).
Daily digest market movers: Gold retreats as buyers take a breather close to $2,500
- Weaker-than-expected US Consumer Price Index (CPI) data sponsored Gold’s leg-up above $2,400, as the odds for Fed rate cuts increased, as reflected by falling US Treasury bond yields.
- The US economic calendar featured Building Permits for June, which increased by 3.4% from 1.3999 million to 1.446 million. Further housing data showed that Housing Starts for the same period expanded by 3% from 1.314 million to 1.353 million.
- US Industrial Production in June decelerated from 0.9% in May to 0.6% month-over-month (MoM) yet exceeded estimates for a 0.3% increase.
- December 2024 fed funds rate futures contract implies that the Fed will ease policy by 52 basis points (bps) toward the end of the year, up from 50 last Friday.
- Bullion prices retreated slightly due to the People's Bank of China (PBoC) decision to halt gold purchases in June, as it did in May. By the end of June, China held 72.80 million troy ounces of the precious metal.
Gold technical analysis: XAU/USD retreats below $2,460 as buyers take a breather
Gold’s uptrend is set to continue, though buyers are taking a respite after hitting all-time highs shy of $2,490. Momentum is still in their favor, as shown by the Relative Strength Index (RSI), which dipped slightly but is still bullish.
If XAUUSD resumes its uptrend, the first resistance will be the all-time high at $2,483. A breach of the latter will expose the $2,490 figure, followed by the $2,500 psychological level.
On the flip side, If XAU/USD drops below $2,450, the first support would be the $2,400 figure, followed by the July 5 high at $2,392. If cleared, Gold would extend its losses to $2,350.
Gold FAQs
Gold has played a key role in human’s history as it has been widely used as a store of value and medium of exchange. Currently, apart from its shine and usage for jewelry, the precious metal is widely seen as a safe-haven asset, meaning that it is considered a good investment during turbulent times. Gold is also widely seen as a hedge against inflation and against depreciating currencies as it doesn’t rely on any specific issuer or government.
Central banks are the biggest Gold holders. In their aim to support their currencies in turbulent times, central banks tend to diversify their reserves and buy Gold to improve the perceived strength of the economy and the currency. High Gold reserves can be a source of trust for a country’s solvency. Central banks added 1,136 tonnes of Gold worth around $70 billion to their reserves in 2022, according to data from the World Gold Council. This is the highest yearly purchase since records began. Central banks from emerging economies such as China, India and Turkey are quickly increasing their Gold reserves.
Gold has an inverse correlation with the US Dollar and US Treasuries, which are both major reserve and safe-haven assets. When the Dollar depreciates, Gold tends to rise, enabling investors and central banks to diversify their assets in turbulent times. Gold is also inversely correlated with risk assets. A rally in the stock market tends to weaken Gold price, while sell-offs in riskier markets tend to favor the precious metal.
The price can move due to a wide range of factors. Geopolitical instability or fears of a deep recession can quickly make Gold price escalate due to its safe-haven status. As a yield-less asset, Gold tends to rise with lower interest rates, while higher cost of money usually weighs down on the yellow metal. Still, most moves depend on how the US Dollar (USD) behaves as the asset is priced in dollars (XAU/USD). A strong Dollar tends to keep the price of Gold controlled, whereas a weaker Dollar is likely to push Gold prices up.
- AUD/JPY drops towards 105.00, notably below the 20-day SMA.
- The downtrend continues, now showing sharp momentum as bearish sentiment increases.
- With intensified bearish momentum, the pair may see a slight upward correction.
In Wednesday's session, the AUD/JPY pair recorded a significant drop to 105.05, marking an extended five-day losing streak from last week. This decline is a significant drop from Tuesday's close of 106.80, indicating a deepening bearish momentum for the pair. This continued downtrend, which is marked by indicators being deep in negative terrain, suggests that the pair may see further losses in the short term but a correction is also in the table.
The daily Relative Strength Index (RSI) for AUD/JPY now stands at 40, as the pair has reached new lows since mid-June. Simultaneously, the daily Moving Average Convergence Divergence (MACD) prints rising red bars, implying an intensified selling activity.
AUD/JPY daily chart
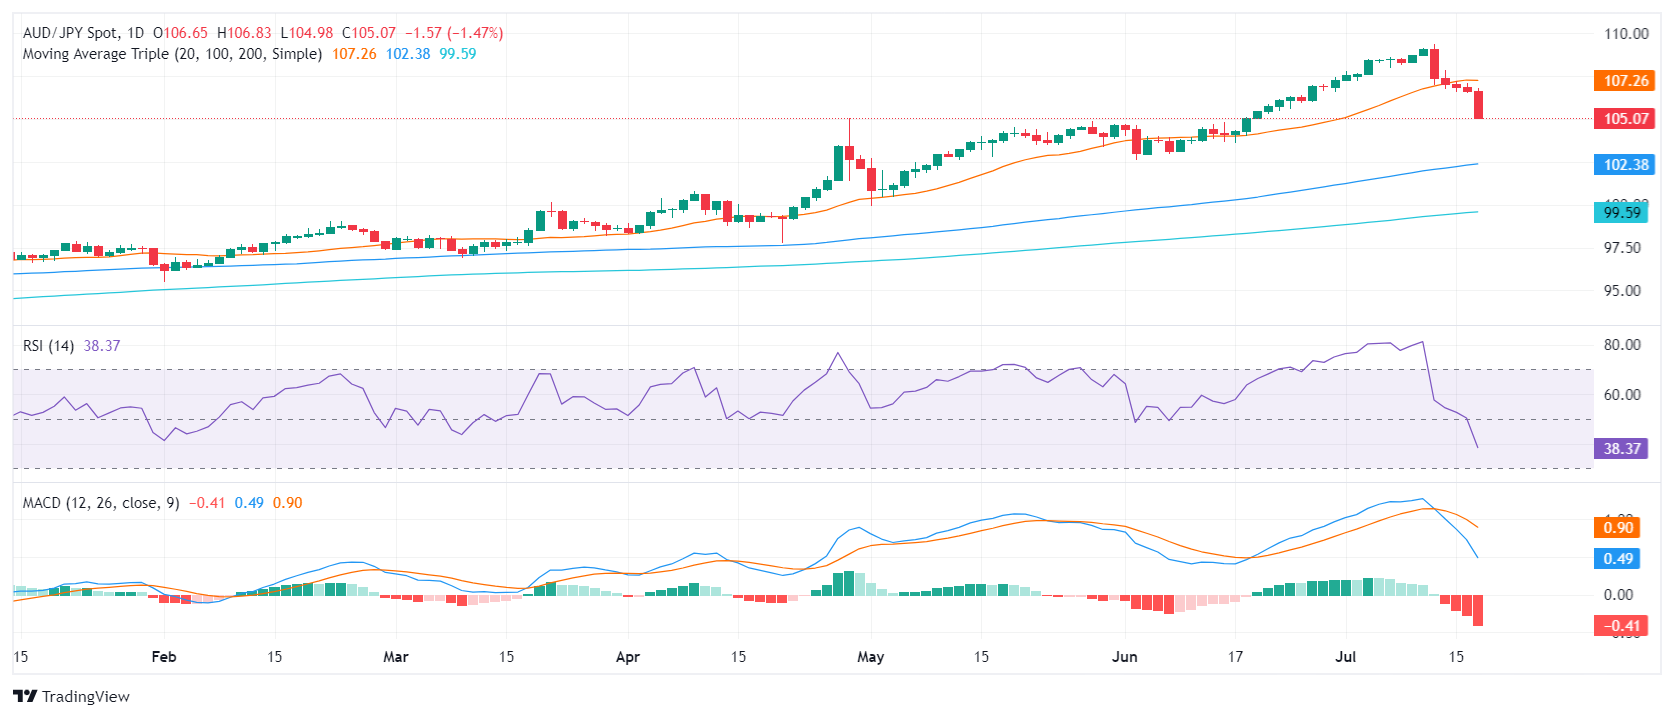 In the broader picture, the AUD/JPY pair seems to maintain its bearish tendency, much highlighted by its position notably below the 20-day Simple Moving Average (SMA) supports. As the pair proceeds its descent, immediate support levels at 105.00 and 104.30 become the crucial markers to watch. To avoid further potential losses, buyers must look to reclaim the 106.00 mark and further target the resurrection of the 106.50 level.
The Greenback extended its downtrend to new four-month lows in response to another FX intervention by the BoJ, firmer rate-cut bets, and the broad-based better tone in risk-associated assets. On Thursday, the ECB will most likely maintain its policy rates unchanged, while investors are expected to closely follow President Lagarde for any clues on the next rate cut.
Here is what you need to know on Thursday, July 18:
Further weakness sent the USD Index (DXY) to the sub-104.00 region, or four-month lows, helped by the lack of traction in US yields. The usual weekly Initial Jobless Claims and the Philly Fed Manufacturing Index are due on July 18 seconded by the CB Leading Index and Net Long Term TIC Flows. In addition, the Fed’s Logan is also expected to speak.
EUR/USD rose to multi-week highs around 1.0950 in response to the increased selling pressure in the Dollar. On July 18, the ECB should leave its interest rates unchanged, while attention will also be on the press conference by President Lagarde.
GBP/USD finally surpassed the 1.3000 barrier for the first time since July 2023. The publication of the UK labour market report should take centre stage in the domestic docket on July 18.
USD/JPY dropped further in response to another suspected intervention in the FX space by the BoJ. The Balance of Trade and weekly Foreign Bond Investment figures will be unveiled on July 18.
AUD/USD clinched its third daily pullback in a row amidst further weakness in the commodity universe and Chinese demand concerns. The always-relevant Australian labour market report will be at the centre of the debate on July 18.
A weaker Dollar, reignited geopolitical jitters, and the larger-than-expected weekly drop in US crude oil inventories all lifted WTI prices to three-day peaks near the $83.00 mark per barrel.
Gold prices rose to an all-time top near $2,490 per ounce troy before correcting a tad lower towards the end of the session. Silver sold-off and challenged the $30.00 mark per ounce, or two-week lows.
- AUD/USD further diminished on Wednesday, falling beneath 0.6730.
- Australian employment figures are set to guide short-term trends that could lay the groundwork for a more hawkish RBA.
- Fed’s Barkin didn’t rule out a July rate cut.
The Australian Dollar (AUD) extended losses against the USD during Wednesday's session, with the AUD/USD dipping to 0.6725. Following the declining streak from Monday's and Tuesday's sessions, the AUD intensified its losses as profit-taking by investors escalated. Nevertheless, the economic landscape suggests the AUD's potential to withstand falls against the USD amidst differing monetary policies between the Federal Reserve and the Reserve Bank of Australia (RBA).
Despite indications of a fluctuating Australian economy, persistently high inflation is urging the RBA to postpone cuts, which may restrain the AUD's downside. It is foreseen that the RBA will be amongst the final central banks from the G10 countries to implement rate cuts, a component that could bolster the AUD's upswing.
Daily digest market movers: AUD path dependant on labor market data
- Investors are poised on the Australian Employment data, scheduled for release on Thursday. The forecast reveals that 20,000 job hunters found employment in June, a number parallel to the May figures.
- If the unemployment rate remains stable at 4.0%, it would signal a robust labor market which could bolster expectations of the RBA's policy-tightening initiative.
- However, in the US, the market suspects a near-future rate cut by the Federal Reserve inflation is showing signs of easing.
- As for now, market projections currently factor in almost a 50% chance of the RBA increasing rates in September or November.
- On the other hand, the likelihood of a rate cut by the Federal Reserve in September is nearly to be priced in.
- The divergent monetary policies of the Fed and RBA might limit the losses of the pair.
Technical Analysis: AUD/USD enters a correction phase, overall outlook remains afloat
Despite the losses this week, the outlook of the AUD/USD remains overall positive, as the pair is maintaining levels not seen since the start of the year. After a surge of over 1.5% in July, indicators like the Relative Strength Index (RSI) and the Moving Average Convergence Divergence (MACD) reached overbought territory which instigated a slight correction.
The aim for buyers is to hold steady within the 0.6700-0.6730 to keep the short-term outlook positive.
Australian Dollar FAQs
One of the most significant factors for the Australian Dollar (AUD) is the level of interest rates set by the Reserve Bank of Australia (RBA). Because Australia is a resource-rich country another key driver is the price of its biggest export, Iron Ore. The health of the Chinese economy, its largest trading partner, is a factor, as well as inflation in Australia, its growth rate and Trade Balance. Market sentiment – whether investors are taking on more risky assets (risk-on) or seeking safe-havens (risk-off) – is also a factor, with risk-on positive for AUD.
The Reserve Bank of Australia (RBA) influences the Australian Dollar (AUD) by setting the level of interest rates that Australian banks can lend to each other. This influences the level of interest rates in the economy as a whole. The main goal of the RBA is to maintain a stable inflation rate of 2-3% by adjusting interest rates up or down. Relatively high interest rates compared to other major central banks support the AUD, and the opposite for relatively low. The RBA can also use quantitative easing and tightening to influence credit conditions, with the former AUD-negative and the latter AUD-positive.
China is Australia’s largest trading partner so the health of the Chinese economy is a major influence on the value of the Australian Dollar (AUD). When the Chinese economy is doing well it purchases more raw materials, goods and services from Australia, lifting demand for the AUD, and pushing up its value. The opposite is the case when the Chinese economy is not growing as fast as expected. Positive or negative surprises in Chinese growth data, therefore, often have a direct impact on the Australian Dollar and its pairs.
Iron Ore is Australia’s largest export, accounting for $118 billion a year according to data from 2021, with China as its primary destination. The price of Iron Ore, therefore, can be a driver of the Australian Dollar. Generally, if the price of Iron Ore rises, AUD also goes up, as aggregate demand for the currency increases. The opposite is the case if the price of Iron Ore falls. Higher Iron Ore prices also tend to result in a greater likelihood of a positive Trade Balance for Australia, which is also positive of the AUD.
The Trade Balance, which is the difference between what a country earns from its exports versus what it pays for its imports, is another factor that can influence the value of the Australian Dollar. If Australia produces highly sought after exports, then its currency will gain in value purely from the surplus demand created from foreign buyers seeking to purchase its exports versus what it spends to purchase imports. Therefore, a positive net Trade Balance strengthens the AUD, with the opposite effect if the Trade Balance is negative.
- Dow Jones climbs on Wednesday as Fedspeak keeps rate cut hopes pinned.
- Fed rate cut expectations have fully priced in a September rate cut.
- One last batch of US inflation figures remains before the Fed’s July rate call.
The Dow Jones Industrial Average (DJIA) clipped into further gains on Wednesday, extending the week’s hard rally on sky-high rate cut expectations and stepped into yet another all-time record high in intraday trading. Investors are piling into securities poised to capitalize on broadly-expected Federal Reserve (Fed) rate cuts.
According to the CME’s FedWatch Tool, rate markets have fully priced in a rate cut when the Federal Open Market Committee (FOMC) gathers for a rate call on September 18. Rate traders currently see 98% odds of a first quarter-point rate cut in September, and particularly wistful markets are pricing in up to three cuts by the end of 2024, well above the Fed’s own forecast of one or two.
As markets weigh odds of the Fed getting bullied into a rate cut cycle by cooling inflation data, one last round of US inflation figures remains on the data docket before the Fed’s July rate meeting on July 31. US Personal Consumption Expenditures Price Index (PCE) inflation is due on Friday, July 26 and represents the last key inflation data that will contour investor expectations for Fed forward guidance heading deeper into the second half of the year.
Dow Jones news
Dow Jones is getting dragged higher on Wednesday, with over two-thirds of the index firmly in the green for the day, with losses concentrated once again in key tech sector companies. Amazon.com Inc. (AMZN) tumbled -3.3% to $186.66 per share on Wednesday, closely followed by Apple Inc. (AAPL) which backslid -2.5% to $228.87 per share. On the high side, Unitedhealth Group Inc. (UNH) soared another 4.0%, setting a new all-time high above $571.00 per share.
Dow Jones technical outlook
The Dow Jones Industrial Average has put the rubber to the road, extending into record highs another 200 points on Wednesday and chalking up a sixth straight trading day of firm gains. DJIA has climbed nearly 5% over six consecutive trading sessions.
With Dow Jones etching in a fresh record high of 41,185.87, bearish technicals have evaporated and short interest will be waiting for a pullback before even bothering trying to drag bids back down to the 200-day Exponential Moving Average (EMA) at 37,822.88.
Dow Jones five minute chart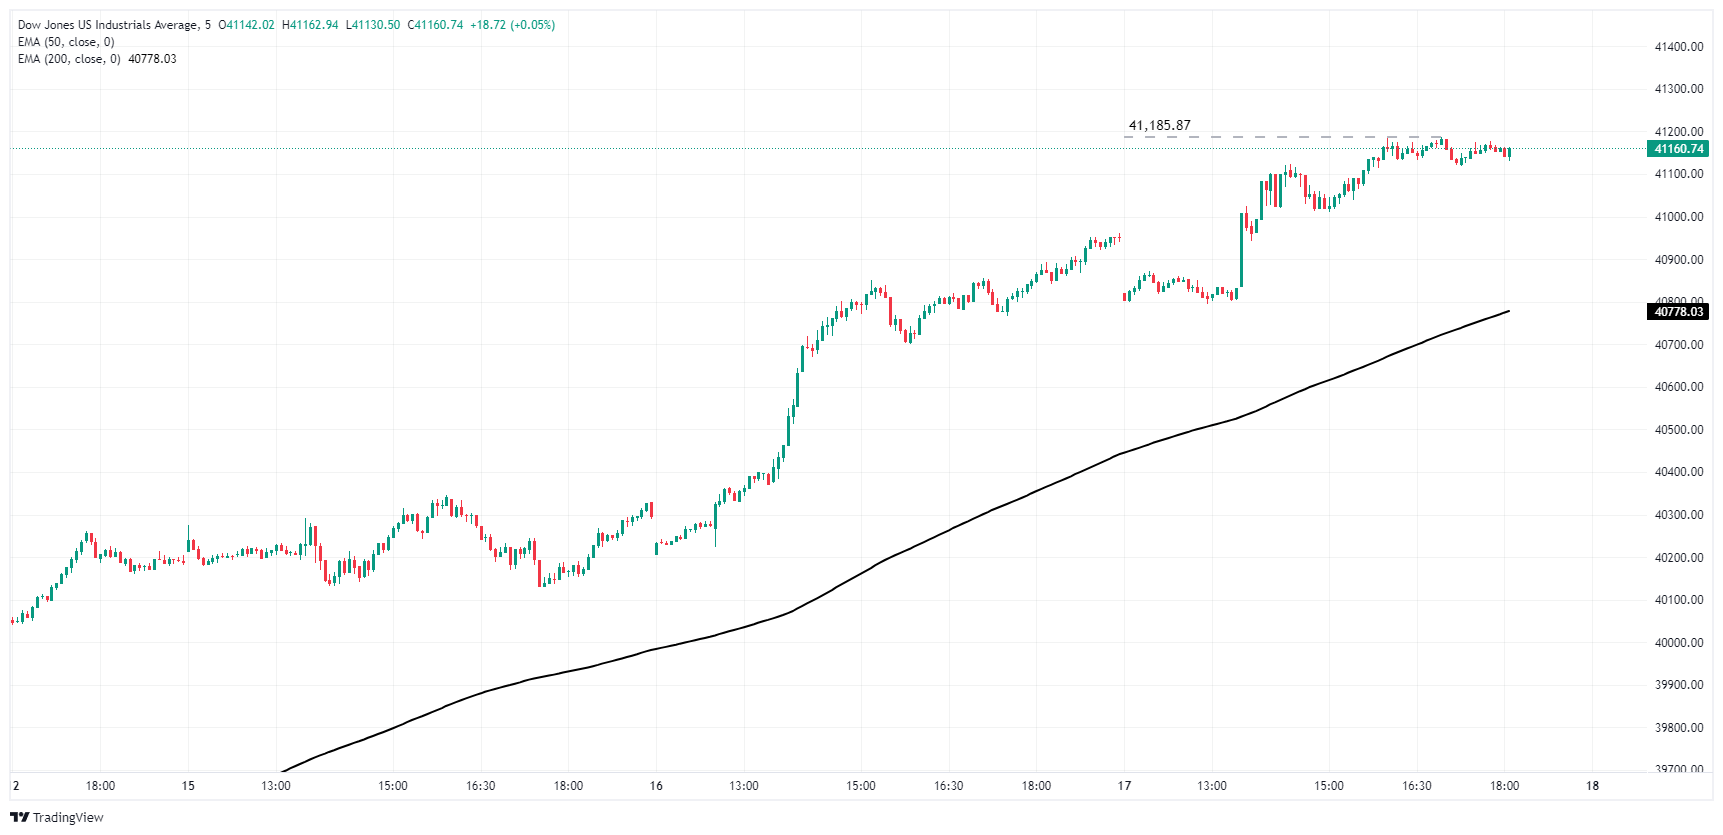
Dow Jones daily chart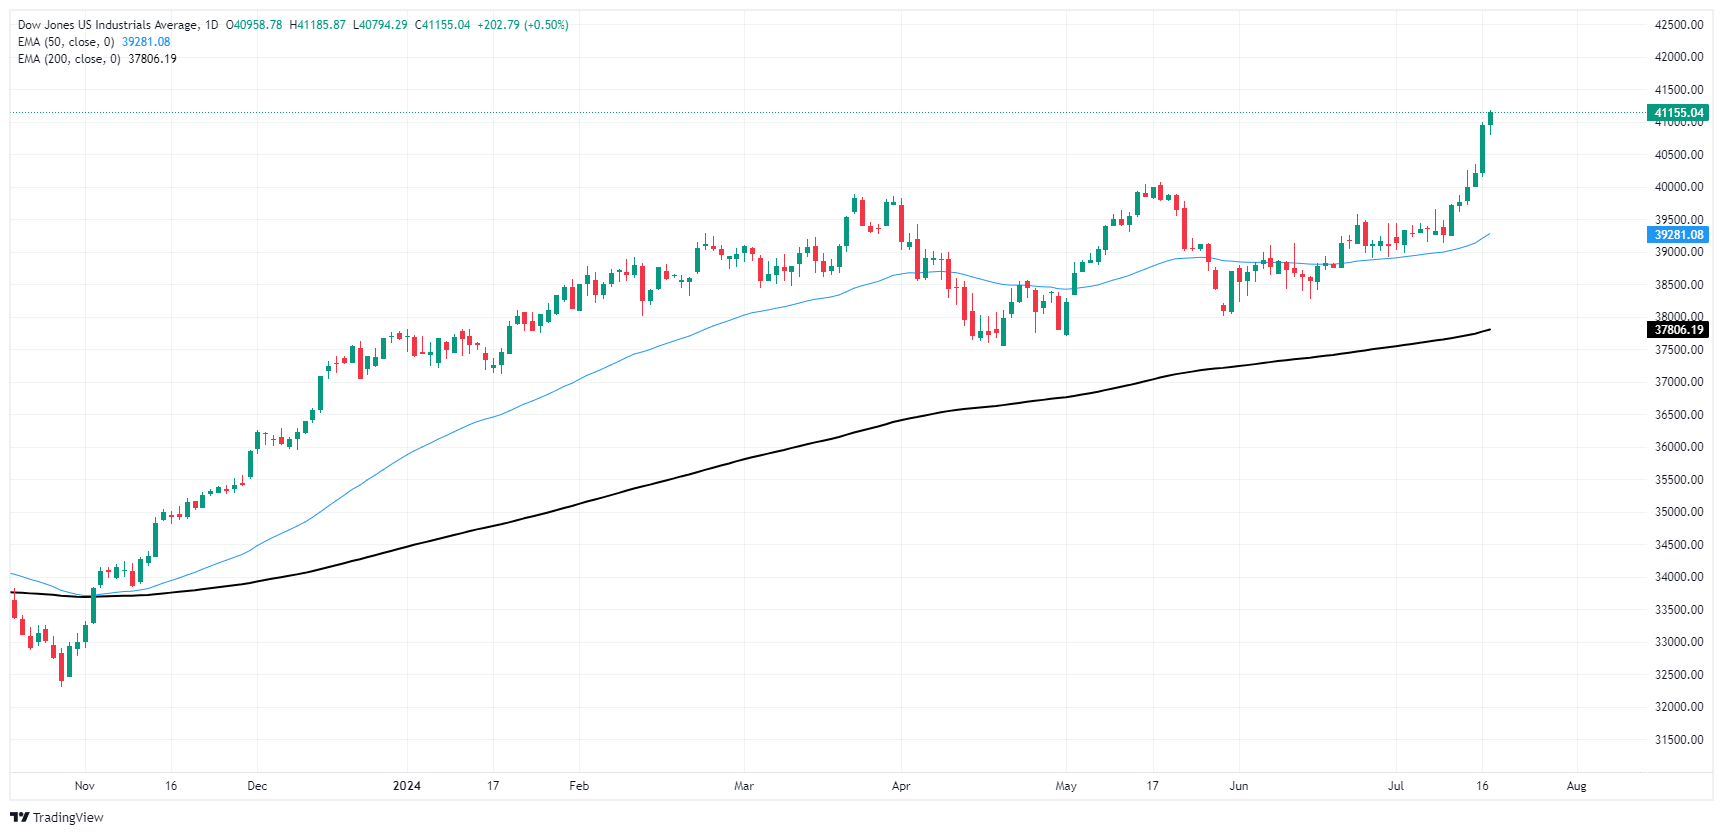
Dow Jones FAQs
The Dow Jones Industrial Average, one of the oldest stock market indices in the world, is compiled of the 30 most traded stocks in the US. The index is price-weighted rather than weighted by capitalization. It is calculated by summing the prices of the constituent stocks and dividing them by a factor, currently 0.152. The index was founded by Charles Dow, who also founded the Wall Street Journal. In later years it has been criticized for not being broadly representative enough because it only tracks 30 conglomerates, unlike broader indices such as the S&P 500.
Many different factors drive the Dow Jones Industrial Average (DJIA). The aggregate performance of the component companies revealed in quarterly company earnings reports is the main one. US and global macroeconomic data also contributes as it impacts on investor sentiment. The level of interest rates, set by the Federal Reserve (Fed), also influences the DJIA as it affects the cost of credit, on which many corporations are heavily reliant. Therefore, inflation can be a major driver as well as other metrics which impact the Fed decisions.
Dow Theory is a method for identifying the primary trend of the stock market developed by Charles Dow. A key step is to compare the direction of the Dow Jones Industrial Average (DJIA) and the Dow Jones Transportation Average (DJTA) and only follow trends where both are moving in the same direction. Volume is a confirmatory criteria. The theory uses elements of peak and trough analysis. Dow’s theory posits three trend phases: accumulation, when smart money starts buying or selling; public participation, when the wider public joins in; and distribution, when the smart money exits.
There are a number of ways to trade the DJIA. One is to use ETFs which allow investors to trade the DJIA as a single security, rather than having to buy shares in all 30 constituent companies. A leading example is the SPDR Dow Jones Industrial Average ETF (DIA). DJIA futures contracts enable traders to speculate on the future value of the index and Options provide the right, but not the obligation, to buy or sell the index at a predetermined price in the future. Mutual funds enable investors to buy a share of a diversified portfolio of DJIA stocks thus providing exposure to the overall index.
- Mexican Peso edges down 0.50% as USD/MXN rebounds from a daily low of 17.63.
- IMF lowers Mexico's 2024 GDP forecast from 2.4% to 2.2% amid economic slowdown.
- Trump's interview boosts market volatility; Fed officials hint at potential rate cuts.
The Mexican Peso stumbled and lost some 0.50% on Wednesday as risk appetite deteriorated. Former US President and Republican Candidate Donald Trump’s interview with Bloomberg spooked investors, and Wall Street equity indices plunged. Therefore, the USD/MXN trades at 17.75 after bouncing off daily lows of 17.63.
The economic docket in Mexico is absent, though the Bank of Mexico Deputy Governor Omar Mejia Castelazo crossed the wires, saying that although Banxico cut rates, it doesn’t mean the beginning of a cycle of interest rate cuts.
Meanwhile, the International Monetary Fund (IMF) adjusted Mexico’s Gross Domestic Product (GDP) expectations for 2024 from 2.4% to 2.2%. The revision shows Mexico’s ongoing economic slowdown driven by manufacturing contraction, observed in the first quarter of 2024, blamed on an experienced deceleration in the US economy.
The Deputy Director of the IMF Research Department, Petya Koeva Brooks, said, “We have revised the forecast for this year slightly downwards, which results from comparing it with the strong growth of last year when there was a lot of non-resident investment in construction as well as a significant expansion of manufacturing activity driven by the United States.”
In addition, Bloomberg published an interview with Donald Trump. He commented that he favors tax reductions, lower interest rates, and tariffs, including a 60% to 100% increase in China’s products and a 10% in the general rate in other countries.
Trump added that he would allow the current Fed Chairman, Jerome Powell, to finish his term, yet warned the Fed wouldn’t cut interest rates before the election.
Lately, Federal Reserve officials have crossed the wires. Richmond’s Fed President Thomas Barkin said inflation has come down over the last quarter, stating that current policy is restrictive. Nevertheless, he’s open to the idea that policy “is not as restrictive as thought.”
His colleague, Fed Governor Christopher Waller, commented that the time to cut the policy rate is approaching, adding that the most likely direction for the Fed funds rate is downwards.
Daily digest market movers: Mexican Peso depreciates on Trump’s comments
- Mexico’s economic docket will be absent during the week, resuming on July 22, when the National Statistics Agency (INEGI) reveals growth figures for the month of May. Nevertheless, Bank of Mexico (Banxico) policymakers and political developments could rock the boat.
- Mexico’s June inflation figures were higher than expected due to a rise in food prices when most economists expect Banxico to resume lowering interest rates.
- The US economic calendar featured Building Permits for June, which increased from 1.3999 million to 1.446 million, an increase of 3.4%. Further housing data showed that Housing Starts for the same period expanded 3% from 1.314 million to 1.353 million.
- US Industrial Production in June decelerated from 0.9% in May to 0.6% MoM yet exceeded estimates for a 0.3% increase.
- The CME FedWatch Tools show the chances for a quarter of a percentage rate cut to the federal funds rate in September are at 100%, capping the Greenback’s advance.
- June consumer inflation figures were lower than expected in the United States, increasing the chances that the Federal Reserve would lower borrowing costs in 2024 by at least 54 basis points, according to the December 2024 fed funds rate futures contract.
Technical analysis: Mexican Peso trips down as USD/MXN climbs above 17.70
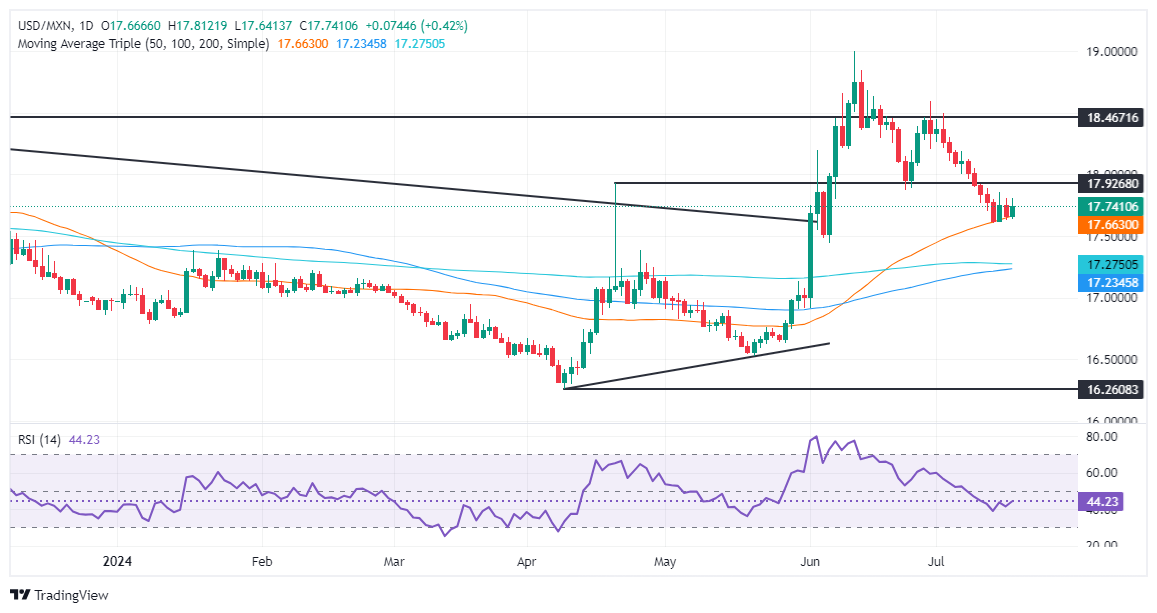
The USD/MXN has bottomed at around the 50-day Simple Moving Average (SMA) after the pair tumbled more than 2.50% as the Mexican currency appreciated. However, buyers had stepped in, forming a floor at around 17.58-17.60.
Momentum suggests that sellers are in charge, as depicted by the Relative Strength Index (RSI) below the 50-neutral line. Buyers seem to be gathering some steam, as the RSI has cleared its previous peak.
If USD/MXN extends its gains above the July 15 high of 17.85, that would exacerbate a rally toward the psychological 18.00 figure. A breach of the latter will expose the July 5 high at 18.19, followed by the June 28 high of 18.59, allowing buyers to aim for the YTD high of 18.99.
On further weakness, if USD/MXN clears the 50-day SMA at 17.63, that would pave the way to challenge the December 5 high at 17.56, followed by the 200-day SMA at 17.27. Further losses would test the 100-day SMA at 17.21.
Mexican Peso FAQs
The Mexican Peso (MXN) is the most traded currency among its Latin American peers. Its value is broadly determined by the performance of the Mexican economy, the country’s central bank’s policy, the amount of foreign investment in the country and even the levels of remittances sent by Mexicans who live abroad, particularly in the United States. Geopolitical trends can also move MXN: for example, the process of nearshoring – or the decision by some firms to relocate manufacturing capacity and supply chains closer to their home countries – is also seen as a catalyst for the Mexican currency as the country is considered a key manufacturing hub in the American continent. Another catalyst for MXN is Oil prices as Mexico is a key exporter of the commodity.
The main objective of Mexico’s central bank, also known as Banxico, is to maintain inflation at low and stable levels (at or close to its target of 3%, the midpoint in a tolerance band of between 2% and 4%). To this end, the bank sets an appropriate level of interest rates. When inflation is too high, Banxico will attempt to tame it by raising interest rates, making it more expensive for households and businesses to borrow money, thus cooling demand and the overall economy. Higher interest rates are generally positive for the Mexican Peso (MXN) as they lead to higher yields, making the country a more attractive place for investors. On the contrary, lower interest rates tend to weaken MXN.
Macroeconomic data releases are key to assess the state of the economy and can have an impact on the Mexican Peso (MXN) valuation. A strong Mexican economy, based on high economic growth, low unemployment and high confidence is good for MXN. Not only does it attract more foreign investment but it may encourage the Bank of Mexico (Banxico) to increase interest rates, particularly if this strength comes together with elevated inflation. However, if economic data is weak, MXN is likely to depreciate.
As an emerging-market currency, the Mexican Peso (MXN) tends to strive during risk-on periods, or when investors perceive that broader market risks are low and thus are eager to engage with investments that carry a higher risk. Conversely, MXN tends to weaken at times of market turbulence or economic uncertainty as investors tend to sell higher-risk assets and flee to the more-stable safe havens.
- The Canadian Dollar backslid as investors take a closer look at inflation data.
- Canada gets a fresh rate call from the BoC next week.
- After a brief soft patch in Canadian inflation, BoC may have cut rates prematurely.
The Canadian Dollar (CAD) shed weight on Wednesday as investors take a second look at Canadian Consumer Price Index (CPI) inflation figures released earlier in the week. Despite an overall downtick in headline inflation figures thanks to easing pressures in overweighted inflation measures, core inflation gauges remained hotter. The Bank of Canada (BoC) will deliver its latest rate call next week.
Canada’s central bank is likely to cut interest rates next Wednesday as the BoC scrambles to alleviate price pressures on the Canadian housing investment market. Canada’s real estate sector accounts for roughly 9% of the country’s total economic output, nearly double the OECD average of 4.8%.
Daily digest market movers: Canadian Dollar stumbles as markets weigh the odds on inflation
- Key Canadian CPI inflation data this week cooled, but only in headline figures as core inflation metrics continue to tease a reignition.
- Headline CPI inflation ticked down to 2.7% YoY in June, down from the previous 2.9%, but trimmed mean Canadian CPI inflation is holding steady at 2.9% on an annualized basis. The BoC’s own core CPI inflation in June actually ticked higher to 1.9% YoY from 1.8%.
- The BoC raced to cut rates in June after a brief soft patch in inflation figures, and pre-committed to several more rate cuts to follow, making it difficult for the BoC to maintain a data-dependent policy stance.
- Shelter, food costs, telecommunications and internet charges, grocer fees, and rents are all climbing again now that industry leaders are no longer being put into the headlines for past price increases.
- As noted by Derek Holt of Scotiabank Economics, “The BoC is still likely to cut next week, but choosing to do so would put full faith in the BoC’s sketchy forecasting abilities while casting aside data dependency and fresher information on the evolving shock to global supply chains that may matter to a trade dependent country like Canada.”
Canadian Dollar PRICE Today
The table below shows the percentage change of Canadian Dollar (CAD) against listed major currencies today. Canadian Dollar was the strongest against the Australian Dollar.
| USD | EUR | GBP | JPY | CAD | AUD | NZD | CHF | |
|---|---|---|---|---|---|---|---|---|
| USD | -0.26% | -0.24% | -1.28% | 0.20% | 0.17% | -0.30% | -1.02% | |
| EUR | 0.26% | 0.04% | -1.02% | 0.46% | 0.42% | -0.07% | -0.76% | |
| GBP | 0.24% | -0.04% | -1.06% | 0.43% | 0.39% | -0.11% | -0.79% | |
| JPY | 1.28% | 1.02% | 1.06% | 1.50% | 1.49% | 0.98% | 0.30% | |
| CAD | -0.20% | -0.46% | -0.43% | -1.50% | -0.04% | -0.52% | -1.21% | |
| AUD | -0.17% | -0.42% | -0.39% | -1.49% | 0.04% | -0.48% | -1.18% | |
| NZD | 0.30% | 0.07% | 0.11% | -0.98% | 0.52% | 0.48% | -0.70% | |
| CHF | 1.02% | 0.76% | 0.79% | -0.30% | 1.21% | 1.18% | 0.70% |
The heat map shows percentage changes of major currencies against each other. The base currency is picked from the left column, while the quote currency is picked from the top row. For example, if you pick the Canadian Dollar from the left column and move along the horizontal line to the US Dollar, the percentage change displayed in the box will represent CAD (base)/USD (quote).
Technical analysis: Canadian Dollar backslides, gives USD/CAD a leg back into 1.3700
The Canadian Dollar (CAD) broadly lost ground on Wednesday, falling one-fifth of one percent against the US Dollar (USD), and shedding four-tenths of one percent against the Euro (EUR) and the Pound Sterling (GBP). Elsewhere, broad recoveries in the Japanese Yen (JPY) and Swiss Franc (CHF) means the CAD gives up ground to the day’s strong performers, falling -1.55% and 1.25%, respectively.
USD/CAD has been given a leg back up into the 1.3700 handle, bolstering the pair up from an intraday swing low into the 200-hour Exponential Moving Average (EMA) at 1.3656. Near-term momentum has tilted into the bullish side in favor of the Greenback against the Canadian Dollar as CAD bidders disappear into the ether.
USD/CAD hourly chart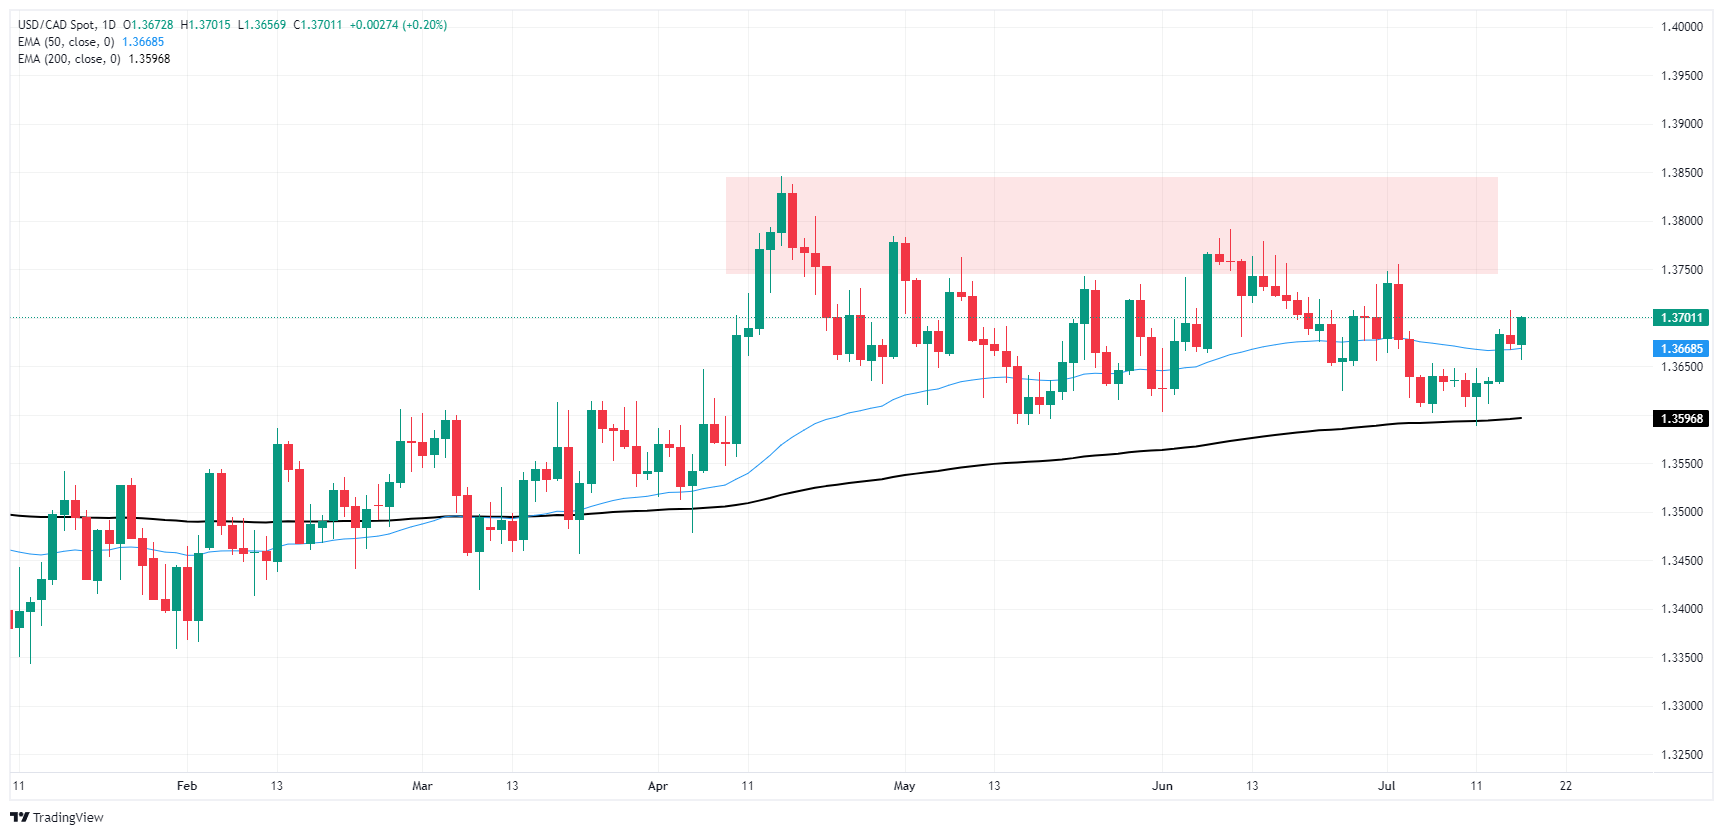
USD/CAD daily chart
Canadian Dollar FAQs
The key factors driving the Canadian Dollar (CAD) are the level of interest rates set by the Bank of Canada (BoC), the price of Oil, Canada’s largest export, the health of its economy, inflation and the Trade Balance, which is the difference between the value of Canada’s exports versus its imports. Other factors include market sentiment – whether investors are taking on more risky assets (risk-on) or seeking safe-havens (risk-off) – with risk-on being CAD-positive. As its largest trading partner, the health of the US economy is also a key factor influencing the Canadian Dollar.
The Bank of Canada (BoC) has a significant influence on the Canadian Dollar by setting the level of interest rates that banks can lend to one another. This influences the level of interest rates for everyone. The main goal of the BoC is to maintain inflation at 1-3% by adjusting interest rates up or down. Relatively higher interest rates tend to be positive for the CAD. The Bank of Canada can also use quantitative easing and tightening to influence credit conditions, with the former CAD-negative and the latter CAD-positive.
The price of Oil is a key factor impacting the value of the Canadian Dollar. Petroleum is Canada’s biggest export, so Oil price tends to have an immediate impact on the CAD value. Generally, if Oil price rises CAD also goes up, as aggregate demand for the currency increases. The opposite is the case if the price of Oil falls. Higher Oil prices also tend to result in a greater likelihood of a positive Trade Balance, which is also supportive of the CAD.
While inflation had always traditionally been thought of as a negative factor for a currency since it lowers the value of money, the opposite has actually been the case in modern times with the relaxation of cross-border capital controls. Higher inflation tends to lead central banks to put up interest rates which attracts more capital inflows from global investors seeking a lucrative place to keep their money. This increases demand for the local currency, which in Canada’s case is the Canadian Dollar.
Macroeconomic data releases gauge the health of the economy and can have an impact on the Canadian Dollar. Indicators such as GDP, Manufacturing and Services PMIs, employment, and consumer sentiment surveys can all influence the direction of the CAD. A strong economy is good for the Canadian Dollar. Not only does it attract more foreign investment but it may encourage the Bank of Canada to put up interest rates, leading to a stronger currency. If economic data is weak, however, the CAD is likely to fall.
- US Dollar, observed a fall reaching its lowest value since March.
- Federal Reserve bets continue to lean in favor of a dovish stance, consequently impacting the USD.
- Strong Housing data could not prevent this decline.
On Thursday, the US Dollar measured by the DXY index saw an extension in its decline below 104.00, despite the strong housing data reported during the European session. Factors such as dovish bets on the Federal Reserve and lower US Treasury Yields are responsible for putting downward pressure on the USD.
The outlook for the US economy shows signs of disinflation, and markets are keeping confidence in a potential cut in September. The Federal Reserve officials continue to show hesitation in rushing to cuts and maintain a data-dependent approach but seem to put a cut in July on the table.
Daily digest market movers: DXY decline, housing data no help for the struggling USD
- Data concerning Housing Starts in June reported an improvement of 3%, amounting to 1.35 million units.
- According to the data unveiled by the US Census Bureau on Tuesday, this figure follows a decrease of 4.6% recorded in May.
- Building Permits showed a surge of 3.4% after a decline of 2.8% in the previous month.
- Thomas Barkin, the Richmond Federal Reserve President, suggested that the discussion at the July policy meeting will likely include whether it is still apt to describe inflation as elevated, as reported by Reuters.
- As per the CME FedWatch Tool, a rate cut in September seems to be priced in which pressured the USD down.
DXY Technical outlook: DXY's bearish outlook remains, a minor correction to the upside possible
Despite the decline, the DXY is grappling to regain the 104.00 area. Even though the daily indicators including Relative Strength Index (RSI) and Moving Average Convergence Divergence (MACD) are far below the 50-mark, pointing towards a near-oversold condition, the DXY could see a slight correction.
Strong supports lie at the 103.50 and 103.00 levels. However, the overall technical outlook remains bearish.
US Dollar FAQs
The US Dollar (USD) is the official currency of the United States of America, and the ‘de facto’ currency of a significant number of other countries where it is found in circulation alongside local notes. It is the most heavily traded currency in the world, accounting for over 88% of all global foreign exchange turnover, or an average of $6.6 trillion in transactions per day, according to data from 2022. Following the second world war, the USD took over from the British Pound as the world’s reserve currency. For most of its history, the US Dollar was backed by Gold, until the Bretton Woods Agreement in 1971 when the Gold Standard went away.
The most important single factor impacting on the value of the US Dollar is monetary policy, which is shaped by the Federal Reserve (Fed). The Fed has two mandates: to achieve price stability (control inflation) and foster full employment. Its primary tool to achieve these two goals is by adjusting interest rates. When prices are rising too quickly and inflation is above the Fed’s 2% target, the Fed will raise rates, which helps the USD value. When inflation falls below 2% or the Unemployment Rate is too high, the Fed may lower interest rates, which weighs on the Greenback.
In extreme situations, the Federal Reserve can also print more Dollars and enact quantitative easing (QE). QE is the process by which the Fed substantially increases the flow of credit in a stuck financial system. It is a non-standard policy measure used when credit has dried up because banks will not lend to each other (out of the fear of counterparty default). It is a last resort when simply lowering interest rates is unlikely to achieve the necessary result. It was the Fed’s weapon of choice to combat the credit crunch that occurred during the Great Financial Crisis in 2008. It involves the Fed printing more Dollars and using them to buy US government bonds predominantly from financial institutions. QE usually leads to a weaker US Dollar.
Quantitative tightening (QT) is the reverse process whereby the Federal Reserve stops buying bonds from financial institutions and does not reinvest the principal from the bonds it holds maturing in new purchases. It is usually positive for the US Dollar.
The Dollar Index (DXY) rose from 104.25 to 104.40 during the Asian session. DXY fell to 104.20 during the European session, but spiked to 104.50 on the better-than-expected US retail sales before drifting back to 104.20 over the rest of the US session, DBS Senior FX Strategist Philip Wee notes.
Data and politics weigh heavy on the USD
“The DXY rose from 104.25 to 104.40 during the Asian session. Investors in external-led Asian economies considered a second Trump presidency damaging for global trade. DXY fell to 104.20 during the European session. The IMF’s World Economic Outlook Update partially offset the Trump-led pessimism over the world economy.”
“IMF maintained the forecast for world growth at 3.2% for 2024 but upgraded 2025 to 3.3% from the 3.2% projected in April. The IMF projected a recovery in world trade growth to 3.25% in 2024-2025 from quasi stagnation in 2023. For 2024, it downgraded US growth by 10 bps to 2.6%, upgraded Europe by 10 bps to 0.9%, and the UK by 20 bps to 0.7%.”
“DXY spiked to 104.50 on the better-than-expected US retail sales before drifting back to 104.20 over the rest of the US session. At the moment of writing, DXY was trading even lower, at 103.80 (-0.46%). Its fluctuations represented the mix of US political developments and economic data affecting its outlook.”
China’s third plenum, which lasts from 15th until the 18th of July, is the most important plenum when it comes to new economic policies and reforms, Rabobank’s Senior Macro Strategist Teeuwe Mevissen notes.
The third plenum is focused on policies and reforms
“The third plenum is mainly focused on policies and reforms with a view on the economy and as such receive a lot of attention from everybody who wants to obtain an idea of what to expect on this front for the next 5 to 10 years.”
“While we think that domestic demand stimulus via fiscal and monetary means would be important to tackle some of China’s economic challenges, not much should be expected on this front.”
“While this third plenum could turn out to be a memorable one, few if any detailed policies and reforms are expected to be announced directly after this plenum.”
After the debate and an attempted assassination, former President Trump's prospects for re-election have surged. Furthermore, there is a growing momentum for a red-sweep. Instead of delving into the odds, we aim to answer several frequently asked questions about the extension of tax cuts, tariffs, and the independence of the Federal Reserve (Fed).
Trump raises uncertainty long ahead of elections
“The election outcome remains uncertain, but there is undeniable momentum building for Trump. Is "Trump 2.0" a term of redemption or a revenge term? Many find reassurance in the US economic and market performance during Trump's first term, at least until the onset of COVID-19. During that time, similar themes of tax cuts, tariffs, and Fed independence were prevalent.”
“Extending the tax cuts of the Tax Cut and Jobs Act (TCJA) of 2017 could potentially increase the deficit by $4.6 trillion over the next 10 years. Official deficit projections must assume that the tax cuts will expire as legislated. It's important to consider that, in terms of the effect on growth, allowing the tax cuts to expire would be akin to raising taxes by the same amount over the same period.”
“Trump levied tariffs in 2018 that raised fears of inflation. We re-examine the aftermath and offer some thoughts on prospects going forward. Also, in a Trump 2.0 we should expect the Federal Reserve’s independence to be tested, but count on Fed to remain focused on their mandated objectives until new any new legislation is passed by Congress.”
Downside pressures for Crude oil continue to grow as physical demand trends continue to deteriorate. Crude prices may be on the cusp of a breakdown, TD Securities Senior Commodity Strategist Daniel Ghali suggests.
Downside pressures on oil prices continue to grow
“Algos are also being whipsawed in WTI crude, but downside pressures continue to grow as physical demand trends continue to deteriorate.”
“Our simulations of future prices now suggest that it will take an uptape to prevent deteriorating trend signals from catalyzing large-scale CTA selling activity over the next week. Crude prices may be on the cusp of a breakdown.”
- GBP/USD breaches 1.3000 for the first time since July 2023.
- RSI indicates strong bullish momentum, with potential targets at 1.3050 and 1.3100.
- Key supports at 1.2894 and 1.2860 if a pullback occurs below the psychological 1.3000 level.
The Pound Sterling has climbed sharply, breached the 1.3000 figure for the first time since July 19, 2023, and exchanged hands at 1.3020 above its opening price by 0.36%, following a mixed inflation report in the UK.
GBP/USD Price Analysis: Technical outlook
The GBP/USD uptrend is set to continue if Federal Reserve officials' rhetoric turns more dovish as policymakers eye the first rate cut. Bullish momentum accelerated, as depicted by the Relative Strength Index (RSI), which, despite being overbought above 70, due to the trend's strength, most traders see the 80 level as the most extreme condition.
If GBP/USD clears the psychological figure of 1.3050, buyers could target the 1.3100 mark. They can further challenge key supply zones overhead, with the July 18, 2023, peak at 1.3125, ahead of last year’s high at 1.3142.
On the other hand, a pullback below 1.3000 can exacerbate a deeper correction, with traders eyeing the latest cycle high, which turned support at 1.2894, the March 8 daily high. The further downside lies underneath, with the following demand zone at 1.2860 before diving to March’s 21 high, at 1.2803.
GBP/USD Price Action – Daily Chart
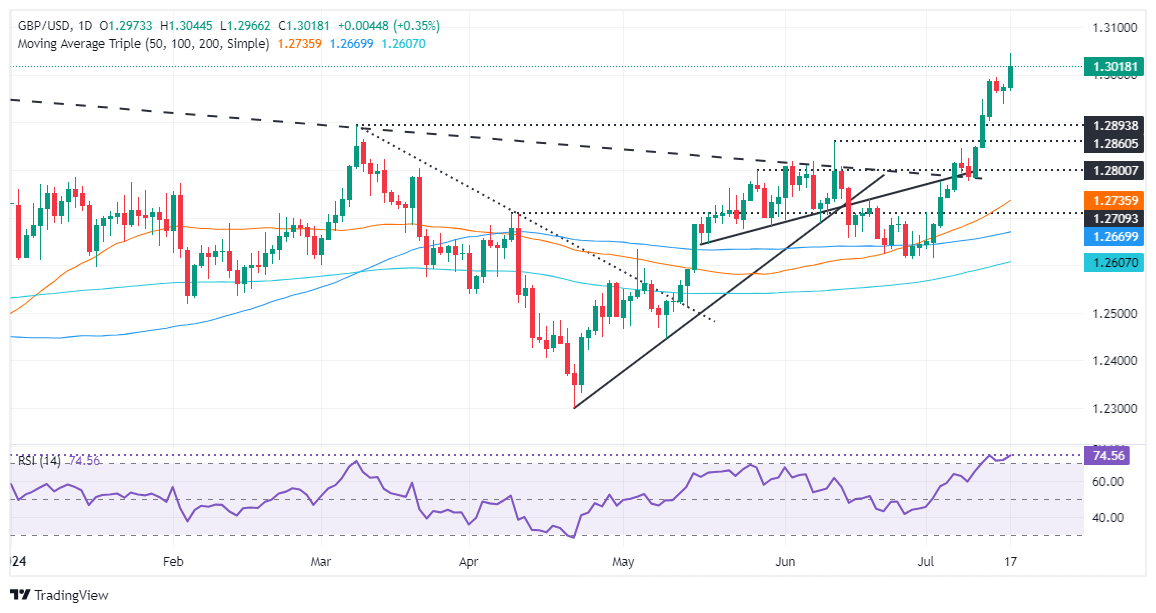
Pound Sterling FAQs
The Pound Sterling (GBP) is the oldest currency in the world (886 AD) and the official currency of the United Kingdom. It is the fourth most traded unit for foreign exchange (FX) in the world, accounting for 12% of all transactions, averaging $630 billion a day, according to 2022 data. Its key trading pairs are GBP/USD, aka ‘Cable’, which accounts for 11% of FX, GBP/JPY, or the ‘Dragon’ as it is known by traders (3%), and EUR/GBP (2%). The Pound Sterling is issued by the Bank of England (BoE).
The single most important factor influencing the value of the Pound Sterling is monetary policy decided by the Bank of England. The BoE bases its decisions on whether it has achieved its primary goal of “price stability” – a steady inflation rate of around 2%. Its primary tool for achieving this is the adjustment of interest rates. When inflation is too high, the BoE will try to rein it in by raising interest rates, making it more expensive for people and businesses to access credit. This is generally positive for GBP, as higher interest rates make the UK a more attractive place for global investors to park their money. When inflation falls too low it is a sign economic growth is slowing. In this scenario, the BoE will consider lowering interest rates to cheapen credit so businesses will borrow more to invest in growth-generating projects.
Data releases gauge the health of the economy and can impact the value of the Pound Sterling. Indicators such as GDP, Manufacturing and Services PMIs, and employment can all influence the direction of the GBP. A strong economy is good for Sterling. Not only does it attract more foreign investment but it may encourage the BoE to put up interest rates, which will directly strengthen GBP. Otherwise, if economic data is weak, the Pound Sterling is likely to fall.
Another significant data release for the Pound Sterling is the Trade Balance. This indicator measures the difference between what a country earns from its exports and what it spends on imports over a given period. If a country produces highly sought-after exports, its currency will benefit purely from the extra demand created from foreign buyers seeking to purchase these goods. Therefore, a positive net Trade Balance strengthens a currency and vice versa for a negative balance.
Commodity Trading Advisors (CTAs) are being whipsawed in base metals, forced into buying back some of their recently sold Aluminium, TDS Senior Commodity Strategist Daniel Ghali suggests.
Commodity demand expectations continue to deteriorate
“Under the hood, commodity demand expectations continue to deteriorate at a fast clip, which places additional focus on the Third Plenum to turn the tide. Failure to do so could result in renewed downside across the complex, as physical demand trends continue to deteriorate with little offset provided by renewed concerns surrounding supply risks.”
“Our simulations of future prices also suggest more notable downside convexity in Aluminium, as a downtape could catalyze large-scale CTA selling activity with algos forced to abandon their entire long book.”
Richmond Federal Reserve President Thomas Barkin said on Wednesday that he is sure policymakers will debate at the July policy meeting whether it is still appropriate to describe inflation as elevated, per Reuters
Key takeaways
"Looking for low inflation to sustain and broaden; starting to see the broadening."
"No one 25-basis-point interest rate cut matters one way or the other; the issue is when to change the narrative."
"US labor market remains quite healthy."
"Recent housing inflation data was encouraging."
"Very encouraged that disinflation is broadening and hopeful it continues."
"Still looking for a bit more evidence that disinflation will be sustained."
"The number one way for the Fed to keep its credibility is to do the right thing at the right time."
Market reaction
The US Dollar Index stays on the back foot in the American session and was last seen losing nearly 0.5% on the day at 103.75.
Commodity Trading Advisors (CTAs) are back on the bid in PGMs, as the recovery in prices catalyzes buying programs in both Platinum and Palladium, TD Securities Senior Commodity Strategist Daniel Ghali suggests.
The odds of a leg higher in Palladium rise
“Has the short-squeeze in Palladium run its course? Our advanced positioning analytics suggest CTAs are back on the bid in PGMs, as the recovery in prices catalyzes buying programs in both Platinum and Palladium, raising the odds of a renewed leg higher in Palladium prices.”
“Our simulations of 500 scenarios for future prices over the next week suggest that CTAs could cover their entire short book in Palladium in an uptape. The squeeze on systematic Palladium shorts may still have some room to run.”
- USD/CAD edges lower due to a vulnerable US Dollar.
- The Fed is widely anticipated to begin reducing interest rates from September.
- Further decline in Canada’s inflation has prompted BoC’s subsequent rate-cut hopes.
The USD/CAD pair exhibits a subdued performance below the round-level resistance of 1.3700 in Wednesday’s New York session. The Loonie asset remains under pressure as the US Dollar (USD) has fallen on the backfoot. The US Dollar weakens as investors see the Federal Reserve (Fed) to begin reducing interest rates from the September meeting.
The US Dollar Index, which tracks the Greenback’s value against six major peers, registers a fresh four-month low near 103.70. More downside remains likely as trades are pricing in two rate cuts this year against one signalled by latest dot plot.
Market expectations for Fed rate cuts were prompted by cooling inflationary pressures and signs that the labor market lose momentum. Recent annual inflation readings were softer-than-expected. Also, monthly headline inflation deflated for the first time in more than four years, pointed to progress in disinflation after stalling in the first quarter. Meanwhile, the labor demand has slowed and the Unemployment Rate has risen to 4.1%.
Soft inflation reading have also boosted confidence of Fed officials that price pressures will return to the desired rate of 2%. In the American trading hours, Fed Governor Christopher Waller communicated confidence over moderation in job market and inflation. When asked about rate cuts, Waller said, “I do believe we are getting closer to the time when a cut in the policy rate is warranted," Reuters reported.
On the Canadian Dollar front, expectations for the Bank of Canada (BoC) delivering subsequent rate cuts have been mounted due to further decline in price pressures. The data showed on Tuesday that monthly headline Consumer Price Index (CPI) deflated. However, economists anticipated the inflation data to have grown at a slower pace of 0.1% from the former release of 0.6%. Annual headline CPI decelerated to 2.7% from May’s reading of 2.9%.
Economic Indicator
Consumer Price Index (YoY)
The Consumer Price Index (CPI), released by Statistics Canada on a monthly basis, represents changes in prices for Canadian consumers by comparing the cost of a fixed basket of goods and services. The YoY reading compares prices in the reference month to the same month a year earlier. Generally, a high reading is seen as bullish for the Canadian Dollar (CAD), while a low reading is seen as bearish.
Read more.Last release: Tue Jul 16, 2024 12:30
Frequency: Monthly
Actual: 2.7%
Consensus: -
Previous: 2.9%
Source: Statistics Canada
Federal Reserve (Fed) Governor Christopher Waller said on Wednesday that the given the lags of monetary policy, the exact timing of a rate cut "doesn't really matter," per Reuters.
Key takeaways
"Key to easing is when conditions justify it."
"The labor market is in a sweet spot, firms have the workers they want."
"Important for Fed to maintain current labor market conditions."
"We've done our job with the high rates, open question about timing of cut."
"Most likely direction for monetary policy is rate cuts."
Market reaction
These comments failed to trigger a noticeable market reaction. At the time of press, the US Dollar Index was down 0.48% on the day at 103.76.
Cable has taken advantage of the generally weak US Dollar (USD) and some slightly hotter than expected UK CPI data to advance through the 1.30 point to reach its highest in a year, Scotiabank’s Chief FX Strategist Shaun Osborne notes.
Broader progress towards 1.33 looks feasible
“Headline CPI rose 0.1% M/M in June, as expected but inflation held at 2.0% in the year (versus a forecast decline to 1.9%). Core prices were steady also and Service sector inflation was unchanged in the year at a lofty 5.7%. The data further compromised prospects for an early August BoE rate cut, with swaps now pricing in less than 10bps of easing risk.”
“Note that the IMF’s latest forecasts indicated the UK economy would be among the fastest, if not the fastest, growing major European economy next year (1.5%, just ahead of the 1.3% pace predicted for Germany and France).”
“GBP/USD’s push above 1.30 adds to a positive technical backdrop that is shaped by solid price gains over the past couple of weeks, a clear move above the early March high and an alignment of bullish trend indicators across the short-, medium– and long-term trend oscillators. Gains should target a return to the 1.3150 zone initially but broader progress towards 1.33 looks feasible in the coming weeks. Support is 1.2950/75.”
The Euro (EUR) is firmer versus the US Dollar (USD), rising through the low 1.09 area that had capped gains in the past few weeks to reach its highest level since March, Scotiabank’s Chief FX Strategist Shaun Osborne notes.
EUR may extend gains to the 1.10/1.11 range
“The EUR is firmer versus the USD, rising through the low 1.09 area that had capped gains in the past few weeks to reach its highest level since March. EUR/CAD has also broken through recent range peaks to near the mid-1.49s, the highest since late 2023. The EUR has largely ignored Trumps comments on tariffs that were specifically aimed at the EU.”
“The charts reflect a positive technical undertone for the EUR. Spot gains have extended through recent highs to reach the best level since March. The EUR is making headway above major, long-term trend resistance and gains are supported by a bullish alignment of trend oscillators on the intraday, daily and weekly charts.”
“That should mean minor EUR dips (to the high 1.08/low1.09 area) are well supported and these factors tilt risks towards EUR gains extending to the 1.10/1.11 range in the near-term.”
The Canadian Dollar (CAD) is a little firmer this morning but barely so. The CAD is a relative underperformer on a day of broad US Dollar (USD) softness, with the MXN losing ground, amid focus on Trump’s support for wide-ranging tariffs in his Bloomberg interview, Scotiabank’s Chief FX Strategist Shaun Osborne notes.
Mixed momentum signals suggest choppy range trade
“CAD is a little firmer this morning but barely so. It’s a relative underperformer on a day of broad USD softness, with the MXN losing ground, amid focus on Trump’s support for wide-ranging tariffs in his Bloomberg interview.”
“Yesterday’s Canadian CPI data were mixed but a central bank that seems keen on easing rates at the moment will likely focus mostly on the lower than expected (-0.1% M/M) headline read than anything else. Swaps pricing shows a 25bps cut on the 24th is more or less fully priced in (21-22bps), nudging US/Canada term spreads out somewhat (2Y cash bond spreads wider to 67bps).”
“Spot losses from the intraday high yesterday left a bearish 'shooting star' candle signal on the daily chart, suggesting a nearterm peak for the USD may be in place. Modest intraday losses for the USD appear to have stalled around 1.3655/60 today, however. Mixed momentum signals suggest choppy range trade may extend a little more between 1.36/1.37.”
- NZD/USD rises to 0.6100 as US Dollar weakens due to strong speculation for Fed rate cuts in September.
- The New Zealand Dollar strengthens despite cooling inflationary pressures.
- NZD/USD rebounds from 50% Fibo retracement at 0.6035.
The NZD/USD pair rallies to near the round-level resistance of 0.6100 in Wednesday’s American session. The Kiwi asset strengthens as the US Dollar (USD) faces an intense sell-off due to firm speculation that the Federal Reserve (Fed) will pivot to policy normalization from the September meeting.
The US Dollar Index (DXY), which tracks the Greenback’s value against six major currencies, slides further and posts a fresh four-month low near 103.60.
Meanwhile, the New Zealand Dollar (NZD) strengthens even though the Q2 Consumer Price Index (CPI) softened at a faster-than-expected pace. This has boosted expectations of early rate cuts by the Reserve Bank of New Zealand (RBNZ).
The data showed that quarterly inflation grew by 0.4%, slower than expectations and Q1 reading of 0.6%. The annual CPI data decelerated at a robust pace to 3.3% from the consensus of 3.5% and the former release of 4.0%.
NZD/USD finds a temporary support near 50% Fibonacci retracement (plotted from April 19 low near 0.5850 to June 12 high at 0.6222) at 0.6035 on a daily timeframe. The near-term outlook remains bearish as the 20-day Exponential Moving Average (EMA) near 0.6100 acts as major barricade to NZD bulls.
The 14-period Relative Strength Index (RSI) oscillates in the 40.00-60.00 range, suggesting indecisiveness among market participants.
Fresh upside would appear if the asset breaks above July 3 high at 0.6130 for targets near May 28 high around 0.6170 and June 12 high of 0.6222.
However, a breakdown below April 4 high around 0.6050 would expose the asset to the psychological support of 0.6000.
NZD/USD daily chart
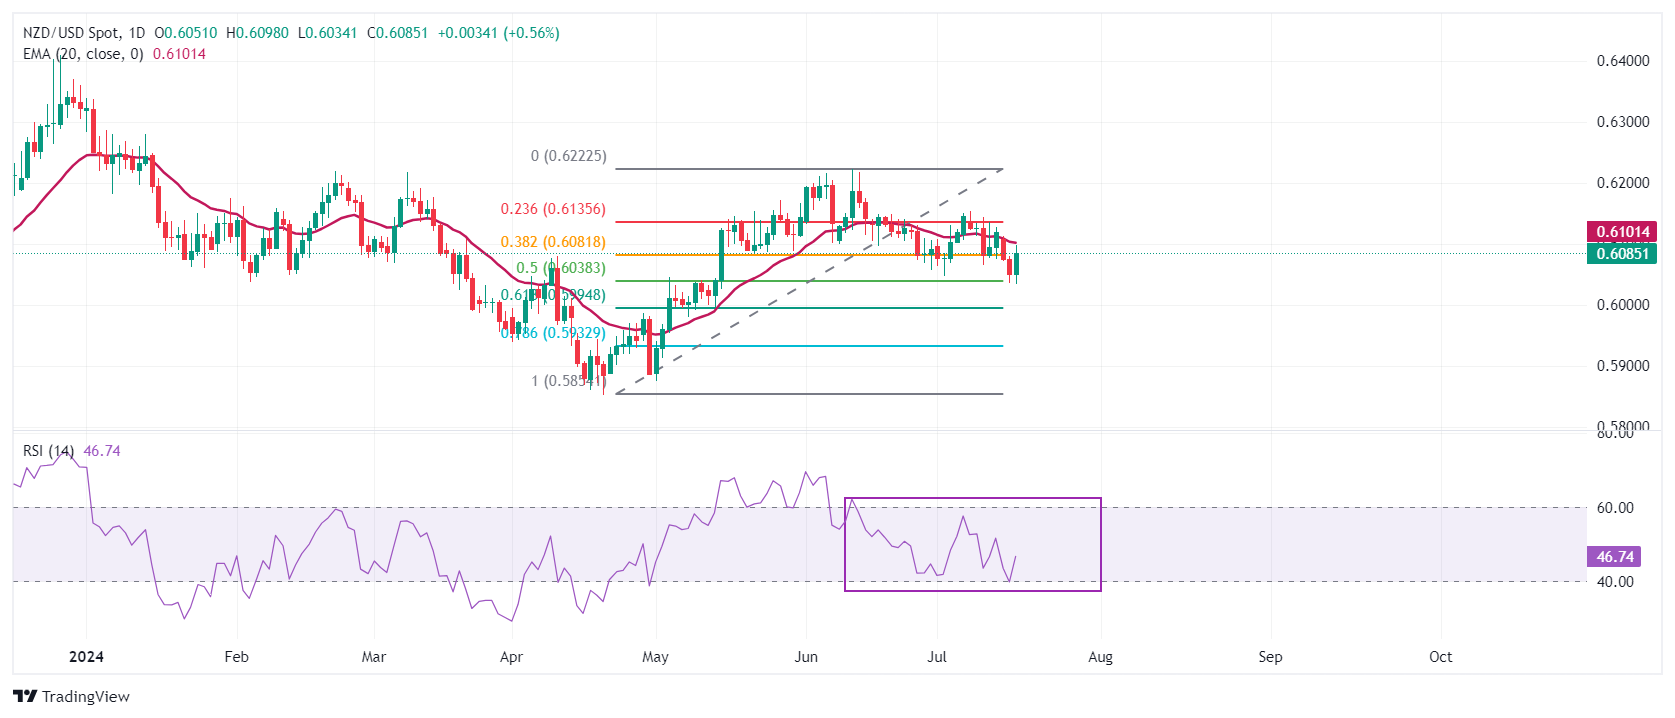
New Zealand Dollar FAQs
The New Zealand Dollar (NZD), also known as the Kiwi, is a well-known traded currency among investors. Its value is broadly determined by the health of the New Zealand economy and the country’s central bank policy. Still, there are some unique particularities that also can make NZD move. The performance of the Chinese economy tends to move the Kiwi because China is New Zealand’s biggest trading partner. Bad news for the Chinese economy likely means less New Zealand exports to the country, hitting the economy and thus its currency. Another factor moving NZD is dairy prices as the dairy industry is New Zealand’s main export. High dairy prices boost export income, contributing positively to the economy and thus to the NZD.
The Reserve Bank of New Zealand (RBNZ) aims to achieve and maintain an inflation rate between 1% and 3% over the medium term, with a focus to keep it near the 2% mid-point. To this end, the bank sets an appropriate level of interest rates. When inflation is too high, the RBNZ will increase interest rates to cool the economy, but the move will also make bond yields higher, increasing investors’ appeal to invest in the country and thus boosting NZD. On the contrary, lower interest rates tend to weaken NZD. The so-called rate differential, or how rates in New Zealand are or are expected to be compared to the ones set by the US Federal Reserve, can also play a key role in moving the NZD/USD pair.
Macroeconomic data releases in New Zealand are key to assess the state of the economy and can impact the New Zealand Dollar’s (NZD) valuation. A strong economy, based on high economic growth, low unemployment and high confidence is good for NZD. High economic growth attracts foreign investment and may encourage the Reserve Bank of New Zealand to increase interest rates, if this economic strength comes together with elevated inflation. Conversely, if economic data is weak, NZD is likely to depreciate.
The New Zealand Dollar (NZD) tends to strengthen during risk-on periods, or when investors perceive that broader market risks are low and are optimistic about growth. This tends to lead to a more favorable outlook for commodities and so-called ‘commodity currencies’ such as the Kiwi. Conversely, NZD tends to weaken at times of market turbulence or economic uncertainty as investors tend to sell higher-risk assets and flee to the more-stable safe havens.
- Housing Starts and Building Permits in the US recovered in June.
- The US Dollar Index stays in negative territory below 104.00.
Housing Starts in the US rose 3% in June to 1.35 million units, the monthly data published by the US Census Bureau revealed on Tuesday. This reading followed the 4.6% decrease recorded in May.
In the same period, Building Permits increased 3.4% after falling 2.8% in May.
Market reaction
The US Dollar stays under heavy selling pressure on Wednesday. At the time of press, the US Dollar Index was down nearly 0.5% on the day at 103.75.
- USD/JPY is rapidly selling off and is now probably in a downtrend on a short and medium-term basis.
- The pair will probably continue declining to targets in the lower 150s.
- RSI is oversold, raising the risk of a correction or consolidation forming.
USD/JPY is declining steeply from its early July highs. After peaking at 161.95 on July 3 it has fallen over five Japanese Yen to the 156.50s on July 17.
The break below the major trendline at 158.45 on July 13 was a gamechanger for the pair and taken together with the more recent break below the 157.15 July 15 low, has given the chart a much more bearish aspect.
The short-term trend is bearish and the intermediate term trend is now also probably negative too. Given the old adage that “the trend is your friend” the odds favor a continuation lower over those timeframes.
USD/JPY Daily Chart
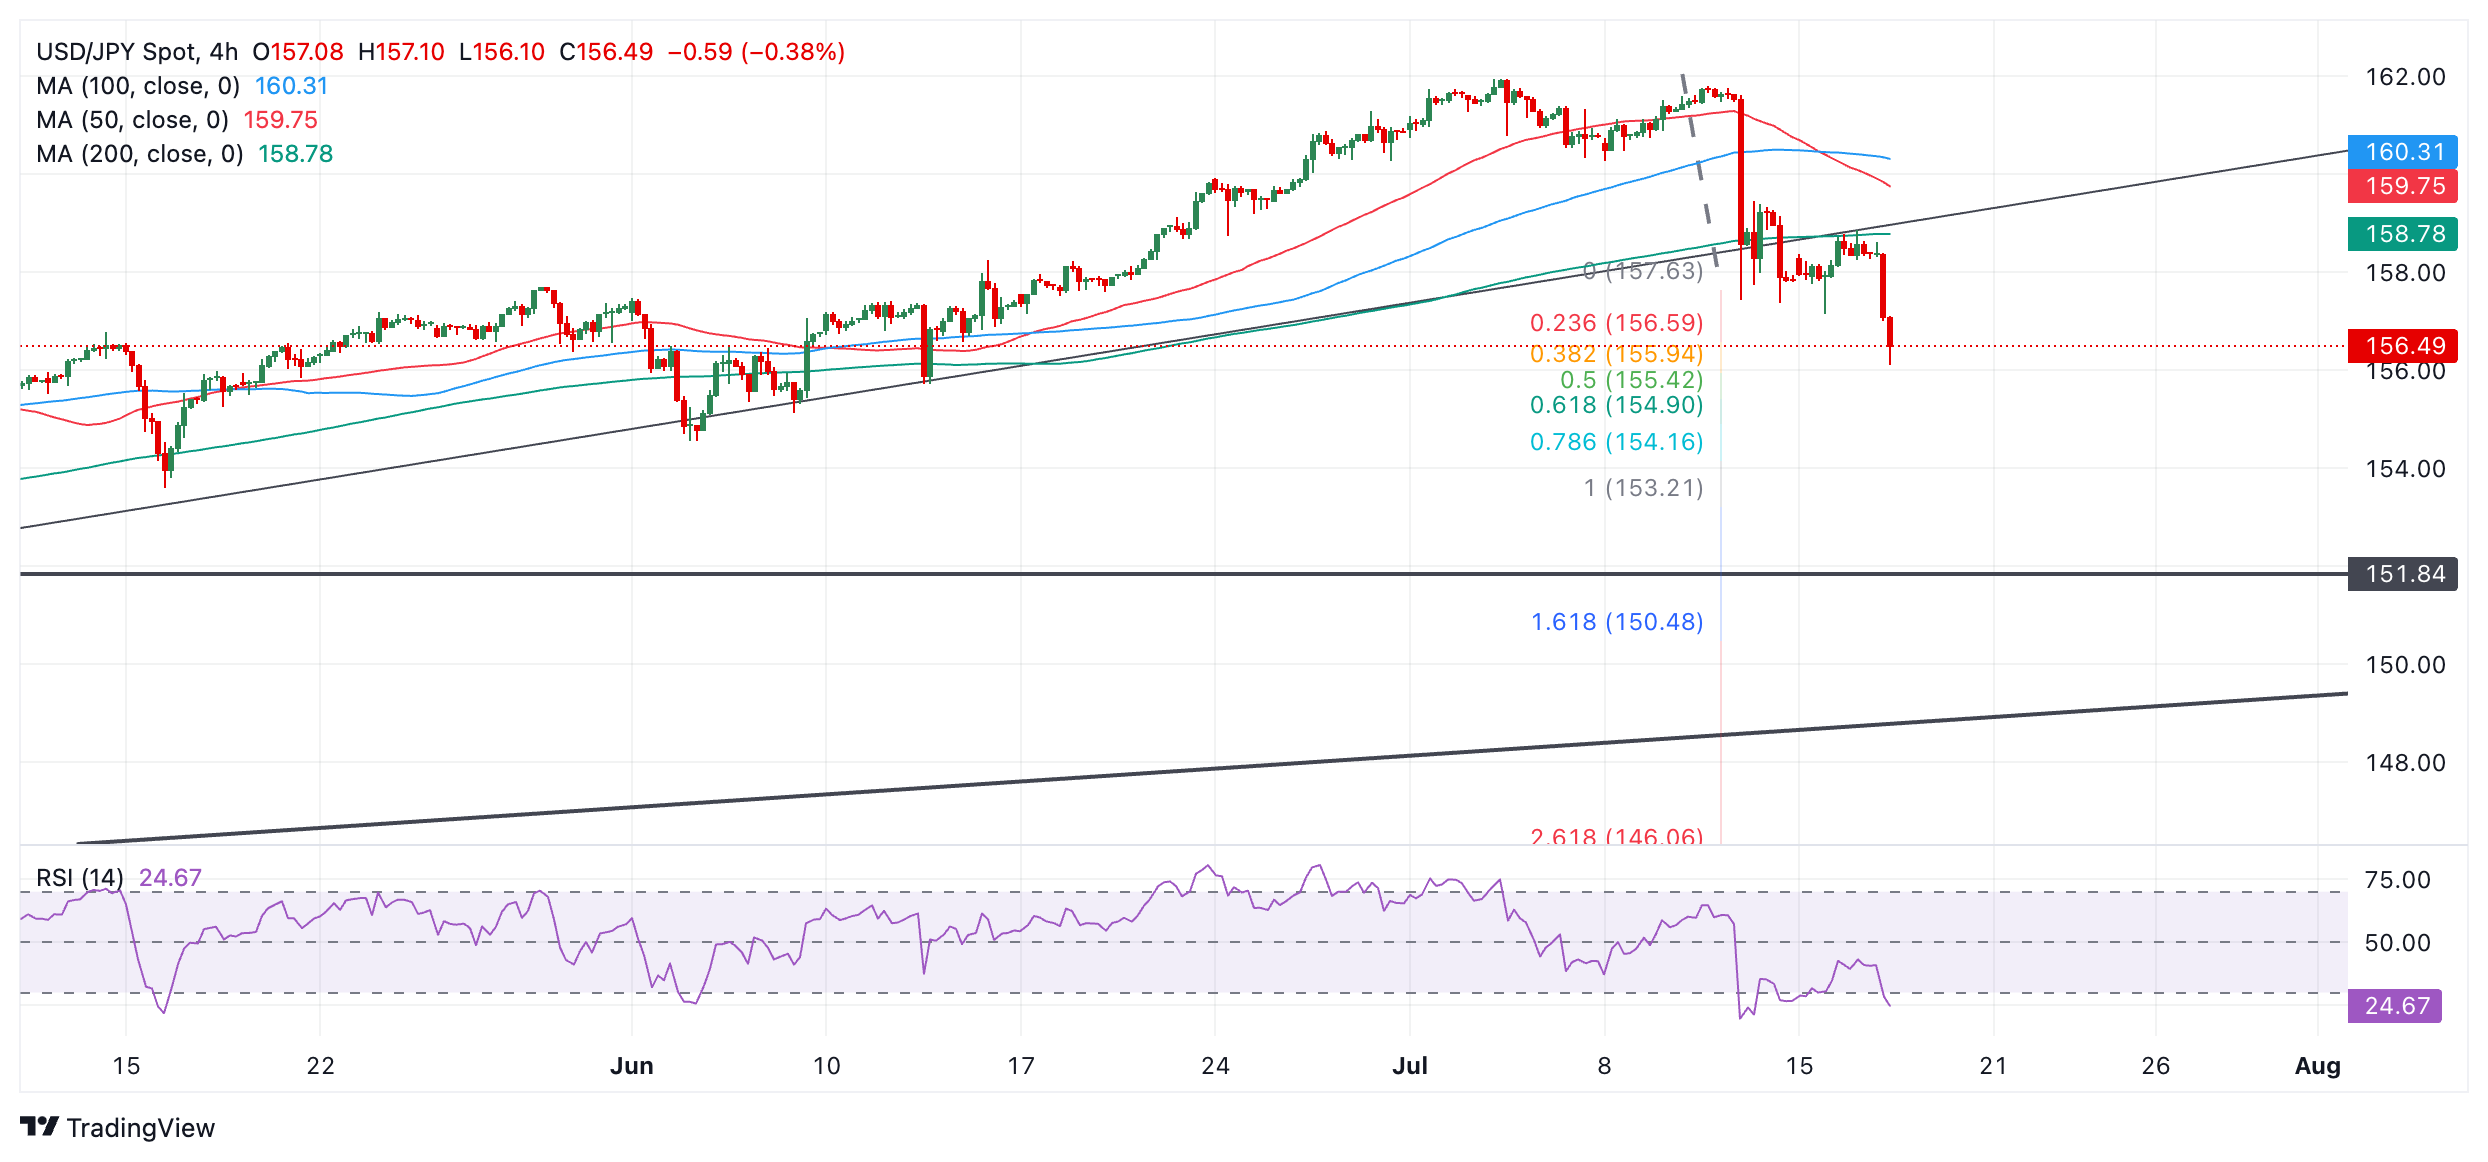
How much lower could USD/JPY go? The next immediate target is at 154.90, which is the 61.8% Fibonacci extension of the down move prior to the trendline break extrapolated lower. This is followed by 153.21, the 100% extrapolation of the same.
A more bearish scenario could even envisage price falling to 151.84 and a key support level (October 2021 high).
The Relative Strength Index (RSI) is in oversold territory indicating a rising chance of a pullback or consolidation delaying the pair’s descent.
- EUR/CAD is tipped to go higher if a bullish continuation pattern completes.
- The price pattern is enhanced by the ADX indicator rising strongly above 20.
- EUR/CAD could reach 1.5000 and beyond if it continues bullish momentum.
EUR/CAD is rising strongly as diverging interest-rate expectations favor the Euro (EUR) over the Canadian Dollar (CAD).
The pair is trading at about 1.4950 at the time of writing and is forming a continuation price pattern (shaded blue rectangle) which – should it complete – could forecast probable higher prices to come.
EUR/CAD Daily Chart
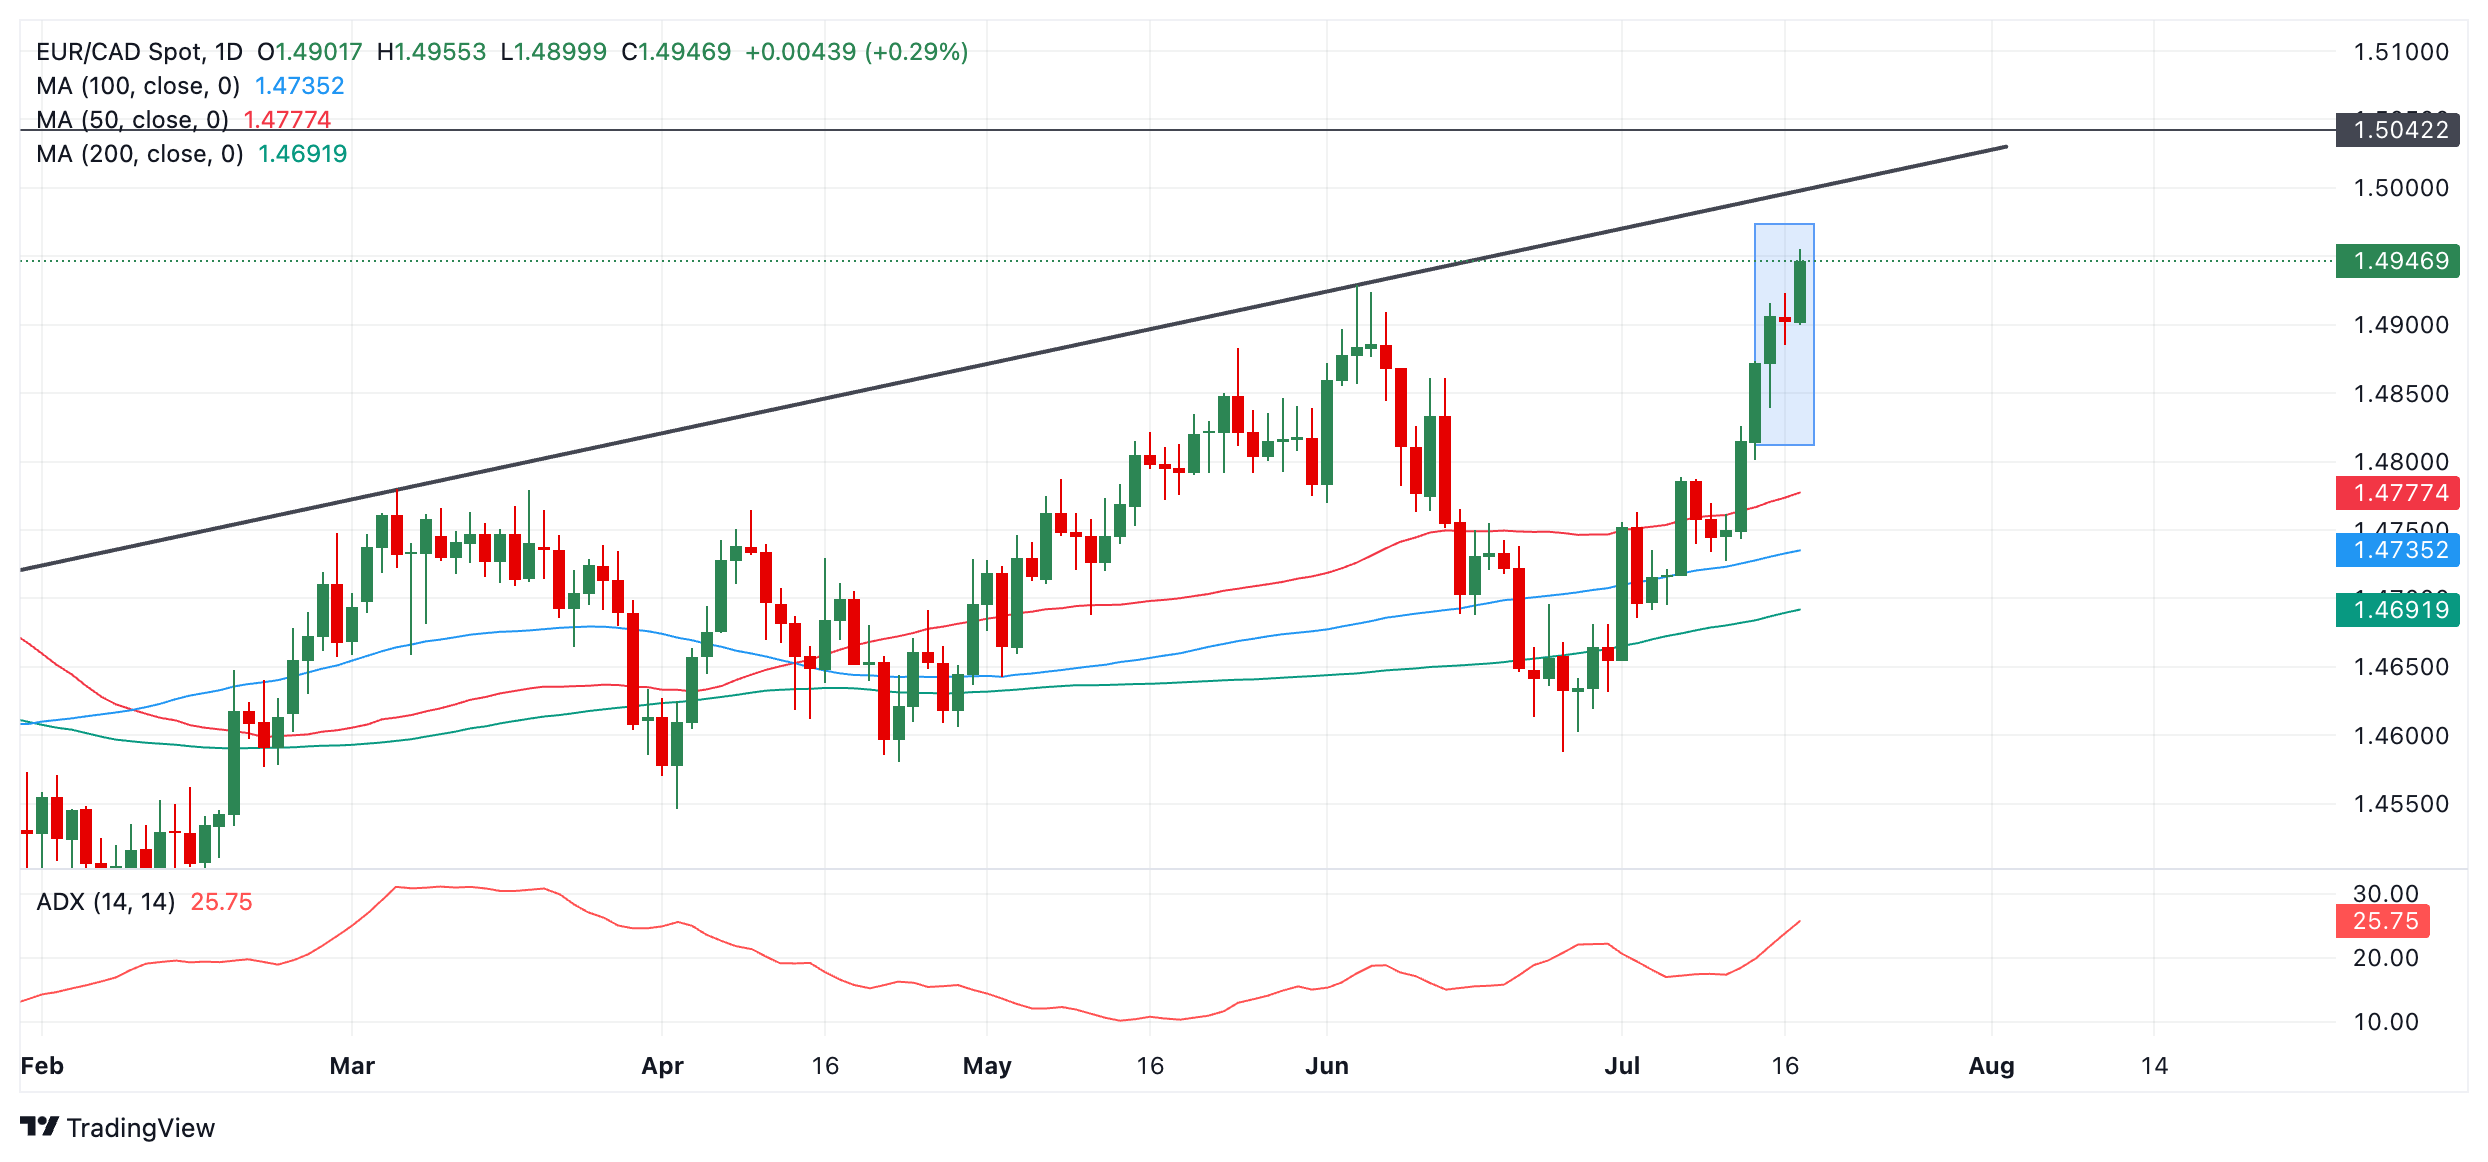
Assuming that Wednesday’s close is above 1.4930 and the day ends as a bullish green candle, the pattern will be confirmed.
The Average Directional Indicator (ADX) is used to assess the strength of the trend and it is rising at above 20 further confirming the likelihood of the bull trend continuing.
If the pattern completes – as looks highly likely – the pair will probably rise to roughly 1.5000, where it will encounter resistance from the dark gray trendline. A break above the day’s highs would serve as confirmation.
It is also possible it could continue even higher to the resistance line at 1.5040.
A decline below 1.4839, however, would invalidate the pattern.
The slightly firmer than expected release of UK CPI inflation this morning has given GBP bulls another lift. Although the headline number at 2.0% remained at the BoE’s inflation target for a second consecutive month, services CPI inflation remained at a worryingly sticky 5.7% y/y which provides a headache for the doves on the MPC, Rabobank's FX strategists note.
Cable pops above 1.30 for the first time since last July
“As the market pared back its expectations for an August rate cut, Cable popped above the 1.30 level for the first time since last July and EUR/GBP dipped further below the 0.84 level, to levels not seen since 2022. Having edged past the USD earlier this month, the Pound Sterling (GBP) continues to hold the position as best performing G10 currency in the year to date as the markets takes a positive view on the policies announced so far by the UK’s new Labour government.”
“It would be inaccurate to credit the Labour government entirely for the better tone in the GBP. It was the second best performing G10 currency in 2023 (after the CHF). In our view the GBP has been slowing picking itself up after the hit that came from the market chaos triggered by the short-lived government of Truss in September 2022.”
“We have been forecasting a slow grinding recovery for GBP vs the Euro for some time. The currency pair has now hit our 0.84 target. In our view, this opens the door to a move towards 0.83, which we have brought forward to a 6-month view. While GBP is also on the front foot vs. the USD, we expect the Greenback to be subject to bouts of strength in the coming months particularly if Trump were to win the US election. Therefore, we see risk for dips in cable potentially to 1.26 on a 3-to-6-month view.”
The CPI report for June, released this morning, showed things continue to move slowly on the disinflation front in the UK. Headline, core, and services inflation were all unchanged since May, despite expectations for a marginal slowdown, ING’s FX strategist Francesco Pesole notes.
Pound Sterling is trading on the strong side
“We know that services inflation is what the Bank of England (BoE) is mostly focused on at this stage, and the stabilisation at 5.7% YoY in June does not endorse any additional easing bets ahead of the 1st August meeting.”
“The Pound Sterling is understandably trading on the strong side this morning as markets are scaling back some dovish rerating in the Sonia curve. Now there are -9bp priced in for August versus -12bp prior to the release, and the year-end pricing is for 48bp of rate cuts.”
“Our economists’ long-standing call has been for the BoE’s easing cycle to start in August, but we admit the chances are somewhat lower after this morning’s CPI report. Markets may also gradually price out an August move in the coming weeks, which would make a potential cut a very negative event for the pound. For now, EUR/GBP long-term bulls like us will be happy to see the pair hang on around 0.8400.”
- AUD/USD moves higher to 0.6750 as US Dollar faces a wrath due to strong speculation for Fed rate-cuts in September.
- Fed Williams communicated the need for more good inflation to gain confidence for Fed rate cuts.
- Aussie Employment data will provide fresh guidance on RBA interest rates.
The AUD/USD pair climbs to near 0.6750 in Wednesday’s European session. The Aussie asset strengthens as the US Dollar (USD) posts a fresh almost four-month low due to firm speculation that the Federal Reserve (Fed) will begin lowering interest rates from the September meeting.
The US Dollar Index (DXY), which tracks the Greenback’s value against six major currencies, tumbles to near 103.30. According to the CME FedWatch tool, expectations for a rate-cut move in September appear to be certain. The tool also shows that the Fed will cut interest rates twice this year against one signaled by officials in their latest dot plot.
A rate-cut move in September seems as a done deal as the Consumer Price Index (CPI) report for June suggested that the progress in disinflation has resumed after reversing in the first quarter.
Meanwhile, Fed policymakers have also acknowledged that the central bank has made some progress in inflation but reiterated that they want to gain greater confidence before cutting interest rates.
In European trading hours, New York Fed Bank President John Williams commented that the current rate policy is appropriate to bring inflation down to the bank’s target of 2%. However, he expressed the need for more good data to strengthen confidence. When asked about rate cuts, William said, “An interest-rate cut could be warranted in the US in the coming month,” Wall Street Journal reported.
On the Aussie front, investors look for the labor market data for June, which will be published on Thursday. The Employment report is expected to show that employers hired 20K job-seekers, lower than 39.7K onboarded in May. The Unemployment Rate is expected to remain steady at 4.0%. Signs of strong job demand would boost expectations of further policy-tightening by the Reserve Bank of Australia (RBA). Financial markets expect that the RBA would be one of the laggards to join the global rate-cutting cycle.
Economic Indicator
Employment Change s.a.
The Employment Change released by the Australian Bureau of Statistics is a measure of the change in the number of employed people in Australia. The statistic is adjusted to remove the influence of seasonal trends. Generally speaking, a rise in Employment Change has positive implications for consumer spending, stimulates economic growth, and is bullish for the Australian Dollar (AUD). A low reading, on the other hand, is seen as bearish.
Read more.Next release: Thu Jul 18, 2024 01:30
Frequency: Monthly
Consensus: 20K
Previous: 39.7K
Source: Australian Bureau of Statistics
- The US Dollar Index is forming a Three Black Crows bearish Japanese candlestick pattern.
- The price pattern is bearish and, if it completes, it will probably indicate more downside to come.
- Support comes in at swing lows in the 102s and 100s.
The US Dollar Index (DXY) is trading lower at 103.67. It is declining for the third week in a row, after peaking at 106.13 (June highs).
US Dollar Index Weekly Chart
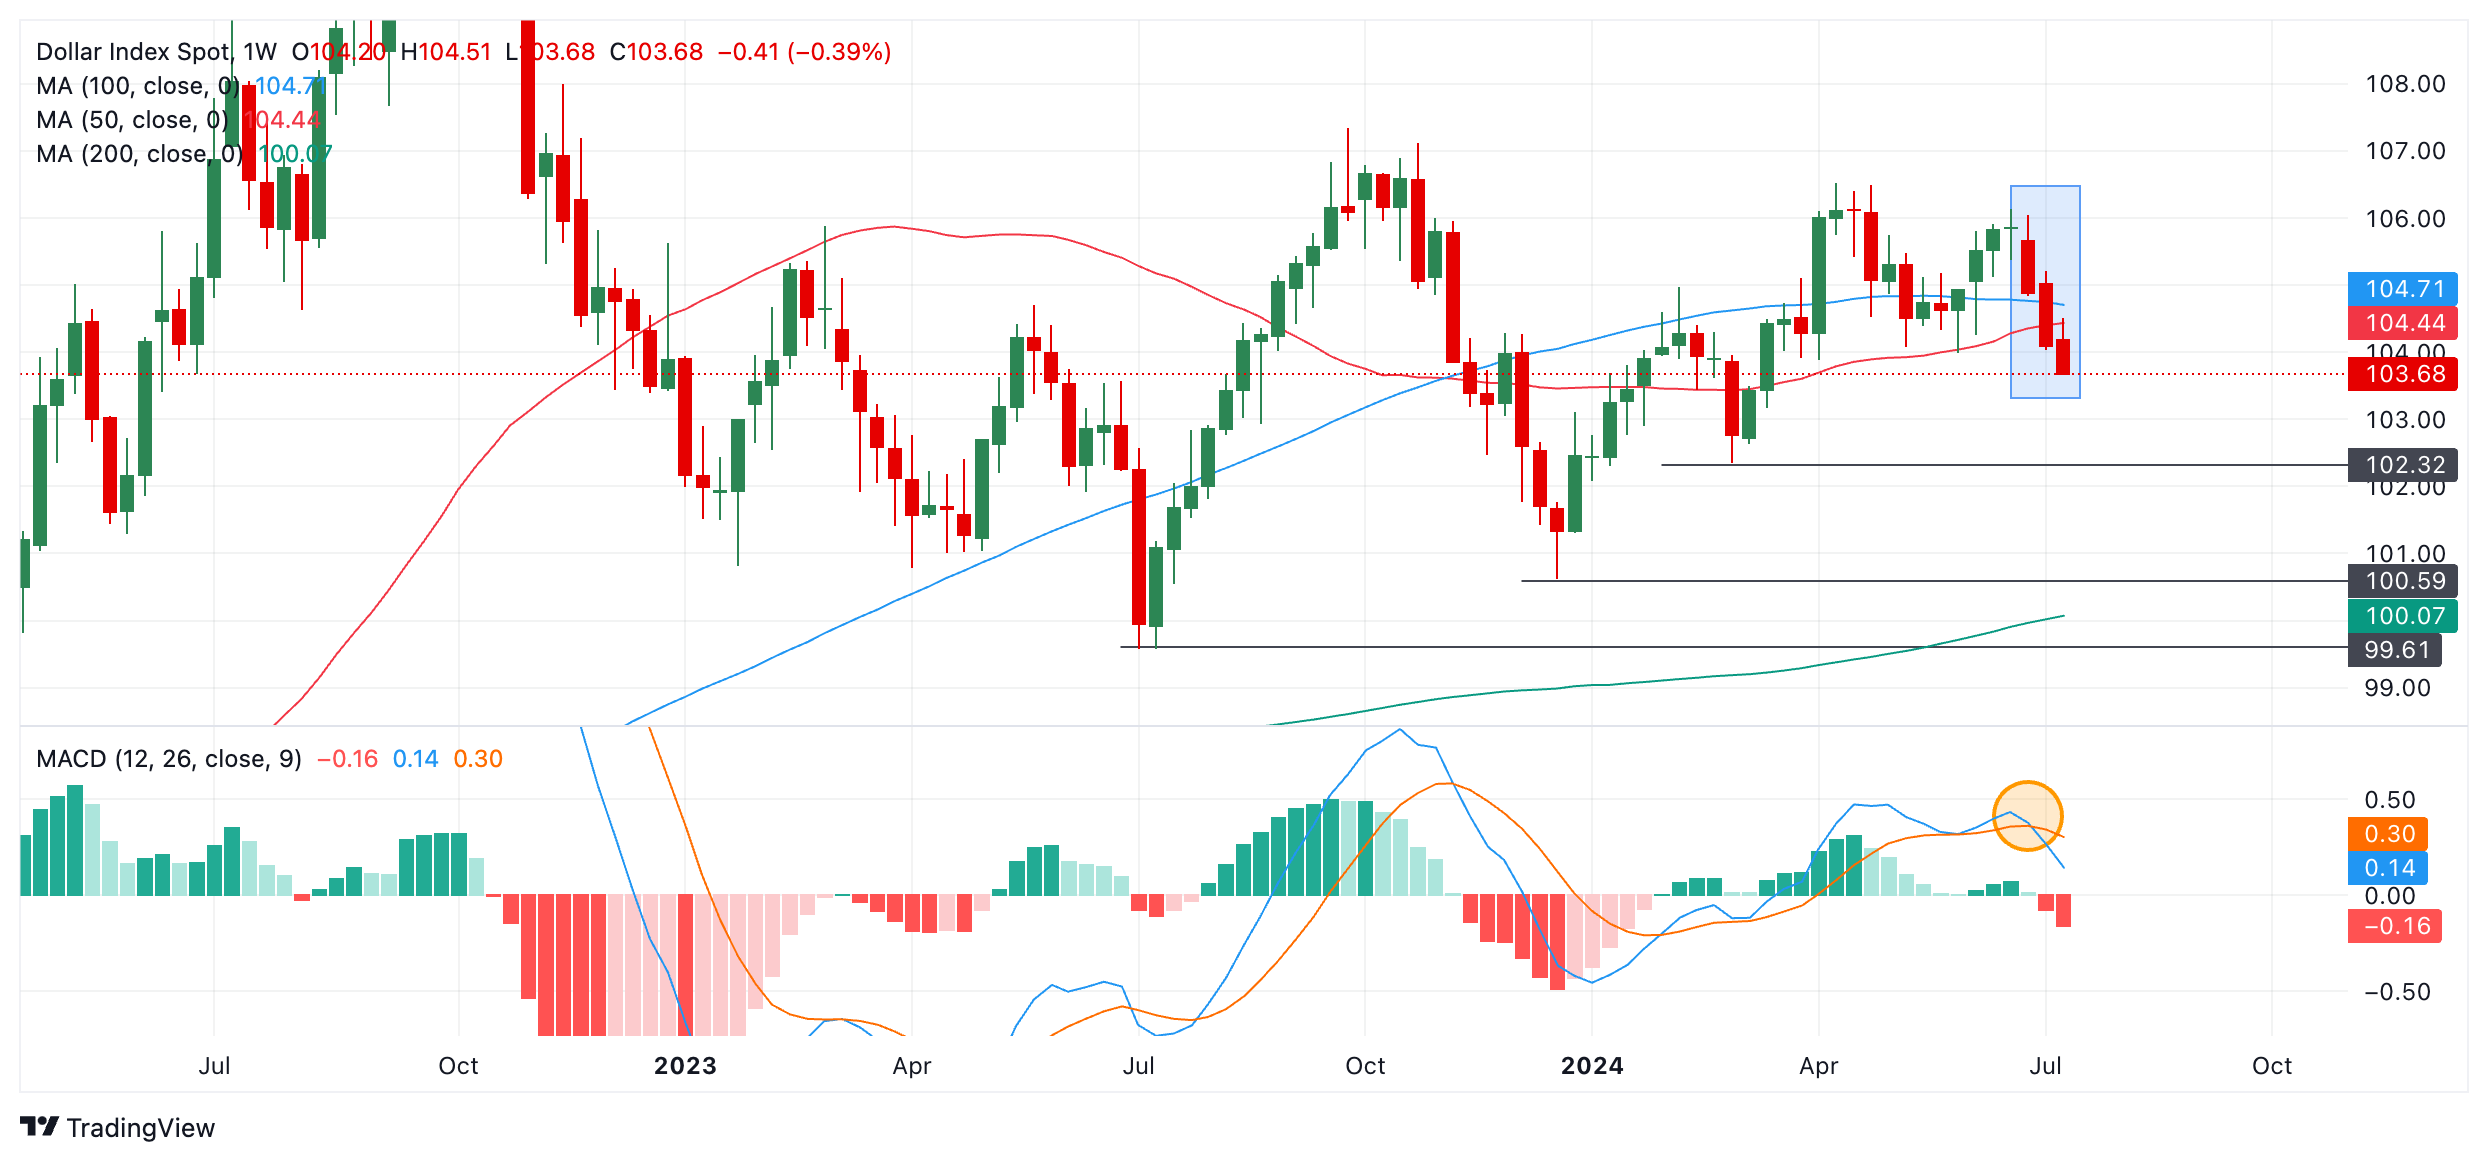
The index might be forming a bearish Three Black Crows Japanese candlestick pattern (shaded blue rectangle), which has bearish connotations. If the current week ends as a bearish red candlestick that will confirm a Three Black Crows has completed and indicate more downside is expected to follow.
Assuming this is the case, the next downside target for the pair is support from the swing low at 102.32, followed by a similar swing low from late 2023 at 100.59.
The bearish view is complemented and reinforced by the bearish crossover of the Moving Average Convergence Divergence (MACD) momentum indicator below its orange signal line (circled).
- The Mexican Peso trades variably against its main counterparts amid data releases and changing interest rate expectations.
- MXN is rising against the USD as bets on a September rate cut mount; versus European currencies, the Peso lags.
- Stubbornly high inflation in the old continent could delay rate cuts from the BoE and ECB, supporting European FX.
The Mexican Peso (MXN) is trading mixed against its key counterparts on Wednesday. MXN is rising versus the US Dollar (USD), which has weakened due to increasing bets the Federal Reserve (Fed) will lower borrowing costs in September. This, in turn, has weighed on USD since lower interest rates attract less foreign capital inflows.
Against the Pound Sterling (GBP), the Mexican Peso is weakening after UK Consumer Price Index (CPI) data showed inflation remained stubbornly high in June. This suggests the Bank of England (BoE) could delay cutting interest rates in the UK. The same is true of EUR/MXN, which is up over a percent after the release of Eurozone inflation data showed similarly persistent inflation in the region.
At the time of writing, one US Dollar (USD) buys 17.73 Mexican Pesos, EUR/MXN trades at 19.41, and GBP/MXN at 23.12.
Mexican Peso trades mixed depending on counterpart
The Mexican Peso is rising versus a weaker USD after a speech from the Fed Board of Governors’ member Adriana Kugler in which she said the Fed might cut rates “later this year”. Markets interpreted this as further confirmation of an interest rate cut in September.
“It will be appropriate to begin easing monetary policy later this year if economic conditions continue to evolve favorably,” said Kugler in a speech to the Peterson Institute for International Economics on Tuesday.
Kugler also added that further signs of deterioration in the labor market might provide another reason for the Fed to lower interest rates, a move which could stimulate hiring through lower borrowing costs. June’s Nonfarm Payrolls report revealed that the Unemployment Rate rose to 4.1%. It was the third month in a row that unemployment had risen in the US, and the highest level it has been at since November 2021. Unlike most central banks, the Fed has a dual mandate to achieve target inflation (of 2.0%) and “full employment”.
Her comments come on the back of market-moving statements made by Federal Reserve Chairman Jerome Powell on Monday, and a marked cooling in recent US inflation data.
Inflation in Europe remains stubbornly high
The Mexican Peso is losing ground against both the Euro and the Pound on Wednesday after the release of CPI data from both the UK and the Eurozone showed inflation remaining largely unchanged in June. This raises the possibility the Bank of England (BoE) and European Central Bank (ECB) may delay making further rate cuts as they wait for inflation to continue cooling.
UK CPI rose 2.0% on a year-over-year (YoY) basis and 0.1% month-over-month (MoM) in June, which was in line with expectations and the previous month’s reading, although the MoM data fell compared to May’s 0.3% reading. UK core CPI showed a 3.5% rise YoY, which was in line with estimates and the same as previous, according to data from the UK Office of National Statistics (ONS) released on Wednesday.
The Eurozone Harmonized Index of Consumer Prices (HICP) rose 2.5% YoY in June – the same as the previous month and in line with estimates, whilst monthly HICP rose 0.2%, also the same as expected and the previous.
Eurozone core HICP rose 2.9% YoY in June, the same as expected and previously, and 0.4% MoM, slightly above the 0.3% registered in May, according to data from Eurostat.
It is a quiet data week for the Mexican Peso, with the next key macroeconomic release not until July 22, when the National Statistics Agency (INEGI) reveals growth figures for the month of May.
Technical Analysis: USD/MXN finds support at 50-day SMA
USD/MXN has found support after its recent decline from the June 12 high.
The pair is consolidating along the line of the 50-day Simple Moving Average (SMA) at 17.65.
USD/MXN Daily Chart
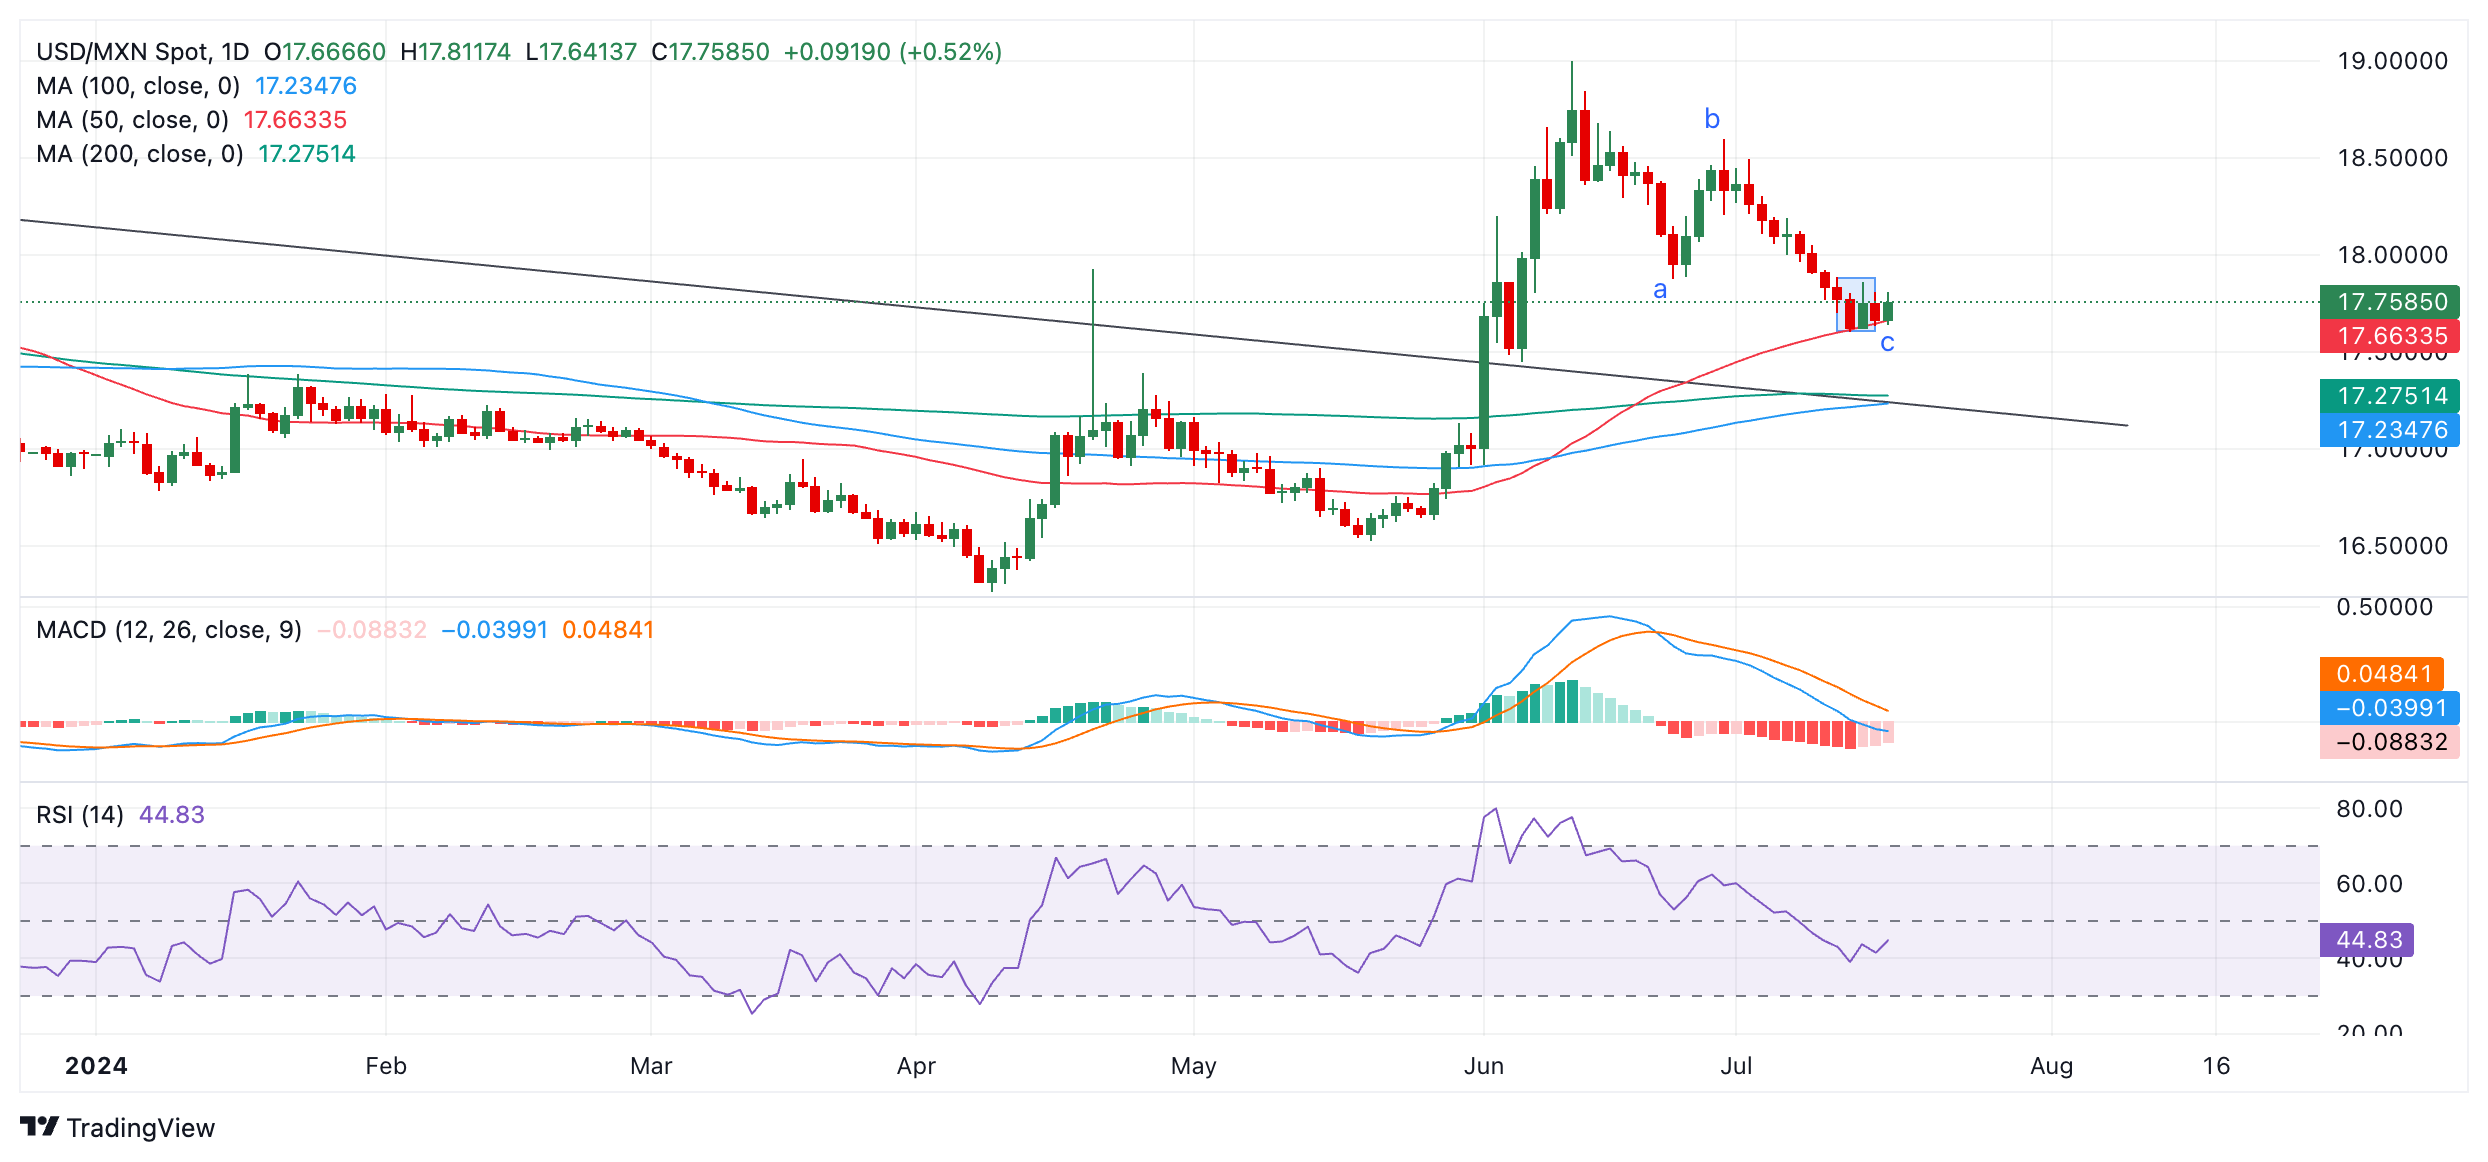
It is possible USD/MXN is preparing for a reversal higher, although there is insufficient evidence yet of this, and it remains in a short-term downtrend. Given that the “trend is your friend,” this still technically favors bearish bets.
The pair, however, might have completed a Measured Move (MM) pattern, a further sign of a reversal may be on the cards.
MMs are large, three-wave zig-zags, with waves labeled A, B, and C. The end of wave C can be estimated using the length of wave A as a guide. C is usually equal to A or, at least, a Fibonacci ratio of A. C is now roughly the same length as A, suggesting the pattern could be complete or near completion.
That said, the trend remains bearish, and a break plus a daily close below the 50-day Simple Moving Average (SMA) would reconfirm the dominant short-term downtrending bias. This could lead to a probable decline to 17.27, the level of the 200-day SMA and a major multi-month trendline.
Meanwhile, the direction of the medium and long-term trends remain in doubt.
Economic Indicator
Fed's Kugler speech
Adriana D. Kugler is a member of the Board of Governors of the Federal Reserve system. She took office on September 13, 2023, to fill an unexpired term ending January 31, 2026. Dr. Kugler served as the US Executive Director at the World Bank Group. She is on leave from Georgetown University where she is a professor of Public Policy and Economics and was vice provost for faculty. Dr. Kugler received a BA in economics and political science from McGill University and a PhD in economics from the University of California, Berkeley.
Read more.Last release: Tue Jul 16, 2024 18:45
Frequency: Irregular
Actual: -
Consensus: -
Previous: -
Source: Federal Reserve
EUR/USD continues to trade close to 1.090, a level that symbolises the current balance between USD-positive US political developments and USD-negative Fed rate repricing. But there remains very little contribution from the Euro (EUR) leg to the pair’s recent price action, ING’s FX strategist Francesco Pesole notes.
EUR/USD to trade near 1.08 in the coming weeks
“On the data side, we saw ZEW surveys yesterday, which confirmed expectations for a drop in the German expectations gauge, but also a surprising recovery in the current situation index – perhaps on the back of the more market-friendly result of the French election. The eurozone-wide expectations survey contracted too, confirming the loss of momentum in activity sentiment over the past month.”
“We expect this cool-off in the eurozone’s growth outlook can coincide with markets becoming gradually more nervous about the French fiscal situation as the political gridlock continues. That is one of the reasons why we continue to see 1.08 as more likely than 1.10 in the coming weeks.“
“The only event to watch on the macro side in the eurozone today is the final release of CPI data for June. Consensus is not expecting any revision from the flash estimates, which saw headline inflation at 2.5% and the core gauge at 2.9% YoY.”
The June US retail sales report exceeded expectations yesterday, with headline sales remaining flat on the month against a consensus 0.3% MoM drop. Slower consumer spending growth, moderating inflation, and rising unemployment rates may impact the sector going forward, and we still expect this to feed into a narrative of lower Fed rates, ING’s FX strategist Francesco Pesole notes.
USD to stabilize before the end of the week
“Those figures did not dent the market’s dovish call on the Fed. A September cut is fully priced in, and 65bp of easing is factored in by year-end. The reason why the US Dollar (USD) has been resilient despite the rise in dovish bets is undoubtedly the emergence of “hedges” for higher inflation, tariffs, and geopolitical risks ahead of a Trump re-election, which is perceived as more likely after the weekend incident.”
“Last week, we were still arguing for some short-term USD weakness on the back of US macro news, but after recent developments in this week’s price action so far, the risks for the dollar are much more balanced. Periods of USD outperformance this summer are more likely as markets have a clear inclination to play the “Trump trade” well ahead of November.”
“The US data calendar includes housing starts, building permits and industrial production for June today. The Fed will release the Beige Book this evening, which may signal some regional strains in the jobs market, ultimately making Fed communication drift further to the dovish side. We continue to expect some stabilisation in USD crosses before the end of the week.”
UK June inflation was broadly as expected, and on target. However, the popular music artist Taylor Swift had several UK concerts in June. Swifties need some place to stay. Hotel price increases were a very sizable part of June inflation, UBS macro strategist Paul Donovan notes.
Trump to tax US consumers of goods partially made overseas
“The popular music artist Taylor Swift had several UK concerts in June. Swifties need some place to stay. Hotel price increases were a very sizable part of June inflation. BoE Governor Bailey should ignore this effect. Goods prices, and in particular durable goods prices, remain firmly in deflation. Producer price inflation was weaker than expected.”
“US May industrial production data is due. It is of some interest to the markets, but not normally a major driver of assets. Yesterday’s retail sales strength (never go short the hedonism of the US consumer) was in contrast to pessimism expressed in sentiment surveys—and the failings of sentiment surveys may carry into business sentiment polls.”
“Former US President Trump said he would allow Federal Reserve Chair Powell to complete his term. However, Trump reiterated a desire to aggressively tax US consumers of goods partially made overseas—tariff risks are something investors need to consider. The Fed’s Beige Book of economic anecdotes will be published. Economists care (but political partisanship may infect the responses).”
- EUR/USD moves higher above 1.0900 as investors see a Fed rate cut in September as a done deal.
- Better-than-expected US Retail Sales report fails to diminish Fed rate-cut prospects.
- The ECB is expected to leave interest rates unchanged on Thursday.
EUR/USD jumps above 1.0900 and reaches a new four-month high in Wednesday’s European session. The major currency pair extends gains after recovering its losses on Tuesday, driven by the better-than-expected United States (US) Retail Sales report for June.
Data showed on Tuesday that monthly Retail Sales remained unchanged, as expected, as lower receipts at auto showrooms were offset by robust demand for core goods. The Retail Sales Control Group, a key measure of consumer spending component of Gross Domestic Product (GDP) that excludes receipts from auto dealers, building-materials retailers, gas stations, office supply stores, mobile home dealers, and tobacco stores, rose at a stronger pace of 0.9% than the former release of 0.4%.
The US Census Bureau also revised May’s Retail Sales reading to 0.3% from 0.1%, adding to economic strength. Though the Retail Sales report has emerged better than estimates, it is unable to weaken firm speculation that the Federal Reserve (Fed) will start reducing interest rates from the September meeting.
Traders see the gossip of rate cuts in September as a done deal due to cooling inflationary pressures and easing labor market strength. The recent consumer inflation report for June signaled that the disinflation process has resumed after a hiatus in the first quarter of the year.
Also, recent commentary from Fed officials has indicated that their confidence in inflation declining to the bank’s target of 2% has improved. On Tuesday, Fed Governor Adriana Kugler signaled cautious optimism that inflation is on the path to return to the bank’s target of 2%. Kugler acknowledged progress in disinflation in all three categories: goods, services and now housing, Reuters reported.
Daily digest market movers: EUR/USD rises further as US Dollar weakens
- EUR/USD is expected to trade cautiously with a focus on the European Central Bank’s (ECB) monetary policy meeting, which is scheduled for Thursday. The ECB is expected to leave interest rates unchanged. Therefore, investors will pay close attention to commentary on the interest rate outlook to know when the ECB will cut interest rates again.
- The ECB delivered its first rate cut in June after maintaining a restrictive interest rate framework for two years to tame hot inflationary pressures driven by coronavirus pandemic-led stimulus. ECB officials voted to roll back the tight policy stance after gaining confidence that inflation will return to the desired rate of 2%. However, policymakers expect price pressures to remain at their current levels for the entire year and return to the bank’s target next year.
- Financial markets expect the ECB to deliver two more rate cuts this year. Meanwhile, investors’ sentiment in the Eurozone’s largest economy, Germany, has deteriorated due to weak demand from both domestic and overseas markets.
- On Tuesday, a sharp decline in the German ZEW Survey – Economic Sentiment for July raised concerns over the economic outlook. The sentiment data, a key measure of the sentiment of institutional investors towards economic growth, declined at a robust pace to 41.8 from the consensus of 42.5 and May’s reading of 47.5.
Technical Analysis: EUR/USD moves higher to 1.0950
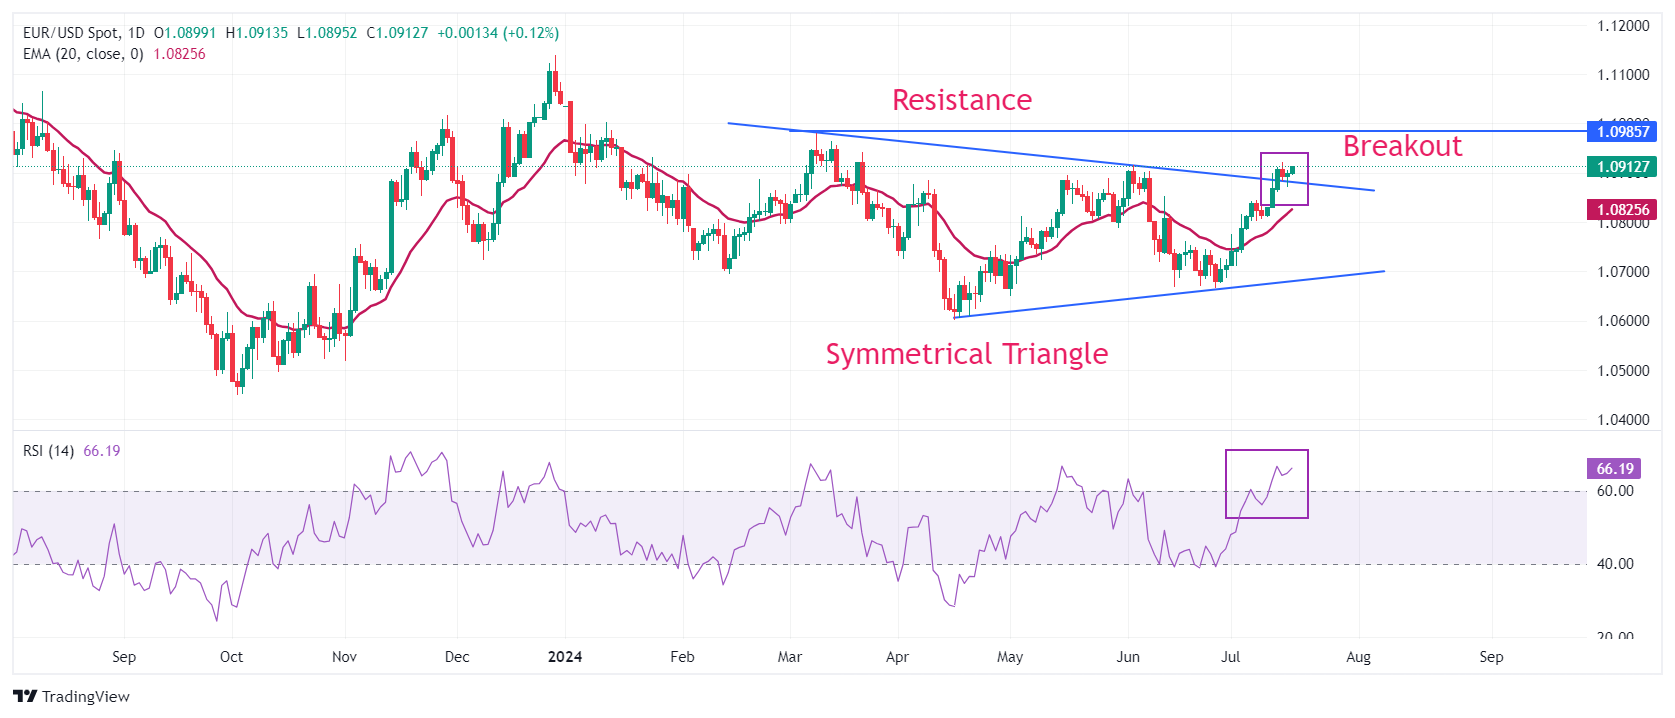
EUR/USD edges higher to near 1.0950. The major currency pair strengthens after a breakout of a Symmetrical Triangle formation on a daily timeframe. A breakout of the above-mentioned chart pattern results in wider ticks and heavy volume. The shared currency pair is expected to extend its upside towards the March 8 high near 1.0980.
The major currency pair’s near-term outlook is bullish as the 20-day Exponential Moving Average (EMA) near 1.0816 is sloping higher.
The 14-day Relative Strength Index (RSI) shifts into the bullish range of 60.00-80.00, suggesting a strong upside momentum.
Euro FAQs
The Euro is the currency for the 20 European Union countries that belong to the Eurozone. It is the second most heavily traded currency in the world behind the US Dollar. In 2022, it accounted for 31% of all foreign exchange transactions, with an average daily turnover of over $2.2 trillion a day. EUR/USD is the most heavily traded currency pair in the world, accounting for an estimated 30% off all transactions, followed by EUR/JPY (4%), EUR/GBP (3%) and EUR/AUD (2%).
The European Central Bank (ECB) in Frankfurt, Germany, is the reserve bank for the Eurozone. The ECB sets interest rates and manages monetary policy. The ECB’s primary mandate is to maintain price stability, which means either controlling inflation or stimulating growth. Its primary tool is the raising or lowering of interest rates. Relatively high interest rates – or the expectation of higher rates – will usually benefit the Euro and vice versa. The ECB Governing Council makes monetary policy decisions at meetings held eight times a year. Decisions are made by heads of the Eurozone national banks and six permanent members, including the President of the ECB, Christine Lagarde.
Eurozone inflation data, measured by the Harmonized Index of Consumer Prices (HICP), is an important econometric for the Euro. If inflation rises more than expected, especially if above the ECB’s 2% target, it obliges the ECB to raise interest rates to bring it back under control. Relatively high interest rates compared to its counterparts will usually benefit the Euro, as it makes the region more attractive as a place for global investors to park their money.
Data releases gauge the health of the economy and can impact on the Euro. Indicators such as GDP, Manufacturing and Services PMIs, employment, and consumer sentiment surveys can all influence the direction of the single currency. A strong economy is good for the Euro. Not only does it attract more foreign investment but it may encourage the ECB to put up interest rates, which will directly strengthen the Euro. Otherwise, if economic data is weak, the Euro is likely to fall. Economic data for the four largest economies in the euro area (Germany, France, Italy and Spain) are especially significant, as they account for 75% of the Eurozone’s economy.
Another significant data release for the Euro is the Trade Balance. This indicator measures the difference between what a country earns from its exports and what it spends on imports over a given period. If a country produces highly sought after exports then its currency will gain in value purely from the extra demand created from foreign buyers seeking to purchase these goods. Therefore, a positive net Trade Balance strengthens a currency and vice versa for a negative balance.
In an interview with the Wall Street Journal (WSJ) on Wednesday, New York Federal Reserve (Fed) bank President John Williams pushed back against concerns bringing inflation back to the Fed’s 2% goal would be more difficult than it had been so far.
Additional quotes
Interest-rate cut could be warranted in the US in the coming months.
Restrictive stance of policy that we have in place is appropriate.
Even if and when the Fed starts to lower rates, they would remain at a setting that still restrains economic activity.
Last three months of inflation data are getting us closer to a disinflationary trend that we’re looking for.
Market reaction
The US Dollar Index (DXY) is accelerating its decline following these comments, currently losing 0.55% on the day to trade near 103.70 – four-month lows.
Fed FAQs
Monetary policy in the US is shaped by the Federal Reserve (Fed). The Fed has two mandates: to achieve price stability and foster full employment. Its primary tool to achieve these goals is by adjusting interest rates. When prices are rising too quickly and inflation is above the Fed’s 2% target, it raises interest rates, increasing borrowing costs throughout the economy. This results in a stronger US Dollar (USD) as it makes the US a more attractive place for international investors to park their money. When inflation falls below 2% or the Unemployment Rate is too high, the Fed may lower interest rates to encourage borrowing, which weighs on the Greenback.
The Federal Reserve (Fed) holds eight policy meetings a year, where the Federal Open Market Committee (FOMC) assesses economic conditions and makes monetary policy decisions. The FOMC is attended by twelve Fed officials – the seven members of the Board of Governors, the president of the Federal Reserve Bank of New York, and four of the remaining eleven regional Reserve Bank presidents, who serve one-year terms on a rotating basis.
In extreme situations, the Federal Reserve may resort to a policy named Quantitative Easing (QE). QE is the process by which the Fed substantially increases the flow of credit in a stuck financial system. It is a non-standard policy measure used during crises or when inflation is extremely low. It was the Fed’s weapon of choice during the Great Financial Crisis in 2008. It involves the Fed printing more Dollars and using them to buy high grade bonds from financial institutions. QE usually weakens the US Dollar.
Quantitative tightening (QT) is the reverse process of QE, whereby the Federal Reserve stops buying bonds from financial institutions and does not reinvest the principal from the bonds it holds maturing, to purchase new bonds. It is usually positive for the value of the US Dollar.
Silver prices (XAG/USD) fell on Wednesday, according to FXStreet data. Silver trades at $30.90 per troy ounce, down 1.14% from the $31.25 it cost on Tuesday.
Silver prices have increased by 29.84% since the beginning of the year.
| Unit measure | Silver Price Today in USD |
|---|---|
| Troy Ounce | 30.90 |
| 1 Gram | 0.99 |
The Gold/Silver ratio, which shows the number of ounces of Silver needed to equal the value of one ounce of Gold, stood at 79.98 on Wednesday, up from 78.99 on Tuesday.
Silver FAQs
Silver is a precious metal highly traded among investors. It has been historically used as a store of value and a medium of exchange. Although less popular than Gold, traders may turn to Silver to diversify their investment portfolio, for its intrinsic value or as a potential hedge during high-inflation periods. Investors can buy physical Silver, in coins or in bars, or trade it through vehicles such as Exchange Traded Funds, which track its price on international markets.
Silver prices can move due to a wide range of factors. Geopolitical instability or fears of a deep recession can make Silver price escalate due to its safe-haven status, although to a lesser extent than Gold's. As a yieldless asset, Silver tends to rise with lower interest rates. Its moves also depend on how the US Dollar (USD) behaves as the asset is priced in dollars (XAG/USD). A strong Dollar tends to keep the price of Silver at bay, whereas a weaker Dollar is likely to propel prices up. Other factors such as investment demand, mining supply – Silver is much more abundant than Gold – and recycling rates can also affect prices.
Silver is widely used in industry, particularly in sectors such as electronics or solar energy, as it has one of the highest electric conductivity of all metals – more than Copper and Gold. A surge in demand can increase prices, while a decline tends to lower them. Dynamics in the US, Chinese and Indian economies can also contribute to price swings: for the US and particularly China, their big industrial sectors use Silver in various processes; in India, consumers’ demand for the precious metal for jewellery also plays a key role in setting prices.
Silver prices tend to follow Gold's moves. When Gold prices rise, Silver typically follows suit, as their status as safe-haven assets is similar. The Gold/Silver ratio, which shows the number of ounces of Silver needed to equal the value of one ounce of Gold, may help to determine the relative valuation between both metals. Some investors may consider a high ratio as an indicator that Silver is undervalued, or Gold is overvalued. On the contrary, a low ratio might suggest that Gold is undervalued relative to Silver.
(An automation tool was used in creating this post.)
- Silver price depreciates due to a slowing economy in China, the world's largest manufacturing hub.
- The third plenum has indicated no major changes in the economic strategy of top consumer China.
- The non-yielding Silver struggled after Tuesday's hawkish remarks from Fed member Dr. Adriana Kugler.
Silver price (XAG/USD) retraces its recent gains, trading around $30.90 per troy ounce during the European hours on Wednesday. The grey metal faces challenges due to a slowing Chinese economy, the world's largest manufacturing hub. China's industrial demand for Silver is significant, as it is essential in various applications such as electronics, solar panels, and automotive components.
China's Gross Domestic Product (GDP) grew 4.7% year-over-year in the second quarter, compared to a 5.3% expansion in the first quarter and an expected 5.1%. This marks the slowest growth since the first quarter of 2023.
The third plenum of the Chinese Communist Party's 20th National Congress, held from July 15 to 18, has so far indicated no major changes in the economic strategy of top consumer China. President Xi Jinping urged the Communist Party to maintain "unwavering faith and commitment" to its strategic agenda.
Standard Chartered anticipates that the People's Bank of China (PBoC) will implement cuts in both interest rates and the reserve requirement ratio (RRR) as GDP growth decelerates in the second quarter. China's growth drivers remain uneven, and trade tensions are escalating, with the US and EU imposing new tariffs on Chinese electric vehicles (EVs).
Additionally, Silver prices struggle due to the emergence of the hawkish sentiment surrounding the Federal Reserve (Fed) policy stance after the speech from Federal Reserve (Fed) Board of Governors member Dr. Adriana Kugler on Tuesday. Dr. Kugler indicated that if upcoming data does not confirm that inflation is moving toward the 2% target, it may be appropriate to maintain current rates for a while longer.
Silver FAQs
Silver is a precious metal highly traded among investors. It has been historically used as a store of value and a medium of exchange. Although less popular than Gold, traders may turn to Silver to diversify their investment portfolio, for its intrinsic value or as a potential hedge during high-inflation periods. Investors can buy physical Silver, in coins or in bars, or trade it through vehicles such as Exchange Traded Funds, which track its price on international markets.
Silver prices can move due to a wide range of factors. Geopolitical instability or fears of a deep recession can make Silver price escalate due to its safe-haven status, although to a lesser extent than Gold's. As a yieldless asset, Silver tends to rise with lower interest rates. Its moves also depend on how the US Dollar (USD) behaves as the asset is priced in dollars (XAG/USD). A strong Dollar tends to keep the price of Silver at bay, whereas a weaker Dollar is likely to propel prices up. Other factors such as investment demand, mining supply – Silver is much more abundant than Gold – and recycling rates can also affect prices.
Silver is widely used in industry, particularly in sectors such as electronics or solar energy, as it has one of the highest electric conductivity of all metals – more than Copper and Gold. A surge in demand can increase prices, while a decline tends to lower them. Dynamics in the US, Chinese and Indian economies can also contribute to price swings: for the US and particularly China, their big industrial sectors use Silver in various processes; in India, consumers’ demand for the precious metal for jewellery also plays a key role in setting prices.
Silver prices tend to follow Gold's moves. When Gold prices rise, Silver typically follows suit, as their status as safe-haven assets is similar. The Gold/Silver ratio, which shows the number of ounces of Silver needed to equal the value of one ounce of Gold, may help to determine the relative valuation between both metals. Some investors may consider a high ratio as an indicator that Silver is undervalued, or Gold is overvalued. On the contrary, a low ratio might suggest that Gold is undervalued relative to Silver.
Momentum has increased slightly, but not enough to suggest a sustained advance. The US Dollar (USD) is likely to trade in a 7.2600/7.3100 range for now, UOB Group FX analysts Quek Ser Leang and Lee Sue Ann note.
Likely to trade in a 7.2600/7.3100 range for now
24-HOUR VIEW: “Our view for USD to trade in a sideways range of 7.2650/7.2850 was incorrect. Instead of trading in a range, USD rose, reaching a high of 7.2924. Upward momentum has increased, albeit slightly. Today, as long as 7.2810 (minor support is at 7.2845) is not breached, USD could rise to 7.2990 before the risk of a pullback increases. The major resistance at 7.3100 is unlikely to come under threat.”
1-3 WEEKS VIEW: “Our most recent narrative was from last Friday (12 Jul, spot at 7.2685), wherein USD ‘is likely to trade with a downward bias towards 7.2400.’ We highlighted that ‘the downward bias is intact as long as USD remains below 7.2910.’ Yesterday, USD broke above 7.2910 (high of 7.2924). Downward momentum has faded, but while upward momentum has increased slightly, it is not enough to suggest a sustained advance. From here, USD is more likely to trade in a 7.2600/7.3100 range.”
Japanese Vice Finance Minister for International Affairs Masato Kanda issued a verbal warning on the recent Yen depreciation in a Kyodo News interview on Wednesday.
Kanda said, “if speculators cause excessive moves in the FX market, we have no choice but to respond appropriately.”
Market reaction
At the time of writing, USD/JPY is falling hard toward 156.00, losing 1.38% so far.
Japanese Yen PRICE Today
The table below shows the percentage change of Japanese Yen (JPY) against listed major currencies today. Japanese Yen was the weakest against the Swiss Franc.
| USD | EUR | GBP | JPY | CAD | AUD | NZD | CHF | |
|---|---|---|---|---|---|---|---|---|
| USD | -0.39% | -0.43% | -1.37% | -0.07% | -0.28% | -0.64% | -0.72% | |
| EUR | 0.39% | -0.02% | -0.97% | 0.33% | 0.11% | -0.28% | -0.32% | |
| GBP | 0.43% | 0.02% | -0.94% | 0.37% | 0.14% | -0.25% | -0.29% | |
| JPY | 1.37% | 0.97% | 0.94% | 1.32% | 1.11% | 0.70% | 0.68% | |
| CAD | 0.07% | -0.33% | -0.37% | -1.32% | -0.22% | -0.59% | -0.65% | |
| AUD | 0.28% | -0.11% | -0.14% | -1.11% | 0.22% | -0.38% | -0.43% | |
| NZD | 0.64% | 0.28% | 0.25% | -0.70% | 0.59% | 0.38% | -0.05% | |
| CHF | 0.72% | 0.32% | 0.29% | -0.68% | 0.65% | 0.43% | 0.05% |
The heat map shows percentage changes of major currencies against each other. The base currency is picked from the left column, while the quote currency is picked from the top row. For example, if you pick the Japanese Yen from the left column and move along the horizontal line to the US Dollar, the percentage change displayed in the box will represent JPY (base)/USD (quote).
The New Zealand Dollar (NZD) is likely to trade in a range between 0.6030 and 0.6090. Buildup in downward momentum is not sufficiently enough to suggest a sustained decline; NZD has to break clearly below 0.6030 before further weakness can be expected, UOB Group FX analysts Quek Ser Leang and Lee Sue Ann note.
NZD needs to break above 0.6115 to continue upwards
24-HOUR VIEW: “Yesterday, we noted ‘the underlying tone has softened.’ We were of the view that NZD ‘is likely to edge lower but is unlikely to break below 0.6045.’ However, NZD fell more than expected to 0.6037. In early Sydney trade, NZD dipped to 0.6033 before rebounding sharply. The rebound in oversold conditions suggests NZD is unlikely to weaken much further. Today, NZD is more likely to trade in a range between 0.6030 and 0.6090.”
1-3 WEEKS VIEW: “In our latest narrative from last Friday (12 Jul, spot at 0.6090), we indicated that ‘the current price movements are likely part of a range trading phase, probably between 0.6045 and 0.6155.’ Yesterday, NZD fell sharply and broke below 0.6045 before closing at 0.6050 (- 0.40%). Downward momentum is building, but not sufficiently enough to suggest the start of a sustained decline. NZD has to break and stay below 0.6030 before further weakness can be expected. The likelihood of NZD breaking clearly below 0.6030 is not high for now, but it will remain intact as long as 0.6115 is not breached.”
The Australian Dollar (AUD) could drop further to 0.6705. Upward momentum has faded; downward momentum has increased slightly. AUD is likely to trade with a downward bias but is unlikely to break 0.6680, UOB Group FX analysts Quek Ser Leang and Lee Sue Ann note.
AUD to test 0.6680 below 0.6705
24-HOUR VIEW: “While we noted yesterday that the underlying tone has softened, we held the view that AUD ‘is likely to trade in a lower range of 0.6740/0.6785.’ Instead of trading in a range, AUD fell sharply, reaching a low of 0.6715. AUD closed on a weak note at 0.6734 (-0.38%). The sharp and swift drop appears to be overdone, but with no sign of stabilisation just yet, AUD could drop further to 0.6705. The major support at 0.6680 is unlikely to come under threat. Resistance levels are at 0.6745 and 0.6760.”
1-3 WEEKS VIEW: “We turned positive in AUD since the start of the month. In our most recent narrative from last Friday (12 Jul, spot at 0.6765), we indicated that ‘while there is room for AUD to continue to rise, it has to surpass 0.6800 before further advance can be expected.’ We added, ‘given the overbought conditions, it remains to be seen if AUD can break above 0.6800.’ Yesterday, AUD fell sharply and broke below our ‘strong support’ level of 0.6735. Not only has upward momentum faded, but downward momentum has also increased slightly. From here, we expect AUD to trade with a downward bias, but at this time, it does not appear to have enough momentum to break the major support at 0.6680. On the upside, a breach of 0.6775 would indicate that the current modest downward momentum has eased.”
- WTI Oil price appreciates as the American Petroleum Institute (API) reports a decline in US Oil stockpiles.
- API Crude Oil stock fell by 4.4 million barrels for the previous week, against the expected decrease of 33K barrels.
- Oil prices struggled after the hawkish remarks from Fed member Dr. Adriana Kugler on Tuesday.
West Texas Intermediate (WTI) Oil price recovers its intraday losses, trading around $80.00 per barrel during the European hours on Wednesday. The decline in the US Dollar (USD) contributes support for the crude Oil demand, underpinning the Oil prices.
Additionally, the Oil price receives support due to the declining Oil stockpiles in the United States (US), the world's largest Oil producer and consumer. The American Petroleum Institute (API) reported a decline of 4.4 million barrels in weekly crude Oil stock for the week ending July 12. Analysts surveyed by Reuters had estimated a smaller decrease of 33,000 barrels. The US Energy Information Administration (EIA) will release its official storage report later in the North American session.
However, prices of liquid gold faced challenges due to a slowing Chinese economy, which is reducing demand in the world's largest Oil-importing country. China's Gross Domestic Product (GDP) grew 4.7% year-over-year in the second quarter, compared to a 5.3% expansion in the first quarter and an expected 5.1%. This is the slowest growth since the first quarter of 2023.
Standard Chartered expects cuts from the People's Bank of China (PBoC) in rates and the reserve requirement ratio (RRR) as GDP growth decelerates in Q2. China’s growth drivers remain uneven, and trade tensions are rising, with the US and EU imposing new tariffs on Chinese electric vehicles (EVs).
Additionally, Oil prices struggled due to the emergence of the hawkish sentiment surrounding the Federal Reserve (Fed) policy stance after the speech from Federal Reserve (Fed) Board of Governors member Dr. Adriana Kugler on Tuesday. Dr. Kugler indicated that if upcoming data does not confirm that inflation is moving toward the 2% target, it may be appropriate to maintain current rates for a while longer.
WTI Oil FAQs
WTI Oil is a type of Crude Oil sold on international markets. The WTI stands for West Texas Intermediate, one of three major types including Brent and Dubai Crude. WTI is also referred to as “light” and “sweet” because of its relatively low gravity and sulfur content respectively. It is considered a high quality Oil that is easily refined. It is sourced in the United States and distributed via the Cushing hub, which is considered “The Pipeline Crossroads of the World”. It is a benchmark for the Oil market and WTI price is frequently quoted in the media.
Like all assets, supply and demand are the key drivers of WTI Oil price. As such, global growth can be a driver of increased demand and vice versa for weak global growth. Political instability, wars, and sanctions can disrupt supply and impact prices. The decisions of OPEC, a group of major Oil-producing countries, is another key driver of price. The value of the US Dollar influences the price of WTI Crude Oil, since Oil is predominantly traded in US Dollars, thus a weaker US Dollar can make Oil more affordable and vice versa.
The weekly Oil inventory reports published by the American Petroleum Institute (API) and the Energy Information Agency (EIA) impact the price of WTI Oil. Changes in inventories reflect fluctuating supply and demand. If the data shows a drop in inventories it can indicate increased demand, pushing up Oil price. Higher inventories can reflect increased supply, pushing down prices. API’s report is published every Tuesday and EIA’s the day after. Their results are usually similar, falling within 1% of each other 75% of the time. The EIA data is considered more reliable, since it is a government agency.
OPEC (Organization of the Petroleum Exporting Countries) is a group of 13 Oil-producing nations who collectively decide production quotas for member countries at twice-yearly meetings. Their decisions often impact WTI Oil prices. When OPEC decides to lower quotas, it can tighten supply, pushing up Oil prices. When OPEC increases production, it has the opposite effect. OPEC+ refers to an expanded group that includes ten extra non-OPEC members, the most notable of which is Russia.
The Euro (EUR) is expected to trade in a 1.0875/1.0915 range. Upward momentum is slowing; it remains to be seen if EUR can rise further to 1.0940, UOB Group FX analysts Quek Ser Leang and Lee Sue Ann note.
Above 1.0915 is set to reach 1.0940
24-HOUR VIEW: “We expected EUR to trade in a range between 1.0875 and 1.0915 yesterday. EUR subsequently traded between 1.0870 and 1.0905, closing largely unchanged (1.0897, +0.03%). Momentum indicators are mostly flat, and we continue to expect EUR to trade in a 1.0875/1.0915 range.”
1-3 WEEKS VIEW: “Our update from yesterday (16 Jul, spot at 1.0895) is still valid. As highlighted, while there is still scope for EUR to rise further, upward momentum is slowing, and it remains to be seen if any further advance can reach 1.0940. On the downside, a breach of 1.0850 (no change in ‘strong support’ level) would mean that the EUR strength from early this month has run its course.”
- Gold is rising as expectations firm of falling interest rates in the US – a positive for the precious metal.
- Fed’s Adriana Kugler says a combination of falling inflation and weakening labor market could force rate cut “later this year”.
- Bets from Shanghai Futures Exchange traders are further bidding up Gold, say strategists from TD Securities.
Gold (XAU/USD) has broken to a new all-time high of $2,482 during the Asian session on Wednesday. The yellow metal’s gains have been put down to a mixture of firming expectations that interest rates in the US will fall in September, and rising demand from buyers on the Shanghai Futures Exchange (SHFE), according to analysts at Canadian Investment Bank TD Securities.
The expectation of rate cuts by the US Federal Reserve (Fed) is a key bullish driver for Gold since lower interest rates reduce the opportunity cost of holding the non-interest-bearing asset.
Gold rises on hopes of a September interest-rate cut
Gold shot up during trade on Tuesday after a speech from the Fed Board of Governors Adriana Kugler in which she said the Fed might cut rates “later this year”. Markets interpreted this as further confirmation of an interest rate cut in September.
“It will be appropriate to begin easing monetary policy later this year if economic conditions continue to evolve favorably,” said Kugler in a speech to the Peterson Institute for International Economics on Tuesday.
Kugler emphasized how the labor market had shown signs of cooling and was “rebalancing”. She added that further signs of deterioration in labor market conditions could also be a cause for the Fed to lower interest rates. In the Nonfarm Payrolls report for June, the Unemployment Rate rose to 4.1% when economists had expected it to remain at 4.0%. It was the third month in a row that unemployment had risen and the highest level it has been at since November 2021. Unlike most central banks, the Fed has a dual mandate to achieve target inflation (of 2.0%) and “full employment”.
Her comments come on the back of market-moving statements made by Federal Reserve Chairman Jerome Powell on Monday, in which he highlighted the progress made on bringing inflation back down to target and hinted a cut to interest rates was on the radar.
The CME FedWatch tool, which uses the price of 30-day Fed Funds futures to calculate probabilities of future rate changes, is pricing in a 100% chance of at least a 0.25% cut in the Fed Funds rate to an upper band of 5.25% in September. Last week, the probabilities had been hovering just above the 60% mark.
The change in outlook comes after US inflation data in the form of the Consumer Price Index (CPI) undershot expectations in June, when it fell to 3.0%. Personal Consumption Expenditures (PCE) inflation data – the Fed’s preferred inflation gauge – also revealed a cooling in price rises in May, with both core and headline rising only 2.6% and undershooting economists expectations in both cases.
Shanghai Futures Exchange buying keeps Gold bid – TD Securities
Gold is also rising because of frenzied buying of Gold futures and options on the Shanghai Futures Exchange (SHFE), according to TD Securities.
“Guess who's back. The top traders in SHFE Gold are piling back into the Yellow Metal. After a month's pause in this cohort's buying activity, positioning for the top traders in SHFE Gold is now rising at a fast clip towards its previous all-time highs set in 2024Q1,” says Daniel Ghali, Senior Commodity Strategist at TD Securities.
SHFE traders have added over 10 tonnes of Gold to their books “over the last five trading sessions, driven almost exclusively by new longs,” says Ghali.
Additionally, discretionary traders are piling back into Comex Gold, says the strategist.
TD’s research suggests that Gold is potentially benefiting from the “Trump trade” in addition to expectations that the Fed will commence its cutting cycle.
Technical Analysis: Gold breaks out of range and makes new all-time-high
Gold has broken decisively out of the top of its range, making a new all-time high in the process.
The precious metal now appears to have completed its sideways consolidation and is recommencing its broader uptrend.
XAU/USD Daily Chart
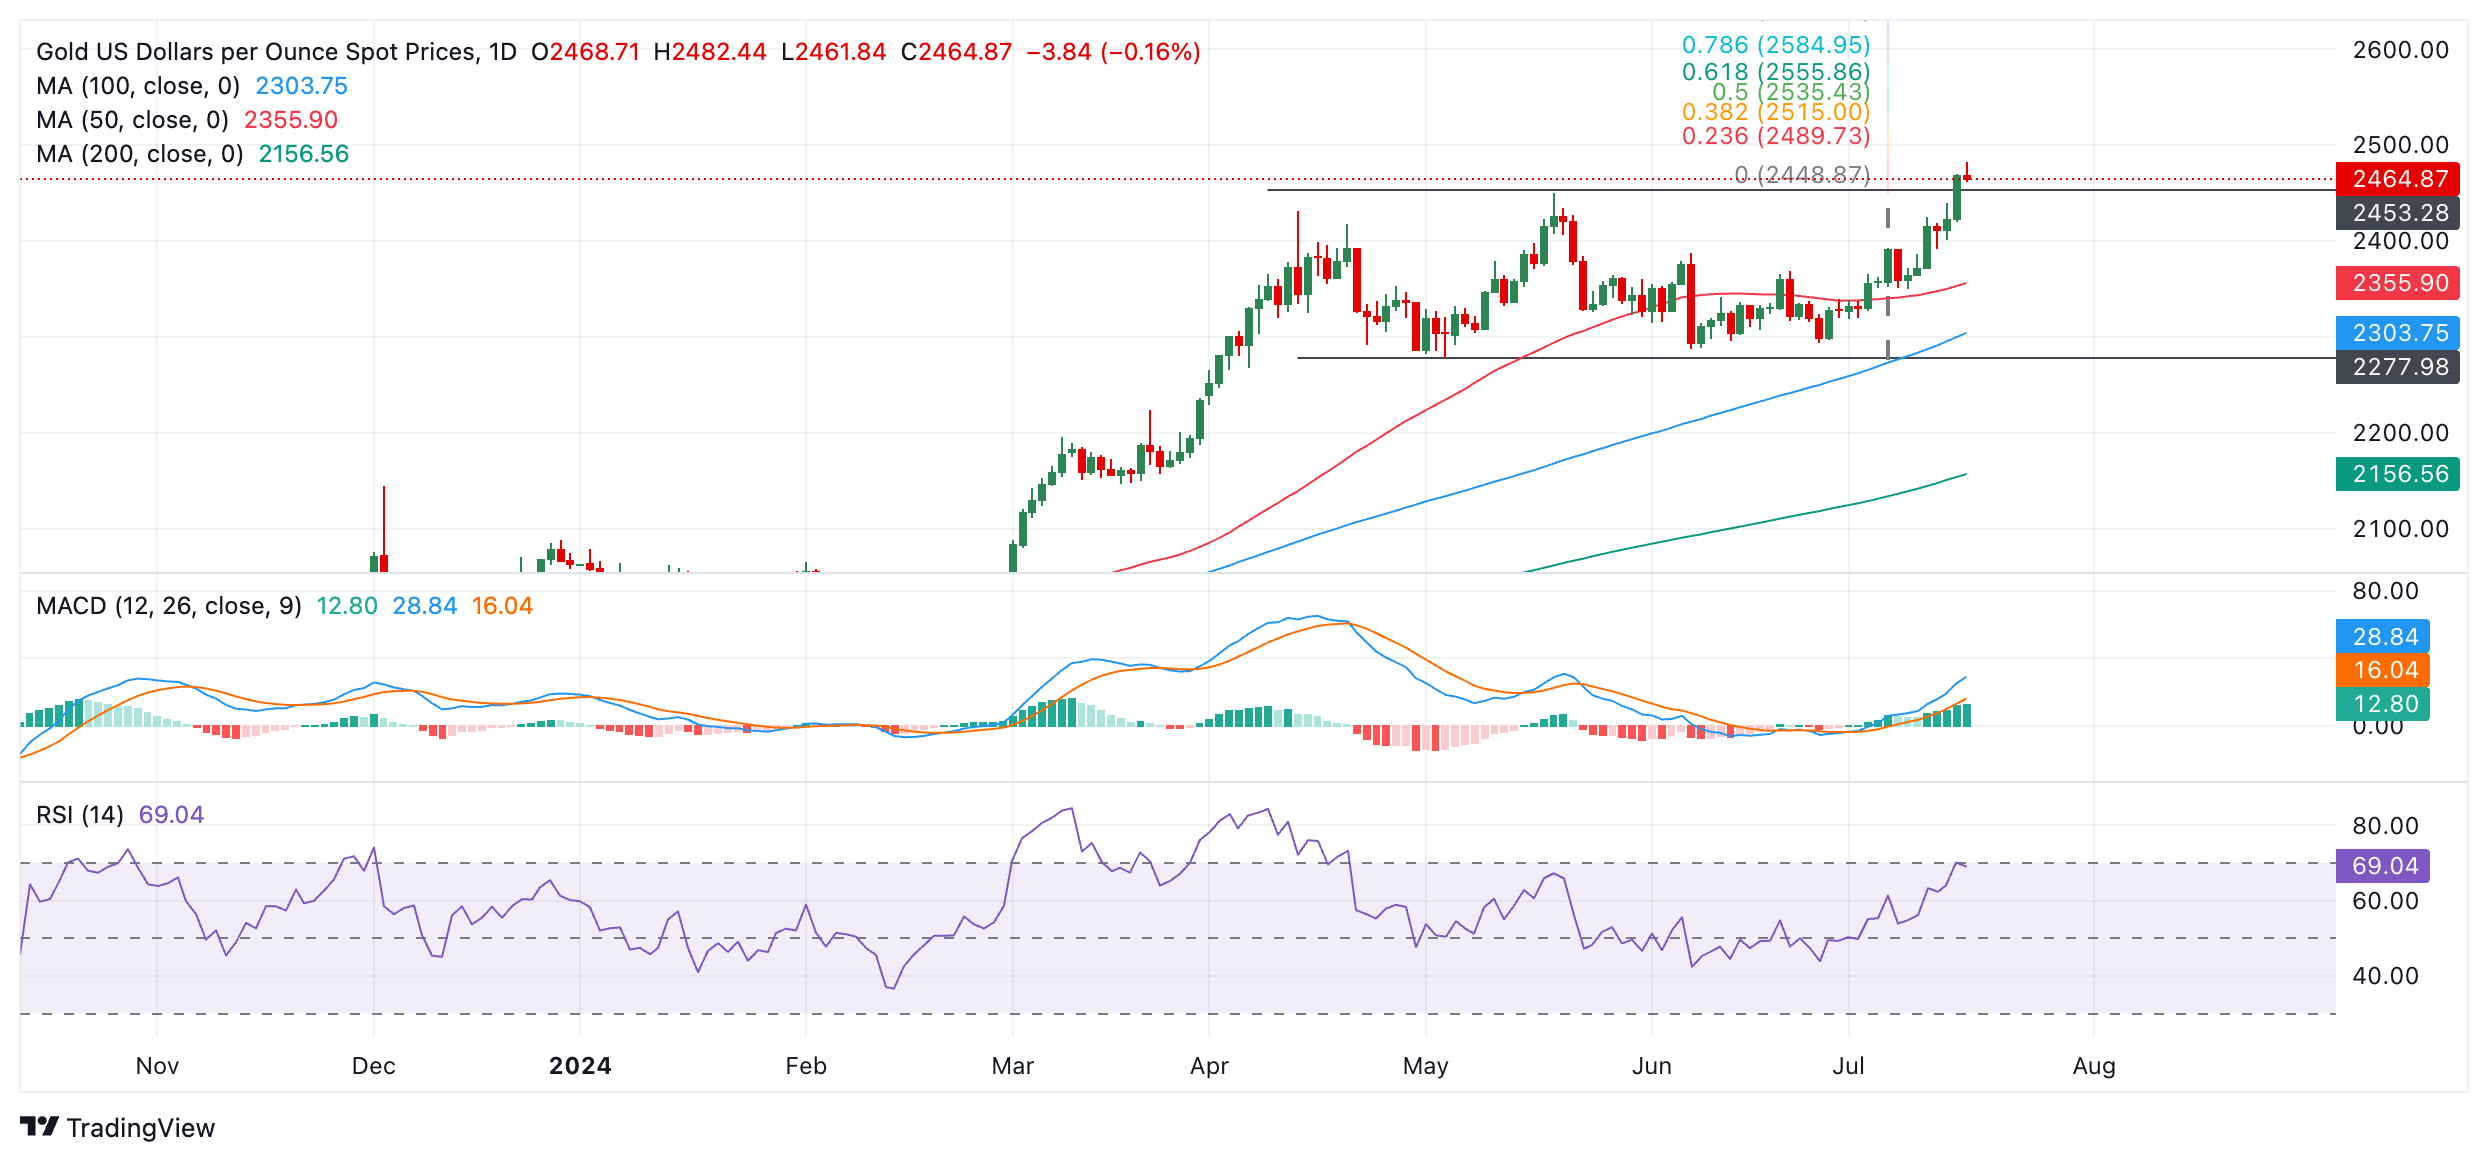
The decisive break above the $2,451 high unlocked Gold’s next upside target of $2,555, calculated by extrapolating the 0.618 Fibonacci ratio of the height of the range higher.
Gold FAQs
Gold has played a key role in human’s history as it has been widely used as a store of value and medium of exchange. Currently, apart from its shine and usage for jewelry, the precious metal is widely seen as a safe-haven asset, meaning that it is considered a good investment during turbulent times. Gold is also widely seen as a hedge against inflation and against depreciating currencies as it doesn’t rely on any specific issuer or government.
Central banks are the biggest Gold holders. In their aim to support their currencies in turbulent times, central banks tend to diversify their reserves and buy Gold to improve the perceived strength of the economy and the currency. High Gold reserves can be a source of trust for a country’s solvency. Central banks added 1,136 tonnes of Gold worth around $70 billion to their reserves in 2022, according to data from the World Gold Council. This is the highest yearly purchase since records began. Central banks from emerging economies such as China, India and Turkey are quickly increasing their Gold reserves.
Gold has an inverse correlation with the US Dollar and US Treasuries, which are both major reserve and safe-haven assets. When the Dollar depreciates, Gold tends to rise, enabling investors and central banks to diversify their assets in turbulent times. Gold is also inversely correlated with risk assets. A rally in the stock market tends to weaken Gold price, while sell-offs in riskier markets tend to favor the precious metal.
The price can move due to a wide range of factors. Geopolitical instability or fears of a deep recession can quickly make Gold price escalate due to its safe-haven status. As a yield-less asset, Gold tends to rise with lower interest rates, while higher cost of money usually weighs down on the yellow metal. Still, most moves depend on how the US Dollar (USD) behaves as the asset is priced in dollars (XAU/USD). A strong Dollar tends to keep the price of Gold controlled, whereas a weaker Dollar is likely to push Gold prices up.
- USD/CAD faces challenges as the commodity-linked CAD struggles due to lower Oil prices.
- WTI Oil price depreciates due to a slowing Chinese economy but its downside could be limited by lower US Oil stockpiles.
- Traders await speeches from Fed officials Thomas Barkin and Christopher Waller on Wednesday.
USD/CAD retraces its recent losses from the previous session, trading around 1.3680 during the early European hours on Wednesday. Lower crude Oil prices put pressure on the commodity-linked Canadian Dollar (CAD). Given the fact that Canada is the biggest Oil exporter to the United States (US).
West Texas Intermediate (WTI) Oil price trades around $79.80 per barrel at the time of writing. This decline is attributed to a slowing Chinese economy, which is reducing demand in the world's largest Oil-importing country.
However, the Oil price may limit its downside due to the declining US Oil stockpiles. The American Petroleum Institute (API) reported a decline of 4.4 million barrels in weekly crude Oil stock for the week ending July 12. Analysts surveyed by Reuters had estimated a smaller decrease of 33,000 barrels. The US Energy Information Administration will release its official storage report later in the North American session.
On Tuesday, data showed that Canada's headline inflation rate eased to 2.7% in June, down from 2.9% in the previous month. This aligned with expectations and marked the sixth consecutive month within the Bank of Canada's (BoC) target range.
The softer Canadian inflation readings have spurred expectations that the Bank of Canada (BoC) would cut interest rates further next week. "The inflation data for June gave the Bank of Canada what it needed in order to cut interest rates at next week's meeting," said Katherine Judge, senior economist at CIBC Capital Markets.
Federal Reserve (Fed) Board of Governors member Dr. Adriana Kugler recently noted that while inflationary pressures have eased, the Fed requires more data to justify a rate cut. Dr. Kugler suggested that if upcoming data fails to show progress towards the 2% inflation target, maintaining current rates longer may be appropriate.
Market focus turns to key US economic data and the Fed Beige Book on Wednesday, alongside speeches from Fed officials Thomas Barkin and Christopher Waller.
Canadian Dollar FAQs
The key factors driving the Canadian Dollar (CAD) are the level of interest rates set by the Bank of Canada (BoC), the price of Oil, Canada’s largest export, the health of its economy, inflation and the Trade Balance, which is the difference between the value of Canada’s exports versus its imports. Other factors include market sentiment – whether investors are taking on more risky assets (risk-on) or seeking safe-havens (risk-off) – with risk-on being CAD-positive. As its largest trading partner, the health of the US economy is also a key factor influencing the Canadian Dollar.
The Bank of Canada (BoC) has a significant influence on the Canadian Dollar by setting the level of interest rates that banks can lend to one another. This influences the level of interest rates for everyone. The main goal of the BoC is to maintain inflation at 1-3% by adjusting interest rates up or down. Relatively higher interest rates tend to be positive for the CAD. The Bank of Canada can also use quantitative easing and tightening to influence credit conditions, with the former CAD-negative and the latter CAD-positive.
The price of Oil is a key factor impacting the value of the Canadian Dollar. Petroleum is Canada’s biggest export, so Oil price tends to have an immediate impact on the CAD value. Generally, if Oil price rises CAD also goes up, as aggregate demand for the currency increases. The opposite is the case if the price of Oil falls. Higher Oil prices also tend to result in a greater likelihood of a positive Trade Balance, which is also supportive of the CAD.
While inflation had always traditionally been thought of as a negative factor for a currency since it lowers the value of money, the opposite has actually been the case in modern times with the relaxation of cross-border capital controls. Higher inflation tends to lead central banks to put up interest rates which attracts more capital inflows from global investors seeking a lucrative place to keep their money. This increases demand for the local currency, which in Canada’s case is the Canadian Dollar.
Macroeconomic data releases gauge the health of the economy and can have an impact on the Canadian Dollar. Indicators such as GDP, Manufacturing and Services PMIs, employment, and consumer sentiment surveys can all influence the direction of the CAD. A strong economy is good for the Canadian Dollar. Not only does it attract more foreign investment but it may encourage the Bank of Canada to put up interest rates, leading to a stronger currency. If economic data is weak, however, the CAD is likely to fall.
Here is what you need to know on Wednesday, July 17:
While the trading action in major currency pairs remained subdued, Gold climbed toward $2,500 and reached a new all-time high early Wednesday. Eurostat will release revisions to June inflation data and the US economic calendar will feature Housing Starts, Building Permits and Industrial Production data for June. Market participants will continue to pay close attention to comments from central bank officials.
The UK's Office for National Statistics reported in the European morning that annual inflation, as measured by the change in the Consumer Price Index (CPI), held steady at 2% in June. The core CPI rose 3.5% in the same period, while the Retail Price Index increased 2.9%. All these figures came in line with analysts' estimates. GBP/USD edged slightly higher but remained below 1.3000 with the immediate reaction.
Following Monday's modest rebound, the US Dollar (USD) Index closed flat on Tuesday after meeting resistance near 104.50. The USD Index inches lower early Wednesday but manages to hold above 104.00. In the meantime, the benchmark 10-year US Treasury bond yield stays below 4.2% following Tuesday's sharp decline and US stock index futures trade in negative territory.
US Dollar PRICE This week
The table below shows the percentage change of US Dollar (USD) against listed major currencies this week. US Dollar was the weakest against the Japanese Yen.
| USD | EUR | GBP | JPY | CAD | AUD | NZD | CHF | |
|---|---|---|---|---|---|---|---|---|
| USD | 0.03% | -0.02% | -0.35% | 0.28% | 0.73% | 0.59% | -0.16% | |
| EUR | -0.03% | -0.01% | -0.19% | 0.45% | 0.74% | 0.75% | 0.00% | |
| GBP | 0.02% | 0.00% | -0.08% | 0.45% | 0.75% | 0.71% | 0.01% | |
| JPY | 0.35% | 0.19% | 0.08% | 0.63% | 0.86% | 0.90% | -0.00% | |
| CAD | -0.28% | -0.45% | -0.45% | -0.63% | 0.38% | 0.30% | -0.44% | |
| AUD | -0.73% | -0.74% | -0.75% | -0.86% | -0.38% | 0.00% | -0.73% | |
| NZD | -0.59% | -0.75% | -0.71% | -0.90% | -0.30% | -0.01% | -0.75% | |
| CHF | 0.16% | -0.00% | -0.01% | 0.00% | 0.44% | 0.73% | 0.75% |
The heat map shows percentage changes of major currencies against each other. The base currency is picked from the left column, while the quote currency is picked from the top row. For example, if you pick the US Dollar from the left column and move along the horizontal line to the Japanese Yen, the percentage change displayed in the box will represent USD (base)/JPY (quote).
Gold benefited from falling US T-bond yields on Tuesday and closed near $2,470. XAU/USD preserved its bullish momentum in the Asian session on Wednesday and reached a new all-time high above $2,480 before retreating below $2,470 by the European morning.
USD/CAD advanced to a two-week-high above 1.3700 in the early American session on Tuesday after the data from Canada showed that the annual CPI inflation softened to 2.7% in June from 2.9% in May. The pair, however, failed to gather further bullish momentum and closed the day modestly lower below 1.3700. In the European morning on Wednesday, USD/CAD fluctuates at around 1.3680.
The CPI in New Zealand rose 3.3% on a yearly basis in the second quarter. This reading followed the 4% increase recorded in the first quarter and came in below the market expectation of 3.5%. Despite the soft inflation data, NZD/USD trades in positive territory above 0.6050.
EUR/USD fluctuated in a narrow channel on Tuesday and closed the day little changed. The pair holds steady at around 1.0900 in the European morning on Wednesday.
Inflation FAQs
Inflation measures the rise in the price of a representative basket of goods and services. Headline inflation is usually expressed as a percentage change on a month-on-month (MoM) and year-on-year (YoY) basis. Core inflation excludes more volatile elements such as food and fuel which can fluctuate because of geopolitical and seasonal factors. Core inflation is the figure economists focus on and is the level targeted by central banks, which are mandated to keep inflation at a manageable level, usually around 2%.
The Consumer Price Index (CPI) measures the change in prices of a basket of goods and services over a period of time. It is usually expressed as a percentage change on a month-on-month (MoM) and year-on-year (YoY) basis. Core CPI is the figure targeted by central banks as it excludes volatile food and fuel inputs. When Core CPI rises above 2% it usually results in higher interest rates and vice versa when it falls below 2%. Since higher interest rates are positive for a currency, higher inflation usually results in a stronger currency. The opposite is true when inflation falls.
Although it may seem counter-intuitive, high inflation in a country pushes up the value of its currency and vice versa for lower inflation. This is because the central bank will normally raise interest rates to combat the higher inflation, which attract more global capital inflows from investors looking for a lucrative place to park their money.
Formerly, Gold was the asset investors turned to in times of high inflation because it preserved its value, and whilst investors will often still buy Gold for its safe-haven properties in times of extreme market turmoil, this is not the case most of the time. This is because when inflation is high, central banks will put up interest rates to combat it. Higher interest rates are negative for Gold because they increase the opportunity-cost of holding Gold vis-a-vis an interest-bearing asset or placing the money in a cash deposit account. On the flipside, lower inflation tends to be positive for Gold as it brings interest rates down, making the bright metal a more viable investment alternative.
- EUR/GBP loses ground around 0.8390 in Wednesday’s European session, down 0.13% on the day.
- Traders trim the BoE rate cut bets for August after the UK CPI inflation data.
- The Eurozone HICP inflation data is due later on Thursday, which is expected to show an increase of 0.2% MoM in June.
The EUR/GBP cross trades on a weaker note near 0.8390 during the early European session on Thursday. The Pound Sterling (GBP) attracts some buyers after the UK Consumer Price Index (CPI) for June. Traders will shift their attention to the Eurozone Harmonized Index of Consumer Prices (HICP) inflation data, which is due later in the day.
Data released from the Office for National Statistics (ONS) on Wednesday showed that UK CPI increased 2.0% YoY in June, compared to the previous reading of 2.0%. The market consensus was for 2.0% growth. Meanwhile, the Core CPI, excluding volatile food and energy items) rose 3.5% YoY in June, at the same pace as in May while beating the market estimation. On a monthly basis, the UK CPI increased by 0.1% MoM in June, compared to a 0.3% rise in May and the expected 0.1%.
This CPI inflation report indicated that inflation in the United Kingdom might be stickier, triggering traders to lower their bets on BoE rate cuts for August. This, in turn, lifts the Cable and creates a headwind for EUR/GBP. The financial markets are pricing in nearly 35% odds for a move in August, down from 49% before the inflation data. Also, market players are still seeing 48 basis points (bps) of rate cuts by year-end, down from 50 bps earlier.
On the Euro front, the Eurozone HICP is expected to show an increase of 0.2% MoM in June, while the annual figure is estimated to rise 2.5%. Finally, Eurozone core HICP inflation is projected to remain steady at 2.9%. The hotter-than-expected inflation report in the Eurozone might underpin the EUR and cap the downside for the cross.
Inflation FAQs
Inflation measures the rise in the price of a representative basket of goods and services. Headline inflation is usually expressed as a percentage change on a month-on-month (MoM) and year-on-year (YoY) basis. Core inflation excludes more volatile elements such as food and fuel which can fluctuate because of geopolitical and seasonal factors. Core inflation is the figure economists focus on and is the level targeted by central banks, which are mandated to keep inflation at a manageable level, usually around 2%.
The Consumer Price Index (CPI) measures the change in prices of a basket of goods and services over a period of time. It is usually expressed as a percentage change on a month-on-month (MoM) and year-on-year (YoY) basis. Core CPI is the figure targeted by central banks as it excludes volatile food and fuel inputs. When Core CPI rises above 2% it usually results in higher interest rates and vice versa when it falls below 2%. Since higher interest rates are positive for a currency, higher inflation usually results in a stronger currency. The opposite is true when inflation falls.
Although it may seem counter-intuitive, high inflation in a country pushes up the value of its currency and vice versa for lower inflation. This is because the central bank will normally raise interest rates to combat the higher inflation, which attract more global capital inflows from investors looking for a lucrative place to park their money.
Formerly, Gold was the asset investors turned to in times of high inflation because it preserved its value, and whilst investors will often still buy Gold for its safe-haven properties in times of extreme market turmoil, this is not the case most of the time. This is because when inflation is high, central banks will put up interest rates to combat it. Higher interest rates are negative for Gold because they increase the opportunity-cost of holding Gold vis-a-vis an interest-bearing asset or placing the money in a cash deposit account. On the flipside, lower inflation tends to be positive for Gold as it brings interest rates down, making the bright metal a more viable investment alternative.
- The Pound Sterling flexes muscles against its major peers as the UK CPI report for June turned out sticky.
- UK service inflation, a key metric for BoE policymakers for decision-making on interest rates, rose steadily to 5.7%.
- Better-than-expected US Retail Sales report for June failed to impact firm Fed rate-cut bets.
The Pound Sterling (GBP) exhibits strength in Wednesday’s London session as the United Kingdom (UK) Office for National Statistics (ONS) has reported stubborn Consumer Price Index (CPI) data for June.
The CPI report showed that annual headline and core inflation, which excludes volatile food and energy items, rose steadily to 2.0% and 3.5%, respectively. Inflation in the service sector, which has remained a key factor in refraining Bank of England (BoE) policymakers from favoring a move to policy normalization, has remained sticky at 5.7%. On month, the headline inflation rose at a slower pace of 0.1%, as expected, from May’s reading of 0.3%.
BoE officials will likely hesitate to support the unwinding of the restrictive monetary policy stance due to sticky price pressures. Policymakers have been showing concerns about stubborn inflationary pressures in the service sector.
A stubborn UK CPI report would also diminish market speculation that the BoE will start reducing interest rates from the August meeting.
The next trigger for the Pound Sterling will be the employment data for the three-months ending in May. Economists expect the ILO Unemployment Rate to remain steady at 4.4%. The Average Earnings data, both Including and Excluding bonuses, a key measure of wage growth, is expected to have decelerated to 5.7%. Signs of easing wage growth momentum would be favorable for market expectations of BoE rate cuts.
Daily digest market movers: Pound Sterling grips gains against US Dollar, UK employment in focus
- The Pound Sterling holds strength against the US Dollar (USD) near the psychological resistance of 1.3000. The US Dollar remains on the back foot even though the United States (US) Census Bureau reported better-than-expected Retail Sales data for June on Tuesday.
- Monthly Retail Sales remained unchanged, as expected, as higher receipts for core goods offset weak demand for automobiles. Also, May’s reading was revised higher to 0.3% from 0.1%. The Retail Sales data has slightly improved the economic outlook but cannot weigh on firm market speculation that the Federal Reserve (Fed) will start reducing interest rates from the September meeting.
- According to the CME FedWatch tool, 30-day Federal Funds futures pricing data shows that an interest rate cut in September is a done deal. The tool also shows that traders have priced in two or three rate cuts this year against one forecasted by Fed officials in the latest dot plot.
- Higher expectations for Fed rate cuts in September were boosted by the softer-than-expected CPI report for June, which signaled that the disinflation process resumed in the second quarter after stalling in the first one. Also, easing labor market conditions fuelled rate-cut prospects.
Technical Analysis: Pound Sterling gathers strength to break above 1.3000
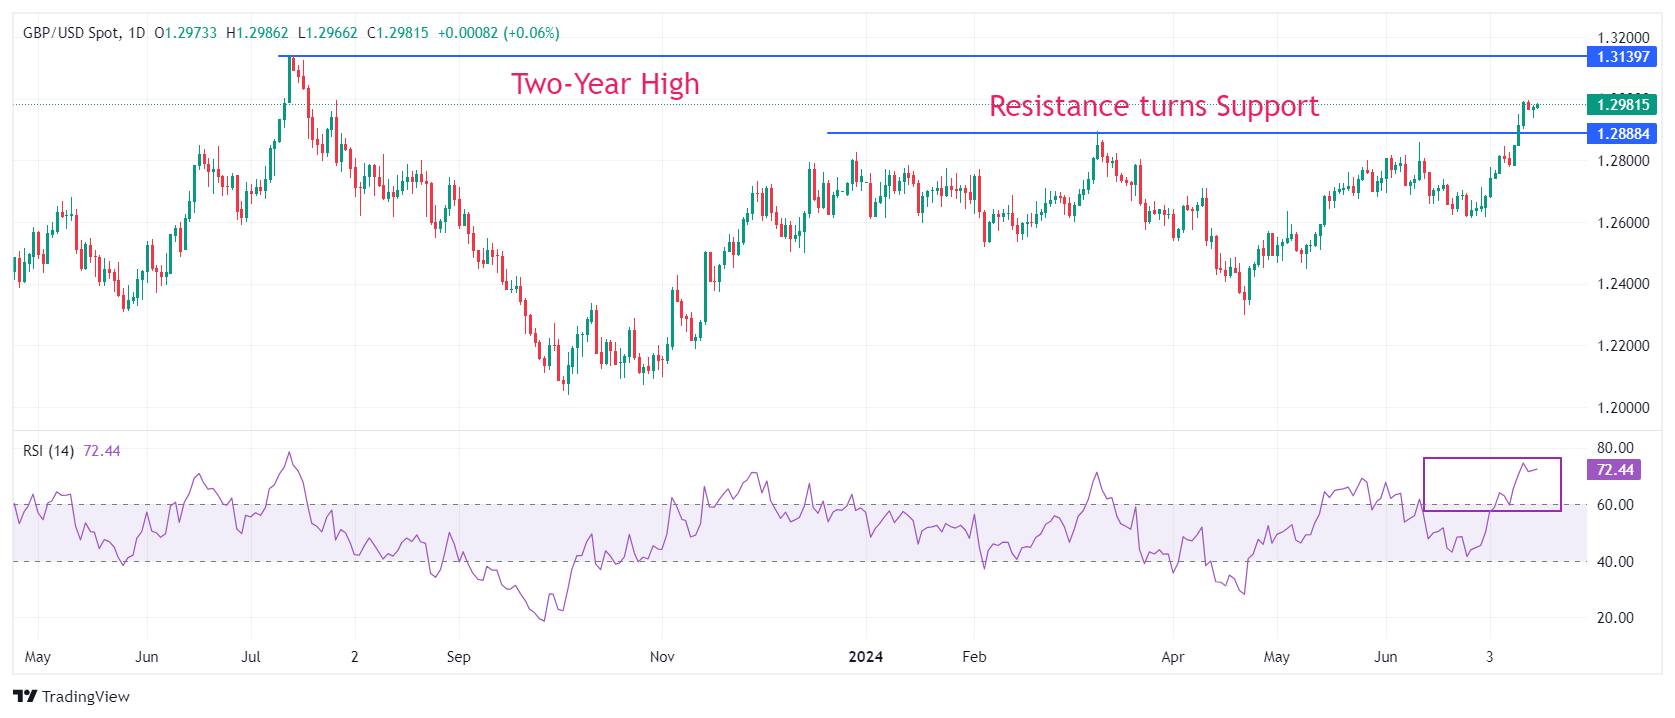
The Pound Sterling clings to gains near 1.3000 against the US Dollar. The near-term outlook of the GBP/USD pair has strengthened as it holds the key support of the March 8 high near 1.2900, which used to be a resistance. The major is expected to extend its upside towards a two-year high near 1.3140.
All short-to-long-term Exponential Moving Averages (EMAs) are sloping higher, suggesting a strong bullish trend.
The 14-period Relative Strength Index (RSI) jumps to near 70.00 for the first time in more than a year, indicating a strong momentum towards the upside.
Pound Sterling FAQs
The Pound Sterling (GBP) is the oldest currency in the world (886 AD) and the official currency of the United Kingdom. It is the fourth most traded unit for foreign exchange (FX) in the world, accounting for 12% of all transactions, averaging $630 billion a day, according to 2022 data. Its key trading pairs are GBP/USD, aka ‘Cable’, which accounts for 11% of FX, GBP/JPY, or the ‘Dragon’ as it is known by traders (3%), and EUR/GBP (2%). The Pound Sterling is issued by the Bank of England (BoE).
The single most important factor influencing the value of the Pound Sterling is monetary policy decided by the Bank of England. The BoE bases its decisions on whether it has achieved its primary goal of “price stability” – a steady inflation rate of around 2%. Its primary tool for achieving this is the adjustment of interest rates. When inflation is too high, the BoE will try to rein it in by raising interest rates, making it more expensive for people and businesses to access credit. This is generally positive for GBP, as higher interest rates make the UK a more attractive place for global investors to park their money. When inflation falls too low it is a sign economic growth is slowing. In this scenario, the BoE will consider lowering interest rates to cheapen credit so businesses will borrow more to invest in growth-generating projects.
Data releases gauge the health of the economy and can impact the value of the Pound Sterling. Indicators such as GDP, Manufacturing and Services PMIs, and employment can all influence the direction of the GBP. A strong economy is good for Sterling. Not only does it attract more foreign investment but it may encourage the BoE to put up interest rates, which will directly strengthen GBP. Otherwise, if economic data is weak, the Pound Sterling is likely to fall.
Another significant data release for the Pound Sterling is the Trade Balance. This indicator measures the difference between what a country earns from its exports and what it spends on imports over a given period. If a country produces highly sought-after exports, its currency will benefit purely from the extra demand created from foreign buyers seeking to purchase these goods. Therefore, a positive net Trade Balance strengthens a currency and vice versa for a negative balance.
- EUR/JPY drifts lower around 172.45 in Wednesday’s Asian session.
- The cross maintains the negative stance below the 100-period EMA on the 4-hour chart, with bearish RSI indicators.
- The first upside barrier will emerge at 172.75; the initial support level is located at 171.82.
The EUR/JPY cross weakens near 172.45 on Wednesday during the early European session. The cross edges lower as traders turn cautious ahead of the release of the Eurozone Harmonized Index of Consumer Prices (HICP) for June. The attention will shift to the European Central Bank (ECB) interest rate decision on Thursday, with no change in rates expected.
According to the 4-hour chart, the bearish outlook of EUR/JPY remains intact as the cross holds below the key 100-period Exponential Moving Averages (EMA). The cross could resume its upside if it can break above the 100-period EMA at 172.75. Meanwhile, the Relative Strength Index (RSI) stands in the bearish zone around 42.15, suggesting that the path of least resistance is to the downside.
The first upside barrier for the cross will emerge at 172.75, the 100-period EMA. Further north, the next hurdle is seen at 173.21, the upper boundary of the Bollinger Band. Extended gains will see a rally to 173.80, a low of July 4.
On the downside, the initial support level for the cross is located at 171.82, the lower limit of the Bollinger Band. The additional downside filter to watch is 170.85, a low of June 26. The crucial contention level will emerge at the 170.00 psychological level.
EUR/JPY 4-hour chart
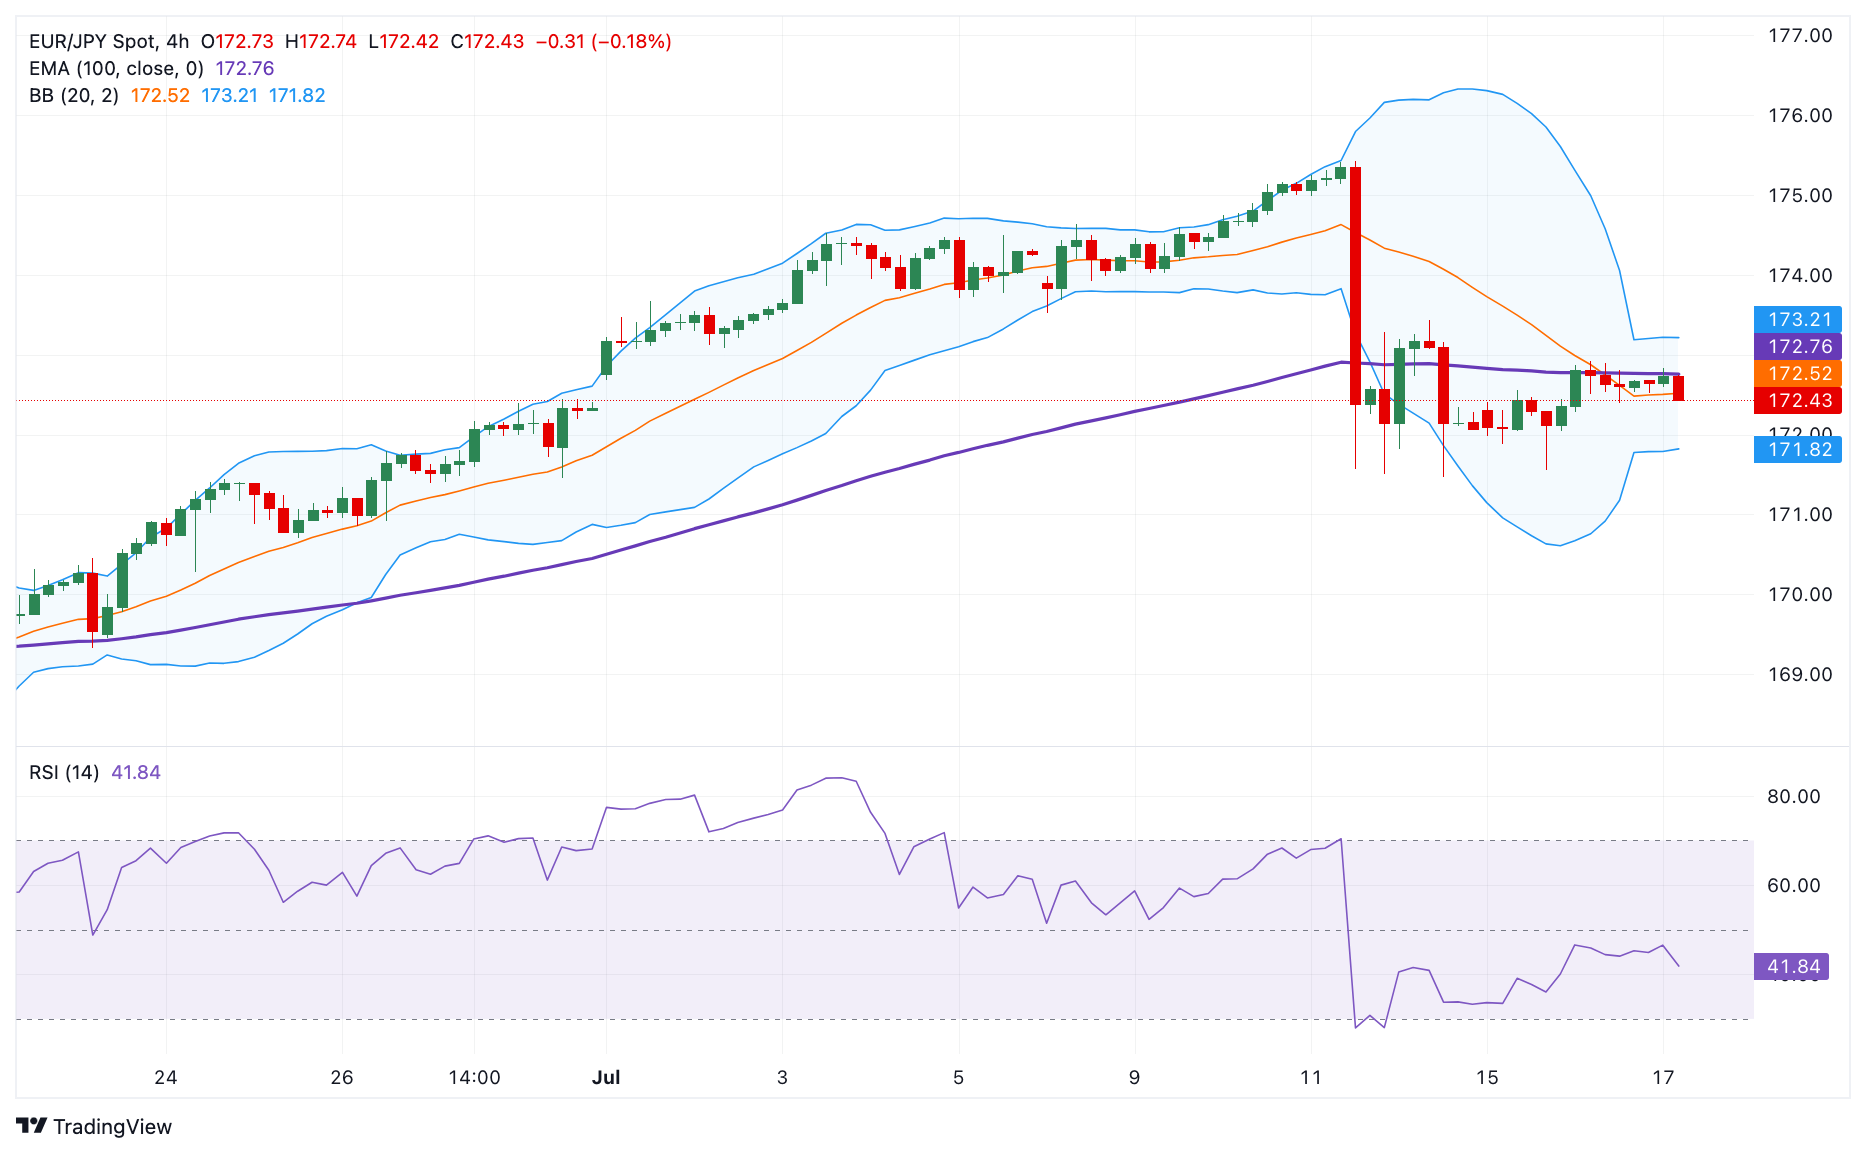
Euro FAQs
The Euro is the currency for the 20 European Union countries that belong to the Eurozone. It is the second most heavily traded currency in the world behind the US Dollar. In 2022, it accounted for 31% of all foreign exchange transactions, with an average daily turnover of over $2.2 trillion a day. EUR/USD is the most heavily traded currency pair in the world, accounting for an estimated 30% off all transactions, followed by EUR/JPY (4%), EUR/GBP (3%) and EUR/AUD (2%).
The European Central Bank (ECB) in Frankfurt, Germany, is the reserve bank for the Eurozone. The ECB sets interest rates and manages monetary policy. The ECB’s primary mandate is to maintain price stability, which means either controlling inflation or stimulating growth. Its primary tool is the raising or lowering of interest rates. Relatively high interest rates – or the expectation of higher rates – will usually benefit the Euro and vice versa. The ECB Governing Council makes monetary policy decisions at meetings held eight times a year. Decisions are made by heads of the Eurozone national banks and six permanent members, including the President of the ECB, Christine Lagarde.
Eurozone inflation data, measured by the Harmonized Index of Consumer Prices (HICP), is an important econometric for the Euro. If inflation rises more than expected, especially if above the ECB’s 2% target, it obliges the ECB to raise interest rates to bring it back under control. Relatively high interest rates compared to its counterparts will usually benefit the Euro, as it makes the region more attractive as a place for global investors to park their money.
Data releases gauge the health of the economy and can impact on the Euro. Indicators such as GDP, Manufacturing and Services PMIs, employment, and consumer sentiment surveys can all influence the direction of the single currency. A strong economy is good for the Euro. Not only does it attract more foreign investment but it may encourage the ECB to put up interest rates, which will directly strengthen the Euro. Otherwise, if economic data is weak, the Euro is likely to fall. Economic data for the four largest economies in the euro area (Germany, France, Italy and Spain) are especially significant, as they account for 75% of the Eurozone’s economy.
Another significant data release for the Euro is the Trade Balance. This indicator measures the difference between what a country earns from its exports and what it spends on imports over a given period. If a country produces highly sought after exports then its currency will gain in value purely from the extra demand created from foreign buyers seeking to purchase these goods. Therefore, a positive net Trade Balance strengthens a currency and vice versa for a negative balance.
FX option expiries for July 17 NY cut at 10:00 Eastern Time, via DTCC, can be found below.
EUR/USD: EUR amounts
- 1.0850 803m
- 1.0900 712m
- 1.0925 453m
USD/JPY: USD amounts
- 157.05 751m
- 158.50 1.3b
USD/CHF: USD amounts
- 0.8800 450m
- 0.8850 500m
AUD/USD: AUD amounts
- 0.6650 454m
- 0.6700 409m
Gold prices remained broadly unchanged in India on Wednesday, according to data compiled by FXStreet.
The price for Gold stood at 6,632.35 Indian Rupees (INR) per gram, broadly stable compared with the INR 6,631.62 it cost on Tuesday.
The price for Gold was broadly steady at INR 77,359.02 per tola from INR 77,349.94 per tola a day earlier.
| Unit measure | Gold Price in INR |
|---|---|
| 1 Gram | 6,632.35 |
| 10 Grams | 66,324.01 |
| Tola | 77,359.02 |
| Troy Ounce | 206,289.20 |
FXStreet calculates Gold prices in India by adapting international prices (USD/INR) to the local currency and measurement units. Prices are updated daily based on the market rates taken at the time of publication. Prices are just for reference and local rates could diverge slightly.
Gold FAQs
Gold has played a key role in human’s history as it has been widely used as a store of value and medium of exchange. Currently, apart from its shine and usage for jewelry, the precious metal is widely seen as a safe-haven asset, meaning that it is considered a good investment during turbulent times. Gold is also widely seen as a hedge against inflation and against depreciating currencies as it doesn’t rely on any specific issuer or government.
Central banks are the biggest Gold holders. In their aim to support their currencies in turbulent times, central banks tend to diversify their reserves and buy Gold to improve the perceived strength of the economy and the currency. High Gold reserves can be a source of trust for a country’s solvency. Central banks added 1,136 tonnes of Gold worth around $70 billion to their reserves in 2022, according to data from the World Gold Council. This is the highest yearly purchase since records began. Central banks from emerging economies such as China, India and Turkey are quickly increasing their Gold reserves.
Gold has an inverse correlation with the US Dollar and US Treasuries, which are both major reserve and safe-haven assets. When the Dollar depreciates, Gold tends to rise, enabling investors and central banks to diversify their assets in turbulent times. Gold is also inversely correlated with risk assets. A rally in the stock market tends to weaken Gold price, while sell-offs in riskier markets tend to favor the precious metal.
The price can move due to a wide range of factors. Geopolitical instability or fears of a deep recession can quickly make Gold price escalate due to its safe-haven status. As a yield-less asset, Gold tends to rise with lower interest rates, while higher cost of money usually weighs down on the yellow metal. Still, most moves depend on how the US Dollar (USD) behaves as the asset is priced in dollars (XAU/USD). A strong Dollar tends to keep the price of Gold controlled, whereas a weaker Dollar is likely to push Gold prices up.
(An automation tool was used in creating this post.)
- USD/CHF holds steady as market participants await speeches from Fed members.
- Fed member Kugler indicated rates will be maintained longer if upcoming data does not confirm a slowdown in inflation.
- Swiss 10-year bond yield declined to near 0.54%, nearing its lowest level since August 2022.
USD/CHF holds ground near 0.8940 during the Asian session on Wednesday. The USD/CHF pair may receive support from a modest rebound in the US Dollar (USD), which is likely influenced by improved Treasury yields.
Federal Reserve (Fed) Board of Governors member Dr. Adriana Kugler recently noted that while inflationary pressures have eased, the Fed requires more data to justify a rate cut. Dr. Kugler suggested that if upcoming data fails to show progress towards the 2% inflation target, maintaining current rates longer may be appropriate.
Market focus turns to key US economic data and the Fed Beige Book on Wednesday, alongside speeches from Fed officials Thomas Barkin and Christopher Waller. On the Swiss front, attention will shift to Trade Balance data due on Thursday.
On the Swiss front, the 10-year government bond yield further declined to near 0.54%, nearing its lowest level since August 2022, reflecting a similar trend seen in US bond yields. This movement followed remarks from Federal Reserve Chair Jerome Powell, which bolstered expectations for a rate cut by the Fed in September.
Fed Chair Powell, on Monday, indicated that recent US inflation data "add somewhat to confidence" that inflation is progressing towards the Fed’s target sustainably, implying that a move towards interest rate cuts could be forthcoming.
The Swiss National Bank (SNB) reduced its key interest rate by 25 basis points for the second consecutive meeting in June. This decision was driven by subdued inflationary pressures and the resilience of the Swiss Franc (CHF).
Swiss Franc FAQs
The Swiss Franc (CHF) is Switzerland’s official currency. It is among the top ten most traded currencies globally, reaching volumes that well exceed the size of the Swiss economy. Its value is determined by the broad market sentiment, the country’s economic health or action taken by the Swiss National Bank (SNB), among other factors. Between 2011 and 2015, the Swiss Franc was pegged to the Euro (EUR). The peg was abruptly removed, resulting in a more than 20% increase in the Franc’s value, causing a turmoil in markets. Even though the peg isn’t in force anymore, CHF fortunes tend to be highly correlated with the Euro ones due to the high dependency of the Swiss economy on the neighboring Eurozone.
The Swiss Franc (CHF) is considered a safe-haven asset, or a currency that investors tend to buy in times of market stress. This is due to the perceived status of Switzerland in the world: a stable economy, a strong export sector, big central bank reserves or a longstanding political stance towards neutrality in global conflicts make the country’s currency a good choice for investors fleeing from risks. Turbulent times are likely to strengthen CHF value against other currencies that are seen as more risky to invest in.
The Swiss National Bank (SNB) meets four times a year – once every quarter, less than other major central banks – to decide on monetary policy. The bank aims for an annual inflation rate of less than 2%. When inflation is above target or forecasted to be above target in the foreseeable future, the bank will attempt to tame price growth by raising its policy rate. Higher interest rates are generally positive for the Swiss Franc (CHF) as they lead to higher yields, making the country a more attractive place for investors. On the contrary, lower interest rates tend to weaken CHF.
Macroeconomic data releases in Switzerland are key to assessing the state of the economy and can impact the Swiss Franc’s (CHF) valuation. The Swiss economy is broadly stable, but any sudden change in economic growth, inflation, current account or the central bank’s currency reserves have the potential to trigger moves in CHF. Generally, high economic growth, low unemployment and high confidence are good for CHF. Conversely, if economic data points to weakening momentum, CHF is likely to depreciate.
As a small and open economy, Switzerland is heavily dependent on the health of the neighboring Eurozone economies. The broader European Union is Switzerland’s main economic partner and a key political ally, so macroeconomic and monetary policy stability in the Eurozone is essential for Switzerland and, thus, for the Swiss Franc (CHF). With such dependency, some models suggest that the correlation between the fortunes of the Euro (EUR) and the CHF is more than 90%, or close to perfect.
- NZD/USD gains strong positive traction following the release of the NZ CPI on Wednesday.
- The risk-on mood and subdued USD price action provide an additional boost to the major.
- Bets for early RBNZ rate cuts and China’s economic woes keep a lid on any meaningful gains.
The NZD/USD pair stages a solid recovery from over a two-month low touched during the Asian session on Wednesday, albeit it lacks follow-through buying and remains below the 0.6100 round figure. Nevertheless, spot prices, for now, seem to have snapped a two-day losing streak and currently trade around the 0.6065 area, still up over 0.30% for the day.
Despite the softer-than-expected Consumer Price Index (CPI) released from New Zealand earlier today, non-tradable inflation pointed to persistent domestic pricing pressures and offered some support to the New Zealand Dollar (NZD). Apart from this, the upbeat market mood, which tends to benefit the risk-sensitive Kiwi, prompts some intraday short-covering move around the NZD/USD pair.
The US Dollar (USD), on the other hand, is undermined by expectations that the Federal Reserve (Fed) will start cutting interest rates in September. This, to a larger extent, overshadowed the better-than-expected US Retail Sales figures released on Tuesday and keeps the US Treasury bond yields depressed near a multi-month low, which undermines the buck and lends support to the NZD/USD pair.
Meanwhile, market participants brought forward the likely timing of interest rate cut by the Reserve Bank of New Zealand (RBNZ) in reaction to the weaker CPI report. Apart from this, China's economic woes, which tend to dent demand for antipodean currencies, including the Kiwi, further contribute to capping the upside for the NZD/USD pair and warrants some caution for bullish traders.
RBNZ FAQs
The Reserve Bank of New Zealand (RBNZ) is the country’s central bank. Its economic objectives are achieving and maintaining price stability – achieved when inflation, measured by the Consumer Price Index (CPI), falls within the band of between 1% and 3% – and supporting maximum sustainable employment.
The Reserve Bank of New Zealand’s (RBNZ) Monetary Policy Committee (MPC) decides the appropriate level of the Official Cash Rate (OCR) according to its objectives. When inflation is above target, the bank will attempt to tame it by raising its key OCR, making it more expensive for households and businesses to borrow money and thus cooling the economy. Higher interest rates are generally positive for the New Zealand Dollar (NZD) as they lead to higher yields, making the country a more attractive place for investors. On the contrary, lower interest rates tend to weaken NZD.
Employment is important for the Reserve Bank of New Zealand (RBNZ) because a tight labor market can fuel inflation. The RBNZ’s goal of “maximum sustainable employment” is defined as the highest use of labor resources that can be sustained over time without creating an acceleration in inflation. “When employment is at its maximum sustainable level, there will be low and stable inflation. However, if employment is above the maximum sustainable level for too long, it will eventually cause prices to rise more and more quickly, requiring the MPC to raise interest rates to keep inflation under control,” the bank says.
In extreme situations, the Reserve Bank of New Zealand (RBNZ) can enact a monetary policy tool called Quantitative Easing. QE is the process by which the RBNZ prints local currency and uses it to buy assets – usually government or corporate bonds – from banks and other financial institutions with the aim to increase the domestic money supply and spur economic activity. QE usually results in a weaker New Zealand Dollar (NZD). QE is a last resort when simply lowering interest rates is unlikely to achieve the objectives of the central bank. The RBNZ used it during the Covid-19 pandemic.
- GBP/JPY trades with mild gains around 205.50 in Wednesday’s Asian session.
- Investors will closely monitor the UK June CPI data on Wednesday.
- Japan’s Tankan Manufacturers Sentiment Index showed the first gain in four months, indicating a pickup in economic activity.
The GBP/JPY cross trades on a stronger note near 205.50 during the Asian session on Wednesday. The selling pressure around the Japanese Yen (JPY) provides some support to the cross. Traders will closely watch the UK Consumer Price Index (CPI) for June, which is due on Wednesday. This data could offer some insight into the UK interest rate path.
The encouraging UK growth numbers last week helped push back against the timing of the Bank of England’s (BoE) first rate cut. Meanwhile, BoE’s external member of the Monetary Policy Committee, Swati Dhingra, said on Monday that the central bank should cut the interest rate at its next meeting on 1 August to ease pressure on households and businesses. Dhingra, the most dovish member of the MPC, believes that inflation is unlikely to rise sharply again.
The UK CPI data will be in the spotlight later in the day. The UK CPI inflation is expected to tick down to 0.1% MoM in June from 0.3% in May, while annualized CPI inflation is expected to hold steady at 2.0% YoY. An upside surprise to the reading could push back against a rate cut next month and lift the Cable against the JPY.
On the other hand, further foreign exchange (FX) intervention from Japanese authorities might support the JPY and cap the upside for the cross. Data released on Tuesday showed that the Bank of Japan (BoJ) intervened in the FX market on two consecutive trading days last Thursday and Friday.
Furthermore, the recent data showed a pickup in economic activity in Japan. Japan’s Tankan Manufacturers Sentiment Index rose to 11.0 in July from 6.0 in June. This figure registered the first gain in four months.
Pound Sterling FAQs
The Pound Sterling (GBP) is the oldest currency in the world (886 AD) and the official currency of the United Kingdom. It is the fourth most traded unit for foreign exchange (FX) in the world, accounting for 12% of all transactions, averaging $630 billion a day, according to 2022 data. Its key trading pairs are GBP/USD, aka ‘Cable’, which accounts for 11% of FX, GBP/JPY, or the ‘Dragon’ as it is known by traders (3%), and EUR/GBP (2%). The Pound Sterling is issued by the Bank of England (BoE).
The single most important factor influencing the value of the Pound Sterling is monetary policy decided by the Bank of England. The BoE bases its decisions on whether it has achieved its primary goal of “price stability” – a steady inflation rate of around 2%. Its primary tool for achieving this is the adjustment of interest rates. When inflation is too high, the BoE will try to rein it in by raising interest rates, making it more expensive for people and businesses to access credit. This is generally positive for GBP, as higher interest rates make the UK a more attractive place for global investors to park their money. When inflation falls too low it is a sign economic growth is slowing. In this scenario, the BoE will consider lowering interest rates to cheapen credit so businesses will borrow more to invest in growth-generating projects.
Data releases gauge the health of the economy and can impact the value of the Pound Sterling. Indicators such as GDP, Manufacturing and Services PMIs, and employment can all influence the direction of the GBP. A strong economy is good for Sterling. Not only does it attract more foreign investment but it may encourage the BoE to put up interest rates, which will directly strengthen GBP. Otherwise, if economic data is weak, the Pound Sterling is likely to fall.
Another significant data release for the Pound Sterling is the Trade Balance. This indicator measures the difference between what a country earns from its exports and what it spends on imports over a given period. If a country produces highly sought-after exports, its currency will benefit purely from the extra demand created from foreign buyers seeking to purchase these goods. Therefore, a positive net Trade Balance strengthens a currency and vice versa for a negative balance.
- GBP/USD remains confined in a familiar range held since the beginning of this week.
- September Fed rate cut bets continue to undermine the USD and lend some support.
- Diminishing bets for the August BoE rate cut favor bulls ahead of the UK CPI report.
The GBP/USD pair extends its sideways consolidative price move for the third successive day on Wednesday and trades around the 1.2970 region during the Asian session. Spot prices, meanwhile, remain well within the striking distance of a one-year peak touched on Monday and the fundamental backdrop supports prospects for an extension of a two-week-old uptrend.
The US Dollar (USD) draws some support from the upbeat US Retail Sales data released on Tuesday, which pointed to consumer resilience and bolstered economic growth prospects for the second quarter. This, in turn, is seen as a key factor acting as a headwind for the GBP/USD pair as traders keenly await the crucial UK consumer inflation figures before positioning for the next leg of a directional move.
The headline UK CPI is expected to come in at 0.1% for June as compared to 0.3% in the previous month, while the yearly rate is anticipated to hold steady at 2.0% YoY. Heading into the key data risk, diminishing odds of a rate cut by the Bank of England (BoE) in August, especially after Britain's economy grew more quickly than expected in May, continues to lend some support to the British Pound (GBP) and the GBP/USD pair.
Meanwhile, the markets are now pricing in over a 90% chance that the Federal Reserve (Fed) will lower borrowing costs in September, which keeps the US Treasury bond yields depressed near a multi-month low and should cap the USD. This, in turn, validates the near-term positive outlook for the GBP/USD pair, suggesting that any immediate market reaction to the softer UK CPI report is more likely to be limited.
Economic Indicator
Consumer Price Index (YoY)
The United Kingdom (UK) Consumer Price Index (CPI), released by the Office for National Statistics on a monthly basis, is a measure of consumer price inflation – the rate at which the prices of goods and services bought by households rise or fall – produced to international standards. It is the inflation measure used in the government’s target. The YoY reading compares prices in the reference month to a year earlier. Generally, a high reading is seen as bullish for the Pound Sterling (GBP), while a low reading is seen as bearish.
Read more.Next release: Wed Jul 17, 2024 06:00
Frequency: Monthly
Consensus: 2%
Previous: 2%
Source: Office for National Statistics
The Bank of England is tasked with keeping inflation, as measured by the headline Consumer Price Index (CPI) at around 2%, giving the monthly release its importance. An increase in inflation implies a quicker and sooner increase of interest rates or the reduction of bond-buying by the BOE, which means squeezing the supply of pounds. Conversely, a drop in the pace of price rises indicates looser monetary policy. A higher-than-expected result tends to be GBP bullish.
- EUR/USD continues its upward momentum, supported by a bullish inclination observed in the daily chart analysis.
- The pair may encounter resistance near a four-month high at 1.0922.
- The lower boundary of the ascending channel around the 1.0870 level could serve as immediate support.
EUR/USD advances for the second consecutive day, trading around 1.0900 during Wednesday's Asian session. The analysis of the daily chart shows a bullish trend, as the pair remains within an ascending channel.
Moreover, the 14-day Relative Strength Index (RSI), a momentum indicator, is above the 50 level, further affirming the bullish sentiment for the EUR/USD pair. Continued upward momentum could strengthen the pair's bullish bias.
The EUR/USD pair approaches potential resistance near a four-month high at 1.0922, observed on July 15. Further resistance is anticipated around the psychological level of 1.1000, followed by the upper boundary of the ascending channel near 1.1020.
On the downside, initial support for the EUR/USD pair is expected near the lower boundary of the ascending channel around the 1.0870 level, which coincides with the nine-day Exponential Moving Average (EMA) at 1.0864.
A breach below this level could intensify downward pressure on the pair, targeting support around the key level of 1.0670, potentially serving as a throwback support level.
EUR/USD: Daily Chart
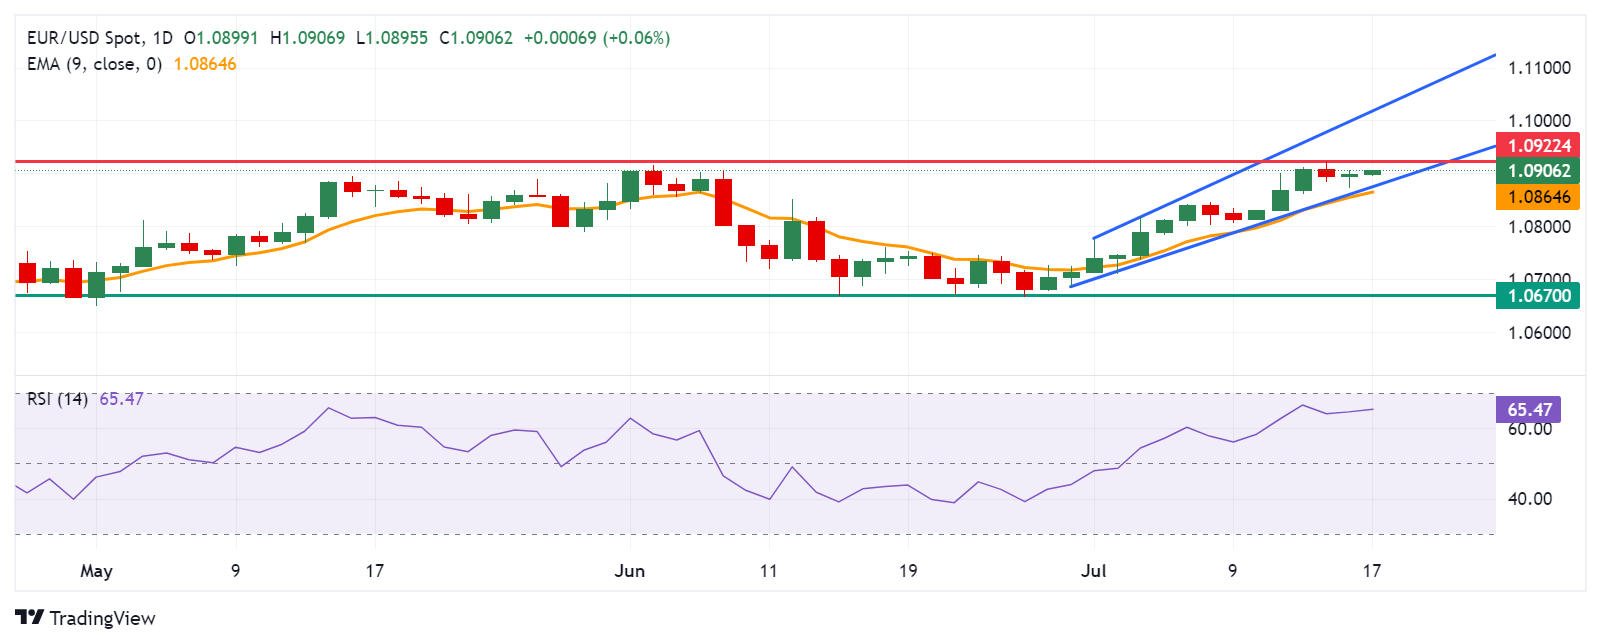
Euro PRICE Today
The table below shows the percentage change of Euro (EUR) against listed major currencies today. Euro was the strongest against the Swiss Franc.
| USD | EUR | GBP | JPY | CAD | AUD | NZD | CHF | |
|---|---|---|---|---|---|---|---|---|
| USD | -0.06% | -0.02% | 0.00% | -0.01% | -0.07% | -0.31% | 0.00% | |
| EUR | 0.06% | 0.06% | 0.07% | 0.06% | 0.02% | -0.27% | 0.08% | |
| GBP | 0.02% | -0.06% | 0.00% | 0.00% | -0.06% | -0.33% | 0.03% | |
| JPY | 0.00% | -0.07% | 0.00% | -0.02% | -0.07% | -0.34% | 0.02% | |
| CAD | 0.01% | -0.06% | 0.00% | 0.02% | -0.07% | -0.31% | 0.03% | |
| AUD | 0.07% | -0.02% | 0.06% | 0.07% | 0.07% | -0.25% | 0.09% | |
| NZD | 0.31% | 0.27% | 0.33% | 0.34% | 0.31% | 0.25% | 0.34% | |
| CHF | -0.00% | -0.08% | -0.03% | -0.02% | -0.03% | -0.09% | -0.34% |
The heat map shows percentage changes of major currencies against each other. The base currency is picked from the left column, while the quote currency is picked from the top row. For example, if you pick the Euro from the left column and move along the horizontal line to the US Dollar, the percentage change displayed in the box will represent EUR (base)/USD (quote).
The Reserve Bank of New Zealand (RBNZ) released its Sectoral Factor Model Inflation gauge for the second quarter of 2024, following the release of the official Consumer Price Index (CPI) by the NZ Stats early Wednesday.
The inflation measure dropped to 3.6% YoY in Q2 2024 vs. 4.2% in Q1.
The inflation measures are closely watched by the RBNZ, which has a monetary policy goal of achieving 1% to 3% inflation.
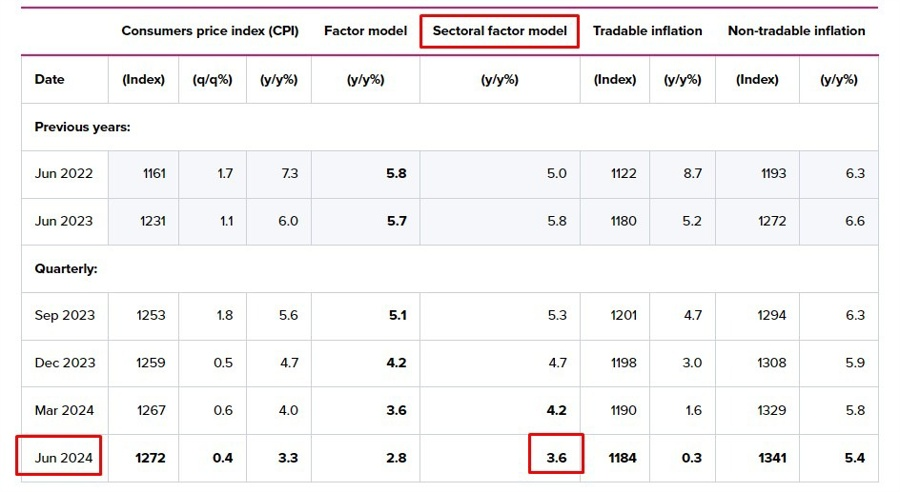
FX implications
The Kiwi Dollar holds its advance above 0.6050 after the RBNZ’s inflation data. At the time of writing, NZD/USD is adding 0.36% on the day to trade at 0.6066.
About the RBNZ Sectoral Factor Model Inflation
The Reserve Bank of New Zealand has a set of models that produce core inflation estimates. The sectoral factor model estimates a measure of core inflation based on co-movements - the extent to which individual price series move together. It takes a sectoral approach, estimating core inflation based on two sets of prices: prices of tradable items, which are those either imported or exposed to international competition, and prices of non-tradable items, which are those produced domestically and not facing competition from imports.
- The Japanese Yen loses ground as the US Dollar remains stable amid improved Treasury yields.
- The JPY could limit its downside as traders expect intervention by authorities.
- BoJ data showed that authorities entered the FX market on consecutive trading days last Thursday and Friday.
The Japanese Yen (JPY) extends its losses for the third consecutive session on Wednesday. The USD/JPY pair has received support from a modest rebound in the US Dollar (USD), which is likely influenced by improved Treasury yields.
The US Dollar also received support from a hawkish speech from Federal Reserve (Fed) Board of Governors member Dr. Adriana Kugler on Tuesday. Dr. Kugler indicated that if upcoming data does not confirm that inflation is moving toward the 2% target, it may be appropriate to maintain current rates for a while longer.
Traders remain vigilant amid suspicions of intervention by Japanese authorities. Data released on Tuesday showed that the Bank of Japan (BoJ) entered the foreign exchange market on consecutive trading days last Thursday and Friday.
The current account balance data from the BoJ, released on Tuesday, indicates an anticipated liquidity drain of approximately ¥2.74 trillion ($17.3 billion) from the financial system on Wednesday due to various government sector transactions. This follows an earlier forecast of a ¥600 billion drain, according to Nikkei Asia.
Daily Digest Market Movers: Japanese Yen declines as US Dollar remains stable
- Japan’s Tankan Manufacturers Sentiment Index rose to 11.0 in July from 6.0 in June. This figure registered the first gain in four months and indicated a pickup in economic activity.
- The US Retail Sales for June stayed mostly in line with expectations. Retail Sales in the United States held steady at $704.3 billion in June, after a 0.3% gain (revised from 0.1%) in May, and are in line with market expectations.
- Fed Chair Jerome Powell mentioned on Monday that the three US inflation readings of this year "add somewhat to confidence" that inflation is on course to meet the Fed’s target sustainably, suggesting that a shift to interest rate cuts may not be far off.
- Fed Bank of San Francisco President Mary Daly stated that inflation is cooling down in a way that bolsters confidence that it’s on its way to 2%. However, Daly added that more information is needed before making a rate decision.
- US President Joe Biden on Monday addressed the nation from the White House, where he condemned all political violence and called for unity, according to CNBC. Biden further stated that “it’s time to cool it down” and noted not just the weekend attack on Trump but also the possibility of election-year violence on multiple fronts.
- According to Saxo Bank, the increasing probability of a Trump 2.0 presidency has been bolstering the US Dollar. Market participants anticipate that a second term for Trump could lead to aggressive fiscal policies and trade measures, thereby driving demand for the greenback.
- BBH FX strategists highlight that recent softness in US data poses challenges to their perspective that the backdrop of sustained inflation and strong growth in the US largely remains intact. They note increasing concern among Federal Reserve officials regarding weaknesses in the labor market.
Technical Analysis: USD/JPY hovers around 158.50
USD/JPY trades around 158.40 on Wednesday. The daily chart analysis shows that the pair lies below its 9-day Exponential Moving Average (EMA), suggesting downward momentum in the short term. This signals that it may be prudent to hold off on buying until the trend shows signs of reversal.
Additionally, the momentum indicator, the 14-day Relative Strength Index (RSI), is below the 50 level, indicating a bearish bias. However, a further increase in the RSI could weaken the bearish sentiment.
Immediate resistance is observed around the nine-day Exponential Moving Average (EMA) at 159.20, followed by the lower boundary of the ascending channel at 160.60. Returning to trade within the ascending channel would likely improve sentiment for the USD/JPY pair, with a potential target toward the upper boundary of the channel near 164.00.
On the downside, the USD/JPY pair could find key support around the psychological level of 158.00. A break below this level could exert pressure on the pair, navigating the region around June's low at 154.55.
USD/JPY: Daily Chart
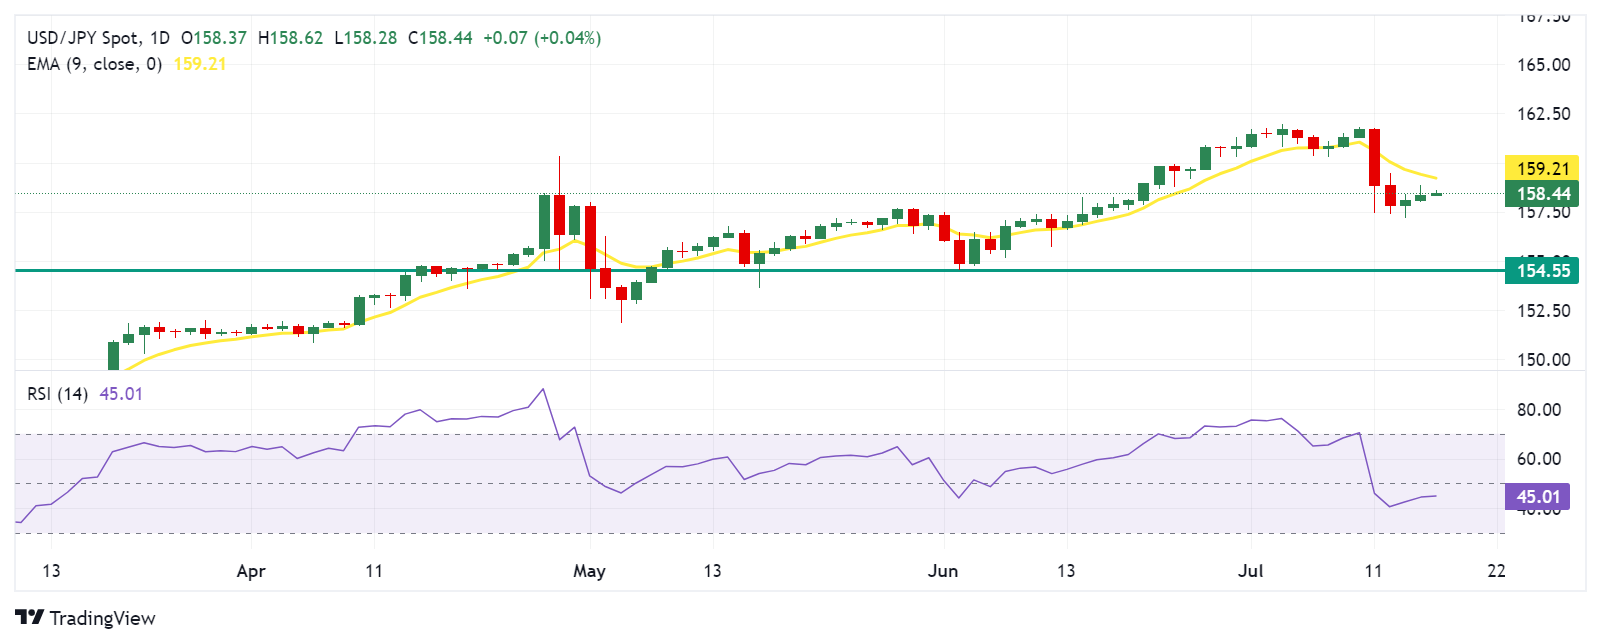
Japanese Yen PRICE Today
The table below shows the percentage change of Japanese Yen (JPY) against listed major currencies today. Japanese Yen was the weakest against the New Zealand Dollar.
| USD | EUR | GBP | JPY | CAD | AUD | NZD | CHF | |
|---|---|---|---|---|---|---|---|---|
| USD | -0.03% | 0.00% | 0.05% | -0.02% | -0.09% | -0.34% | 0.02% | |
| EUR | 0.03% | 0.06% | 0.09% | 0.03% | -0.05% | -0.34% | 0.07% | |
| GBP | -0.01% | -0.06% | 0.02% | -0.04% | -0.10% | -0.41% | 0.02% | |
| JPY | -0.05% | -0.09% | -0.02% | -0.06% | -0.12% | -0.42% | 0.01% | |
| CAD | 0.02% | -0.03% | 0.04% | 0.06% | -0.07% | -0.34% | 0.06% | |
| AUD | 0.09% | 0.05% | 0.10% | 0.12% | 0.07% | -0.28% | 0.13% | |
| NZD | 0.34% | 0.34% | 0.41% | 0.42% | 0.34% | 0.28% | 0.41% | |
| CHF | -0.02% | -0.07% | -0.02% | -0.01% | -0.06% | -0.13% | -0.41% |
The heat map shows percentage changes of major currencies against each other. The base currency is picked from the left column, while the quote currency is picked from the top row. For example, if you pick the Japanese Yen from the left column and move along the horizontal line to the US Dollar, the percentage change displayed in the box will represent JPY (base)/USD (quote).
Bank of Japan FAQs
The Bank of Japan (BoJ) is the Japanese central bank, which sets monetary policy in the country. Its mandate is to issue banknotes and carry out currency and monetary control to ensure price stability, which means an inflation target of around 2%.
The Bank of Japan has embarked in an ultra-loose monetary policy since 2013 in order to stimulate the economy and fuel inflation amid a low-inflationary environment. The bank’s policy is based on Quantitative and Qualitative Easing (QQE), or printing notes to buy assets such as government or corporate bonds to provide liquidity. In 2016, the bank doubled down on its strategy and further loosened policy by first introducing negative interest rates and then directly controlling the yield of its 10-year government bonds.
The Bank’s massive stimulus has caused the Yen to depreciate against its main currency peers. This process has exacerbated more recently due to an increasing policy divergence between the Bank of Japan and other main central banks, which have opted to increase interest rates sharply to fight decades-high levels of inflation. The BoJ’s policy of holding down rates has led to a widening differential with other currencies, dragging down the value of the Yen.
A weaker Yen and the spike in global energy prices have led to an increase in Japanese inflation, which has exceeded the BoJ’s 2% target. Still, the Bank judges that the sustainable and stable achievement of the 2% target has not yet come in sight, so any sudden change in the current policy looks unlikely.
- Silver lacks any firm intraday direction and oscillates in a range on Wednesday.
- The overnight sustained breakout through a trading range favors bullish traders.
- Dips towards $31.00 could be seen as a buying opportunity and remain limited.
Silver (XAG/USD) struggles to capitalize on the previous day's positive move and seesaws between tepid gains/minor losses during the Asian session on Wednesday. The white metal currently trades around the $31.25 region, nearly unchanged for the day and just below a fresh weekly peak touched earlier today.
From a technical perspective, the overnight breakout through a multi-day-old trading range could be seen as a fresh trigger for bullish traders and support prospects for additional gains. Moreover, oscillators on the daily chart are holding in the positive territory and suggest that the path of least resistance for the XAG/USD is to the upside. Hence, any meaningful dip might still be seen as a buying opportunity and remain limited.
Meanwhile, the trading range resistance breakpoint, around the $31.00 round figure, now coincides with the 100-hour Simple Moving Average (SMA) and should protect the immediate downside. A convincing break below might prompt some technical selling and drag the XAG/USD below the $30.75 area, towards testing the $30.55-$30.50 strong horizontal support, which should act as a key pivotal point for short-term traders.
On the flip side, the Asian session peak, around the $31.45 area, now seems to act as an immediate resistance, above which the XAG/USD could then surpass an intermediate hurdle near the $31.75 region and aim to reclaim the $32.00 mark for the first time since May 30. Some follow-through buying should pave the way for additional gains and a move towards challenging the YTD peak, around the $32.50 region touched in May.
Silver 1-hour chart
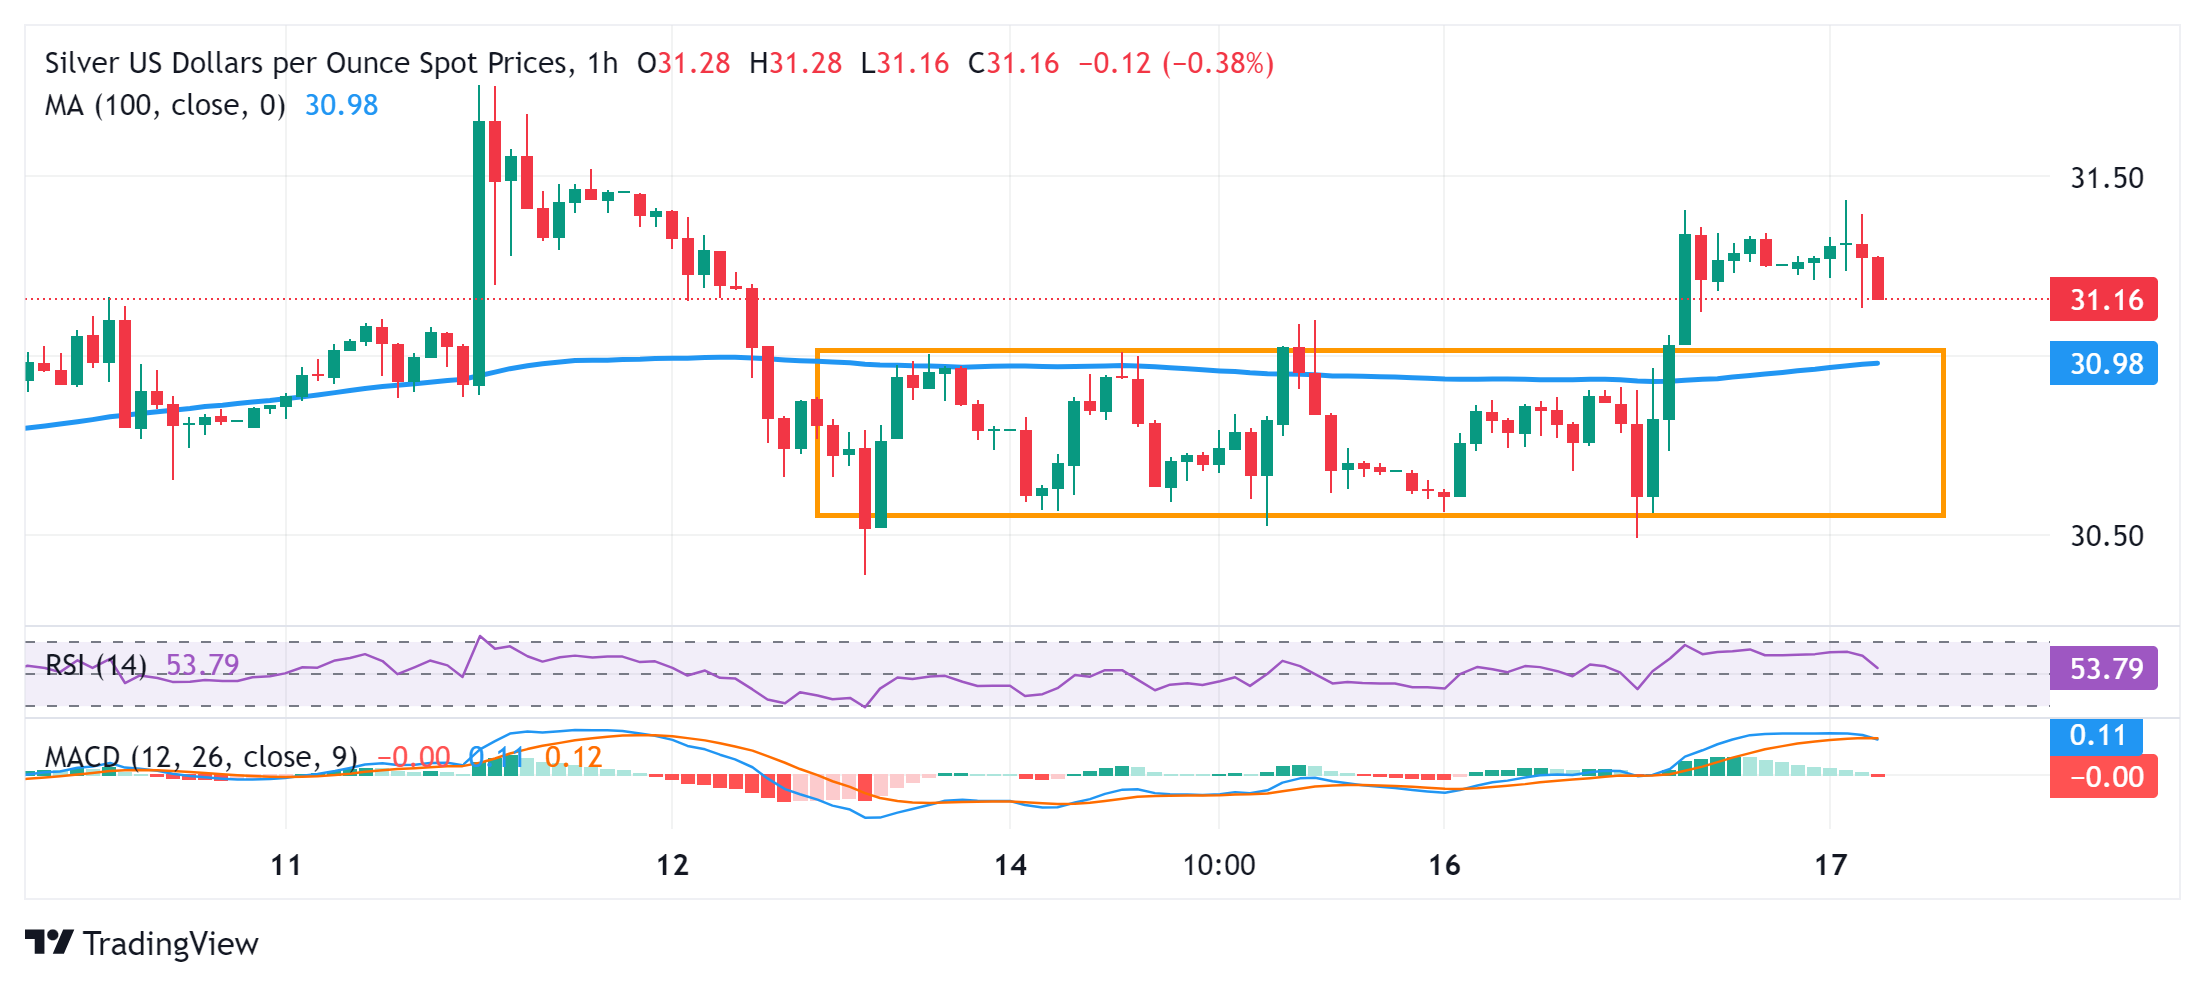
Silver FAQs
Silver is a precious metal highly traded among investors. It has been historically used as a store of value and a medium of exchange. Although less popular than Gold, traders may turn to Silver to diversify their investment portfolio, for its intrinsic value or as a potential hedge during high-inflation periods. Investors can buy physical Silver, in coins or in bars, or trade it through vehicles such as Exchange Traded Funds, which track its price on international markets.
Silver prices can move due to a wide range of factors. Geopolitical instability or fears of a deep recession can make Silver price escalate due to its safe-haven status, although to a lesser extent than Gold's. As a yieldless asset, Silver tends to rise with lower interest rates. Its moves also depend on how the US Dollar (USD) behaves as the asset is priced in dollars (XAG/USD). A strong Dollar tends to keep the price of Silver at bay, whereas a weaker Dollar is likely to propel prices up. Other factors such as investment demand, mining supply – Silver is much more abundant than Gold – and recycling rates can also affect prices.
Silver is widely used in industry, particularly in sectors such as electronics or solar energy, as it has one of the highest electric conductivity of all metals – more than Copper and Gold. A surge in demand can increase prices, while a decline tends to lower them. Dynamics in the US, Chinese and Indian economies can also contribute to price swings: for the US and particularly China, their big industrial sectors use Silver in various processes; in India, consumers’ demand for the precious metal for jewellery also plays a key role in setting prices.
Silver prices tend to follow Gold's moves. When Gold prices rise, Silver typically follows suit, as their status as safe-haven assets is similar. The Gold/Silver ratio, which shows the number of ounces of Silver needed to equal the value of one ounce of Gold, may help to determine the relative valuation between both metals. Some investors may consider a high ratio as an indicator that Silver is undervalued, or Gold is overvalued. On the contrary, a low ratio might suggest that Gold is undervalued relative to Silver.
- The US Dollar Index trades on a softer note near 104.20 in Wednesday’s Asian session.
- Rising bets on rate cuts and the Fed’s dovish stance might exert some selling on the DXY in the near term.
- The safe-haven flows are likely to cap the DXY’s downside.
The US Dollar Index (DXY) remains on the defensive around 104.20 on Wednesday during the Asian trading hours. The prospect of Federal Reserve (Fed) rate cuts as early as September weighs on the DXY despite better-than-expected US Retail sales data. Investors will keep an eye on the US Building Permits, Housing Starts, Industrial Production, and the Fed Beige Book on Wednesday, along with the speeches from the Fed Barkin and Waller.
The US June Retail Sales released on Tuesday did not alter significantly from the Fed rate cut expectations. Retail Sales in the United States remained flat at $704.3 billion in June, after a 0.3% increase (revised from 0.1%) in May and in line with market forecasts. Retail Sales ex Autos rose 0.4% MoM in June, above the projected 0.1%, according to the US Census Bureau.
Dovish bets on the Fed continue to undermine the DXY in the near term. Fed Chair Jerome Powell said on Monday that the US central bank has "more good" inflation data and it could pave the way for its first interest rate cut later this year. Meanwhile, Fed Governor Adriana Kugler said on Tuesday that inflation is on course to the Fed's 2% target, with goods, services and now housing contributing to easing price pressures. Financial markets are now pricing in 100% odds of a Fed rate cut in September, up from 70% a month ago, according to the CME FedWatch Tool.
Nonetheless, the political uncertainty and geopolitical risks globally might boost the safe-haven currency like the US Dollar and cap the downside. On Tuesday, two Israeli strikes killed more than 20 Palestinians in different regions of Gaza, one of which hit a United Nations school turned into a shelter, per the New York Times.
US Dollar FAQs
The US Dollar (USD) is the official currency of the United States of America, and the ‘de facto’ currency of a significant number of other countries where it is found in circulation alongside local notes. It is the most heavily traded currency in the world, accounting for over 88% of all global foreign exchange turnover, or an average of $6.6 trillion in transactions per day, according to data from 2022. Following the second world war, the USD took over from the British Pound as the world’s reserve currency. For most of its history, the US Dollar was backed by Gold, until the Bretton Woods Agreement in 1971 when the Gold Standard went away.
The most important single factor impacting on the value of the US Dollar is monetary policy, which is shaped by the Federal Reserve (Fed). The Fed has two mandates: to achieve price stability (control inflation) and foster full employment. Its primary tool to achieve these two goals is by adjusting interest rates. When prices are rising too quickly and inflation is above the Fed’s 2% target, the Fed will raise rates, which helps the USD value. When inflation falls below 2% or the Unemployment Rate is too high, the Fed may lower interest rates, which weighs on the Greenback.
In extreme situations, the Federal Reserve can also print more Dollars and enact quantitative easing (QE). QE is the process by which the Fed substantially increases the flow of credit in a stuck financial system. It is a non-standard policy measure used when credit has dried up because banks will not lend to each other (out of the fear of counterparty default). It is a last resort when simply lowering interest rates is unlikely to achieve the necessary result. It was the Fed’s weapon of choice to combat the credit crunch that occurred during the Great Financial Crisis in 2008. It involves the Fed printing more Dollars and using them to buy US government bonds predominantly from financial institutions. QE usually leads to a weaker US Dollar.
Quantitative tightening (QT) is the reverse process whereby the Federal Reserve stops buying bonds from financial institutions and does not reinvest the principal from the bonds it holds maturing in new purchases. It is usually positive for the US Dollar.
- AUD/NZD retreats sharply from a nearly two-year peak touched earlier this Wednesday.
- The softer New Zealand CPI print brings forward RBNZ rate cut bets and might cap gains.
- Speculations that RBA could hike rates again should contribute to limiting the downside.
The AUD/NZD cross witnessed an intraday turnaround from the 1.1150 region, or its highest level since October 2022 touched during the Asian session on Wednesday and drops to the lower end of the weekly range in the last hour. Spot prices currently trade around the 1.1085-1.1080 region, down nearly 0.40% for the day.
Data published by Statistics New Zealand earlier this Wednesday showed that the headline Consumer Price Index (CPI) rose 0.4% QoQ compared to 0.6% in the previous quarter and analysts' forecasts. Moreover, the annual CPI inflation rate fell from the 4% YoY rate in the March 2024 quarter to its lowest rate in three years, at 3.3% in Q2. The New Zealand Dollar (NZD), however, rallied across the board following the release of softer data and turns out to be a key factor exerting heavy downward pressure on the AUD/NZD cross.
Meanwhile, the strong intraday move lacks any obvious fundamental catalyst and could be solely attributed to some NZD short-covering and is more likely to remain limited amid bets that the Reserve Bank of New Zealand (RBNZ) will cut interest rates soon. Furthermore, expectations that the Reserve Bank of Australia (RBA) could raise interest rates again could lend some support to the Australian Dollar (AUD) and help limit the downside for the AUD/NZD cross. This, in turn, warrants some caution before confirming that spot prices have topped out.
Moving ahead, investors now look forward to the release of monthly employment details from Australia, due during the Asian session on Thursday. In the meantime, hopes for additional stimulus from China might act as a tailwind for the China-proxy Aussie and the AUD/NZD cross. Hence, it will be prudent to wait for strong follow-through selling before positioning for any meaningful corrective decline for the currency pair.
Economic Indicator
Consumer Price Index (YoY)
Inflationary or deflationary tendencies are measured by periodically summing the prices of a basket of representative goods and services and presenting the data as The Consumer Price Index (CPI). CPI data is compiled on a monthly basis and released by the US Department of Labor Statistics. The YoY reading compares the prices of goods in the reference month to the same month a year earlier.The CPI is a key indicator to measure inflation and changes in purchasing trends. Generally speaking, a high reading is seen as bullish for the US Dollar (USD), while a low reading is seen as bearish.
Read more.Last release: Thu Jul 11, 2024 12:30
Frequency: Monthly
Actual: 3%
Consensus: 3.1%
Previous: 3.3%
Source: US Bureau of Labor Statistics
The US Federal Reserve has a dual mandate of maintaining price stability and maximum employment. According to such mandate, inflation should be at around 2% YoY and has become the weakest pillar of the central bank’s directive ever since the world suffered a pandemic, which extends to these days. Price pressures keep rising amid supply-chain issues and bottlenecks, with the Consumer Price Index (CPI) hanging at multi-decade highs. The Fed has already taken measures to tame inflation and is expected to maintain an aggressive stance in the foreseeable future.
| Raw materials | Closed | Change, % |
|---|---|---|
| Silver | 31.26 | 1.98 |
| Gold | 246.882 | 1.93 |
| Palladium | 957.62 | 0.84 |
- United Kingdom’s CPI report will be published by the Office for National Statistics on Wednesday.
- The annual UK headline and core inflation are expected to hold steady in June.
- The UK CPI data could revive BoE August interest rate cut bets, rocking the Pound Sterling.
The high-impact Consumer Price Index (CPI) data for June from the United Kingdom (UK) will be published by the Office for National Statistics (ONS) on Wednesday at 06:00 GMT.
The UK CPI inflation report could reinforce expectations of an interest-rate cut by the Bank of England (BoE) in August, with volatility set to spike around the Pound Sterling.
What to expect from the next UK inflation report?
The UK Consumer Price Index is expected to rise at an annual rate of 2.0% in June, at the same pace as in May, sitting at the BoE’s 2.0% target.
Core CPI inflation is likely to stay unchanged at 3.5% YoY in June. Meanwhile, the British monthly CPI is seen rising 0.1% in the same period, compared with the previous increase of 0.3%.
Official data is expected to show that services inflation ticked down to 5.6% in June from 5.7% the month before, according to a Bloomberg survey of economists.
Previewing the UK inflation data, TD Securities (TDS) analysts noted: “Heavy deflation in the energy component should keep headline inflation close to the 2% target in June despite core likely remaining sticky at 3.5% YoY.”
“Focus will continue to be on services, and here we see an unchanged YoY reading as momentum remains strong. Taylor Swift should not have that big of an impact on this print - August is the bigger risk in our view,” the TDS analysts said.
The encouraging UK growth numbers and BoE Chief Economist Huw Pill’s prudent comments last week helped push back against the timing of the BoE’s first rate cut since the COVID pandemic hit the world in 2020.
Data released by the ONS last Thursday showed that the UK economy grew by 0.4% in May, above the expected 0.2% monthly expansion, after stagnating in April.
Meanwhile, BoE Chief Economist Pill dampened expectations of an August interest rate cut on Wednesday. Pill said, "I think it's still an open question on whether the timing for a rate cut is now," adding that services inflation and wage growth showed "uncomfortable strength" despite headline inflation falling to the BoE's 2% target in May.
Money markets currently price in a 50% chance of 25 basis points (bps) cut to the Bank Rate on August 1, down from 62% seen early last week.
How will the UK Consumer Price Index report affect GBP/USD?
Against this backdrop, the UK CPI data will be crucial to determining whether the August rate reduction remains on the table for the BoE. An upside surprise to the headline and core inflation data could support the recent dialing down of expectations of a rate cut next month, fuelling a fresh leg higher in the Pound Sterling. In such a case, GBP/USD could unleash the additional upside toward the 1.3100 level.
On the other hand, GBP/USD could retest the 1.2800 round figure if the UK CPI readings meet forecasts while the services inflation softens significantly. This could bring back bets for the BoE policy pivot in August.
Dhwani Mehta, Asian Session Lead Analyst at FXStreet, offers a brief technical outlook for the major and explains: “GBP/USD’s daily chart portrays overbought conditions, as 14-day Relative Strength Index (RSI) holds near 75, signaling risks of a Pound Sterling correction in the near term.”
Dhwani adds: “The pair needs to find acceptance above the 1.3000 psychological level on a daily closing basis to extend the upside toward the July 19, 2023, high of 1.3045. On the flip side, the immediate support is placed at the March 8 high of 1.2894, below which the 1.2800 resistance-turned-support could be tested. The last line of defense for buyers is seen at the 21-day Simple Moving Average (SMA) at 1.2748.” Dhwani adds.
Economic Indicator
Consumer Price Index (YoY)
The United Kingdom (UK) Consumer Price Index (CPI), released by the Office for National Statistics on a monthly basis, is a measure of consumer price inflation – the rate at which the prices of goods and services bought by households rise or fall – produced to international standards. It is the inflation measure used in the government’s target. The YoY reading compares prices in the reference month to a year earlier. Generally, a high reading is seen as bullish for the Pound Sterling (GBP), while a low reading is seen as bearish.
Read more.Next release: Wed Jul 17, 2024 06:00
Frequency: Monthly
Consensus: 2%
Previous: 2%
Source: Office for National Statistics
The Bank of England is tasked with keeping inflation, as measured by the headline Consumer Price Index (CPI) at around 2%, giving the monthly release its importance. An increase in inflation implies a quicker and sooner increase of interest rates or the reduction of bond-buying by the BOE, which means squeezing the supply of pounds. Conversely, a drop in the pace of price rises indicates looser monetary policy. A higher-than-expected result tends to be GBP bullish.
Inflation FAQs
Inflation measures the rise in the price of a representative basket of goods and services. Headline inflation is usually expressed as a percentage change on a month-on-month (MoM) and year-on-year (YoY) basis. Core inflation excludes more volatile elements such as food and fuel which can fluctuate because of geopolitical and seasonal factors. Core inflation is the figure economists focus on and is the level targeted by central banks, which are mandated to keep inflation at a manageable level, usually around 2%.
The Consumer Price Index (CPI) measures the change in prices of a basket of goods and services over a period of time. It is usually expressed as a percentage change on a month-on-month (MoM) and year-on-year (YoY) basis. Core CPI is the figure targeted by central banks as it excludes volatile food and fuel inputs. When Core CPI rises above 2% it usually results in higher interest rates and vice versa when it falls below 2%. Since higher interest rates are positive for a currency, higher inflation usually results in a stronger currency. The opposite is true when inflation falls.
Although it may seem counter-intuitive, high inflation in a country pushes up the value of its currency and vice versa for lower inflation. This is because the central bank will normally raise interest rates to combat the higher inflation, which attract more global capital inflows from investors looking for a lucrative place to park their money.
Formerly, Gold was the asset investors turned to in times of high inflation because it preserved its value, and whilst investors will often still buy Gold for its safe-haven properties in times of extreme market turmoil, this is not the case most of the time. This is because when inflation is high, central banks will put up interest rates to combat it. Higher interest rates are negative for Gold because they increase the opportunity-cost of holding Gold vis-a-vis an interest-bearing asset or placing the money in a cash deposit account. On the flipside, lower inflation tends to be positive for Gold as it brings interest rates down, making the bright metal a more viable investment alternative.
- The Australian Dollar could lose ground by receiving pressure from a hawkish speech by a Fed member.
- Fed member Dr. Adriana Kugler indicated to maintain rates for longer if upcoming data does not confirm a slowdown in inflation.
- Australia’s 10-year government bond yield steadies around 4.2%, its lowest level in three weeks.
The Australian Dollar (AUD) experiences volatility on Wednesday. The AUD/USD pair has faced challenges due to a modest rebound in the US Dollar (USD), which is likely influenced by a hawkish speech from Federal Reserve (Fed) Board of Governors member Dr. Adriana Kugler on Tuesday.
In her remarks, Dr. Kugler acknowledged that inflationary pressures have eased but emphasized that the Fed still needs additional data to justify a rate cut. Kugler indicated that if upcoming data does not confirm that inflation is moving toward the 2% target, it may be appropriate to maintain current rates for a while longer.
The AUD/USD pair loses ground as investors reduce their expectations for a Reserve Bank of Australia (RBA) rate hike. Despite this, the central bank is still anticipated to delay joining the global rate-cutting cycle. Investors are now focused on Australian employment numbers, due on Thursday, to gain further insights into the monetary policy outlook.
Daily Digest Market Movers: Australian Dollar receives pressure from a hawkish Fed member
- Australia’s 10-year government bond yield steadies around 4.2%, its lowest level in three weeks, mirroring a decline in US bond yields. This followed comments from Federal Reserve Chair Jerome Powell, which strengthened the case for a rate cut by the US central bank in September.
- On Monday, Fed Chair Powell stated that the three US inflation readings from this year "add somewhat to confidence" that inflation is on track to meet the Fed’s target sustainably, suggesting that a shift to interest rate cuts may be imminent.
- The US Retail Sales for June did not change much for the central bank's expectations. Retail Sales in the United States held steady at $704.3 billion in June, after a 0.3% gain (revised from 0.1%) in May and in line with market expectations.
- The third plenum of the Chinese Communist Party's 20th National Congress continues today, being held from July 15 to 18. Standard Chartered expects cuts from the People's Bank of China, both in rates and the reserve requirement ratio (RRR), as GDP growth decelerated in Q2. China’s growth drivers remain uneven, and trade tensions are rising, with the US and EU imposing new tariffs on Chinese electric vehicles (EVs).
- Fed Bank of San Francisco President Mary Daly stated that inflation is cooling down in a way that bolsters confidence that it’s on its way to 2%. However, Daly added that more information is needed before making a rate decision.
- In China, a close trade partner of Australia, Gross Domestic Product (GDP) grew 4.7% year-over-year in the second quarter, compared to a 5.3% expansion in the first quarter and an expected 5.1%.
- The National Bureau of Statistics (NBS) reported that China's economy operated generally steadily in the first half of the year, with H1 GDP growth at +5.0% year-on-year. Looking ahead, the NBS highlighted increasing external uncertainties and numerous domestic challenges that China's economy faces in the second half of the year.
Technical Analysis: Australian Dollar holds ground near 0.6750
The Australian Dollar trades around 0.6740 on Wednesday. The daily chart analysis shows that the AUD/USD pair consolidates within an ascending channel, indicating a bullish bias. However, the 14-day Relative Strength Index (RSI) declines toward the 50 level, suggesting a correction. A further decline could weaken the bullish trend.
The AUD/USD pair may test the psychological level of 0.6800. A breakthrough above this level could support the pair to approach the upper boundary of the ascending channel near 0.6820.
On the downside, immediate support appears around the 21-day Exponential Moving Average (EMA) at 0.6710. Further support is seen near the lower boundary of the ascending channel at 0.6700. A break below this level could push the AUD/USD pair toward the throwback support at 0.6590.
AUD/USD: Daily Chart
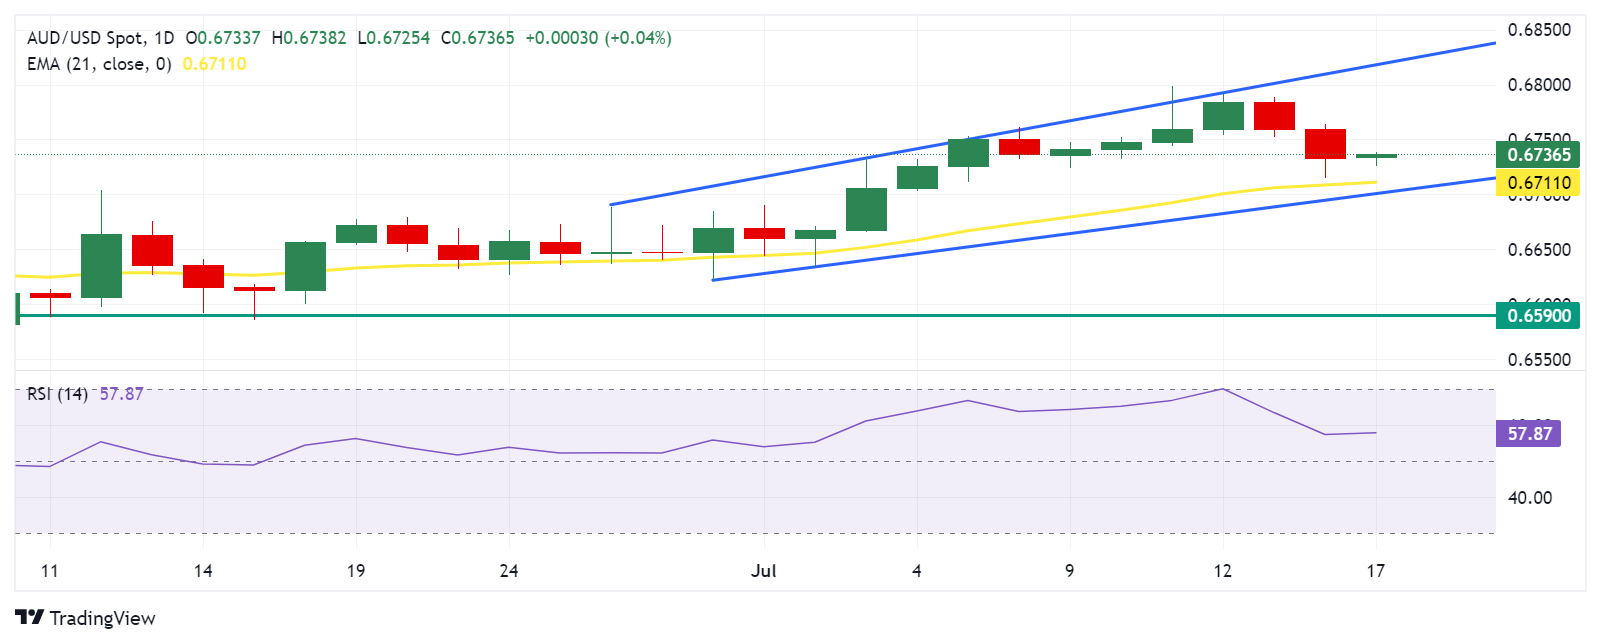
Australian Dollar PRICE Today
The table below shows the percentage change of Australian Dollar (AUD) against listed major currencies today. Australian Dollar was the strongest against the Japanese Yen.
| USD | EUR | GBP | JPY | CAD | AUD | NZD | CHF | |
|---|---|---|---|---|---|---|---|---|
| USD | -0.03% | -0.01% | 0.10% | 0.02% | -0.08% | -0.50% | 0.03% | |
| EUR | 0.03% | 0.04% | 0.12% | 0.05% | -0.05% | -0.51% | 0.07% | |
| GBP | 0.00% | -0.04% | 0.08% | 0.02% | -0.09% | -0.55% | 0.04% | |
| JPY | -0.10% | -0.12% | -0.08% | -0.08% | -0.17% | -0.63% | -0.03% | |
| CAD | -0.02% | -0.05% | -0.02% | 0.08% | -0.11% | -0.54% | 0.03% | |
| AUD | 0.08% | 0.05% | 0.09% | 0.17% | 0.11% | -0.44% | 0.13% | |
| NZD | 0.50% | 0.51% | 0.55% | 0.63% | 0.54% | 0.44% | 0.57% | |
| CHF | -0.03% | -0.07% | -0.04% | 0.03% | -0.03% | -0.13% | -0.57% |
The heat map shows percentage changes of major currencies against each other. The base currency is picked from the left column, while the quote currency is picked from the top row. For example, if you pick the Australian Dollar from the left column and move along the horizontal line to the US Dollar, the percentage change displayed in the box will represent AUD (base)/USD (quote).
Interest rates FAQs
Interest rates are charged by financial institutions on loans to borrowers and are paid as interest to savers and depositors. They are influenced by base lending rates, which are set by central banks in response to changes in the economy. Central banks normally have a mandate to ensure price stability, which in most cases means targeting a core inflation rate of around 2%. If inflation falls below target the central bank may cut base lending rates, with a view to stimulating lending and boosting the economy. If inflation rises substantially above 2% it normally results in the central bank raising base lending rates in an attempt to lower inflation.
Higher interest rates generally help strengthen a country’s currency as they make it a more attractive place for global investors to park their money.
Higher interest rates overall weigh on the price of Gold because they increase the opportunity cost of holding Gold instead of investing in an interest-bearing asset or placing cash in the bank. If interest rates are high that usually pushes up the price of the US Dollar (USD), and since Gold is priced in Dollars, this has the effect of lowering the price of Gold.
The Fed funds rate is the overnight rate at which US banks lend to each other. It is the oft-quoted headline rate set by the Federal Reserve at its FOMC meetings. It is set as a range, for example 4.75%-5.00%, though the upper limit (in that case 5.00%) is the quoted figure. Market expectations for future Fed funds rate are tracked by the CME FedWatch tool, which shapes how many financial markets behave in anticipation of future Federal Reserve monetary policy decisions.
- Gold price continues to attract buyers amid growing September Fed rate cut bets.
- Tuesday’s upbeat US Retail Sales data underpins the USD and might cap the metal.
- The risk-on mood further warrants caution before positioning for additional gains.
Gold price (XAU/USD) builds on the previous day's strong move up and touches a fresh all-time high, around the $2,476-2,477 area during the Asian session on Wednesday. The recent comments by Federal Reserve (Fed) officials cemented expectations about an imminent start of the rate-cutting cycle in September. This, in turn, keeps the US Treasury bond yields depressed near a multi-month trough and is seen as a key factor benefiting the non-yielding yellow metal.
Bulls, meanwhile, seem rather unaffected by a modest US Dollar (USD) uptick, which tends to undermine the USD-denominated commodities, including the Gold price. Even the prevalent risk-on environment – as depicted by an extension of the uptrend across the global equity markets – also does little to dent demand for the safe-haven precious metal. This suggests that the path of least resistance for the XAU/USD is to the upside, though slightly overbought conditions might cap gains.
Daily Digest Market Movers: Gold price benefits from dovish Fed expectations, despite modest USD uptick
- The recent comments by Federal Reserve officials reaffirmed expectations of an interest rate cut in September, which continues to drive flows towards the non-yielding Gold price.
- Fed Chair Jerome Powell said on Monday that inflation readings during the second quarter showed more progress was being made on bringing the pace of price increases to the target.
- San Francisco Fed President Mary Daly showed growing confidence that inflation is heading toward the central bank's goal and added that she expects a policy adjustment at some point.
- Fed Governor Adriana Kugler noted on Tuesday that downside risks to employment have become more balanced and continued labor market rebalancing suggests inflation will move towards the target.
- Kugler further added that it will be appropriate to begin easing monetary policy later this year if economic conditions continue to evolve favorably and if the labor market cools too much.
- Traders are now pricing in multiple rate cuts by year-end, dragging the yield on the benchmark 10-year US government bond and the rate-sensitive 2-year Treasury yield to a multi-month low.
- Meanwhile, the US Dollar draws support from Tuesday's upbeat US Retail Sales data, which pointed to consumer resilience and bolstered economic growth prospects for the second quarter.
- The Census Bureau reported Retail Sales in the US remained unchanged in June and the previous month's revised higher to show a growth of 0.3% as compared to the 0.1% reported originally.
- This, along with an extension of a bullish run across the global equity markets, might hold back traders from placing fresh bullish bets around the safe-haven XAU/USD and cap gains.
Technical Analysis: Gold price could pause the uptrend near the $2,500 mark amid slightly overbought oscillators
From a technical perspective, the overnight sustained breakout through the $2,425-2,430 supply zone and a subsequent move beyond the $2,450 area, or the previous all-time peak, could be seen as a fresh trigger for bullish traders. That said, oscillators on the daily chart have just started moving in overbought territory and warrant some caution before positioning for additional gains. Hence, any further move-up is more likely to face some resistance and pause near the $2,500 psychological mark
On the flip side, any meaningful slide below the $2,450 area might now be seen as a buying opportunity and remain limited near the $2,430-2,425 resistance breakpoint, now turned support. A convincing break below the latter, however, might prompt some technical selling and drag the Gold price to the $2,400 mark. Some follow-through selling below the $2,390 area could pave the way for deeper losses towards testing the next relevant support near the $2,360 region.
Gold FAQs
Gold has played a key role in human’s history as it has been widely used as a store of value and medium of exchange. Currently, apart from its shine and usage for jewelry, the precious metal is widely seen as a safe-haven asset, meaning that it is considered a good investment during turbulent times. Gold is also widely seen as a hedge against inflation and against depreciating currencies as it doesn’t rely on any specific issuer or government.
Central banks are the biggest Gold holders. In their aim to support their currencies in turbulent times, central banks tend to diversify their reserves and buy Gold to improve the perceived strength of the economy and the currency. High Gold reserves can be a source of trust for a country’s solvency. Central banks added 1,136 tonnes of Gold worth around $70 billion to their reserves in 2022, according to data from the World Gold Council. This is the highest yearly purchase since records began. Central banks from emerging economies such as China, India and Turkey are quickly increasing their Gold reserves.
Gold has an inverse correlation with the US Dollar and US Treasuries, which are both major reserve and safe-haven assets. When the Dollar depreciates, Gold tends to rise, enabling investors and central banks to diversify their assets in turbulent times. Gold is also inversely correlated with risk assets. A rally in the stock market tends to weaken Gold price, while sell-offs in riskier markets tend to favor the precious metal.
The price can move due to a wide range of factors. Geopolitical instability or fears of a deep recession can quickly make Gold price escalate due to its safe-haven status. As a yield-less asset, Gold tends to rise with lower interest rates, while higher cost of money usually weighs down on the yellow metal. Still, most moves depend on how the US Dollar (USD) behaves as the asset is priced in dollars (XAU/USD). A strong Dollar tends to keep the price of Gold controlled, whereas a weaker Dollar is likely to push Gold prices up.
- WTI price extends decline near $79.50 in Wednesday’s Asian session.
- Chinese demand concerns weigh on the WTI price.
- Rising bets on a Fed rate cut in September might limit the black gold’s downside.
West Texas Intermediate (WTI), the US crude oil benchmark, is trading around $79.50 on Wednesday. WTI price edges lower as fears about a sluggish Chinese economy hurt oil demand.
The weaker Chinese economic data on Tuesday exerts some selling pressure on the black gold as China is the world's largest crude oil importer. "Weaker economic data continues to flow from China as continued government support programs have been disappointing, with many of China's refineries cutting back on weaker fuel demand," said Dennis Kissler, senior vice president of trading at BOK Financial.
China’s economy expanded 4.7% YoY in the second quarter (Q2), compared to a 5.3% expansion in the first quarter, according to the National Bureau of Statistics (NBS) on Monday. Meanwhile, China’s Retail Sales came in weaker than expected, climbing 2.0% YoY in June versus 3.1% expected and 3.7% prior.
Nonetheless, the rising odds that the US Federal Reserve (Fed) would cut interest rates might limit the downside for WTI. Fed Chair Jerome Powell said on Monday that the US central bank has "more good" inflation data and could pave the way for its first interest rate cut later this year. Traders are now pricing in a 100% chance of a Fed rate cut in September, up from 70% a month ago, according to the CME FedWatch Tool.
Elsewhere, crude oil inventories in the United States for the week ending July 12 fell by 4.44 million barrels from a decline of 1.9 million barrels in the previous week, according to the American Petroleum Institute (API). Stocks on average were expected to fall by 33,000 barrels last week
WTI Oil FAQs
WTI Oil is a type of Crude Oil sold on international markets. The WTI stands for West Texas Intermediate, one of three major types including Brent and Dubai Crude. WTI is also referred to as “light” and “sweet” because of its relatively low gravity and sulfur content respectively. It is considered a high quality Oil that is easily refined. It is sourced in the United States and distributed via the Cushing hub, which is considered “The Pipeline Crossroads of the World”. It is a benchmark for the Oil market and WTI price is frequently quoted in the media.
Like all assets, supply and demand are the key drivers of WTI Oil price. As such, global growth can be a driver of increased demand and vice versa for weak global growth. Political instability, wars, and sanctions can disrupt supply and impact prices. The decisions of OPEC, a group of major Oil-producing countries, is another key driver of price. The value of the US Dollar influences the price of WTI Crude Oil, since Oil is predominantly traded in US Dollars, thus a weaker US Dollar can make Oil more affordable and vice versa.
The weekly Oil inventory reports published by the American Petroleum Institute (API) and the Energy Information Agency (EIA) impact the price of WTI Oil. Changes in inventories reflect fluctuating supply and demand. If the data shows a drop in inventories it can indicate increased demand, pushing up Oil price. Higher inventories can reflect increased supply, pushing down prices. API’s report is published every Tuesday and EIA’s the day after. Their results are usually similar, falling within 1% of each other 75% of the time. The EIA data is considered more reliable, since it is a government agency.
OPEC (Organization of the Petroleum Exporting Countries) is a group of 13 Oil-producing nations who collectively decide production quotas for member countries at twice-yearly meetings. Their decisions often impact WTI Oil prices. When OPEC decides to lower quotas, it can tighten supply, pushing up Oil prices. When OPEC increases production, it has the opposite effect. OPEC+ refers to an expanded group that includes ten extra non-OPEC members, the most notable of which is Russia.
The People’s Bank of China (PBOC) set the USD/CNY central rate on Wednesday at 7.1318, as against the previous day's fix of 7.1328 and 7.2630 Reuters estimates.
- USD/JPY trades in positive territory for the third consecutive day
- BoJ data suggested an additional $13 billion JPY intervention on Friday.
- Financial markets see the chance of a Fed rate cut by September at 100%.
The USD/JPY pair extends gains near 158.40 on the selling pressure around the Japanese currency during the early Asian session on Wednesday. The US Building Permits, Housing Starts, Industrial Production and the Fed Beige Book will be released later on Wednesday, along with the Federal Reserve’s (Fed) Barkin and Waller speeches. e data suggest the possibility of yen-buying interventions worth around 2 trillion yen on Friday,
Data released on Tuesday showed that the Bank of Japan (BoJ) stepped into the foreign exchange market on two consecutive trading days last Thursday and Friday, pushing the Japanese Yen from 162.00 to 157.00 against the USD in just two days.
However, the interest rate differential between Japan and the US continues to weigh on the JPY and create a tailwind for USD/JPY. Earlier this month, the Yen reached a low of 161.94, its lowest since December 1986.
The Japan’s Tankan Manufacturers Sentiment Index rose to 11.0 in July from 6.0 in June. This figure registered the first gain in four months and indicated a pickup in economic activity.
On the other hand, The softer US June Consumer Price Index (CPI) has spurred the chance of Fed rate cuts. The growing speculation that the Fed will cut interest rates by September might cap the pair’s upside. According to the CME FedWatch Tool, traders see the odds of a Fed rate cut by September at 100%, up from 70% a month ago.
Japanese Yen FAQs
The Japanese Yen (JPY) is one of the world’s most traded currencies. Its value is broadly determined by the performance of the Japanese economy, but more specifically by the Bank of Japan’s policy, the differential between Japanese and US bond yields, or risk sentiment among traders, among other factors.
One of the Bank of Japan’s mandates is currency control, so its moves are key for the Yen. The BoJ has directly intervened in currency markets sometimes, generally to lower the value of the Yen, although it refrains from doing it often due to political concerns of its main trading partners. The current BoJ ultra-loose monetary policy, based on massive stimulus to the economy, has caused the Yen to depreciate against its main currency peers. This process has exacerbated more recently due to an increasing policy divergence between the Bank of Japan and other main central banks, which have opted to increase interest rates sharply to fight decades-high levels of inflation.
The BoJ’s stance of sticking to ultra-loose monetary policy has led to a widening policy divergence with other central banks, particularly with the US Federal Reserve. This supports a widening of the differential between the 10-year US and Japanese bonds, which favors the US Dollar against the Japanese Yen.
The Japanese Yen is often seen as a safe-haven investment. This means that in times of market stress, investors are more likely to put their money in the Japanese currency due to its supposed reliability and stability. Turbulent times are likely to strengthen the Yen’s value against other currencies seen as more risky to invest in.
| Index | Change, points | Closed | Change, % |
|---|---|---|---|
| NIKKEI 225 | 84.4 | 41275.08 | 0.2 |
| Hang Seng | -287.96 | 17727.98 | -1.6 |
| KOSPI | 5.17 | 2866.09 | 0.18 |
| ASX 200 | -18.3 | 7999.3 | -0.23 |
| DAX | -72.86 | 18518.03 | -0.39 |
| CAC 40 | -52.68 | 7580.03 | -0.69 |
| Dow Jones | 742.76 | 40954.48 | 1.85 |
| S&P 500 | 35.98 | 5667.2 | 0.64 |
| NASDAQ Composite | 36.77 | 18509.34 | 0.2 |
| Pare | Closed | Change, % |
|---|---|---|
| AUDUSD | 0.67331 | -0.39 |
| EURJPY | 172.558 | 0.18 |
| EURUSD | 1.08988 | 0.04 |
| GBPJPY | 205.375 | 0.18 |
| GBPUSD | 1.29716 | 0.03 |
| NZDUSD | 0.605 | -0.38 |
| USDCAD | 1.36711 | -0.07 |
| USDCHF | 0.89385 | -0.19 |
| USDJPY | 158.329 | 0.15 |


© 2000-2026. Sva prava zaštićena.
Sajt je vlasništvo kompanije Teletrade D.J. LLC 2351 LLC 2022 (Euro House, Richmond Hill Road, Kingstown, VC0100, St. Vincent and the Grenadines).
Svi podaci koji se nalaze na sajtu ne predstavljaju osnovu za donošenje investicionih odluka, već su informativnog karaktera.
The company does not serve or provide services to customers who are residents of the US, Canada, Iran, The Democratic People's Republic of Korea, Yemen and FATF blacklisted countries.
Izvršenje trgovinskih operacija sa finansijskim instrumentima upotrebom marginalne trgovine pruža velike mogućnosti i omogućava investitorima ostvarivanje visokih prihoda. Međutim, takav vid trgovine povezan je sa potencijalno visokim nivoom rizika od gubitka sredstava. Проведение торговых операций на финанcовых рынках c маржинальными финанcовыми инcтрументами открывает широкие возможноcти, и позволяет инвеcторам, готовым пойти на риcк, получать выcокую прибыль, но при этом неcет в cебе потенциально выcокий уровень риcка получения убытков. Iz tog razloga je pre započinjanja trgovine potrebno odlučiti o izboru odgovarajuće investicione strategije, uzimajući u obzir raspoložive resurse.
Upotreba informacija: U slučaju potpunog ili delimičnog preuzimanja i daljeg korišćenja materijala koji se nalazi na sajtu, potrebno je navesti link odgovarajuće stranice na sajtu kompanije TeleTrade-a kao izvora informacija. Upotreba materijala na internetu mora biti praćena hiper linkom do web stranice teletrade.org. Automatski uvoz materijala i informacija sa stranice je zabranjen.
Ako imate bilo kakvih pitanja, obratite nam se pr@teletrade.global.
транcфери