- Analiza
- Novosti i instrumenti
- Vesti sa tržišta
Forex-novosti i prognoze od 17-06-2024
- As rate cut hopes persist, EUR/USD recovers from a near-term swing low near 1.0670.
- Investors shrug off cautious Fed tones to bet on September rate cut.
- EU economic data thin this week with mid-tier events, Friday’s global PMIs loom.
EUR/USD recovered to 1.0740 on Monday as market sentiment shifts back into rate cut hopes to kick off the new trading week, with investors shrugging off cautionary statements from Federal Reserve (Fed) officials that warned rate cuts may not materialize at a pace investors are happy with. US data will dominate financial headlines with Retail Sales slated for Tuesday, leaving markets shuffling in place until Friday’s global Purchasing Managers Index (PMI) figures update.
Pan-European economic figures are limited to mid-tier prints this week, leaving markets to focus on Tuesday’s upcoming US Retail Sales print. In May, US Retail Sales are expected to increase to 0.2% month-over-month after remaining flat at 0.0% in the previous month. Core Retail Sales, excluding automobile sales, are also anticipated to remain steady at 0.2%.
Read more: Fed policymakers warns that rates set to hold as the wait for more cooling inflation data continues
Throughout the week’s upcoming economic calendar, various Federal Reserve (Fed) officials are scheduled to make appearances, with a number of policymakers expressing a notably cautious stance on Monday. Although recent inflation data has shown a faster-than-expected decline, the Fed has emphasized a reluctance to implement premature rate cuts, emphasizing the need for further data before making any decisions.
Later in the week, EU and US PMI)figures scheduled for Friday are expected to split results, with market forecasts expecting a slight uptick in pan-EU activity and a slight decrease expected in US PMI figures.
EUR/USD technical outlook
EUR/USD recovered its footing on Monday, extending last Friday’s recovery from a near-term low around 1.0670. Despite intraday recovery, the Fiber remains on the low side, trading south of the 200-hour Exponential Moving Average (EMA) at 1.0770. A pattern of lower highs leaves EUR/USD at risk for a continued bearish slide.
Daily candlesticks remain firmly planted in bear country after tumbling back from the 200-day EMA at 1.0803. Bullish momentum is on pace to build a firmer bounce from recent lows below the 1.0700 handle, but pressure is mounting with a pattern of lower highs weighing on price action from December’s peak near 1.1140.
EUR/USD hourly chart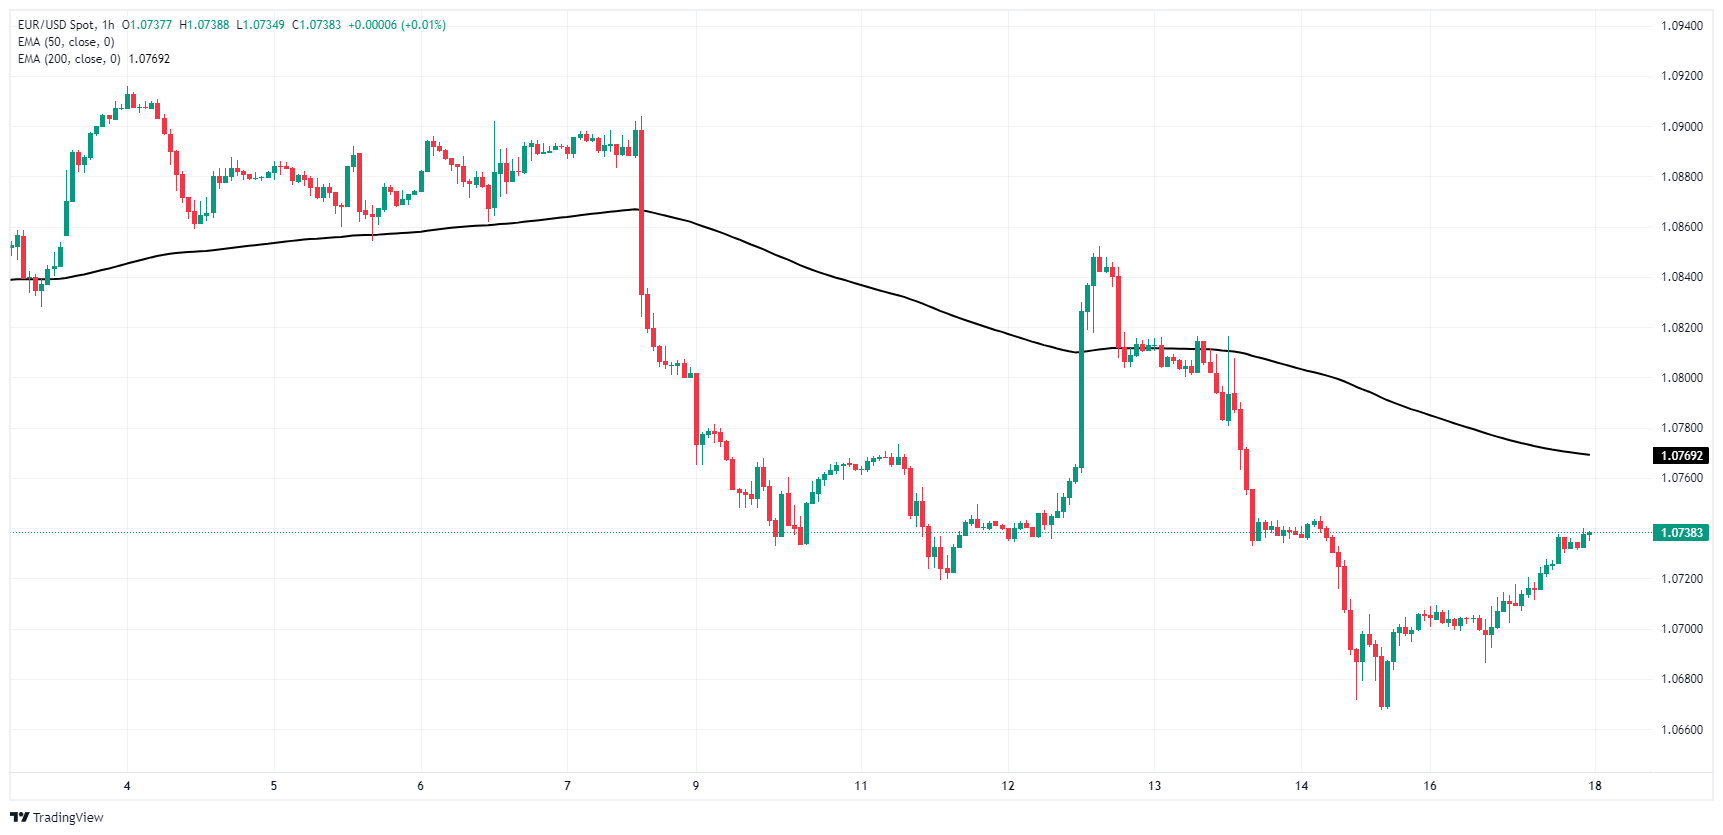
EUR/USD daily chart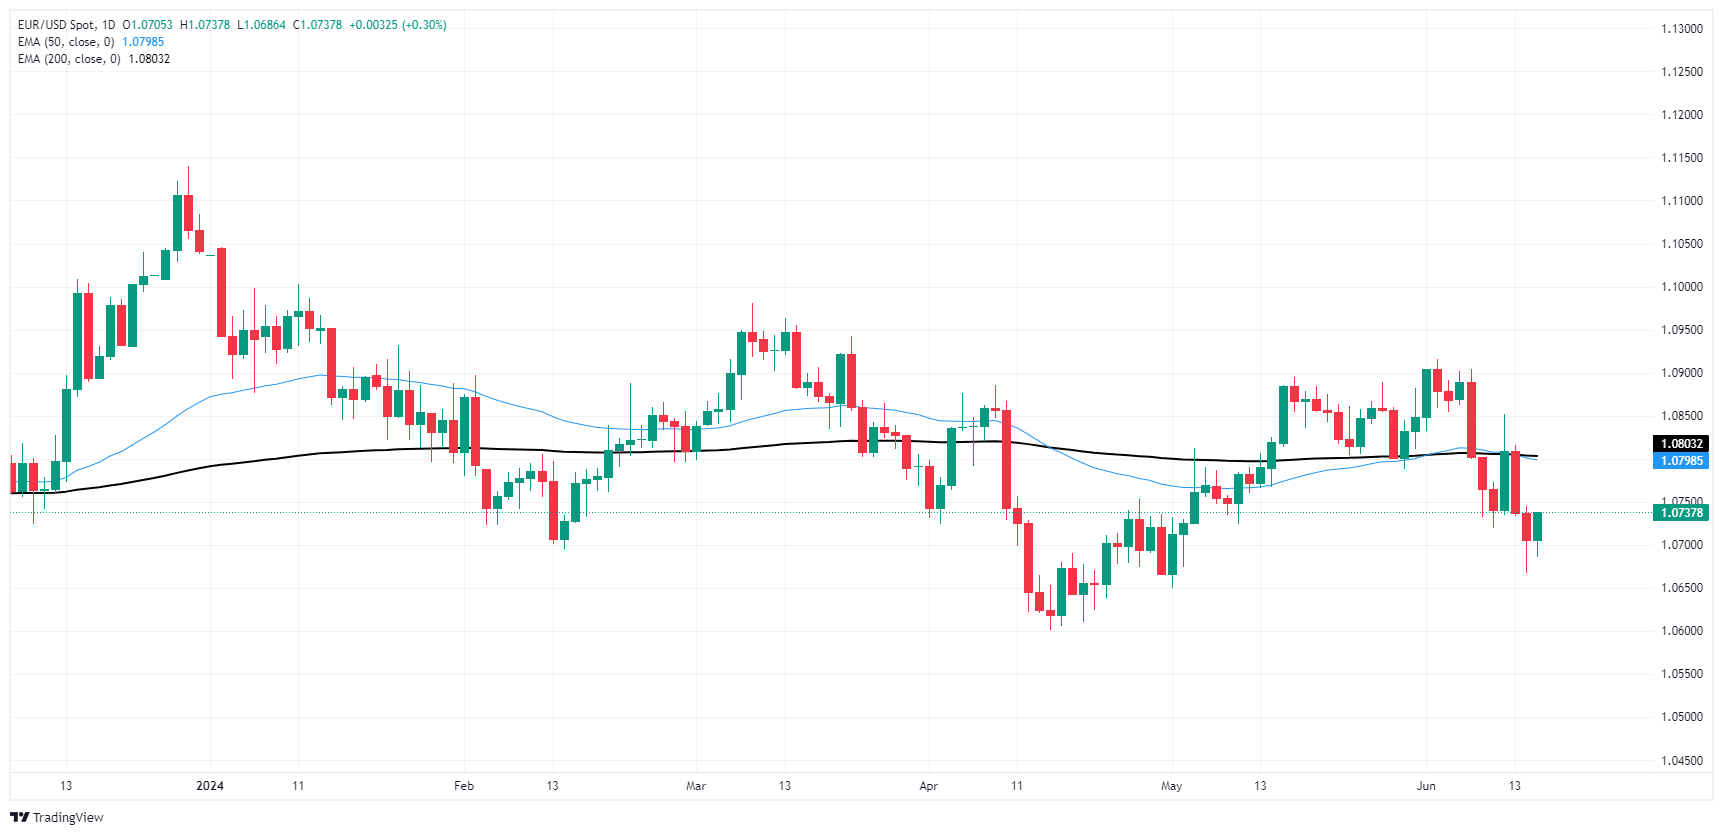
- USD/CAD trades in negative territory near 1.3720 on the softer US Dollar on Tuesday.
- Fed’s Harker said it is appropriate to keep rates on hold and wait for more data.
- Higher crude oil prices lift the commodity-linked Loonie and weigh on the pair.
The USD/CAD pair extends downside around 1.3720 during the early Asian session on Tuesday. The decline of the USD Index (DXY) and the rebound of crude oil prices weigh on the pair. The US Retail Sales and Industrial Production are due later in the day. Also, the Fed Lisa Cook, Thomas Barkin, Adriana Kugler, Lorie Logan, Alberto Musalem, and Austan Goolsbee are set to speak.
The US Federal Reserve (Fed) officials have maintained a cautious stance, noting that the Fed may need to keep rates for longer than markets expected for more cooling inflation data. Philadelphia Fed President Patrick Harker said that if the US economy behaved as he expected, one rate cut would be “appropriate” by the end of 2024, adding that it is fine to keep rates on hold and wait for more data.
Earlier, Cleveland Fed President Loretta Mester stated that she would like to see good-looking inflation data, while Minneapolis Fed President Neel Kashkari said that it would be a “reasonable prediction” that the Fed will wait until December to cut interest rates. Market expectations for rate cuts have clashed with the Fed's rate cut predictions through 2024. According to the CME's FedWatch Tool, financial markets see nearly 60% odds of at least 25 basis points (bps) of rate cuts at the September meeting.
On the Loonie front, crude oil prices edge higher as investors expect an increase in summer fuel demand due to a hotter-than-average season. This, in turn, boosts the commodity-linked Canadian Dollar (CAD) as Canada is the largest Oil exporter to the United States (US).
- Interest rate in Australia is set to stay steady at 4.35% for the fifth consecutive meeting in May.
- Reserve Bank of Australia Governor Michele Bullock will hold a press conference at 05:30 GMT.
- The Australian Dollar could see a big reaction to RBA’s policy statement and Bullock’s words.
The Reserve Bank of Australia (RBA) is unlikely to give into the pressure of a dovish policy pivot, as adopted by the Bank of Canada (BoC) and the European Central Bank (ECB) when it concludes its policy meeting on Tuesday.
The RBA is set to keep the Official Cash Rate (OCR) unchanged at 4.35% for the fifth meeting in a row in June. The decision will be announced at 04:30 GMT, while Governor Michele Bullock’s press conference will follow at 05:30 GMT.
Reserve Bank of Australia expected to extend the pause, but what’s next?
Economists are widely expecting the RBA to hold its borrowing rate at a 12-year high at yet another policy meeting, with Governor Michele Bullock likely to retain her hawkish rhetoric during the press conference.
In lieu of the stickier nature of inflation, the Australian central bank could leave the door ajar for a rate hike this year, especially after the Minutes of the RBA’s May meeting showed that the board members considered increasing interest rates.
However, the RBA could refrain from explicitly signaling a policy pivot in the upcoming meetings, maintaining a ‘higher rates for longer’ view.
The May policy statement read, “recent data have demonstrated that the process of returning inflation to target is unlikely to be smooth. Persistence of services inflation is a key uncertainty.”
Therefore, “not ruling anything in or out on future decisions,” the statement added.
The trimmed mean Consumer Price Index (CPI), the RBA’s measure of underlying inflation, ticked lower from 4.2% YoY to 4.0% year-over-year in the three months to March, but at a slower pace than expected. Meanwhile, The first quarter headline inflation rate was 1%, compared with the 0.6% pace in the December quarter. Economists had tipped it would rise to 0.8%. The main reason behind the slower-than-expected decline in inflation was the elevated services inflation alongside a tight labor market. This remains a major cause of concern for the central bank.
The recent labor market data published by the Australian Bureau of Statistics (ABS) showed that the Australian economy added 39,700 jobs in May, driven by full-time employment, compared to an expected 30,000 gain. The Unemployment Rate dipped to 4% in May from 4.1% in April.
Against this economic backdrop, the RBA is likely to remain in a wait-and-see mode until the release of the second quarter inflation data due on July 31. Another unwelcome surprise on the inflation front could warrant the RBA’s action.
Previewing the RBA policy decision, analysts at TD Securities (TDS) explained, “the Board is likely to reiterate that it "...will remain vigilant to upside risks." However we are not expecting the Board to shift its tone, comfortable for now that a higher for longer cash rate will do its job of getting on top of inflation. The Bank has indicated it's reluctant to 'fine tune' policy but if the Bank mentions Q2 CPI as a risk, this would be considered hawkish.”
How will the RBA interest rate decision impact AUD/USD?
Having faced rejection once again at the 0.6700 level, the Australian Dollar (AUD) has turned south against the US Dollar (USD). If RBA Governor Bullock explicitly signals a rate hike in the upcoming meetings this year, AUD/USD could see a fresh upswing toward the abovementioned key resistance.
On the other hand, AUD/USD could extend the ongoing downtrend to test 0.6500 on the RBA’s failure to affirm the hawkish expectations. Therefore, the language in the policy statement and Bullock’s comments are likely to determine the next directional move in the AUD/USD pair.
In the lead-up to the RBA showdown, big banks, including Australia and New Zealand Banking Group (ANZ) and Societe Generale, have pushed back the likely timing of the RBA's first interest rate cut to early 2025 from November this year.
Dhwani Mehta, Asian Session Lead Analyst at FXStreet, notes key technicals to trade AUD/USD on the policy outcome. “AUD/USD is on track to challenge a critical demand area near 0.6650, where the 100-day and 200-day Simple Moving Averages (SMA) hang around. The 14-day Relative Strength Index (RSI) points lower below the 50 level, indicating a clear downside path for the pair heading into the RBA interest rate decision.”
“Aussie buyers need to defend the abovementioned key support near 0.6550 on a daily closing basis to attempt a rebound toward the 21-day SMA at 0.6635. The next upside barrier is seen at the critical 0.6700 threshold. Conversely, a downside break of the 0.6550 support zone could trigger a fresh downtrend toward the 0.6500 level. The last line of defense for buyers is seen at 0.6477, the March 5 low,” Dhwani adds.
Economic Indicator
RBA Interest Rate Decision
The Reserve Bank of Australia (RBA) announces its interest rate decision at the end of its eight scheduled meetings per year. If the RBA is hawkish about the inflationary outlook of the economy and raises interest rates it is usually bullish for the Australian Dollar (AUD). Likewise, if the RBA has a dovish view on the Australian economy and keeps interest rates unchanged, or cuts them, it is seen as bearish for AUD.
Read more.Next release: Tue Jun 18, 2024 04:30
Frequency: Irregular
Consensus: 4.35%
Previous: 4.35%
Source: Reserve Bank of Australia
RBA FAQs
The Reserve Bank of Australia (RBA) sets interest rates and manages monetary policy for Australia. Decisions are made by a board of governors at 11 meetings a year and ad hoc emergency meetings as required. The RBA’s primary mandate is to maintain price stability, which means an inflation rate of 2-3%, but also “..to contribute to the stability of the currency, full employment, and the economic prosperity and welfare of the Australian people.” Its main tool for achieving this is by raising or lowering interest rates. Relatively high interest rates will strengthen the Australian Dollar (AUD) and vice versa. Other RBA tools include quantitative easing and tightening.
While inflation had always traditionally been thought of as a negative factor for currencies since it lowers the value of money in general, the opposite has actually been the case in modern times with the relaxation of cross-border capital controls. Moderately higher inflation now tends to lead central banks to put up their interest rates, which in turn has the effect of attracting more capital inflows from global investors seeking a lucrative place to keep their money. This increases demand for the local currency, which in the case of Australia is the Aussie Dollar.
Macroeconomic data gauges the health of an economy and can have an impact on the value of its currency. Investors prefer to invest their capital in economies that are safe and growing rather than precarious and shrinking. Greater capital inflows increase the aggregate demand and value of the domestic currency. Classic indicators, such as GDP, Manufacturing and Services PMIs, employment, and consumer sentiment surveys can influence AUD. A strong economy may encourage the Reserve Bank of Australia to put up interest rates, also supporting AUD.
Quantitative Easing (QE) is a tool used in extreme situations when lowering interest rates is not enough to restore the flow of credit in the economy. QE is the process by which the Reserve Bank of Australia (RBA) prints Australian Dollars (AUD) for the purpose of buying assets – usually government or corporate bonds – from financial institutions, thereby providing them with much-needed liquidity. QE usually results in a weaker AUD.
Quantitative tightening (QT) is the reverse of QE. It is undertaken after QE when an economic recovery is underway and inflation starts rising. Whilst in QE the Reserve Bank of Australia (RBA) purchases government and corporate bonds from financial institutions to provide them with liquidity, in QT the RBA stops buying more assets, and stops reinvesting the principal maturing on the bonds it already holds. It would be positive (or bullish) for the Australian Dollar.
- Silver's price drops to $29.49, posting minimal losses of 0.38%.
- First support level at the 50-day moving average near $29.01.
- If Silver buyers clear $30.00, a re-test of the YTD high of $32.51 is possible.
Silver's price edged lower and posted minimal losses of 0.38% on Monday. Elevated US Treasury bond yields amid Fed hawkish commentary undermined the grey metal. Therefore, the XAG/USD trades at $29.49 at the time of writing.
XAG/USD Price Analysis: Technical outlook
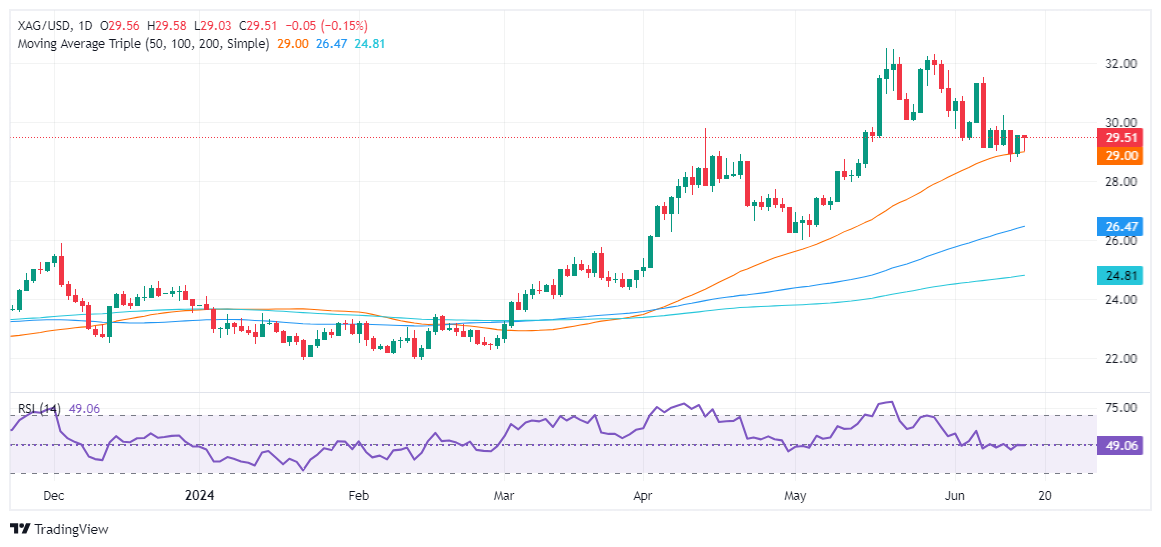
The grey metal is neutral to downward biased after hitting an eleven-year high of 32.51. Since then, the pair retreated towards an area near the 50-day moving average (DMA) at around $29.01, which is the first support level.
Momentum turned bearish, with the Relative Strength Index (RSI) standing below the 50-midline.
Therefore, the first support level for XAG/USD would be the 50-DMA. If the Silver price dives below that level, the next support level will be the 100-DMA at $26.40, ahead of the May 2 low of $26.02.
On the other hand, if Silver buyers conquer $29.00, they must clear the $30.00 handle if they want to re-test the year-to-date (YTD) high of $32.51.
XAG/USD Price Action – Daily Chart
- GBP/USD bounced back to 1.2700 after a hard drop to 1.2660.
- US Retail Sales in the barrel for Tuesday, UK CPI inflation slated for Wednesday.
- Fed rate cut hopes continue to drive market flows despite cautious rhetoric.
GBP/USD halted a recent slide on Monday, recovering 1.2700 after bottoming out near 1.2660 last week. Broader market sentiment recovered to kick off the new week as investors shrug off cautionary tones from Federal Reserve (Fed) officials to continue hoping for a September rate cut as US economic data softens.
Tuesday’s upcoming US Retail Sales will draw the market’s outlook sharply into focus. US Retail Sales in May are expected to tick back up to 0.2% MoM after the previous month’s 0.0% flat print. Core Retail Sales excluding automobiles in May are also expected to hold steady at 0.2%. Later in the week, US Purchasing Managers Index (PMI) figures scheduled for Friday are expected to ease slightly.
Read more: Fed policymakers warns that rates set to hold as the wait for more cooling inflation data continues
Fed official appearances are muttered throughout the week’s economic calendar, with several policymakers striking a notably cautious tone on Monday. Recent inflation data has cooled faster than expected, but the Fed remains in no rush to cut too early, cautioning that more data is needed before making a decision on rates.
UK CPI inflation is due Wednesday, forecast to tick upwards to 0.4% MoM in May, rising from the previous month’s 0.3%. The Bank of England (BoE) also gathers for a fresh vote on interest rates. The UK central bank is broadly expected to hold interest rates at 5.25% in June, with the Monetary Policy Committee (MPC) forecast to vote seven-to-two on keeping rates unchanged, inline with the BoE’s previous meeting.
GBP/USD technical outlook
GBP/USD rose back into the 1.2700 handle on Monday, but bullish momentum remains limited and the pair will need a fresh push to reclaim chart territory north of the 200-hour Exponential Moving Average (EMA) at 1.2734. The pair remains steeply off of last week’s peak bids near 1.2860, and near-term volatility has pushed the technical boundaries wider, leaving the pair to waffle in congestion.
A long-term supply zone beyond the 1.2800 handle continues to crimp bullish momentum on daily candlesticks despite Monday’s bounce from the 50-day EMA at 1.2671. The pair is holding on the north side of technical support from the 200-day EMA at 1.2593, but bidders are struggling to gather the needed momentum to break back into 2024’s peak bids near 1.2900.
GBP/USD hourly chart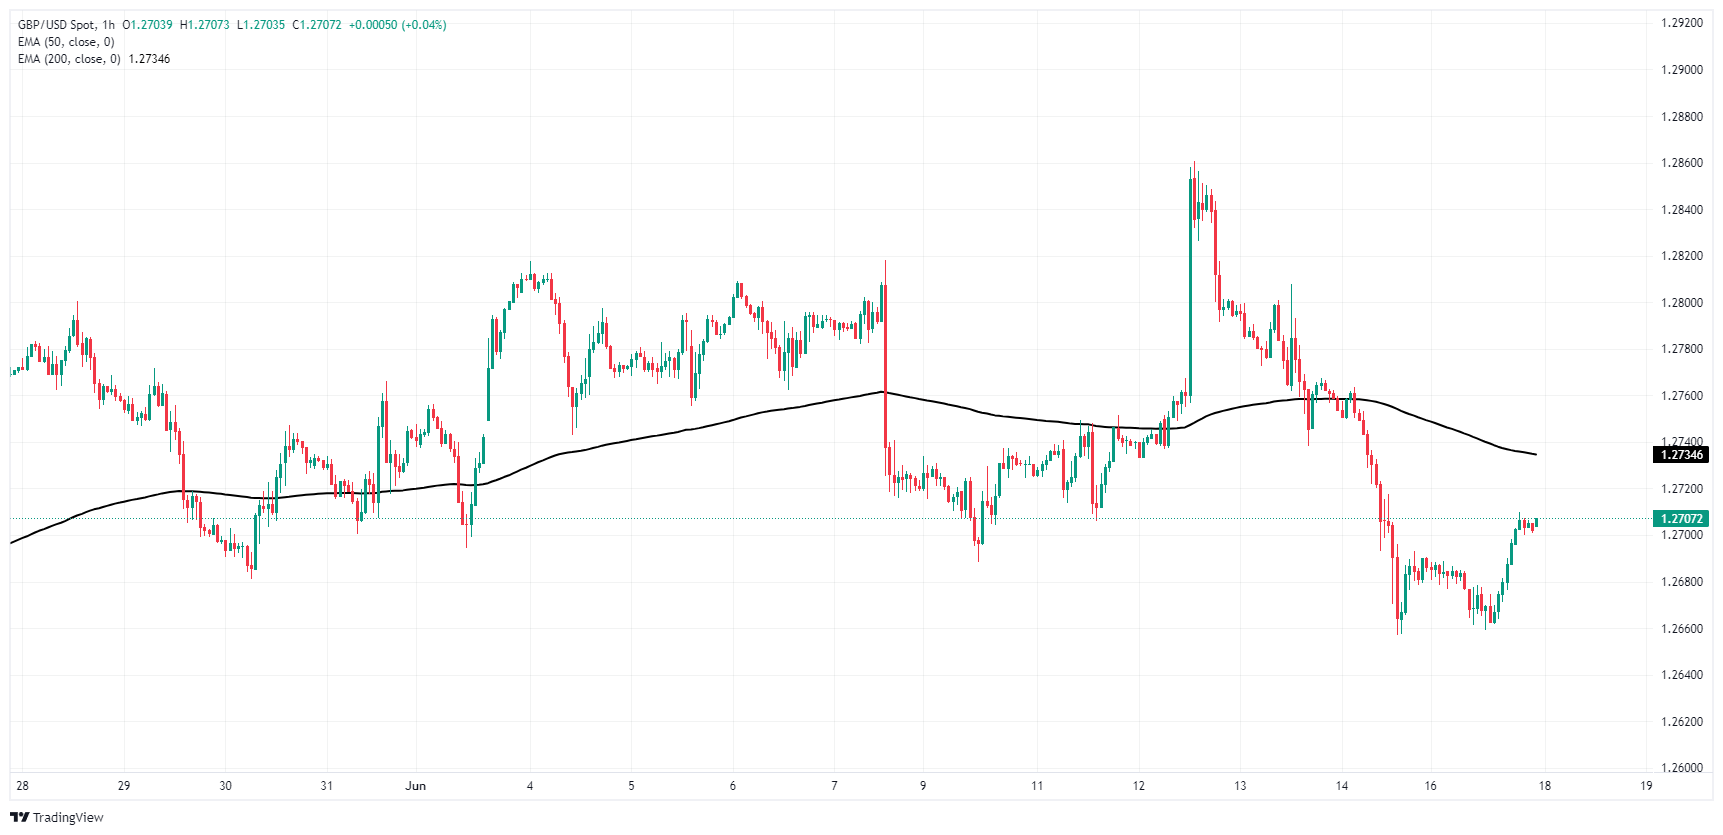
GBP/USD daily chart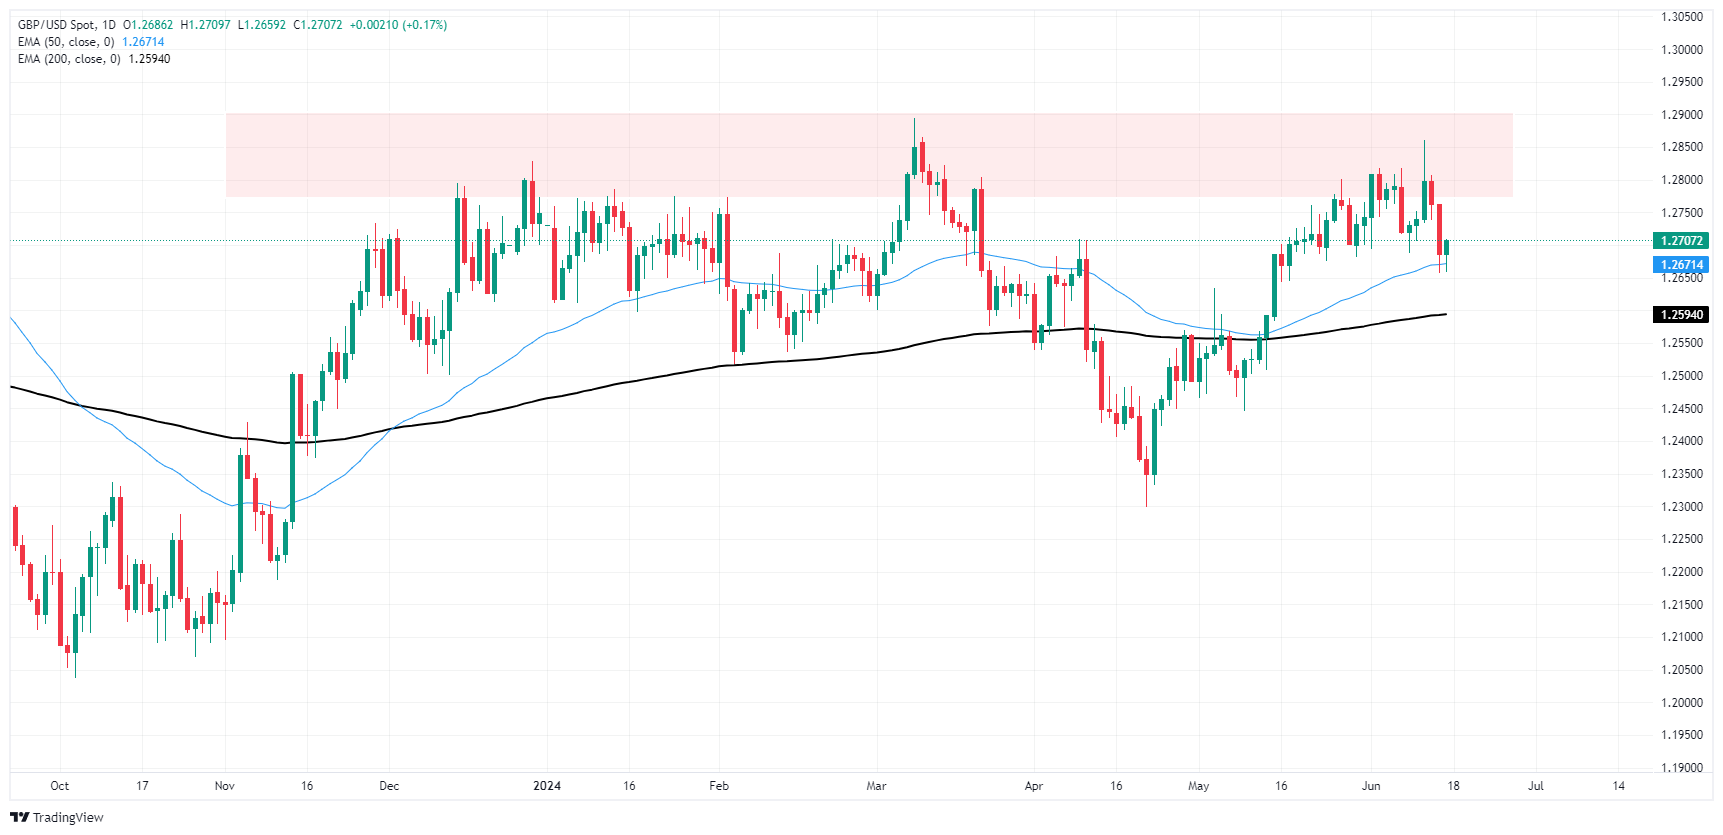
- The NZD/USD slips further below the 20-day SMA as bears reinforce their strength.
- Daily chart indicators suggest an ongoing consolidation phase, marked by a slight negative momentum following last Wednesday’s push.
- The pair fell to a low of 0.6105 but bulls managed to clear most of its losses.
The NZD/USD continued its descent on Monday, moving below the 20-day Simple Moving Average (SMA) of 0.6140 the buyers managed to clear most of its daily losses. The pair seems to be stuck in a state of consolidation following the sharp surge last week to 0.6220. Despite buyers' attempts, the 20-day SMA could not be sustained, and losses could potentially extend if this trend continues.
Meanwhile, on the daily chart, the Relative Strength Index (RSI) has maintained its negative momentum, suggesting a faltering buying pressure. The downward orientation of the RSI is consistent with the flat red bars displayed by the Moving Average Convergence Divergence (MACD), further emphasizing the ongoing consolidation narrative.
NZD/USD daily chart
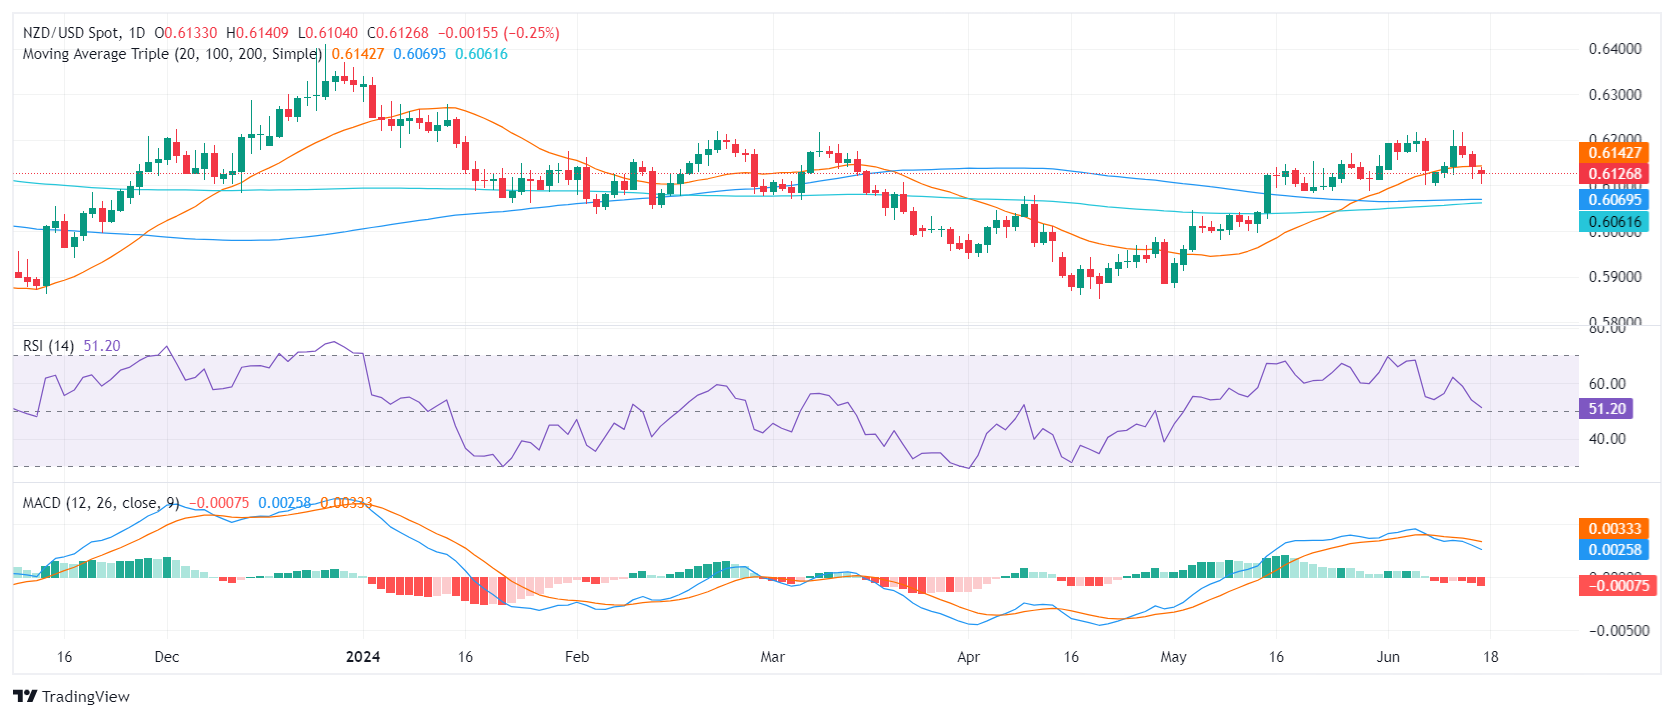
The NZD/USD's immediate resistance level stands at the 20-day SMA of 0.6140. Simultaneously, the convergence of the 100 and 200-day SMAs in the 0.6050-0.6060 region builds a sturdy support base for the pair, which is likely to aid in correction should the bears seize control. Movements below this convergence point could indicate sell conditions.
Furthermore, the main resistance continues to stand at the 0.6200 level. A breach at this point could be viewed as a buy signal, signaling an overturn of the bearish sentiment.
- USD/JPY hits a daily low of 156.81, currently trading at 157.43.
- Major trading above 50, 100, and 200-day moving averages, confirming upward bias.
- Key resistance levels: 158.25 (June 17 high) and 158.44 (April 26 peak), with YTD high at 160.32 in sight.
The USD/JPY climbed for the second straight day, up 0.27% after hitting a daily low of 156.81, as US Treasury bond yields climbed six basis points on speculation that the Federal Reserve will keep interest rates unchanged. At the time of writing, the pair trades at 157.43.
USD/JPY Price Analysis: Technical outlook
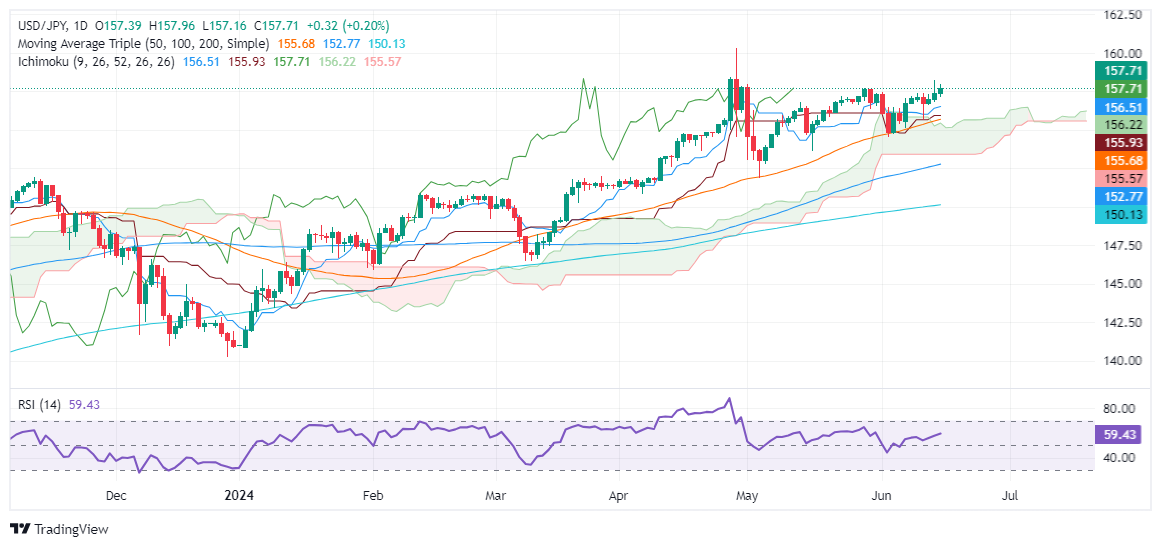
The uptrend in the USD/JPY remains, though Monday’s price action suggests that buyers remain cautious amid fears of Japanese authority's intervention. The major is trading above the 50, 100, and 200-day moving averages (DMAs), further confirming the upward bias supported by the Relatives Strength Index (RSI), which shows momentum is bullish.
If USD/JPY climbs above 157.00, the next resistance level would be the 158.25 high hit on June 17, followed by the April 26 peak at 158.44. If those levels are cleared, up next would be the year-to-date (YTD) high of 160.32.
Conversely, if USD/JPY drops below 157.00, sellers can challenge key support levels. The first one would be the Senkou Span A at 156.16, followed by the Kijun-Sen at 155.93. The next demand area would be the Senkou Span B at 155.52.
USD/JPY Price Action – Daily Chart
- The AUD/JPY showed tepid losses on Monday and then recovered, focusing on building support around the 20-day SMA regained last week.
- Given continued side-ways trading, the pair might move in the 104.00 - 105.00 range.
In Monday's session, the AUD/JPY pair experienced limited losses and then recovered to trade with gains, with attention focused on reinforcing the support at the 20-day Simple Moving Average (SMA), after dipping briefly below 103.60 and then recovering it back. The price recovery above the 104.00 level indicates the robust supportive role played by this SMA, which once served as a barrier to the bulls.
On a daily scale, the Relative Strength Index (RSI) stands flat at 57. This neutral stance indicates a weak buying pressure and that the overall technical outlook remains balanced. Likewise, the Moving Average Convergence Divergence (MACD) continues to show flat red bars, indicating a steady selling momentum.
AUD/JPY daily chart
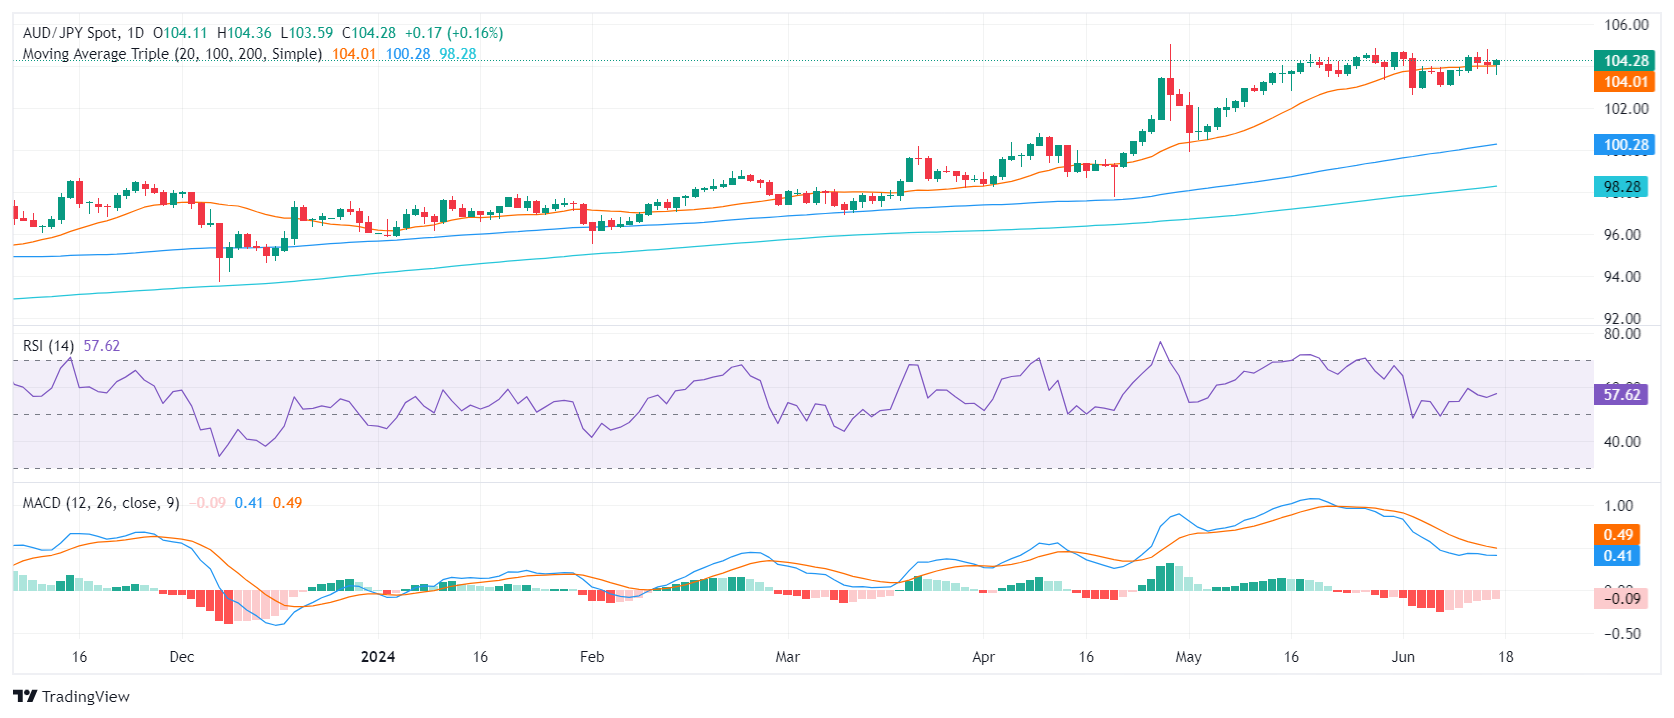
Summing up, ongoing consolidation is the trend for the AUD/JPY pair, despite a small loss on Monday, with trading activity focused around the 20-day SMA. This situation leads to an expectation of continued sideways trading within the 104.00-105.00 range for the forthcoming sessions, as bulls are consolidating the gains from May's rally that took the pair near the 105.00 level.
However, the periods of consolidation suggest a prep phase for bulls aiming for the 104.50-105.00 range once again. On the other hand, a breach below the 20-day SMA could tempt the sellers, with support lining up at 103.60, just below the mentioned SMA. Further supports exist at 102.60, and long-term at the 100 and 200-day SMAs, situated in the 100.00 to 98.00 bracket.
- WTI climbs to $80 per barrel as energy markets hope for summer demand uptick.
- Crude Oil markets shrug off disappointment Chinese demand figures.
- OPEC+ production limits set to expire, could swamp out Crude supplies.
West Texas Intermediate (WTI) US Crude Oil shrugged off recent bearish pressures to climb back towards the $80.00 handle on Monday. Energy markets are shrugging off the planned end of voluntary production cuts from the Organization of the Petroleum Exporting Countries (OPEC) and a miss from updated Chinese demand figures. Barrel traders continue to hope for an expected uptick in summer Crude Oil demand to stop up a possible oversupply wave that could hit barrel stocks as production continues to outpace projections.
A planned phasing out of voluntary production cuts for OPEC ally member states, OPEC+, is expected to begin later in the year as OPEC+ begins to crack under the financial pressure of trying to prop up global Crude Oil prices. Chinese production figures also missed the mark over the weekend, threatening future hopes of an uptick in industrial fuels production. Despite headwinds on multiple fronts, Crude Oil markets are grinding out higher ground to kick off the new trading week as investors expect an uptick in summer fuel demand with a hotter-than-average summer season expected.
Crude Oil technical outlook
WTI US Crude Oil climbed back over the 200-day Exponential Moving Average (EMA) at $78.81, tipping into the touch range of the $80.00 handle as it continues an extended recovery from the recent multi-month swing low at $72.45.
A short-side play could be on the cards if bullish exhaustion runs out of gas near $80.00, but bidders could find technical support as WTI cracks above a descending trendline drawn from 2024’s peak bids above $86.00.
WTI hourly chart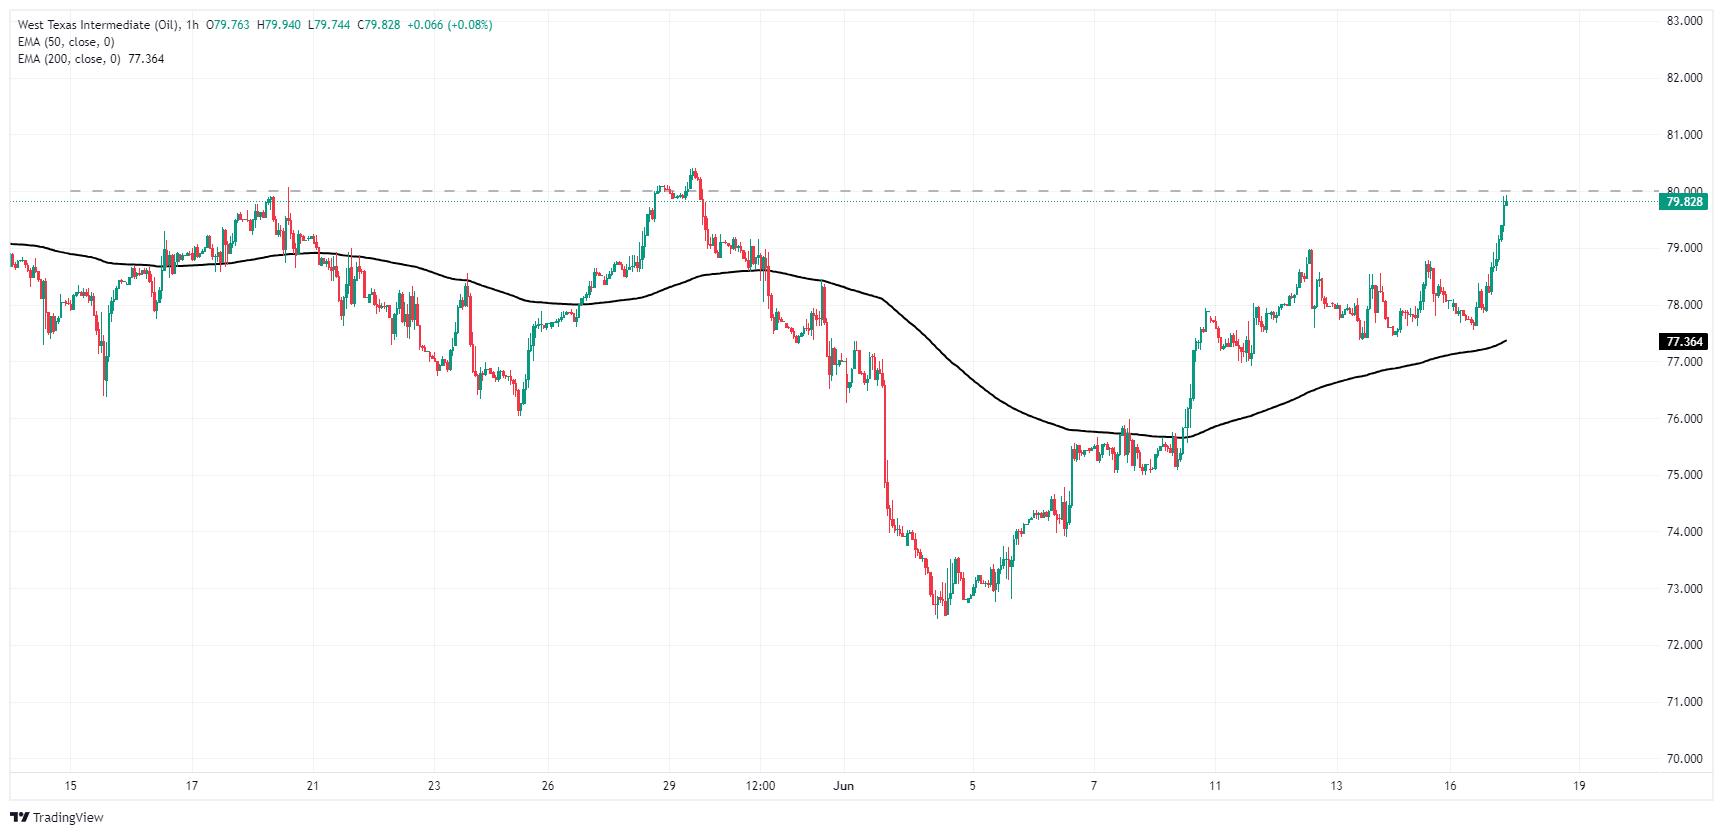
WTI daily chart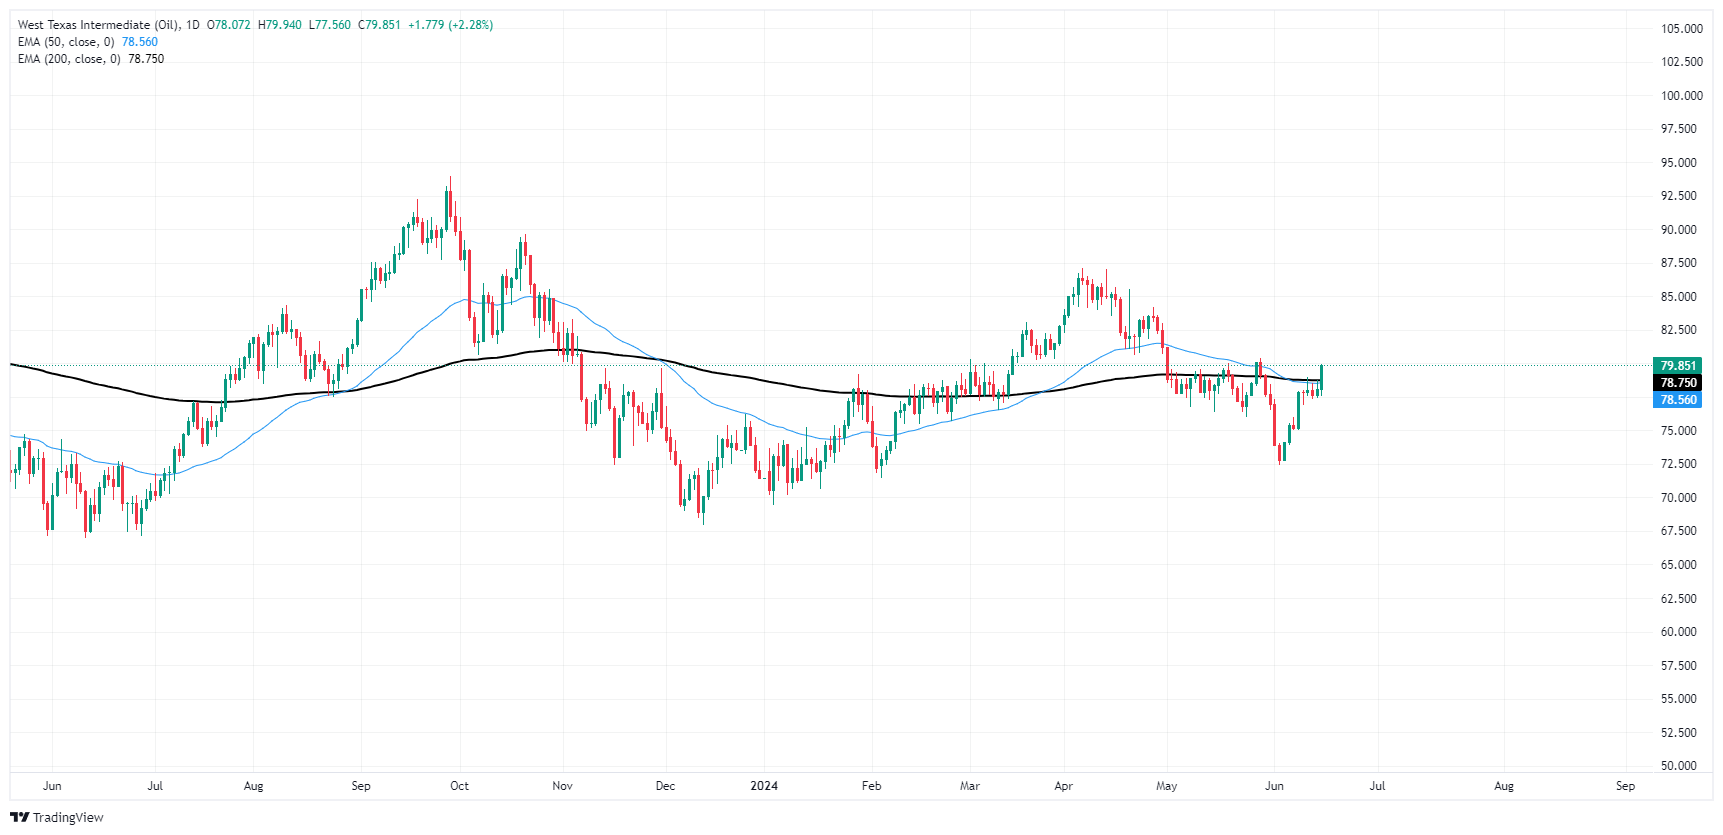
- Polls commissioned by MORENA indicate 80% support for judicial reform and 70% for electing Supreme Court judges.
- Nearly 90% favor an independent judicial watchdog; around 40% believe many judges and magistrates are corrupt.
Mexico’s President-Elect Claudia Sheinbaum revealed that polls commissioned by the ruling party, Morena, supported the popular election of Supreme Court judges.
Claudia Sheinbaum said, “These polls are information, they don't have another objective,” and added, “This is just information to be considered in the discussions that will start in the coming days.”
Sheinbaum commented that she would hold talks with elected senators and deputies on Tuesday and compromised public forums to discuss the plan.
According to Reuters,” Some 70% backed the popular election of Supreme Court judges, and nearly 90% supported an independent judicial watchdog to probe possible misdeeds or corruption. Around 40% said they believed most judges, magistrates and ministers were corrupt.”
The polls jointly surveyed some 3,855 people between June 14-16 with margins of error of just under 3%.
USD/MXN Reaction
The pair trades at around 18.53, slightly above the 18.50 figure, consolidated. A daily close above the latter could pave the way for further gains. Otherwise, the USD/MXN would likely remain at around 18.35-19.00.
Mexican Peso FAQs
The Mexican Peso (MXN) is the most traded currency among its Latin American peers. Its value is broadly determined by the performance of the Mexican economy, the country’s central bank’s policy, the amount of foreign investment in the country and even the levels of remittances sent by Mexicans who live abroad, particularly in the United States. Geopolitical trends can also move MXN: for example, the process of nearshoring – or the decision by some firms to relocate manufacturing capacity and supply chains closer to their home countries – is also seen as a catalyst for the Mexican currency as the country is considered a key manufacturing hub in the American continent. Another catalyst for MXN is Oil prices as Mexico is a key exporter of the commodity.
The main objective of Mexico’s central bank, also known as Banxico, is to maintain inflation at low and stable levels (at or close to its target of 3%, the midpoint in a tolerance band of between 2% and 4%). To this end, the bank sets an appropriate level of interest rates. When inflation is too high, Banxico will attempt to tame it by raising interest rates, making it more expensive for households and businesses to borrow money, thus cooling demand and the overall economy. Higher interest rates are generally positive for the Mexican Peso (MXN) as they lead to higher yields, making the country a more attractive place for investors. On the contrary, lower interest rates tend to weaken MXN.
Macroeconomic data releases are key to assess the state of the economy and can have an impact on the Mexican Peso (MXN) valuation. A strong Mexican economy, based on high economic growth, low unemployment and high confidence is good for MXN. Not only does it attract more foreign investment but it may encourage the Bank of Mexico (Banxico) to increase interest rates, particularly if this strength comes together with elevated inflation. However, if economic data is weak, MXN is likely to depreciate.
As an emerging-market currency, the Mexican Peso (MXN) tends to strive during risk-on periods, or when investors perceive that broader market risks are low and thus are eager to engage with investments that carry a higher risk. Conversely, MXN tends to weaken at times of market turbulence or economic uncertainty as investors tend to sell higher-risk assets and flee to the more-stable safe havens.
- The consolidation phase extends as the Kiwi witnesses difficulty against the Yen.
- Indicators on the daily chart trend downwards, indicating potential for further consolidation in the upcoming sessions.
- Retesting the 97.00 level could be on the cards, but a break above this resistance appears unlikely due to weak buying traction.
On Monday, the NZD/JPY pair extended its consolidation phase after hitting a multi-year high last week. The technical landscape suggests that sellers may have their chance as consolidation continues, potentially limiting the pair's upward movement under the key resistance level of 97.00. However, the 20-day Simple Moving Average (SMA) is holding as strong support and bulls continue to defend it.
The daily Relative Strength Index (RSI) for NZD/JPY now stands at 60, indicating a slight retracement downwards and a decrease in the bullish momentum. The Moving Average Convergence Divergence (MACD) continues to print rising red bars, indicating an ongoing consolidation phase.
NZD/JPY daily chart
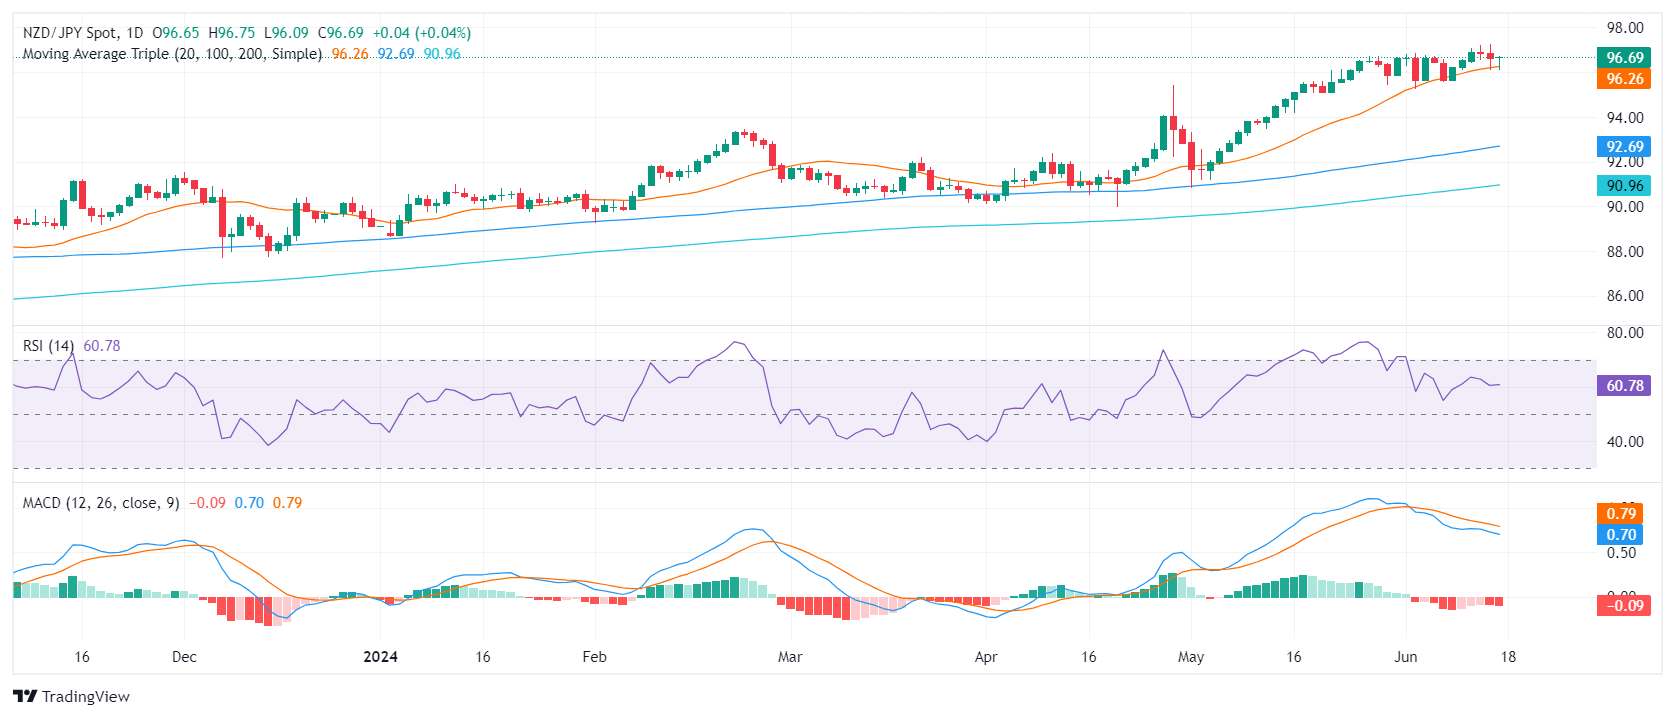
Buyers continue to maintain their stand above the 20-day Simple Moving Average (SMA), demonstrating an effort to uphold the bullish trend. Regardless, the downturn observed in the daily technical indicators points towards the market's need for further consolidation after the significant leap to nearly 96.00 since May.
The upcoming trading sessions might witness the pair movings between the support level of 95.00 and the resistance level of 97.00 as this pair remains among the tallest since June 2007. Notably, the bears have struggled twice consecutively to breach the 20-day SMA at 96.20, making it unlikely for the downtrend to continue The longer-term 100-day and 200-day Simple Moving Averages (SMAs), established roughly around 90.00 - 92.00, continue to protect the overall bullish aspect of the pair. The area around 95.30 also offers substantial support against potential losses.
- Gold price starts week on back foot as high US yields dent appetite for the non-yielding metal.
- Fed officials signal only one rate cut in 2024 via Minneapolis Fed's Neel Kashkari.
- Upcoming US economic data releases, including Retail Sales and Industrial Production, to influence Gold price.
- Precious metals traders await US Retail Sales and Industrial Production on June 18.
Gold prices retreated on Monday due to rising US Treasury bond yields after Federal Reserve (Fed) officials decided to keep rates unchanged and revised their expectations on rate cuts from three to one later in the year. Therefore, the XAU/USD trades at $2,317, down 0.63%, after retreating from the daily high of $2,332.
The golden metal is on the defensive as US Treasury bond yields advance after Fed officials remained hawkish. Despite that, the Greenback failed to gain traction and remains one of the laggards in the FX space.
Over the weekend, the Minneapolis Fed’s Neel Kashkari discussed monetary policy, saying that “it’s a reasonable prediction” that the Fed will ease policy by just 25 basis points (bps) in 2024. This would keep US bond yields high, making it less appealing to hold bullion as the fed funds rate remains lofty.
Earlier, Philadelphia Fed President Patrick Harker said that if the economy evolves as expected, one rate cut in 2024 is expected. He said the policy is restrictive and positioned to bring inflation to 2%.
Gold traders will watch the release of Retail Sales, Industrial Production, Initial Jobless Claims, and the S&P Global Purchasing Managers Index (PMI) figures.
Data from the Chicago Board of Trade (CBOT) shows traders expect 35 bps of easing during the year via December’s 2024 fed funds rate contract.
News that the People’s Bank of China has paused its 18-month bullion buying spree has weighed on the precious metal. PBOC holdings held steady at 72.80 million troy ounces of Gold in May.
Daily digest market movers: Gold price flops on higher US yields
- Rising US Treasury yields remained high, capping Gold’s advance. The US 10-year T-yield is up almost six bps to 4.281%.
- US Dollar Index (DXY) decreased by 0.18% to 105.34, putting a lid on Gold price.
- Despite US CPI report showing disinflation process continuing, Fed Chair Jerome Powell commented that they remain “less confident” about the progress on inflation.
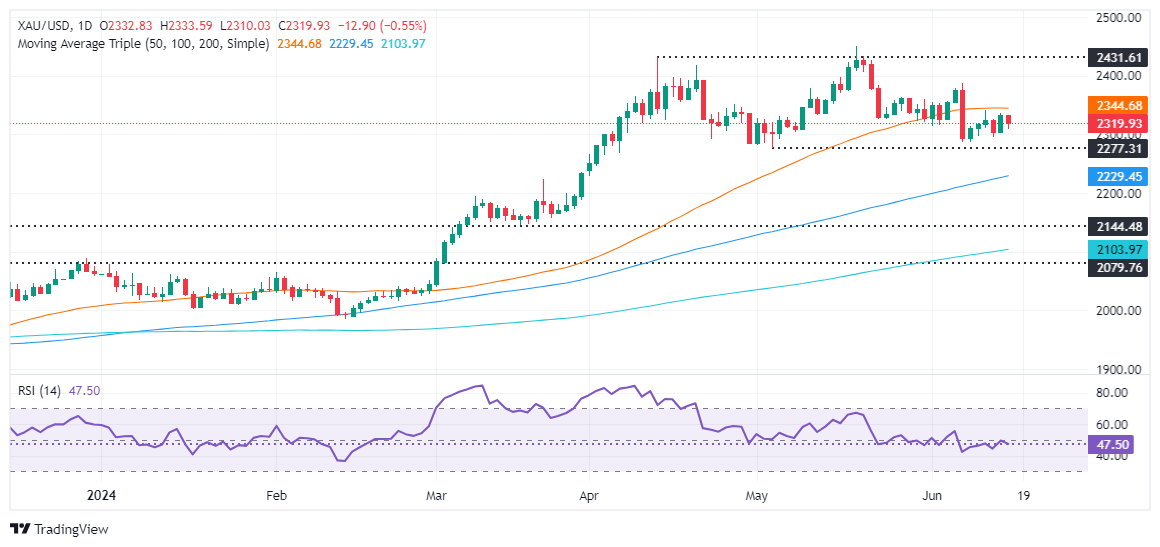
Technical analysis: Gold price sellers regain control as prices are headed toward $2,300
Gold price is neutral to downwardly biased as the Head-and-Shoulders chart pattern remains intact, hinting that the golden metal could dip below the $2,200 mark. Momentum shows that sellers are gathering steam with the Relative Strength Index (RSI) diving further into bearish territory, opening the door for further losses.
If XAU/USD drops below $2,300, the first support would be the May 3 low of $2,277, followed by the March 21 high of $2,222. Further losses lie beneath, as sellers would eye the Head-and-Shoulders chart pattern objective from $2,170 to $2,160.
Otherwise, if Gold extends its gains past the June 7 cycle high of $2,387, it will be ready to test the $2,400 figure.
Gold FAQs
Gold has played a key role in human’s history as it has been widely used as a store of value and medium of exchange. Currently, apart from its shine and usage for jewelry, the precious metal is widely seen as a safe-haven asset, meaning that it is considered a good investment during turbulent times. Gold is also widely seen as a hedge against inflation and against depreciating currencies as it doesn’t rely on any specific issuer or government.
Central banks are the biggest Gold holders. In their aim to support their currencies in turbulent times, central banks tend to diversify their reserves and buy Gold to improve the perceived strength of the economy and the currency. High Gold reserves can be a source of trust for a country’s solvency. Central banks added 1,136 tonnes of Gold worth around $70 billion to their reserves in 2022, according to data from the World Gold Council. This is the highest yearly purchase since records began. Central banks from emerging economies such as China, India and Turkey are quickly increasing their Gold reserves.
Gold has an inverse correlation with the US Dollar and US Treasuries, which are both major reserve and safe-haven assets. When the Dollar depreciates, Gold tends to rise, enabling investors and central banks to diversify their assets in turbulent times. Gold is also inversely correlated with risk assets. A rally in the stock market tends to weaken Gold price, while sell-offs in riskier markets tend to favor the precious metal.
The price can move due to a wide range of factors. Geopolitical instability or fears of a deep recession can quickly make Gold price escalate due to its safe-haven status. As a yield-less asset, Gold tends to rise with lower interest rates, while higher cost of money usually weighs down on the yellow metal. Still, most moves depend on how the US Dollar (USD) behaves as the asset is priced in dollars (XAU/USD). A strong Dollar tends to keep the price of Gold controlled, whereas a weaker Dollar is likely to push Gold prices up.
The Greenback gave away part of its recent advance despite the rebound in US yields in response to an improvement in the broad risk appetite trends and somewhat easing political jitters in Europe.
Here is what you need to know on Tuesday, June 18:
The USD Index (DXY) left behind two strong daily advances in a row amidst investors’ speculation of two interest rate cuts by the Fed in 2024. A busy calendar on June 18 will see Retail Sales, Industrial Production, Business Inventories and TIC Flows. In addition, Fed’s Cook, Barkin, Collins, Kugler, Logan, Musalem and Goolsbee are all due to speak.
EUR/USD showed some signs of life after Friday’s multi-week lows well south of the 1.0700 support. The final Inflation Rate in the euro zone, and the Economic Sentiment in both Germany and the Euroland are expected on June 18.
GBP/USD regained composure, set aside two straight sessions of losses and reclaimed the area beyond 1.2700 the figure. Next on tap in the UK calendar will be the release of the Inflation Rate on June 19.
USD/JPY maintained the bullish trade well in place and flirted with the 158.00 barrier once again in quite an auspicious start to the week. The Japanese docket will be empty on June 18.
AUD/USD alternated gains and losses around the 0.6600 neighbourhood ahead of the key interest rate decision by the RBA. On June 18, the RBA will decide on interest rates.
Prices of WTI added to Friday’s advance and challenged the key 200-day SMA above the $79.00 mark per barrel.
The rebound in US yields and some incipient risk-on trade weighed on Gold prices and sparked modest losses on Monday. By the same token, Silver partially faded Friday’s advance and revisited the low-$29.00s.
- AUD/USD extended its decline in Monday's session as market gears up for RBA decision.
- Federal Reserve's projection of higher interest rates continues to bolster the USD.
- Australian and American economic calendars remain empty on Monday.
The Australian Dollar (AUD) experienced additional losses against the US Dollar (USD) on Monday as markets gear up for Tuesday’s Reserve Bank of Australia (RBA) decision.
The Australian economy shows some signs of weakness, but stubbornly high inflation is prompting the RBA to delay cuts, which may limit its decline. The RBA's meeting concludes on Tuesday when investors will look for further clues. Markets are pricing in the first rate cut only for May 2025.
Daily digest market movers: Australian Dollar sustains sell-off, markets await RBA's decision
- No significant highlights were detected from the Australian economy on Friday.
- Reserve Bank of Australia meets on Tuesday and is expected to keep rates steady at 4.35%.
- The RBA is expected to stick to its neutral policy guidance that the bank is not ruling anything in or out.
- Following the May 7 meeting, Governor Bullock confirmed that the board discussed the option of raising rates. This option will likely remain on the table as inflation doesn’t show signs of easing.
- Market fully projects in a cut at the February meeting.
- Market hopes for rate cuts have persistently clashed with the Fed’s rate cut expectations through 2024, and according to the CME’s FedWatch Tool, rate markets maintain over 60% odds of at least a 25 basis-point rate trim on September 18.
Technical analysis: Sellers persist as Aussie approaches key level
The Relative Strength Index (RSI) now sits below 50 and points downwards, indicating negative momentum. Meanwhile, the Moving Average Convergence Divergence (MACD) prints steady rising red bars hinting at persistent selling pressure.
The short-term outlook has turned negative as the pair fell below the 20-day Simple Moving Average (SMA) toward 0.6613, indicating a loss in buying steam. As sellers continue to advance, the area of 0.6560-0.6550 where the 100 and 200-day Simple Moving Averages (SMAs) converge might be retested.
Australian Dollar FAQs
One of the most significant factors for the Australian Dollar (AUD) is the level of interest rates set by the Reserve Bank of Australia (RBA). Because Australia is a resource-rich country another key driver is the price of its biggest export, Iron Ore. The health of the Chinese economy, its largest trading partner, is a factor, as well as inflation in Australia, its growth rate and Trade Balance. Market sentiment – whether investors are taking on more risky assets (risk-on) or seeking safe-havens (risk-off) – is also a factor, with risk-on positive for AUD.
The Reserve Bank of Australia (RBA) influences the Australian Dollar (AUD) by setting the level of interest rates that Australian banks can lend to each other. This influences the level of interest rates in the economy as a whole. The main goal of the RBA is to maintain a stable inflation rate of 2-3% by adjusting interest rates up or down. Relatively high interest rates compared to other major central banks support the AUD, and the opposite for relatively low. The RBA can also use quantitative easing and tightening to influence credit conditions, with the former AUD-negative and the latter AUD-positive.
China is Australia’s largest trading partner so the health of the Chinese economy is a major influence on the value of the Australian Dollar (AUD). When the Chinese economy is doing well it purchases more raw materials, goods and services from Australia, lifting demand for the AUD, and pushing up its value. The opposite is the case when the Chinese economy is not growing as fast as expected. Positive or negative surprises in Chinese growth data, therefore, often have a direct impact on the Australian Dollar and its pairs.
Iron Ore is Australia’s largest export, accounting for $118 billion a year according to data from 2021, with China as its primary destination. The price of Iron Ore, therefore, can be a driver of the Australian Dollar. Generally, if the price of Iron Ore rises, AUD also goes up, as aggregate demand for the currency increases. The opposite is the case if the price of Iron Ore falls. Higher Iron Ore prices also tend to result in a greater likelihood of a positive Trade Balance for Australia, which is also positive of the AUD.
The Trade Balance, which is the difference between what a country earns from its exports versus what it pays for its imports, is another factor that can influence the value of the Australian Dollar. If Australia produces highly sought after exports, then its currency will gain in value purely from the surplus demand created from foreign buyers seeking to purchase its exports versus what it spends to purchase imports. Therefore, a positive net Trade Balance strengthens the AUD, with the opposite effect if the Trade Balance is negative.
- Dow Jones clips into higher ground as investors look to claw back territory.
- US Retail Sales to be the early week’s key data print.
- Investors shrug off increasing warnings from Fed policymakers to hope for cuts.
The Dow Jones Industrial Average (DJIA) found thin gains on Monday, climbing four-tenths of a percent as investors recover balance and resume the long wait for rate cuts from the Federal Reserve (Fed). The “bad news is good news” narrative that has fueled investor sentiment seeking an accelerated pace of rate cuts from the Fed still exists in broader market flows, but has begun to destabilize as US economic data begins to cool faster than expected.
The Fed is still firmly entrenched in a holding pattern as policymakers seek firmer signs of cooling inflation within the US’ domestic economy as shelter and services inflation thumbs the nose at market expectations. Despite repetition of the need for patience from Fed officials, markets continue to hope for a quarter-point cut from the Fed at the September 18 policy meeting. According to the CME’s FedWatch tool, rate traders are pricing in over 60% odds of at least a 25 basis point rate trim from the Fed in September.
Read more: Fed policymakers warn that rates set to hold as the wait for more cooling inflation data continues
US Retail Sales slated for Tuesday will be the early week’s key data print, with Housing Starts on Thursday and a fresh round of the S&P Global Purchasing Managers Indexes (PMI) slated for Friday. Tuesday’s headline Retail Sales are expected to recover to 0.2% MoM in May after the previous month’s flat 0.0%.
Dow Jones news
Over two-thirds of the DJIA’s constituent securities are in the green on Monday as investors lean into a risk-on mood to kick off the new trading week. Despite the upbeat sentiment, Unitedhealth Group Inc. (UNH) still full over a full percent to $489.60 per share. Unitedhealth is ex-dividend on Monday, having paid the latest round of dividends and the company is also in the process of notifying users of a recent data breach.
On the upside, Apple Inc. (AAPL) has climbed around three percent on Monday, shouldering its way into $218.54 per share as investors flaunt a recent demotion in Apple’s volume weighting in the Technology Select Sector SPRDR ETF Fund (XLK). The ETF reduced Apple’s volume share in the ETF to just 4.5% as investors continue to scoop up Nvidia Corp. (NVDA), whose share in the same ETF rose to 21% to match Microsoft’s weighting within the fund. Apple’s battery supplier also unveiled new battery tech that promises significantly higher energy density on a per-unit basis, but how the technology will be applied to Apple devices remains to be seen.
Dow Jones technical outlook
The Dow Jones Industrial Average is snapping a near-term losing streak, on pace to close in the green for the first time in five trading days after closing lower for four straight sessions. The Index remains steeply off of recent all-time highs above the 40,000.00 major handle, but further declines are set to get mired in technical congestion at the 50-day Exponential Moving Average (EMA) at 38,809.34.
The Dow Jones is still trading well above the 200-day EMA at 37,396.04, and downside pressure has thus far failed to extend a push back down to the last swing low at the 38,000.00 handle. The level to beat for bulls will be last week’s peak bids at 39,136.56.
Dow Jones five minute chart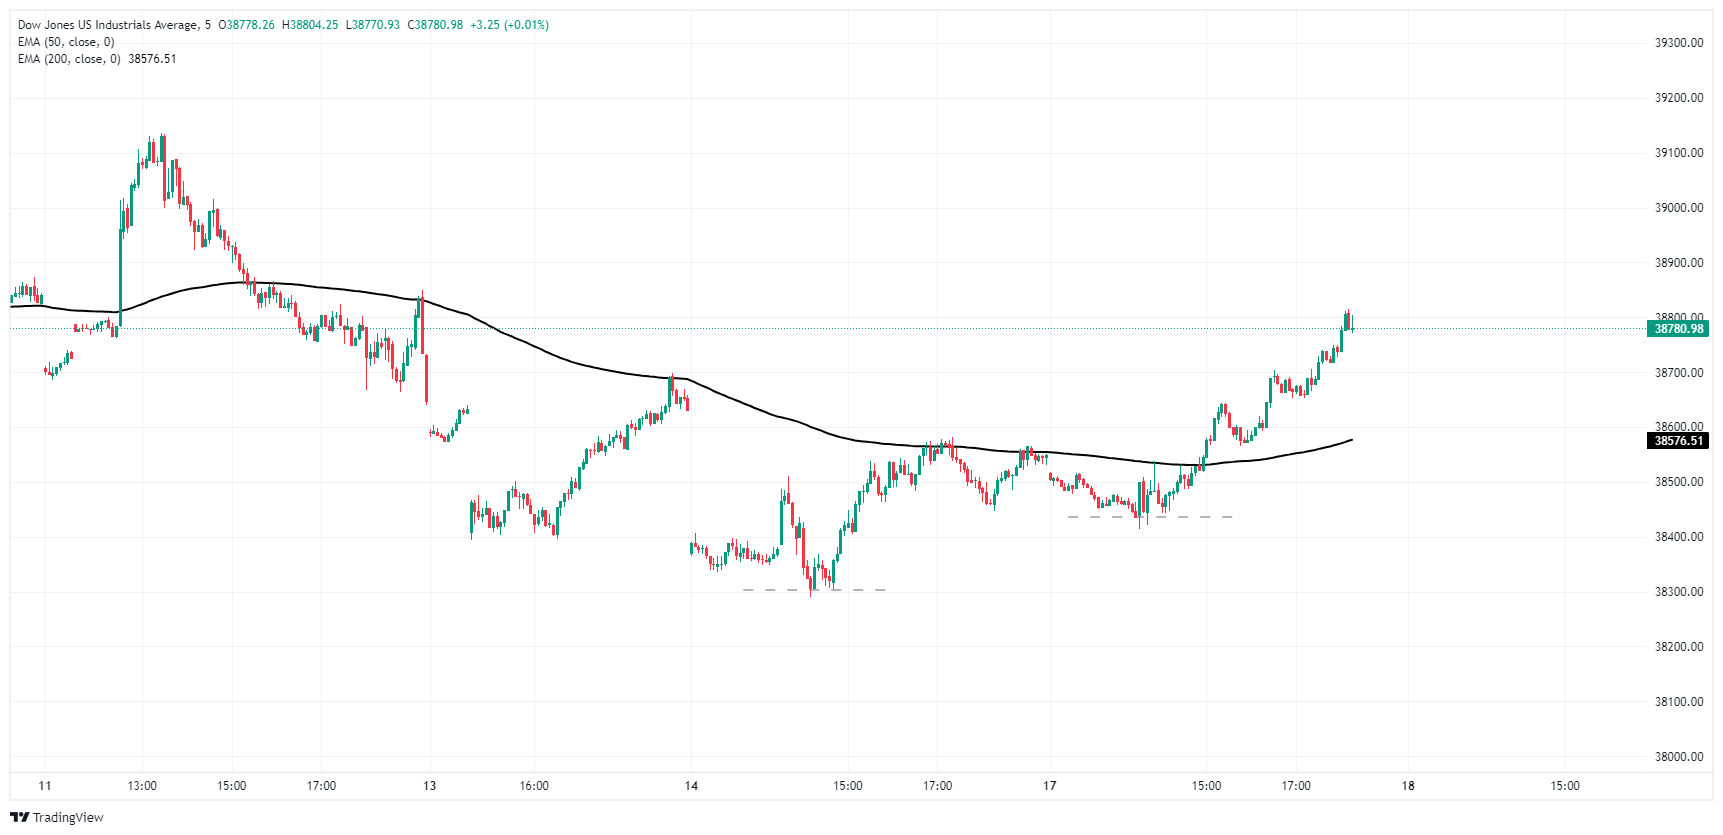
Dow Jones daily chart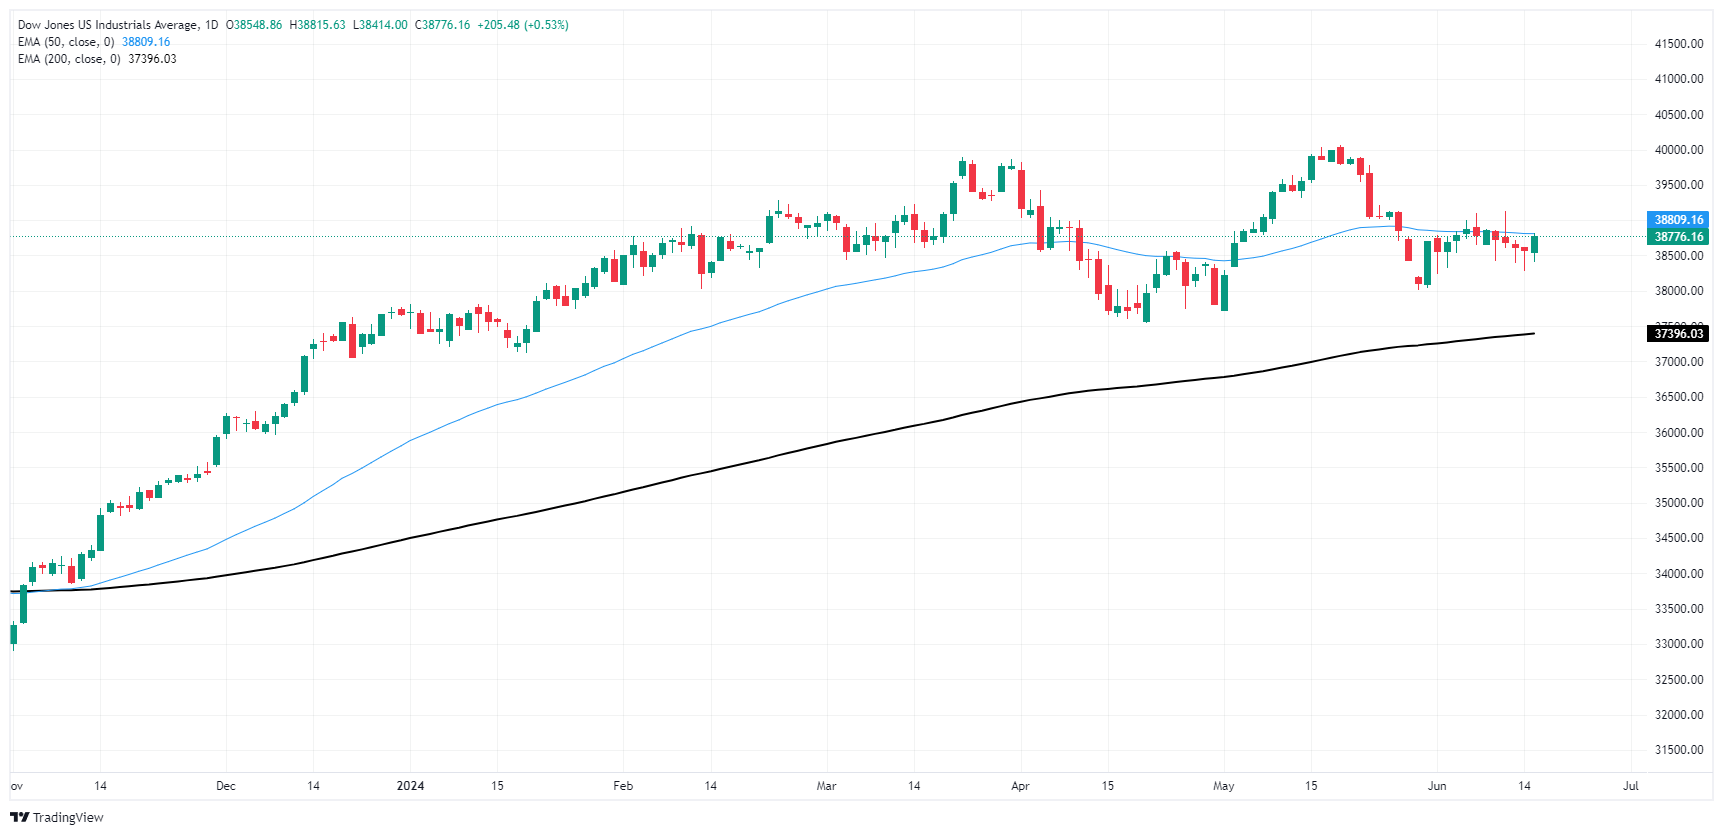
Dow Jones FAQs
The Dow Jones Industrial Average, one of the oldest stock market indices in the world, is compiled of the 30 most traded stocks in the US. The index is price-weighted rather than weighted by capitalization. It is calculated by summing the prices of the constituent stocks and dividing them by a factor, currently 0.152. The index was founded by Charles Dow, who also founded the Wall Street Journal. In later years it has been criticized for not being broadly representative enough because it only tracks 30 conglomerates, unlike broader indices such as the S&P 500.
Many different factors drive the Dow Jones Industrial Average (DJIA). The aggregate performance of the component companies revealed in quarterly company earnings reports is the main one. US and global macroeconomic data also contributes as it impacts on investor sentiment. The level of interest rates, set by the Federal Reserve (Fed), also influences the DJIA as it affects the cost of credit, on which many corporations are heavily reliant. Therefore, inflation can be a major driver as well as other metrics which impact the Fed decisions.
Dow Theory is a method for identifying the primary trend of the stock market developed by Charles Dow. A key step is to compare the direction of the Dow Jones Industrial Average (DJIA) and the Dow Jones Transportation Average (DJTA) and only follow trends where both are moving in the same direction. Volume is a confirmatory criteria. The theory uses elements of peak and trough analysis. Dow’s theory posits three trend phases: accumulation, when smart money starts buying or selling; public participation, when the wider public joins in; and distribution, when the smart money exits.
There are a number of ways to trade the DJIA. One is to use ETFs which allow investors to trade the DJIA as a single security, rather than having to buy shares in all 30 constituent companies. A leading example is the SPDR Dow Jones Industrial Average ETF (DIA). DJIA futures contracts enable traders to speculate on the future value of the index and Options provide the right, but not the obligation, to buy or sell the index at a predetermined price in the future. Mutual funds enable investors to buy a share of a diversified portfolio of DJIA stocks thus providing exposure to the overall index.
- Mexican Peso down 0.29% amid risk aversion on weak China data and European political uncertainty.
- Banxico's verbal intervention last week stabilized the Peso, central bank remains vigilant on currency volatility.
- Upcoming economic data from Mexico expected to show economic slowdown.
The Mexican Peso traded with minuscule losses against the US Dollar on Monday and is down 0.29% as risk appetite deteriorates based on weak China data and political uncertainty in Europe. The emerging market currency would remain volatile as traders digest the incumbent judiciary reform in September, presented by current President Andres Manuel Lopez Obrador and approved by upcoming President Claudia Sheinbaum. The USD/MXN trades at 18.51, gaining 0.34%
The Mexican currency stabilized last week after verbal intervention by Bank of Mexico (Banxico) Governor Victoria Rodriguez Ceja last Wednesday, who said the central bank is attentive to volatility in the Mexican currency exchange rate and could act to restore “order” in markets.
Last week, Claudia Sheinbaum tried to calm investors and told them not to be concerned about the reforms. She said, “Mexico’s economy is healthy and strong, and [there is] nothing to worry about.”
The economic docket in Mexico will feature the announcement of Aggregate Demand, Private Spending, Retail Sales, and Economic Activity data. The data is expected to show that the economy is slowing down due to higher interest rates set by Banxico at 11%, which are expected to be lowered in the June 27 meeting.
Despite that, the USD/MXN exchange rate continues to be driven by political uncertainty about the changes to the Mexican Constitution that threaten the state of law.
Across the border, the latest Federal Reserve (Fed) decision to keep rates unchanged and the projection of just one interest rate cut in 2024 cushioned the Greenback and boosted the USD/MXN to 14-month highs.
The US economic docket is absent except for Fed officials crossing the newswires. Up next, the Philadelphia Fed’s Patrick Harker will give a speech later on Monday.
Daily digest market movers: Mexican Peso on defensive amid risk-aversion
- In February 2024, AMLO presented several proposals to the Mexican Congress. These include a Supreme Court reform to elect Supreme Court ministers through a popular vote, an electoral reform aimed at electing electoral commission councilors by popular vote and reducing multi-member representation, and a reform of autonomous bodies that proposes dissolving the transparency body.
- Mexican Peso depreciation could weigh on Banxico's decision to ease policy on June 27 despite last month’s dip in core prices. Therefore, keeping interest rates higher could prompt deceleration in the economy and increase the odds of a possible recession.
- Morgan Stanley noted that if Mexico’s upcoming government and Congress adopted an unorthodox agenda, it would undermine Mexican institutions and be bearish for the Mexican Peso, which could weaken to 19.20.
- Latest US inflation report increased the odds of a Fed rate cut in September from 62% to 56.3%, according to CME FedWatch Tool.
- December’s 2024 fed funds futures contract hints that investors expect 35 basis points of rate cuts by the Fed through the end of the year.
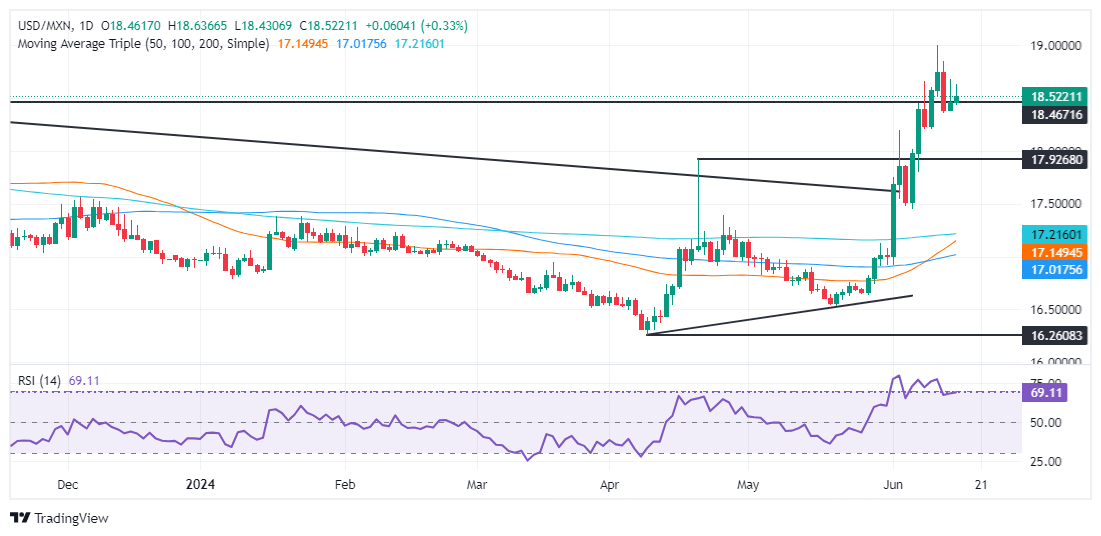
Technical analysis: Mexican Peso registers losses as USD/MXN climbs above 18.50
The USD/MXN uptrend remains intact, even though it has hovered near 18.50 for the last three trading days. Momentum supports buyers as the Relative Strength Index (RSI) remains bullish after exiting overbought territory. That said, if buyers achieve a daily close above 18.50, that could pave the way for further upside.
Once buyers reclaim 18.50, the next resistance level would be the year-to-date high of 18.99, followed by the March 20, 2023, high of 19.23. A breach of the latter will sponsor an uptick to 19.50, ahead of the psychological 20.00 mark.
Conversely, if sellers push prices below the April 19 high of 18.15, that would keep the exotic pair trading within the 18.00-18.15 range.
Mexican Peso FAQs
The Mexican Peso (MXN) is the most traded currency among its Latin American peers. Its value is broadly determined by the performance of the Mexican economy, the country’s central bank’s policy, the amount of foreign investment in the country and even the levels of remittances sent by Mexicans who live abroad, particularly in the United States. Geopolitical trends can also move MXN: for example, the process of nearshoring – or the decision by some firms to relocate manufacturing capacity and supply chains closer to their home countries – is also seen as a catalyst for the Mexican currency as the country is considered a key manufacturing hub in the American continent. Another catalyst for MXN is Oil prices as Mexico is a key exporter of the commodity.
The main objective of Mexico’s central bank, also known as Banxico, is to maintain inflation at low and stable levels (at or close to its target of 3%, the midpoint in a tolerance band of between 2% and 4%). To this end, the bank sets an appropriate level of interest rates. When inflation is too high, Banxico will attempt to tame it by raising interest rates, making it more expensive for households and businesses to borrow money, thus cooling demand and the overall economy. Higher interest rates are generally positive for the Mexican Peso (MXN) as they lead to higher yields, making the country a more attractive place for investors. On the contrary, lower interest rates tend to weaken MXN.
Macroeconomic data releases are key to assess the state of the economy and can have an impact on the Mexican Peso (MXN) valuation. A strong Mexican economy, based on high economic growth, low unemployment and high confidence is good for MXN. Not only does it attract more foreign investment but it may encourage the Bank of Mexico (Banxico) to increase interest rates, particularly if this strength comes together with elevated inflation. However, if economic data is weak, MXN is likely to depreciate.
As an emerging-market currency, the Mexican Peso (MXN) tends to strive during risk-on periods, or when investors perceive that broader market risks are low and thus are eager to engage with investments that carry a higher risk. Conversely, MXN tends to weaken at times of market turbulence or economic uncertainty as investors tend to sell higher-risk assets and flee to the more-stable safe havens.
- Canadian Dollar treads lightly amidst quiet Monday markets.
- Canada Housing Starts rise faster than expected in May, but sales and prices are down.
- US NY Empire Manufacturing recovered, but Tuesday’s Retail Sales loom ahead.
The Canadian Dollar (CAD) is trading tightly on Monday, with gains and losses mixed across the board and within a quarter of a percent against most of its major currency peers. Canadian Housing Starts came in better than expected, but prices and activity remain lower in May. US manufacturing figures improved more than expected but still remain in contraction territory.
Canada saw Housing Starts rise more than expected for the year ending in May, but according to the Canadian Real Estate Association (CREA), both housing prices and buying activity declined in May. The US New York Empire Manufacturing Index rose faster than expected in June but still remains mired in contraction territory. Markets will shift into wait-and-see mode as investors look out for US Retail Sales figures due on Tuesday.
Daily digest market movers: Canadian Dollar finds tepid Monday markets and a limited data docket
- Canadian Housing Starts rose to 264.5K YoY in May, above the forecast for 247K and rising from the previous period’s revised 241.1K.
- However, the CREA’s Canadian Home Price Index fell 0.2% MoM in May and fell 2.4% YoY. The CREA also noted that home sales declined 0.6% MoM in May as activity remains constrained.
- The US NY Empire State Manufacturing Index recovered to a four-month high of -6.0 in June, higher than the forecast of -9.0 and well above the previous -15.6. Despite the recovery, the NY Empire index has remained in contraction territory since November of last year.
- Tuesday’s US Retail Sales will be the key data release of the early week, and investors will be keeping one eye turned to the news feeds. A slew of policymakers from the Federal Reserve are expected to appear this week.
- Wednesday’s Juneteenth US holiday will see a lull in the midweek market flow.
Canadian Dollar PRICE Today
The table below shows the percentage change of Canadian Dollar (CAD) against listed major currencies today. Canadian Dollar was the strongest against the New Zealand Dollar.
| USD | EUR | GBP | JPY | CAD | AUD | NZD | CHF | |
|---|---|---|---|---|---|---|---|---|
| USD | -0.21% | -0.08% | 0.24% | -0.02% | 0.13% | 0.17% | 0.05% | |
| EUR | 0.21% | 0.14% | 0.47% | 0.20% | 0.24% | 0.42% | 0.26% | |
| GBP | 0.08% | -0.14% | 0.40% | 0.05% | 0.08% | 0.24% | 0.13% | |
| JPY | -0.24% | -0.47% | -0.40% | -0.15% | -0.11% | 0.08% | -0.14% | |
| CAD | 0.02% | -0.20% | -0.05% | 0.15% | 0.08% | 0.19% | 0.07% | |
| AUD | -0.13% | -0.24% | -0.08% | 0.11% | -0.08% | 0.24% | 0.05% | |
| NZD | -0.17% | -0.42% | -0.24% | -0.08% | -0.19% | -0.24% | -0.12% | |
| CHF | -0.05% | -0.26% | -0.13% | 0.14% | -0.07% | -0.05% | 0.12% |
The heat map shows percentage changes of major currencies against each other. The base currency is picked from the left column, while the quote currency is picked from the top row. For example, if you pick the Canadian Dollar from the left column and move along the horizontal line to the US Dollar, the percentage change displayed in the box will represent CAD (base)/USD (quote).
Technical analysis: Canadian Dollar churns in the midrange on Monday
The Canadian Dollar (CAD) is comfortably splashing around in the shallow end on Monday, trading within a quarter of one percent across the board as markets kick off the new trading week on a notably tepid note. USD/CAD briefly found an intraday high above 1.3760 before pulling back into a familiar midrange near 1.3740.
Intraday price action remains mired on the low side of a heavy supply zone above 1.3760, but long-term momentum still leans into the bullish side as the pair holds north of the 50-day Exponential Moving Average (EMA) at 1.3673. USD/CAD has been grinding higher on a rising trendline, climbing from December’s swing low below 1.3200, but the pair has failed to etch in a fresh high since peaking at 1.3846 in mid-April.
USD/CAD hourly chart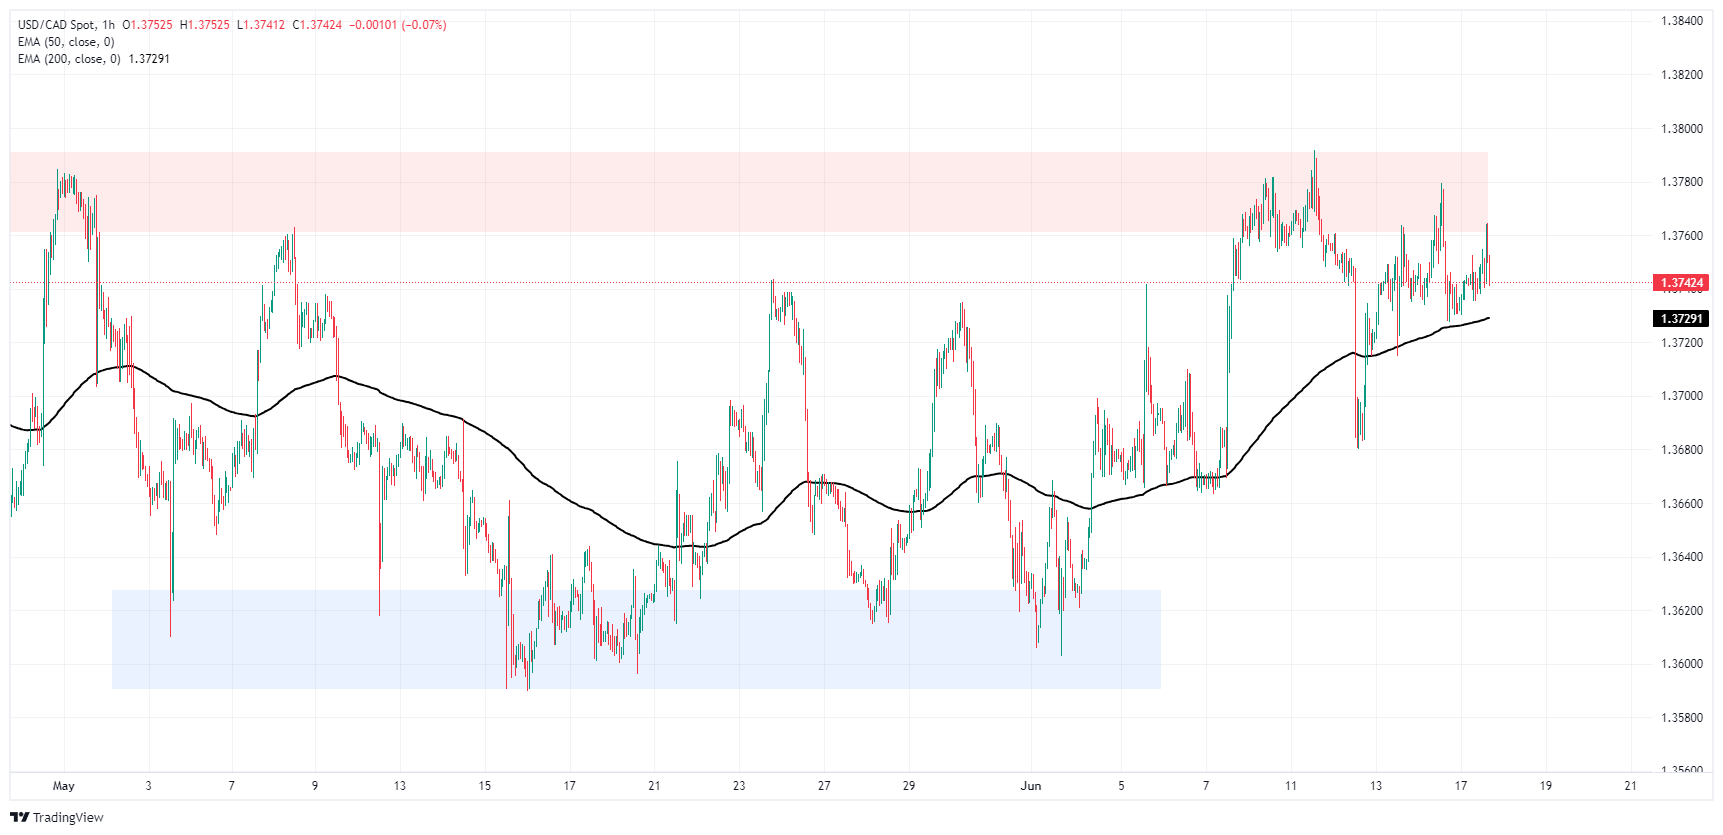
USD/CAD daily chart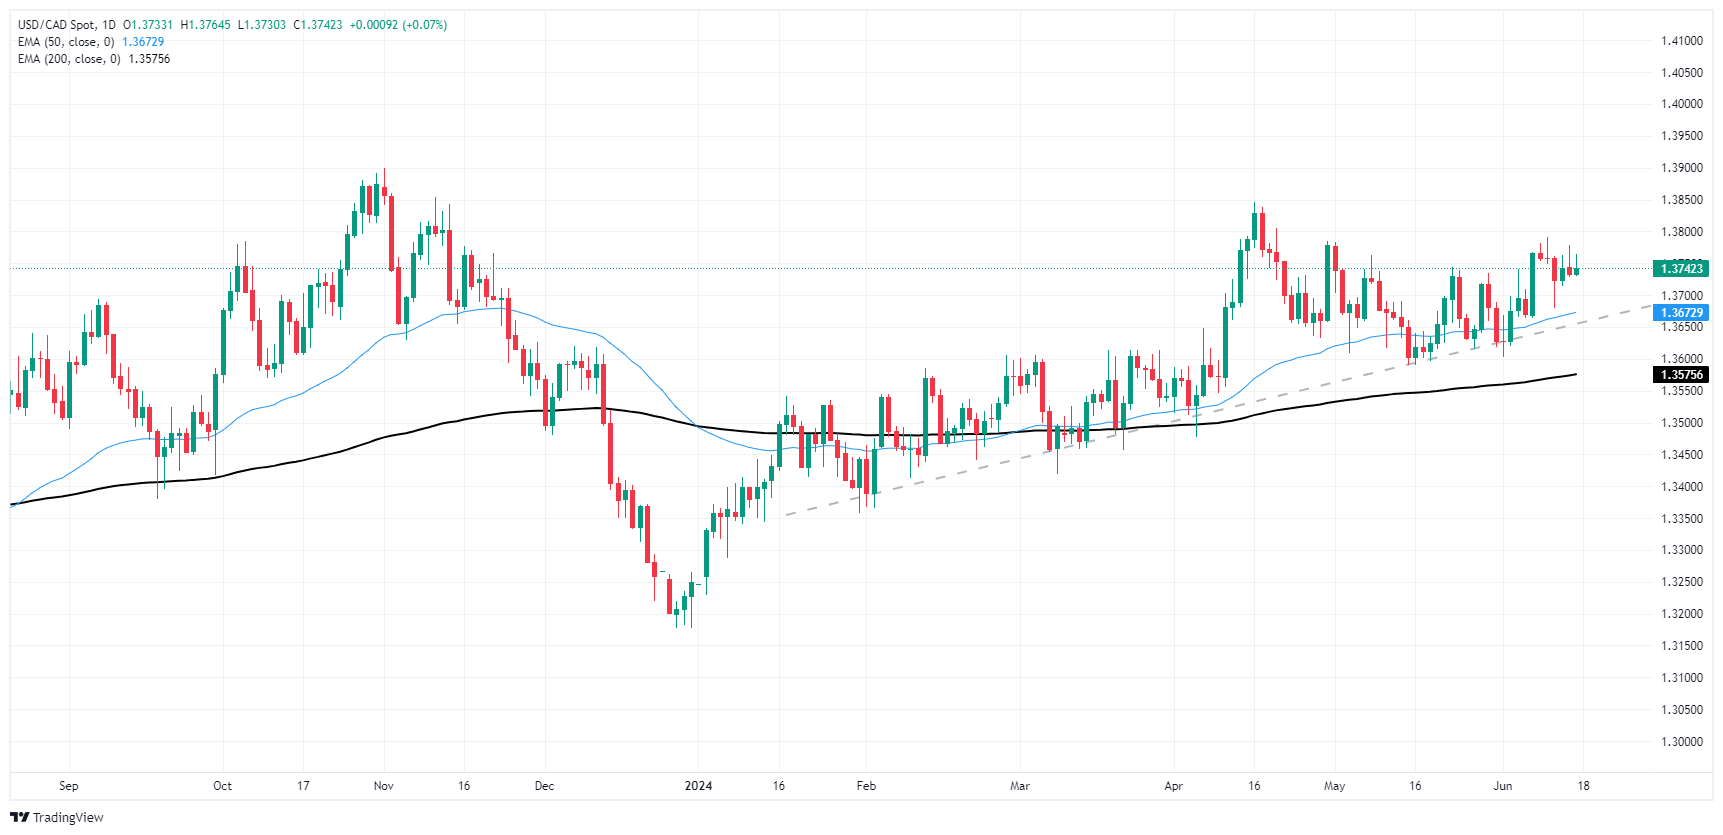
Canadian Dollar FAQs
The key factors driving the Canadian Dollar (CAD) are the level of interest rates set by the Bank of Canada (BoC), the price of Oil, Canada’s largest export, the health of its economy, inflation and the Trade Balance, which is the difference between the value of Canada’s exports versus its imports. Other factors include market sentiment – whether investors are taking on more risky assets (risk-on) or seeking safe-havens (risk-off) – with risk-on being CAD-positive. As its largest trading partner, the health of the US economy is also a key factor influencing the Canadian Dollar.
The Bank of Canada (BoC) has a significant influence on the Canadian Dollar by setting the level of interest rates that banks can lend to one another. This influences the level of interest rates for everyone. The main goal of the BoC is to maintain inflation at 1-3% by adjusting interest rates up or down. Relatively higher interest rates tend to be positive for the CAD. The Bank of Canada can also use quantitative easing and tightening to influence credit conditions, with the former CAD-negative and the latter CAD-positive.
The price of Oil is a key factor impacting the value of the Canadian Dollar. Petroleum is Canada’s biggest export, so Oil price tends to have an immediate impact on the CAD value. Generally, if Oil price rises CAD also goes up, as aggregate demand for the currency increases. The opposite is the case if the price of Oil falls. Higher Oil prices also tend to result in a greater likelihood of a positive Trade Balance, which is also supportive of the CAD.
While inflation had always traditionally been thought of as a negative factor for a currency since it lowers the value of money, the opposite has actually been the case in modern times with the relaxation of cross-border capital controls. Higher inflation tends to lead central banks to put up interest rates which attracts more capital inflows from global investors seeking a lucrative place to keep their money. This increases demand for the local currency, which in Canada’s case is the Canadian Dollar.
Macroeconomic data releases gauge the health of the economy and can have an impact on the Canadian Dollar. Indicators such as GDP, Manufacturing and Services PMIs, employment, and consumer sentiment surveys can all influence the direction of the CAD. A strong economy is good for the Canadian Dollar. Not only does it attract more foreign investment but it may encourage the Bank of Canada to put up interest rates, leading to a stronger currency. If economic data is weak, however, the CAD is likely to fall.
- DXY rally sees minor pullback on Monday but is set to continue its upward journey this week.
- Fed maintains that only one rate cut is expected in 2024, conflicting with market expectations.
- US Treasury yields continued rising, gaining more than 1% on Monday.
On Monday, the US Dollar Index (DXY) experienced some pullback but maintained overall strength. Tracking the previous week's performance, the DXY was influenced by the hawkish Federal Reserve (Fed) and the risk-off impulses from Europe. These two driving factors are expected to continue influencing the Index, allowing the US Dollar rally to proceed. It's worth noticing that the Index, on Friday, closed at its highest level since early May and is expected to retest the April-May highs near 106.50.
The US economic outlook persists in a state of ambiguity. The Fed continues to keep its economic indicator projections unchanged but revised its forecast for Personal Consumption Expenditures (PCE) higher. Primarily, soft inflation levels combined with a robust labor market illustrate the mixed dynamic of the US economic landscape.
Daily digest market movers: DXY slightly pulls back after strong week
- Fed perceives only one rate cut in 2024 compared to the market's prediction of two. This discrepancy will be influenced heavily by emerging financial data.
- Investors are awaiting critical reports, namely June's Consumer Price Index (CPI) and PCE, which will be key for timing of interest rate cuts. The odds of a cut at the July meeting remain low at 10%.
- An upcoming cut will also depend on July’s CPI and PCE, ahead of the Fed's meeting on September 17-18. The odds for a rate cut at this meeting are currently near 75%.
- US Treasury yields are following an uptrend, with the 2, 5 and 10-year yields reported at 4.47%, 4.30%, and 4.28%, respectively, with large gains.
DXY technical analysis: Bulls pause, outlook still positive
The technical indicators presented a pause in Monday's session but maintained an overall positive standpoint. The Relative Strength Index (RSI) continues to hold above the 50 level, and the Moving Average Convergence Divergence (MACD) continues to present green bars. This implies that the bulls remain strong, which leaves the door open for additional gains.
Furthermore, the DXY remains above its 20, 100 and 200-day Simple Moving Averages (SMA), which combined with investors taking a breather supports a bullish stance for the DXY.
US Dollar FAQs
The US Dollar (USD) is the official currency of the United States of America, and the ‘de facto’ currency of a significant number of other countries where it is found in circulation alongside local notes. It is the most heavily traded currency in the world, accounting for over 88% of all global foreign exchange turnover, or an average of $6.6 trillion in transactions per day, according to data from 2022. Following the second world war, the USD took over from the British Pound as the world’s reserve currency. For most of its history, the US Dollar was backed by Gold, until the Bretton Woods Agreement in 1971 when the Gold Standard went away.
The most important single factor impacting on the value of the US Dollar is monetary policy, which is shaped by the Federal Reserve (Fed). The Fed has two mandates: to achieve price stability (control inflation) and foster full employment. Its primary tool to achieve these two goals is by adjusting interest rates. When prices are rising too quickly and inflation is above the Fed’s 2% target, the Fed will raise rates, which helps the USD value. When inflation falls below 2% or the Unemployment Rate is too high, the Fed may lower interest rates, which weighs on the Greenback.
In extreme situations, the Federal Reserve can also print more Dollars and enact quantitative easing (QE). QE is the process by which the Fed substantially increases the flow of credit in a stuck financial system. It is a non-standard policy measure used when credit has dried up because banks will not lend to each other (out of the fear of counterparty default). It is a last resort when simply lowering interest rates is unlikely to achieve the necessary result. It was the Fed’s weapon of choice to combat the credit crunch that occurred during the Great Financial Crisis in 2008. It involves the Fed printing more Dollars and using them to buy US government bonds predominantly from financial institutions. QE usually leads to a weaker US Dollar.
Quantitative tightening (QT) is the reverse process whereby the Federal Reserve stops buying bonds from financial institutions and does not reinvest the principal from the bonds it holds maturing in new purchases. It is usually positive for the US Dollar.
The US Dollar (USD) and the Pound Sterling (GBP) gain momentum while the Euro (EUR) and the Japanese Yen (JPY) lose track, strategists at Rabobank note.
US shows the best performance in the FX
“USD net long positions have increased for five consecutive weeks, driven by a decrease in short positions. Labor data came in hot this week with higher-than-expected nonfarm payrolls registering 272 thousand new jobs added to the US economy in May. Investors had priced in a slim-to-none likelihood of a June rate cut going into the June 12th FOMC meeting.”
“EUR net long positions have decreased, driven by an increase in short positions. The ECB released its decision to cut rates 25bps at the June 6th meeting. The market is positioned for a rate pause in July. GBP net long positions increased for the third consecutive week, driven by an increase in long positions. Investors are positioned for a no-change decision from the Bank of England at the June 20th meeting.”
“JPY net short positions have increased, driven by decrease in long positions. PPI registered higher than expected at 0.7% m/m for May versus expectations of 0.5% m/m. Investors were positioned for a no-change decision from the BoJ going into the June 14th meeting.”
- The Japanese Yen weakens against the US Dollar on Monday amid still–elevated US interest-rate projections.
- The Fed’s reluctance to entertain interest-rate cuts until more data assures them inflation is coming down, is a factor.
- The BoJ’s expected bond-taper supports JPY but weak wage data and imported inflation weigh.
The Japanese Yen (JPY) trades lower by about a third of a percent against the US Dollar (USD), in the 157.80s on Monday, as the outlook for interest rates in the US remains elevated despite lower inflation and economic sentiment readings. The expectation of higher interest rates supports the USD by attracting greater inflows of foreign capital.
The Japanese Yen, meanwhile, weakens as despite moderate gains to inflation, Japanese real wages – which are adjusted for inflation – continue to fall, registering the 25th consecutive month of declines in April, data from the Ministry of Health, Labor and Welfare shows. The data suggests much of Japan’s inflation is imported because of a historically weak Yen rather than due to increased consumer spending.
The Yen does however receive a modicum of support from Friday’s Bank of Japan (BoJ) meeting. Although the BoJ did not raise interest rates which languish in a range between 0.0% - 0.1% – the lowest of any developed central bank – it did say it was planning to reduce quantitative easing (QE). Officials announced that at the next meeting in July they would be revealing plans on tapering Japanese Government Bond (JGB) purchases. A reduction in QE is positive for the Japanese Yen as it helps raise interest rates.
USD/JPY remains supported by comments from the Chairman of the Federal Reserve (Fed), Jerome Powell. At the Fed’s June policy meeting Powell said he needed more assurances that inflation was coming down in a sustainable fashion before cutting interest rates.
Future interest rate forecasts from members of the Federal Open Market Committee (FOMC), who are tasked with setting interest rates, were also revised, documents accompanying the June meeting showed. From members forecasting three 0.25% cuts to the Fed Funds Rate in 2024, in March, the June projections showed only one 0.25% cut now penciled in amid stickier-than-expected inflation. The expectation that US interest rates will remain higher for longer was a boost for the US Dollar.
US Consumer Price Index (CPI) data for May, released a few hours before the Fed meeting, showed a lower-than-expected reading suggesting price pressures were dissipating. Chairman Powell, however, dismissed the data as insufficient to force the Fed to lower interest rates from their 5.25% - 5.50% band. More data showing lower inflation would be required, he said, before the Fed could be confident the long-run inflation rate was on its way down.
US Producer Price Index (PPI) data on Thursday showed “factory gate” prices slowly cooling in May, further adding to the picture of a declining US inflationary backdrop.
On Friday the Michigan Consumer Sentiment Index declined for the third straight month in a row to 65.6 in June, from 69.1 in May and well below forecasts of 72, preliminary estimates showed. Year-ahead inflation expectations, however, remained unchanged at 3.3%, but the five-year one edged up to 3.1% from 3.0% in May, data from the University of Michigan showed.
USD/JPY traders will also be wary of the risk of Japanese government direct intervention in the Forex markets after myriad warnings from high-ranking officials and currency czars. Data from the BoJ also revealed it had intervened to make market operations to prop up the Yen when USD/JPY experienced sudden corrections in late April and early May recent records showed.
European Central Bank (ECB) policymakers indicated that the French situation is “contained”, allowing the Euro (EUR) to float above 1.07, Scotiabank’s Chief FX Strategist Shaun Osborne notes.
EUR holds a steady grip over 1.07
“ECB policymakers indicated last week that the risks around French situation were 'contained' while the National Rally’s Le Pen commented that her party would co-operate with President Macron if her group won the election. Soothing comments have allowed the 1-Y OAT/Bund spread to narrow marginally from last week’s peak, allowing the EUR to steady above 1.07.”
“EUR gains from last Friday’s low have developed slowly in overnight trade. The rebound may have some legs in our session but, at the moment, gains look more like a brief consolidation ahead of renewed weakness.”
“EUR losses did stabilize around the 76.4% retracement of the April/May rally at 1.0675 last week, however, so the potential for a deeper rebound cannot be ignored. But spot remains well below levels that would confer any real technical strength on the EUR I think (above 1.0850 is needed to lift the EUR’s technical prospects at this point).”
Global carry trade withers away leaving markets cling to the US Dollar as the best hedge to rising risks, TDS strategists note.
Global politics reshapes the market risk sentiment
“The grip of the 'doom loop' continues to tighten ever so slightly. Markets are witnessing typical behavior of a complex, adaptive system. What starts with a seemingly idiosyncratic event in a specific country, morphs into a problem for everyone else. The events in South Africa, India, Mexico, and now France are not isolated. They are connected and starting to reshape the market sentiment.”
“This is an outcome we have been recently discussing, especially as FX vols have been lulled into a dreamlike state. Everything is fine — until it's not. The unwinding of the carry trade has been a major talking point with clients recently. A successful carry trade needs two conditions: rate divergence and low volatility. Both are moving against it, leaving the USD as the best hedge to rising risks.”
“We also note that long-term valuations play a critical role in carry unwinds. Our slow-moving composite framework, LFFV, points to overvaluation in most of the popular carry trades like MXN, BRL, COP, HUF. What's more, EUR headwinds keep building, underscoring rising political uncertainty and a jump in OAT-Bund spreads. We continue to expect an H2 break below 1.05 in EUR/USD.”
- GBP/USD prolonged its losses for three straight days amid risk aversion.
- The pair is neutral to downward bias with momentum favoring sellers as RSI turns bearish.
- Key support levels: Last week’s low at 1.2656, 100-DMA at 1.2646, 50-DMA at 1.2612, and 200-DMA at 1.2548.
- For bullish continuation, GBP/USD must break above resistance at 1.2720/40 and test 1.2750.
The Pound Sterling extended its losses versus the Greenback on Monday, losses of some 0.06% as traders remain risk averse due to European political uncertainty. That and a Bank of England’s (BoE) monetary policy decision looming would likely keep the major consolidated. The GBP/USD trades at 1.2675 after hitting a daily high of 1.2688.
GBP/USD Price Analysis: Technical outlook
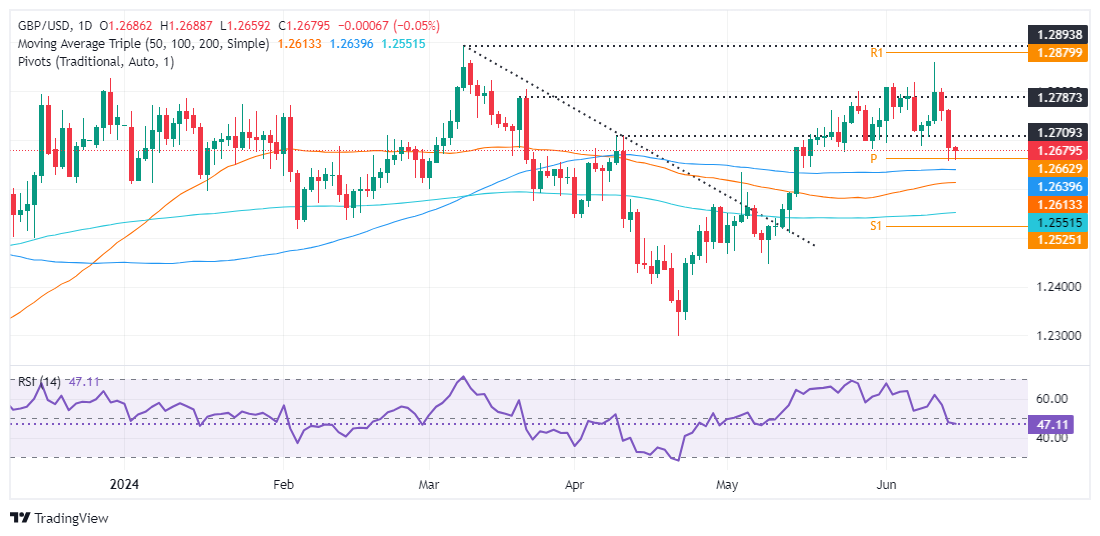
From a technical standpoint, the GBP/USD is neutral to downward biased, even though price action is above the daily moving averages (DMAs). Momentum shifted in favor of sellers, which according to the Relative Strength Index (RSI) are gathering traction as it turns bearish.
Once the GBP/USD dived below 1.2700 on further weakness, opened the door for additional losses. The next support would be last week’s low of 1.2656, followed by the 100-DMA at 1.2646, ahead of the 50-DMA at 1.2612. A breach of the latter will expose the 200-DMA at 1.2548.
Conversely, if traders want a bullish continuation, they must lift the GBP/USD above a broken support trendline that turned resistance at around 1.2720/40 before testing 1.2750.
GBP/USD Price Action – Daily Chart
British Pound PRICE Today
The table below shows the percentage change of British Pound (GBP) against listed major currencies today. British Pound was the strongest against the Japanese Yen.
| USD | EUR | GBP | JPY | CAD | AUD | NZD | CHF | |
|---|---|---|---|---|---|---|---|---|
| USD | -0.13% | 0.06% | 0.32% | 0.10% | 0.32% | 0.31% | 0.16% | |
| EUR | 0.13% | 0.21% | 0.49% | 0.24% | 0.36% | 0.49% | 0.29% | |
| GBP | -0.06% | -0.21% | 0.36% | 0.03% | 0.14% | 0.25% | 0.11% | |
| JPY | -0.32% | -0.49% | -0.36% | -0.11% | 0.00% | 0.13% | -0.10% | |
| CAD | -0.10% | -0.24% | -0.03% | 0.11% | 0.15% | 0.20% | 0.07% | |
| AUD | -0.32% | -0.36% | -0.14% | -0.01% | -0.15% | 0.19% | -0.02% | |
| NZD | -0.31% | -0.49% | -0.25% | -0.13% | -0.20% | -0.19% | -0.14% | |
| CHF | -0.16% | -0.29% | -0.11% | 0.10% | -0.07% | 0.02% | 0.14% |
The heat map shows percentage changes of major currencies against each other. The base currency is picked from the left column, while the quote currency is picked from the top row. For example, if you pick the British Pound from the left column and move along the horizontal line to the US Dollar, the percentage change displayed in the box will represent GBP (base)/USD (quote).
Global financial markets cheered last week's weaker-than-expected US CPI data for May, with both the headline (+0.0%) and core (+0.2%) measures coming in a tick below consensus expectations, National Bank of Canada (NBC) strategists Stéfane Marion and Jocelyn Paquet note.
Possibility of US disinflation stalling persists
“The real question going forward is whether the ongoing deflation in core goods will be enough to offset the persistent inflationary pressures in core services, where 12-month inflation has been above 5% for 24 consecutive months – the longest such streak since the early 1990s.”
“Note that there is no precedent in modern US history for core services inflation to be above 5% while core goods are deflating. As US tariffs on Chinese goods ramp up, the possibility of disinflation stalling in the coming months remains.”
“Keep in mind that the average base effect on core CPI from now to December will be only +0.17%, which means that, for the 12-month core rate to continue to fall, monthly results from now to the end of the year will have to be consistently below this figure. It’s possible, but it’s a tall order.”
Crude Oil's recovery could start to fade as upside momentum eases, TDS Senior Commodity Strategist Ryan McKay notes.
Markets may halt their Brent and WTI buying program
“In WTI crude, Commodity Trading Advisors (CTAs) will need to see prices breakthrough $80/bbl to see a continuation of the recent buying program, while liquidations appear to be the more likely risk with downside triggers at $78.36/bbl. Brent crude could also see selling on a failure to break through the $83/bbl level.”
“Indeed, while the market has recovered nicely from the OPEC+ driven knee-jerk lower, there is still more relative concern about Q4 balances and beyond, which should serve as a resistance to major upside.”
Gold (XAU/USD) faces some Commodity Trading Advisor (CTA) selling amid the back-and-forth price action, but the latest Federal Reserve (Fed) meeting generated some demand for the Yellow Metal, Ryan McKay, Senior Commodity Strategist, notes.
Gold faces some CTA selling amid price wobbling
“Precious metals are trading weaker to start the week, but back-to-back weaker-than-expected inflation prints, along with the less hawkish details of the Fed meeting, have seen appetite for gold increase.”
“Plenty of uncertainty remains regarding timing of expected cuts, and macro positioning's beta to data surprises will remain elevated in the near term.”
“In this sense, the back-and-forth price action in the Yellow Metal saw some modest selling from CTAs, but these positions could be added back above $2,354/oz.”
- USD/JPY rises to a seven-week high near 158.00 amid multiple tailwinds.
- The US Dollar strengthens as the Fed maintains hawkish guidance on interest rates.
- The Japanese Yen weakens as BoJ pushes plans for a reduction in bond-buying operations.
The USD/JPY pair jumps to near 158.00 in Monday’s American session. The asset extends its upside as Federal Reserve’s (Fed) hawkish narrative on the interest rate outlook has strengthened the US Dollar (USD) and the postponement of taper tantrum plans by the Bank of Japan (BoJ) has weakened the Japanese Yen.
The US Dollar Index (DXY), which tracks the Greenback’s value against six major currencies, trades sideways but clings to gains near 105.56. The Fed sees only one rate cut this year as policymakers want to see inflation declining for months.
Meanwhile, investors shifted focus to the United States (US) Retail Sales data for May, which will be published on Tuesday. Monthly Retail Sales are estimated to have increased by 0.3% after remaining flat in April.
The Japanese Yen remains on the backfoot as the BoJ pushes plans of tapering bond-buying operations to the July meeting. BoJ Governor Kazuo Ueda left interest rates unchanged but didn’t rule out expectations for further policy tightening in July.
USD/JPY trades in a Rising Channel chart formation on a four-hour timeframe in which each corrective move is considered a buying opportunity by market participants. The asset remains above the 200-period Exponential Moving Average (EMA) near 156.00, suggesting that the overall trend is bullish.
The 14-period Relative Strength Index (RSI) hovers near 60.00. Momentum would lean towards the upside if the oscillator establishes above 60.00.
More upside would appear if the asset breaks above June 14 high at 158.26, which will drive it towards multi-year high of 160.00. Breach of the latter will expose the pair in an unchartered territory.
On the flip side, a breakdown below May 16 low at 153.60 will expose the asst towards May 3 low at 151.86, followed by the psychological support of 150.00.
USD/JPY four-hour chart
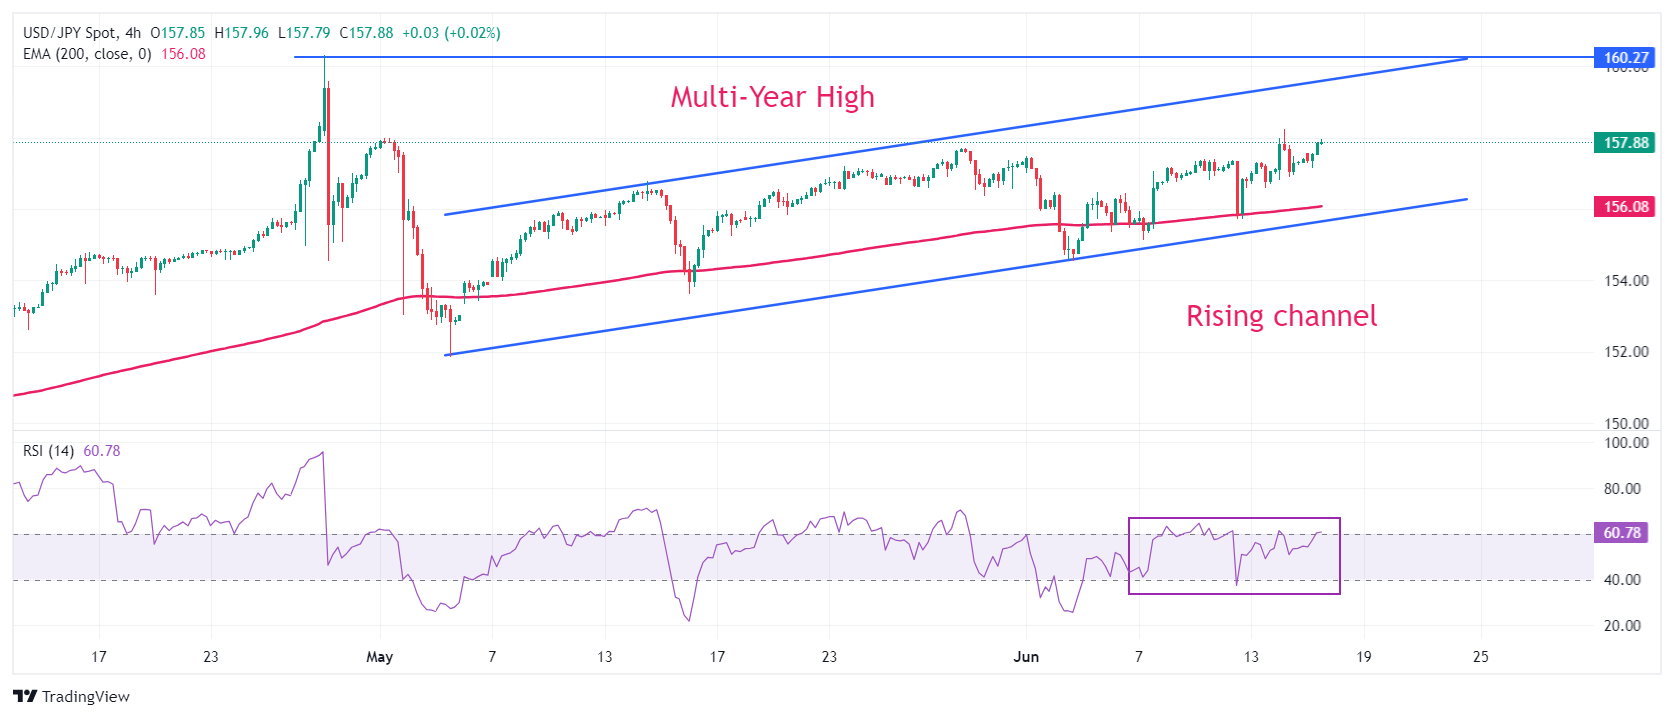
- Silver is correcting within a short-term downtrend.
- A break below the June 13 lows would probably lead to a continuation of the trend of lower lows.
- The 50-day Simple Moving Average is an obstacle to bears pushing price lower.
Silver (XAG/USD) trades a third of a percent lower in the $29.40s on Monday. Despite trading marginally lower on the day it has overall recovered since falling to a low of $28.66 on June 13.
The precious metal is in a short-term downtrend, on balance, and given “the trend is your friend” this is likely to continue. The recovery since June 13 is probably a pull back rather than a reversal – once it finishes the downtrend will probably resume.
Silver 4-hour Chart
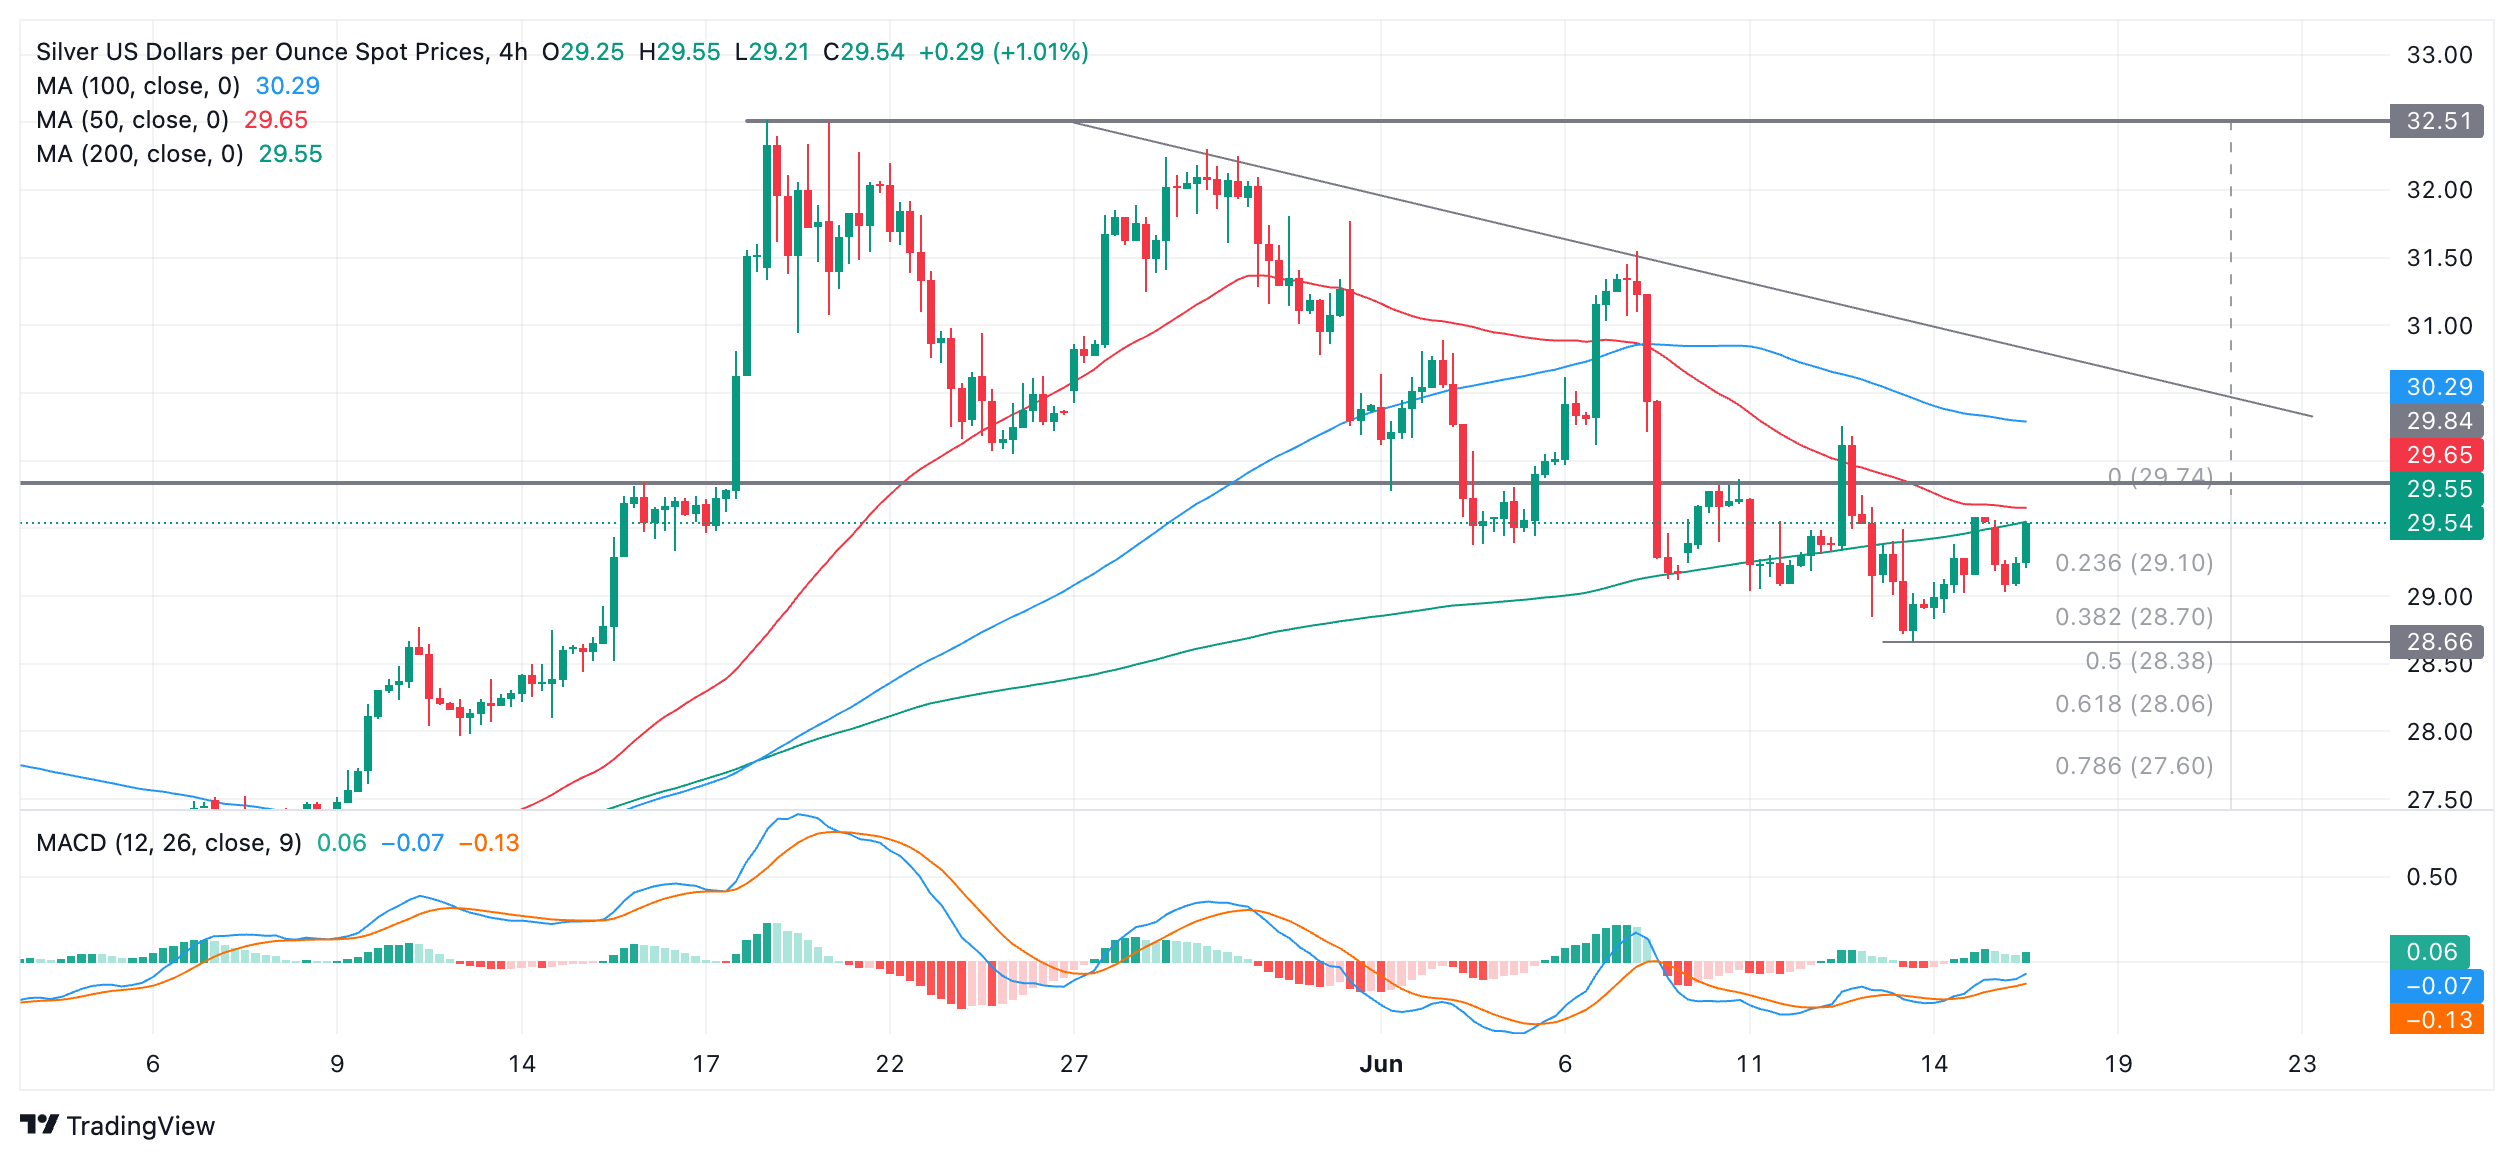
A break below $28.66 (June 13 low) would confirm another lower low, and a continuation of the bearish sequence.
After that, Silver could fall to an initial, conservative target at $28.06, the 0.618 Fibonacci ratio of the height of the range that unfolded in the second half of May, extrapolated lower.
The 50-day Simple Moving Average (SMA) at $29.01 could act as an obstacle to progress lower.
Even more bearishness could see Silver reach as low as $27.02 (100% extrapolation of the height of the range lower).
It would require a close above $30.50 to bring the short-term downtrend into doubt. A move above the $31.55 lower high would suggest the possibility of a recovery to the range high at $32.51, and a reversal of the short-term trend.
The industrial metals continue their descent from their recent euphoric highs, Ryan McKay, Senior Commodity Strategist at TDS, notes.
Copper is losing ground, Aluminum to see demand above $2,454/t
“With few signs of physical tightness, and increasing inventory levels across the globe, Copper remains at risk given macro traders have already built an extremely bloated long position. There are early signs of money managers unwinding their large long positions.”
“At the same time, the recent length accumulated from top Shanghai Futures Exchange (SHFE) funds has also been reduced heavily in the overnight session. Commodity Trading Advisors (CTAs) joined the selling party in Copper, however the margin of safety before the next round of selling remains at $8,990/t.”
“Additionally, we’re seeing China's Aluminum supply hit record levels. While the metal could see modest buying activity from CTAs above $2,454/t, there is a more significant trigger that could see funds liquidate approximately 10% of their historic max position below $2,389/t.”
- USD/CHF surges to near 0.8930 amid uncertainty over SNB’s policy decision.
- The SNB worries about price pressures reaccelerating due to the weak Swiss Franc.
- USD/CHF tests the breakdown region of the H&S pattern.
The USD/CHF pair recovers strongly from the round-level support of 0.8900 and jumps to near 0.8930 in Monday’s early New York session. The Swiss Franc asset strengthens as US Dollar (USD) clings to gains and the uncertainty over the Swiss National Bank’s (SNB) policy outcome.
Market sentiment appears to be cautious as Federal Reserve (Fed) policymakers continue to support only one rate cut this year as they want to see signs of disinflation for months. Contrary to that, the CME FedWatch tool shows the possibility of two rate cuts, which has been prompted by a higher-than-expected decline in the consumer and producer inflation readings for May.
The US Dollar Index (DXY) holds gains near 105.50. 10-year US Treasury yields soar to 4.27%.
Meanwhile, the Swiss Franc declines ahead of the SNB’s policy’s decision on Thursday. Investors see a close call this time as policymakers remain concerned over the inflation outlook. Weak Swiss Franc have made exports competitive and a sharp rise in import costs have deepened fears of price pressures reaccelerating again. However, year-on-year Swiss inflation has remained comfortably below the 2% threshold since June 2023.
USD/CHF declines after facing selling pressure near the neckline of the Head and Shoulder (H&S) chart pattern formed on a four-hour timeframe. A breakdown of the H&S chart formation results in a bearish reversal. The asset has established below the 200-period Exponential Moving Average (EMA) near 0.9015, which indicates that the overall trend is bearish.
The 14-period Relative Strength Index (RSI) hovers near 40.00. A decisive break below the same would trigger a bearish momentum.
Going forward, more recovery above the psychological resistance of 0.9000 will drive the asset towards June 3 high at 0.9036, followed by May 28 low at 0.9086.
On the flip side, room for more downside towards March 21 low at 0.8840 and the round-level support of 0.8800 will open if the asset breaks below June 4 low of 0.8900.
USD/CHF four-hour chart
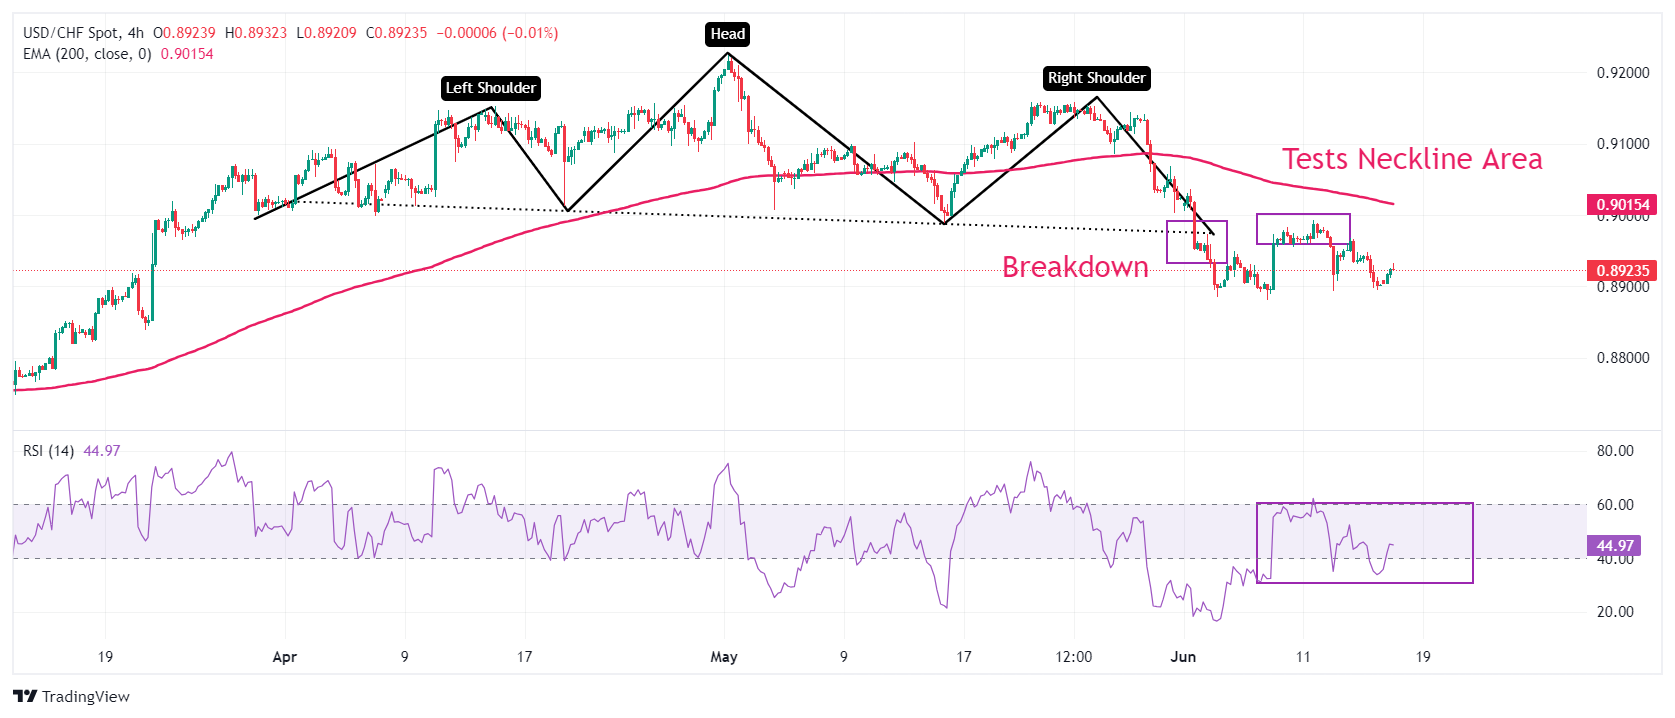
- EUR/GBP sold off to just below 0.8400 as its downtrend unfolds.
- It has formed a bullish Piercing Line Japanese candlestick reversal pattern indicating the potential for a correction higher.
- The pair is in an overall downtrend, however, indicating more downside will probably eventually materialize.
EUR/GBP has sold-off steeply since breaking out of a range-bound consolidation it was trading in for most of the start of the year.
EUR/GBP Daily Chart
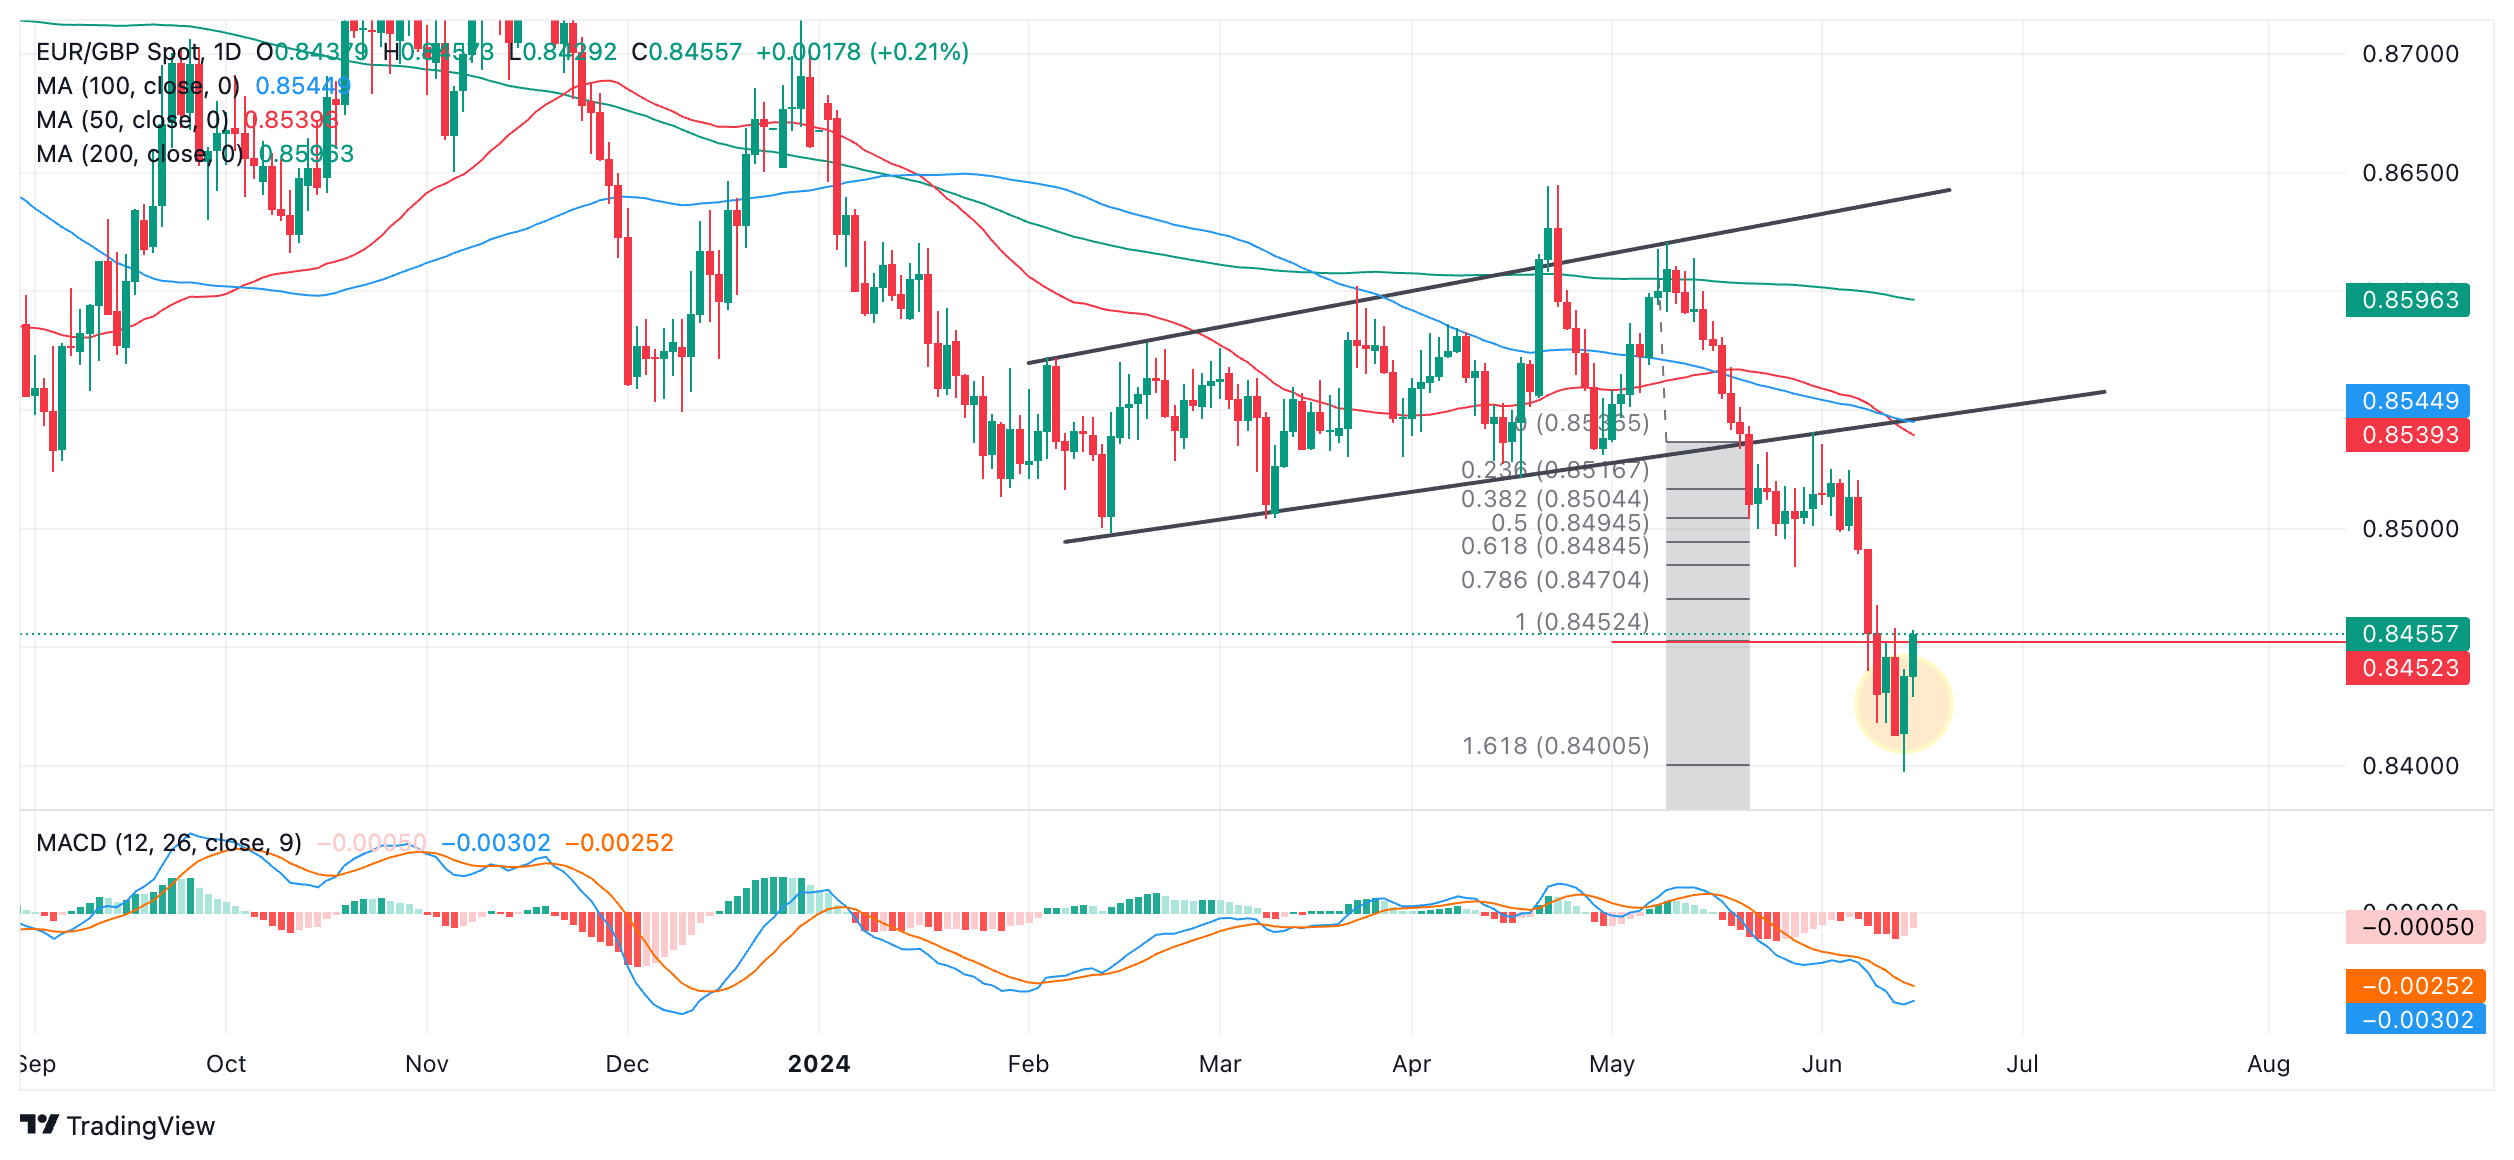
After touching a low at 0.8398 on June 1 4 it reversed and started rising, forming a Japanese Piercing Line candlestick reversal pattern in the process (circled). This occurs when price falls to a new low and then rotates higher during the same day, closing at a level above the halfway mark of the previous day’s body. The Piercing Line has been followed by a green up day today (Monday) and if it closes positive then it will provide added bullish confirmation of the reversal. The pattern suggests a short-term reversal but not a reversal of the trend. It could mean EUR/GBP is about to correct higher.
The trend, both on a short, intermediate and long-term basis is bearish on balance. Given “the trend is your friend” this suggests the correction will probably run out of steam and roll over eventually, with the dominant downtrend then resuming.
Price has reached both the conservative and main target for the breakout from the range that evolved during February, March, April and half of May.
Continued weakness could see it fall to the next downside target at 0.8340 (August 2022 low). A break below the 0.8397 (June 14 low) would provide confirmation of more downside.
- Federal Reserve looks for more "good inflation" data before cutting rates.
- Jerome Powell reiterates data-dependent approach, says they will make decisions meeting by meeting.
- Federal Reserve policymakers are divided over the timing of the policy pivot.
Federal Reserve (Fed) left the policy rate unchanged at 5.25%-5.5% following the June policy meeting, as expected. The revised Summary of Economic Projections (SEP), the so-called dot plot, showed that policymakers were divided over the near-term rate outlook. Four of 19 officials saw no rate cuts in 2024, seven projected a 25 basis points (bps) rate reduction, while eight marked down a 50 bps cut in the policy rate.
Fed officials comment on policy outlook
Fed Chairman Jerome Powell refrained from hinting at the timing of the rate reduction in the post-meeting press conference. "We need further confidence, more good inflation readings but won't be specific about how many to start rate cuts," Powell explained.
Following the Fed event and May inflation data, the probability of the Fed leaving the policy rate unchanged in September declined toward 30% from 50%, according to the CME FedWatch Tool.
With the Fed's blackout period coming to an end after the June meeting, investors will pay close attention to comments from policymakers in the near term.
Cleveland Fed President Loretta Mester said that she would like to see a "longer run of good-looking inflation data," and Minneapolis Fed President Neel Kashkari stated over the weekend that it would be a “reasonable prediction” that the Fed will wait until December to cut interest rates, adding that the central bank is in a very good position to get more data before making any decisions.
Fed FAQs
Monetary policy in the US is shaped by the Federal Reserve (Fed). The Fed has two mandates: to achieve price stability and foster full employment. Its primary tool to achieve these goals is by adjusting interest rates. When prices are rising too quickly and inflation is above the Fed’s 2% target, it raises interest rates, increasing borrowing costs throughout the economy. This results in a stronger US Dollar (USD) as it makes the US a more attractive place for international investors to park their money. When inflation falls below 2% or the Unemployment Rate is too high, the Fed may lower interest rates to encourage borrowing, which weighs on the Greenback.
The Federal Reserve (Fed) holds eight policy meetings a year, where the Federal Open Market Committee (FOMC) assesses economic conditions and makes monetary policy decisions. The FOMC is attended by twelve Fed officials – the seven members of the Board of Governors, the president of the Federal Reserve Bank of New York, and four of the remaining eleven regional Reserve Bank presidents, who serve one-year terms on a rotating basis.
In extreme situations, the Federal Reserve may resort to a policy named Quantitative Easing (QE). QE is the process by which the Fed substantially increases the flow of credit in a stuck financial system. It is a non-standard policy measure used during crises or when inflation is extremely low. It was the Fed’s weapon of choice during the Great Financial Crisis in 2008. It involves the Fed printing more Dollars and using them to buy high grade bonds from financial institutions. QE usually weakens the US Dollar.
Quantitative tightening (QT) is the reverse process of QE, whereby the Federal Reserve stops buying bonds from financial institutions and does not reinvest the principal from the bonds it holds maturing, to purchase new bonds. It is usually positive for the value of the US Dollar.
- The US Dollar trades in the green against most peers, with single exceptions for Central European currencies.
- France’s political uncertainty continues to weigh on the country’s bonds and stocks.
- The US Dollar index trades above 105.50 ahead of a soft Monday opening.
The US Dollar (USD) trades broadly steady on Monday as risk aversion prevails in markets amid the French political uncertainty. President Emmanuel Macron’s decision to call for snap legislative elections and the possibility of a far-right-dominated parliament spooked investors, who sold French assets on concerns about how Macron would cope with such a scenario. Sovereign bond spreads in Europe are widening even more, signalling a bond market in distress. Should the bond market continue its rout, the possibility of an intervention by the European Central Bank (ECB) shouldn’t be ruled out in order to keep the European bond market cohesive and in sync with its monetary policy.
On the economic data front, a very quiet start for this week from the US perspective with some lighter data ahead. Pivotal elements to look forward to are the Retail Sales on Tuesday and the Purchasing Managers Index (PMI) numbers on Friday. Traders will need to assess what will get priority: softer US data which would see an easing US Dollar, or will it be again the European political turmoil which would rather see US Dollar strength.
Daily digest market movers: European bond markets get trashed
- At the start of the European trading session on Monday, European sovereign bond spreads are widening even further than Friday (80 basis points at the time of writing between French and German 10-year benchmark bond yields). A dispersion in sovereign bond yields per country is causing issues for the European Central Bank (ECB) as it has only one overall monetary policy rate that it can use to control inflation in the Eurozone. When bond spreads between countries are getting too wide and too dispersed, the ECB has more difficulties controlling local price forces, which might lead to local flare-ups in inflation or even sudden deflation. The second element is that those countries might start having issues to fund their sovereign debt on international markets and might trigger a bank run or having the ECB stepping in to offer a lifeline to that country so that it doesn’t default on its debt. The best example of that was Greece in 2010 during the sovereign debt crisis.
- At 12:30 GMT, the NY Empire State Manufacturing Index for June is set to be released. Economists are expecting it to come in at -13, slightly up from -15.6 a month earlier.
- Near 17:00 GMT, Federal Reserve Bank of Philadelphia President Patrick Harker participates at the Global Interdependence Centre's 42nd Annual Monetary and Trade Conference.
- Equity markets are looking for direction. European equities are trying to snap the losing streak, even with the bond market turmoil. US Futures are mildly in the green.
- The CME FedWatch Tool shows a 33.3% chance of the Fed interest rate remaining at the current level in September. Odds for a 25-basis-points rate cut stand at 59.0%, while a very slim 7.7% chance is priced in for a 50-basis-points rate cut.
- The benchmark 10-year US Treasury Note slides to the lowest level for this month, near 4.23%, flirting with the lows seen in March.
US Dollar Index Technical Analysis: Eyes on Europe
The US Dollar Index (DXY) would likely not be where it is this Monday if it were not for the current European political turmoil. With a higher DXY, there is the risk of a quick correction if European headline risk start to abate and US data comes on the soft side. A fair warning thus that this US Dollar strength might be short-lived.
On the upside, no big changes to the levels traders need to watch out for. The first is 105.52, where the DXY is trading around, a barrier that held during most of April. The next level to watch is 105.88, which triggered a rejection at the start of May and will likely play its role as resistance again. Further up, the biggest challenge remains at 106.51, the year-to-date high from April 16.
On the downside, the trifecta of Simple Moving Averages (SMA) is still playing support. First is the 55-day SMA at 105.10. A touch lower, near 104.55 and 104.47, both the 100-day and the 200-day SMA are forming a double layer of protection to support any declines. Should this area be broken, look for 104.00 to salvage the situation.
US Dollar FAQs
The US Dollar (USD) is the official currency of the United States of America, and the ‘de facto’ currency of a significant number of other countries where it is found in circulation alongside local notes. It is the most heavily traded currency in the world, accounting for over 88% of all global foreign exchange turnover, or an average of $6.6 trillion in transactions per day, according to data from 2022. Following the second world war, the USD took over from the British Pound as the world’s reserve currency. For most of its history, the US Dollar was backed by Gold, until the Bretton Woods Agreement in 1971 when the Gold Standard went away.
The most important single factor impacting on the value of the US Dollar is monetary policy, which is shaped by the Federal Reserve (Fed). The Fed has two mandates: to achieve price stability (control inflation) and foster full employment. Its primary tool to achieve these two goals is by adjusting interest rates. When prices are rising too quickly and inflation is above the Fed’s 2% target, the Fed will raise rates, which helps the USD value. When inflation falls below 2% or the Unemployment Rate is too high, the Fed may lower interest rates, which weighs on the Greenback.
In extreme situations, the Federal Reserve can also print more Dollars and enact quantitative easing (QE). QE is the process by which the Fed substantially increases the flow of credit in a stuck financial system. It is a non-standard policy measure used when credit has dried up because banks will not lend to each other (out of the fear of counterparty default). It is a last resort when simply lowering interest rates is unlikely to achieve the necessary result. It was the Fed’s weapon of choice to combat the credit crunch that occurred during the Great Financial Crisis in 2008. It involves the Fed printing more Dollars and using them to buy US government bonds predominantly from financial institutions. QE usually leads to a weaker US Dollar.
Quantitative tightening (QT) is the reverse process whereby the Federal Reserve stops buying bonds from financial institutions and does not reinvest the principal from the bonds it holds maturing in new purchases. It is usually positive for the US Dollar.
- USD/CAD consolidates near 1.3750 with a focus on the US Retail Sales report for May.
- Investors see the Fed reducing interest rates twice this year against one forecasted by policymakers.
- The BoC may extend its policy-tightening spell in July.
The USD/CAD pair sis lightly up in Monday’s London session but has been trading in a range of 1.710-1.3780 from Thursday. The Loonie asset struggles to find direction as investors shift focus to the monthly United States (US) Retail Sales data for May, which will be published on Tuesday.
Investors will pay close attention to the US Retail Sales data for fresh cues on the Federal Reserve’s (Fed) policy outlook. The Retail Sales data is a close measure of consumer spending, which provides cues on the inflation outlook. This would give more clarity on the divergence between the Fed’s expectations of one rate cut this year and the two that financial markets are speculating about. Retail Sales are estimated to have expanded by 0.3% after remaining flat in April.
According to the CME FedWatch tool, the possibility of two rate cuts this year is very high and policymakers will start reducing from the September meeting.
Meanwhile, Fed officials continue to argue in favor of cutting interest rates only once this year as they want to see inflation declining for months to gain confidence in lowering interest rates. Fed policymakers remain concerned over reacceleration in price pressures due to premature rate cuts.
On the Canadian Dollar front, investors expect that the Bank of Canada (BoC) will deliver subsequent rate cuts in the July meeting. The BoC became the first among central banks of G-7 nations to start unwinding its restrictive monetary policy framework since the pandemic.
- Gold follows the general commodity pack lower on Monday.
- Traders weigh US economic data with Fedspeak to model future interest rates in the US, a key driver for Gold.
- XAU/USD continues forming a bearish Head-and-Shoulders pattern on the daily chart.
Gold (XAU/USD) trades marginally lower in the $2,320s on Monday as it joins a broad sell-off in commodities sparked by a run of poor Chinese economic data. The possibility that US interest rates might remain high for the foreseeable future further weighs on the precious metal.
At their policy meeting last Wednesday, US Federal Reserve (Fed) officials expressed reluctance to signal future cuts to interest rates due to persistent inflation. This, in turn, keeps the opportunity cost of owning non-yielding Gold high, and strengthens the US Dollar, in which Gold is priced.
Gold trades marginally lower amid weak data, a cautious Fed
Gold trades down about half a percent on Monday, exchanging hands in a familiar range as traders weigh up the evidence regarding the future trajectory of US interest rates, a key factor in evaluating the Gold price.
The release of US Producer Price Index (PPI) data on Thursday, the market’s gauge of “factory gate” price growth, provided evidence of a reduction in inflationary pressures, suggesting a higher probability the Federal Reserve (Fed) could move to cut interest rates in the near-term – a positive for Gold.
Yet the Fed itself revised down – from three to one – the number of interest-rate cuts it foresaw making in 2024, at its meeting on Wednesday. Additionally, Fed Chairman Jerome Powell dismissed the importance of the cooler-than-expected Consumer Price Index (CPI) data, released only a few hours earlier, saying it was only one data point, and endorsing a data-dependent approach going forward.
Gold price rose over half a percent to a peak of $2,342 after the disinflationary CPI release, before backtracking on the Fed’s more cautious stance.
On Friday, the Michigan Consumer Sentiment Index declined for the third straight month in a row to 65.6 in June, from 69.1 in May and well below forecasts of 72, preliminary estimates showed. Year-ahead inflation expectations remained unchanged at 3.3%, but the five-year one edged up to 3.1% from 3.0% in May, according to data from the University of Michigan. The overall takeaway from the data seemed to be that it reflected a slowdown in the economy with marginally bullish connotations for Gold.
Gold met pressure following the release of Gold reserves data from The People’s Bank of China (PBoC) last week. The data revealed that the PBoC stopped buying the precious metal between the end of April and May. It was the first time in 18 months the PBoC had not increased its Gold reserves. The inference was that Gold might be overpriced in their view. At the same, analysts at Citibank point to continued strong demand from consumers in China, which, they say, could contribute to a rise in Gold during 2024.
Technical Analysis: Gold forms Head-and-Shoulders top
Gold is still forming what looks like a bearish Head-and-Shoulders (H&S) price pattern. These patterns tend to occur at market tops and signal a change of trend.
XAU/USD Daily Chart
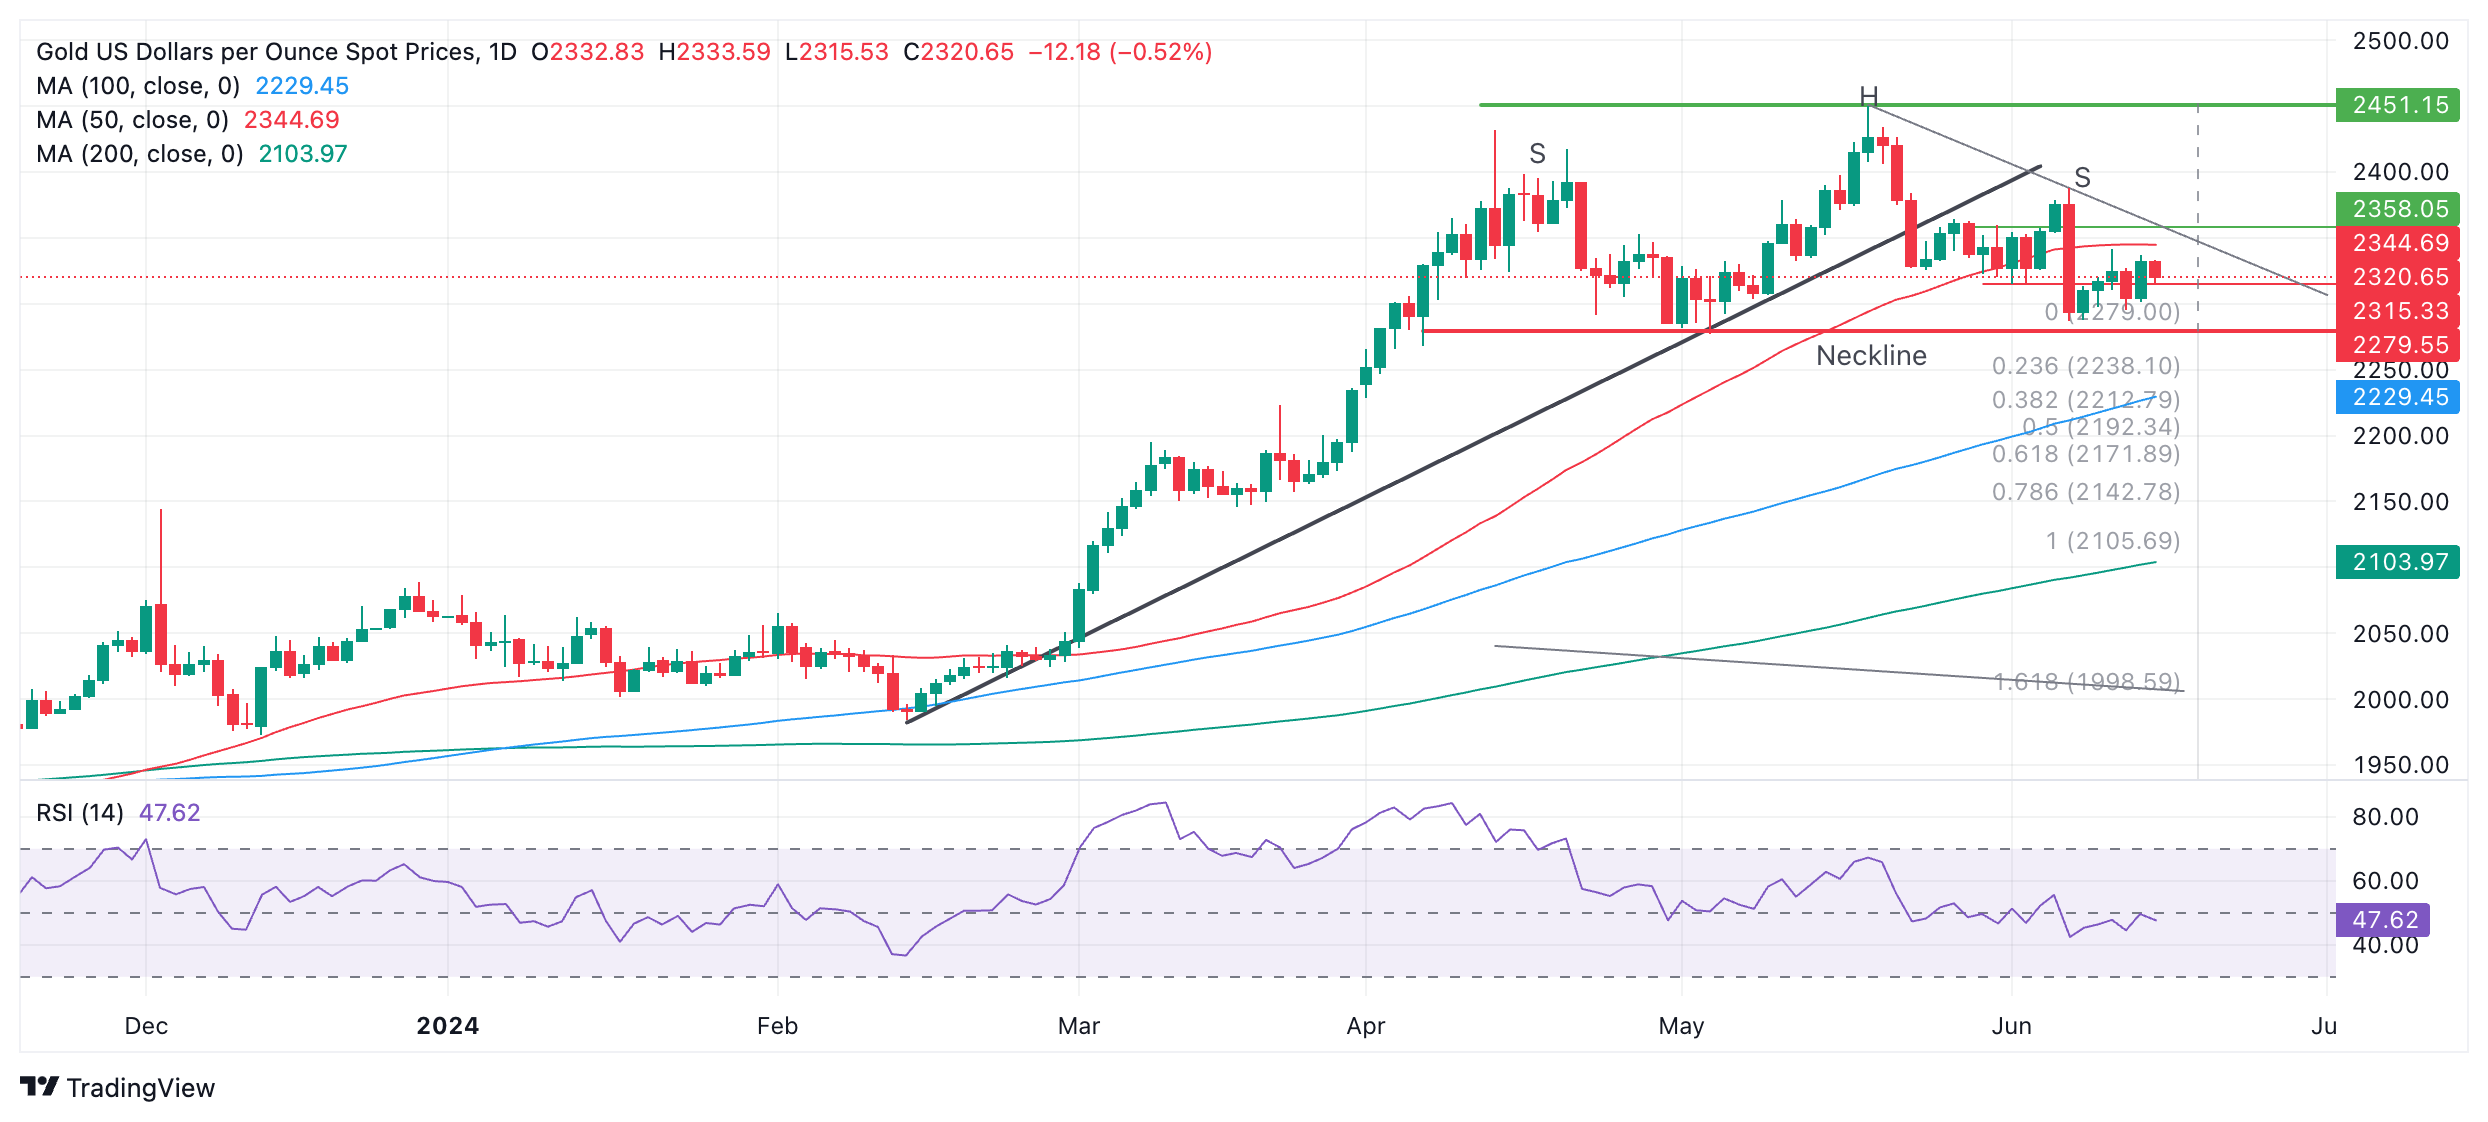
The H&S on Gold has completed a left and right shoulder (labeled “S”) and a “head” (labeled “H”). The so-called “neckline” of the pattern appears to be at the $2,279 support level (red line).
Declining momentum signaled by the Relative Strength Index (RSI) during its development corroborates the pattern.
A decisive break below the neckline would validate the H&S pattern and activate downside targets. The first more conservative target would be $2,171, calculated by taking the 0.618 Fibonacci ratio of the height of the pattern and extrapolating it lower from the neckline. The second target would be at $2,106, the full height of the pattern extrapolated lower.
A break above $2,345, however, would bring the H&S into doubt and could signal a continuation higher, to an initial target at the $2,450 peak.
Gold FAQs
Gold has played a key role in human’s history as it has been widely used as a store of value and medium of exchange. Currently, apart from its shine and usage for jewelry, the precious metal is widely seen as a safe-haven asset, meaning that it is considered a good investment during turbulent times. Gold is also widely seen as a hedge against inflation and against depreciating currencies as it doesn’t rely on any specific issuer or government.
Central banks are the biggest Gold holders. In their aim to support their currencies in turbulent times, central banks tend to diversify their reserves and buy Gold to improve the perceived strength of the economy and the currency. High Gold reserves can be a source of trust for a country’s solvency. Central banks added 1,136 tonnes of Gold worth around $70 billion to their reserves in 2022, according to data from the World Gold Council. This is the highest yearly purchase since records began. Central banks from emerging economies such as China, India and Turkey are quickly increasing their Gold reserves.
Gold has an inverse correlation with the US Dollar and US Treasuries, which are both major reserve and safe-haven assets. When the Dollar depreciates, Gold tends to rise, enabling investors and central banks to diversify their assets in turbulent times. Gold is also inversely correlated with risk assets. A rally in the stock market tends to weaken Gold price, while sell-offs in riskier markets tend to favor the precious metal.
The price can move due to a wide range of factors. Geopolitical instability or fears of a deep recession can quickly make Gold price escalate due to its safe-haven status. As a yield-less asset, Gold tends to rise with lower interest rates, while higher cost of money usually weighs down on the yellow metal. Still, most moves depend on how the US Dollar (USD) behaves as the asset is priced in dollars (XAU/USD). A strong Dollar tends to keep the price of Gold controlled, whereas a weaker Dollar is likely to push Gold prices up.
- NZD/USD falls further to 0.6140 as the Fed’s hawkish remarks improve the US Dollar’s appeal.
- Sost US inflation reports have prompted Fed rate-cut prospects for September.
- China’s weak data weighs on the New Zealand Dollar.
The NZD/USD pair extends its losing streak for the third trading day on Monday. The Kiwi asset declines to near 0.6140 as the US Dollar (USD) clings to gains amid a tug of war between Federal Reserve (Fed) and market speculation for how much interest rates will be reduced this year.
Fed policymakers have acknowledged that the progress in inflation declining to bank’s target of 2% has resumed after the release of the cooler consumer and producer inflation reports for May. However, they want to see price pressures declining for months before considering rate cuts. Therefore, they expect room for only one rate-cut this year.
However, soft inflation reports have boosted market expectations for two rate cuts this year. The CME FedWatch tool shows that the Fed will start reducing interest rates from the September meeting and will cut again in the November or December meeting.
Meanwhile, the New Zealand Dollar weakens after various Chinese economic indicators suggested uncertainty over the economic outlook. In May, the House Price Index deflated by 3.9%, and Industrial Production and YTD Fixed Asset Investment grew slower than expected by 5.6% and 4%, respectively. However, Retail Sales rose by 3.7%, beat expectations of 3% and the prior release of 2.3%. The New Zealand (NZ) economy is one of the leading trading partners of China, and the latter’s weak economic performance impacts the Kiwi dollar.
NZD/USD declines while attempting to deliver a breakout of the Inverted Head and Shoulder (H&S) chart pattern formed on a daily timeframe. The neckline of the above-mentioned chart pattern is marked near 0.6215. The asset has declined below the 20-day Exponential Moving Average (EMA) near 0.6130, which indicates an uncertain near-term outlook.
The 14-period Relative Strength Index (RSI) falls back into the 40.00-60.00 range, indicating that the upside momentum has faded.
Fresh downside would appear if the asset breaks below April 4 high around 0.6050 This would drag the asset towards the psychological support of 0.6000 and April 25 high at 0.5969.
On the contrary, a reversal move above June 12 high of 0.6222, which will expose the asset January 15 high near 0.6250, followed by January 12 high near 0.6280.
NZD/USD daily chart
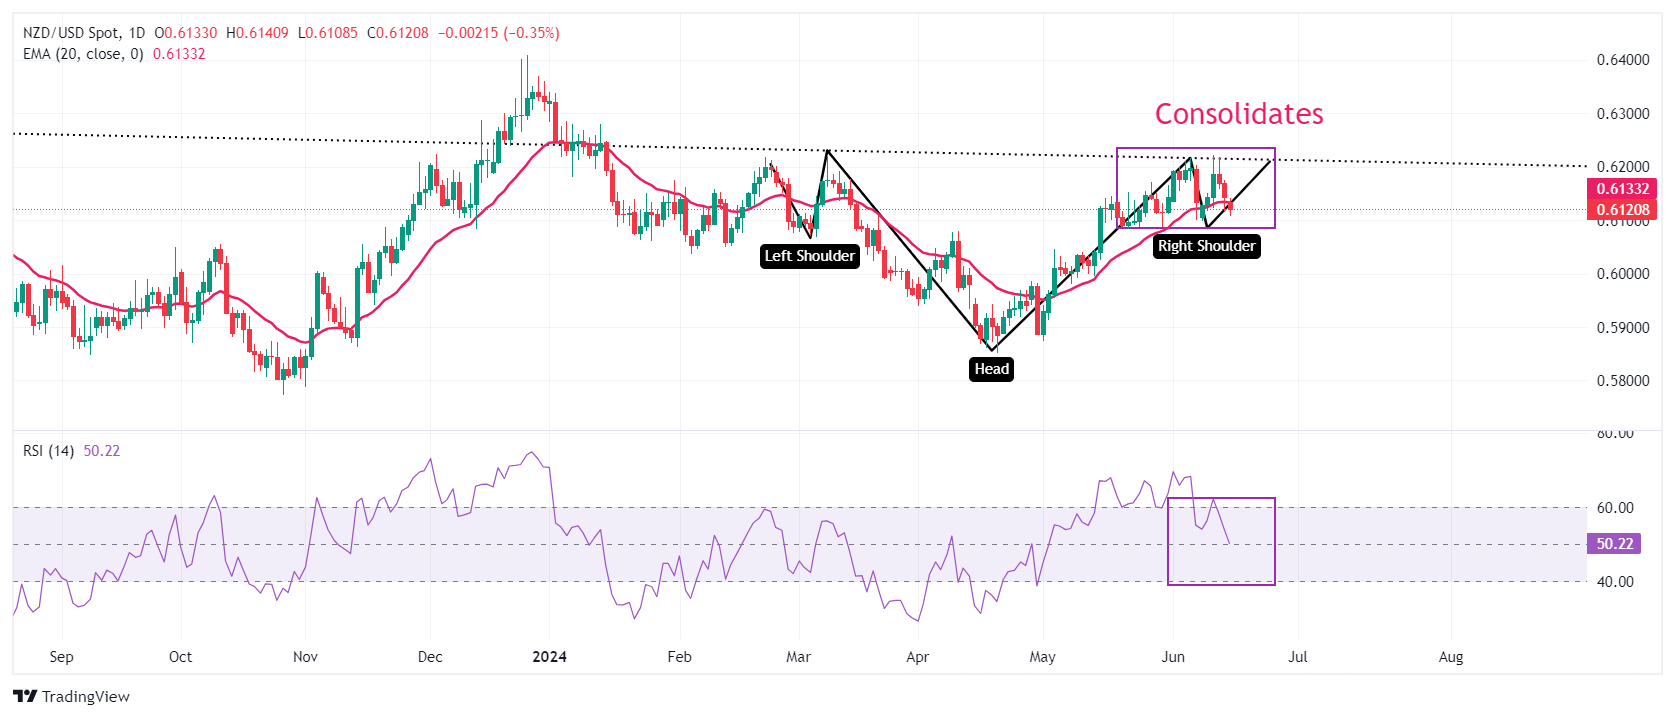
- AUD/USD has fallen to the floor of a range it began in mid-May.
- The pair is in a sideways short-term trend which is likely to extend.
- This suggests the likely evolution of an up leg towards the range ceiling.
AUD/USD has fallen to the bottom of a range it has been trading in since the middle of May. From here it is likely to reverse and start moving back up to the top of the range at roughly 0.8609.
AUD/USD is in a short-term sideways trend which, given “the trend is your friend,” is more likely than not to continue.
AUD/USD 4-hour Chart
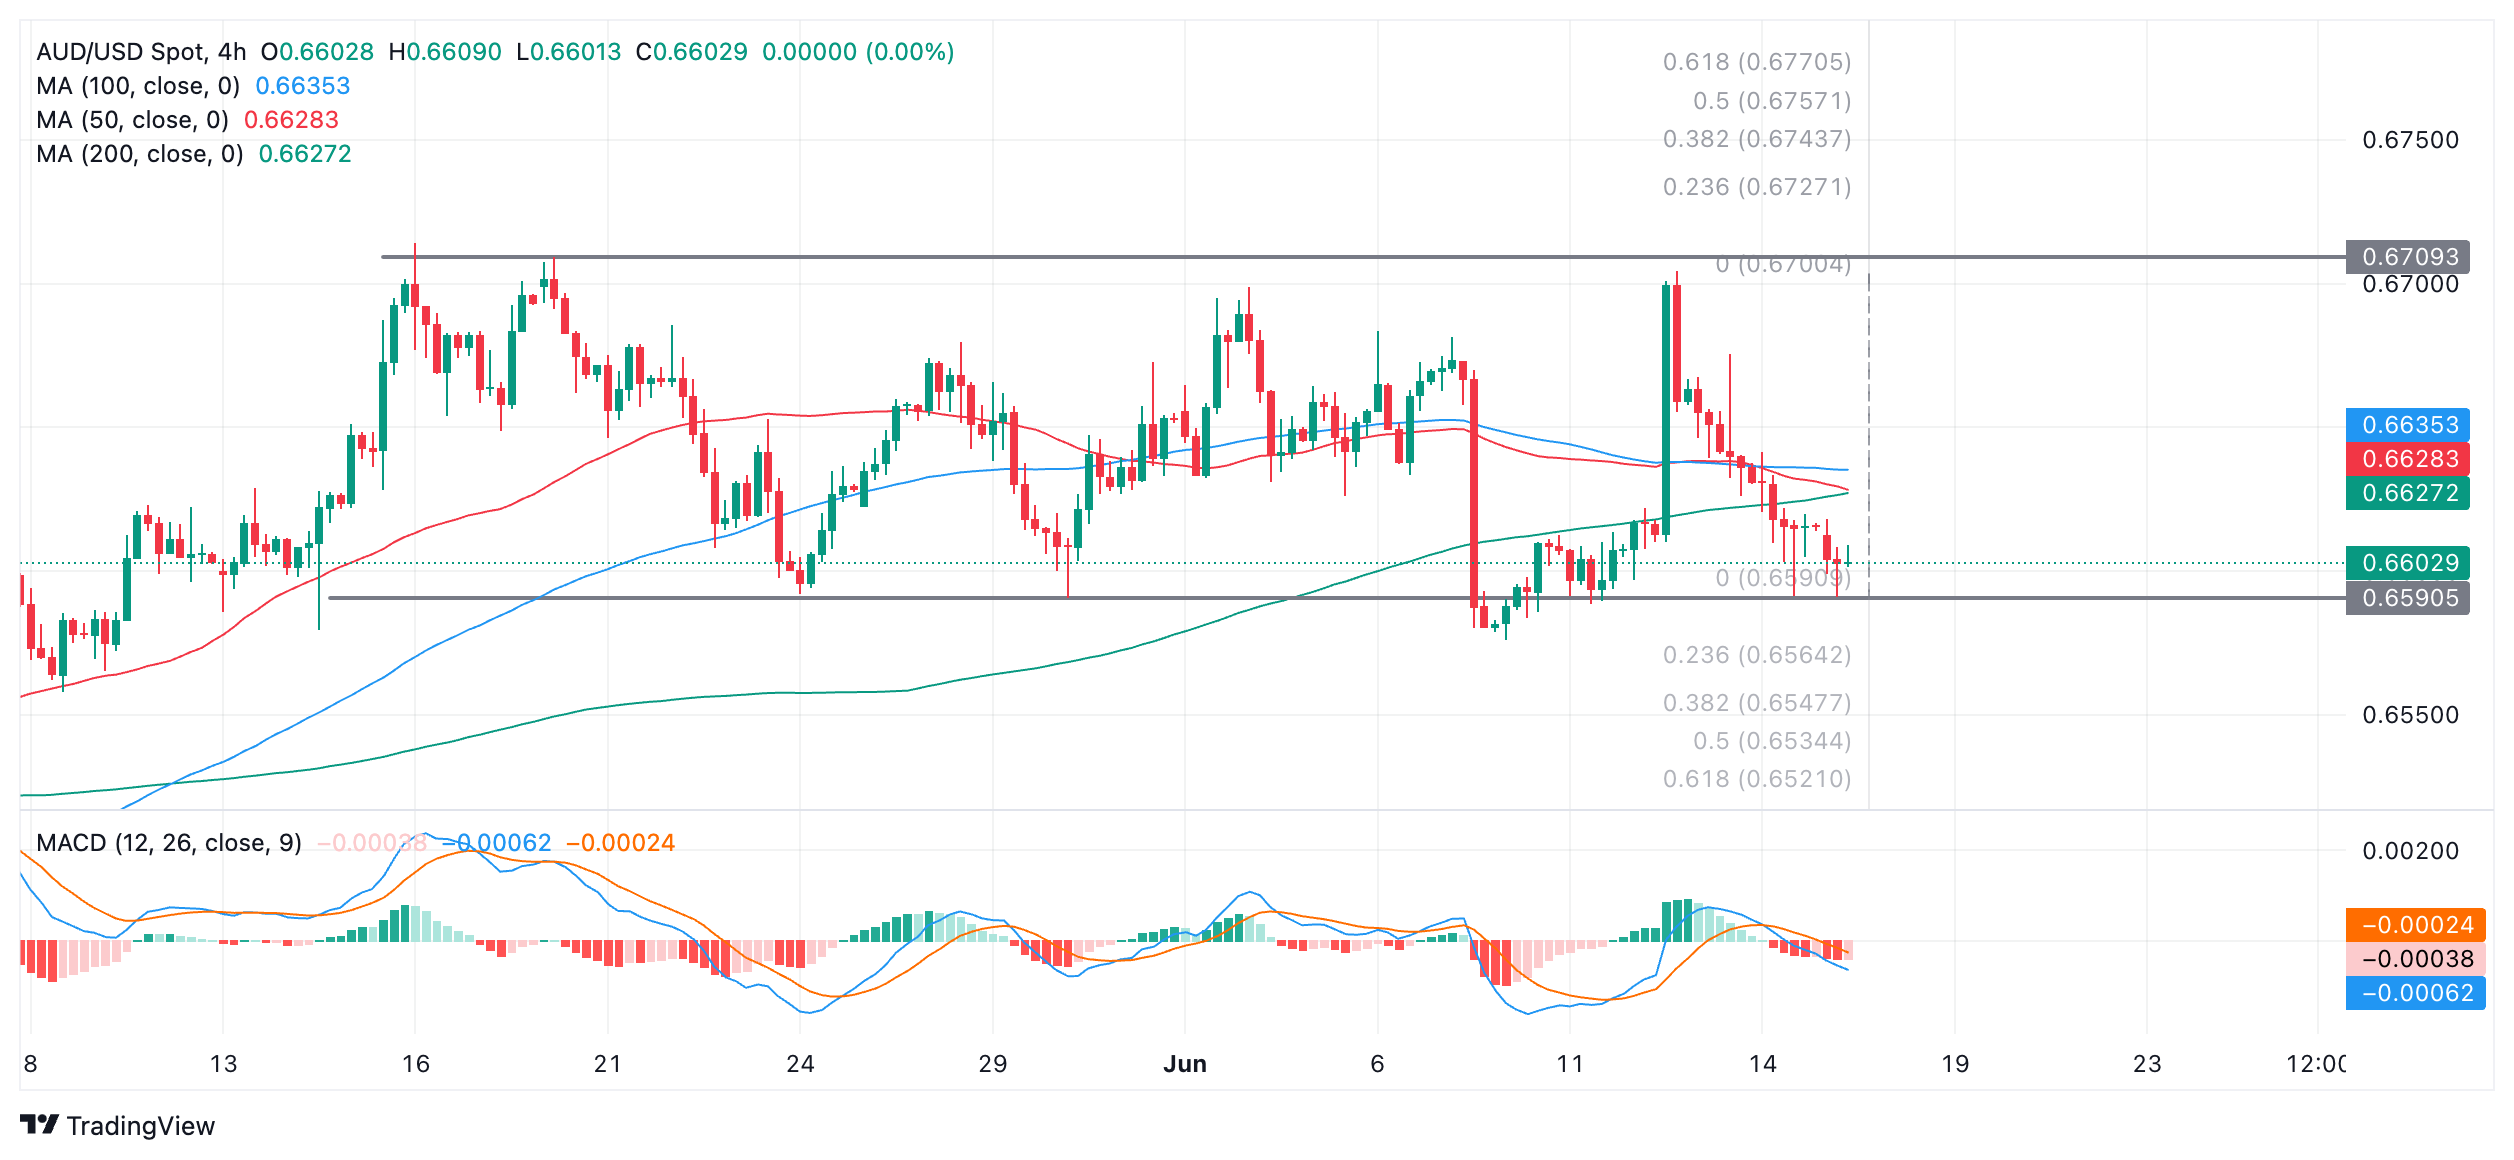
It would require a decisive break out of the range to signal the end of the sideways trend and a change to a more directional trend. An upside break is marginally more likely to happen because the trend prior range was bullish.
A decisive break above the ceiling of the range would likely see a follow-through to a conservative target at 0.6770; a decisive break below the range floor would indicate a follow-through to at least 0.6521.
A decisive break would be one in which a longer-than-average candle broke out of the range and closed near its high or low, or three successive candles of the same color broke cleanly through the range top or bottom.
The targets are generated using the usual technical-analysis method of extrapolating the height of the range by a Fibonacci 0.618 ratio higher (in the case of an upside break) or lower (in the case of a downside break). A more generous target would come from extrapolating the full height of the range.
- Oil ticks higher on Monday amid broad consolidation ongoing.
- Demand recovery faces substantial issues in the medium turn with the shift away from fossil fuels.
- The US Dollar Index trades above 105.50 on the back of turmoil in the European bond market.
Oil prices are heading slightly higher on Monday, with no big headlines driving up prices. It looks like traders are evaluating and estimating how the shift to Electric Vehicles will impact demand in the medium to long term projections, while an uprising in fuel demand over the summer will certainly lead to an uprising in Oil prices in the short term. This could translate to smaller volumes traded ahead of more clarity on how to approach this change in narrative short term versus long term.
Meanwhile, the US Dollar Index (DXY) is trading above 105.50, with additional help from the European bond markets, which are in distress. Sovereign bonds are seeing spreads, the difference between the yield in maturity from one country against another, widening. This could cause issues for the European Central Bank (ECB) as it could cause some difficult financial conditions for some countries that need to refinance their sovereign debt in financial markets.
At the time of writing, Crude Oil (WTI) trades at $78.32 and Brent Crude at $82.45
Oil news and market movers: Near vs long term
- Vortex data revealed that the amount of crude oil held worldwide on tankers that have been stationary for at least seven days fell to 78.66m bbl as of June 14, Bloomberg reported. That is a fall of nearly 12%.
- Jet Fuel demand will keep growing as the demand for plane travel continues to pick up, Bloomberg data reported.
- OPEC sticks to its bullish outlook against the forecast from the International Energy Agency (IEA) and expects more demand pickup by the fall and winter of this year.
- Mixed economic data from China makes traders question whether China will be able to keep up its current demand resurgence, Reuters reports.
Oil Technical Analysis: What does OPEC see?
Oil price remains a bit puzzling on what to do next. Although several commodity desks and analysts warn of the green shift that will hurt Oil demand in the long run, OPEC keeps sticking to its bullish outlook. Expect to see further consolidation until more pieces of the puzzle fall into place to give traders more outlook on demand.
Looking up, the key two levels ahead of $80.00 are the 100-day and 200-day Simple Moving Averages (SMA) at $79.26 and $79.13, respectively. Next, the 55-day Simple Moving Average (SMA) at $80.11 is a level with a lot of resistance where any recovery rally could pause. Once broken through, the road looks quite open to $87.12.
On the other side, the $76.00 marker is still acting as a support, with the $75.27 level playing a crucial role if traders still want to have an option to head back to $80.00. However, risks are skewed towards another leg lower if the US Federal Reserve (Fed) keeps its hawkish tone, sending Oil further down below $70.00.
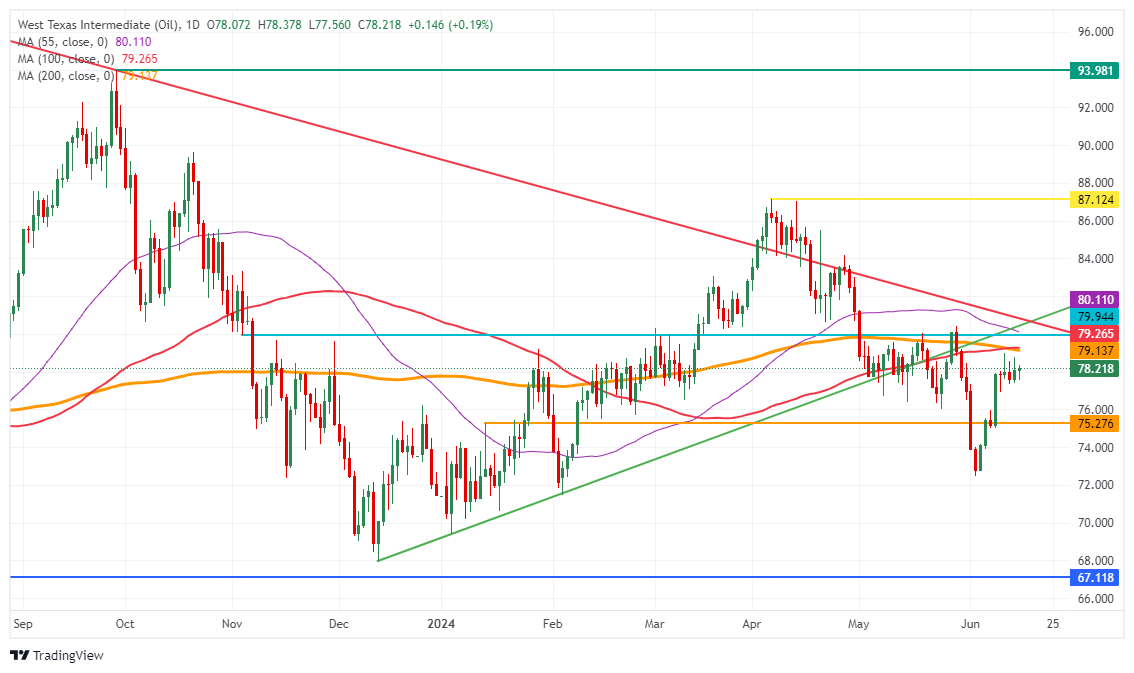
US WTI Crude Oil: Daily Chart
WTI Oil FAQs
WTI Oil is a type of Crude Oil sold on international markets. The WTI stands for West Texas Intermediate, one of three major types including Brent and Dubai Crude. WTI is also referred to as “light” and “sweet” because of its relatively low gravity and sulfur content respectively. It is considered a high quality Oil that is easily refined. It is sourced in the United States and distributed via the Cushing hub, which is considered “The Pipeline Crossroads of the World”. It is a benchmark for the Oil market and WTI price is frequently quoted in the media.
Like all assets, supply and demand are the key drivers of WTI Oil price. As such, global growth can be a driver of increased demand and vice versa for weak global growth. Political instability, wars, and sanctions can disrupt supply and impact prices. The decisions of OPEC, a group of major Oil-producing countries, is another key driver of price. The value of the US Dollar influences the price of WTI Crude Oil, since Oil is predominantly traded in US Dollars, thus a weaker US Dollar can make Oil more affordable and vice versa.
The weekly Oil inventory reports published by the American Petroleum Institute (API) and the Energy Information Agency (EIA) impact the price of WTI Oil. Changes in inventories reflect fluctuating supply and demand. If the data shows a drop in inventories it can indicate increased demand, pushing up Oil price. Higher inventories can reflect increased supply, pushing down prices. API’s report is published every Tuesday and EIA’s the day after. Their results are usually similar, falling within 1% of each other 75% of the time. The EIA data is considered more reliable, since it is a government agency.
OPEC (Organization of the Petroleum Exporting Countries) is a group of 13 Oil-producing nations who collectively decide production quotas for member countries at twice-yearly meetings. Their decisions often impact WTI Oil prices. When OPEC decides to lower quotas, it can tighten supply, pushing up Oil prices. When OPEC increases production, it has the opposite effect. OPEC+ refers to an expanded group that includes ten extra non-OPEC members, the most notable of which is Russia.
- USD/JPY moves higher to 157.70 as Fed policymakers see only one rate cut this year.
- The USD Index will dance to the tunes of the US Retail Sales data for May.
- The BoJ postpones tapering the amount of bond-buying to the July meeting.
The USD/JPY pair jumps to 157.70 in Monday’s European session as the US Dollar (USD) holds strength due to a hawkish outlook on interest rates by Federal Reserve’s (Fed) officials. The US Dollar Index (DXY), which tracks the Greenback’s value against six major currencies, clings to gains near 105.55.
Fed policymakers continue to argue in favor of lowering interest rates only once this year amid fears of reacceleration in price pressures. Officials worry that progress in the disinflation process could remain slow due to strong labor market conditions. United States (US) consumer inflation cooled more than expected in May after an expected decline in April.
Though Fed policymakers want more soft inflation data to get convinced for rate cuts, the confidence of financial markets has increased significantly for early rate cuts. The CME FedWatch tool shows high possibility of two rate cuts this year and policymakers will return to policy-normalization from the September meeting.
This week, investors will focus on the US monthly Retail Sales data for May to get more cues on the interest rate outlook. The Retail Sales data, which is a leading indicator of consumer spending, is expected to have increased by 0.3% after remaining stagnant in April.
Meanwhile, the Japanese Yen weakens as taper tantrum plans have been postponed by the Bank of Japan (BoJ) to the July’s meeting. The BoJ didn’t rule out expectations of more rate hikes in July as weak Japanese Yen has boosted import prices, which is driving inflation higher.
- The Pound Sterling remains vulnerable around 1.2670 as investors turn cautious ahead of the UK inflation for May and the BoE’s policy outcome.
- UK’s headline inflation is expected to come lower at the central bank’s target of 2%.
- Fed’s Kashkari sees only one rate-cut move this year despite progress in disinflation has resumed.
The Pound Sterling (GBP) continues its losing streak for the third trading day against the US Dollar (USD) on Monday. The GBP/USD pair hovers near a monthly low at around 1.2670 as the Federal Reserve’s (Fed) hawkish outlook on interest rates keeps the US Dollar’s appeal firm.
This weekend, Minneapolis Fed Bank President Neel Kashkari said in an interview with CBS that it's a "reasonable prediction" that the United States (US) central bank will cut interest rates once this year, waiting until December to do it.
Contrary to the Fed’s support for reducing interest rates only once this year, financial markets speculate that the Fed will deliver two rate cuts and start unwinding its restrictive policy framework from the September meeting, with subsequent rate cuts in the November or December meeting. The soft US Consumer Price Index (CPI) and Producer Price Index (PPI) reports for May have prompted higher expectations for early rate cuts.
On Friday, Chicago Fed Bank President Austan Goolsbee acknowledged that cooler consumer and producer inflation reports for May had relieved him. However, he wants to see similar data for months before lowering interest rates. Goolsbee advocated for reducing interest rates only once this year.
Daily digest market movers: Pound Sterling remains vulnerable ahead of key UK events
- The Pound Sterling exhibits a poor performance against all major currencies amid uncertainty ahead of the United Kingdom (UK) Consumer Price Index (CPI) data for May and the Bank of England’s (BoE) interest rate policy, which are scheduled for Wednesday and Thursday, respectively.
- Economists expect the UK Office for National Statistics (ONS) to report a sharp decline in the core CPI, which strips off the more volatile items, to 3.5% from 3.9% in April. The headline inflation is expected to return to the central bank’s target of 2.0% from the prior reading of 2.3%. Investors will keenly focus on service inflation, which has been a major barrier to the BoE’s move towards policy normalization.
- The expected decline in UK inflation will increase investors’ confidence that price pressures will stabilize near the desired rate. This will boost expectations of early rate cuts by the Bank of England (BoE). For June’s policy meeting, the BoE is expected to leave interest rates unchanged at 5.25%. Investors will pay close attention to the vote split and fresh cues on the interest rate outlook.
- In the last policy meeting, BoE Deputy Governor Dave Ramsden joined policymaker Swati Dhingra and voted for lowering interest rates by 25 basis points (bps) to 5.0%. Currently, investors remain split between August or September meetings from when the BoE could start reducing interest rates.
Pound Sterling Price Today:
British Pound PRICE Today
The table below shows the percentage change of British Pound (GBP) against listed major currencies today. British Pound was the strongest against the Japanese Yen.
| GBP | EUR | USD | JPY | CAD | AUD | NZD | CHF | |
|---|---|---|---|---|---|---|---|---|
| GBP | -0.14% | -0.09% | 0.20% | -0.11% | -0.05% | 0.10% | 0.06% | |
| EUR | 0.14% | 0.07% | 0.29% | 0.06% | 0.13% | 0.30% | 0.20% | |
| USD | 0.09% | -0.07% | 0.19% | -0.02% | 0.15% | 0.19% | 0.13% | |
| JPY | -0.20% | -0.29% | -0.19% | -0.10% | -0.04% | 0.14% | -0.01% | |
| CAD | 0.11% | -0.06% | 0.02% | 0.10% | 0.10% | 0.19% | 0.16% | |
| AUD | 0.05% | -0.13% | -0.15% | 0.04% | -0.10% | 0.23% | 0.11% | |
| NZD | -0.10% | -0.30% | -0.19% | -0.14% | -0.19% | -0.23% | -0.05% | |
| CHF | -0.06% | -0.20% | -0.13% | 0.00% | -0.16% | -0.11% | 0.05% |
The heat map shows percentage changes of major currencies against each other. The base currency is picked from the left column, while the quote currency is picked from the top row. For example, if you pick the British Pound from the left column and move along the horizontal line to the US Dollar, the percentage change displayed in the box will represent GBP (base)/USD (quote).
Technical Analysis: Pound Sterling declines to 50-day EMA
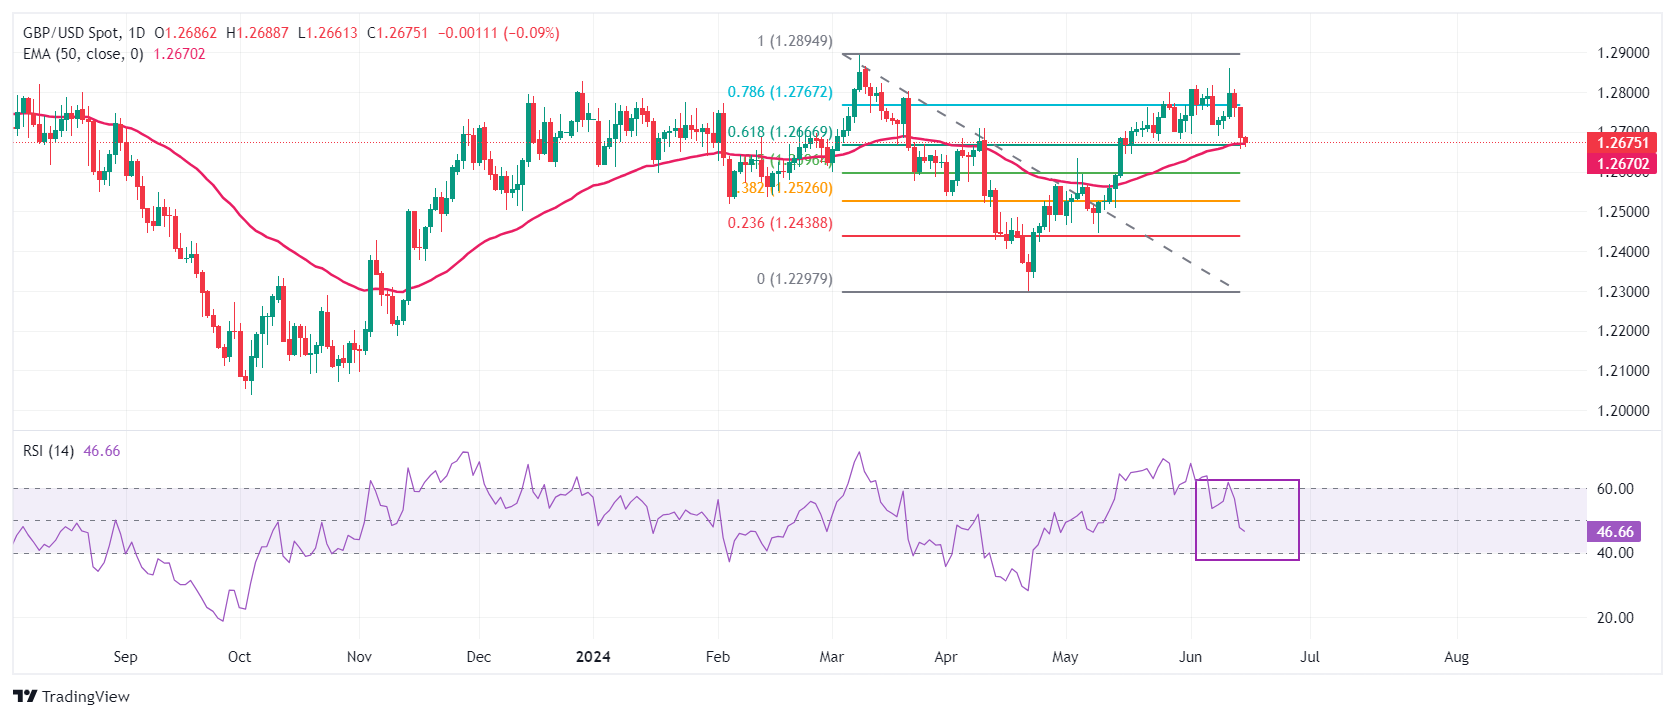
The Pound Sterling trades inside Friday’s trading range amid caution ahead of UK inflation data and BoE monetary policy meeting. The GBP/USD pair struggles to sustain above the 61.8% Fibonacci retracement support (plotted from the March 8 high of 1.2900 to the April 22 low at 1.2300) at 1.2667.
The Cable has declined to near the 50-day Exponential Moving Average (EMA), which trades around 1.2670, suggesting that the near-term outlook is uncertain.
The 14-period Relative Strength Index (RSI) falls back into the 40.00-60.00 range, indicating that the upside momentum has faded.
Pound Sterling FAQs
The Pound Sterling (GBP) is the oldest currency in the world (886 AD) and the official currency of the United Kingdom. It is the fourth most traded unit for foreign exchange (FX) in the world, accounting for 12% of all transactions, averaging $630 billion a day, according to 2022 data. Its key trading pairs are GBP/USD, aka ‘Cable’, which accounts for 11% of FX, GBP/JPY, or the ‘Dragon’ as it is known by traders (3%), and EUR/GBP (2%). The Pound Sterling is issued by the Bank of England (BoE).
The single most important factor influencing the value of the Pound Sterling is monetary policy decided by the Bank of England. The BoE bases its decisions on whether it has achieved its primary goal of “price stability” – a steady inflation rate of around 2%. Its primary tool for achieving this is the adjustment of interest rates. When inflation is too high, the BoE will try to rein it in by raising interest rates, making it more expensive for people and businesses to access credit. This is generally positive for GBP, as higher interest rates make the UK a more attractive place for global investors to park their money. When inflation falls too low it is a sign economic growth is slowing. In this scenario, the BoE will consider lowering interest rates to cheapen credit so businesses will borrow more to invest in growth-generating projects.
Data releases gauge the health of the economy and can impact the value of the Pound Sterling. Indicators such as GDP, Manufacturing and Services PMIs, and employment can all influence the direction of the GBP. A strong economy is good for Sterling. Not only does it attract more foreign investment but it may encourage the BoE to put up interest rates, which will directly strengthen GBP. Otherwise, if economic data is weak, the Pound Sterling is likely to fall.
Another significant data release for the Pound Sterling is the Trade Balance. This indicator measures the difference between what a country earns from its exports and what it spends on imports over a given period. If a country produces highly sought-after exports, its currency will benefit purely from the extra demand created from foreign buyers seeking to purchase these goods. Therefore, a positive net Trade Balance strengthens a currency and vice versa for a negative balance.
Silver prices (XAG/USD) fell on Monday, according to FXStreet data. Silver trades at $29.19 per troy ounce, down 1.24% from the $29.56 it cost on Friday.
Silver prices have increased by 14.61% since the beginning of the year.
| Unit measure | Today Price |
|---|---|
| Silver price per troy ounce | $29.19 |
| Silver price per gram | $0.94 |
The Gold/Silver ratio, which shows the number of troy ounces of Silver needed to equal the value of one troy ounce of Gold, stood at 79.55 on Monday, up from 78.93 on Friday.
Investors might use this ratio to determine the relative valuation of Gold and Silver. Some may consider a high ratio as an indicator that Silver is undervalued – or Gold is overvalued – and might buy Silver or sell Gold accordingly. Conversely, a low ratio might suggest that Gold is undervalued relative to Silver.
Silver FAQs
Silver is a precious metal highly traded among investors. It has been historically used as a store of value and a medium of exchange. Although less popular than Gold, traders may turn to Silver to diversify their investment portfolio, for its intrinsic value or as a potential hedge during high-inflation periods. Investors can buy physical Silver, in coins or in bars, or trade it through vehicles such as Exchange Traded Funds, which track its price on international markets.
Silver prices can move due to a wide range of factors. Geopolitical instability or fears of a deep recession can make Silver price escalate due to its safe-haven status, although to a lesser extent than Gold's. As a yieldless asset, Silver tends to rise with lower interest rates. Its moves also depend on how the US Dollar (USD) behaves as the asset is priced in dollars (XAG/USD). A strong Dollar tends to keep the price of Silver at bay, whereas a weaker Dollar is likely to propel prices up. Other factors such as investment demand, mining supply – Silver is much more abundant than Gold – and recycling rates can also affect prices.
Silver is widely used in industry, particularly in sectors such as electronics or solar energy, as it has one of the highest electric conductivity of all metals – more than Copper and Gold. A surge in demand can increase prices, while a decline tends to lower them. Dynamics in the US, Chinese and Indian economies can also contribute to price swings: for the US and particularly China, their big industrial sectors use Silver in various processes; in India, consumers’ demand for the precious metal for jewellery also plays a key role in setting prices.
Silver prices tend to follow Gold's moves. When Gold prices rise, Silver typically follows suit, as their status as safe-haven assets is similar. The Gold/Silver ratio, which shows the number of ounces of Silver needed to equal the value of one ounce of Gold, may help to determine the relative valuation between both metals. Some investors may consider a high ratio as an indicator that Silver is undervalued, or Gold is overvalued. On the contrary, a low ratio might suggest that Gold is undervalued relative to Silver.
(An automation tool was used in creating this post.)
European Central Bank (ECB) Chief Economist Phillip Lane noted on Monday that they are seeing significant wage increases in some Eurozone countries, per Reuters.
Key takeaways
"Cost pressures to be muted next year."
"We should not be too sensitive to monthly inflation data, need to differentiate between noise and signal."
"Inflation jumps we don't like, bumps we can deal with."
"We need to see domestic services inflation momentum come down."
Market reaction
These comments failed to trigger a noticeable reaction in EUR/USD. The pair was last seen trading virtually unchanged on the day at 1.0705.
- The Mexican Peso trades flat or lower in its major pairs at the start of the new trading week.
- Global growth fears and the unwillingness of the Fed to lower borrowing costs are curbing enthusiasm and weighing on MXN.
- USD/MXN is still pulling back in the midst of a short and medium-term uptrend.
The Mexican Peso (MXN) trades either flat or edges lower in its key pairs on Monday as market sentiment sours and commodity prices sell-off on global growth fears. As a “risk-on” currency, the Peso accordingly takes some heat.
At the time of writing, a single US Dollar (USD) buys 18.47 Mexican Pesos, EUR/MXN is trading at 19.77 and GBP/MXN at 23.41.
Mexican Peso edges lower on global outlook, Fed caution
The Mexican Peso trades marginally bearish at the start of the new trading week as global growth concerns weigh. A contraction in official Chinese manufacturing data in May combined with a fall in commodity imports due to rising prices are partly to blame. However, the US Federal Reserve’s (Fed) cautious stance at its meeting on Wednesday, with the bank clearly not in a hurry to reduce borrowing costs, further weighed on overall market sentiment.
This comes after a recovery rally for MXN on Thursday, due to verbal intervention by the President of the Banco de Mexico (Banxico), Victoria Rodriguez Ceja, who said Banxico would step in to prop up the Peso if volatility became too “extreme”.
Political risk also continues to provide a background risk for the Peso. Investors are fretting over the victory of President-elect Claudia Sheinbaum and her left-wing coalition Sigamos Haciendo Historia (SHH) at the June 2 elections. SHH won a supermajority in the Mexican House of Deputies and came two seats away in the Senate. This will give it a mandate to push through radical amendments to the constitution that have set markets on edge.
Market positioning has added fuel to sell-off following the build-up of an overweight long bet on the Mexican Peso since its long-term uptrend began in 2020. Relatively high interest rates of 11.00%, set by the Banxico to control inflation, have been a major draw for investors seeking returns. This is especially true of carry traders, for example, who borrow in currencies with low interest rates like the Japanese Yen (Apr circa 0.0% -0.1%) and invest in currencies like the Mexican Peso that offer higher returns (Apr circa 11.00%), pocketing the difference.
“Before the election, we’d been arguing for some time that the Peso appeared increasingly overvalued and was vulnerable to a sharp fall – the declines over the past couple of weeks have taken it within touching distance of our long-standing year-end forecast of 19.00 (USD/MXN),” said Jason Tuvey, Deputy Chief Emerging Markets Economist at Capital Economics, to FXStreet.
Technical Analysis: USD/MXN pulls back but remains in short-term uptrend
USD/MXN appears to be resuming its short-term uptrend after a pullback, and given “the trend is your friend,” the odds favor a continuation higher, probably to the next target situated at 19.22 (March 2023 high).
USD/MXN Daily Chart
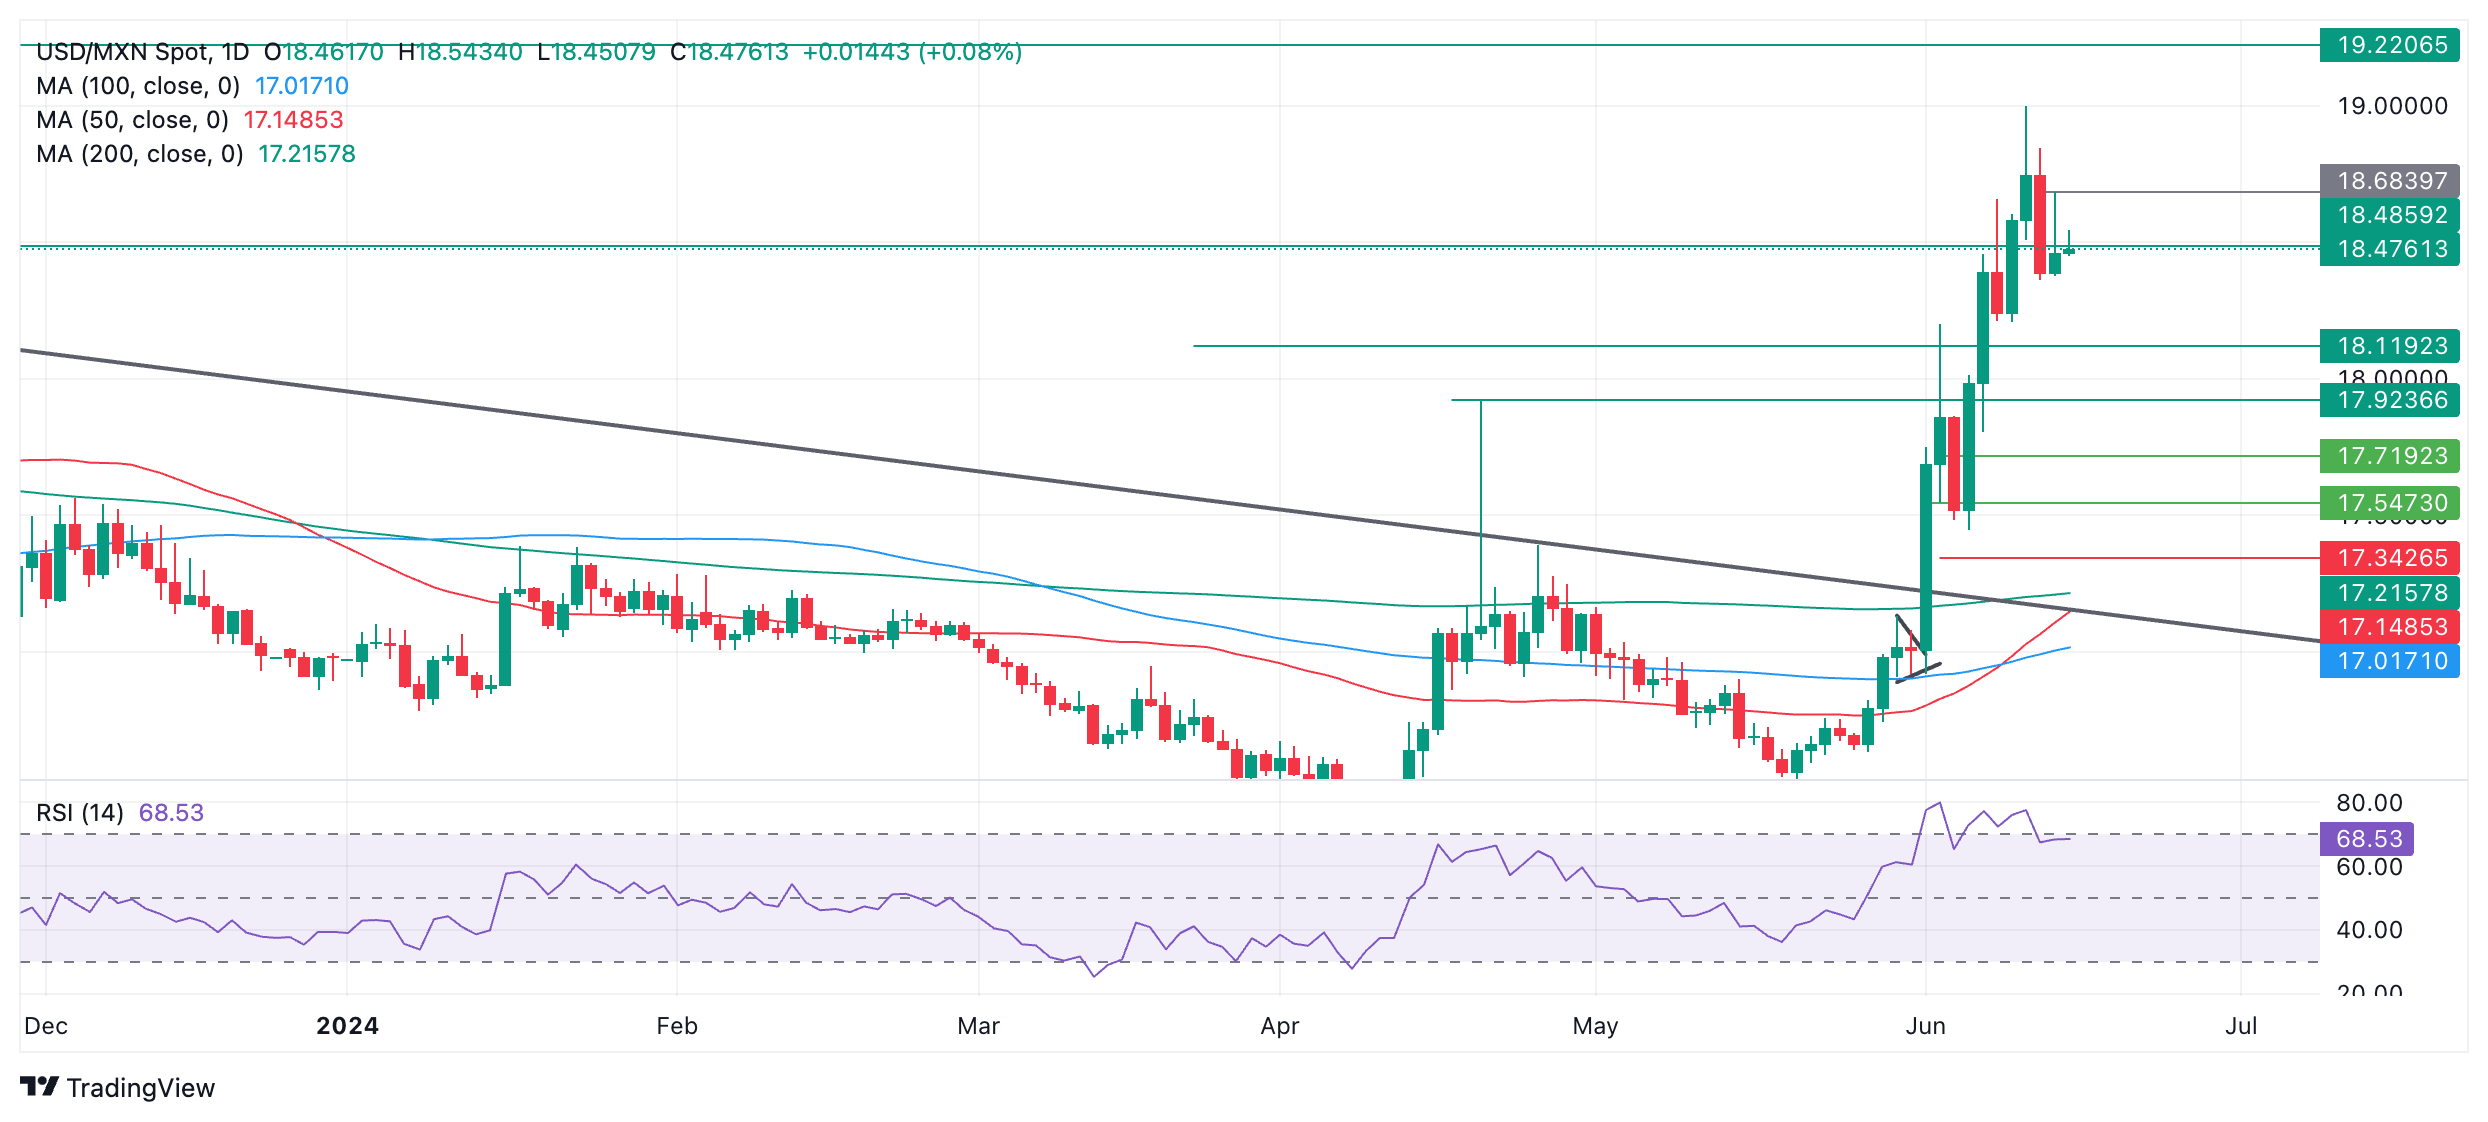
A break above Friday’s high at 18.68 would provide additional confirmation of more upside towards the target at 19.22.
The Relative Strength Index (RSI) has just exited the overbought zone, which is a signal for traders to close their longs. This suggests a risk the correction could still go deeper. That said, the established uptrend is likely to resume eventually.
The direction of the long-term trend is in doubt after the break above the October 2023 high. Previous to that, it was down.
Mexican Peso FAQs
The Mexican Peso (MXN) is the most traded currency among its Latin American peers. Its value is broadly determined by the performance of the Mexican economy, the country’s central bank’s policy, the amount of foreign investment in the country and even the levels of remittances sent by Mexicans who live abroad, particularly in the United States. Geopolitical trends can also move MXN: for example, the process of nearshoring – or the decision by some firms to relocate manufacturing capacity and supply chains closer to their home countries – is also seen as a catalyst for the Mexican currency as the country is considered a key manufacturing hub in the American continent. Another catalyst for MXN is Oil prices as Mexico is a key exporter of the commodity.
The main objective of Mexico’s central bank, also known as Banxico, is to maintain inflation at low and stable levels (at or close to its target of 3%, the midpoint in a tolerance band of between 2% and 4%). To this end, the bank sets an appropriate level of interest rates. When inflation is too high, Banxico will attempt to tame it by raising interest rates, making it more expensive for households and businesses to borrow money, thus cooling demand and the overall economy. Higher interest rates are generally positive for the Mexican Peso (MXN) as they lead to higher yields, making the country a more attractive place for investors. On the contrary, lower interest rates tend to weaken MXN.
Macroeconomic data releases are key to assess the state of the economy and can have an impact on the Mexican Peso (MXN) valuation. A strong Mexican economy, based on high economic growth, low unemployment and high confidence is good for MXN. Not only does it attract more foreign investment but it may encourage the Bank of Mexico (Banxico) to increase interest rates, particularly if this strength comes together with elevated inflation. However, if economic data is weak, MXN is likely to depreciate.
As an emerging-market currency, the Mexican Peso (MXN) tends to strive during risk-on periods, or when investors perceive that broader market risks are low and thus are eager to engage with investments that carry a higher risk. Conversely, MXN tends to weaken at times of market turbulence or economic uncertainty as investors tend to sell higher-risk assets and flee to the more-stable safe havens.
Gold prices fell in India on Monday, according to data compiled by FXStreet.
The price for Gold stood at 6,228.65 Indian Rupees (INR) per gram, down compared with the INR 6,265.07 it cost on Friday.
The price for Gold decreased to INR 72,649.75 per tola from INR 73,074.51 per tola a day earlier.
| Unit measure | Gold Price in INR |
|---|---|
| 1 Gram | 6,228.65 |
| 10 Grams | 62,286.50 |
| Tola | 72,649.75 |
| Troy Ounce | 193,733.60 |
FXStreet calculates Gold prices in India by adapting international prices (USD/INR) to the local currency and measurement units. Prices are updated daily based on the market rates taken at the time of publication. Prices are just for reference and local rates could diverge slightly.
Global Market Movers: Comex Gold price stays defensive amid Fed rate jitters
- The Federal Reserve adopted a more hawkish stance at the end of the June policy meeting, which continues to act as a tailwind for the US Dollar and is seen undermining the non-yielding Comex Gold price.
- That said, weaker US consumer and producer prices data released last week indicated that inflation is subsiding, which keeps hopes alive for two Fed rate cuts in 2024, in September and in December.
- Adding to this, the Labor Department reported on Friday that US import prices unexpectedly declined for the first time in five months in May, providing another boost to the domestic inflation outlook.
- Furthermore, the University of Michigan survey showed that consumer sentiment touched its lowest level in seven months in June and the index fell to 65.6 from 69.1 in May, missing consensus estimates.
- Cleveland Federal President Loretta Mester said on Friday that we are starting to see inflation move down again after stalling and that it is important not to wait too long to start cutting interest rates.
- Mester, in an interview with CNBC, added that she would like to see a longer run of good-looking inflation data and that the path towards the Fed's 2.0% inflation goal may take longer than expected.
- Chicago Fed President Austan Goolsbee noted that he still wants to see further progress on inflation and that if inflation behaves as it did in the first quarter, we will have a hard time cutting rates.
- Minneapolis Fed President Neel Kashkari said on Sunday that we need to see more evidence to convince inflation is heading to 2% and that the central bank will wait until December to cut rates.
- This raises doubts about the Fed's rate-cut path, which might cap any meaningful appreciating move for the buck and lend some support to the XAU/USD amid geopolitical risks and political uncertainty.
Gold FAQs
Gold has played a key role in human’s history as it has been widely used as a store of value and medium of exchange. Currently, apart from its shine and usage for jewelry, the precious metal is widely seen as a safe-haven asset, meaning that it is considered a good investment during turbulent times. Gold is also widely seen as a hedge against inflation and against depreciating currencies as it doesn’t rely on any specific issuer or government.
Central banks are the biggest Gold holders. In their aim to support their currencies in turbulent times, central banks tend to diversify their reserves and buy Gold to improve the perceived strength of the economy and the currency. High Gold reserves can be a source of trust for a country’s solvency. Central banks added 1,136 tonnes of Gold worth around $70 billion to their reserves in 2022, according to data from the World Gold Council. This is the highest yearly purchase since records began. Central banks from emerging economies such as China, India and Turkey are quickly increasing their Gold reserves.
Gold has an inverse correlation with the US Dollar and US Treasuries, which are both major reserve and safe-haven assets. When the Dollar depreciates, Gold tends to rise, enabling investors and central banks to diversify their assets in turbulent times. Gold is also inversely correlated with risk assets. A rally in the stock market tends to weaken Gold price, while sell-offs in riskier markets tend to favor the precious metal.
The price can move due to a wide range of factors. Geopolitical instability or fears of a deep recession can quickly make Gold price escalate due to its safe-haven status. As a yield-less asset, Gold tends to rise with lower interest rates, while higher cost of money usually weighs down on the yellow metal. Still, most moves depend on how the US Dollar (USD) behaves as the asset is priced in dollars (XAU/USD). A strong Dollar tends to keep the price of Gold controlled, whereas a weaker Dollar is likely to push Gold prices up.
(An automation tool was used in creating this post.)
In its March economic forecasts, Switzerland’s State Secretariat for Economic Affairs (SECO) said that the “Swiss government sees the economic growth in 2024 to come in well below average.”
Additional takeaways
Swiss government sees 2024 GDP (sport event adj) growth at +1.2% (previous forecast was +1.1%).
Swiss government sees 2025 GDP (sport event adj) growth at +1.7% (previous forecast was +1.7%).
Swiss government sees 2024 CPI at +1.4% (previous forecast was +1.5%).
Swiss government sees 2025 CPI at +1.1% (previous forecast was +1.1%).
Market reaction
At the time of writing, USD/CHF is up 0.09% on the day, trading at around 0.8910.
Swiss economy FAQs
Switzerland is the ninth-largest economy measured by nominal Gross Domestic Product (GDP) in the European continent. Measured by GDP per capita – a broad measure of average living standards –, the country ranks among the highest in the world, meaning that it is one the richest countries globally. Switzerland tends to be in the top spots in global rankings about living standards, development indexes, competitiveness or innovation.
Switzerland is an open, free-market economy mainly based on the services sector. The Swiss economy has a strong export sector, and the neighboring European Union (EU) is its main trading partner. Switzerland is a leading exporter of watches and clocks, and hosts leading firms in the food, chemicals and pharmaceutical industries. The country is considered to be an international tax haven, with significantly low corporate and income tax rates compared with its European neighbors.
As a high-income country, the growth rate of the Swiss economy has diminished over the last decades. Still, its political and economic stability, its high education levels, top-tier firms in several industries and its tax-haven status have made it a preferred destination for foreign investment. This has generally benefited the Swiss Franc (CHF), which has historically kept relatively strong against its main currency peers. Generally, a good performance of the Swiss economy – based on high growth, low unemployment and stable prices – tends to appreciate CHF. Conversely, if economic data points to weakening momentum, CHF is likely to depreciate.
Switzerland isn’t a commodity exporter, so in general commodity prices aren’t a key driver of the Swiss Franc (CHF). However, there is a slight correlation with both Gold and Oil prices. With Gold, CHF’s status as a safe-haven and the fact that the currency used to be backed by the precious metal means that both assets tend to move in the same direction. With Oil, a paper released by the Swiss National Bank (SNB) suggests that the rise in Oil prices could negatively influence CHF valuation, as Switzerland is a net importer of fuel.
Here is what you need to know on Monday, June 17:
The US Dollar (USD) stays resilient against its major rivals at the beginning of the week, with the US Dollar Index clinging to modest gains above 105.50 after closing the previous week in positive territory. In the absence of high-tier macroeconomic data releases, investors will pay close attention to comments from central bankers.
After struggling to find demand on soft US inflation data in the middle of the previous week, the USD benefited from the Federal Reserve's hawkish tone and the risk-averse market atmosphere. Early Monday, US stock index futures trade virtually unchanged on the day and the benchmark 10-year US Treasury bond yield holds steady above 4.2%.
US Dollar PRICE Last 7 days
The table below shows the percentage change of US Dollar (USD) against listed major currencies last 7 days. US Dollar was the strongest against the Euro.
| USD | EUR | GBP | JPY | CAD | AUD | NZD | CHF | |
|---|---|---|---|---|---|---|---|---|
| USD | 0.97% | 0.40% | 0.35% | -0.13% | -0.23% | -0.11% | -0.75% | |
| EUR | -0.97% | -0.22% | -0.37% | -0.84% | -0.92% | -0.82% | -1.45% | |
| GBP | -0.40% | 0.22% | -0.02% | -0.61% | -0.70% | -0.60% | -1.24% | |
| JPY | -0.35% | 0.37% | 0.02% | -0.46% | -0.63% | -0.54% | -1.02% | |
| CAD | 0.13% | 0.84% | 0.61% | 0.46% | -0.06% | 0.02% | -0.63% | |
| AUD | 0.23% | 0.92% | 0.70% | 0.63% | 0.06% | 0.10% | -0.54% | |
| NZD | 0.11% | 0.82% | 0.60% | 0.54% | -0.02% | -0.10% | -0.65% | |
| CHF | 0.75% | 1.45% | 1.24% | 1.02% | 0.63% | 0.54% | 0.65% |
The heat map shows percentage changes of major currencies against each other. The base currency is picked from the left column, while the quote currency is picked from the top row. For example, if you pick the US Dollar from the left column and move along the horizontal line to the Japanese Yen, the percentage change displayed in the box will represent USD (base)/JPY (quote).
During the Asian trading hours, the data from China showed that Retail Sales expanded 3.7% on a yearly basis in May. This reading followed the 2.3% increase recorded in April and came in better than the market expectation for an increase of 3%. On a negative note, Industrial Production grew 5.6% in the same period, falling short of analysts' estimate for an increase of 6%. The Shanghai Composite Index is down more than 0.5% after the mixed Chinese data, while Hong Kong's Hang Seng Index stays flat on the day.
ANZ Job Advertisements in Australia declined 2.1% on a monthly basis in May. After closing the last two trading days of the previous week in negative territory, AUD/USD continues to edge lower in the early European session on Monday and was last seen trading near 0.6600. The Reserve Bank of Australia (RBA) will announce monetary policy decisions in the early Asian session on Tuesday.
Australian Dollar remains on the defensive near 0.6600 as Fed pencils one rate cut this year.
EUR/USD lost nearly 1% in the previous week, pressured by the broad-based USD strength. The pair struggles to stage a rebound in the early European session and trades at around 1.0700.
GBP/USD stays under modest bearish pressure and trades below 1.2700 after closing the second straight week in the red. The UK's Office for National Statistics will release inflation data on Wednesday before the Bank of England announces monetary policy decisions on Thursday.
USD/JPY reached its highest level since late April above 158.00 on Friday as the Japanese Yen struggled to find demand following the Bank of Japan's decisions to hold policy settings unchanged. After staging a downward correction heading into the weekend, the pair seems to have stabilized at around 157.50 to begin the new week.
Gold gathered bullish momentum and gained more than 1% on a daily basis on Friday, ending the week in positive territory and snapping a three-week losing streak. XAU/USD, however, lost its traction in the Asian trading hours and retreated below $2,320 on Monday, where it was down more than 0.5% on the day.
Central banks FAQs
Central Banks have a key mandate which is making sure that there is price stability in a country or region. Economies are constantly facing inflation or deflation when prices for certain goods and services are fluctuating. Constant rising prices for the same goods means inflation, constant lowered prices for the same goods means deflation. It is the task of the central bank to keep the demand in line by tweaking its policy rate. For the biggest central banks like the US Federal Reserve (Fed), the European Central Bank (ECB) or the Bank of England (BoE), the mandate is to keep inflation close to 2%.
A central bank has one important tool at its disposal to get inflation higher or lower, and that is by tweaking its benchmark policy rate, commonly known as interest rate. On pre-communicated moments, the central bank will issue a statement with its policy rate and provide additional reasoning on why it is either remaining or changing (cutting or hiking) it. Local banks will adjust their savings and lending rates accordingly, which in turn will make it either harder or easier for people to earn on their savings or for companies to take out loans and make investments in their businesses. When the central bank hikes interest rates substantially, this is called monetary tightening. When it is cutting its benchmark rate, it is called monetary easing.
A central bank is often politically independent. Members of the central bank policy board are passing through a series of panels and hearings before being appointed to a policy board seat. Each member in that board often has a certain conviction on how the central bank should control inflation and the subsequent monetary policy. Members that want a very loose monetary policy, with low rates and cheap lending, to boost the economy substantially while being content to see inflation slightly above 2%, are called ‘doves’. Members that rather want to see higher rates to reward savings and want to keep a lit on inflation at all time are called ‘hawks’ and will not rest until inflation is at or just below 2%.
Normally, there is a chairman or president who leads each meeting, needs to create a consensus between the hawks or doves and has his or her final say when it would come down to a vote split to avoid a 50-50 tie on whether the current policy should be adjusted. The chairman will deliver speeches which often can be followed live, where the current monetary stance and outlook is being communicated. A central bank will try to push forward its monetary policy without triggering violent swings in rates, equities, or its currency. All members of the central bank will channel their stance toward the markets in advance of a policy meeting event. A few days before a policy meeting takes place until the new policy has been communicated, members are forbidden to talk publicly. This is called the blackout period.
FX option expiries for June 17 NY cut at 10:00 Eastern Time, via DTCC, can be found below
- EUR/USD: EUR amounts
- 1.0670 1.6b
- 1.0685 881m
- 1.0750 1.1b
- 1.0805 1.3b
- USD/JPY: USD amounts
- 157.00 515m
- 157.50 771m
- 158.00 833m
- USD/CHF: USD amounts
- 0.8970 482m
- 0.9000 400m
- AUD/USD: AUD amounts
- 0.6600 939m
- 0.6615 848m
- USD/CAD: USD amounts
- 1.3650 728m
- 1.3700 520m
- 1.3765 810m
- 1.3780 790m
- EUR/GBP: EUR amounts
- 0.8450 459m
- EUR/USD trades around 1.0700, and remains on the backfoot amid French elections uncertainty.
- Investors worry the French economy will face a financial crisis if the far right forms a new government.
- The US Dollar will dance to the tunes of the US Retail Sales data.
EUR/USD trades in a tight range near the crucial support of 1.0700 in Monday’s early European session. The major currency pair has been under pressure as potential risks of the financial crisis in France amid firm speculation that Marine Le Pen's far-right National Rally (RN) will form a new government, which will have an adverse impact on the nation’s fiscal situation, that has dampened Euro’s appeal.
French Finance Minister Bruno Le Maire said on Friday that the euro zone's second-biggest economy was at risk of a financial crisis if either the far right or left won because of their heavy spending plans, Reuters reported.
On the monetary policy front, European Central Bank (ECB) policymakers have been reluctant to provide an interest rate-cut trajectory as they remain concerned over the stubborn wage growth outlook, which could revamp price pressures again.
On Sunday, ECB Governing Council member and Governor of the Bank of Latvia Martins Kazaks said that the bank must not allow inflation to remain above 2% into 2026. Kazaks added, “Currently, I think we are still on the path to 2% in the second half of 2025, and I really hope that we will do it by that time.”
Daily digest market movers: EUR/USD is stuck in tight range while more downside looks warranted
- EUR/USD trades sideways around 1.0700 after discovering interim support near 1.0660 as the US Dollar (USD) struggles to extend upside above a six-week high of 105.80. The US Dollar Index (DXY), which tracks the Greenback’s value against six major currencies, corrects modestly to near 105.50.
- The USD Index grinds between market speculation for two rate cuts by the Federal Reserve (Fed) this year due to resumed progress in the disinflation process and the Fed’s projection for only one rate cut amid fears of reacceleration in price pressures.
- According to the CME FedWatch tool, 30-day Federal Fund Futures pricing data has firm expectations to begin reducing interest rates from the September meeting and following suit again in the November or December meeting.
- After the Fed’s blackout period, policymakers advocate for only one rate cut this year, as they updated in the latest interest rate projections. On Friday, Chicago Fed Bank President Austan Goolsbee said that he was relieved after consumer and producer inflation data for May showed that price pressures were softer than expected. However, he wants to see similar data for months before lowering interest rates.
- Going forward, investors will pay close attention to the United States (US) monthly Retail Sales data for May, which will be published on Tuesday. The Retail Sales data, a close measure of consumer spending, is estimated to have increased by 0.3% after remaining flat in April.
Technical Analysis: EUR/USD to decline toward 1.0630
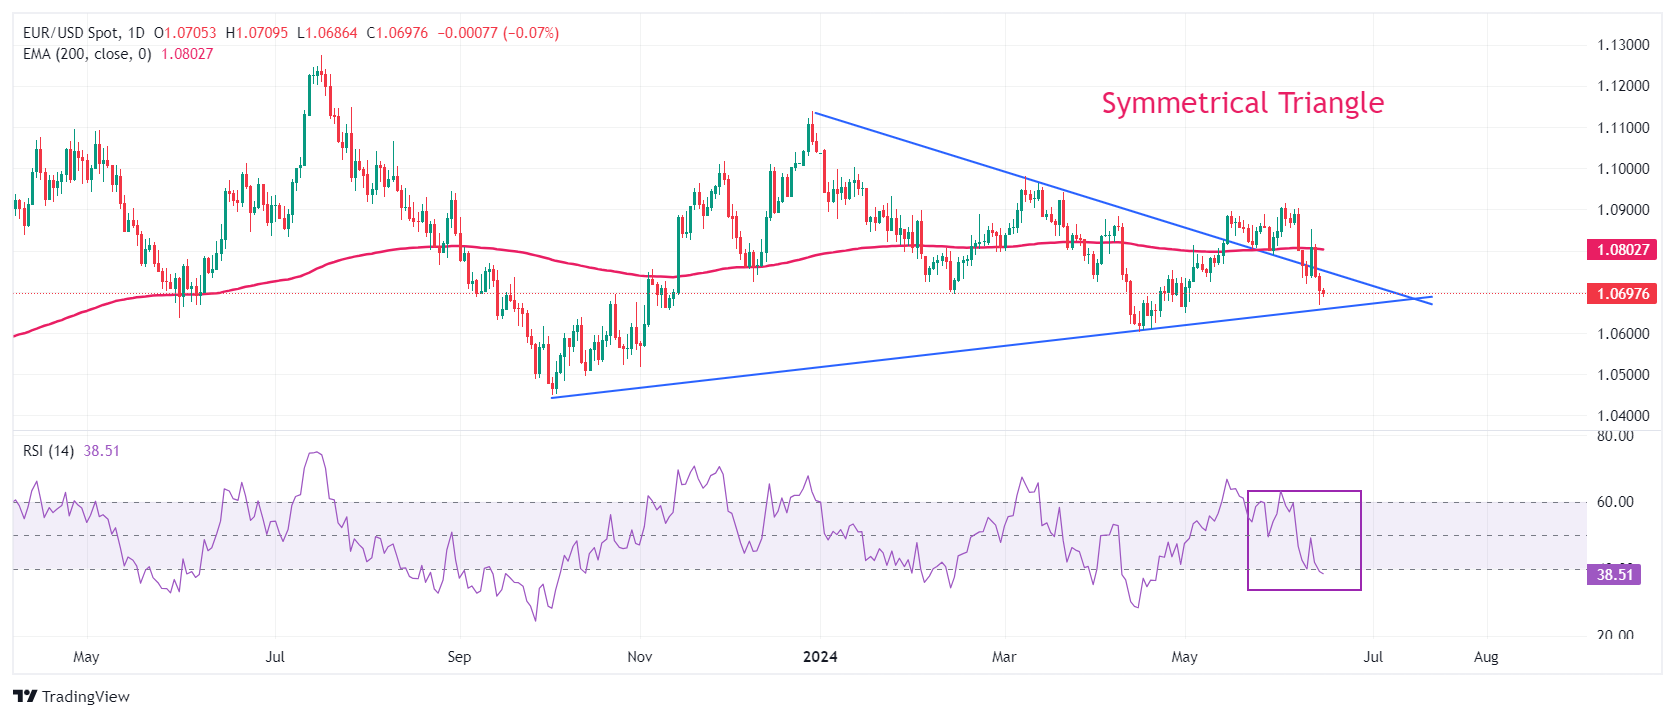
EUR/USD hovers around 1.0700 after returning into the Symmetrical Triangle formation on a daily timeframe. The major currency pair is expected to find support at 1.0636, near the upward-sloping trendline of the chart pattern plotted from the low from October 3, 2023, at 1.0448, and the horizontal cushion plotted from the April 16 low around 1.0600.
On the upside, the downward-sloping border from the high of December 28, 2023, at 1.1140 will be a major barrier for the Euro bulls near 1.0750.
The long-term outlook of the shared currency pair has also turned negative as prices dropped below the 200-day Exponential Moving Average (EMA), which trades around 1.0800.
The 14-period Relative Strength Index (RSI) falls below 40.00. Momentum could turn bearish if the RSI sustains below this level.
Euro FAQs
The Euro is the currency for the 20 European Union countries that belong to the Eurozone. It is the second most heavily traded currency in the world behind the US Dollar. In 2022, it accounted for 31% of all foreign exchange transactions, with an average daily turnover of over $2.2 trillion a day. EUR/USD is the most heavily traded currency pair in the world, accounting for an estimated 30% off all transactions, followed by EUR/JPY (4%), EUR/GBP (3%) and EUR/AUD (2%).
The European Central Bank (ECB) in Frankfurt, Germany, is the reserve bank for the Eurozone. The ECB sets interest rates and manages monetary policy. The ECB’s primary mandate is to maintain price stability, which means either controlling inflation or stimulating growth. Its primary tool is the raising or lowering of interest rates. Relatively high interest rates – or the expectation of higher rates – will usually benefit the Euro and vice versa. The ECB Governing Council makes monetary policy decisions at meetings held eight times a year. Decisions are made by heads of the Eurozone national banks and six permanent members, including the President of the ECB, Christine Lagarde.
Eurozone inflation data, measured by the Harmonized Index of Consumer Prices (HICP), is an important econometric for the Euro. If inflation rises more than expected, especially if above the ECB’s 2% target, it obliges the ECB to raise interest rates to bring it back under control. Relatively high interest rates compared to its counterparts will usually benefit the Euro, as it makes the region more attractive as a place for global investors to park their money.
Data releases gauge the health of the economy and can impact on the Euro. Indicators such as GDP, Manufacturing and Services PMIs, employment, and consumer sentiment surveys can all influence the direction of the single currency. A strong economy is good for the Euro. Not only does it attract more foreign investment but it may encourage the ECB to put up interest rates, which will directly strengthen the Euro. Otherwise, if economic data is weak, the Euro is likely to fall. Economic data for the four largest economies in the euro area (Germany, France, Italy and Spain) are especially significant, as they account for 75% of the Eurozone’s economy.
Another significant data release for the Euro is the Trade Balance. This indicator measures the difference between what a country earns from its exports and what it spends on imports over a given period. If a country produces highly sought after exports then its currency will gain in value purely from the extra demand created from foreign buyers seeking to purchase these goods. Therefore, a positive net Trade Balance strengthens a currency and vice versa for a negative balance.
- Silver price falls after a less-confident pullback move as US bond yields recover.
- US yields recover as Fed advocates only one rate-cut this year.
- Investors await the US Retail Sales data for fresh cues on interest rates.
Silver price (XAG/USD) falls back to the crucial support of $29.00 in Monday’s European session after a short-lived pullback to near $29.60. The white metal comes under pressure as US bond yields rebound. 10-year US Treasury yields recover to near 4.24% as Federal Reserve (Fed) officials continue to argue in favor of reducing interest rates only one this year.
Higher yields on interest-bearing assets increase the opportunity cost of holding an investment in non-yielding assets, such as Silver.
On Friday, Chicago Fed Bank President Austan Goolsbee said that cooler consumer and producer inflation reports for May have relieved him. However, he wants to see similar data for months before lowering interest rates.
This weekend, Minneapolis Fed Bank President Neel Kashkari said it’s a "reasonable prediction" that the central bank will cut interest rates once this year and wait until December to do so.
Contrary to Fed officials’ verdict, investors expect that the Fed will deliver two rate cuts this year one in September and next in November or December’s meeting.
Meanwhile, the US Dollar Index (DXY) holds gains near a six-week high around 105.80. Going forward, investors will focus on the United States (US) monthly Retail Sales data for May, which will be published on Tuesday. The Retail Sales data is estimated to have grown by 0.3% after remaining flat in April.
Silver technical analysis
Silver price trades in a Falling Channel chart pattern in which each pullback is considered a selling opportunity by market participants. The asset struggles to hold above the 200-period Exponential Moving Average (EMA), which trades around $29.40, indicating uncertainty in the overall trend.
The 14-period Relative Strength Index (RSI) oscillates in the 40.00-60.00 range, suggesting a consolidating ahead.
Silver four-hour chart
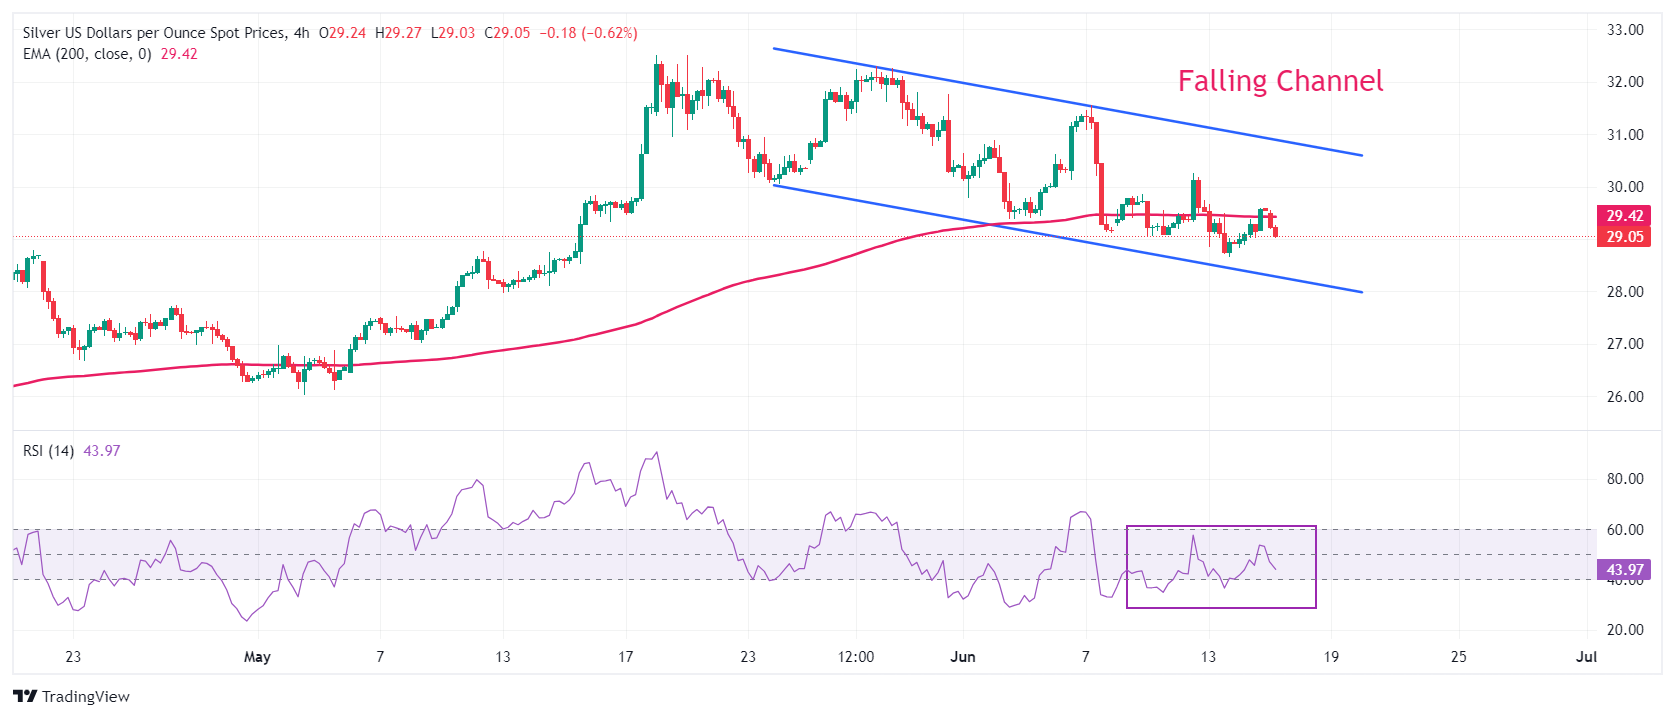
- USD/CHF trades on a stronger note near 0.8910 in Monday’s early European session.
- Fed’s Kashkari said that it is reasonable that the central bank will wait for more data until December to cut rates.
- The SNB is expected to keep its interest rate on hold at 1.5% as Switzerland’s inflation remains elevated.
The USD/CHF pair snaps the three-day losing streak around 0.8910 during the early European session on Monday. The firmer US Dollar (USD) in the wake of the Federal Reserve's (Fed) hawkish stance, with the projection for only one rate cut in 2024, provides some support to the pair. Switzerland’s SECO Economic Forecasts are due later on Monday. On Thursday, the Swiss National Bank (SNB) interest rate decision will be closely watched.
The Fed officials forecast only one quarter-point rate cut by the end of this year, down from a total of three quarter-point cuts earlier this year. Fed Chair Jerome Powell said last week that inflation might end the year higher than initially predicted, prompting the expectation that the Fed might hold rates higher for longer to curb inflation. Powell added that the US central bank does not yet have the confidence to cut rates and he needs more convincing evidence that inflation is moving towards the goals.
Minneapolis Fed President Neel Kashkari said on Sunday that it is a “reasonable prediction” that the Fed will wait for more data until December to cut interest rates. Cleveland Fed President Loretta Mester noted on Friday that the path towards the Fed's 2.0% inflation target may take longer than previously expected.
About the data, the preliminary University of Michigan's Consumer Sentiment Index came in worse than estimated, dropping to 65.6 in June from 69.1 in the final reading in May, below the market consensus of 72. The UoM one-year Consumer Inflation Expectation held steady at 3.3%, while the five-year inflation outlook increased to 3.1% from 3.0%. However, these reports have little to no impact on the Greenback.
On the Swiss front, the Swiss central bank is anticipated to keep its interest rate on hold at 1.5% at its June meeting on Thursday as inflation in Switzerland hit the highest since December 2023. Apart from this, the ongoing geopolitical tensions in the Middle East and the political uncertainty in the Eurozone, particularly in France, might boost the safe-haven flows and benefit the Swiss Franc (CHF) against the USD. After losing to the right-wing National Rally in the European vote, France's President Emmanuel Macron called for early parliamentary elections. Macron stated on Sunday that Economic programs by two extremist blocks in the parliament election are not realistic, and France is at a very serious moment with major economic issues at stake.
- WTI price edges lower to $77.75 on Monday.
- The weaker US Consumer Sentiment and Chinese economic output data weigh on the black gold.
- China’s Industrial Production came in weaker than expected in May, adding pressure on the world’s top largest oil consumers.
West Texas Intermediate (WTI), the US crude oil benchmark, is trading around $77.75 on Monday. The downtick of the black gold is backed by weaker US consumer demand and the downbeat Chinese Industrial Production data.
Consumer sentiment dropped to a seven-month low in June, according to the preliminary report from the Michigan Consumer Sentiment Index released Friday. The Consumer Sentiment Index fell to 65.6 in June from May's final reading of 69.1. The number was lower than expected at 72.0. In response to the data, the WTI price has edged lower amid worries about their personal finances and inflation.
Furthermore, the hawkish messages from the Federal Reserve (Fed) lift the US Dollar (USD) and weigh on the USD-denominated WTI. On Sunday, Minneapolis Fed President Neel Kashkari said that it is a “reasonable prediction” that the Fed will wait for more data until December to cut interest rates. Kashkari further stated that the Fed is in a very good position to get more economic and inflation data before making any decisions.
Last week, Fed Chair Jerome Powell said during the Fed policy press conference that the central bank does not yet have the confidence to cut rates and he needs more convincing evidence that inflation was moving to the 2% target. The higher-for-longer US interest rate narrative continues to exert some selling pressure on black gold as it increases the cost of borrowing, which can dampen economic activity and oil demand.
The Chinese Industrial Production for May missed expectations, and a slowdown in the property sector showed no signs of improvement, adding pressure on the world's second-largest economy. Early Monday, China’s Retail Sales rose 3.7% YoY in May from 2.3% in April, which is better than the consensus of 3.0%. Meanwhile, Industrial Production increased 5.6% YoY in the same period, compared to 6.7% in the previous reading, weaker than the forecast of 6.0%, according to the National Bureau of Statistics (NBS).
- USD/CAD regains positive traction on Monday amid a modest downtick in Oil prices.
- The Fed’s hawkish outlook continues to underpin the USD and further lend support.
- The fundamental backdrop warrants caution before positioning for additional gains.
The USD/CAD pair attracts some dip-buying on the first day of a new week, albeit lacks follow-through and remains confined in a familiar range held over the past week or so. Spot prices currently trade just below mid-1.3700s, up less than 0.10% for the day amid a combination of diverging forces.
Crude Oil prices declined on Monday and eroded a part of last week's strong gains amid concerns about a weaker US consumer demand, which is seen undermining the commodity-linked Loonie. The US Dollar (USD), on the other hand, holds steady near its highest level since early May touched on Friday in the wake of the Federal Reserve's (Fed) hawkish surprise, forecasting only one rate cut in 2024. This is seen as another factor acting as a tailwind for the USD/CAD pair.
Meanwhile, weaker-than-expected US consumer and producer prices data released last week suggests that inflation is subsiding. Moreover, an unexpected fall in the US import prices further boosted the domestic inflation outlook. This, along with a sharp deterioration in the US consumer sentiment in June, keeps the first Fed rate cut move in September on the table. This holds back the USD bulls from placing aggressive bets and might cap the upside for the USD/CAD pair.
Hence, it will be prudent to wait for strong follow-through buying before positioning for a further near-term appreciating move for the currency pair. Traders now look forward to Monday's economic docket, featuring the release of Canadian Housing Starts data and the Empire State Manufacturing Index from the US later during the North American session. This, along with Oil price dynamics, should assist traders to grab short-term opportunities around the USD/CAD pair.
- The Australian Dollar weakens amid the firmer US Dollar in Monday’s Asian session.
- The hawkish tone of the Fed and challenges in China’s economic recovery weigh on AUD/USD.
- The RBA interest rate decision on Tuesday will be in the spotlight, with no change in rate expected.
The Australian Dollar (AUD) extends downside for the third consecutive day on Monday on the back of the stronger US Dollar (USD) broadly. The Greenback remains well-supported by the expectation that US interest rates will stay higher for longer, with the median projection from Federal Reserve (Fed) officials calling for one interest rate cut this year.
Furthermore, the latest mixed Chinese economic data and some challenges in China's economic operations might exert some selling pressure on the Aussie as China accounts for one-third of Australian exports. Investors will closely watch the Reserve Bank of Australia (RBA) interest rate decision on Tuesday, along with the Governor Michele Bullock press conference. The hawkish hold from the RBA could boost the AUD and cap the downside for AUD/USD in the near term. On the US docket, the Retail Sales for May will be released, which is expected to improve to 0.3% from 0% in April.
Daily Digest Market Movers: Australian Dollar attracts some sellers ahead of RBA policy meeting
- The Reserve Bank of Australia (RBA) will likely keep the cash rate at 4.35% for a fifth straight meeting as it tries to restrain consumer prices that have been underpinned by an ultra-tight employment market, economists surveyed by Bloomberg forecast.
- China’s Retail Sales improved 3.7% YoY in May from 2.3% in April, which is better than the estimate of 3.0%. Meanwhile, the nation’s Industrial Production rose 5.6% YoY in the same period, compared to the previous reading of 6.7%, below the consensus of 6.0%, the National Bureau of Statistics (NBS) showed Monday.
- The preliminary University of Michigan's Consumer Sentiment Index declined to 65.6 in June from 69.1, below the market consensus of 72.
- The UoM one-year Consumer Inflation Expectation held steady at 3.3%, while the five-year inflation outlook rose to 3.1% from 3%.
- Minneapolis Fed President Neel Kashkari said on Sunday that it is a “reasonable prediction” that the central bank will wait until December to cut interest rates. Kashkari added that the Fed is in a very good position to get more data before making any decisions.
- Cleveland Fed President Loretta Mester noted on Friday that she would like to see good-looking inflation data, adding that the path towards the Fed's 2.0% inflation goal may take longer than expected.
Technical Analysis: AUD/USD’s positive outlook remains fragile in the longer term
The Australian Dollar trades weaker on the day. The bullish outlook of the AUD/USD pair seems vulnerable as it hovers around the key 100-day Exponential Moving Average (EMA) on the daily chart. The pair could resume its downside journey if it crosses below the key EMA, as mentioned. Additionally, the 14-day Relative Strength Index (RSI) holds below the 50-midline, indicating that further downside cannot be ruled out for the time being.
The key support level for AUD/USD will emerge at the 0.6580-0.6585 region, portraying the confluence of the 100-day EMA and the lower limit of Bollinger Band. A decisive break below this level could see a drop to 0.6510, a low of March 22. The additional downside filter to watch is 0.6465, a low of May 1, and finally, the psychological level and a low of April 17 at 0.6400.
On the upside, the immediate resistance level is seen at 0.6688, the upper boundary of the Bollinger Band. Further north, the next upside target is located at 0.6715, a high of May 16. The next hurdle to watch is 0.6760, a high of January 4.
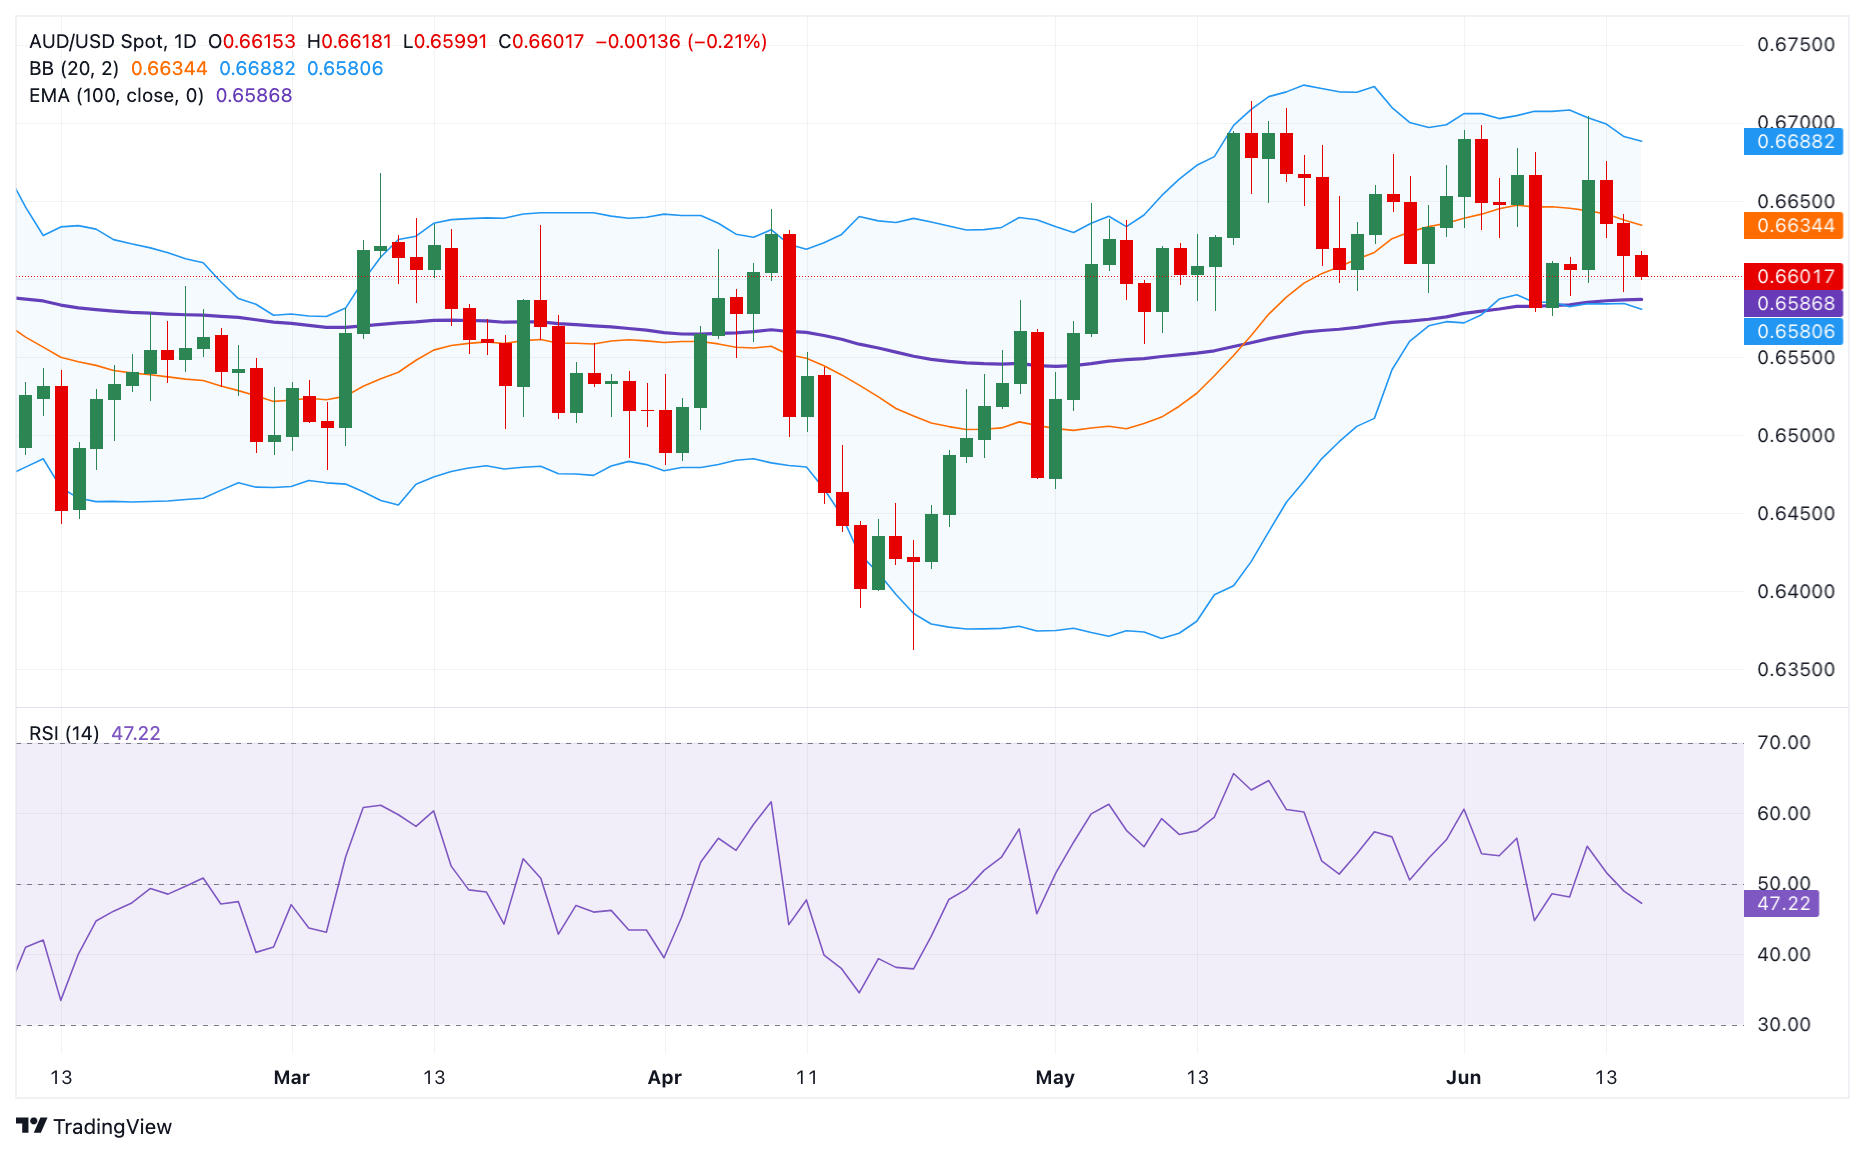
Australian Dollar price today
The table below shows the percentage change of Australian Dollar (AUD) against listed major currencies today. Australian Dollar was the weakest against the Japanese Yen.
| USD | EUR | GBP | CAD | AUD | JPY | NZD | CHF | |
| USD | -0.01% | 0.01% | 0.05% | 0.17% | -0.06% | 0.17% | -0.01% | |
| EUR | 0.01% | 0.02% | 0.06% | 0.19% | -0.03% | 0.17% | -0.01% | |
| GBP | -0.01% | 0.00% | 0.03% | 0.17% | -0.04% | 0.14% | -0.02% | |
| CAD | -0.05% | -0.06% | -0.05% | 0.14% | -0.08% | 0.11% | -0.06% | |
| AUD | -0.15% | -0.18% | -0.17% | -0.13% | -0.22% | -0.02% | -0.20% | |
| JPY | 0.04% | 0.03% | 0.03% | 0.11% | 0.21% | 0.22% | 0.01% | |
| NZD | -0.17% | -0.18% | -0.15% | -0.12% | 0.01% | -0.23% | -0.15% | |
| CHF | 0.01% | 0.02% | 0.02% | 0.06% | 0.19% | -0.01% | 0.17% |
The heat map shows percentage changes of major currencies against each other. The base currency is picked from the left column, while the quote currency is picked from the top row. For example, if you pick the Euro from the left column and move along the horizontal line to the Japanese Yen, the percentage change displayed in the box will represent EUR (base)/JPY (quote).
Australian Dollar FAQs
One of the most significant factors for the Australian Dollar (AUD) is the level of interest rates set by the Reserve Bank of Australia (RBA). Because Australia is a resource-rich country another key driver is the price of its biggest export, Iron Ore. The health of the Chinese economy, its largest trading partner, is a factor, as well as inflation in Australia, its growth rate and Trade Balance. Market sentiment – whether investors are taking on more risky assets (risk-on) or seeking safe-havens (risk-off) – is also a factor, with risk-on positive for AUD.
The Reserve Bank of Australia (RBA) influences the Australian Dollar (AUD) by setting the level of interest rates that Australian banks can lend to each other. This influences the level of interest rates in the economy as a whole. The main goal of the RBA is to maintain a stable inflation rate of 2-3% by adjusting interest rates up or down. Relatively high interest rates compared to other major central banks support the AUD, and the opposite for relatively low. The RBA can also use quantitative easing and tightening to influence credit conditions, with the former AUD-negative and the latter AUD-positive.
China is Australia’s largest trading partner so the health of the Chinese economy is a major influence on the value of the Australian Dollar (AUD). When the Chinese economy is doing well it purchases more raw materials, goods and services from Australia, lifting demand for the AUD, and pushing up its value. The opposite is the case when the Chinese economy is not growing as fast as expected. Positive or negative surprises in Chinese growth data, therefore, often have a direct impact on the Australian Dollar and its pairs.
Iron Ore is Australia’s largest export, accounting for $118 billion a year according to data from 2021, with China as its primary destination. The price of Iron Ore, therefore, can be a driver of the Australian Dollar. Generally, if the price of Iron Ore rises, AUD also goes up, as aggregate demand for the currency increases. The opposite is the case if the price of Iron Ore falls. Higher Iron Ore prices also tend to result in a greater likelihood of a positive Trade Balance for Australia, which is also positive of the AUD.
The Trade Balance, which is the difference between what a country earns from its exports versus what it pays for its imports, is another factor that can influence the value of the Australian Dollar. If Australia produces highly sought after exports, then its currency will gain in value purely from the surplus demand created from foreign buyers seeking to purchase its exports versus what it spends to purchase imports. Therefore, a positive net Trade Balance strengthens the AUD, with the opposite effect if the Trade Balance is negative.
- Gold price kicks off the new week on a weaker note amid the Fed’s hawkish outlook.
- Geopolitical risks and political uncertainty could lend support to the safe-haven metal.
- The recent repeated failures near the 50-day SMA support prospects for deeper losses.
Gold price (XAU/USD) struggles to capitalize on Friday's positive move and attracts fresh sellers on the first day of a new week. The commodity maintains its offered tone through the Asian session and currently trades below the $2,325 level, down around 0.40% for the day. The Federal Reserve's (Fed) hawkish surprise last week, forecasting only one interest rate cut in 2024, remains supportive of elevated US Treasury bond yields. This allows the US Dollar (USD) to stand tall near its highest level since early May touched on Friday and exerts some downward pressure on the non-yielding yellow metal.
That said, signs of easing inflationary pressures in the United States (US) keep the door open for at least two rate cuts this year, which, in turn, is holding back the USD bulls from placing aggressive bets. Apart from this, persistent geopolitical tensions in the Middle East, along with political uncertainty in Europe, could lend some support to the safe haven Gold price and help limit any further downside. This makes it prudent to wait for strong follow-through selling before positioning for the resumption of the previous metal's recent pullback from the all-time peak, around the $2,350 region touched in May.
Daily Digest Market Movers: Gold price is pressured by the hawkish Fed-inspired USD strength
- The Federal Reserve adopted a more hawkish stance at the end of the June policy meeting, which continues to act as a tailwind for the US Dollar and is seen undermining the non-yielding Gold price.
- That said, weaker US consumer and producer prices data released last week indicated that inflation is subsiding, which keeps hopes alive for two Fed rate cuts in 2024, in September and in December.
- Adding to this, the Labor Department reported on Friday that US import prices unexpectedly declined for the first time in five months in May, providing another boost to the domestic inflation outlook.
- Furthermore, the University of Michigan survey showed that consumer sentiment touched its lowest level in seven months in June and the index fell to 65.6 from 69.1 in May, missing consensus estimates.
- Cleveland Federal President Loretta Mester said on Friday that we are starting to see inflation move down again after stalling and that it is important not to wait too long to start cutting interest rates.
- Mester, in an interview with CNBC, added that she would like to see a longer run of good-looking inflation data and that the path towards the Fed's 2.0% inflation goal may take longer than expected.
- Chicago Fed President Austan Goolsbee noted that he still wants to see further progress on inflation and that if inflation behaves as it did in the first quarter, we will have a hard time cutting rates.
- Minneapolis Fed President Neel Kashkari said on Sunday that we need to see more evidence to convince inflation is heading to 2% and that the central bank will wait until December to cut rates.
- This raises doubts about the Fed's rate-cut path, which might cap any meaningful appreciating move for the buck and lend some support to the XAU/USD amid geopolitical risks and political uncertainty.
Technical Analysis: Gold price seems vulnerable while below 50-day SMA support breakpoint
From a technical perspective, traders need to wait for a sustained break and acceptance below the $2,300 mark before placing fresh bearish bets around the Gold price. Hence, it will be prudent to wait for some follow-through selling below the $2,285 horizontal support before positioning for any further losses. The commodity might then accelerate the fall towards the next relevant support near the $2,254-2,253 region. The downward trajectory could extend further towards the $2,225-2,220 area en route to the $2,200 round figure.
On the flip side, the 50-day Simple Moving Average (SMA) support breakpoint, currently pegged near the $2,344-2,345 region, is likely to act as an immediate strong barrier. This is followed by the $2,360-2,362 supply zone, which if cleared decisively might prompt some short-covering rally and lift the Gold price to the $2,387-2,388 intermediate hurdle en route to the $2,400 mark. A sustained strength beyond the latter will negate any near-term negative bias and allow the XAU/USD to challenge the all-time peak, around the $2,450 region touched in May.
Gold FAQs
Gold has played a key role in human’s history as it has been widely used as a store of value and medium of exchange. Currently, apart from its shine and usage for jewelry, the precious metal is widely seen as a safe-haven asset, meaning that it is considered a good investment during turbulent times. Gold is also widely seen as a hedge against inflation and against depreciating currencies as it doesn’t rely on any specific issuer or government.
Central banks are the biggest Gold holders. In their aim to support their currencies in turbulent times, central banks tend to diversify their reserves and buy Gold to improve the perceived strength of the economy and the currency. High Gold reserves can be a source of trust for a country’s solvency. Central banks added 1,136 tonnes of Gold worth around $70 billion to their reserves in 2022, according to data from the World Gold Council. This is the highest yearly purchase since records began. Central banks from emerging economies such as China, India and Turkey are quickly increasing their Gold reserves.
Gold has an inverse correlation with the US Dollar and US Treasuries, which are both major reserve and safe-haven assets. When the Dollar depreciates, Gold tends to rise, enabling investors and central banks to diversify their assets in turbulent times. Gold is also inversely correlated with risk assets. A rally in the stock market tends to weaken Gold price, while sell-offs in riskier markets tend to favor the precious metal.
The price can move due to a wide range of factors. Geopolitical instability or fears of a deep recession can quickly make Gold price escalate due to its safe-haven status. As a yield-less asset, Gold tends to rise with lower interest rates, while higher cost of money usually weighs down on the yellow metal. Still, most moves depend on how the US Dollar (USD) behaves as the asset is priced in dollars (XAU/USD). A strong Dollar tends to keep the price of Gold controlled, whereas a weaker Dollar is likely to push Gold prices up.
| Raw materials | Closed | Change, % |
|---|---|---|
| Silver | 29.547 | 2.12 |
| Gold | 2332.47 | 1.24 |
| Palladium | 887.35 | -0.09 |
- NZD/USD remains under some selling pressure for the third straight day on Monday.
- The mixed Chinese data does little to impress bulls or provide any impetus to the Kiwi.
- The Fed’s hawkish outlook acts as a tailwind for the USD and exerts downward pressure.
The NZD/USD pair opens with a modest bearish gap on the first day of a new week, albeit managing to hold its neck above the 0.6100 mark through the Asian session. Spot prices remain depressed near the 0.6130-0.6125 region and move little following the release of mixed Chinese macroeconomic data.
The National Bureau of Statistics reported this Monday that China's Retail Sales grew by 3.7% YoY in May as compared to consensus estimates for a reading of 3% and 2.3% in the previous month. The upbeat print, however, was largely offset by a smaller-than-expected increase in Fixed Asset Investment and Industrial Production, which rose by 4.0% and 5.6% yearly rate, respectively. The data fails to provide any meaningful impetus to antipodean currencies, including the New Zealand Dollar (NZD), though a modest US Dollar (USD) strength continues to exert pressure on the NZD/USD pair.
The USD Index (DXY), which tracks the Greenback against a basket of currencies, stands tall near its highest level since early May touched on Friday in the wake of the Federal Reserve's (Fed) hawkish forecast of only one rate cut in 2024. The outlook remains supportive of elevated US Treasury bond yields and continues to act as a tailwind for the buck. This, along with persistent geopolitical tensions in the Middle East and political uncertainty in Europe, underpins the safe-haven USD and further contributes to the offered tone surrounding the NZD/USD pair for the third successive day on Monday.
Following the publication of the high-impact China’s activity data for May, the National Bureau of Statistics (NBS) expressed its outlook on the economy during its press conference on Monday.
Key quotes (via Reuters)
China's economic operations generally steady, some main indicators showed recovery in May.
Summer grains output is expected to see another bumper harvest.
Expect declines in PPI to narrow further.
Expect CPI to show mild rebound.
Market reaction
AUD/USD is battling 0.6600, down 0.16% on the day, at the press time.
Australian Dollar PRICE Today
The table below shows the percentage change of Australian Dollar (AUD) against listed major currencies today. Australian Dollar was the weakest against the US Dollar.
| USD | EUR | GBP | JPY | CAD | AUD | NZD | CHF | |
|---|---|---|---|---|---|---|---|---|
| USD | 0.04% | 0.03% | 0.08% | -0.03% | 0.18% | 0.07% | 0.02% | |
| EUR | -0.04% | 0.02% | 0.07% | -0.06% | 0.06% | 0.08% | -0.02% | |
| GBP | -0.03% | -0.02% | 0.12% | -0.07% | 0.02% | 0.02% | -0.01% | |
| JPY | -0.08% | -0.07% | -0.12% | 0.00% | 0.11% | 0.13% | 0.00% | |
| CAD | 0.03% | 0.06% | 0.07% | -0.01% | 0.15% | 0.09% | 0.06% | |
| AUD | -0.18% | -0.06% | -0.02% | -0.11% | -0.15% | 0.07% | -0.03% | |
| NZD | -0.07% | -0.08% | -0.02% | -0.13% | -0.09% | -0.07% | -0.03% | |
| CHF | -0.02% | 0.02% | 0.00% | -0.00% | -0.06% | 0.03% | 0.03% |
The heat map shows percentage changes of major currencies against each other. The base currency is picked from the left column, while the quote currency is picked from the top row. For example, if you pick the Australian Dollar from the left column and move along the horizontal line to the US Dollar, the percentage change displayed in the box will represent AUD (base)/USD (quote).
China’s May Retail Sales, rose 3.7% YoY vs. 3.0% expected and April’s 2.3% while the country’s Industrial Production increased 5.6% YoY in the same period vs. 6.0% forecast and 6.7% recorded previously. The National Bureau of Statistics (NBS) published the official data on Monday.
Meanwhile, the Fixed Asset Investment rose 4.0% YTD YoY in May, compared to the 4.2% figure anticipated and 4.2% in April.
Additional takeaways
China May nationwide survey-based jobless rate at 5.0%.
China May survey-based jobless rate in 31 major cities at 4.9%.
China Jan-May property investment -10.1% YoY.
China Jan-May new construction starts -24.2% YoY.
Market reaction to Chinese data
The mixed Chinese data dump keeps the downward pressure intact on the Australian Dollar, with AUD/USD refreshing intraday lows near 0.6600. The pair is down 0.17% on the day, as of writing.
Australian Dollar FAQs
One of the most significant factors for the Australian Dollar (AUD) is the level of interest rates set by the Reserve Bank of Australia (RBA). Because Australia is a resource-rich country another key driver is the price of its biggest export, Iron Ore. The health of the Chinese economy, its largest trading partner, is a factor, as well as inflation in Australia, its growth rate and Trade Balance. Market sentiment – whether investors are taking on more risky assets (risk-on) or seeking safe-havens (risk-off) – is also a factor, with risk-on positive for AUD.
The Reserve Bank of Australia (RBA) influences the Australian Dollar (AUD) by setting the level of interest rates that Australian banks can lend to each other. This influences the level of interest rates in the economy as a whole. The main goal of the RBA is to maintain a stable inflation rate of 2-3% by adjusting interest rates up or down. Relatively high interest rates compared to other major central banks support the AUD, and the opposite for relatively low. The RBA can also use quantitative easing and tightening to influence credit conditions, with the former AUD-negative and the latter AUD-positive.
China is Australia’s largest trading partner so the health of the Chinese economy is a major influence on the value of the Australian Dollar (AUD). When the Chinese economy is doing well it purchases more raw materials, goods and services from Australia, lifting demand for the AUD, and pushing up its value. The opposite is the case when the Chinese economy is not growing as fast as expected. Positive or negative surprises in Chinese growth data, therefore, often have a direct impact on the Australian Dollar and its pairs.
Iron Ore is Australia’s largest export, accounting for $118 billion a year according to data from 2021, with China as its primary destination. The price of Iron Ore, therefore, can be a driver of the Australian Dollar. Generally, if the price of Iron Ore rises, AUD also goes up, as aggregate demand for the currency increases. The opposite is the case if the price of Iron Ore falls. Higher Iron Ore prices also tend to result in a greater likelihood of a positive Trade Balance for Australia, which is also positive of the AUD.
The Trade Balance, which is the difference between what a country earns from its exports versus what it pays for its imports, is another factor that can influence the value of the Australian Dollar. If Australia produces highly sought after exports, then its currency will gain in value purely from the surplus demand created from foreign buyers seeking to purchase its exports versus what it spends to purchase imports. Therefore, a positive net Trade Balance strengthens the AUD, with the opposite effect if the Trade Balance is negative.
- USD/JPY gains traction around 157.50 on Monday, up 0.08% on the day.
- The hawkish stance from the US Fed supported the Greenback, despite the weaker-than-expected Michigan Consumer Sentiment Index data.
- BoJ kept short-term rate target unchanged and could reduce its purchases of JGBs after the next monetary policy meeting.
The USD/JPY pair extends the rally near 157.50 during the early Asian session on Monday. The hawkish stance from the US Federal Reserve (Fed) provides some support to the pair. Meanwhile, the Japanese Yen (JPY) loses ground as the Bank of Japan (BoJ) decided to keep its interest rate at 0% at the conclusion of its June policy meeting on Friday.
The Fed held interest rates steady at their current range of 5.25% to 5.5% at the latest policy meeting last week, as widely expected by consensus. Furthermore, it revised its outlook for rate cuts to just one in 2024. Fed Chair Jerome Powell said during the press conference that the central bank does not yet have the confidence to cut rates and he needs more convincing evidence that inflation was moving to the 2% target. On Sunday, Minneapolis Fed President Neel Kashkari noted that it is a “reasonable prediction” that the Fed will wait until December to cut interest rates, adding that the Fed is in a very good position to get more data before making any decisions.
On Friday, the preliminary report of the Michigan Consumer Sentiment Index, a monthly survey of consumer confidence levels in the US fell to a 7-month low at 65.6 in June from 69.1 in the previous reading, below the forecast of 72.0. Nonetheless, the downbeat Consumer Sentiment data had little to no impact on the Greenback.
On the JPY’s front, the BoJ kept its benchmark interest rate unchanged between 0% to 0.1% at the end of its two-day policy meeting on Friday but indicated it could reduce its purchases of Japanese government bonds after the next monetary policy meeting in July. The BoJ Governor Kazuo Ueda also said he would not rule out raising interest rates in July as weakness in the Japanese Yen (JPY) pushes up import costs. ”Decision suggests that the BoJ is very careful about reducing the bond buying amounts, which means the central bank is also cautious about raising rates," said Takayuki Miyajima, senior economist at Sony Financial Group. Such a dovish stance from the BoJ continues to undermine the JPY and acts as a tailwind for USD/JPY.
- GBP/USD is seen consolidating its recent losses to over a one-month low touched on Friday.
- The Fed’s hawkish outlook continues to underpin the USD and exerts pressure on the major.
- The divergent Fed-BoE policy expectations could lend some support and limit deeper losses.
The GBP/USD pair struggles to capitalize on Friday's modest bounce from the vicinity of mid-1.2600s or a nearly one-month low and oscillates in a narrow band on the first trading day of a new week. Spot prices now seem to have found acceptance below the 1.2700 round-figure mark and could decline further amid a bullish sentiment surrounding the US Dollar (USD).
In fact, the USD Index (DXY), which tracks the Greenback against a basket of currencies, stands tall near its highest level since early May touched on Friday in the wake of the Federal Reserve's (Fed) hawkish surprise last week. In the so-called "dot plot", policymakers projected only one interest rate cut in 2024 as compared to three in March. This remains supportive of elevated US Treasury bond yields and acts as a tailwind for the buck, validating the negative outlook for the GBP/USD pair.
That said, weaker-than-expected US consumer and producer prices data released last week pointed to signs of easing inflationary pressures. Adding to this, an unexpected fall in the US import prices further boosted the domestic inflation outlook, which, along with a sharp deterioration in the US consumer sentiment in June, keeps hopes alive for the first Fed rate cut move in September and the second cut in December. This might cap gains for the USD and help limit losses for the GBP/USD pair.
Market participants, meanwhile, expect that more persistent price pressures in the UK might force the Bank of England (BoE) to keep interest rates at their current level for a little bit longer. This might hold back bearish traders from placing aggressive bets around the British Pound (GBP) ahead of this week's release of the UK CPI report. Moreover, the upcoming UK general election on July 4 warrants some caution before positioning for any further depreciating move for the GBP/USD pair.
The People’s Bank of China (PBoC) set the USD/CNY central rate for the trading session ahead on Monday at 7.1149, as against the previous day's fix of 7.1151 and 7.2574 Reuters estimates.
Furthermore, the China's central bank kept the one-year Medium-term Lending Facility (MLF) rate steady at 2.50% on Monday. The one-year MLF was last cut in August 2023, from 2.65%.
- EUR/USD struggles to build on Friday’s bounce from its lowest level since early May.
- Political uncertainty in Europe continues to undermine the Euro and cap the upside.
- The Fed’s hawkish outlook acts as a tailwind for the USD and favors bearish traders.
The EUR/USD pair kicks off the new week on a subdued note and consolidates its recent heavy losses to the lowest level since early May, around the 1.0670-1.0665 region touched on Friday. Spot prices currently trade around the 1.0700 mark and seem vulnerable to extending the recent downward trajectory witnessed over the past two weeks or so.
The shared currency continues to be undermined by concerns that a snap election in France will worsen the fiscal situation in the Eurozone's second-largest economy, against the backdrop of a lead to the right-wing National Front party in the opinion polls. In fact, French Finance Minister Bruno Le Maire said on Friday that the country was at risk of a financial crisis if either the far right or left won because of their heavy spending plans. This, along with a modest US Dollar (USD) uptick, validates the near-term negative outlook for the EUR/USD pair.
The Federal Reserve's (Fed) hawkish surprise at the end of the June policy meeting, indicating a median projection of just one rate cut in 2024, remains supportive of elevated US Treasury bond yields. Apart from this, persistent geopolitical tensions in the Middle East turn out to be another factor underpinning the safe-haven Greenback, suggesting that the path of least resistance for the EUR/USD pair is to the downside. That said, signs of easing inflationary pressures in the US keep the door open for the first interest rate cut by the Fed in September.
The bets were further reinforced by the US data released on Friday, which showed that import prices unexpectedly fell in May and further boosted the domestic inflation outlook. Furthermore, a survey by the University of Michigan revealed that US consumer sentiment deteriorated sharply in June, which, in turn, might hold back the USD bulls from placing aggressive bets and help limit losses for the EUR/USD pair. There isn't any relevant economic data due for release from the US on Monday, leaving spot prices at the mercy of the USD.
- Gold price edges lower to $2,325 in Monday’s early Asian session.
- The hawkish Fed continues to underpin the Greenback and drag USD-denominated Gold lower.
- The Eurozone political concerns might boost the safe-haven flows and cap the downside for yellow metal.
Gold price (XAU/USD) trades on a softer note near $2,325 during the early Asian trading hours on Monday. The speculation that US interest rates will stay higher for longer, with the median projection from Federal Reserve (Fed) officials calling for one interest rate cut this year, has lifted the Greenback broadly. However, the risk aversion fueled by political uncertainty in Europe might boost the safe-haven flows and cap the downside for yellow metal.
On Friday, Cleveland Fed President Loretta Mester said that she would like to see good-looking inflation data, adding that the path towards the Fed's 2.0% inflation goal may take longer than expected. Meanwhile, Minneapolis Fed President Neel Kashkari stated on Sunday that it is a “reasonable prediction” that the central bank will wait until December to cut interest rates. Kashkari added that the Fed is in a very good position to get more data before making any decisions. The hawkish comments from the Fed officials weigh on the non-yielding assets like Gold as it makes the white precious metal more expensive for overseas buyers.
Consumer sentiment fell to a seven-month low in June, according to the preliminary report for the Michigan Consumer Sentiment Index on Friday. The Consumer Sentiment Index dropped 3.5 points to 65.6 in June from May's final reading of 69.1. The figure came in weaker than the estimation of 72.0. Additionally, the one-year inflation expectation held steady at 3.3%, and the five-year inflation outlook rose to 3.1% from 3%.
On the other hand, the downside for yellow metal might be limited amid the Eurozone political concerns. France's President Emmanuel Macron called for early parliamentary elections after losing to the right-wing National Rally in the European vote. On Sunday, Macron said that Economic programs by two extremist blocks in the parliament election are not realistic, and France is at a very serious moment with major economic issues at stake. Any negative development surrounding the Eurozone or France's political concerns could provide some support to the safe-haven assets like Gold.
| Index | Change, points | Closed | Change, % |
|---|---|---|---|
| NIKKEI 225 | 94.09 | 38814.56 | 0.24 |
| Hang Seng | -170.85 | 17941.78 | -0.94 |
| KOSPI | 3.53 | 2758.42 | 0.13 |
| ASX 200 | -25.4 | 7724.3 | -0.33 |
| DAX | -263.66 | 18002.02 | -1.44 |
| CAC 40 | -204.75 | 7503.27 | -2.66 |
| Dow Jones | -57.94 | 38589.16 | -0.15 |
| S&P 500 | -2.14 | 5431.6 | -0.04 |
| NASDAQ Composite | 21.32 | 17688.88 | 0.12 |
| Pare | Closed | Change, % |
|---|---|---|
| AUDUSD | 0.66151 | -0.27 |
| EURJPY | 168.489 | -0.05 |
| EURUSD | 1.07057 | -0.28 |
| GBPJPY | 199.669 | -0.33 |
| GBPUSD | 1.26867 | -0.57 |
| NZDUSD | 0.61418 | -0.4 |
| USDCAD | 1.37341 | -0.08 |
| USDCHF | 0.89025 | -0.41 |
| USDJPY | 157.387 | 0.24 |


© 2000-2026. Sva prava zaštićena.
Sajt je vlasništvo kompanije Teletrade D.J. LLC 2351 LLC 2022 (Euro House, Richmond Hill Road, Kingstown, VC0100, St. Vincent and the Grenadines).
Svi podaci koji se nalaze na sajtu ne predstavljaju osnovu za donošenje investicionih odluka, već su informativnog karaktera.
The company does not serve or provide services to customers who are residents of the US, Canada, Iran, The Democratic People's Republic of Korea, Yemen and FATF blacklisted countries.
Izvršenje trgovinskih operacija sa finansijskim instrumentima upotrebom marginalne trgovine pruža velike mogućnosti i omogućava investitorima ostvarivanje visokih prihoda. Međutim, takav vid trgovine povezan je sa potencijalno visokim nivoom rizika od gubitka sredstava. Проведение торговых операций на финанcовых рынках c маржинальными финанcовыми инcтрументами открывает широкие возможноcти, и позволяет инвеcторам, готовым пойти на риcк, получать выcокую прибыль, но при этом неcет в cебе потенциально выcокий уровень риcка получения убытков. Iz tog razloga je pre započinjanja trgovine potrebno odlučiti o izboru odgovarajuće investicione strategije, uzimajući u obzir raspoložive resurse.
Upotreba informacija: U slučaju potpunog ili delimičnog preuzimanja i daljeg korišćenja materijala koji se nalazi na sajtu, potrebno je navesti link odgovarajuće stranice na sajtu kompanije TeleTrade-a kao izvora informacija. Upotreba materijala na internetu mora biti praćena hiper linkom do web stranice teletrade.org. Automatski uvoz materijala i informacija sa stranice je zabranjen.
Ako imate bilo kakvih pitanja, obratite nam se pr@teletrade.global.
транcфери