- Analiza
- Novosti i instrumenti
- Vesti sa tržišta
Forex-novosti i prognoze od 17-05-2024
- The daily chart reveals a strong bullish sentiment with indicators deep in positive territory.
- Hourly indicators show a flattening buying traction but remain positive.
- The pair closed its best week since November 2023.
In Friday's session, the NZD/USD rose to the 0.6137 level, demonstrating a strong bullish trend. After closing above its main Simple Moving Averages (SMAs) of 20,100 and 200 days, the pair secured its best week since late 2023.
On the daily chart, the Relative Strength Index (RSI) reveals a positive trend, moving from below 60 and nearing the 70 mark. This indicates that the NZD/USD pair is accumulating strength, demonstrating bullish pressure in the recent sessions. Concurrently, the Moving Average Convergence Divergence (MACD) prints green bars, showing steady buying traction.
NZD/USD daily chart

The hourly RSI readings exhibit a consistent positive trend over the recent hours, but was seen finishing at 57.17 but pointing downwards. The hourly MACD chart supports this view, with gradually diminishing green bars indicating a slowing positive momentum as investors take profits.
NZD/USD hourly chart
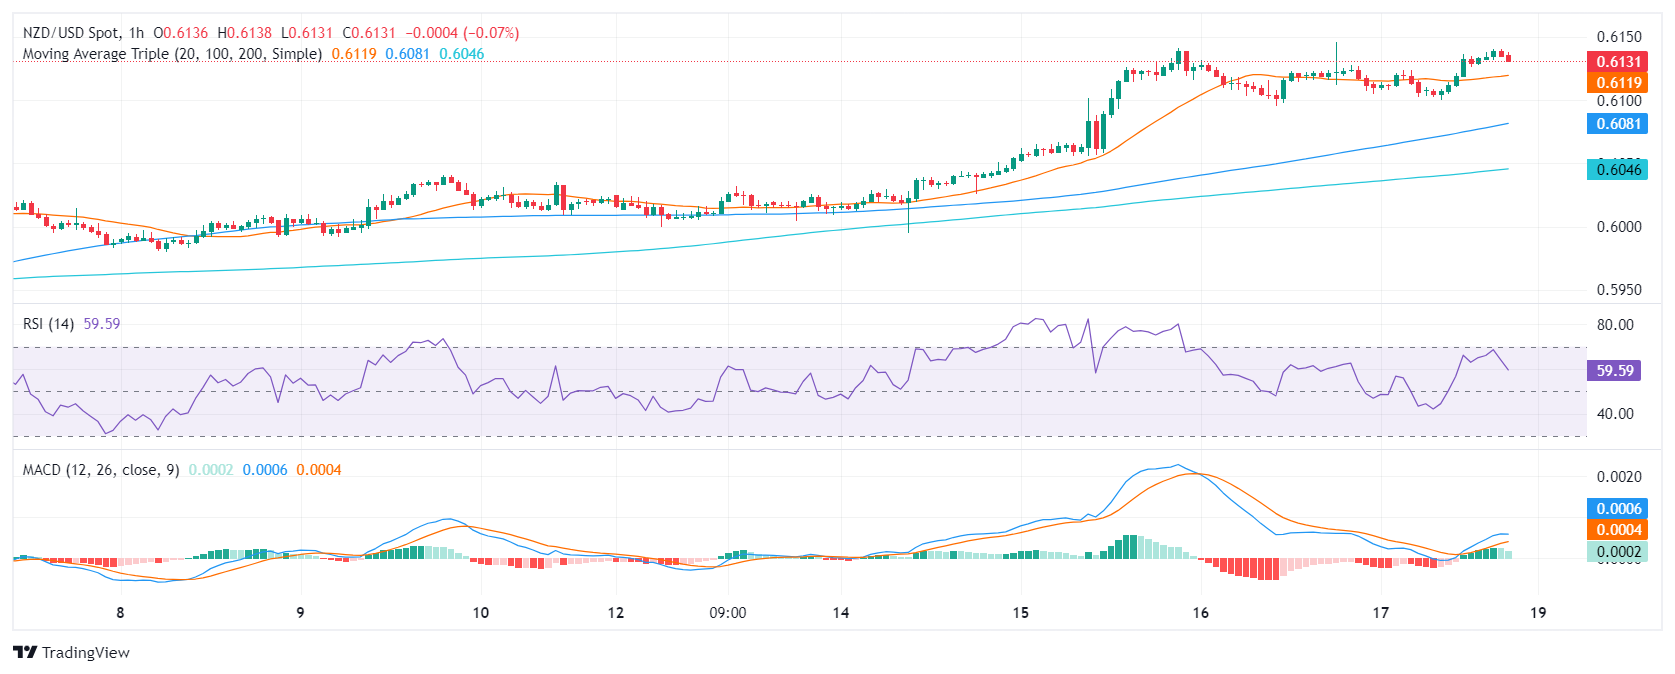
In conclusion, the NZD/USD is in a robust technical position, showing short and long-term bullish signals on the daily and short-term charts. Although the RSI shows that the pair is approaching overbought conditions and the hourly indicators show dwindling positive momentum, the pair retains its position above vital SMAs. Traders shouldn’t take off the table further corrective movements as investors might continue taking profits.
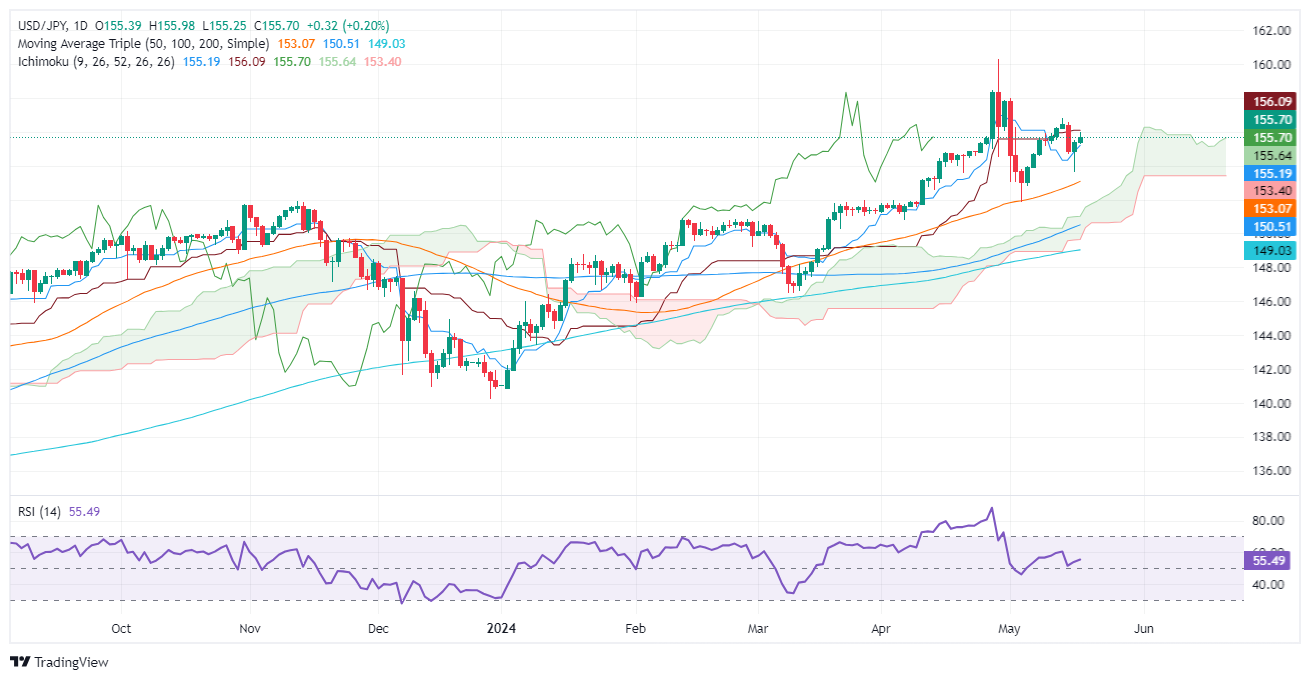
- USD/JPY maintains uptrend, trading at 155.66 after hitting a daily low of 155.25.
- Technical outlook suggests further gains with resistance at 156.05, 157.00, and YTD high at 160.32.
- Key support levels include 155.18, 155.00, and May 16 low at 153.60 if price drops below 155.69.
The USD/JPY extended its gains late on Friday’s North American session, though it’s set to finish the week unchanged. The major trades at 155.66, up 0.18% after hitting a daily low of 155.25.
USD/JPY Price Analysis: Technical outlook
Despite the conditions to extend their gains, traders should be aware of the Japanese authority's intervention threats. That said, the USD/JPY uptrend remains intact as long as price action achieves two goals: persisting above the Ichimoku Cloud (Kumo) and staying above the uptrend trendline drawn from the January 2024 lows.
The Relative Strength Index (RSI) favors buyers, standing above the 50-midline with enough room to spare before reaching overbought territory.
Therefore, the path of least resistance is upwards. The first resistance would be the Kijun-Sen at 156.05. Once cleared, the next stop would be 157.00, followed by the April 26 high of 158.44, ahead of challenging the year-to-date (YTD) high at 160.32.
On the flip side, if USD/JPY drops below the Senkou Span A of 155.69, the pair could be headed towards retesting lower support levels. Bulls' first line of defense would be the Tenkan-Sen at 155.18, followed by 155.00. Once hurdled, the next stop would be the May 16 low of 153.60, followed by the Sekou Span B at 153.06.
USD/JPY Price Action – Daily Chart
Japanese Yen PRICE Today
The table below shows the percentage change of Japanese Yen (JPY) against listed major currencies today. Japanese Yen was the strongest against the Swiss Franc.
| USD | EUR | GBP | JPY | CAD | AUD | NZD | CHF | |
|---|---|---|---|---|---|---|---|---|
| USD | -0.02% | -0.25% | 0.19% | -0.04% | -0.24% | -0.23% | 0.30% | |
| EUR | 0.02% | -0.24% | 0.22% | -0.01% | -0.20% | -0.19% | 0.30% | |
| GBP | 0.25% | 0.24% | 0.44% | 0.22% | 0.04% | 0.03% | 0.53% | |
| JPY | -0.19% | -0.22% | -0.44% | -0.26% | -0.43% | -0.45% | 0.09% | |
| CAD | 0.04% | 0.01% | -0.22% | 0.26% | -0.19% | -0.18% | 0.33% | |
| AUD | 0.24% | 0.20% | -0.04% | 0.43% | 0.19% | 0.00% | 0.51% | |
| NZD | 0.23% | 0.19% | -0.03% | 0.45% | 0.18% | -0.01% | 0.51% | |
| CHF | -0.30% | -0.30% | -0.53% | -0.09% | -0.33% | -0.51% | -0.51% |
The heat map shows percentage changes of major currencies against each other. The base currency is picked from the left column, while the quote currency is picked from the top row. For example, if you pick the Japanese Yen from the left column and move along the horizontal line to the US Dollar, the percentage change displayed in the box will represent JPY (base)/USD (quote).
- WTI testing towards $80 per barrel as energy markets step higher.
- Risk appetite is on the rise, bolstered by rate cut hopes.
- Easing US inflation data and declining US Crude Oil reserves spark barrel bids.
West Texas Intermediate (WTI) rose in late-day bidding on Friday as Crude Oil markets recover, but still remains within recent consolidation levels. US Crude Oil was propped up by a backslide in US barrel counts from the Energy Information Administration (EIA) and the American Petroleum Institute (API) this week, with broad-market risk appetite pinning deeper into ‘buy it all’ territory after US Consumer Price Index (CPI) inflation data eased more than expected in April.
Risk appetite increased during the latter half of the trading week after US inflation figures kicked investor hope for Federal Reserve (Fed) rate cuts higher, helping to drag Crude Oil bids up from its lowest bids since late February. Despite refreshed rate trim bids, Fedspeak is striking a notably moderate tone, with multiple Fed officials cautioning for patience on rates from the Fed, and the possibility that rates could remain higher for much longer than markets might be prepared for.
With Fedspeak dominating the financial news cycle to wrap up the trading week, investors will be bracing for early next week when a slew of Fed appearances show up on Monday and Tuesday. A volley of talking points from Fed policymakers will be hitting the wires in the front half of next trading week.
WTI technical outlook
US Crude Oil rose into a late weekly high on Friday, pushing through the 200-day Exponential Moving Average (EMA) at 79.10, ticking into 79.63 before the closing bell. WTI is pushing into a consolidation zone between the 50-day and 200-day EMAs.
The near-term ceiling is priced in at the last swing high near 87.00, but US Crude Oil is still up over 10% in 2024 despite trading down from the year’s early peaks.
WTI daily chart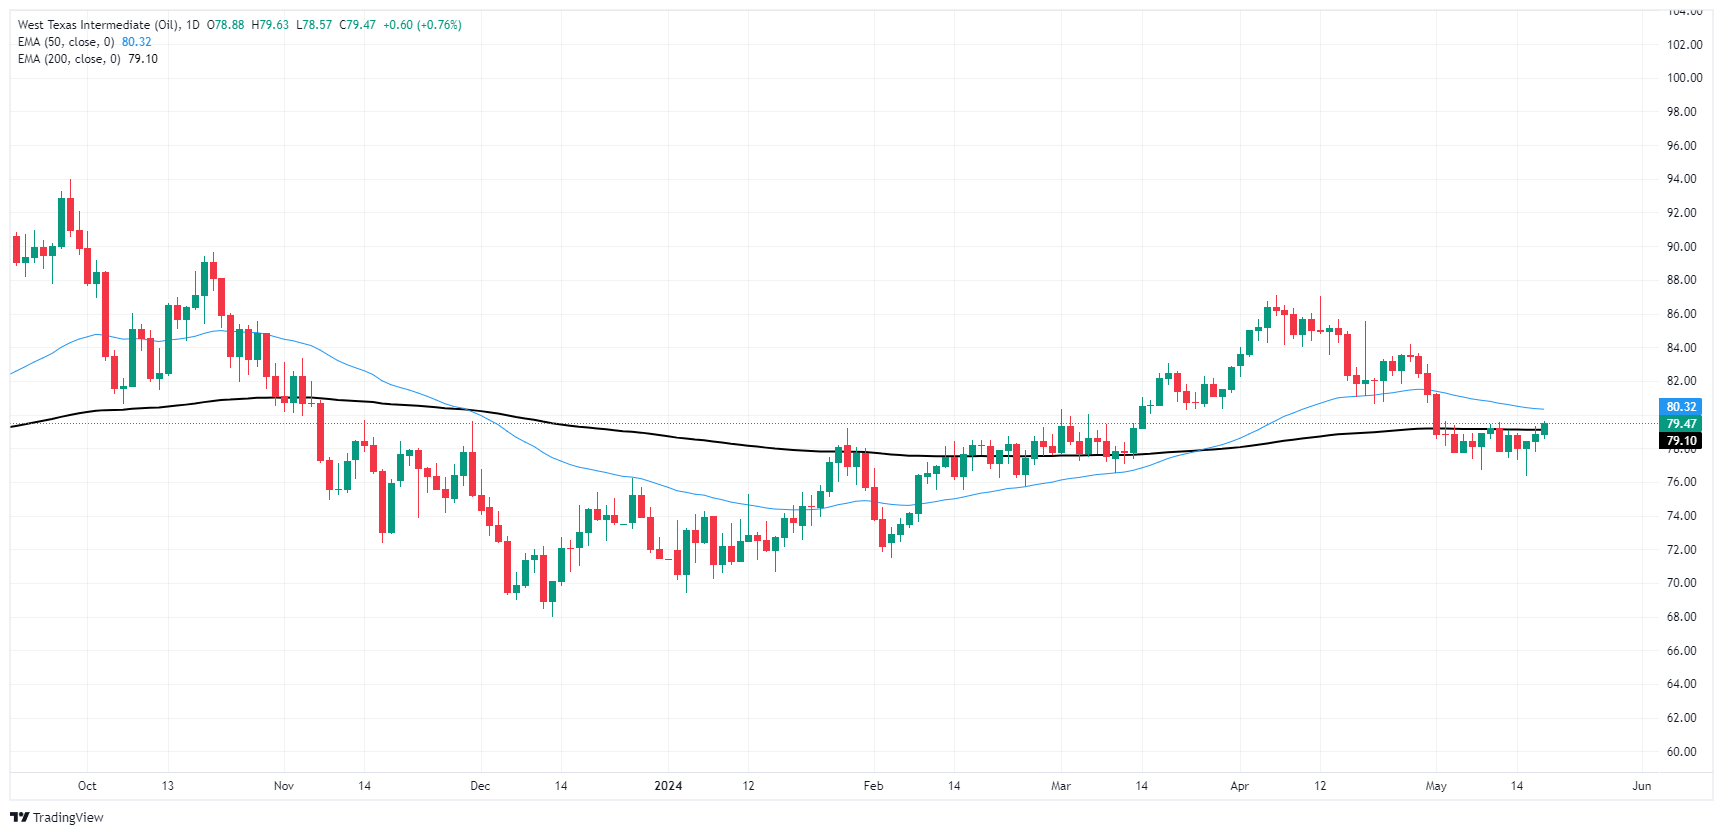
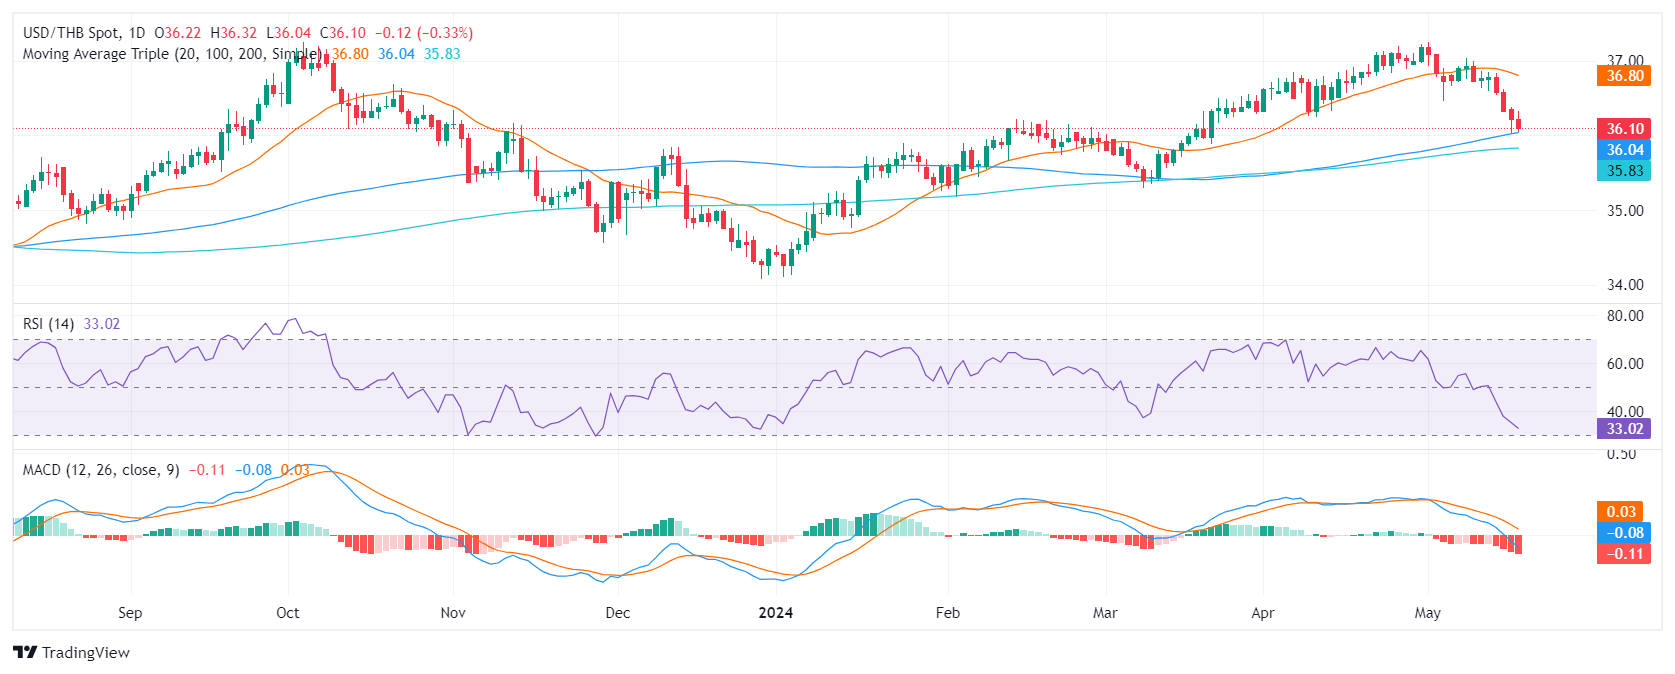
- USD/THB edged lower in Friday's session to stand at 36.10, showcasing a loss of 0.36%, as the bears maintain steady control.
- Data released during the week indicates a weak US economy, igniting market predictions for early interest rate cuts from the Federal Reserve.
- The hopes of sooner rate cuts were offset by the cautious tone of the Fed officials.
The USD/THB continued to lose ground on Friday despite the cautious tone seen in the latest Federal Reserve (Fed) officials' words.
US economic data published over the course of the week revealed signs of a potential economic slowdown. The indicators in question included April's Consumer Price Index (CPI) and Retail Sales figures as well as mounting weekly unemployment claims - all of which momentarily pushed the US Dollar into a selling pressure spiral. Nevertheless, the USD regained traction as Fed officials including Atlanta’s Fed President Raphael Bostic and his Cleveland Fed counterpart, Loretta Mester, reassured markets of their satisfaction with the unfolding inflation scenario and its accordance with the current monetary policy expressing that they need further confidence to start cutting. However, if data continues to underperform, the USD might see further losses.
USD/THB technical analysis
The daily Relative Strength Index (RSI) for the pair reveals a trend toward negative territory and approached oversold conditions. Simultaneously, the Moving Average Convergence Divergence (MACD) histogram presents flat red bars, signaling negative momentum with no expected substantial shift for the session.
USD/THB daily chart
Expanding to the broader picture, the USD/THB is situated beneath its 20-day Simple Moving Average (SMA). This indicates a robust sign of inherent bearish sentiment in the short term. Regardless of the short-term pessimistic view, the pair's ability to stay above its 100 and 200-day SMAs remains essential to keep the positive, long-term trend intact.
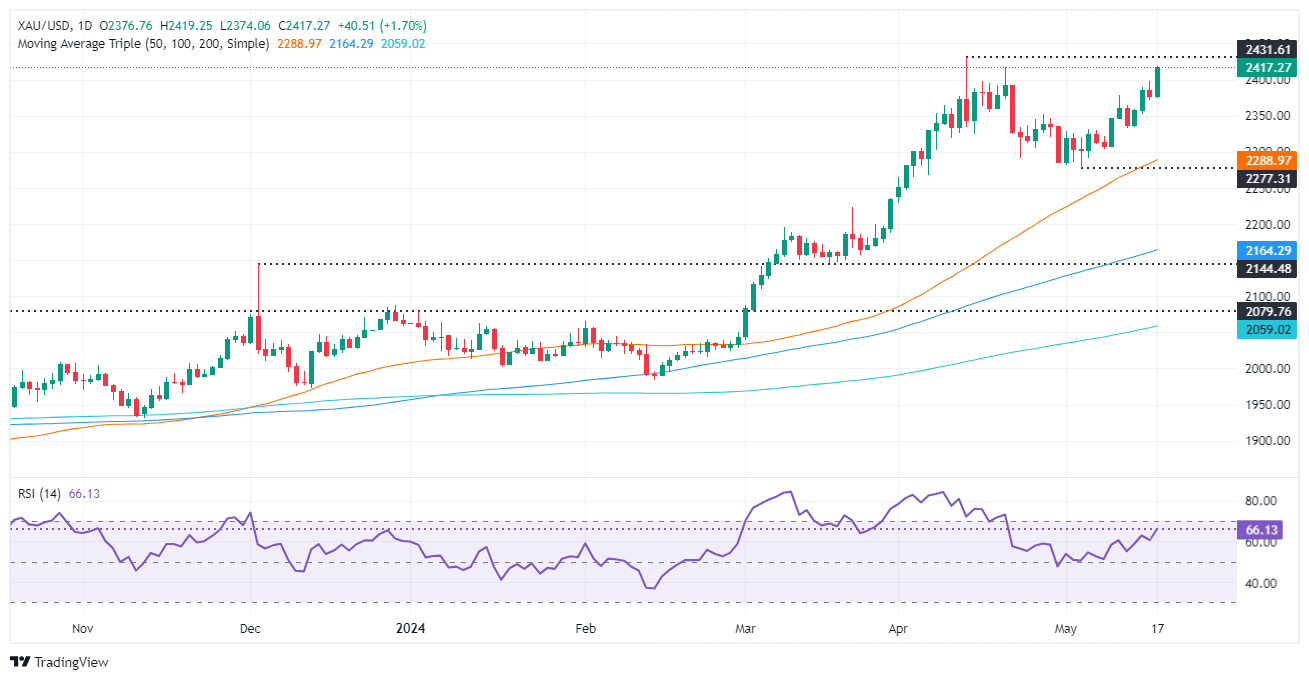
- Gold breaks above $2,400, nearing all-time high of $2,431.
- Lower April inflation in the US supports Gold’s rally, despite rising Treasury yields.
- Fed officials remain cautious, with December 2024 rate cut expectations slightly adjusted to 35 bps.
Gold's price skyrocketed during the North American session ahead of the weekend as XAU/USD traded above $2,400, posting gains of more than 1.5% amid higher US Treasury bond yields. The non-yielding metal extended its advancement and threatened to crack the all-time high of $2,431.
A lower April inflationary reading in the United States (US) sponsored Gold’s leg up above the $2,400 mark, although US Treasury yields climbed. However, the Greenback is battered across the board and tumbled some 0.03%, according to the US Dollar Index (DXY), standing at 104.45.
That revived speculation that the Federal Reserve (Fed) could lower rates in 2024. However, Fed officials stressed that one positive read for inflation is not enough with most regional Fed presidents maintaining a cautious stance.
According to the fed funds rate December 2024 futures contract, expectations that the Fed would lower rates dropped from 36 basis points (bps) to 35 bps toward the end of the year.
Daily digest market movers: Gold price ignores hawkish Fed comments to keep rates higher
- Gold prices advanced despite higher US Treasury yields and a weaker US Dollar. The US 10-year Treasury note yields 4.42% and is up four-and-a-half basis points (bps) from its opening level. DXY dropped 0.04% to 104.40.
- On Wednesday, US inflation resumed its downtrend after stalling for six months, according to the US Bureau of Labor Statistics (BLS). The core Consumer Price Index (CPI) ebbed lower from 3.8% to 3.6% YoY in April, easing pressure on the Fed. This and soft Retail Sales augmented the odds for rate cut expectations by the Fed.
- After the data, US equities rallied to new all-time highs, while the Greenback tumbled sharply, following the path of US Treasury yields.
- Richmond Fed President Thomas Barkin acknowledged that inflation is decreasing but emphasized that it will "take more time" to reach the Fed’s target.
- Cleveland Fed President Loretta Mester approved the latest CPI data, noting that the Fed's current monetary policy stance is appropriate as it continues to assess forthcoming economic data.
- Fed Governor Michelle Bowman said the policy is restrictive but is willing to raise rates if inflation stalls or reverses.
Technical analysis: Gold price to extend its rally toward $2,500
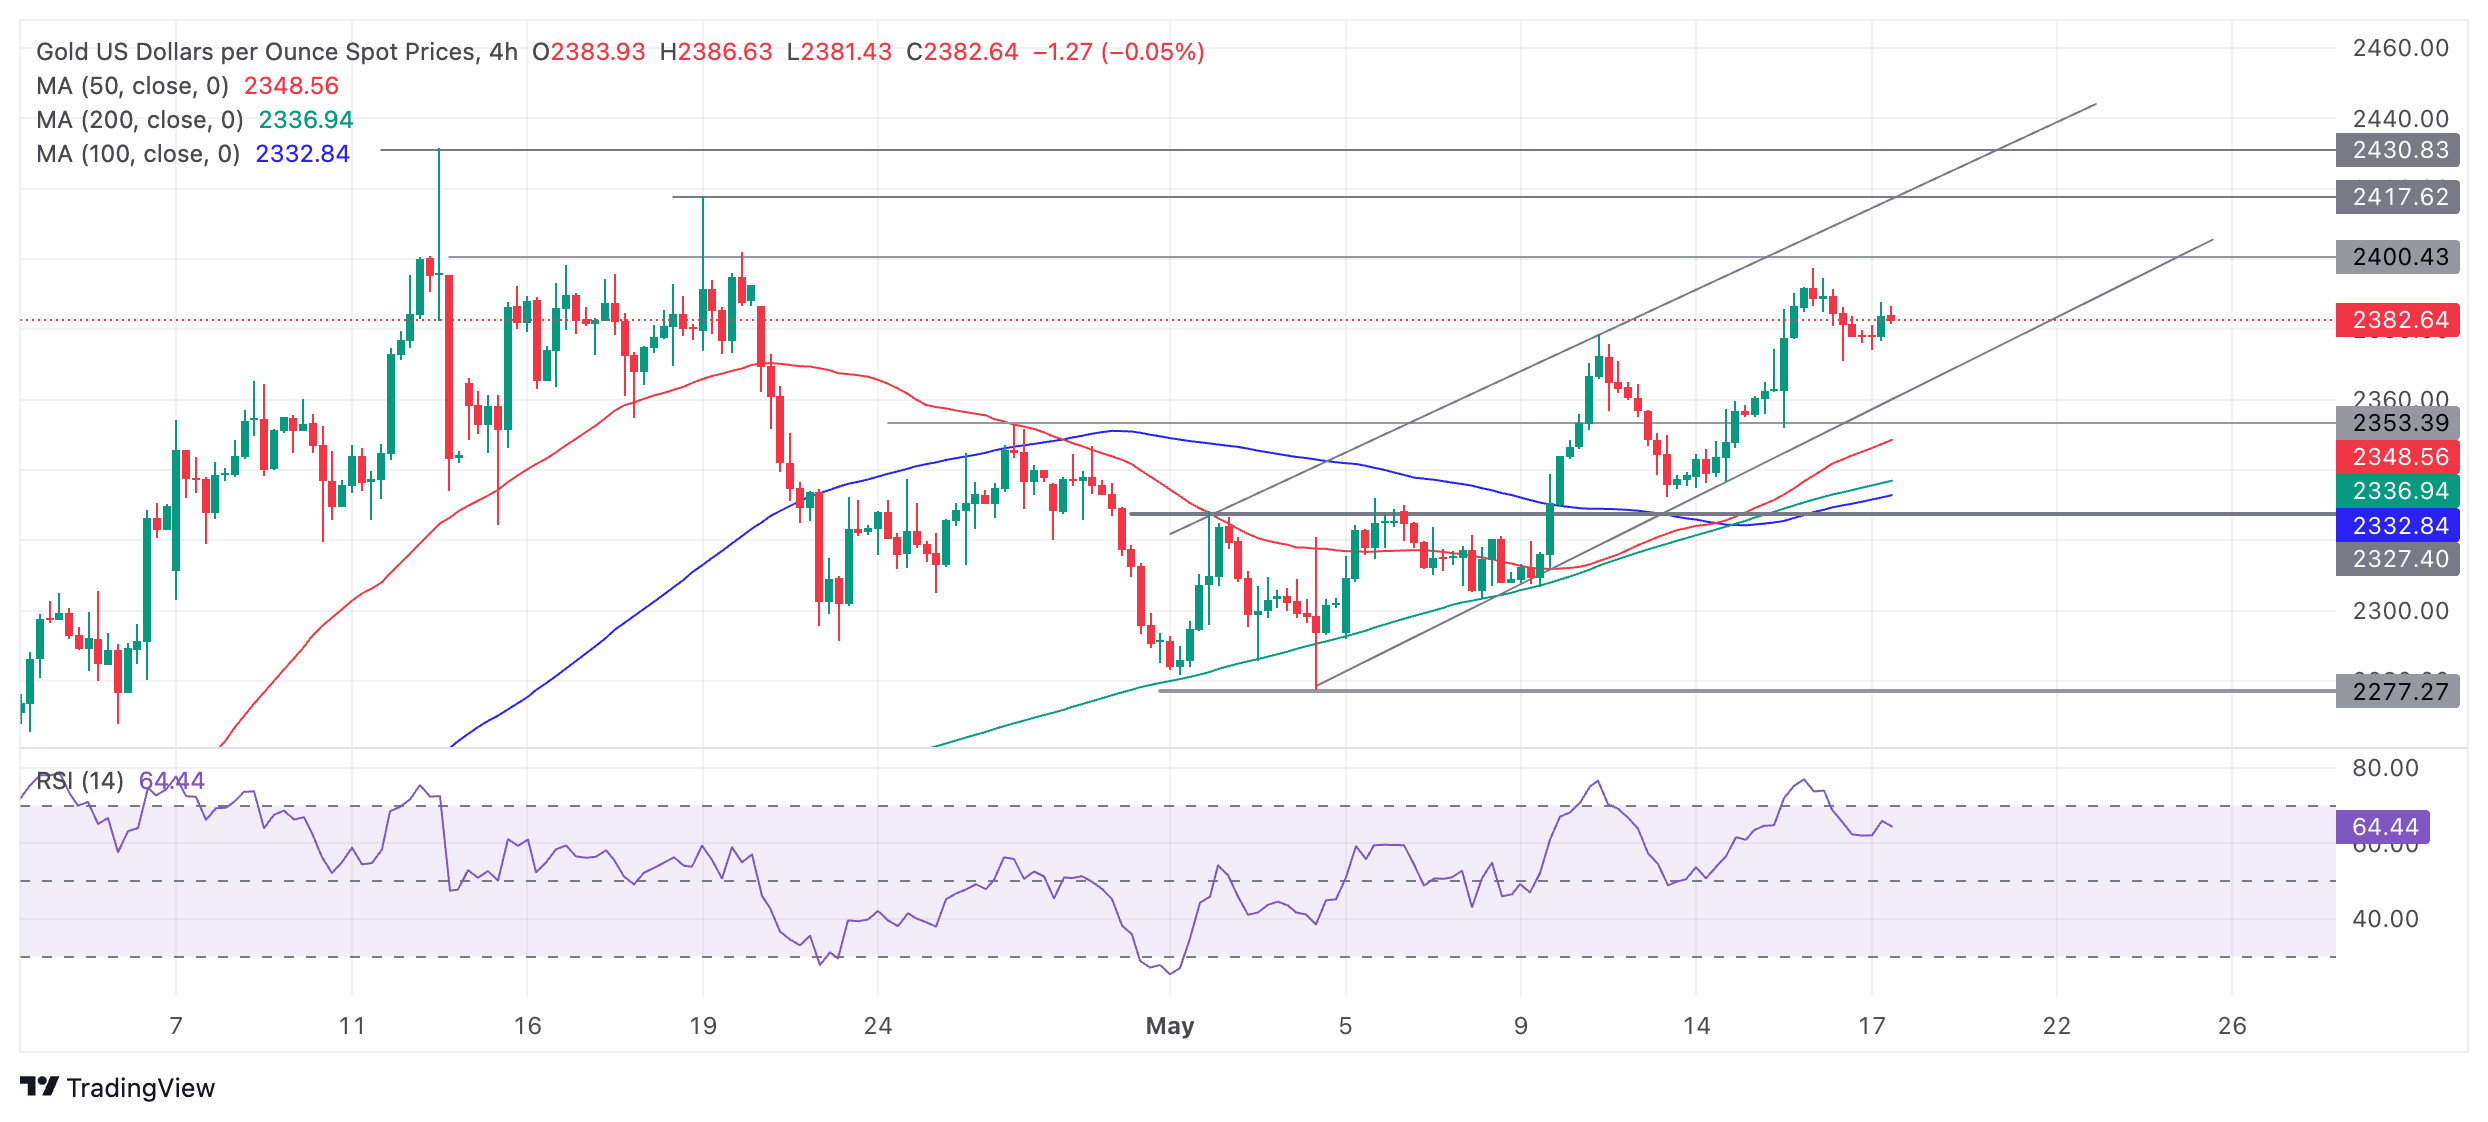
Gold price’s bullish bias remains intact as the golden metal resumed its uptrend. Gold buyers gather strength with the momentum on their side as the Relative Strength Index (RSI) stays in bullish territory.
Therefore, the most likely scenario is that XAU/USD might test the all-time high of $2,431. Once cleared, the next stop would be the $2,450 mark, followed by the psychological $2,500 figure.
Conversely, if XAU/USD retreats below $2,400, that could expose the May 13 low at $2,332, followed by the May 8 low of $2,303. Once those levels are surpassed, the 50-day Simple Moving Average (SMA) at $2,284 will be up next.
Gold FAQs
Gold has played a key role in human’s history as it has been widely used as a store of value and medium of exchange. Currently, apart from its shine and usage for jewelry, the precious metal is widely seen as a safe-haven asset, meaning that it is considered a good investment during turbulent times. Gold is also widely seen as a hedge against inflation and against depreciating currencies as it doesn’t rely on any specific issuer or government.
Central banks are the biggest Gold holders. In their aim to support their currencies in turbulent times, central banks tend to diversify their reserves and buy Gold to improve the perceived strength of the economy and the currency. High Gold reserves can be a source of trust for a country’s solvency. Central banks added 1,136 tonnes of Gold worth around $70 billion to their reserves in 2022, according to data from the World Gold Council. This is the highest yearly purchase since records began. Central banks from emerging economies such as China, India and Turkey are quickly increasing their Gold reserves.
Gold has an inverse correlation with the US Dollar and US Treasuries, which are both major reserve and safe-haven assets. When the Dollar depreciates, Gold tends to rise, enabling investors and central banks to diversify their assets in turbulent times. Gold is also inversely correlated with risk assets. A rally in the stock market tends to weaken Gold price, while sell-offs in riskier markets tend to favor the precious metal.
The price can move due to a wide range of factors. Geopolitical instability or fears of a deep recession can quickly make Gold price escalate due to its safe-haven status. As a yield-less asset, Gold tends to rise with lower interest rates, while higher cost of money usually weighs down on the yellow metal. Still, most moves depend on how the US Dollar (USD) behaves as the asset is priced in dollars (XAU/USD). A strong Dollar tends to keep the price of Gold controlled, whereas a weaker Dollar is likely to push Gold prices up.
- Dow Jones softly higher but still down slightly from recent record highs.
- Record equity gains on rate cut hopes could prove to be short-lived.
- Fedspeak remains key focal point for markets.
The Dow Jones Industrial Average (DJIA) is on the high side as markets wind down a hectic trading week that saw rate cut hopes return to the forefront after US Consumer Price Index (CPI) inflation eased to a three-month low. Easing inflation figures sparked a risk appetite rally that sent the Dow Jones over the 40,000.00 major price handle on Thursday as investors pin their hopes and dreams on the Federal Reserve (Fed) delivering at least two rate cuts before the end of the year.
Read more: Fed officials recognize overall inflation progress, but cautious tones remain
Despite easing inflation data this week, Fed officials have routinely talked down still-high market expectations. Fed Board of Governors member Michelle Bowman hit markets late in the Friday market session with cautionary comments highlighting that progress on inflation in 2024 has not been as good as many had hoped. Fed Governor Bowman also sees inflation remaining higher than markets expect, highlighting that further rate hikes are not off the table if inflationary pressures return to the data.
Dow Jones news
Despite record prints across the major US indexes, analysts have started to flash warnings signs that the record run-up in equities could lead to near-term volatility. According to Wells Fargo analyst Christopher Harvey, as quoted by CNBC Markets, investors should expect some choppiness in markets as the current investor narrative of bad news (easing economic conditions) meaning good news (rate cuts) could begin to unravel.
A little less than half of the 30 securities listed on the Dow Jones are lower on Friday, but losses are lean with the loss leader Intel Corp. (INTC) down -1.11% to $31.68 per share. Gainers are equally sedate heading into the trading week’s close, with Walmart Inc. (WMT), JPMorgan Chase & CO. (JPM), and Caterpillar Inc. (CAT) all up around 1% on the day.
Dow Jones technical outlook
The Dow Jones Industrial Average is trading on the low side of the 40,000.00 on Friday after Thursday’s record bidding action, but pullbacks remain limited and the major index is close to 39,900.00. The Dow Jones’ record high of 40,042.54 this week remains close by, and a technical floor is priced in above 39,800.00.
The Dow Jones is up over 1% for the week, and a bullish Friday close will mean the index has gained ground for all but two of the last 12 consecutive trading days. Bulls remain firmly in control with the DJIA trading well above the 200-day Exponential Moving Average (EMA) at 37,067.12.
Dow Jones five minute chart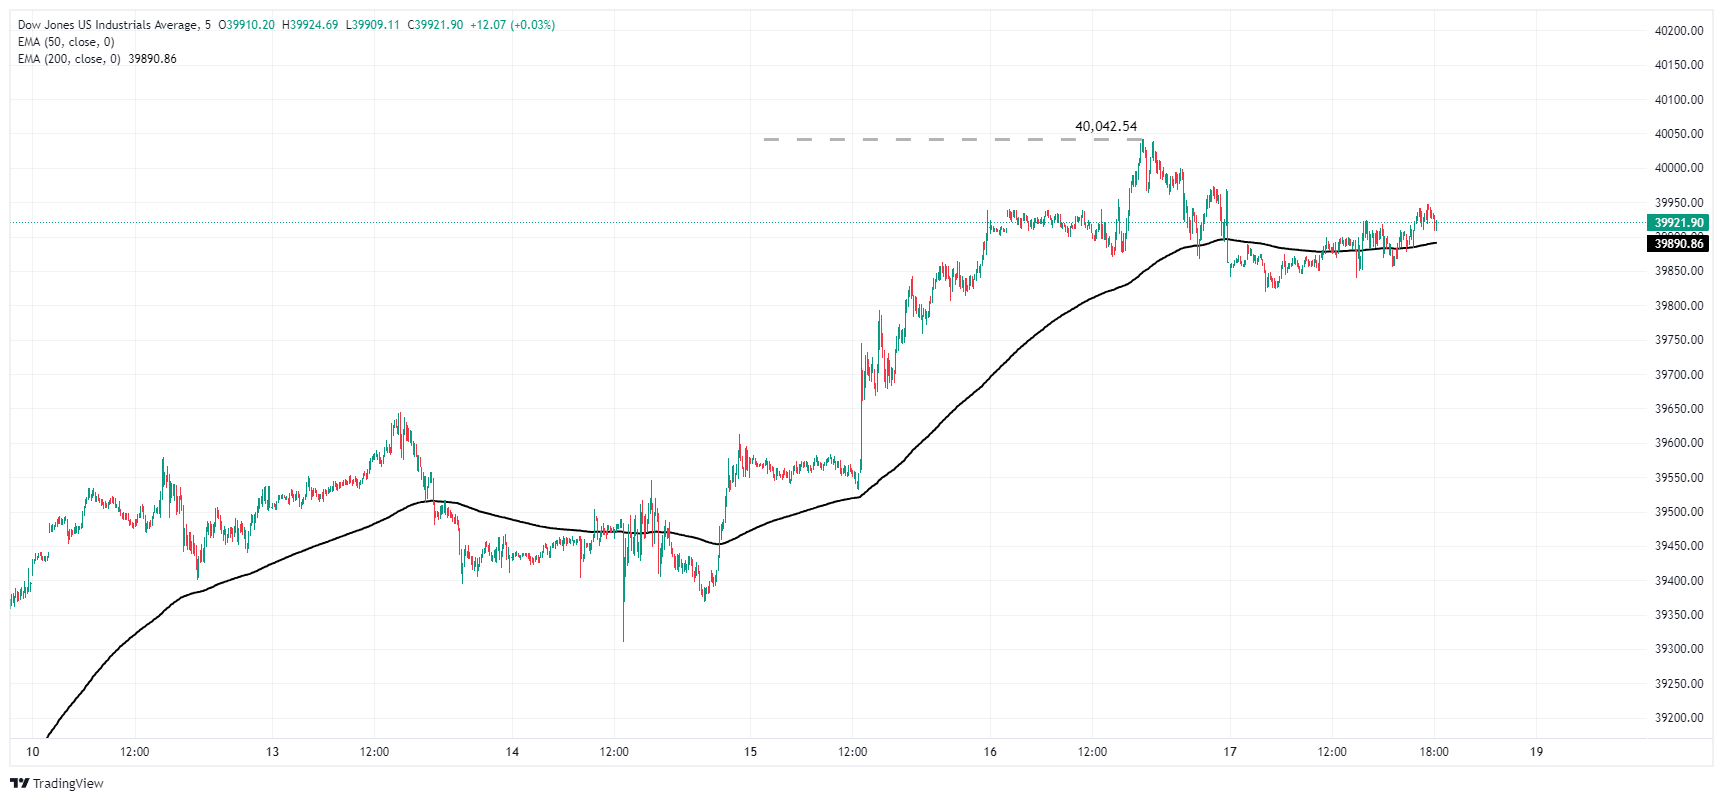
Dow Jones daily chart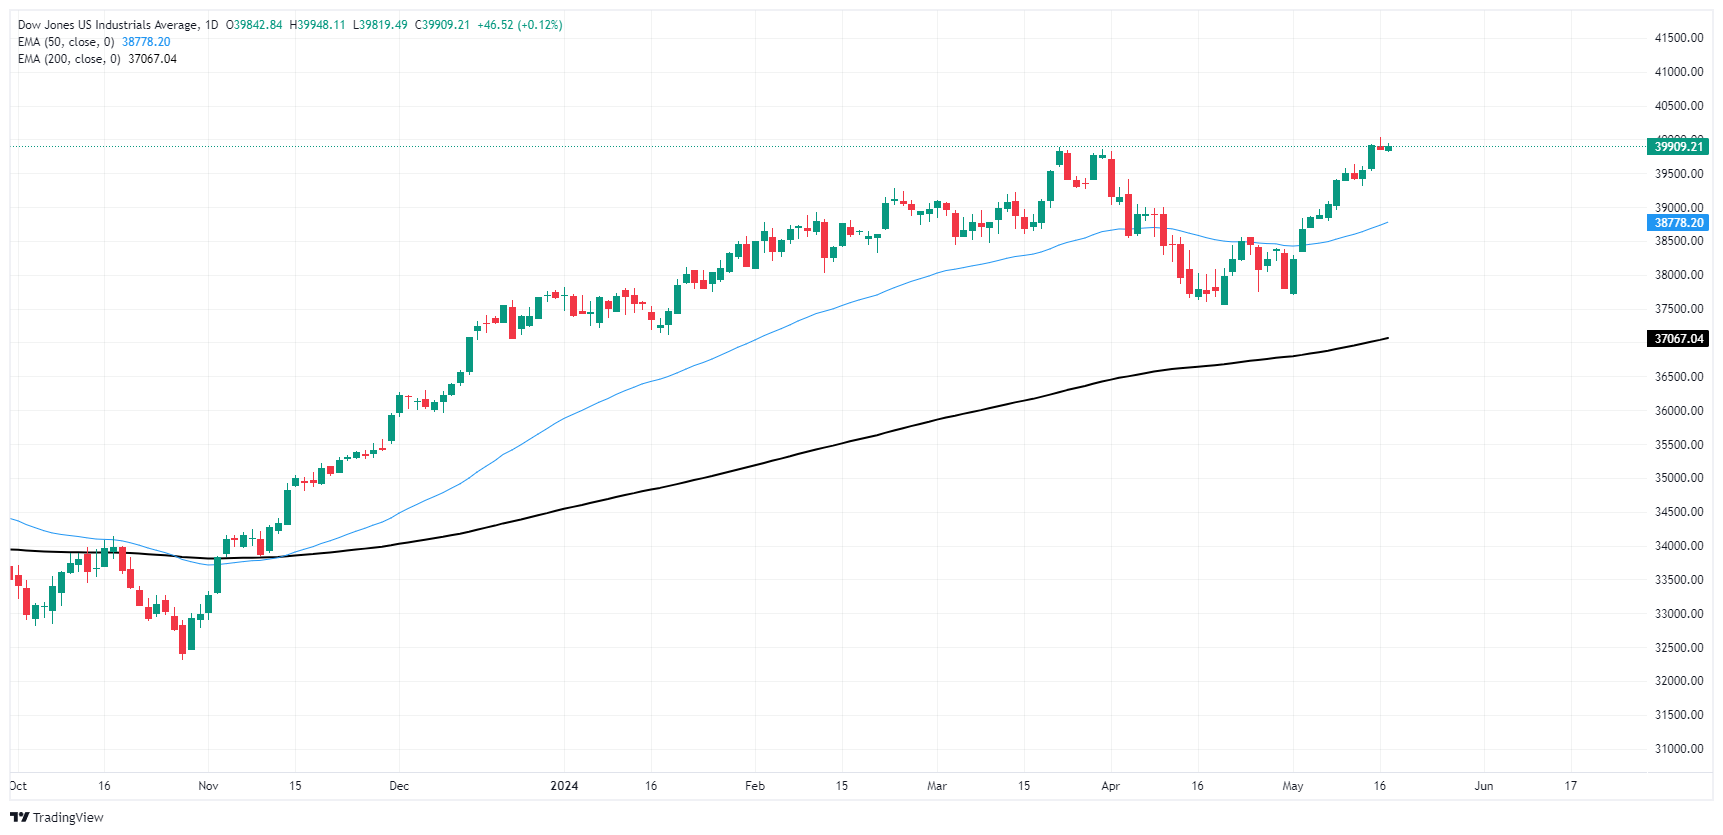
Fed FAQs
Monetary policy in the US is shaped by the Federal Reserve (Fed). The Fed has two mandates: to achieve price stability and foster full employment. Its primary tool to achieve these goals is by adjusting interest rates. When prices are rising too quickly and inflation is above the Fed’s 2% target, it raises interest rates, increasing borrowing costs throughout the economy. This results in a stronger US Dollar (USD) as it makes the US a more attractive place for international investors to park their money. When inflation falls below 2% or the Unemployment Rate is too high, the Fed may lower interest rates to encourage borrowing, which weighs on the Greenback.
The Federal Reserve (Fed) holds eight policy meetings a year, where the Federal Open Market Committee (FOMC) assesses economic conditions and makes monetary policy decisions. The FOMC is attended by twelve Fed officials – the seven members of the Board of Governors, the president of the Federal Reserve Bank of New York, and four of the remaining eleven regional Reserve Bank presidents, who serve one-year terms on a rotating basis.
In extreme situations, the Federal Reserve may resort to a policy named Quantitative Easing (QE). QE is the process by which the Fed substantially increases the flow of credit in a stuck financial system. It is a non-standard policy measure used during crises or when inflation is extremely low. It was the Fed’s weapon of choice during the Great Financial Crisis in 2008. It involves the Fed printing more Dollars and using them to buy high grade bonds from financial institutions. QE usually weakens the US Dollar.
Quantitative tightening (QT) is the reverse process of QE, whereby the Federal Reserve stops buying bonds from financial institutions and does not reinvest the principal from the bonds it holds maturing, to purchase new bonds. It is usually positive for the value of the US Dollar.
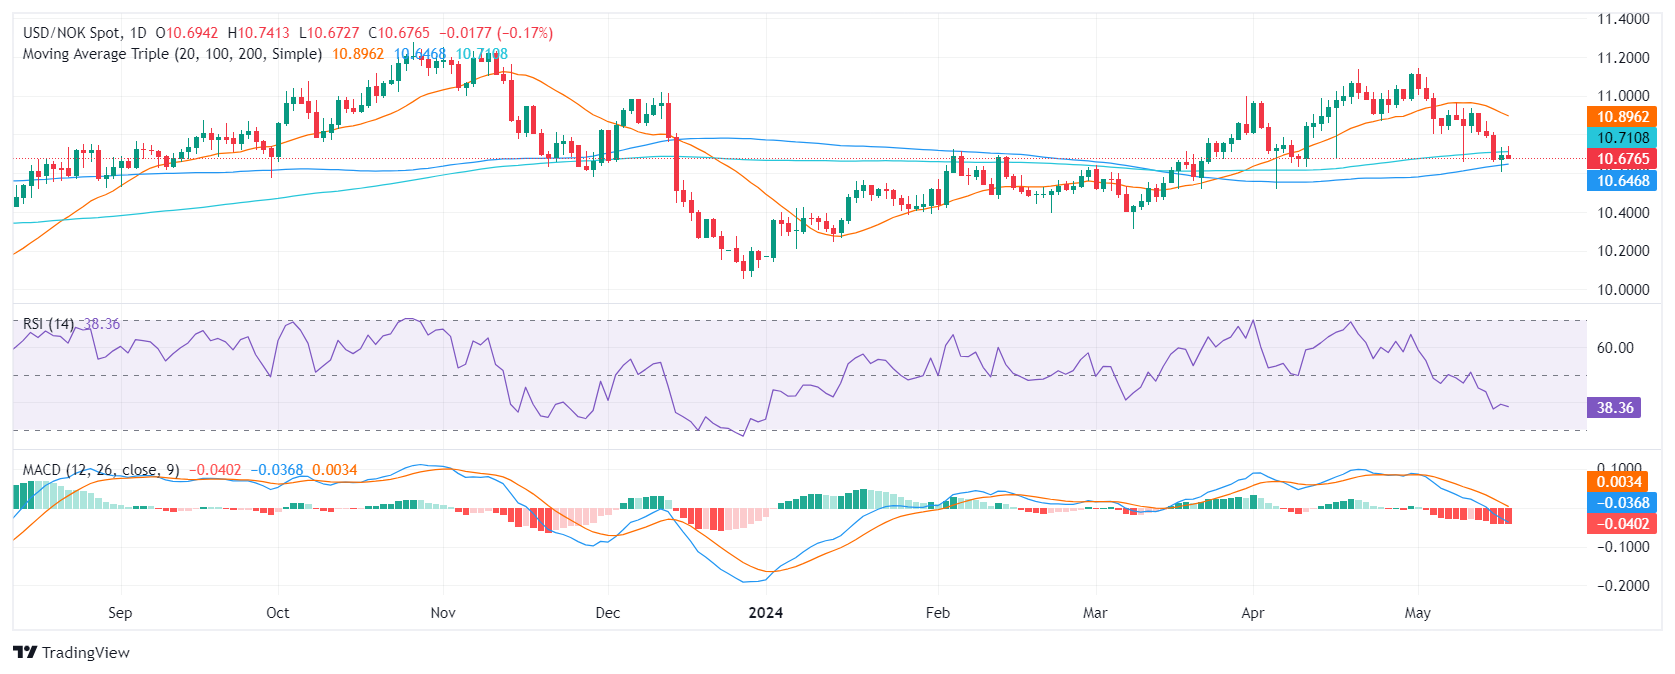
- USD/NOK saw mild losses on Friday’s session, around 10.66.
- Despite mixed reactions to softening economic data, the Dollar remains steady due to a cautious stance from Fed officials.
- The Fed recognized progress but that it needs further data to start cutting.
The USD/NOK stands mildly down on Friday with the Greenback holding its ground thanks to the cautious tone of the Federal Reserve (Fed) officials. They mention that the Consumer Price Index (CPI) figures have yet to meet the Fed's desired targets which makes the market attach to their bets of the easing starting in September.
Fed officials, including Raphael Bostic, Loretta Mester, and Thomas Barkin, have adopted a cautious stance in light of recent US economic data. Despite softening figures, the US Dollar has remained resilient, reflecting confidence in the existing monetary policy. The difficulty appears in the inflation trajectory, with Bostic and Mester both emphasizing the necessity of awaiting further data before deciding on potential rate adjustments. Barkin's remarks echo this cautious mindset, noting that the current CPI does not reflect the Fed’s target for inflation, suggesting possible adjustments in the near future.
USD/NOK technical analysis
On the daily chart, the Relative Strength Index (RSI) for the USD/NOK pair is in negative territory, marking an overall bearish momentum. There is a gradual descent, indicating a continuous sell-off with no immediate signs of reversal. Meanwhile, the Moving Average Convergence Divergence (MACD) histogram produces flat red bars, suggesting a stable negative momentum supplementing further support to the prevailing downward pressure.
USD/NOK daily chart
When considering the Simple Moving Average (SMA) analysis, the pair can be seen between the 200 and 100-day SMAs which reflects a negative outlook in the overall trend. On the short-term, the outlook also favors the bears as the pair stands below the 20-day SMA.
- Canadian Dollar taking a breather amidst easy Friday markets.
- Canada is set for a long weekend and will return on Tuesday with CPI inflation.
- Fedspeak to dominate as investors await signs of Fed rate cuts.
The Canadian Dollar (CAD) is trading softly on a low-volatility Friday, sticking close to the midrange. CAD traders are geared up to knock off for a long weekend, and markets are treading water after a hectic week that saw broader markets kick up rate cut expectations from the Federal Reserve (Fed) after US Consumer Price Index (CPI) inflation growth eased to a three-month low in April.
Canada is set to release its latest CPI inflation update next Tuesday, and Canadian institutions will be shuttered on Monday in observance of Victoria Day. Fedspeak is set to continue dominating headlines as markets look for signs of rate cuts in the face of easing inflation figures that continue to drift toward the Fed’s 2% target range.
Daily digest market movers: Canadian Dollar close to flat as markets ease into weekend mode
- Foreign Portfolio Investment in Canada rose $14.37 billion in March, well above the forecast of $3.51 billion and scrubbing out the previous month’s $-4.28 billion decline, which was revised upwards from $-8.78 billion.
- US CPI inflation cooled this week, tipping markets further into rate cut hopes.
- CME’s FedWatch Tool shows rate traders are pricing in nearly 70% odds of at least a quarter-point cut in September.
- Next week brings a slew of appearances from Fed officials as policymakers from the US central bank head to the Financial Markets Conference hosted by the Federal Reserve Bank of Atlanta.
- Federal Open Market Committee’s (FOMC) latest Meeting Minutes will be released next week, and investors will be looking out for any signs of overly dovish language from Fed deliberations.
Canadian Dollar PRICE Today
The table below shows the percentage change of Canadian Dollar (CAD) against listed major currencies today. Canadian Dollar was the strongest against the Swiss Franc.
| USD | EUR | GBP | JPY | CAD | AUD | NZD | CHF | |
|---|---|---|---|---|---|---|---|---|
| USD | -0.05% | -0.30% | 0.12% | -0.07% | -0.21% | -0.23% | 0.16% | |
| EUR | 0.05% | -0.25% | 0.19% | -0.01% | -0.13% | -0.16% | 0.22% | |
| GBP | 0.30% | 0.25% | 0.44% | 0.26% | 0.12% | 0.08% | 0.46% | |
| JPY | -0.12% | -0.19% | -0.44% | -0.21% | -0.33% | -0.37% | 0.04% | |
| CAD | 0.07% | 0.00% | -0.26% | 0.21% | -0.13% | -0.15% | 0.24% | |
| AUD | 0.21% | 0.13% | -0.12% | 0.33% | 0.13% | -0.03% | 0.35% | |
| NZD | 0.23% | 0.16% | -0.08% | 0.37% | 0.15% | 0.03% | 0.41% | |
| CHF | -0.16% | -0.22% | -0.46% | -0.04% | -0.24% | -0.35% | -0.41% |
The heat map shows percentage changes of major currencies against each other. The base currency is picked from the left column, while the quote currency is picked from the top row. For example, if you pick the Canadian Dollar from the left column and move along the horizontal line to the US Dollar, the percentage change displayed in the box will represent CAD (base)/USD (quote).
Technical analysis: Canadian Dollar middles on quiet Friday session
The Canadian Dollar (CAD) is treading water in familiar territory on Friday, trading within a quarter of a percent across the board. The CAD has gained around a quarter of a percent against the Swiss Franc (CHF) and is down around a quarter of a percent against the Pound Sterling (GBP).
USD/CAD is bidding firmly within recent technical levels with intraday trading stuck to a familiar support and resistance level at 1.3640. Price action remains pinned on the low side of the 200-hour Exponential Moving Average (EMA) at 1.364.
USD/CAD hourly chart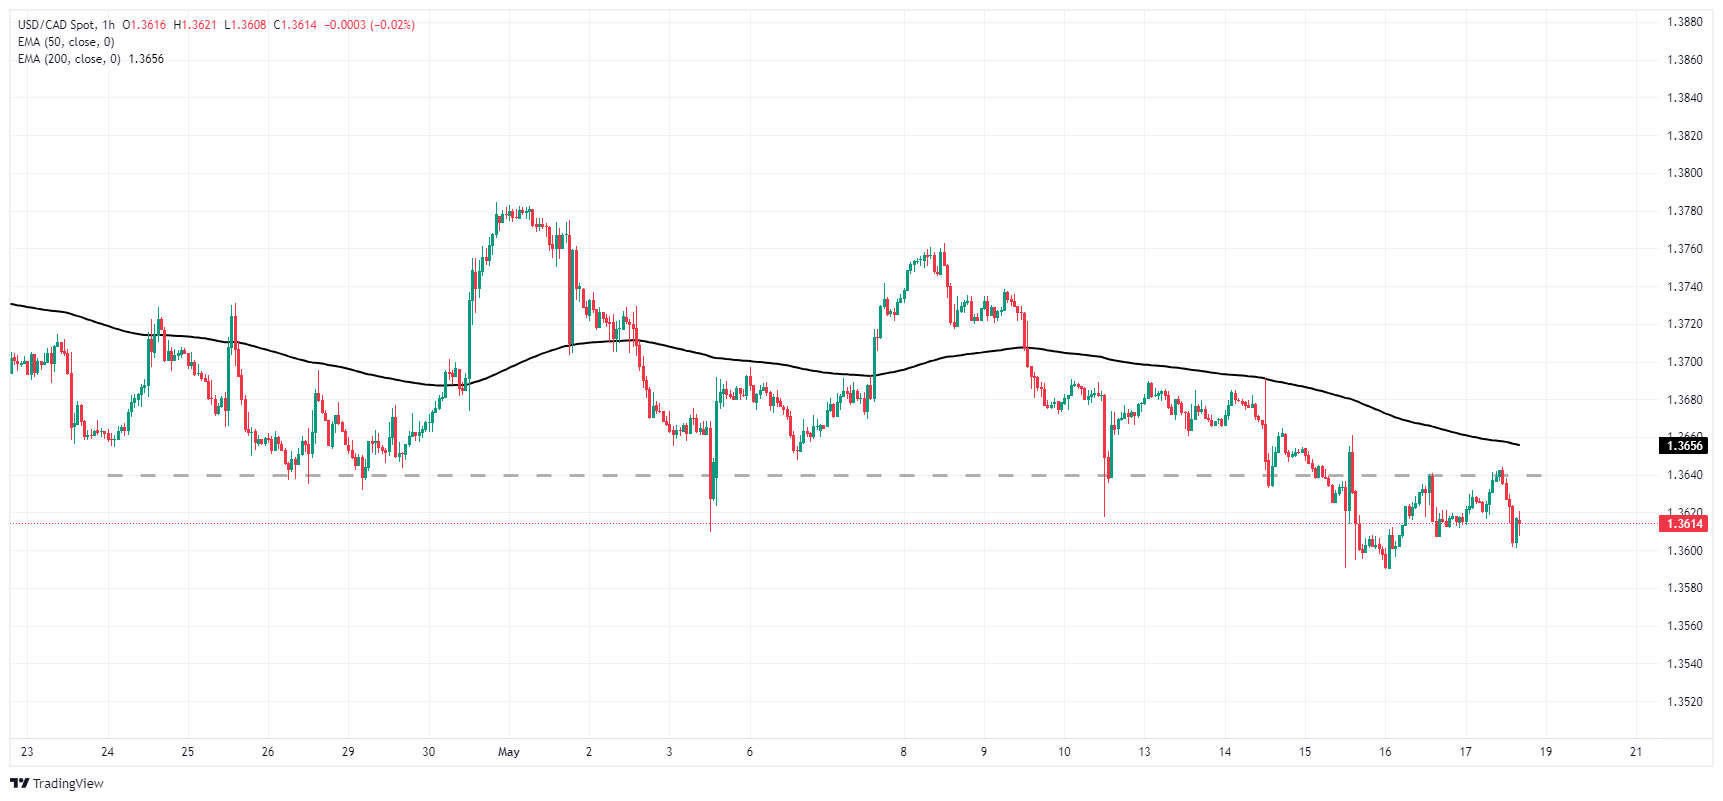
USD/CAD daily chart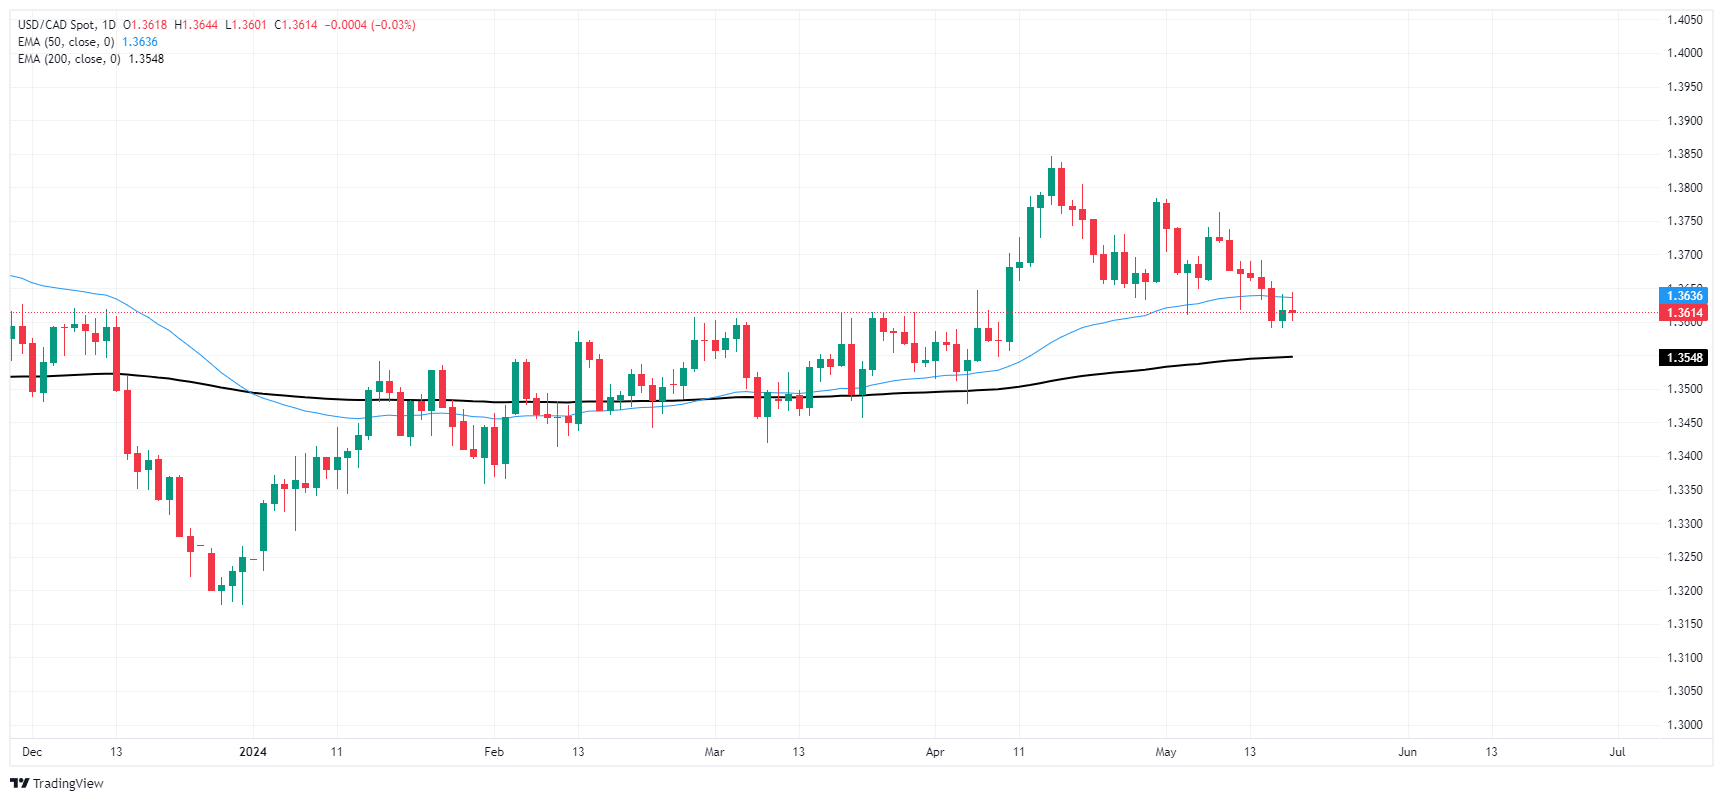
Canadian Dollar FAQs
The key factors driving the Canadian Dollar (CAD) are the level of interest rates set by the Bank of Canada (BoC), the price of Oil, Canada’s largest export, the health of its economy, inflation and the Trade Balance, which is the difference between the value of Canada’s exports versus its imports. Other factors include market sentiment – whether investors are taking on more risky assets (risk-on) or seeking safe-havens (risk-off) – with risk-on being CAD-positive. As its largest trading partner, the health of the US economy is also a key factor influencing the Canadian Dollar.
The Bank of Canada (BoC) has a significant influence on the Canadian Dollar by setting the level of interest rates that banks can lend to one another. This influences the level of interest rates for everyone. The main goal of the BoC is to maintain inflation at 1-3% by adjusting interest rates up or down. Relatively higher interest rates tend to be positive for the CAD. The Bank of Canada can also use quantitative easing and tightening to influence credit conditions, with the former CAD-negative and the latter CAD-positive.
The price of Oil is a key factor impacting the value of the Canadian Dollar. Petroleum is Canada’s biggest export, so Oil price tends to have an immediate impact on the CAD value. Generally, if Oil price rises CAD also goes up, as aggregate demand for the currency increases. The opposite is the case if the price of Oil falls. Higher Oil prices also tend to result in a greater likelihood of a positive Trade Balance, which is also supportive of the CAD.
While inflation had always traditionally been thought of as a negative factor for a currency since it lowers the value of money, the opposite has actually been the case in modern times with the relaxation of cross-border capital controls. Higher inflation tends to lead central banks to put up interest rates which attracts more capital inflows from global investors seeking a lucrative place to keep their money. This increases demand for the local currency, which in Canada’s case is the Canadian Dollar.
Macroeconomic data releases gauge the health of the economy and can have an impact on the Canadian Dollar. Indicators such as GDP, Manufacturing and Services PMIs, employment, and consumer sentiment surveys can all influence the direction of the CAD. A strong economy is good for the Canadian Dollar. Not only does it attract more foreign investment but it may encourage the Bank of Canada to put up interest rates, leading to a stronger currency. If economic data is weak, however, the CAD is likely to fall.
- Mexican Peso climbs sharply as USD/MXN surpasses 2023 low of 16.62.
- Banxico's Deputy Governor Irene Espinosa's comments on rate cuts support Peso's rally.
- US inflation data sparks speculation of Fed rate cuts,with futures market indicating 41 bps reduction by year-end.
The Mexican Peso continues to record gains versus the US Dollar, refreshing its four-week high as the rally continued. In an interview, Bank of Mexico (Banxico) Deputy Governor Irene Espinosa was hawkish, boosting the Mexican currency. Meanwhile, US inflation data revealed during the week was mixed, though it reignited speculation that the Federal Reserve (Fed) would lower interest rates in September. The USD/MXN trades at 16.61, below the 2023 low of 16.62.
Mexico’s economic docket featured Banxico’s Deputy Governor Espinosa, who said the March rate cut was premature and would delay inflation’s convergence to the bank’s target. “The monetary restriction that was needed to maintain convergence (of inflation to the target) within the horizon that we had planned was reduced,” Espinosa said.
In the meantime, US inflation resumed its downtrend after stalling for six months, according to the US Bureau of Labor Statistics (BLS). The core Consumer Price Index (CPI) ebbed lower from 3.8% to 3.6% YoY in April, easing pressure on the Fed.
After the data, US equities rallied to new all-time highs, while the Greenback tumbled sharply, following the path of US Treasury yields. According to the fed funds rate December 2024 futures contract, expectations that the Fed would lower rates jumped from 36 basis points (bps) to 41 bps toward the end of the year.
Data from the CME FedWatch Tool shows odds for a 25 bps rate cut at the September meeting remain at 83%, lower than Thursday’s 87%.
Data-wise, the US Conference Board revealed the Leading Economic Index continued to fall in April. “Another decline in the U.S. LEI confirms that softer economic conditions lay ahead,” said Justyna Zabinska-La Monica, senior manager of business cycle indicators at The Conference Board.
Daily digest market movers: Mexican Peso surges amid Espinosa’s hawkish stance
- Banxico is beginning to split among its members. Governor Victoria Rodriguez Ceja said on Monday that the bank would discuss lowering rates in the upcoming meeting on June 29. Deputy Governor Espinosa commented that lowering rates in March might have delayed inflation convergence toward the central bank’s target by two quarters.
- Mexico’s economic docket next is expected to release Retail Sales on May 20, followed by the Gross Domestic Product (GDP), inflation figures and Banxico’s minutes on May 23.
- April's data show that Mexico’s headline inflation is reaccelerating. However, core prices are falling. This spurred Banxico’s revision to its inflation projections, with the bank expected to hit its 3% target toward the last quarter of 2025, later than March’s estimates for Q2 2025. Core inflation is projected to hit 3% in Q2 2025.
- The CB Leading Index decreased by 0.6% in April to 101.8 (2016=100) after diminishing by 0.3% in March. Over the six-month period between October 2023 and April 2024, the LEI contracted by 1.9% — a smaller decrease than its 3.5% decline over the previous six months.
- The US jobs market continues to slow down after the Nonfarm Payrolls report for April. This, along with the last two Initial Jobless Claims reports, suggests the labor market is cooling, helping the Fed to curb inflation.
- Investors have become optimistic that the Fed may cut rates this year after US inflation data showed the downtrend is resuming, while Retail Sales remained unchanged.
- Richmond Fed President Thomas Barkin stated that inflation is coming down, but that it will “take more time” to hit the Fed’s target.
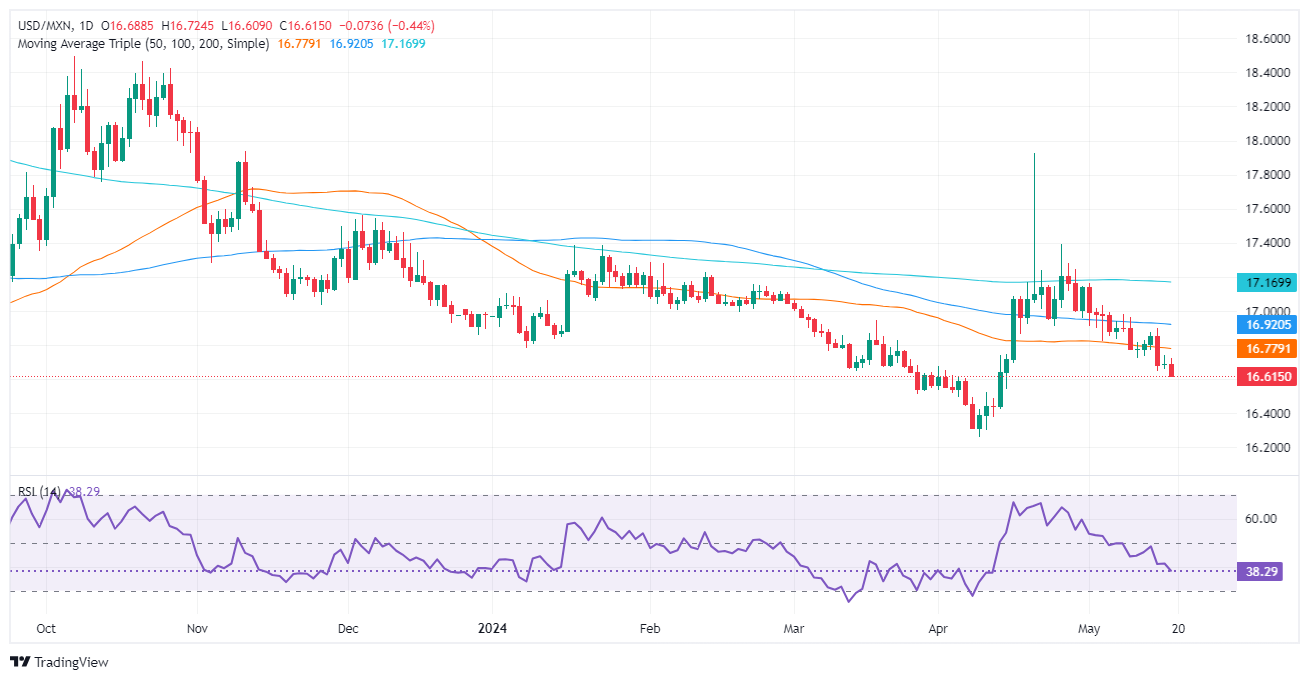
Technical analysis: Mexican Peso climbs sharply as USD/MXN falls below 2023 low
The USD/MXN downtrend continues even though buyers pushed the exchange rate past close to the 50-day Simple Moving Average (SMA) near 16.77. Momentum favors Mexican Peso holders as the Relative Strength Index (RSI) remains in bearish territory, aiming downwards.
If USD/MXN extends its losses beneath the psychological 16.50 figure, that could open the door to test the current year-to-date low of 16.25.
Conversely, if buyers reclaim the 50-day SMA at 16.78, it could exacerbate a rally toward the 100-day SMA at 16.92. Once cleared, the next supply zone would be the 17.00 psychological level. In that event, the next stop would be the 200-day SMA at 17.17.
Mexican Peso FAQs
The Mexican Peso (MXN) is the most traded currency among its Latin American peers. Its value is broadly determined by the performance of the Mexican economy, the country’s central bank’s policy, the amount of foreign investment in the country and even the levels of remittances sent by Mexicans who live abroad, particularly in the United States. Geopolitical trends can also move MXN: for example, the process of nearshoring – or the decision by some firms to relocate manufacturing capacity and supply chains closer to their home countries – is also seen as a catalyst for the Mexican currency as the country is considered a key manufacturing hub in the American continent. Another catalyst for MXN is Oil prices as Mexico is a key exporter of the commodity.
The main objective of Mexico’s central bank, also known as Banxico, is to maintain inflation at low and stable levels (at or close to its target of 3%, the midpoint in a tolerance band of between 2% and 4%). To this end, the bank sets an appropriate level of interest rates. When inflation is too high, Banxico will attempt to tame it by raising interest rates, making it more expensive for households and businesses to borrow money, thus cooling demand and the overall economy. Higher interest rates are generally positive for the Mexican Peso (MXN) as they lead to higher yields, making the country a more attractive place for investors. On the contrary, lower interest rates tend to weaken MXN.
Macroeconomic data releases are key to assess the state of the economy and can have an impact on the Mexican Peso (MXN) valuation. A strong Mexican economy, based on high economic growth, low unemployment and high confidence is good for MXN. Not only does it attract more foreign investment but it may encourage the Bank of Mexico (Banxico) to increase interest rates, particularly if this strength comes together with elevated inflation. However, if economic data is weak, MXN is likely to depreciate.
As an emerging-market currency, the Mexican Peso (MXN) tends to strive during risk-on periods, or when investors perceive that broader market risks are low and thus are eager to engage with investments that carry a higher risk. Conversely, MXN tends to weaken at times of market turbulence or economic uncertainty as investors tend to sell higher-risk assets and flee to the more-stable safe havens.
- Cautious Fed officials and robust Q2 growth limits the USD downside.
- Markets continue to bet that the easing cycle will start in September.
- If data continues to underperform, the Fed might consider a July rate cut.
The US Dollar Index (DXY) is currently trading at 104.50, maintaining a neutral stance. Strong The overall Q2 growth backed by the Federal Reserve’s (Fed) cautious stance has offered mild gains to the US Dollar at the end of the week.
Despite some signs of softness, the US economy continues to exhibit robust growth in Q2 overall, directly influencing the cautious stance adopted by Fed officials. This reluctance to implement rate cuts seems to be keeping the Greenback afloat and limiting the downside.
Daily digest market movers: DXY stands neutral ahead of the weekend, Fed remains cautious
- April's Consumer Price Index (CPI) and Retail Sales figures, plus an increase in weekly Initial Jobless Claims, prompted the US Dollar to lose value earlier this week.
- Raphael Bostic, President Atlanta Fed, speaks positively about inflation progression in April but declares the Fed is not prepared to lower the policy rate.
- Loretta Mester, President of Cleveland Fed, feels the monetary policy positioning is fitting as data comes under review. Thomas Barking of the Richmond Fed believes that current inflation rates still have targets to meet.
- According to CME FedWatch Tool, markets are betting on higher odds of the first cut coming in September.
DXY technical analysis: DXY outlook remains negative despite indicators flattening
The daily chart indicators are exhibiting signals of uncertainty. Despite the Relative Strength Index (RSI) staying flat in negative territory, it does not fully endorse the presence of a robust selling momentum. Similarly, the Moving Average Convergence Divergence (MACD) is flat with red bars, indicating a potential pause in the aggressive bearish trend.
On the flip side, the Simple Moving Averages (SMAs) paint a contrasting picture. The DXY Index, after having sustained a fall and subsequently rebounded at the 100-day SMA, remains below the 20-day SMA. This suggests that the bears had been temporarily holding ground. However, remaining above the 100 and 200-day SMAs indicates that the bulls are not entirely out of the picture.
US Dollar FAQs
The US Dollar (USD) is the official currency of the United States of America, and the ‘de facto’ currency of a significant number of other countries where it is found in circulation alongside local notes. It is the most heavily traded currency in the world, accounting for over 88% of all global foreign exchange turnover, or an average of $6.6 trillion in transactions per day, according to data from 2022. Following the second world war, the USD took over from the British Pound as the world’s reserve currency. For most of its history, the US Dollar was backed by Gold, until the Bretton Woods Agreement in 1971 when the Gold Standard went away.
The most important single factor impacting on the value of the US Dollar is monetary policy, which is shaped by the Federal Reserve (Fed). The Fed has two mandates: to achieve price stability (control inflation) and foster full employment. Its primary tool to achieve these two goals is by adjusting interest rates. When prices are rising too quickly and inflation is above the Fed’s 2% target, the Fed will raise rates, which helps the USD value. When inflation falls below 2% or the Unemployment Rate is too high, the Fed may lower interest rates, which weighs on the Greenback.
In extreme situations, the Federal Reserve can also print more Dollars and enact quantitative easing (QE). QE is the process by which the Fed substantially increases the flow of credit in a stuck financial system. It is a non-standard policy measure used when credit has dried up because banks will not lend to each other (out of the fear of counterparty default). It is a last resort when simply lowering interest rates is unlikely to achieve the necessary result. It was the Fed’s weapon of choice to combat the credit crunch that occurred during the Great Financial Crisis in 2008. It involves the Fed printing more Dollars and using them to buy US government bonds predominantly from financial institutions. QE usually leads to a weaker US Dollar.
Quantitative tightening (QT) is the reverse process whereby the Federal Reserve stops buying bonds from financial institutions and does not reinvest the principal from the bonds it holds maturing in new purchases. It is usually positive for the US Dollar.
The Greenback lost further ground and dropped to multi-week lows on the back of rising expectations of interest rate cuts by the Fed, a view that was further reinforced by lower US CPI data in April
The Greenback remained on the back foot and dragged the USD Index (DXY) to the 104.00 zone amidst an equally downward move in US yields. Weekly Mortgage Applications, Existing Home Sales and FOMC Minutes are all due on May 22. The usual weekly Initial Jobless Claims, the Chicago Fed National Activity Index, New Home Sales and flash Manufacturing and Services PMIs come on May 23, while Durable Goods Orders and the final Michigan Consumer Sentiment are expected on May 24.
EUR/USD maintained its uptrend well in place, advancing for the fifth week in a row and flirting with the key 1.0900 barrier. Germany’s Producer Prices are due on May 20, while EMU Balance of Trade is expected on May 21. On May 23, the advanced Manufacturing and Services PMIs in Germany and the euro bloc and the flash Consumer Confidence gauge in the euro zone will be unveiled. On May 24, the final Q1 GDP Growth Rate in Germany is due.
GBP/USD extended its march north beyond the 1.2700 mark for the first time since mid-March. In the UK docket, the CBI Industrial Trends Orders are due on May 21, seconded by the Inflation Rate and Public Sector Net Borrowing on May 22. May 23 will see the preliminary Manufacturing and Services PMIs, while Retail Sales and the GfK Consumer Confidence are due on May 24.
USD/JPY traded in a choppy fashion, eventually ending the week with marginal losses around 155.50. The Tertiary Industry Index is due on May 20 ahead of the Reuters Tankan Index, Balance of Trade and Machinery Orders all expected on May 22. On May 23, there will be the weekly Foreign Bond Investment and flash Jibun Bank Manufacturing and Services PMIs. The Inflation Rate will close the week on May 24.
AUD/USD resumed the uptrend and closed the week with marked gains, managing to finally surpass the key 0.6700 barrier. On May 21, the Westpac Consumer Confidence Index and the RBA Minutes are due. The flash Judo Bank Manufacturing and Services PMIs are expected on May 23 along with Consumer Inflation Expectations.
Anticipating Economic Perspectives: Voices on the Horizon
- Fed’s Powell speaks on May 19.
- Fed’s Bostic, Barr, Waller and Jefferson speak on May 20 along with BoE’s Broadbent.
- Fed’s Bostic, Barkin, Williams, Waller and Barr speak on May 21. In addition, ECB’s Lagarde, BoE’s Bailey and US Treasury Secretary Yellen are also due to speak.
- Fed’s Bostic, Collins and Mester speak on May 22 seconded by BoE’s Breeden.
- Fed’s Bostic and BoE’s Pill are due to speak on May 23.
- Fed’s Waller and SNB’s Jordan speak on May 24.
Central Banks: Upcoming Meetings to Shape Monetary Policies
- The PBoC holds its meeting on May 20.
- The Hungarian central bank (NBH) meets on May 21.
- The Bank Indonesia (BI) will meet on May 22 along with the RBNZ.
- The Bank of Korea (BoK) and the CBRT meet on May 23.
- GBP/USD reversed Thursday’s losses and hit new weekly high.
- Technical outlook shows a breach of the 100-DMA and key resistance at 1.2631/34.Buyers aim for 1.2803 and YTD high at 1.2894, while a dip below 1.2630 could expose 1.2500 and 200-DMA at 1.2539.
The British Pound registers gains of 0.21% against the US Dollar, although higher US Treasury yields failed to underpin the Greenback. At the time of writing, the GBP/USD pair trades at 1.2703 after bouncing off a daily low of 1.2644.
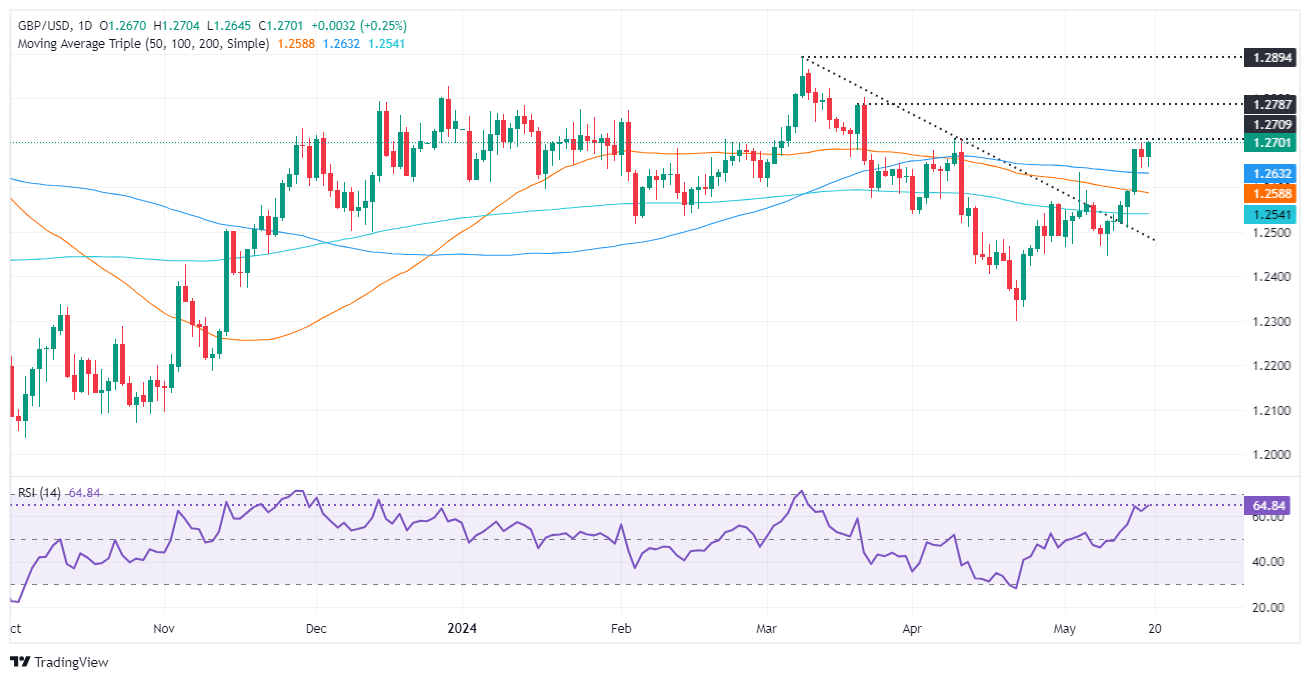
GBP/USD Price Analysis: Technical outlook
The GBP/USD has decisively breached the confluence of the 100-day moving average (DMA) and the May 3 high of 1.2631/34, which exacerbated the rally toward the 1.2690ish region. However, it remains shy of reclaiming the psychological 1.2700, which, once done, would pave the way to challenging the year-to-date (YTD) high.
If the buyers manage to reclaim 1.2700, the next key levels to watch out for would be the March 21 high of 1.2803, followed by the YTD high at 1.2894.
Conversely, sellers would have the upper hand if GBP/USD dives beneath 1.2630. That will immediately expose 1.2500, with the 200-DMA up next at 1.2539.
GBP/USD Price Action – Daily Chart
British Pound PRICE Today
The table below shows the percentage change of British Pound (GBP) against listed major currencies today. British Pound was the strongest against the Swiss Franc.
| USD | EUR | GBP | JPY | CAD | AUD | NZD | CHF | |
|---|---|---|---|---|---|---|---|---|
| USD | -0.07% | -0.24% | -0.06% | -0.11% | -0.18% | -0.19% | 0.07% | |
| EUR | 0.07% | -0.17% | 0.05% | -0.03% | -0.09% | -0.09% | 0.16% | |
| GBP | 0.24% | 0.17% | 0.22% | 0.15% | 0.08% | 0.06% | 0.32% | |
| JPY | 0.06% | -0.05% | -0.22% | -0.09% | -0.14% | -0.17% | 0.11% | |
| CAD | 0.11% | 0.03% | -0.15% | 0.09% | -0.06% | -0.07% | 0.19% | |
| AUD | 0.18% | 0.09% | -0.08% | 0.14% | 0.06% | -0.01% | 0.25% | |
| NZD | 0.19% | 0.09% | -0.06% | 0.17% | 0.07% | 0.01% | 0.27% | |
| CHF | -0.07% | -0.16% | -0.32% | -0.11% | -0.19% | -0.25% | -0.27% |
The heat map shows percentage changes of major currencies against each other. The base currency is picked from the left column, while the quote currency is picked from the top row. For example, if you pick the British Pound from the left column and move along the horizontal line to the US Dollar, the percentage change displayed in the box will represent GBP (base)/USD (quote).
Federal Reserve (Fed) Governor Christopher Waller delivered a prepared speech at the International Organization for Standardization Technical Committee 68 Financial Services 44th Plenary Meeting on Friday but refrained from commenting on the monetary policy or the economic outlook.
"As we navigate the latest wave of technological innovation in payments, the fundamental payment system dynamics and role of technical standards are not new," Waller said. "However, the pace of change is a lot faster now than in the 1910s, when paper checks were used. Collaboration among a broad range of private and public stakeholders can help to establish standards for integrating the new technologies into the payment system."
Summary of Federal Reserve policymakers' speeches after April inflation data: Fed officials recognize inflation progress, remain cautious about policy easing
US Dollar PRICE This week
The table below shows the percentage change of US Dollar (USD) against listed major currencies this week. US Dollar was the weakest against the New Zealand Dollar.
| USD | EUR | GBP | JPY | CAD | AUD | NZD | CHF | |
|---|---|---|---|---|---|---|---|---|
| USD | -0.95% | -1.37% | -0.20% | -0.49% | -1.29% | -1.74% | 0.10% | |
| EUR | 0.95% | -0.47% | 0.74% | 0.44% | -0.38% | -0.82% | 1.03% | |
| GBP | 1.37% | 0.47% | 1.14% | 0.91% | 0.10% | -0.34% | 1.51% | |
| JPY | 0.20% | -0.74% | -1.14% | -0.32% | -1.06% | -1.60% | 0.33% | |
| CAD | 0.49% | -0.44% | -0.91% | 0.32% | -0.78% | -1.26% | 0.51% | |
| AUD | 1.29% | 0.38% | -0.10% | 1.06% | 0.78% | -0.54% | 1.42% | |
| NZD | 1.74% | 0.82% | 0.34% | 1.60% | 1.26% | 0.54% | 1.86% | |
| CHF | -0.10% | -1.03% | -1.51% | -0.33% | -0.51% | -1.42% | -1.86% |
The heat map shows percentage changes of major currencies against each other. The base currency is picked from the left column, while the quote currency is picked from the top row. For example, if you pick the US Dollar from the left column and move along the horizontal line to the Japanese Yen, the percentage change displayed in the box will represent USD (base)/JPY (quote).
Fed FAQs
Monetary policy in the US is shaped by the Federal Reserve (Fed). The Fed has two mandates: to achieve price stability and foster full employment. Its primary tool to achieve these goals is by adjusting interest rates. When prices are rising too quickly and inflation is above the Fed’s 2% target, it raises interest rates, increasing borrowing costs throughout the economy. This results in a stronger US Dollar (USD) as it makes the US a more attractive place for international investors to park their money. When inflation falls below 2% or the Unemployment Rate is too high, the Fed may lower interest rates to encourage borrowing, which weighs on the Greenback.
The Federal Reserve (Fed) holds eight policy meetings a year, where the Federal Open Market Committee (FOMC) assesses economic conditions and makes monetary policy decisions. The FOMC is attended by twelve Fed officials – the seven members of the Board of Governors, the president of the Federal Reserve Bank of New York, and four of the remaining eleven regional Reserve Bank presidents, who serve one-year terms on a rotating basis.
In extreme situations, the Federal Reserve may resort to a policy named Quantitative Easing (QE). QE is the process by which the Fed substantially increases the flow of credit in a stuck financial system. It is a non-standard policy measure used during crises or when inflation is extremely low. It was the Fed’s weapon of choice during the Great Financial Crisis in 2008. It involves the Fed printing more Dollars and using them to buy high grade bonds from financial institutions. QE usually weakens the US Dollar.
Quantitative tightening (QT) is the reverse process of QE, whereby the Federal Reserve stops buying bonds from financial institutions and does not reinvest the principal from the bonds it holds maturing, to purchase new bonds. It is usually positive for the value of the US Dollar.
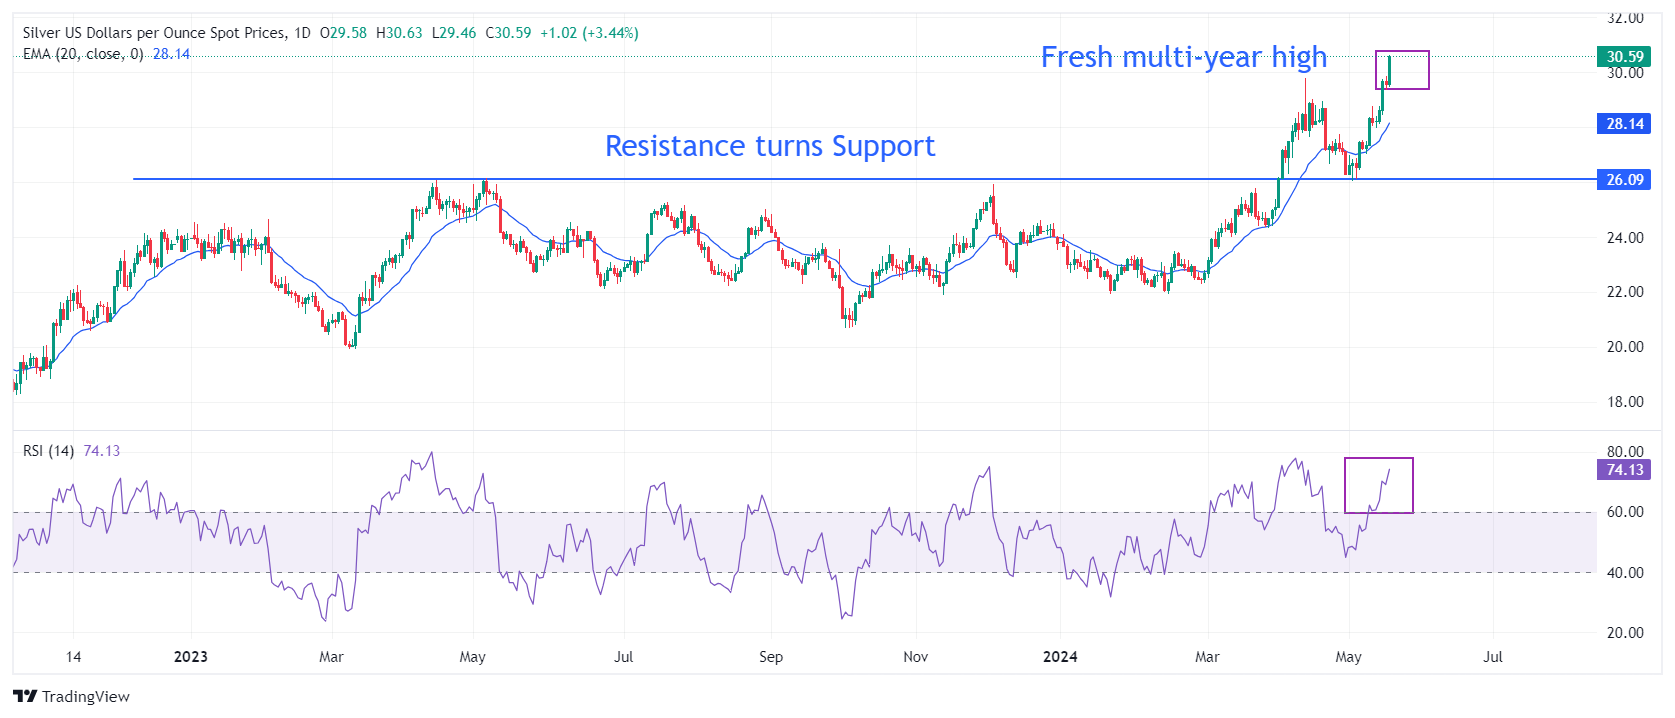
- Silver price prints a fresh multi-year high at $30.50 amid firm speculation for Fed rate cuts.
- The US Dollar falls back as investors see the Fed reducing interest rates from September.
- Fed officials want to see more good inflation data to gain confidence that price pressures will return to the 2% target.
Silver price (XAG/USD) refreshes multi-year high at $30.50 in Friday’s New York session. The white metal strengthens on firm speculation that the Federal Reserve (Fed) will start reducing interest rates from the September meeting.
The confidence of investors for the Fed to begin lowering interest rates from September has strengthened as the United States Consumer Price Index (CPI) report for April has indicated that progress in the disinflation process has resumed after stalling in the January-March period. The scenario is favorable for non-yielding assets such as Silver but weighs on bond yields and the US Dollar.
The US Dollar Index (DXY), which tracks the Greenback’s value against six major currencies, retreats from the intraday high of 104.80.
In spite of an expected decline in the US inflation, Fed officials have maintained a hawkish guidance on interest rates. St. Louis Fed Bank President Loretta Mester said on Thursday inflation will take longer to reach the 2% target than what she previously thought." She emphasized the need to accumulate more data to have a clearer picture of the inflation outlook.
Silver technical analysis
Silver price has posted a fresh multi-year high at $30.55. Earlier, Silver price recovers sharply after discovering buying interest near the horizontal support plotted from 14 April 2023 high around $26.09 on a daily timeframe. The above-mentioned support was earlier a major resistance for the Silver price bulls. The white metal is approaching the multi-year high at $29.80.
The near-term outlook of Silver has improved as it returns above the 20-period Exponential Moving Average (EMA), which trades around $28.10.
The 14-period Relative Strength Index (RSI) shifts into the bullish range of 60.00-80.00, suggesting that a bullish momentum has been triggered.
Silver daily chart
- WTI trades inside Thursday’s trading range ahead of PBoC’s interest rate decision.
- The oil demand outlook has improved as US inflation softens as expected in April.
- Fed policymakers see a one-time decline in inflation as insufficient to roll back restrictive policy stance.
West Texas Intermediate (WTI), futures on NYMEX, are stuck in a tight range slightly below $79.00 in Friday’s New York session. The oil price struggles for a direction as investors shift focus to the People’s Bank of China’s (PBoC) monetary policy decision, which will be announced on Monday.
The PBoC is expected to maintain a dovish stance on interest rates as the Chinese economy is still recovering from low consumer price inflation due to weak consumer spending. Investors should note that China is the largest importer of Oil in the world and the maintenance of expansionary policy stance by the PBoC improves its near-term outlook.
Meanwhile, the decline in the United States inflation has also improved prospects of the oil demand. The expected fall in the US inflation as indicated by the Consumer Price Index (CPI) report for April has boosted expectations that the Federal Reserve (Fed) will start reducing interest rates from the September meeting.
However, Fed officials have not convinced that inflation is on track to return to the desired rate of 2%. On Thursday, New York Fed Bank President John Williams said the monetary policy is restrictive and is in a good place. He doesn’t see any economic indicator suggesting the need to change the stance of monetary policy now. When asked about the inflation outlook, Williams said, “In the very near term, I don't expect to get that greater confidence that we need to see on inflation progress towards a 2% goal," Reuters reported.
The article was corrected on May 17 at 14:18 GMT to state that "China" is the largest importer of Oil in the world, not Canada.
- EUR/GBP has declined to support from a cluster of Moving Averages.
- The pair has reached a pivotal level within a range that has been unfolding since January.
- In the absence of any bullish signs it could continue falling to the range floor as the sideways trend extends.
EUR/GBP has continued falling within a multi-month range that began in January 2024.
The pair has declined to support from two major moving averages – the 50 and 100-day Simple Moving Averages (SMA) – situated at 0.8566-67.
EUR/GBP Daily Chart
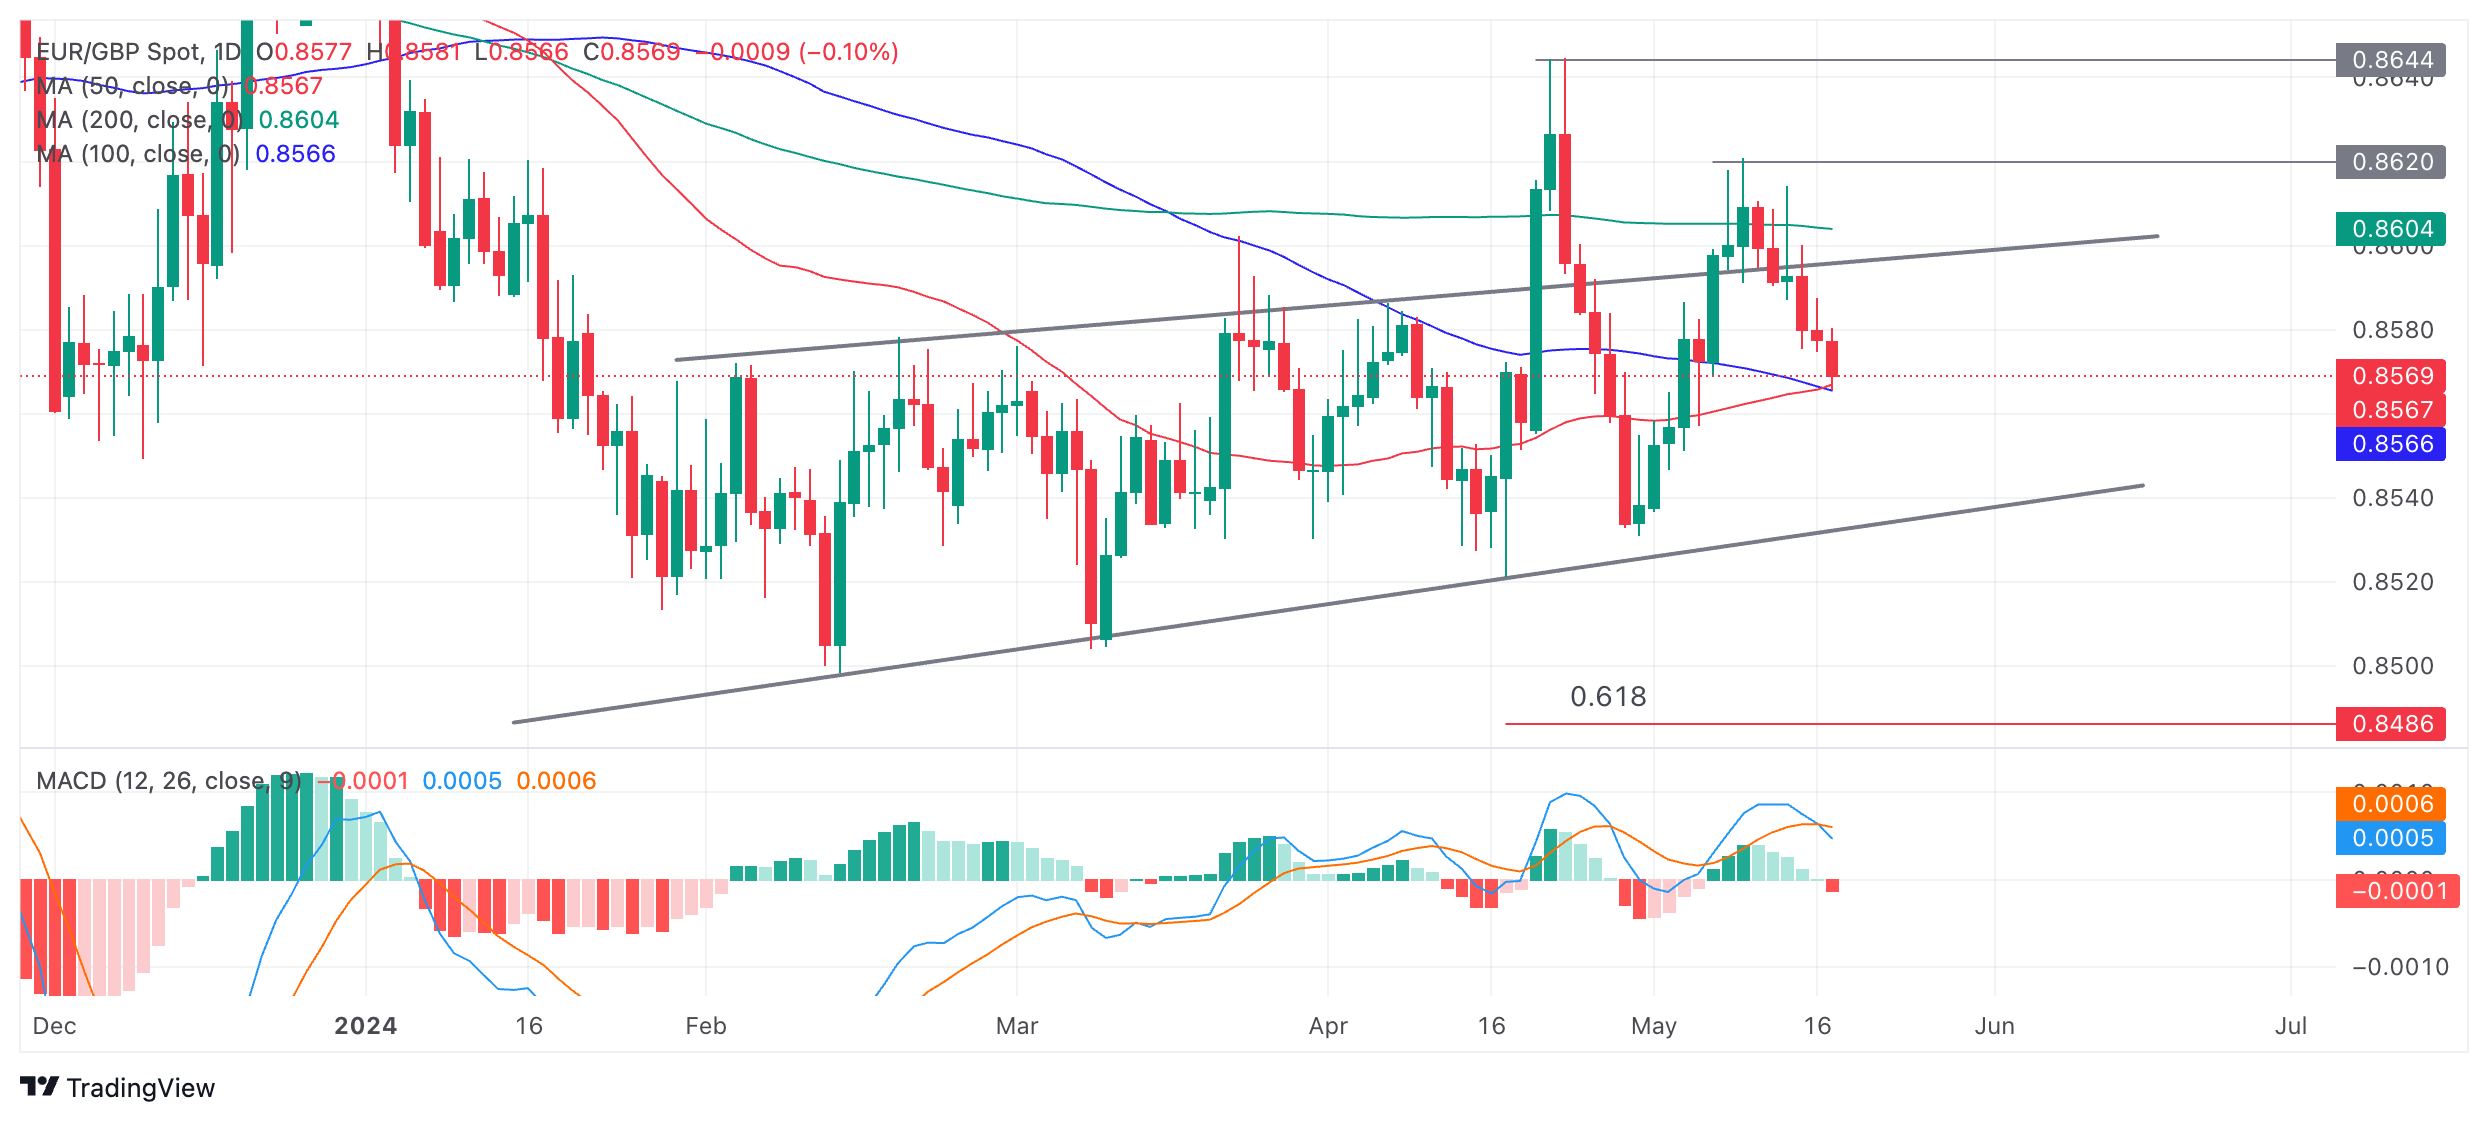
The Moving Average Convergence Divergence (MACD) indicator has crossed below its red signal line, providing further bearish evidence suggesting EUR/GBP could continue descending within its range/channel.
Given the bearish tone of the charts, EUR/GBP could now break below the support from the SMAs and continue falling to the range low at circa 0.8540.
There is also a possibility, however, that EUR/GBP could recover from support at the SMAs. If so, it could start rising to the ceiling of the range at 0.8600. At the moment, however, there is no indication from price action that such a bullish short-term reversal is underway.
- USD/JPY rebounds sharply to 156.00 amid a firm recovery in the US Dollar.
- Fed officials one good inflation data as incapable for unwinding the restrictive policy stance.
- Japan’s weak GDP deepens fears of BoJ’s limited scope for policy-tightening.
The USD/JPY pair extends its recovery to 156.00 in Friday’s European session. The asset strengthens as the US Dollar rebounds strongly after the Federal Reserve (Fed) ruled out expectations of rate cuts despite an expected decline in the United States (US) Consumer Price Index (CPI) data for April.
On Thursday, the communication from Fed policymakers suggested that one-time decline in the consumer price inflation in sufficient to indicate a change in the overall trend. New York Fed Bank President John Williams said he doesn’t see any economic indicator suggesting the need to change the stance of monetary policy now. When asked about the inflation outlook, Williams said, “In the very near term, I don't expect to get that greater confidence that we need to see on inflation progress towards a 2% goal," Reuters reported.
The situation of restrictive interest rate stance by the Fed for a longer period is favorable for the US Dollar and bond yields. The US Dollar Index (DXY), which tracks the Greenback’s value against six major currencies, rise to 104.70. 10-year US Treasury yields rise to 4.39%.
Meanwhile, the speculation for the Fed to begin reducing interest rates from the September meeting remains firm. The CME FedWacth tool shows that the probability of interest rates declining from the current levels in September is 68%, which has come down from 73% recorded after the release of the soft inflation data.
On the Japan front, weak Q1 Gross Domestic Product (GDP) data has prompted fresh challenges for the Bank of Japan (BoJ) with their agenda of tightening monetary policy further. The Japanese economy contracted at a higher pace of 0.5% from the estimates of 0.4%.
- The Japanese Yen softened on Friday as BoJ’s Ueda faced questions in parliament.
- The Yen is trading flat for the week, unable to hold on to gains against the Greenback.
- The US Dollar Index extends recovery for a second day after Wednesday’s meltdown.
The Japanese Yen (JPY) trades flat for the week, posting a second day of losses against the US Dollar (USD) on Friday. The JPY is struggling against the Dollar during the latter part of the week, almost reversing the surge it registered on Wednesday against the US Dollar after the US Consumer Price Index (CPI) report showed inflation pressures are easing. Bank of Japan (BoJ) President Kazuo Ueda faced on Friday questions in the parliament on monetary policy and recent market events, but investors reacted rather tepidly as he didn’t provide any real market-moving comments.
Meanwhile, the DXY US Dollar Index – which gauges the value of the US Dollar against a basket of six foreign currencies – is trying to extend recovery from the steep decline it faced after the CPI data for April. However, there are not many reasons left for the Greenback to outperform. The interest rate differential could still provide some strength to the US Dollar, but the economic data is no longer really outperforming and inflation is back on track towards its disinflationary path.
Daily digest market movers: A very empty calendar ahead
- Friday’s economic calendar doesn’t include any release for the US, so market participants can digest recent data while a slew of US Federal Reserve (Fed) officials are set to speak before the close of the week:
- At 14:15 GMT, Federal Reserve Bank of Minneapolis President Neel Kashkari will have opening remarks at the International Organization for Standardization Technical Committee 68 (ISO/TC 68) financial services plenary meeting.
- Kashkari will introduce Federal Reserve Governor Christopher Waller, who will give a speech about payment innovation at the same stage.
- Near 16:15 GMT, Federal Reserve Bank of San Francisco President Mary Daly delivers a speech at the University of San Francisco School of Management commencement ceremony.
- Daly and Waller are both voting members of the Federal Open Market Committee (FOMC) this year.
- Equities trade mixed on Friday. Japan has closed off, with the Topix up 0.30% and the Nikkei down 0.34% on the day, while US equity futures are still looking for direction ahead of the US opening bell.
- The CME Fedwatch Tool suggests a 91.3% probability that June will still see no change to the Federal Reserve's fed fund rate. Odds have changed for September, with the tool showing a 50.5% chance that rates will be 25 basis points lower than current levels.
- The benchmark 10-year US Treasury Note trades around 4.39%, and hovers near the lower levels for this week. The benchmark 10-year Japan Treasury Note (JGB) trades around 0.949%, and is just a touch below the high of this week at 0.957%.
USD/JPY Technical Analysis: Dollar buyers are sitting where they are
The USD/JPY pair still has some room to go, with buyers who bought at that 153.00 area not really taking much profit, seeing that no chunky outflows are being noticed. This creates a small imbalance in the trade which sees buyers willing to pay higher prices to get in. Although a revisit to the 160.00 area looks a bit of a stretch, a recovery to 156.74 first and 158.00 next could be in the cards, likely to open the risk again of another intervention.
Bank of Japan FAQs
The Bank of Japan (BoJ) is the Japanese central bank, which sets monetary policy in the country. Its mandate is to issue banknotes and carry out currency and monetary control to ensure price stability, which means an inflation target of around 2%.
The Bank of Japan has embarked in an ultra-loose monetary policy since 2013 in order to stimulate the economy and fuel inflation amid a low-inflationary environment. The bank’s policy is based on Quantitative and Qualitative Easing (QQE), or printing notes to buy assets such as government or corporate bonds to provide liquidity. In 2016, the bank doubled down on its strategy and further loosened policy by first introducing negative interest rates and then directly controlling the yield of its 10-year government bonds.
The Bank’s massive stimulus has caused the Yen to depreciate against its main currency peers. This process has exacerbated more recently due to an increasing policy divergence between the Bank of Japan and other main central banks, which have opted to increase interest rates sharply to fight decades-high levels of inflation. The BoJ’s policy of holding down rates has led to a widening differential with other currencies, dragging down the value of the Yen.
A weaker Yen and the spike in global energy prices have led to an increase in Japanese inflation, which has exceeded the BoJ’s 2% target. Still, the Bank judges that the sustainable and stable achievement of the 2% target has not yet come in sight, so any sudden change in the current policy looks unlikely.
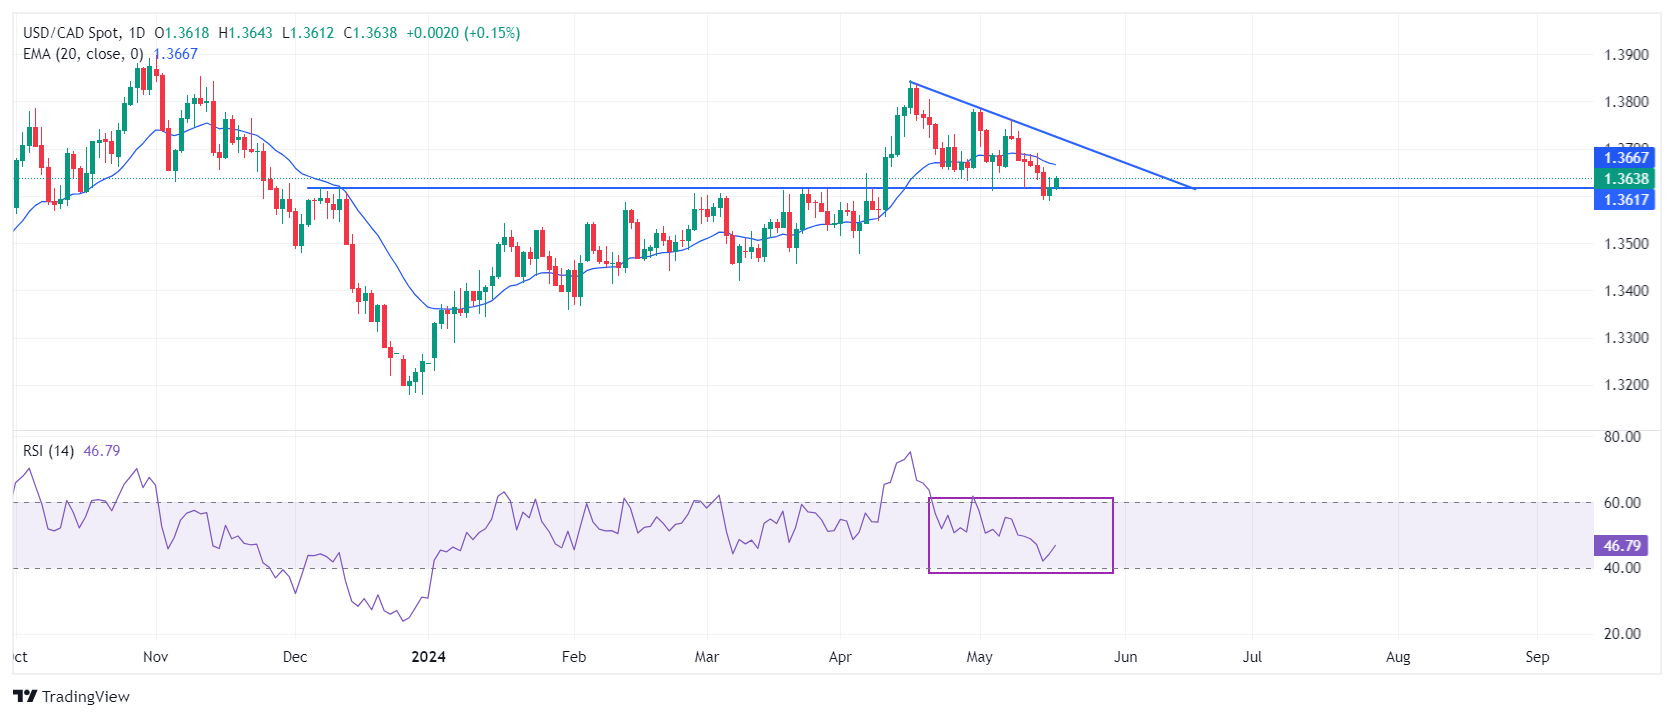
- USD/CAD bounces back to 1.3640 amid a firm recovery in the US Dollar.
- Fed officials endorse a restrictive policy stance for longer due to weak conviction over inflation returning to 2%.
- Investors await the Canada CPI data to project the next move in the Canadian Dollar.
The USD/CAD pair rises further to 1.3640 in Friday’s European session. The Loonie asset capitalizes on strong recovery in the US Dollar that is driven by hawkish guidance on interest rates by Federal Reserve (Fed) officials.
The US Dollar Index (DXY) bounces back to 104.75 from a five-week low of 104.00 posted on Thursday. The market sentiment turns cautious as Fed policymakers see one good consumer inflation print as insufficient to build their confidence that price pressures will sustainably return to the desired rate of 2%. Therefore, Fed policymakers emphasized keeping interest rates at their current levels for a longer period. This scenario is favorable for interest-bearish assets, such as bond yields. 10-year US Treasury yields rise to 4.39%. S&P 500 futures remain subdued in the European session.
Meanwhile, investors await Canada’s Consumer Price Index (CPI) data for April, which will be published on Tuesday. The consumer inflation data will significantly influence market expectations for rate cuts by the Bank of Canada (BoC), which investors expect will begin from the June meeting.
USD/CAD rebounds after discovering buying interest near the horizontal support plotted from December 7 high at 1.3620 on a daily timeframe. The downward-sloping trendline from April 16 high at 1.3846 is acting as a major carrier for the US Dollar bulls. The near-term outlook is uncertain as the asset is trading below the 20-day Exponential Moving Average (EMA), which trades around 1.3667.
The 14-period Relative Strength Index (RSI) remains inside the 40.00-60.00 range, suggesting a sharp volatility contraction.
Fresh buying opportunity would emerge if the asset breaks above April 30 high at 1.3785. This would drive the asset towards April 17 high at 1.3838, followed by the round-level resistance of 1.3900.
In an alternate scenario, a breakdown below May 3 low around 1.3600 will expose the asset to the April 9 low around 1.3547 and the psychological support of 1.3500.
USD/CAD daily chart
Economic Indicator
BoC Consumer Price Index Core (YoY)
The BoC Consumer Price Index Core, released by the Bank of Canada (BoC) on a monthly basis, represents changes in prices for Canadian consumers by comparing the cost of a fixed basket of goods and services. It is considered a measure of underlying inflation as it excludes eight of the most-volatile components: fruits, vegetables, gasoline, fuel oil, natural gas, mortgage interest, intercity transportation and tobacco products. The YoY reading compares prices in the reference month to the same month a year earlier. Generally, a high reading is seen as bullish for the Canadian Dollar (CAD), while a low reading is seen as bearish.
Read more.Next release: Tue May 21, 2024 12:30
Frequency: Monthly
Consensus: -
Previous: 2%
Source: Statistics Canada
- The US Dollar was able to eke out gains on Thursday after the steep decline from Wednesday.
- The Greenback edges further up ahead of a slew of Fed speakers taking the stage on Friday.
- The US Dollar Index flirts with a jump back above 104.70 towards 105.00
The US Dollar (USD) is continuing its recovery on Friday for a second day in a row after the steep decline seen on Wednesday, which marked this week for the Greenback. Markets have priced in two interest-rate cuts for 2024 due to the lower Consumer Price Index (CPI) data for April released of this week. However, markets are not out of the woods just yet with rate cut expectations as several Federal Reserve (Fed) officials pushing back against enthusiasm, calling to put the cork back on the champagne bottle as rates might be staying higher for longer than expected.
On the economic data front, it will be a very calm Friday with no real data points of importance available for the US Dollar to move on. Still, a fresh can of Fed speakers are lined up to speak, with Federal Reserve Bank of Minneapolis President Neel Kashkari making a second appearance this week. Federal Reserve Governor Christopher Waller is always good for a few market-moving comments, and right at the end of this Friday, Federal Reserve Bank of San Francisco President Mary Daly will wrap up the week.
Daily digest market movers: Ideal for dust to settle
- Friday’s economic calendar doesn’t include any data points for the US to be released.
- Markets can digest all of this week’s data while a slew of Fed officials are set to close off the week:
- At 14:15 GMT, Federal Reserve Bank of Minneapolis President Neel Kashkari will have opening remarks at the International Organization for Standardization Technical Committee 68 (ISO/TC 68) financial services plenary meeting.
- Fed’s Kashkari will be followed by Federal Reserve Governor Christopher Waller, who will give a speech about payment innovation at the same stage.
- Near 16:15 GMT, Federal Reserve Bank of San Francisco President Mary Daly delivers a speech at the University of San Francisco School of Management commencement ceremony.
- Fed’s Daly and Waller are both voting members of the Federal Open Market Committee (FOMC) this year.
- Equities trade very mixed this Friday. European main indices are on the back foot, while US futures are still struggling for direction.
- The CME Fedwatch Tool suggests a 91.3% probability that June will still see no change to the Federal Reserve's fed fund rate. Odds have changed for September, with the tool showing a 50.5% chance that rates will be 25 basis points lower than current levels.
- The benchmark 10-year US Treasury Note trades around 4.36%, and recovers from the lowest level for this month at 4.34%.
US Dollar Index Technical Analysis: A negative week
The US Dollar Index (DXY) is further building on its recovery with, for now, a second day of green on the screen. However, the substantial slide from Wednesday looks to be too big to overcome for this week and will likely result in a negative end closing this Friday evening for the DXY.
The question is if the Greenback has enough reason to rally. Even though Fed officials are pushing back against upcoming interest-rate cuts, several economic data points this week from both leading and lagging indicators are starting to ease, which does not support the thesis that the US – its economy and its Dollar – is outperforming.
On the upside, several levels need to be regained again after Wednesday’s firm correction. The first is the 55-day Simple Moving Average (SMA) at 104.68, together with a pivotal level at 104.60. The next step up will be 105.12 and 105.52.
On the downside, the 100-day SMA around 104.11 is the last man standing to support the decline. Once that snaps, an air pocket is placed between 104.11 and 103.00. Should US Dollar outflows persist, the low of March at 102.35 and the low from January at 100.61 are levels to keep into consideration.
US Dollar FAQs
The US Dollar (USD) is the official currency of the United States of America, and the ‘de facto’ currency of a significant number of other countries where it is found in circulation alongside local notes. It is the most heavily traded currency in the world, accounting for over 88% of all global foreign exchange turnover, or an average of $6.6 trillion in transactions per day, according to data from 2022. Following the second world war, the USD took over from the British Pound as the world’s reserve currency. For most of its history, the US Dollar was backed by Gold, until the Bretton Woods Agreement in 1971 when the Gold Standard went away.
The most important single factor impacting on the value of the US Dollar is monetary policy, which is shaped by the Federal Reserve (Fed). The Fed has two mandates: to achieve price stability (control inflation) and foster full employment. Its primary tool to achieve these two goals is by adjusting interest rates. When prices are rising too quickly and inflation is above the Fed’s 2% target, the Fed will raise rates, which helps the USD value. When inflation falls below 2% or the Unemployment Rate is too high, the Fed may lower interest rates, which weighs on the Greenback.
In extreme situations, the Federal Reserve can also print more Dollars and enact quantitative easing (QE). QE is the process by which the Fed substantially increases the flow of credit in a stuck financial system. It is a non-standard policy measure used when credit has dried up because banks will not lend to each other (out of the fear of counterparty default). It is a last resort when simply lowering interest rates is unlikely to achieve the necessary result. It was the Fed’s weapon of choice to combat the credit crunch that occurred during the Great Financial Crisis in 2008. It involves the Fed printing more Dollars and using them to buy US government bonds predominantly from financial institutions. QE usually leads to a weaker US Dollar.
Quantitative tightening (QT) is the reverse process whereby the Federal Reserve stops buying bonds from financial institutions and does not reinvest the principal from the bonds it holds maturing in new purchases. It is usually positive for the US Dollar.
- AUD/USD has reached the bullish target for a price pattern that formed at the April 19 lows.
- It is currently correcting back but the overall uptrend suggests it will recover.
- Support from the zone around the trendline is likely to provide the springboard for a reversal higher.
AUD/USD reached a key upside target on May 16 and has retraced. The pair is in a short-term uptrend and the pull back is likely to be a temporary correction before the uptrend continues.
AUD/USD 4-hour Chart
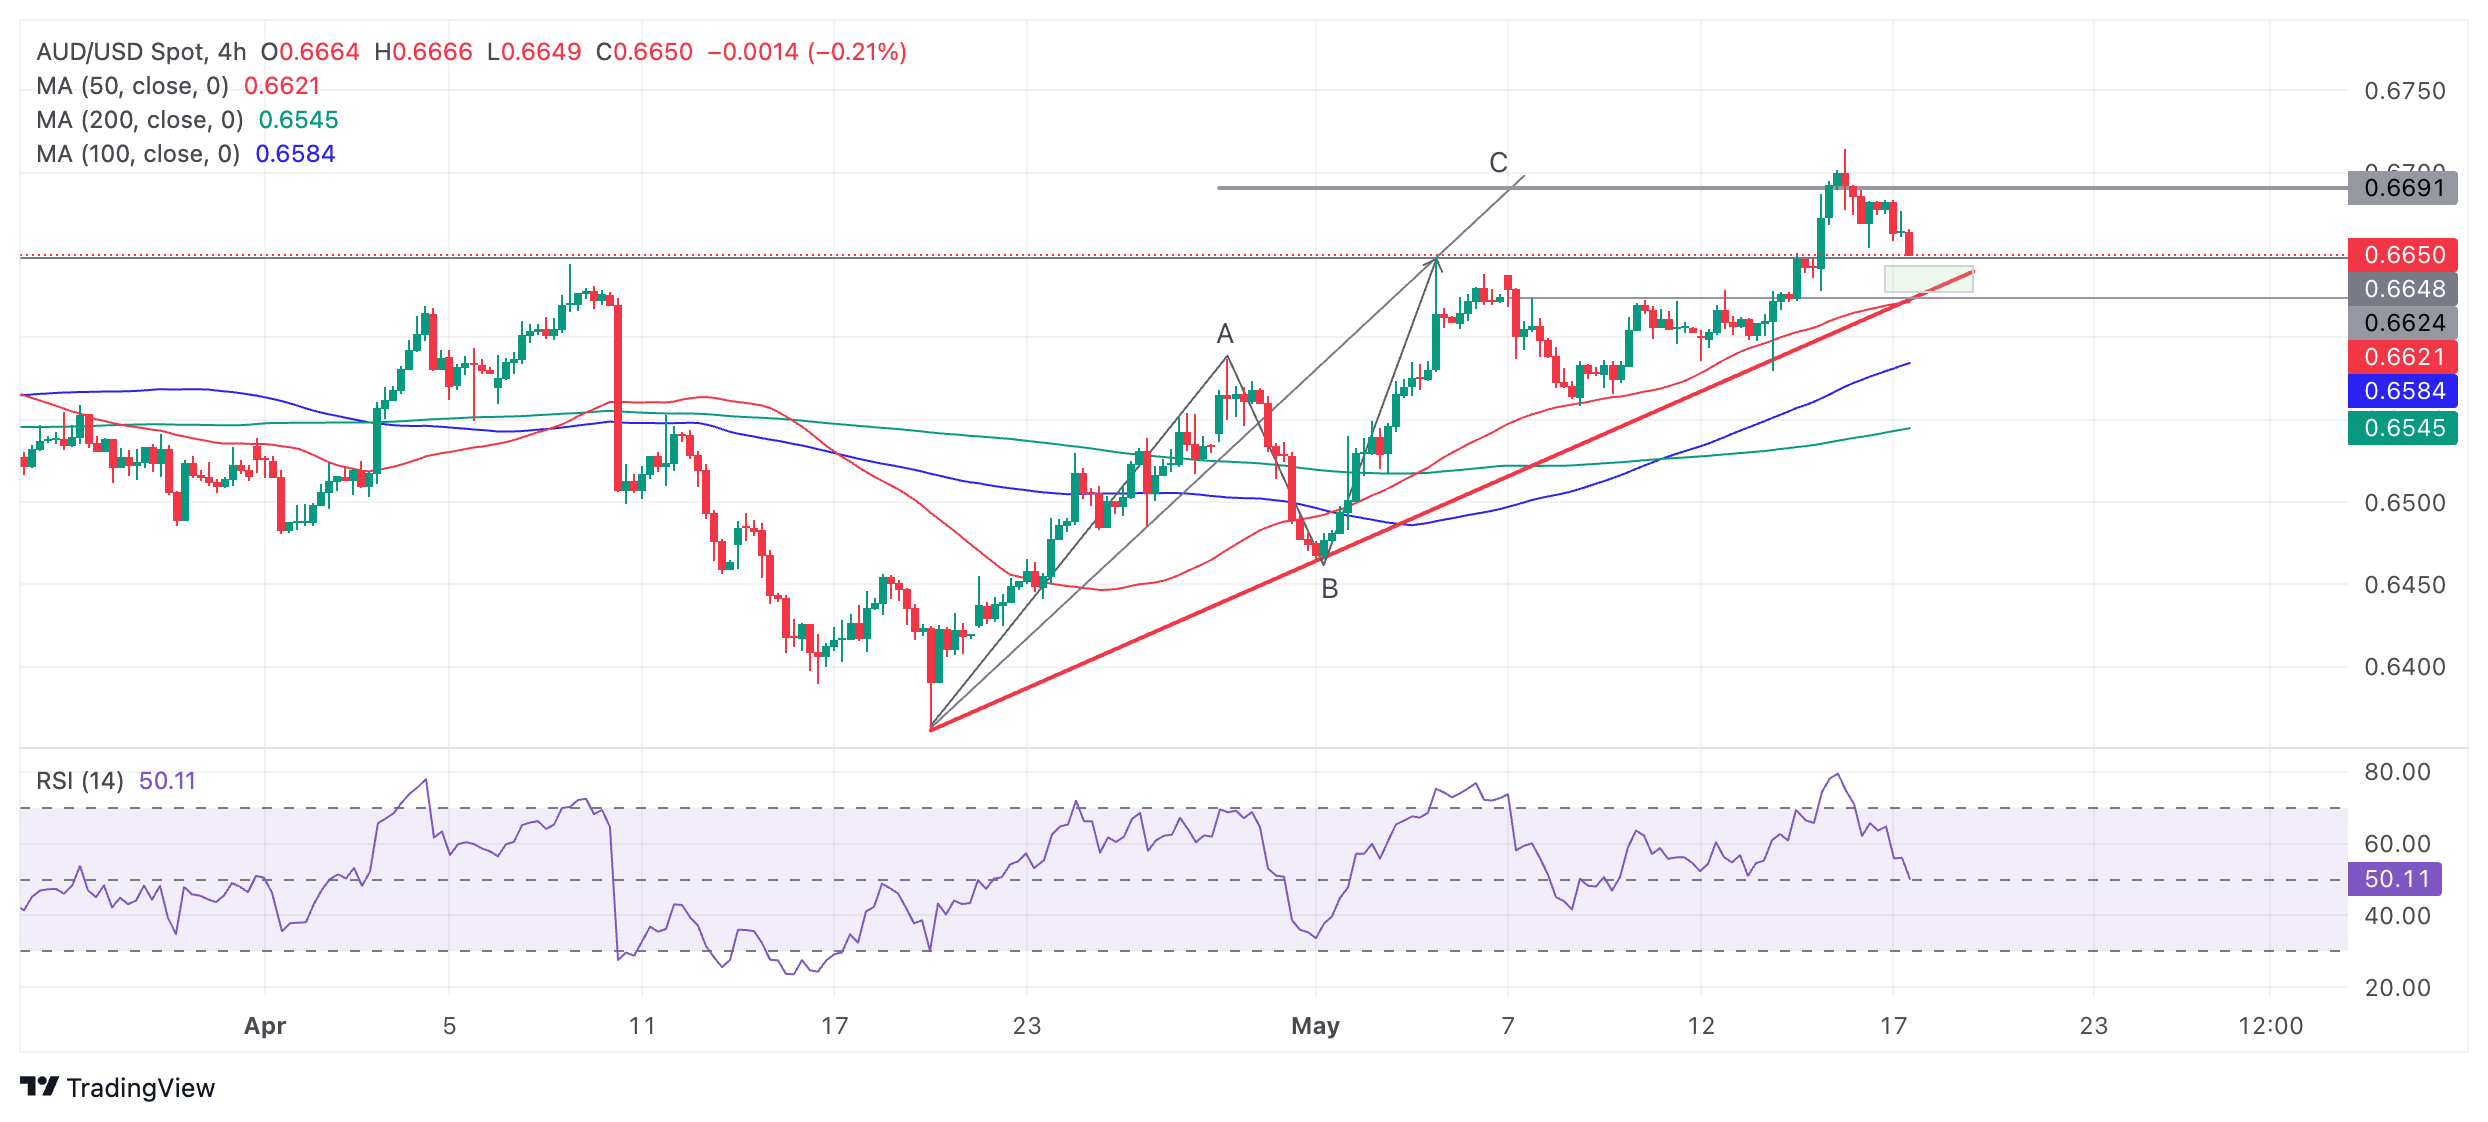
AUD/USD will probably find support at the red trendline for the move up and then reverse and start moving higher again. There are no signs yet it is resuming its uptrend however.
A break above the 0.6714 high of May 16 will create a higher high and confirm a continuation of the uptrend.
The pair has now reached the target for the Measured Move pattern which formed from the April 19 lows. Measured Moves are zig-zag like patterns composed of three waves, usually labeled A, B and C. The general expectation is that wave C will reach either the same length as A or a Fibonacci 0.681 ratio of A.
Wave C has now fulfilled both these targets.
A decisive break below the red trendline would be a bearish sign and could denote a change of the short-term trend.
Decisive would be characterized as a break that was accompanied by a long red candle that closed near its low or three red candles in a row that broke through the trendline.
- Gold ticks higher on Friday after strong data from China, the nation with the greatest demand for Gold.
- Economists caution Chinese growth is “uneven”, however, and government stimulus is key.
- XAU/USD is in a short-term uptrend and may start climbing again after pulling back.
Gold price (XAU/USD) is trading three-tenths of a percent higher on Friday, in the $2,380s, helped by positive data from China that brightened the prospects for the country with the world’s largest market for Gold.
In the US, meanwhile, a raft of secondary data released on Thursday came out mixed and Federal Reserve (Fed) officials repeated their mantra that inflation was still not coming down fast enough to contemplate cutting interest rates, with an overall neutralizing effect on Gold price.
Gold had been rallying after cooler US inflation data and weak US Retail Sales released on Wednesday suggested the Fed might be closer to cutting interest rates than previously thought. The expectation of lower interest rates increases the attractiveness of non-yielding Gold to investors.
Gold price rises after China data shows improvement
Gold got a shot in the arm on Friday after Chinese Industrial Production showed an expectation-beating 6.7% rise year-over-year in April, according to data from the National Bureau of Statistics of China. Economists had forecast a more modest 5.5%. The figure was substantially higher than the 4.5% reading registered in March.
Chinese growth “uneven”
Despite the positive data, some economists remain skeptical about Chinese growth, describing it as “uneven”.
“Activity data for April suggested growth remained uneven. Growth was supported by investment growth and exports, while consumption slowed,” said Tommy Wu, Senior Economist at Commerzbank.
Fiscal spending key
Wu says greater fiscal spending is required to keep growth momentum steady and points out that the Chinese government is starting to sell sovereign bonds in order to boost spending. Much of the country’s growth expectations depend on whether the government sticks to its spending plans, he adds.
The government is also working on comprehensive solutions to the housing crisis. A plan for local governments and state-owned enterprises (SOEs) to buy unsold homes should help absorb inventory and prop up the ailing sector. Further, the PBoC has loosened restrictions on first-time buyers by lowering the minimum deposit to 15% from 25% and “scrapping the mortgage rate floor for first and second home buyers.”
Impact of US tariffs minor
As far as US tariffs on EVs and solar panels goes, Wu says the effect is likely to be minor given China only exports a small percentage of its EVs to the US and most Chinese solar panels are sold through intermediate countries without high tariffs.
Technical Analysis: Gold price rising in channel
Gold price (XAU/USD) pulls back after rising to within a whisker of resistance at $2,400.
The precious metal has been rising in a channel since the May 2 lows, however, suggesting the short-term trend is bullish and more upside is eventually expected.
XAU/USD 4-hour Chart
The Relative Strength Index (RSI) has fallen back out of the overbought zone, suggesting renewed potential for more upside.
A break above $2,400 would likely see it rally to the next resistance level at $2,417 (the April 19 high), followed by $2,430 – the all-time high.
The medium and long-term charts (daily and weekly) are also bullish, adding a supportive backdrop for Gold.
Economic Indicator
Industrial Production (YoY)
Industrial output is released by the National Bureau of Statistics of China. It shows the volume of production of Chinese Industries such as factories and manufacturing facilities. A surge in output is regarded as inflationary which would prompt the People’s Bank of China would tighten monetary policy and fiscal policy risk. Generally speaking, if high industrial production growth comes out, this may generate a positive sentiment (or bullish) for the CNY, whereas a low reading is seen as negative (or Bearish) for the CNY.
Read more.Last release: Fri May 17, 2024 02:00
Frequency: Monthly
Actual: 6.7%
Consensus: 5.5%
Previous: 4.5%
- EUR/USD drops below 1.0900 as the US Dollar rebounds after many Fed officials vow to maintain interest rates at their current levels for longer.
- Fed policymakers see one good inflation report as insufficient to change the trend.
- ECB’s Schnabel also highlighted risks from premature interest-rate cuts.
EUR/USD drops to 1.0840 in Friday’s European session as market sentiment over upcoming interest-rate cuts turns slightly cautious after Federal Reserve (Fed) policymakers supported keeping the monetary policy stance restrictive for a longer period. These comments helped the US Dollar lick its wounds after the sharp fall induced by the decline in the United States (US) inflation in April, as shown by the Consumer Price Index (CPI) report released on Wednesday.
The corrective move in the major currency pair seems purely the outcome of the US Dollar’s recovery. However, the appeal for the Euro also remains upbeat as European Central Bank (ECB) policymakers are also casting doubts over the need to extend the rate-cut cycle immediately after a widely anticipated June rate cut.
In the early London session, ECB Board member Isabel Schnabel said the path beyond the June rate cut is uncertain. Schnabel added recent inflation data suggested that the last mile in the disinflation process is the most difficult, adding that she remained cautious about upside risks to inflation that could arise from premature rate cuts.
Daily digest market movers: EUR/USD comes down as US Dollar bounces back
- EUR/USD corrects from recent highs of 1.0900 as the US Dollar recovers after posting a fresh monthly low. The US Dollar Index (DXY), which tracks the Greenback’s value against six major currencies, finds buying interest near 104.00 and rebounds to 104.60.
- The USD Index recovers after a slew of Federal Reserve (Fed) policymakers emphasized the need to keep interest rates at their current levels for a longer period on Thursday. Fed policymakers seem to keep a broadly hawkish stance on the interest-rate outlook, stating that one good US inflation data after a series of disappointments could not turn the table to rate cuts.
- On Thursday, New York Fed Bank President John Williams said the monetary policy is restrictive and is in a good place. He doesn’t see any economic indicator suggesting the need to change the stance of monetary policy now. When asked about the inflation outlook, Williams said: “In the very near term, I don't expect to get that greater confidence that we need to see on inflation progress towards a 2% goal," Reuters reported.
- While markets aren’t yet fully convinced that the US is back on the disinflation path, there are increasing concerns that the US labor market is losing its strength, which could keep firm odds for rate cuts in the September meeting intact. The uncertainty about US job market strength has escalated due to rising weekly Initial Jobless Claims.
- The US Department of Labor reported on Thursday that individuals claiming jobless benefits for the first time for the week ending May 10 rose to 222K from the consensus of 220K. Although claims were lower than the prior reading of 232K, which was the highest level in eight months. Higher jobless claims indicate lower job opportunities or companies laying off employees or a mix of both. In April, the increase in Nonfarm Payrolls (NFP) was also significantly lower than estimates.
Technical Analysis: EUR/USD sets to test triangle breakout region
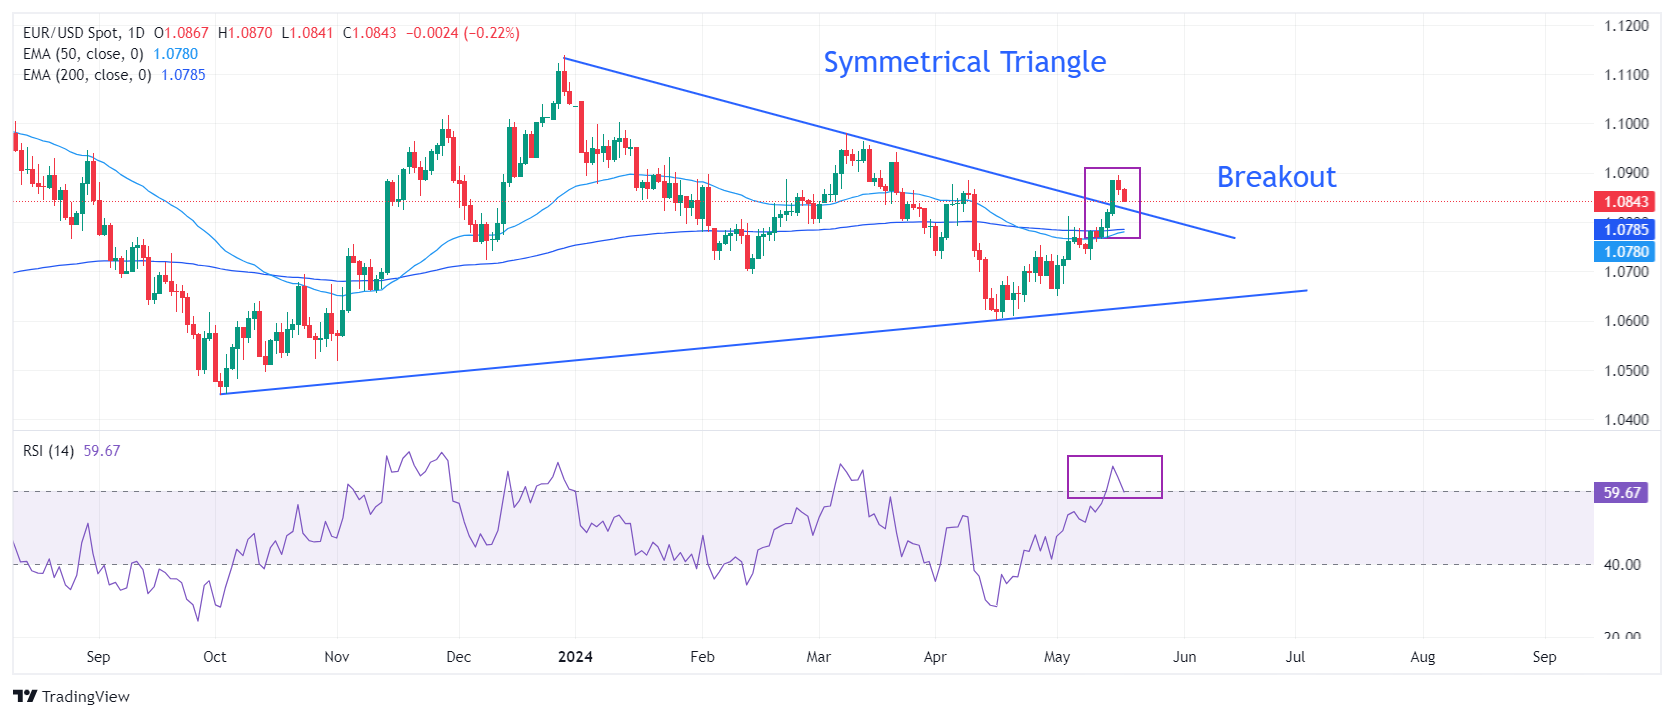
EUR/USD is gradually declining towards the breakout region of the Symmetrical Triangle formation, which is around 1.0830. The near-term outlook of the major currency pair remains bullish as a breakout of a triangle formation results in heavy buying volume and wider ticks. The shared currency pair seems well-established above the 50-day and 200-day Exponential Moving Averages (EMAs), which trade around 1.0780 and 1.0788, respectively.
The 14-period Relative Strength Index (RSI) has shifted into the bullish range of 60.00-80.00, suggesting a strong upside move ahead. Going forward, EUR/USD is expected to extend its upside towards the psychological resistance of 1.1000.
Euro FAQs
The Euro is the currency for the 20 European Union countries that belong to the Eurozone. It is the second most heavily traded currency in the world behind the US Dollar. In 2022, it accounted for 31% of all foreign exchange transactions, with an average daily turnover of over $2.2 trillion a day. EUR/USD is the most heavily traded currency pair in the world, accounting for an estimated 30% off all transactions, followed by EUR/JPY (4%), EUR/GBP (3%) and EUR/AUD (2%).
The European Central Bank (ECB) in Frankfurt, Germany, is the reserve bank for the Eurozone. The ECB sets interest rates and manages monetary policy. The ECB’s primary mandate is to maintain price stability, which means either controlling inflation or stimulating growth. Its primary tool is the raising or lowering of interest rates. Relatively high interest rates – or the expectation of higher rates – will usually benefit the Euro and vice versa. The ECB Governing Council makes monetary policy decisions at meetings held eight times a year. Decisions are made by heads of the Eurozone national banks and six permanent members, including the President of the ECB, Christine Lagarde.
Eurozone inflation data, measured by the Harmonized Index of Consumer Prices (HICP), is an important econometric for the Euro. If inflation rises more than expected, especially if above the ECB’s 2% target, it obliges the ECB to raise interest rates to bring it back under control. Relatively high interest rates compared to its counterparts will usually benefit the Euro, as it makes the region more attractive as a place for global investors to park their money.
Data releases gauge the health of the economy and can impact on the Euro. Indicators such as GDP, Manufacturing and Services PMIs, employment, and consumer sentiment surveys can all influence the direction of the single currency. A strong economy is good for the Euro. Not only does it attract more foreign investment but it may encourage the ECB to put up interest rates, which will directly strengthen the Euro. Otherwise, if economic data is weak, the Euro is likely to fall. Economic data for the four largest economies in the euro area (Germany, France, Italy and Spain) are especially significant, as they account for 75% of the Eurozone’s economy.
Another significant data release for the Euro is the Trade Balance. This indicator measures the difference between what a country earns from its exports and what it spends on imports over a given period. If a country produces highly sought after exports then its currency will gain in value purely from the extra demand created from foreign buyers seeking to purchase these goods. Therefore, a positive net Trade Balance strengthens a currency and vice versa for a negative balance.
- AUD/JPY inches lower after the release of mixed Chinese data on Friday.
- China’s Retail Sales rose for the successive 15th month but the softest gain in this sequence.
- Former BOJ chief economist Toshitaka Sekine suggested the central bank could raise the rate three times in 2024.
AUD/JPY hovers around 103.70 during the European trading hours on Friday. The Australian Dollar (AUD) continues to experience a decline, driven by recent mixed economic data from China. Any economic change in the Chinese economy could catalyze the Australian market as both nations are close trade partners.
China's Retail Sales (YoY) increased 2.3% in April, down from March's 3.1% and the expected 3.8%. This marks the 15th consecutive month of growth in retail activity but represents the slowest uptick in this trend. Meanwhile, Industrial Production improved 6.7% YoY, surpassing the anticipated 5.5% and the previous recording of 4.5%.
The Aussie Dollar had already been under pressure after Australia's employment figures released on Thursday presented a mixed picture. Australia’s Wage Price Index (QoQ) increased by 0.8% in the first quarter, falling short of the market's forecast of a 0.9% rise. This quarter's increase is the smallest since late 2022. Additionally, annual pay growth slowed slightly to 4.1%, down from the previous 4.2%, and below market expectations.
The Japanese Yen (JPY) encountered renewed pressure as the Bank of Japan (BoJ) maintained its bond-buying amounts on Friday from the previous operation, opting against a surprise cut to debt purchasing earlier in the week. Traders speculate that the BoJ might reduce bond buying at the June policy meeting. BOJ Governor Kazuo Ueda also mentioned that there are no immediate plans to sell the central bank’s ETF holdings.
In an interview with Bloomberg, former BOJ chief economist Toshitaka Sekine suggested that the Bank of Japan could raise its benchmark interest rate up to three more times this year. Sekine proposed that the next move could potentially occur as early as June, given the significant room available to adjust its current "excessively" easy settings.
Silver prices (XAG/USD) rose on Friday, according to FXStreet data. Silver trades at $29.63 per troy ounce, up 0.18% from the $29.58 it cost on Thursday.
Silver prices have increased by 16.33% since the beginning of the year.
| Unit measure | Today Price |
|---|---|
| Silver price per troy ounce | $29.63 |
| Silver price per gram | $0.95 |
The Gold/Silver ratio, which shows the number of troy ounces of Silver needed to equal the value of one troy ounce of Gold, stood at 80.39 on Friday, up from 80.36 on Thursday.
Investors might use this ratio to determine the relative valuation of Gold and Silver. Some may consider a high ratio as an indicator that Silver is undervalued – or Gold is overvalued – and might buy Silver or sell Gold accordingly. Conversely, a low ratio might suggest that Gold is undervalued relative to Silver.
(An automation tool was used in creating this post.)
Silver FAQs
Silver is a precious metal highly traded among investors. It has been historically used as a store of value and a medium of exchange. Although less popular than Gold, traders may turn to Silver to diversify their investment portfolio, for its intrinsic value or as a potential hedge during high-inflation periods. Investors can buy physical Silver, in coins or in bars, or trade it through vehicles such as Exchange Traded Funds, which track its price on international markets.
Silver prices can move due to a wide range of factors. Geopolitical instability or fears of a deep recession can make Silver price escalate due to its safe-haven status, although to a lesser extent than Gold's. As a yieldless asset, Silver tends to rise with lower interest rates. Its moves also depend on how the US Dollar (USD) behaves as the asset is priced in dollars (XAG/USD). A strong Dollar tends to keep the price of Silver at bay, whereas a weaker Dollar is likely to propel prices up. Other factors such as investment demand, mining supply – Silver is much more abundant than Gold – and recycling rates can also affect prices.
Silver is widely used in industry, particularly in sectors such as electronics or solar energy, as it has one of the highest electric conductivity of all metals – more than Copper and Gold. A surge in demand can increase prices, while a decline tends to lower them. Dynamics in the US, Chinese and Indian economies can also contribute to price swings: for the US and particularly China, their big industrial sectors use Silver in various processes; in India, consumers’ demand for the precious metal for jewellery also plays a key role in setting prices.
Silver prices tend to follow Gold's moves. When Gold prices rise, Silver typically follows suit, as their status as safe-haven assets is similar. The Gold/Silver ratio, which shows the number of ounces of Silver needed to equal the value of one ounce of Gold, may help to determine the relative valuation between both metals. Some investors may consider a high ratio as an indicator that Silver is undervalued, or Gold is overvalued. On the contrary, a low ratio might suggest that Gold is undervalued relative to Silver.
Gold prices fell in India on Friday, according to data from India's Multi Commodity Exchange (MCX).
Gold price stood at 73,161 Indian Rupees (INR) per 10 grams, down INR 51 compared with the INR 73,212 it cost on Thursday.
As for futures contracts, Gold prices decreased to INR 72,912 per 10 gms from INR 72,980 per 10 gms.
Prices for Silver futures contracts increased to INR 87,575 per kg from INR 87,300 per kg.
| Major Indian city | Gold Price |
|---|---|
| Ahmedabad | 75,730 |
| Mumbai | 75,490 |
| New Delhi | 75,485 |
| Chennai | 75,730 |
| Kolkata | 75,650 |
Global Market Movers: Comex Gold price edges higher despite Fed officials suggest interest rates should stay higher for longer
- The US weekly Initial Jobless Claims increased by 222K for the week ending May 11 from 232K in the previous week, above the 220K estimated, according to the US Bureau of Labor Statistics (BLS).
- Housing Starts rose by 5.7% MoM to 1.36 million in April, while Building Permits dropped by 3% MoM in April to 1.44 million.
- Atlanta Fed President Raphael Bostic said he saw signs of cooling inflation in the recent CPI report, but he prefers to watch the May and June data to gain confidence that the inflation doesn’t turn back the other way.
- Cleveland Fed President Loretta Mester said policy was well positioned, and it was too soon to say progress on inflation had stalled.
- Richmond Fed President Tom Barkin noted the central bank needs to keep borrowing costs high for longer to ensure inflation is on track to its target, citing higher prices in the services sector.
- Financial markets are currently pricing in nearly 75% odds of a Fed rate cut in September, an increase from 65% earlier in the week. The markets are also pricing in full 25 basis point (bps) rate cuts before the end of the year, according to the CME FedWatch Tool.
(An automation tool was used in creating this post.)
Gold FAQs
Gold has played a key role in human’s history as it has been widely used as a store of value and medium of exchange. Currently, apart from its shine and usage for jewelry, the precious metal is widely seen as a safe-haven asset, meaning that it is considered a good investment during turbulent times. Gold is also widely seen as a hedge against inflation and against depreciating currencies as it doesn’t rely on any specific issuer or government.
Central banks are the biggest Gold holders. In their aim to support their currencies in turbulent times, central banks tend to diversify their reserves and buy Gold to improve the perceived strength of the economy and the currency. High Gold reserves can be a source of trust for a country’s solvency. Central banks added 1,136 tonnes of Gold worth around $70 billion to their reserves in 2022, according to data from the World Gold Council. This is the highest yearly purchase since records began. Central banks from emerging economies such as China, India and Turkey are quickly increasing their Gold reserves.
Gold has an inverse correlation with the US Dollar and US Treasuries, which are both major reserve and safe-haven assets. When the Dollar depreciates, Gold tends to rise, enabling investors and central banks to diversify their assets in turbulent times. Gold is also inversely correlated with risk assets. A rally in the stock market tends to weaken Gold price, while sell-offs in riskier markets tend to favor the precious metal.
The price can move due to a wide range of factors. Geopolitical instability or fears of a deep recession can quickly make Gold price escalate due to its safe-haven status. As a yield-less asset, Gold tends to rise with lower interest rates, while higher cost of money usually weighs down on the yellow metal. Still, most moves depend on how the US Dollar (USD) behaves as the asset is priced in dollars (XAU/USD). A strong Dollar tends to keep the price of Gold controlled, whereas a weaker Dollar is likely to push Gold prices up.
FX option expiries for May 17 NY cut at 10:00 Eastern Time, via DTCC, can be found below
- EUR/USD: EUR amounts
- 1.0675 753m
- 1.0725 652m
- 1.0740 494m
- 1.0775 825m
- 1.0800 601m
- 1.0810 813m
- 1.0820 685m
- 1.0825 500m
- 1.0850 3b
- 1.0875 1.2b
- 1.0915 1.1b
- GBP/USD: GBP amounts
- 1.2475 550m
- USD/CHF: USD amounts
- 0.9000 605m
- USD/CAD: USD amounts
- 1.3600 508m
- 1.3675 887m
- 1.3725 924m
- 1.3735 585m
- USD/JPY: USD amounts
- 152.50 1.1b
- 153.60 842m
- 154.00 2b
- 154.80 500m
- 155.00 2b
- 155.50 891m
- 156.00 791m
- 156.35 538m
- 156.60 475m
- 157.00 1.4b
- AUD/USD: AUD amounts
- 0.6550 559m
- 0.6570 492m
- 0.6600 524m
- 0.6625 728m
- 0.6650 431m
- 0.6655 705m
- NZD/USD: NZD amounts
- 0.5880 1.5b
- 0.5950 949m
- USD/CHF continues to advance after the release of lower Swiss production data on Friday.
- Swiss Industrial Production declined by 3.1% in Q1, marking the second consecutive quarter of declining industrial activity.
- The US Dollar appreciates Fed officials suggesting prolonging higher rates as pricing pressure persists in the US economy.
USD/CHF extends its gains for the second day, trading around 0.9080 during the early European hours on Friday. The Swiss Franc (CHF) depreciated against the US Dollar (USD) after the release of the lower Industrial Production released by Swiss Statistics.
The volume of production of Industries in Switzerland declined by 3.1% in the first quarter, following an upwardly revised decline of 0.5% in the previous quarter. This marks the second consecutive quarter of declining industrial activity. On a seasonally adjusted quarterly basis, industrial production dropped by 1% in Q1, compared to an upwardly revised decline of 1.1% in the prior quarter.
On the USD front, the Federal Reserve (Fed) maintains a cautious stance regarding inflation and the potential for rate cuts in 2024, which contributes support for the US Dollar (USD), underpinning the USD/CHF pair.
Reuters reports on Thursday, Atlanta Fed President Raphael Bostic said at an event in Jacksonville that the need for patience with interest rates, noting that substantial pricing pressure persists in the US economy. Additionally, Cleveland Fed President Loretta Mester indicated that it might take longer than anticipated to confidently ascertain the inflation trajectory, suggesting that the Fed should maintain its restrictive stance for an extended period.
However, the higher-than-expected Initial Jobless Claims were released by the US Department of Labor on Thursday. This has contributed to the market expectations of the Federal Reserve’s (Fed) delivering a rate cut in September. The number of Americans filing new claims for jobless benefits rose to 222,000 for the week ending May 10, surpassing the market consensus of 220,000 but below the previous week's figure of 232,000.
- The Pound Sterling consolidates slightly below 1.2700 as the focus shifts to UK inflation data.
- Investors expect that the BoE could start reducing interest rates in the June or August meeting.
- Fed’s hawkish stance on interest rates boosts US Dollar’s recovery.
The Pound Sterling (GBP) turns sideways in Friday’s London session after posting a fresh monthly high at 1.2700 on Thursday. The GBP/USD pair struggles to extend upside as investors shift focus to the United Kingdom Consumer Price Index (CPI) data for April, which will be published on Wednesday.
The UK inflation data will provide fresh cues about the interest rate outlook. Investors remain divided between the June and the August meeting about when the Bank of England (BoE) could start reducing interest rates.
April’s inflation data is expected to significantly influence the next move in the Pound Sterling as BoE Governor Andrew Bailey said after the release of the March’s CPI data on April 17, “Inflation in the UK will fall near its 2% target next month” and has declined roughly in step with the BOE’s forecast in February. Bailey added, “I expect that next month's number will show quite a strong drop because we have a particularly unique energy to household energy pricing system in the UK,” Bloomberg reported.
Daily digest market movers: Pound Sterling upside stalls as US Dollar rebounds
- The Pound Sterling’s rally to near the round-level resistance of 1.2700 stalls as the market sentiment turns slightly cautious. Federal Reserve (Fed) policymakers push back market expectations for rate cuts despite an expected decline in the United States (US) inflation data for April.
- A slew of Fed policymakers lined up to speak on the interest rate outlook on Thursday. Their commentary suggested that the current interest rate framework is optimal in the present scenario. Policymakers suggested that a one-time decline in inflation figures is insufficient to give them confidence that the disinflation process has continued again after stalling in the first quarter of this year.
- Hawkish commentaries from Fed policymakers have negatively impacted speculation for Fed rate cuts, for which investors expect that the central bank will choose the September meeting as the earliest point. The CME FedWatch tool shows that the probability of interest rates declining from their current levels in September has come down to 68% from 73% recorded after the release of the inflation data.
- The Fed maintaining a stance of higher interest rates for longer has offered some relief to the US Dollar. The US Dollar Index (DXY), which tracks the Greenback’s value against six major currencies, rebounds to 104.66 after posting a fresh monthly low near 104.00 on Thursday but is still on track to close the week in negative.
- Meanwhile, investors’ concerns over US labor market strength deepened further after the Department of Labor showed on Thursday that Initial Jobless Claims for the week ending May 10 were higher-than-expected. The number of individuals claiming jobless benefits for the first time was 222K, above estimates of 220K but lower than the prior reading of 232K, the highest level in eight months.
Technical Analysis: Pound Sterling trades close to 61.8% Fibo retracement around 1.2670

The Pound Sterling advances to the 61.8% Fibonacci retracement (plotted from the March high at around 1.2900 to the April low at 1.2300) at 1.2670 on a daily timeframe. The GBP/USD pair could extend its upside after a decisive break above the round-level resistance of 1.2700.
On the downside, 50-day and 200-day Exponential Moving Averages (EMAs), which trade around 1.2565 and 1.2536, respectively, will be the major support zones for the Pound Sterling
The 14-period Relative Strength Index (RSI) has shifted into the bullish range of 60.00-80.00, suggesting that the momentum has leaned toward the upside.
Pound Sterling FAQs
The Pound Sterling (GBP) is the oldest currency in the world (886 AD) and the official currency of the United Kingdom. It is the fourth most traded unit for foreign exchange (FX) in the world, accounting for 12% of all transactions, averaging $630 billion a day, according to 2022 data. Its key trading pairs are GBP/USD, aka ‘Cable’, which accounts for 11% of FX, GBP/JPY, or the ‘Dragon’ as it is known by traders (3%), and EUR/GBP (2%). The Pound Sterling is issued by the Bank of England (BoE).
The single most important factor influencing the value of the Pound Sterling is monetary policy decided by the Bank of England. The BoE bases its decisions on whether it has achieved its primary goal of “price stability” – a steady inflation rate of around 2%. Its primary tool for achieving this is the adjustment of interest rates. When inflation is too high, the BoE will try to rein it in by raising interest rates, making it more expensive for people and businesses to access credit. This is generally positive for GBP, as higher interest rates make the UK a more attractive place for global investors to park their money. When inflation falls too low it is a sign economic growth is slowing. In this scenario, the BoE will consider lowering interest rates to cheapen credit so businesses will borrow more to invest in growth-generating projects.
Data releases gauge the health of the economy and can impact the value of the Pound Sterling. Indicators such as GDP, Manufacturing and Services PMIs, and employment can all influence the direction of the GBP. A strong economy is good for Sterling. Not only does it attract more foreign investment but it may encourage the BoE to put up interest rates, which will directly strengthen GBP. Otherwise, if economic data is weak, the Pound Sterling is likely to fall.
Another significant data release for the Pound Sterling is the Trade Balance. This indicator measures the difference between what a country earns from its exports and what it spends on imports over a given period. If a country produces highly sought-after exports, its currency will benefit purely from the extra demand created from foreign buyers seeking to purchase these goods. Therefore, a positive net Trade Balance strengthens a currency and vice versa for a negative balance.
- The Mexican Peso is trading sideways after its strong rally on Wednesday.
- This is probably a consolidation within an uptrend and more strength is likely for the Peso.
- US data was mixed on Thursday and provided a balm to Wednesday’s negative releases, supporting USD/MXN.
The Mexican Peso (MXN) trades broadly unchanged in its key pairs on Friday, with USD/MXN flatlining as the US Dollar (USD) stabilizes after its recent sell-off and market sentiment remains relatively calm heading into the weekend.
At the time of writing, USD/MXN is trading at 16.70, EUR/MXN at 18.14 and GBP/MXN at 21.15.
Mexican Peso stable after midweek volatility
The Mexican Peso holds the line in its major pairs as a lack of market moving data and geopolitical shocks keeps volatility to a minimum.
On Thursday the US released a mixed bag of data that did not really change the outlook for the economy or interest rates, a key driver for FX. The same went for Europe and the UK.
Regarding the US data, the results were as follows:
- Initial Jobless Claims came in at 222K in the week ending May 10, which was above the 220K expected but below the upwardly revised 232K of the previous week.
- The number of Building Permits awarded – said to be a leading indicator for the economy – fell to 1.44M in April, which was below the 1.48M expected and 1.47M previous.
- Housing Starts in April rose to 1.36M from 1.29M previously, but not as much as the 1.42M economists had expected.
- The Philadelphia Fed Manufacturing Survey came in at 4.5 in May, below the 8 forecast and the 15.5 previously.
- US Industrial Production flatlined in May, coming in at 0.0% when analysts had expected a 0.1% rise, the same as the previous month.
Apart from the data, several US Federal Reserve (Fed) officials commented on Fed monetary policy, but their words were interpreted as neutral and had little impact.
The President of the Richmond Fed Thomas Barkin said inflation is coming down, but that it will “take more time” to hit the Fed’s target.
Cleveland Fed President Loretta Mester, meanwhile, welcomed the latest CPI data but said monetary policy is well-positioned.
Atlanta Fed President Raphael Bostic said he was pleased with the progress on inflation in April but that the Fed needed to “be patient and vigilant.”
In Europe, European Central Bank (ECB) executive board member Isabel Schnabel, meanwhile, said an interest rate cut in June may be appropriate but the “path beyond June is much more uncertain.”
So, to sum up, no big changes there and business as usual.
Technical Analysis: USD/MXN threatens to go lower
USD/MXN – the value of one US Dollar in Mexican Pesos – trades sideways after the massive sell-off on Wednesday.
The consolidation after the steep decline could possibly be the early beginnings of a Bear Flag continuation pattern, although it is still early to say for sure.
USD/MXN 4-hour Chart
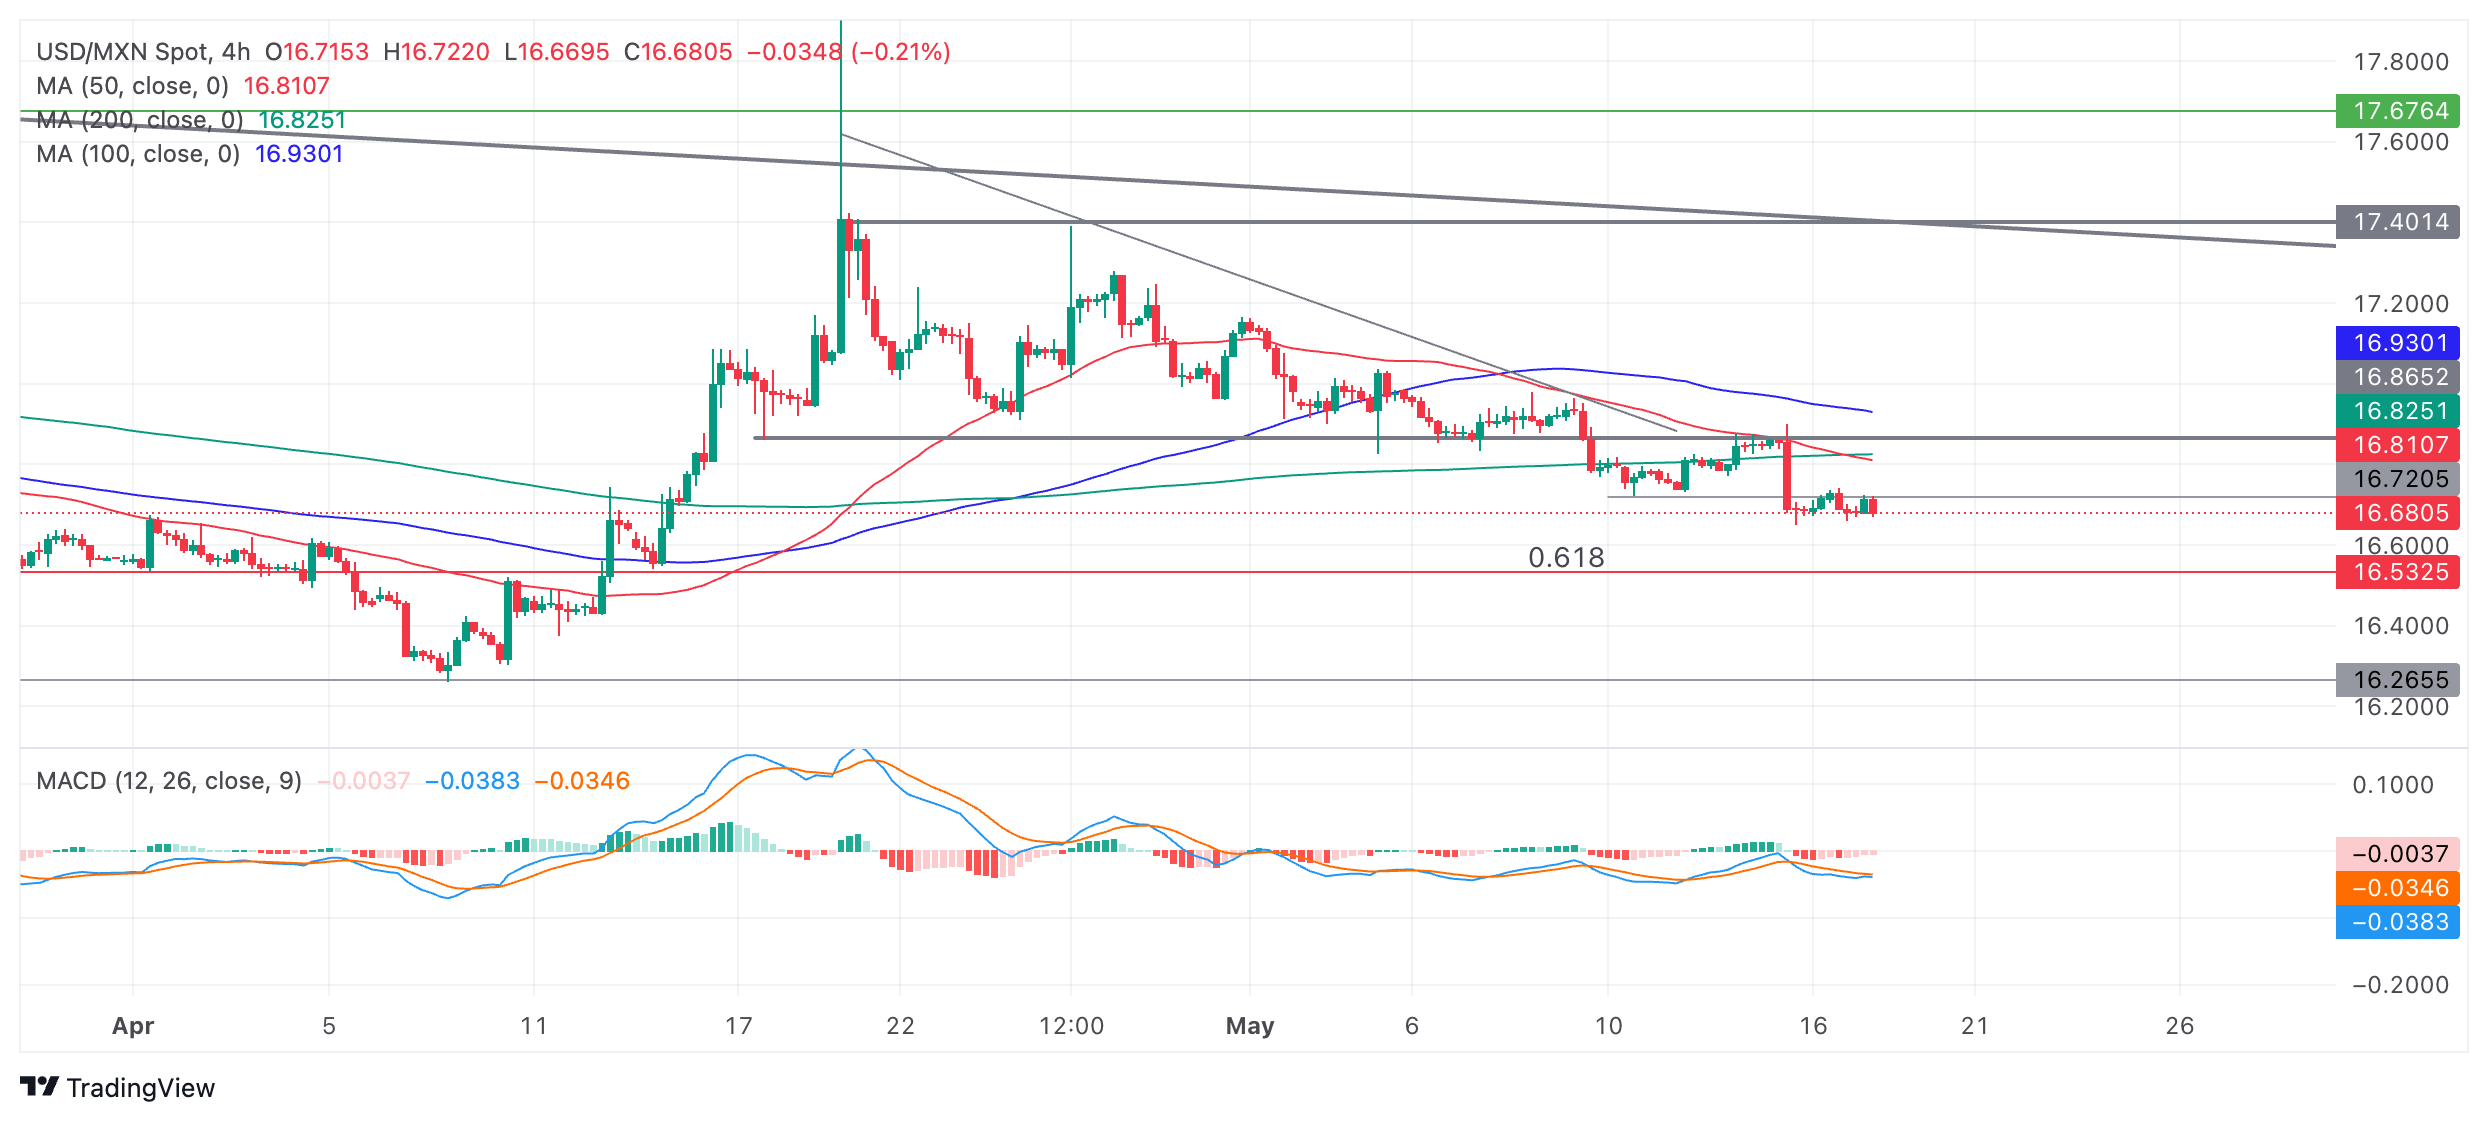
Ever since breaking out below the bottom of its range at 16.86 on May 9, the pair has looked like it has been in a short-term downtrend, favoring shorts over longs.
If USD/MXN breaks below the May 15 lows of 16.64, it will probably confirm the start of the next leg lower.
More downside would likely reach the conservative target for the breakout of the mid-April to May range at 16.54, which is the 0.618 Fibonacci ratio of the height of the range extrapolated lower. Further bearishness could even reach 16.34, the full height of the range extrapolated lower.
Given the medium and long-term trends are bearish, the odds further favor more downside.
It would take a recovery and decisive break back inside the range (above 16.86) to reverse the downtrending bias.
A decisive break would be one accompanied by a longer-than-average green candlestick that closed near its high or three green candlesticks in a row.
Economic Indicator
Building Permits (MoM)
The Building Permits released by the US Census Bureau, at the Department of Commerce shows the number of permits for new construction projects. It implies the movement of corporate investments (US economic development). It tends to cause some volatility to the USD. Normally, the more growing number of permits, the more positive (or bullish) for the USD.
Read more.Last release: Thu May 16, 2024 12:30
Frequency: Monthly
Actual: 1.44M
Consensus: 1.48M
Previous: 1.458M
Source: US Census Bureau
Here is what you need to know on Friday, May 17:
Following the sharp decline seen after April inflation data on Wednesday, the US Dollar Index managed to stage a modest rebound on Thursday and closed the day in positive territory. On Friday, Eurostat will release revisions to April Harmonized Index of Consumer Prices (HICP) data. Later in the day, investors will remain focused on comments from Federal Reserve (Fed) officials in the absence of high-impact data releases from the US.
The data published by the US Department of Labor showed on Thursday that there were 222,000 first-time applications for unemployment benefits in the week ending May 11, down from 232,000 in the previous week. In the meantime, several Fed officials spoke on Thursday and called for patience with regards to lowering the policy rate, while acknowledging the progress seen in inflation in April Consumer Price Index (CPI) data. After falling more than 2% on Wednesday, the benchmark 10-yaer US Treasury bond yield gains 0.7% on Thursday and closed the day in the green, helping the US Dollar stay resilient against its rivals. Early Friday, the 10-year US yield stays flat slightly below 4.4% and US stock index futures trade virtually unchanged.
US Dollar PRICE This week
The table below shows the percentage change of US Dollar (USD) against listed major currencies this week. US Dollar was the weakest against the New Zealand Dollar.
| USD | EUR | GBP | JPY | CAD | AUD | NZD | CHF | |
|---|---|---|---|---|---|---|---|---|
| USD | -0.84% | -1.09% | -0.05% | -0.34% | -0.99% | -1.54% | 0.07% | |
| EUR | 0.84% | -0.31% | 0.78% | 0.48% | -0.19% | -0.74% | 0.90% | |
| GBP | 1.09% | 0.31% | 1.03% | 0.78% | 0.12% | -0.43% | 1.21% | |
| JPY | 0.05% | -0.78% | -1.03% | -0.31% | -0.91% | -1.55% | 0.16% | |
| CAD | 0.34% | -0.48% | -0.78% | 0.31% | -0.63% | -1.22% | 0.33% | |
| AUD | 0.99% | 0.19% | -0.12% | 0.91% | 0.63% | -0.65% | 1.08% | |
| NZD | 1.54% | 0.74% | 0.43% | 1.55% | 1.22% | 0.65% | 1.64% | |
| CHF | -0.07% | -0.90% | -1.21% | -0.16% | -0.33% | -1.08% | -1.64% |
The heat map shows percentage changes of major currencies against each other. The base currency is picked from the left column, while the quote currency is picked from the top row. For example, if you pick the US Dollar from the left column and move along the horizontal line to the Japanese Yen, the percentage change displayed in the box will represent USD (base)/JPY (quote).
Fed officials stick to cautious tones, but outlook beginning to tease rate cuts.
During the Asian trading hours, the data from China showed that Retail Sales rose 2.3% on a yearly basis in April, missing the market expectation for an increase of 3.8%. On a positive note, Industrial Production expanded 6.7% in the same period and beat analysts' estimate of 5.5%. After closing in the red on Thursday, AUD/USD continued to edge lower and was last seen losing 0.2% on the day at 0.6665.
Australian Dollar struggles as Aussie 10-year yield drops to a monthly low.
Following Wednesday's impressive upsurge, EUR/USD corrected lower on Thursday. The pair stays relatively quiet and fluctuates slightly above 1.0850 in the European morning on Friday.
GBP/USD turned south after testing 1.2700 early Thursday and registered modest daily losses. The pair continues to edge lower toward 1.2650 early European session.
USD/JPY stretches higher on Friday and trades above 155.50 after closing in positive territory on Thursday.
Gold struggled to build on Wednesday gains and posted small losses on Thursday, pressured by recovering US Treasury bond yields. XAU/USD, however, managed to find a foothold early Friday and was last seen gaining 0.4% on the day at $2,386.
Gold price loses traction, with Fed speakers in focus.
Fed FAQs
Monetary policy in the US is shaped by the Federal Reserve (Fed). The Fed has two mandates: to achieve price stability and foster full employment. Its primary tool to achieve these goals is by adjusting interest rates. When prices are rising too quickly and inflation is above the Fed’s 2% target, it raises interest rates, increasing borrowing costs throughout the economy. This results in a stronger US Dollar (USD) as it makes the US a more attractive place for international investors to park their money. When inflation falls below 2% or the Unemployment Rate is too high, the Fed may lower interest rates to encourage borrowing, which weighs on the Greenback.
The Federal Reserve (Fed) holds eight policy meetings a year, where the Federal Open Market Committee (FOMC) assesses economic conditions and makes monetary policy decisions. The FOMC is attended by twelve Fed officials – the seven members of the Board of Governors, the president of the Federal Reserve Bank of New York, and four of the remaining eleven regional Reserve Bank presidents, who serve one-year terms on a rotating basis.
In extreme situations, the Federal Reserve may resort to a policy named Quantitative Easing (QE). QE is the process by which the Fed substantially increases the flow of credit in a stuck financial system. It is a non-standard policy measure used during crises or when inflation is extremely low. It was the Fed’s weapon of choice during the Great Financial Crisis in 2008. It involves the Fed printing more Dollars and using them to buy high grade bonds from financial institutions. QE usually weakens the US Dollar.
Quantitative tightening (QT) is the reverse process of QE, whereby the Federal Reserve stops buying bonds from financial institutions and does not reinvest the principal from the bonds it holds maturing, to purchase new bonds. It is usually positive for the value of the US Dollar.
- EUR/JPY gains momentum near 169.20 in Friday’s early European session.
- The cross keeps the bullish vibe unchanged above the key EMA, with the RSI indicator standing above the 50-midline.
- The first upside barrier is seen at 169.40; 167.80 acts as an initial support level.
The EUR/JPY cross extends the rally around 169.20 during the early European trading hours on Friday. The Japanese Yen (JPY) has weakened as Japan's economy contracted more than expected in the first quarter (Q1) of 2024, challenging the Bank of Japan's (BoJ) push to get interest rates further away from near zero. On Friday, the BoJ left the amount of bonds it buys at regular operations unchanged, adding to a modest dip in the JPY after helping the currency earlier in the week with a surprise reduction in purchases, per Bloomberg.
Technically, EUR/JPY maintains the bullish outlook unchanged as the cross holds above the 100-period Exponential Moving Averages (EMA) on the four-hour chart. The upward momentum is backed by the Relative Strength Index (RSI), which stands in bullish territory near 62.60, supporting the buyers for the time being.
The immediate resistance level for the cross will emerge near a high of May 15 at 169.40. The additional upside filter to watch is the 170.00 psychological round figure. A decisive break above the latter will see a rally to the next barrier around a high of April 29 at 171.60.
On the flip side, the first downside target is seen at the 100-period EMA at 167.80. Further south, the next contention level is located near a low of May 16 at 167.33, followed by a low of April 29 at 165.66.
EUR/JPY four-hour chart
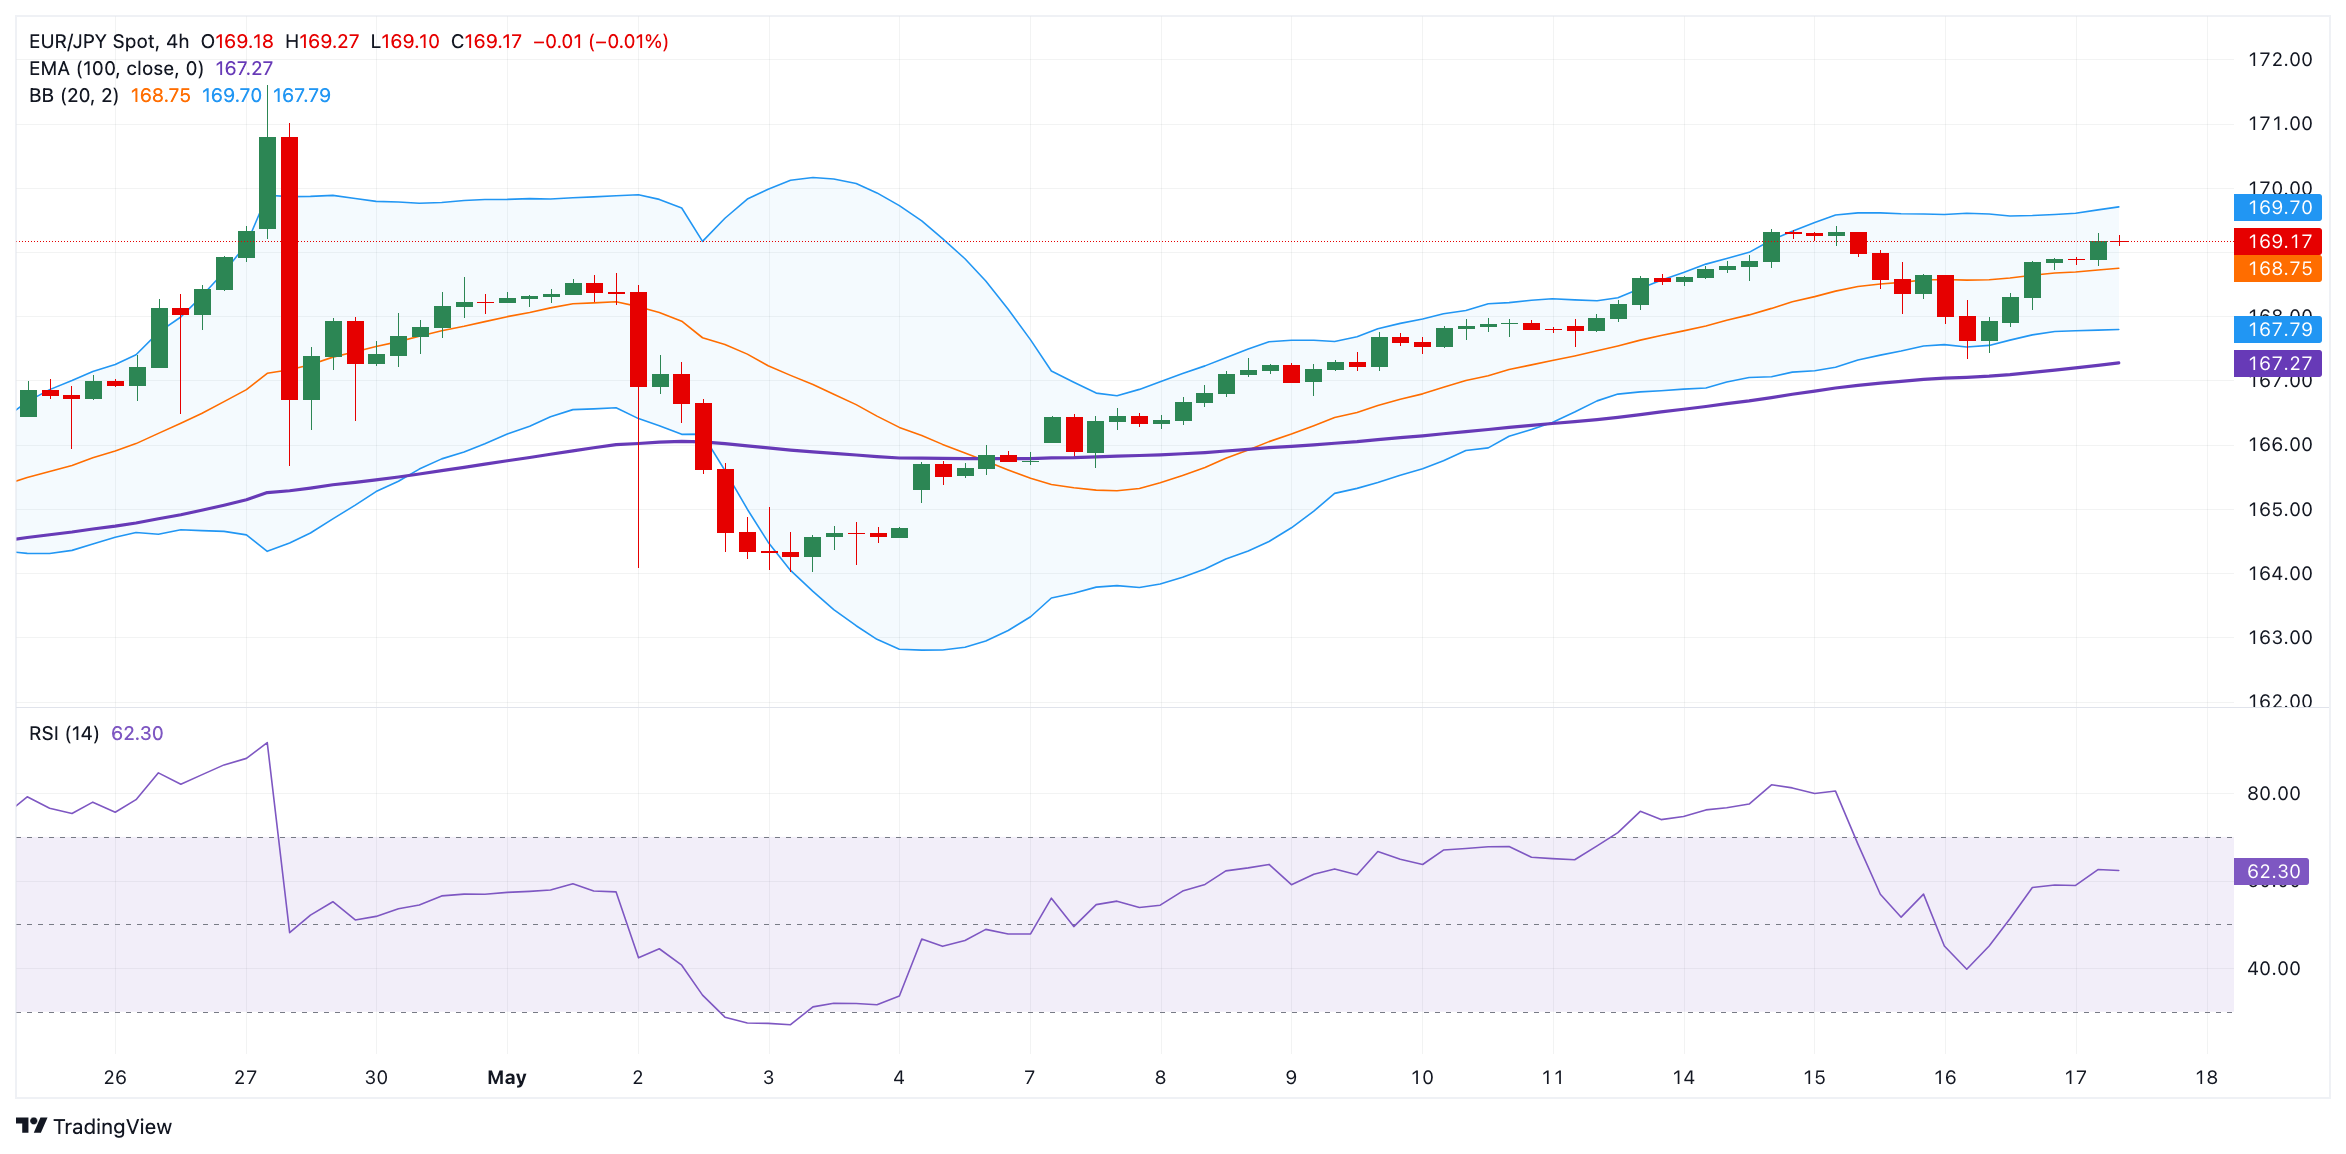
- Silver price appreciated as higher Initial Jobless Claims contributed to the expectations of the Fed reducing rates in September.
- Fed officials suggested prolonging of higher rates as pricing pressure persists in the US economy.
- The US Dollar gains ground as the Fed adopts a cautious stance regarding the potential rate cuts in 2024.
Silver price retraces its recent losses registered on Thursday, trading around $29.70 per troy ounce during the Asian hours on Friday. The price of the grey metal as investors turn cautious following the higher-than-expected Initial Jobless Claims released by the US Department of Labor on Thursday. This has contributed to the dovish expectations of the Federal Reserve’s (Fed) delivering a rate cut in September.
The number of Americans filing new claims for jobless benefits rose to 222,000 for the week ending May 10, surpassing the market consensus of 220,000 but below the previous week's figure of 232,000.
On Thursday, Fed Bank of Atlanta President Raphael Bostic emphasized the need for patience with interest rates, noting that substantial pricing pressure persists in the US economy. Additionally, Cleveland Fed President Loretta Mester indicated that it might take longer than anticipated to confidently ascertain the inflation trajectory, suggesting that the Fed should maintain its restrictive stance for an extended period.
Reuters reports on Thursday, Atlanta Fed President Raphael Bostic said at an event in Jacksonville that the need for patience with interest rates, noting that substantial pricing pressure persists in the US economy. Additionally, Cleveland Fed President Loretta Mester indicated that it might take longer than anticipated to confidently ascertain the inflation trajectory, suggesting that the Fed should maintain its restrictive stance for an extended period.
In the absence of top-tier economic data from the US docket, market participants will likely observe Fedspeak for insights into the future direction of the Fed's monetary policy. Later on Friday, Minneapolis Fed President Neel Kashkari and San Francisco Fed President Mary Daly are scheduled to speak, potentially providing valuable hints.
- EUR/USD could retest the upper boundary aligned with the psychological level of 1.0900.
- The momentum indicator MACD suggests a bullish sentiment for the pair.
- The potential support appears at the nine-day EMA at 1.0818.
EUR/USD continues to lose ground, trading around 1.0860 during the Asian hours on Friday. From a technical perspective on a daily chart, analysis indicates a sideways trend for the pair as it continues to lie within the symmetrical triangle. A surpassing of the upper boundary could shift the momentum toward a bullish bias.
However, the momentum indicator Moving Average Convergence Divergence (MACD) suggests a bullish sentiment for the EUR/USD pair. Positioned above the centerline, there's a noted divergence above the signal line, indicating upward momentum.
The EUR/USD pair could challenge the key barrier at the upper boundary of the symmetrical triangle aligned with the psychological level of 1.0900. A break above this level could support the pair to test the pullback resistance at 1.0981.
Conversely, downside potential for the EUR/USD pair suggests initial support near the significant level of 1.0850, with further support expected around the nine-day Exponential Moving Average (EMA) at 1.0818. A breach below the latter could prompt movement toward the lower boundary of the symmetrical triangle, aligning with the psychological threshold of 1.0700. Additional support levels might come into play around April’s low at 1.0601.
EUR/USD: Daily Chart
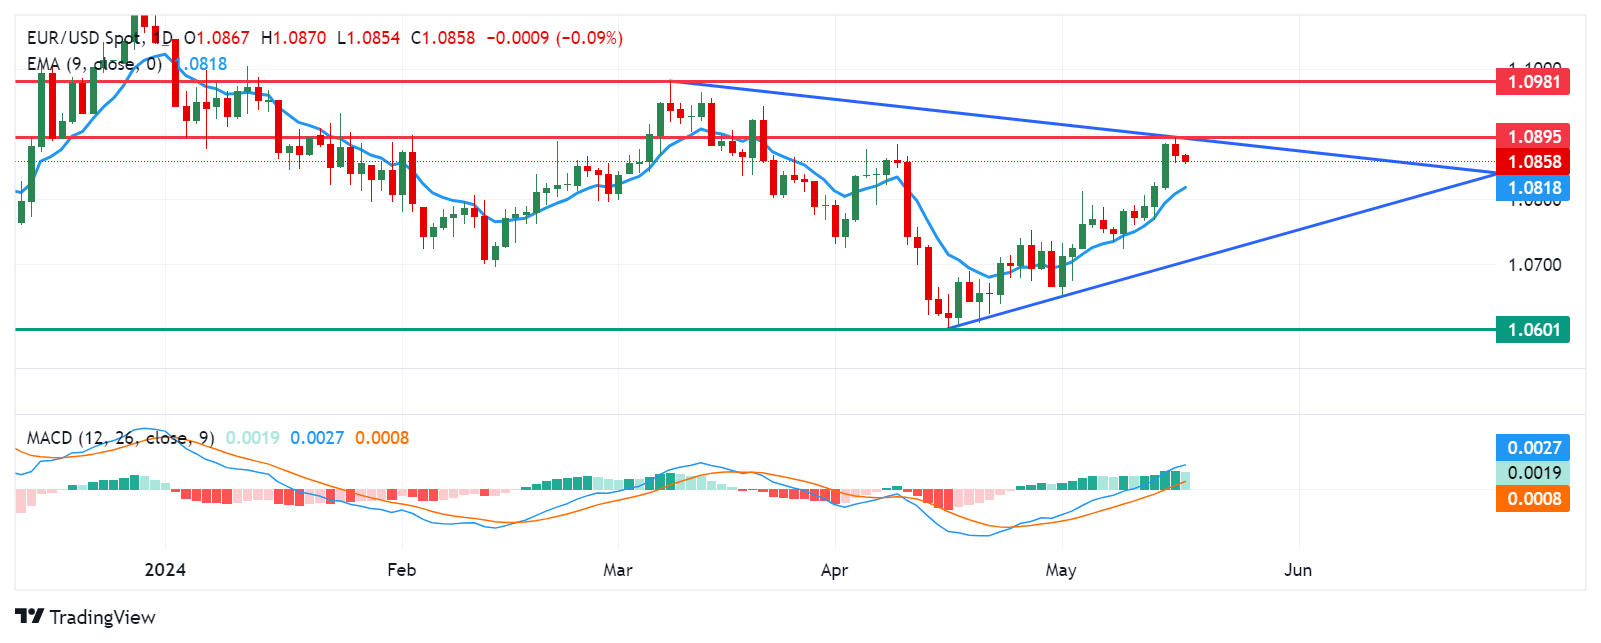
- USD/JPY appreciates as BoJ maintains its bond-buying amounts from the previous operation.
- Former BOJ chief economist Toshitaka Sekine suggested the central bank could raise the rate three times in 2024.
- The US Dollar strengthens as the Fed maintains a cautious stance regarding the prospect of interest rate reductions in the current year.
USD/JPY rose to near 155.90 during the Asian session on Friday as the Japanese Yen (JPY) encountered renewed pressure. This was sparked by the Bank of Japan (BoJ) maintaining its bond-buying amounts from the previous operation, opting against a surprise cut to debt purchasing earlier in the week.
Traders speculate that the BoJ might reduce bond buying at the June policy meeting. BOJ Governor Kazuo Ueda also mentioned that there are no immediate plans to sell the central bank’s ETF holdings.
In an interview with Bloomberg, former BOJ chief economist Toshitaka Sekine suggested that the Bank of Japan could raise its benchmark interest rate up to three more times this year. Sekine indicated that the next move could potentially occur as early as June, given the significant room available to adjust its current "excessively" easy settings.
The US Dollar Index (DXY), which gauges the performance of the US Dollar (USD) against six major currencies, trades around 104.60 after rebounding from a multi-week low of 104.08 marked on Thursday. The Federal Reserve (Fed) maintains a cautious stance regarding inflation and the potential for rate cuts in 2024.
Reuters reports on Thursday, Atlanta Fed President Raphael Bostic said at an event in Jacksonville that the need for patience with interest rates, noting that substantial pricing pressure persists in the US economy. Additionally, Cleveland Fed President Loretta Mester indicated that it might take longer than anticipated to confidently ascertain the inflation trajectory, suggesting that the Fed should maintain its restrictive stance for an extended period.
- Gold price retraces on the rebound of the USD on Friday.
- The Fed's cautious approach weighs on the yellow metal.
- Gold traders will focus on the Fed’s Kashkari, Waller, and Daly speeches on Friday.
The gold price (XAU/USD) trades with a bearish bias on Friday after retreating from the nearly $2,400 barrier. The bullish move of precious metals in the previous sessions was bolstered by the softer-than-expected US inflation data in April, which triggered hope for rate cuts from the US Federal Reserve (Fed). However, the cautious approach from Fed officials on Thursday to keep borrowing costs high for longer suggested that the US central bank is not in a rush to cut interest rates this year. This, in turn, boosts the US Dollar (USD) broadly and drags the yellow metal lower, as higher interest rates might well reduce overall investment demand for non-yielding gold.
In the absence of top-tier economic data from the US docket, market participants will monitor Fedspeak, which might offer some hints about the future path of the Fed’s monetary policy. The Fed’s Kashkari, Waller, and Daly are set to speak later on Friday.
Daily Digest Market Movers: Gold price edges lower as Fed officials suggest interest rates should stay higher for longer
- The US weekly Initial Jobless Claims increased by 222K for the week ending May 11 from 232K in the previous week, above the 220K estimated, according to the US Bureau of Labor Statistics (BLS).
- Housing Starts rose by 5.7% MoM to 1.36 million in April, while Building Permits dropped by 3% MoM in April to 1.44 million.
- Atlanta Fed President Raphael Bostic said he saw signs of cooling inflation in the recent CPI report, but he prefers to watch the May and June data to gain confidence that the inflation doesn’t turn back the other way.
- Cleveland Fed President Loretta Mester said policy was well positioned, and it was too soon to say progress on inflation had stalled.
- Richmond Fed President Tom Barkin noted the central bank needs to keep borrowing costs high for longer to ensure inflation is on track to its target, citing higher prices in the services sector.
- Financial markets are currently pricing in nearly 75% odds of a Fed rate cut in September, an increase from 65% earlier in the week. The markets are also pricing in full 25 basis point (bps) rate cuts before the end of the year, according to the CME FedWatch Tool.
Technical Analysis: Gold price’s upside remains intact
The gold price trades on a negative note on the day. According to the four-hour chart, the precious metal has formed an ascending trend channel since May 2. The constructive outlook of gold remains intact, as it is above the 100-period Exponential Moving Average (EMA). The path of least resistance level is to the upside, as XAU/USD stands in bullish territory around 62.00.
The upper boundary of the ascending trend channel and psychological barrier of $2,400 act as a crucial resistance level for the yellow metal for the time being. With a break above this level, gold could make another attempt at an all-time high of $2,432 en route to the $2,500 round figure.
In the bearish case, the first downside filter to watch is the lower limit of the ascending trend channel of $2,355. Further south, the next contention level is seen at the 100-period EMA at $2,340. Any follow-through selling below the mentioned level might drag XAU/USD back to $2,300.
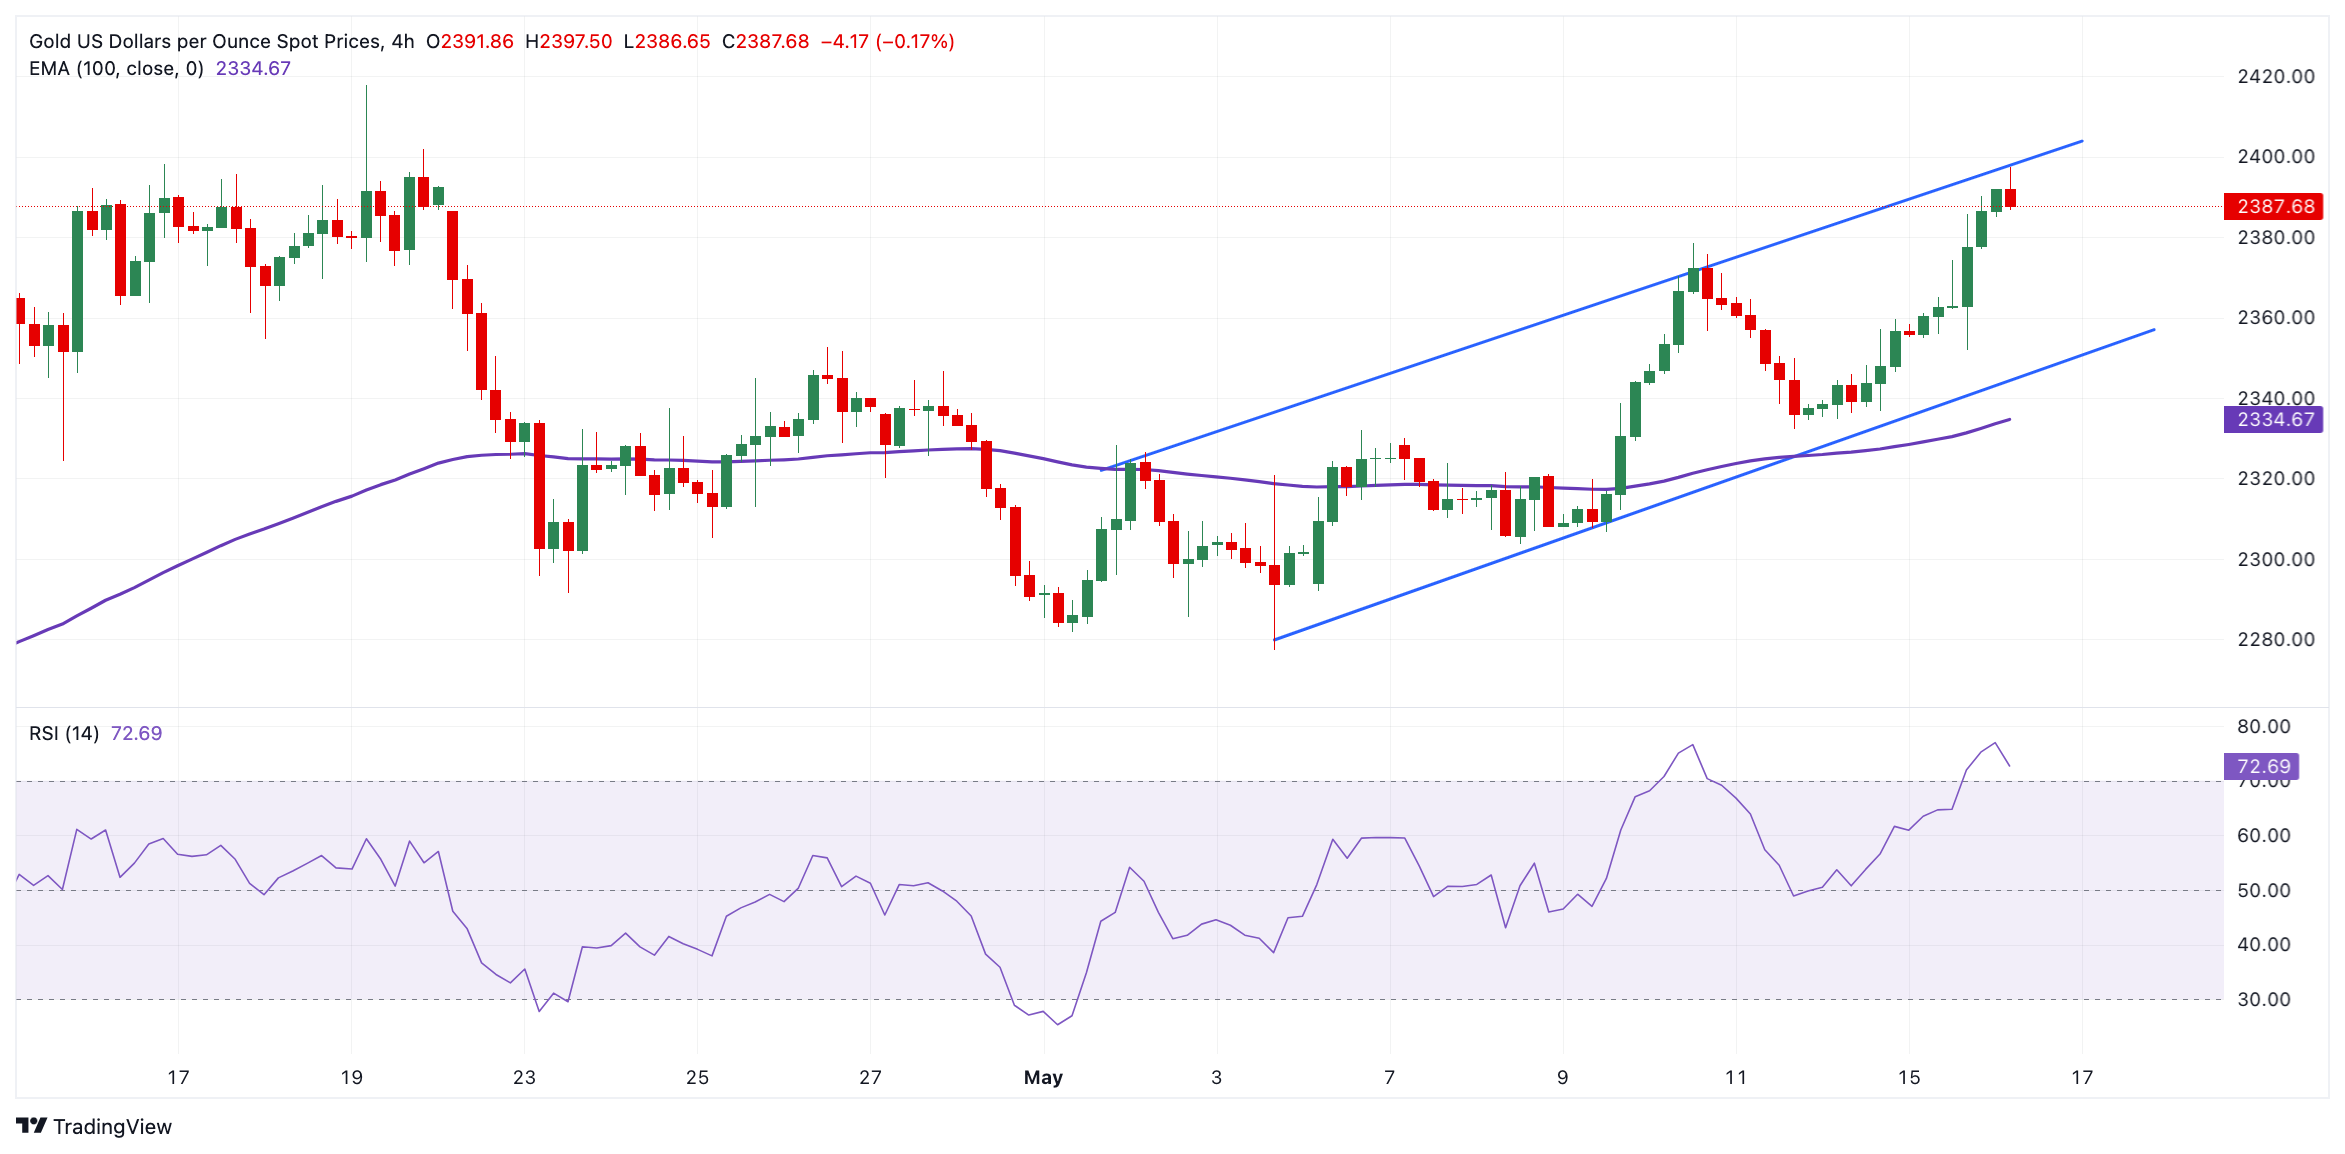
US Dollar price today
The table below shows the percentage change of US Dollar (USD) against listed major currencies today. US Dollar was the strongest against the Japanese Yen.
| USD | EUR | GBP | CAD | AUD | JPY | NZD | CHF | |
| USD | 0.07% | 0.11% | 0.08% | 0.25% | 0.31% | 0.19% | 0.11% | |
| EUR | -0.07% | 0.04% | 0.00% | 0.18% | 0.24% | 0.13% | 0.04% | |
| GBP | -0.11% | -0.04% | -0.04% | 0.14% | 0.19% | 0.07% | -0.01% | |
| CAD | -0.08% | -0.01% | 0.04% | 0.17% | 0.23% | 0.12% | 0.03% | |
| AUD | -0.26% | -0.18% | -0.13% | -0.17% | 0.06% | -0.06% | -0.14% | |
| JPY | -0.32% | -0.24% | -0.20% | -0.23% | -0.07% | -0.11% | -0.19% | |
| NZD | -0.20% | -0.13% | -0.09% | -0.13% | 0.05% | 0.10% | -0.10% | |
| CHF | -0.11% | -0.03% | 0.01% | -0.03% | 0.15% | 0.20% | 0.10% |
The heat map shows percentage changes of major currencies against each other. The base currency is picked from the left column, while the quote currency is picked from the top row. For example, if you pick the Euro from the left column and move along the horizontal line to the Japanese Yen, the percentage change displayed in the box will represent EUR (base)/JPY (quote).
Gold FAQs
Gold has played a key role in human’s history as it has been widely used as a store of value and medium of exchange. Currently, apart from its shine and usage for jewelry, the precious metal is widely seen as a safe-haven asset, meaning that it is considered a good investment during turbulent times. Gold is also widely seen as a hedge against inflation and against depreciating currencies as it doesn’t rely on any specific issuer or government.
Central banks are the biggest Gold holders. In their aim to support their currencies in turbulent times, central banks tend to diversify their reserves and buy Gold to improve the perceived strength of the economy and the currency. High Gold reserves can be a source of trust for a country’s solvency. Central banks added 1,136 tonnes of Gold worth around $70 billion to their reserves in 2022, according to data from the World Gold Council. This is the highest yearly purchase since records began. Central banks from emerging economies such as China, India and Turkey are quickly increasing their Gold reserves.
Gold has an inverse correlation with the US Dollar and US Treasuries, which are both major reserve and safe-haven assets. When the Dollar depreciates, Gold tends to rise, enabling investors and central banks to diversify their assets in turbulent times. Gold is also inversely correlated with risk assets. A rally in the stock market tends to weaken Gold price, while sell-offs in riskier markets tend to favor the precious metal.
The price can move due to a wide range of factors. Geopolitical instability or fears of a deep recession can quickly make Gold price escalate due to its safe-haven status. As a yield-less asset, Gold tends to rise with lower interest rates, while higher cost of money usually weighs down on the yellow metal. Still, most moves depend on how the US Dollar (USD) behaves as the asset is priced in dollars (XAU/USD). A strong Dollar tends to keep the price of Gold controlled, whereas a weaker Dollar is likely to push Gold prices up.
European Central Bank (ECB) Board member Isabel Schnabel said on Friday that the central bank may cut interest rates in June, but policymakers should look very carefully at the data because there is a risk of easing prematurely, per Reuters.
Key quotes
“Says depending on incoming data rate cut in June may be appropriate but a path beyond June is much more uncertain.”
“Recent data have confirmed that the last mile of disinflation is most difficult.”
“Based on current data, a rate cut in July does not seem warranted.”
“With inflation risks still being tilted to the upside, front-loading of easing process would come with a risk of easing prematurely.”
“We cannot pre-commit to any particular rate path due to very high uncertainty.”
“It's virtually impossible to quantify a change in the natural rate of interest in real-time with any reasonable degree of precision.”
“The closer we get to a potentially neutral level, and this could be well above 2%, we need to move even more cautiously.”
“2% target has served us well, a change in the target is not appropriate.”
“Geopolitical shocks are a key risk that we need to watch, and this poses upside risks to the inflation outlook.”
“Over the longer run, geopolitical fragmentation would pose further upside risks to inflation by reducing the efficiency and reliability of global supply chains.”
Market reaction
These comments have little to no market reaction to the Euro. The EUR/USD pair is trading at 1.0861, losing 0.06% on the day.
ECB FAQs
The European Central Bank (ECB) in Frankfurt, Germany, is the reserve bank for the Eurozone. The ECB sets interest rates and manages monetary policy for the region. The ECB primary mandate is to maintain price stability, which means keeping inflation at around 2%. Its primary tool for achieving this is by raising or lowering interest rates. Relatively high interest rates will usually result in a stronger Euro and vice versa. The ECB Governing Council makes monetary policy decisions at meetings held eight times a year. Decisions are made by heads of the Eurozone national banks and six permanent members, including the President of the ECB, Christine Lagarde.
In extreme situations, the European Central Bank can enact a policy tool called Quantitative Easing. QE is the process by which the ECB prints Euros and uses them to buy assets – usually government or corporate bonds – from banks and other financial institutions. QE usually results in a weaker Euro. QE is a last resort when simply lowering interest rates is unlikely to achieve the objective of price stability. The ECB used it during the Great Financial Crisis in 2009-11, in 2015 when inflation remained stubbornly low, as well as during the covid pandemic.
Quantitative tightening (QT) is the reverse of QE. It is undertaken after QE when an economic recovery is underway and inflation starts rising. Whilst in QE the European Central Bank (ECB) purchases government and corporate bonds from financial institutions to provide them with liquidity, in QT the ECB stops buying more bonds, and stops reinvesting the principal maturing on the bonds it already holds. It is usually positive (or bullish) for the Euro.
- The Australian Dollar extends its losses after mixed economic data from China on Friday.
- The Australian Dollar struggles as Australia’s 10-year bond yield has dropped to a monthly low of 4.2%.
- China’s Retail Sales increased for the consecutive 15th month but the softest gain in the sequence.
- The US Dollar has rebounded as the Fed remains cautious about inflation and potential rate cuts in 2024.
The Australian Dollar (AUD) continues to experience a decline for the second consecutive session, largely influenced by recent mixed economic data from China released on Friday. The Aussie Dollar had already been under pressure after Australia's employment figures released on Thursday presented a mixed picture. Any economic change in the Chinese economy could catalyze the Australian market as both nations are close trade partners.
The Australian Dollar’s decline is bolstered as the yield on Australia’s 10-year government bond has dropped to near 4.2%, marking its lowest level in a month. This decline in bond yields is a reaction to the domestic jobs report, which showed an unexpected slowing in wage growth during the first quarter. The slowing wage growth has led markets to discount the possibility of any interest rate hikes by the Reserve Bank of Australia (RBA).
The US Dollar Index (DXY), which gauges the performance of the US Dollar (USD) against six major currencies, has rebounded from a multi-week low of 104.08 marked on Thursday. The Federal Reserve (Fed) maintains a cautious stance regarding inflation and the potential for rate cuts in 2024. Investors will take more cues from the Minneapolis Fed President Neel Kashkari and San Francisco Fed President Mary Daly's speeches later in the day.
Daily Digest Market Movers: Australian Dollar depreciates after mixed Chinese data
- China's Retail Sales increased 2.3% year-over-year in April, down from March's 3.1% and falling short of the expected 3.8%. This marks the 15th consecutive month of growth in retail activity but represents the slowest uptick in this trend. Meanwhile, Industrial Production improved 6.7% YoY, surpassing the anticipated 5.5% and the previous recording of 4.5%.
- On Thursday, Fed Bank of Atlanta President Raphael Bostic emphasized the need for patience with interest rates, noting that substantial pricing pressure persists in the US economy. Additionally, Cleveland Fed President Loretta Mester indicated that it might take longer than anticipated to confidently ascertain the inflation trajectory, suggesting that the Fed should maintain its restrictive stance for an extended period.
- Australia’s Wage Price Index (QoQ) increased by 0.8% in the first quarter, falling short of the market's forecast of a 0.9% rise. This quarter's increase is the smallest since late 2022. Additionally, annual pay growth slowed slightly to 4.1%, down from the previous 4.2%, and below market expectations.
- Sarah Hunter, Chief Economist and Assistant Governor (Economic) at the Reserve Bank of Australia (RBA), delivered a speech at the REIA Centennial Congress on Thursday. During her address, Hunter explored various potential strategies to address the imbalance between housing supply and demand growth. This issue looms large in Australia, with escalating prices, rents, and homelessness posing significant challenges.
- US Consumer Price Index (CPI) decelerated to 0.3% month-over-month in April, came in at lower than expected 0.4% reading. While Retail Sales flattened, falling short of the expected increase of 0.4%.
- On Tuesday, the Australian Budget for 2024-25 returned to a deficit after recording a surplus of $9.3 billion in 2023-24. The Australian government aims to tackle headline inflation and alleviate the cost of living pressures by allocating billions to reduce energy bills and rent, alongside initiatives to lower income taxes.
- A Reuters report cited Treasurer of Australia Jim Chalmers, expressing his expectation that the current headline inflation rate of 3.6% will return to the Reserve Bank of Australia’s target range of 2-3% by the end of the year. If this scenario unfolds, the central bank will likely consider cutting interest rates earlier than markets had anticipated.
- Federal Reserve Chair Jerome Powell has anticipated a continued decline in inflation on Tuesday. Powell expressed less confidence in the disinflation outlook compared to previous assessments. He also highlighted that Gross Domestic Product (GDP) growth is expected to reach 2% or higher, attributing this positive forecast to the strength of the labor market.
Technical Analysis: Australian Dollar falls toward 0.6650
The Australian Dollar trades around 0.6660 on Friday. Observing the daily chart for AUD/USD showed an ascending triangle formation. Additionally, the 14-day Relative Strength Index (RSI) suggests a bullish sentiment, holding above the 50 mark.
The AUD/USD pair could challenge the upper threshold of the ascending triangle, resting near the four-month peak of 0.6714. A breach above this level might prompt exploration toward the significant barrier at 0.6750.
Conversely, potential support stands at the nine-day Exponential Moving Average (EMA) at 0.6634, followed by the lower boundary of the ascending triangle around at 0.6610. A breakdown below this level could exert downward pressure, directing attention toward the throwback support at 0.6550.
AUD/USD: Daily Chart
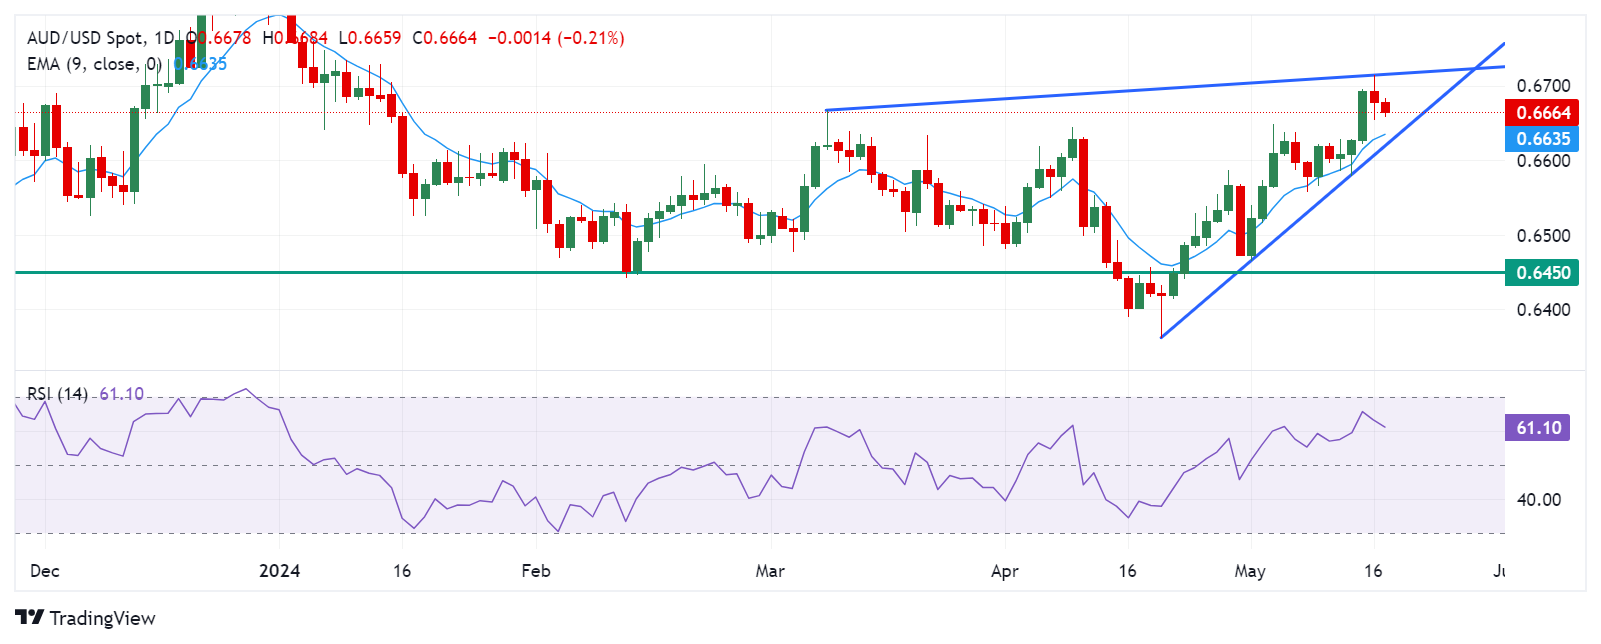
Australian Dollar price today
The table below shows the percentage change of the Australian Dollar (AUD) against listed major currencies today. The Australian Dollar was the weakest against the US Dollar.
| USD | EUR | GBP | CAD | AUD | JPY | NZD | CHF | |
| USD | 0.06% | 0.11% | 0.09% | 0.25% | 0.31% | 0.21% | 0.11% | |
| EUR | -0.08% | 0.03% | 0.02% | 0.19% | 0.24% | 0.16% | 0.05% | |
| GBP | -0.11% | -0.03% | -0.02% | 0.15% | 0.19% | 0.09% | 0.01% | |
| CAD | -0.09% | -0.02% | 0.03% | 0.17% | 0.21% | 0.13% | 0.03% | |
| AUD | -0.27% | -0.18% | -0.15% | -0.15% | 0.04% | -0.03% | -0.14% | |
| JPY | -0.30% | -0.24% | -0.19% | -0.20% | -0.05% | -0.08% | -0.19% | |
| NZD | -0.22% | -0.17% | -0.12% | -0.13% | 0.04% | 0.07% | -0.12% | |
| CHF | -0.11% | -0.04% | -0.01% | -0.03% | 0.14% | 0.18% | 0.12% |
The heat map shows percentage changes of major currencies against each other. The base currency is picked from the left column, while the quote currency is picked from the top row. For example, if you pick the Euro from the left column and move along the horizontal line to the Japanese Yen, the percentage change displayed in the box will represent EUR (base)/JPY (quote).
Australian Dollar FAQs
One of the most significant factors for the Australian Dollar (AUD) is the level of interest rates set by the Reserve Bank of Australia (RBA). Because Australia is a resource-rich country another key driver is the price of its biggest export, Iron Ore. The health of the Chinese economy, its largest trading partner, is a factor, as well as inflation in Australia, its growth rate, and Trade Balance. Market sentiment – whether investors are taking on more risky assets (risk-on) or seeking safe havens (risk-off) – is also a factor, with risk-on positive for AUD.
The Reserve Bank of Australia (RBA) influences the Australian Dollar (AUD) by setting the level of interest rates that Australian banks can lend to each other. This influences the level of interest rates in the economy as a whole. The main goal of the RBA is to maintain a stable inflation rate of 2-3% by adjusting interest rates up or down. Relatively high interest rates compared to other major central banks support the AUD, and the opposite for relatively low. The RBA can also use quantitative easing and tightening to influence credit conditions, with the former AUD-negative and the latter AUD-positive.
China is Australia’s largest trading partner so the health of the Chinese economy is a major influence on the value of the Australian Dollar (AUD). When the Chinese economy is doing well it purchases more raw materials, goods and services from Australia, lifting demand for the AUD, and pushing up its value. The opposite is the case when the Chinese economy is not growing as fast as expected. Positive or negative surprises in Chinese growth data, therefore, often have a direct impact on the Australian Dollar and its pairs.
Iron Ore is Australia’s largest export, accounting for $118 billion a year according to data from 2021, with China as its primary destination. The price of Iron Ore, therefore, can be a driver of the Australian Dollar. Generally, if the price of Iron Ore rises, AUD also goes up, as aggregate demand for the currency increases. The opposite is the case if the price of Iron Ore falls. Higher Iron Ore prices also tend to result in a greater likelihood of a positive Trade Balance for Australia, which is also positive of the AUD.
The Trade Balance, which is the difference between what a country earns from its exports versus what it pays for its imports, is another factor that can influence the value of the Australian Dollar. If Australia produces highly sought after exports, then its currency will gain in value purely from the surplus demand created from foreign buyers seeking to purchase its exports versus what it spends to purchase imports. Therefore, a positive net Trade Balance strengthens the AUD, with the opposite effect if the Trade Balance is negative.
| Raw materials | Closed | Change, % |
|---|---|---|
| Silver | 29.565 | -0.42 |
| Gold | 2376.12 | -0.49 |
| Palladium | 987.78 | -1.1 |
China’s Retail Sales rose 2.3% YoY in April from 3.1% in March, worse than the 3.8% expected. The nation’s Industrial Production improved 6.7% YoY in the same period versus 5.5% anticipated and 4.5% recorded previously. The official data was published by the National Bureau of Statistics (NBS) on Friday.
Meanwhile, the Fixed Asset Investment rose 4.2% YTD YoY in April versus the 4.6% expected and 4.5% seen in March.
Market reaction to Chinese data
The Australian Dollar (AUD) attracts some sellers following the Chinese data. The AUD/USD pair is adding 0.16% on the day to trade at 0.6666, as of writing.
Australian Dollar FAQs
One of the most significant factors for the Australian Dollar (AUD) is the level of interest rates set by the Reserve Bank of Australia (RBA). Because Australia is a resource-rich country another key driver is the price of its biggest export, Iron Ore. The health of the Chinese economy, its largest trading partner, is a factor, as well as inflation in Australia, its growth rate and Trade Balance. Market sentiment – whether investors are taking on more risky assets (risk-on) or seeking safe-havens (risk-off) – is also a factor, with risk-on positive for AUD.
The Reserve Bank of Australia (RBA) influences the Australian Dollar (AUD) by setting the level of interest rates that Australian banks can lend to each other. This influences the level of interest rates in the economy as a whole. The main goal of the RBA is to maintain a stable inflation rate of 2-3% by adjusting interest rates up or down. Relatively high interest rates compared to other major central banks support the AUD, and the opposite for relatively low. The RBA can also use quantitative easing and tightening to influence credit conditions, with the former AUD-negative and the latter AUD-positive.
China is Australia’s largest trading partner so the health of the Chinese economy is a major influence on the value of the Australian Dollar (AUD). When the Chinese economy is doing well it purchases more raw materials, goods and services from Australia, lifting demand for the AUD, and pushing up its value. The opposite is the case when the Chinese economy is not growing as fast as expected. Positive or negative surprises in Chinese growth data, therefore, often have a direct impact on the Australian Dollar and its pairs.
Iron Ore is Australia’s largest export, accounting for $118 billion a year according to data from 2021, with China as its primary destination. The price of Iron Ore, therefore, can be a driver of the Australian Dollar. Generally, if the price of Iron Ore rises, AUD also goes up, as aggregate demand for the currency increases. The opposite is the case if the price of Iron Ore falls. Higher Iron Ore prices also tend to result in a greater likelihood of a positive Trade Balance for Australia, which is also positive of the AUD.
The Trade Balance, which is the difference between what a country earns from its exports versus what it pays for its imports, is another factor that can influence the value of the Australian Dollar. If Australia produces highly sought after exports, then its currency will gain in value purely from the surplus demand created from foreign buyers seeking to purchase its exports versus what it spends to purchase imports. Therefore, a positive net Trade Balance strengthens the AUD, with the opposite effect if the Trade Balance is negative.
- NZD/USD extends losses due to the upward correction in the US Dollar.
- Fed remains cautious about inflation and potential rate cuts in 2024.
- The New Zealand Dollar could draw some support from higher PPI inputs and outputs for Q1.
The NZD/USD pair extended its losses to near 0.6110 during the Asian session on Friday. This decline can be attributed to the recovery of the US Dollar (USD), which rebounded after hitting multi-week lows around 104.00 on Thursday.
The Federal Reserve (Fed) maintains a cautious stance regarding inflation and the potential for rate cuts in 2024. On Thursday, Fed Bank of Atlanta President Raphael Bostic emphasized the need for patience with interest rates, noting that substantial pricing pressure persists in the US economy.
Additionally, Cleveland Fed President Loretta Mester indicated that it might take longer than anticipated to confidently ascertain the inflation trajectory, suggesting that the Fed should maintain its restrictive stance for an extended period.
Furthermore, the US Department of Labor released the US Initial Jobless Claims on Thursday. The number of Americans filing new claims for jobless benefits rose to 222,000 for the week ending May 10, surpassing the market consensus of 220,000 but below the previous week's figure of 232,000.
On the Kiwi front, New Zealand's Producer Price Index (PPI) inputs and outputs increased in the first quarter. PPI input prices rose by 0.7% compared to the expected 0.7%. While PPI output prices increased by 0.9% against the expected 0.5%. These higher-than-expected PPI figures could provide some support for the New Zealand Dollar (NZD), potentially limiting the downside of the NZD/USD pair.
According to Stats NZ, the largest contributors to the rise in output prices were electricity and gas, which saw an 8.8% quarter-on-quarter increase. Energy costs also significantly impacted input prices, climbing 11.6%. Additionally, insurance costs substantially contributed to the increase in PPI input costs, rising by 5.0% quarter-on-quarter.
The People’s Bank of China (PBoC) set the USD/CNY central rate for the trading session ahead on Friday at 7.1045 as compared to the previous day's fix of 7.1020 and 7.2222 Reuters estimates.
- USD/CAD holds positive ground near 1.3620 in Friday’s early Asian session.
- Several Fed officials emphasized their cautious stance to keep the rate higher for longer, lifting the USD.
- The recovery in oil prices is likely to cap the commodity-linked Canadian Dollar.
The USD/CAD pair trades on a stronger note around 1.3620 on Friday during the early Asian trading hours. The uptick of the pair is bolstered by the renewed US Dollar (USD) demand as the US Federal Reserve (Fed) officials emphasized their cautious stance to hold rates higher for longer.
On Thursday, the US weekly Initial Jobless Claims for the week ending May 11 came in at 222,000 from the previous week of 232,000, above the market consensus of 220,000, according to the US Bureau of Labor Statistics (BLS). Housing Starts climbed 5.7% MoM to 1.36 million in April, while Building Permits declined by 3% MoM in April to 1.44 million. However, these mixed reports had little to no impact on the Greenback as traders kept an eye on the Fed official's remarks about the interest rate cuts.
Atlanta Fed President Raphael Bostic stated on Thursday that he saw signs of cooling inflation in the recent report, but he prefers to watch the May and June data to make sure the inflation doesn’t turn back the other way. Meanwhile, Cleveland Fed President Loretta Mester said she wants to see more data to gain confidence that inflation is on course to meet the Fed’s 2% target.
Richmond Fed President Tom Barkin noted the central bank needs to keep borrowing costs high for longer to ensure inflation is on track to its target, citing higher prices in the services sector. Financial markets are currently pricing in nearly 70% odds of a Fed rate cut in September, an increase from 65% earlier in the week, according to the CME FedWatch Tool.
On the Loonie front, Canada’s Manufacturing Sales fell 2.1% MoM in March from a 0.9% rise in February, weaker than the market expectation of a decline of 1.4%, Statistics Canada showed Wednesday. Elsewhere, the extended rebound in oil prices might lift the commodity-linked Canadian Dollar (CAD) and cap the upside of the pair as Canada is the largest oil exporter to the United States.
| Index | Change, points | Closed | Change, % |
|---|---|---|---|
| NIKKEI 225 | 534.53 | 38920.26 | 1.39 |
| Hang Seng | 302.82 | 19376.53 | 1.59 |
| KOSPI | 22.66 | 2753 | 0.83 |
| ASX 200 | 127.6 | 7881.3 | 1.65 |
| DAX | -130.55 | 18738.81 | -0.69 |
| CAC 40 | -51.5 | 8188.49 | -0.63 |
| Dow Jones | -38.62 | 39869.38 | -0.1 |
| S&P 500 | -11.05 | 5297.1 | -0.21 |
| NASDAQ Composite | -44.07 | 16698.32 | -0.26 |
- WTI prices gains traction near $78.90 on Friday.
- The softer US April inflation data, Fed rate cut expectations, and a drop in US crude inventories boost the black gold.
- The ongoing geopolitical risks in the Middle East might cap the downside of WTI prices.
Western Texas Intermediate (WTI), the US crude oil benchmark, is trading around $78.90 on Friday. The black gold edges higher amid the recent drop in US crude inventories and the possible interest rate cuts by the Federal Reserve (Fed).
The recent US CPI inflation report this week showed that US inflation eased slightly in April, prompting the expectation of interest rate cuts from the US Fed in September. This, in turn, weighs on the US Dollar (USD) and benefits USD-denominated oil as lower interest rates help stimulate the economy, which can boost crude oil demand.
About the data, a decline in oil inventories lifted the black gold. Crude inventories in the US for the week ending May 3 fell by 2.5 million barrels to 457 million barrels, from 1.36 million barrels drawn in the previous week, according to the Energy Information Administration (EIA). The market consensus projected that stocks would decrease by 1.35 million barrels.
On Thursday, Israel's tanks moved into Jabalia in northern Gaza and pummelling Rafah in the south without advancing, per Reuters. Ceasefire negotiations mediated by Qatar and Egypt are at a stalemate, with Hamas demanding a stop to attacks and Israel refusing until the group is annihilated. Oil traders will closely monitor the developments surrounding the renewed geopolitical tensions in the Middle East. Any escalating geopolitical risks might raise concern about oil supply disruptions, lifting the WTI prices.
| Pare | Closed | Change, % |
|---|---|---|
| AUDUSD | 0.66761 | -0.27 |
| EURJPY | 168.811 | 0.2 |
| EURUSD | 1.08659 | -0.18 |
| GBPJPY | 196.811 | 0.25 |
| GBPUSD | 1.26694 | -0.12 |
| NZDUSD | 0.61194 | -0.03 |
| USDCAD | 1.36157 | 0.09 |
| USDCHF | 0.90563 | 0.42 |
| USDJPY | 155.348 | 0.38 |


© 2000-2026. Sva prava zaštićena.
Sajt je vlasništvo kompanije Teletrade D.J. LLC 2351 LLC 2022 (Euro House, Richmond Hill Road, Kingstown, VC0100, St. Vincent and the Grenadines).
Svi podaci koji se nalaze na sajtu ne predstavljaju osnovu za donošenje investicionih odluka, već su informativnog karaktera.
The company does not serve or provide services to customers who are residents of the US, Canada, Iran, The Democratic People's Republic of Korea, Yemen and FATF blacklisted countries.
Izvršenje trgovinskih operacija sa finansijskim instrumentima upotrebom marginalne trgovine pruža velike mogućnosti i omogućava investitorima ostvarivanje visokih prihoda. Međutim, takav vid trgovine povezan je sa potencijalno visokim nivoom rizika od gubitka sredstava. Проведение торговых операций на финанcовых рынках c маржинальными финанcовыми инcтрументами открывает широкие возможноcти, и позволяет инвеcторам, готовым пойти на риcк, получать выcокую прибыль, но при этом неcет в cебе потенциально выcокий уровень риcка получения убытков. Iz tog razloga je pre započinjanja trgovine potrebno odlučiti o izboru odgovarajuće investicione strategije, uzimajući u obzir raspoložive resurse.
Upotreba informacija: U slučaju potpunog ili delimičnog preuzimanja i daljeg korišćenja materijala koji se nalazi na sajtu, potrebno je navesti link odgovarajuće stranice na sajtu kompanije TeleTrade-a kao izvora informacija. Upotreba materijala na internetu mora biti praćena hiper linkom do web stranice teletrade.org. Automatski uvoz materijala i informacija sa stranice je zabranjen.
Ako imate bilo kakvih pitanja, obratite nam se pr@teletrade.global.
транcфери