- Analiza
- Novosti i instrumenti
- Vesti sa tržišta
Forex-novosti i prognoze od 16-10-2024
- WTI price loses ground to around $70.70 in Thursday’s early Asian session.
- Easing fears of an oil supply disruption in the Middle East, sluggish global oil demand outlook weigh on the WTI price.
- Any positive development surrounding more Chinese fresh stimulus plans could cap the WTI’s downside.
West Texas Intermediate (WTI), the US crude oil benchmark, is trading around $70.70 on Thursday. The WTI price edges lower after selling off on reports that Israel will not attack Iran’s oil facilities.
Israel told the United States that a planned retaliatory attack on Iran won’t target nuclear and oil facilities, according to senior Biden administration officials, a promise sought by the White House to head off further Middle East escalation and to avoid a potential oil price increase, per the Wall Street Journal. Traders will closely watch the developments surrounding the geopolitical tensions in the Middle East. Any signs of escalation could lift the WTI price.
US crude oil inventories rose more than expected last week. According to the American Petroleum Institute (API), crude oil stockpiles in the United States for the week ending October 11 fell by 1.58 million barrels, compared to a rise of 10.9 million barrels in the previous week. The market consensus estimated that stocks would increase by 2.3 million barrels.
The Organisation of the Petroleum Exporting Countries (OPEC) and the International Energy Agency (EIA) this week cut their 2024 global oil demand growth forecasts. The IEA estimated global oil demand to grow 1.2 million barrels per day to 104.3 million bpd next year, about 300,000 bpd below prior forecasts. Furthermore, stimulus measures in China fail to boost the black gold price.
"On the top of every ardent bear's wish list are a stuttering Chinese economy, relative calm in the Near East, and downward revisions in global oil demand growth. These wishes were granted at the beginning of the week," noted Tamas Varga, an analyst at TP ICAP.
The Chinese officials will hold a joint briefing at 2.00 GMT on Thursday on potential measures to support the economy. Additional fresh stimulus plans from China, the top largest consumer of oil in the world, could provide some support to the WTI price in the near term.
WTI Oil FAQs
WTI Oil is a type of Crude Oil sold on international markets. The WTI stands for West Texas Intermediate, one of three major types including Brent and Dubai Crude. WTI is also referred to as “light” and “sweet” because of its relatively low gravity and sulfur content respectively. It is considered a high quality Oil that is easily refined. It is sourced in the United States and distributed via the Cushing hub, which is considered “The Pipeline Crossroads of the World”. It is a benchmark for the Oil market and WTI price is frequently quoted in the media.
Like all assets, supply and demand are the key drivers of WTI Oil price. As such, global growth can be a driver of increased demand and vice versa for weak global growth. Political instability, wars, and sanctions can disrupt supply and impact prices. The decisions of OPEC, a group of major Oil-producing countries, is another key driver of price. The value of the US Dollar influences the price of WTI Crude Oil, since Oil is predominantly traded in US Dollars, thus a weaker US Dollar can make Oil more affordable and vice versa.
The weekly Oil inventory reports published by the American Petroleum Institute (API) and the Energy Information Agency (EIA) impact the price of WTI Oil. Changes in inventories reflect fluctuating supply and demand. If the data shows a drop in inventories it can indicate increased demand, pushing up Oil price. Higher inventories can reflect increased supply, pushing down prices. API’s report is published every Tuesday and EIA’s the day after. Their results are usually similar, falling within 1% of each other 75% of the time. The EIA data is considered more reliable, since it is a government agency.
OPEC (Organization of the Petroleum Exporting Countries) is a group of 12 Oil-producing nations who collectively decide production quotas for member countries at twice-yearly meetings. Their decisions often impact WTI Oil prices. When OPEC decides to lower quotas, it can tighten supply, pushing up Oil prices. When OPEC increases production, it has the opposite effect. OPEC+ refers to an expanded group that includes ten extra non-OPEC members, the most notable of which is Russia.
- USD/CAD trades with mild gains around 1.3755 in Thursday’s early Asian session.
- The expectation of a slower pace of Fed rate cuts underpins the USD broadly.
- The BoC is expected to cut rates by 50 bps next week.
The USD/CAD pair posts modest gains to near 1.3755 during the early Asian session on Thursday. The US Dollar Index (DXY) rose further to multi-week tops above 103.50 amid rising bets that the US Federal Reserve (Fed) will proceed with modest interest rate cuts over the next year. Later on Thursday, the US Retail Sales will take centre stage.
The Greenback edges higher as traders see the Fed gradually lowering interest rates in the remainder of the year. Traders have priced in a nearly 94% chance of a 25 basis points (bps) Fed rate cut in November, according to the CME FedWatch tool.
Minneapolis Fed President Neel Kashkari said earlier this week that future interest rate cuts would be “modest” and emphasized that policy decisions would depend on economic data. Meanwhile, San Francisco Fed President Mary Daly said on Tuesday that there is room for the Fed to lower rates further, following last month’s half point reduction in fed funds to 4.75% to 5.00%
Additionally, persistent geopolitical tensions in the Middle East and US election uncertainty could provide some support to the USD. "Volatility ... and the U.S. dollar tend to rise in tandem going into the U.S. election, especially with the rise of (former U.S. President) Trump in betting markets and the 50 basis-point (bp) cut being out of the picture for the Fed at least in November. This would be the best case for the dollar in the short term,” said Boris Kovacevic, global macro strategist, at Convera in Vienna, Austria.
On the Loonie front, a fall in crude oil prices might weigh on the commodity-linked Canadian Dollar (CAD) as Canada is the largest oil exporter to the United States. Furthermore, the expectation that the Bank of Canada (BoC) would accelerate its easing cycle after September’s inflation data might cap the CAD’s upside. Statistics Canada reported on Tuesday that the Consumer Price Index (CPI) rose 1.6% YoY in September, the slowest annual pace of inflation since February 2021.
“I think this morning’s inflation number has really solidified the case for the Bank of Canada to cut by 50 basis points next week,” noted Charles St-Arnaud, the chief economist with Alberta Central and former economist at the Bank of Canada.
Canadian Dollar FAQs
The key factors driving the Canadian Dollar (CAD) are the level of interest rates set by the Bank of Canada (BoC), the price of Oil, Canada’s largest export, the health of its economy, inflation and the Trade Balance, which is the difference between the value of Canada’s exports versus its imports. Other factors include market sentiment – whether investors are taking on more risky assets (risk-on) or seeking safe-havens (risk-off) – with risk-on being CAD-positive. As its largest trading partner, the health of the US economy is also a key factor influencing the Canadian Dollar.
The Bank of Canada (BoC) has a significant influence on the Canadian Dollar by setting the level of interest rates that banks can lend to one another. This influences the level of interest rates for everyone. The main goal of the BoC is to maintain inflation at 1-3% by adjusting interest rates up or down. Relatively higher interest rates tend to be positive for the CAD. The Bank of Canada can also use quantitative easing and tightening to influence credit conditions, with the former CAD-negative and the latter CAD-positive.
The price of Oil is a key factor impacting the value of the Canadian Dollar. Petroleum is Canada’s biggest export, so Oil price tends to have an immediate impact on the CAD value. Generally, if Oil price rises CAD also goes up, as aggregate demand for the currency increases. The opposite is the case if the price of Oil falls. Higher Oil prices also tend to result in a greater likelihood of a positive Trade Balance, which is also supportive of the CAD.
While inflation had always traditionally been thought of as a negative factor for a currency since it lowers the value of money, the opposite has actually been the case in modern times with the relaxation of cross-border capital controls. Higher inflation tends to lead central banks to put up interest rates which attracts more capital inflows from global investors seeking a lucrative place to keep their money. This increases demand for the local currency, which in Canada’s case is the Canadian Dollar.
Macroeconomic data releases gauge the health of the economy and can have an impact on the Canadian Dollar. Indicators such as GDP, Manufacturing and Services PMIs, employment, and consumer sentiment surveys can all influence the direction of the CAD. A strong economy is good for the Canadian Dollar. Not only does it attract more foreign investment but it may encourage the Bank of Canada to put up interest rates, leading to a stronger currency. If economic data is weak, however, the CAD is likely to fall.
- EUR/USD withered further on Wednesday, sagging below 1.0900.
- ECB rate cut looms large around the corner, broadly expected to trim rates 25 bps.
- Final EU inflation figures are unlikely to move the needle on Thursday.
EUR/USD is in freefall, plummeting to multi-week lows as the Euro continues to crumple ahead of the European Central Bank’s (ECB) upcoming rate call on Thursday. The ECB is widely expected to trim interest rates by a quarter of a percent, or 25 bps.
All eyes will be on the ECB during Thursday’s European market session. The ECB is widely expected to trim its Main Refinancing Operations Rate by 25 bps to 3.4% from 3.65%, with the ECB’s Rate on Deposit Facility expected to take a matching 25 bps trim to 3.25% from 3.5%. With the ECB broadly expected to reduce rates in the face of a lopsided and cooling pan-EU economy, the Euro is running out of room quickly and can be expected to continue declining in the near-term.
With the ECB set to dominate Fiber flows heading into the back half of the trading week, all that’s on the Greenback side of the data docket will be Thursday’s US Retail Sales. Markets are expecting an improvement in US retailer volumes, forecasting a MoM uptick of 0.3% in September Retail Sales compared to August’s 0.1% print.
EUR/USD price forecast
EUR/USD continues to tilt firmly into bearish momentum, slumping further below the 200-day Exponential Moving Average (EMA) at the 1.0900 handle. Extended short pressure could see the pair continue its current one-sided backslide to the 1.0800 region.
Fiber is down over 3% and falling fast after tumbling from recent highs above the 1.1200 handle set in late September. The pair has closed in the red for all but four of the last 15 consecutive trading days, and is poised for a third consecutive bearish week.
EUR/USD daily chart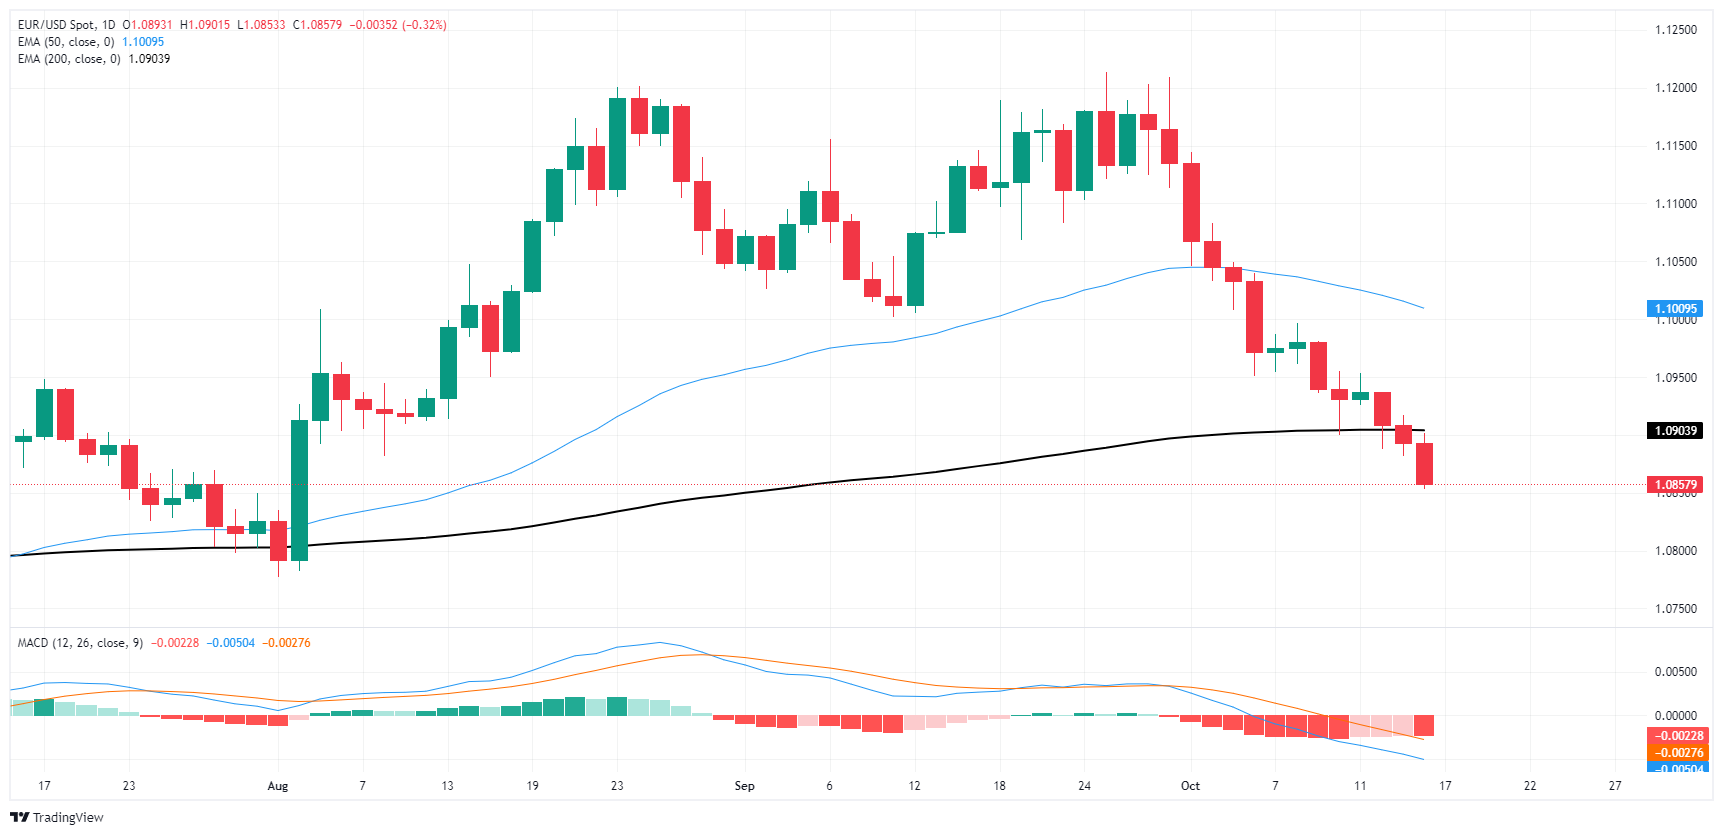
Euro FAQs
The Euro is the currency for the 19 European Union countries that belong to the Eurozone. It is the second most heavily traded currency in the world behind the US Dollar. In 2022, it accounted for 31% of all foreign exchange transactions, with an average daily turnover of over $2.2 trillion a day. EUR/USD is the most heavily traded currency pair in the world, accounting for an estimated 30% off all transactions, followed by EUR/JPY (4%), EUR/GBP (3%) and EUR/AUD (2%).
The European Central Bank (ECB) in Frankfurt, Germany, is the reserve bank for the Eurozone. The ECB sets interest rates and manages monetary policy. The ECB’s primary mandate is to maintain price stability, which means either controlling inflation or stimulating growth. Its primary tool is the raising or lowering of interest rates. Relatively high interest rates – or the expectation of higher rates – will usually benefit the Euro and vice versa. The ECB Governing Council makes monetary policy decisions at meetings held eight times a year. Decisions are made by heads of the Eurozone national banks and six permanent members, including the President of the ECB, Christine Lagarde.
Eurozone inflation data, measured by the Harmonized Index of Consumer Prices (HICP), is an important econometric for the Euro. If inflation rises more than expected, especially if above the ECB’s 2% target, it obliges the ECB to raise interest rates to bring it back under control. Relatively high interest rates compared to its counterparts will usually benefit the Euro, as it makes the region more attractive as a place for global investors to park their money.
Data releases gauge the health of the economy and can impact on the Euro. Indicators such as GDP, Manufacturing and Services PMIs, employment, and consumer sentiment surveys can all influence the direction of the single currency. A strong economy is good for the Euro. Not only does it attract more foreign investment but it may encourage the ECB to put up interest rates, which will directly strengthen the Euro. Otherwise, if economic data is weak, the Euro is likely to fall. Economic data for the four largest economies in the euro area (Germany, France, Italy and Spain) are especially significant, as they account for 75% of the Eurozone’s economy.
Another significant data release for the Euro is the Trade Balance. This indicator measures the difference between what a country earns from its exports and what it spends on imports over a given period. If a country produces highly sought after exports then its currency will gain in value purely from the extra demand created from foreign buyers seeking to purchase these goods. Therefore, a positive net Trade Balance strengthens a currency and vice versa for a negative balance.
- GBP/USD backslid another two-thirds of one percent on Wednesday.
- Cable shed more weight after UK CPI inflation figures missed the mark.
- US & UK Retail Sales figures go head-to-head with releases on Thursday and Friday, respectively.
Tension snapped in GBP/UISD chart action on Wednesday, with Cable losing the tug of war and backsliding out of recent congestion. Cable tumbled two-thirds of one percent and slipped below the 1.3000 handle during the midweek market session. GBP markets withered after UK Consumer Price Index (CPI) inflation figures missed the mark, sending the Pound Sterling to a fresh eight-week low.
UK CPI inflation number widely missed median market forecasts as inflation drops faster and further than investors initially anticipated in September. Headline CPI inflation for the year ended in September eased to 1.7% from 2.2%, with markets expecting a print of 1.9%. Core CPI inflation remains stubbornly higher than headline inflation measures, but still eased faster than expected, dipping to 3.2% YoY from the previous 3.6% and wringing extra out of the forecast 3.4%.
The UK is witnessing its slowest pace of annual inflation growth since May of 2021, and rising concerns of a deepening economic slowdown are dragging Cable lower. UK Producer Price Index (PPI) figures also contracted more than expected in September, with headline PPI Output prices swooning -0.7% YoY, below the forecast -0.6% and eating away the previous 0.2%. The UK Retail Price Index also hit its lowest measure since April of 2021, falling to 2.7% YoY compared to the previous period’s 3.5% and the median market forecast of 3.1%.
Up next on the data docket will be Thursday’s US Retail Sales. Markets are expecting an improvement in US retailer volumes, forecasting a MoM uptick of 0.3% in September Retail Sales compared to August’s 0.1% print.
The UK’s last chance to impress traders will come on Friday, when UK Retail Sales figures get released. Unfortunately, investors aren’t expecting much; September’s UK Retail Sales are forecast to slump to -0.3% MoM from the previous 0.1%.
GBP/USD price forecast
GBP/USD is set to close for a third straight week in the red as long as Greenback bulls can keep their hands on the wheel for the back half of the trading week. The pair has declined nearly 3.5% after hitting multi-month highs near 1.3450 in September, and the loss of the 1.3000 handle serves as a last-chance wakeup call for Pound Sterling bidders.
GBP/USD daily chart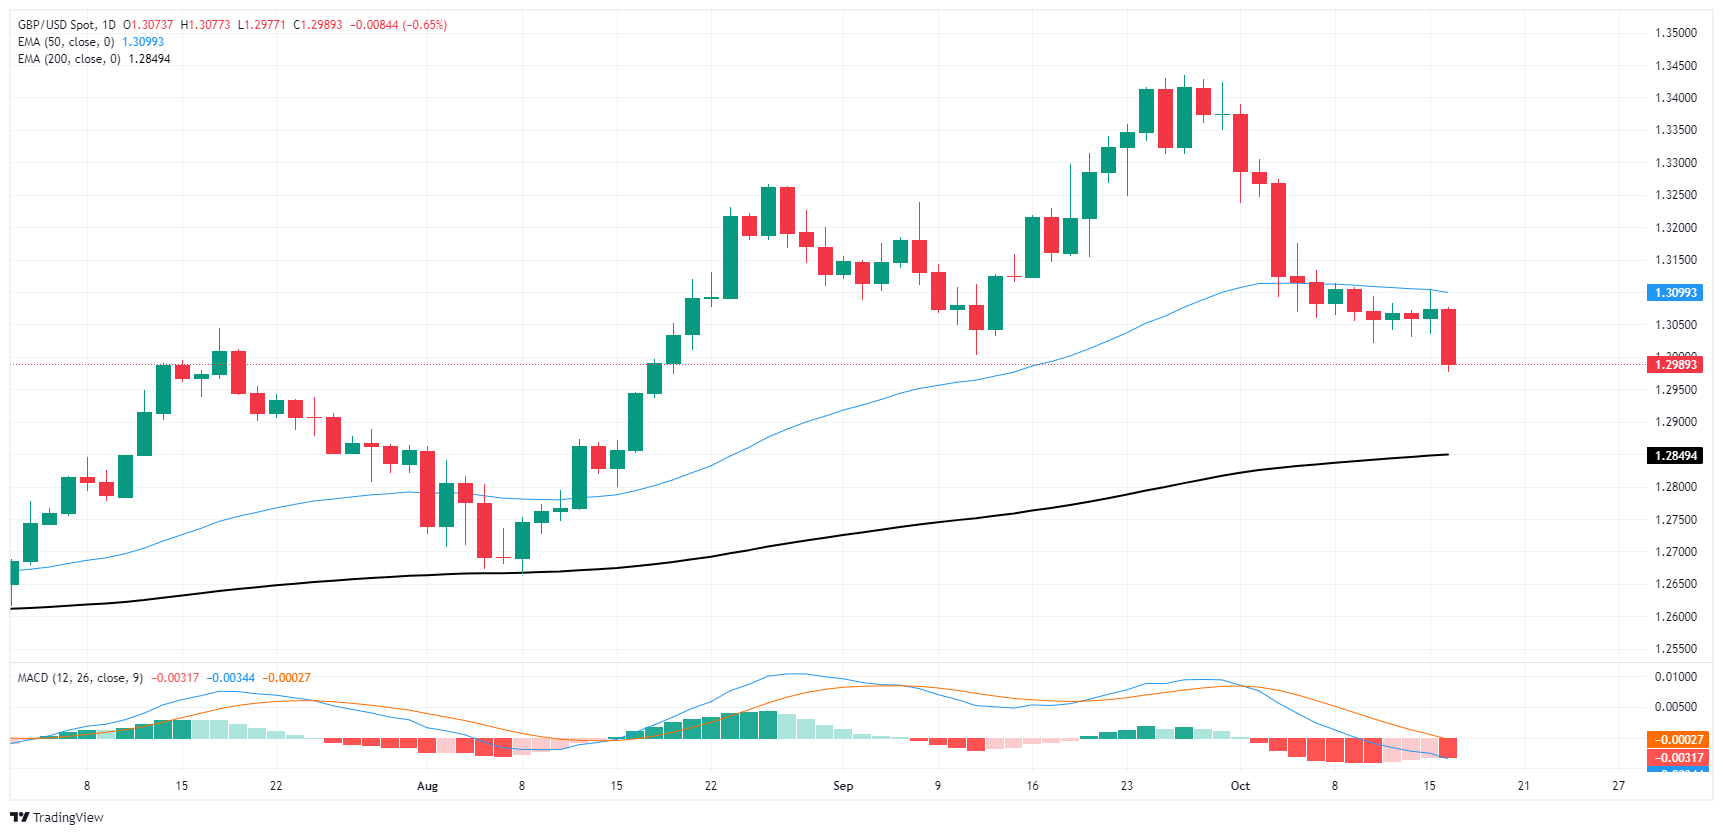
Euro FAQs
The Euro is the currency for the 19 European Union countries that belong to the Eurozone. It is the second most heavily traded currency in the world behind the US Dollar. In 2022, it accounted for 31% of all foreign exchange transactions, with an average daily turnover of over $2.2 trillion a day. EUR/USD is the most heavily traded currency pair in the world, accounting for an estimated 30% off all transactions, followed by EUR/JPY (4%), EUR/GBP (3%) and EUR/AUD (2%).
The European Central Bank (ECB) in Frankfurt, Germany, is the reserve bank for the Eurozone. The ECB sets interest rates and manages monetary policy. The ECB’s primary mandate is to maintain price stability, which means either controlling inflation or stimulating growth. Its primary tool is the raising or lowering of interest rates. Relatively high interest rates – or the expectation of higher rates – will usually benefit the Euro and vice versa. The ECB Governing Council makes monetary policy decisions at meetings held eight times a year. Decisions are made by heads of the Eurozone national banks and six permanent members, including the President of the ECB, Christine Lagarde.
Eurozone inflation data, measured by the Harmonized Index of Consumer Prices (HICP), is an important econometric for the Euro. If inflation rises more than expected, especially if above the ECB’s 2% target, it obliges the ECB to raise interest rates to bring it back under control. Relatively high interest rates compared to its counterparts will usually benefit the Euro, as it makes the region more attractive as a place for global investors to park their money.
Data releases gauge the health of the economy and can impact on the Euro. Indicators such as GDP, Manufacturing and Services PMIs, employment, and consumer sentiment surveys can all influence the direction of the single currency. A strong economy is good for the Euro. Not only does it attract more foreign investment but it may encourage the ECB to put up interest rates, which will directly strengthen the Euro. Otherwise, if economic data is weak, the Euro is likely to fall. Economic data for the four largest economies in the euro area (Germany, France, Italy and Spain) are especially significant, as they account for 75% of the Eurozone’s economy.
Another significant data release for the Euro is the Trade Balance. This indicator measures the difference between what a country earns from its exports and what it spends on imports over a given period. If a country produces highly sought after exports then its currency will gain in value purely from the extra demand created from foreign buyers seeking to purchase these goods. Therefore, a positive net Trade Balance strengthens a currency and vice versa for a negative balance.
- The NZD/USD declined in Wednesday's session, continuing its bearish momentum.
- RSI has dropped to 34, indicating oversold conditions and rising selling pressure.
- MACD remains flat and red, suggesting a bearish trend with weakening selling pressure.
In Wednesday's session, the NZD/USD extended its recent decline, falling by 0.27% to 0.6050. The technical indicators remain bearish, indicating a continuation of the selling pressure that has dominated recent trading sessions.
The Relative Strength Index (RSI) has fallen into oversold territory, with a value of 34 and a sharply declining slope. This suggests that selling pressure is increasing and that the bears are gaining strength but that a correction might be in the horizon. The Moving Average Convergence Divergence (MACD) histogram is flat and red, indicating a bearish outlook. As long as the RSI remains below 50 and the MACD remains red, the technical outlook will remain bearish for the NZD/USD but sellers shouldn’t take off the table a healthy correction.
NZD/USD daily chart
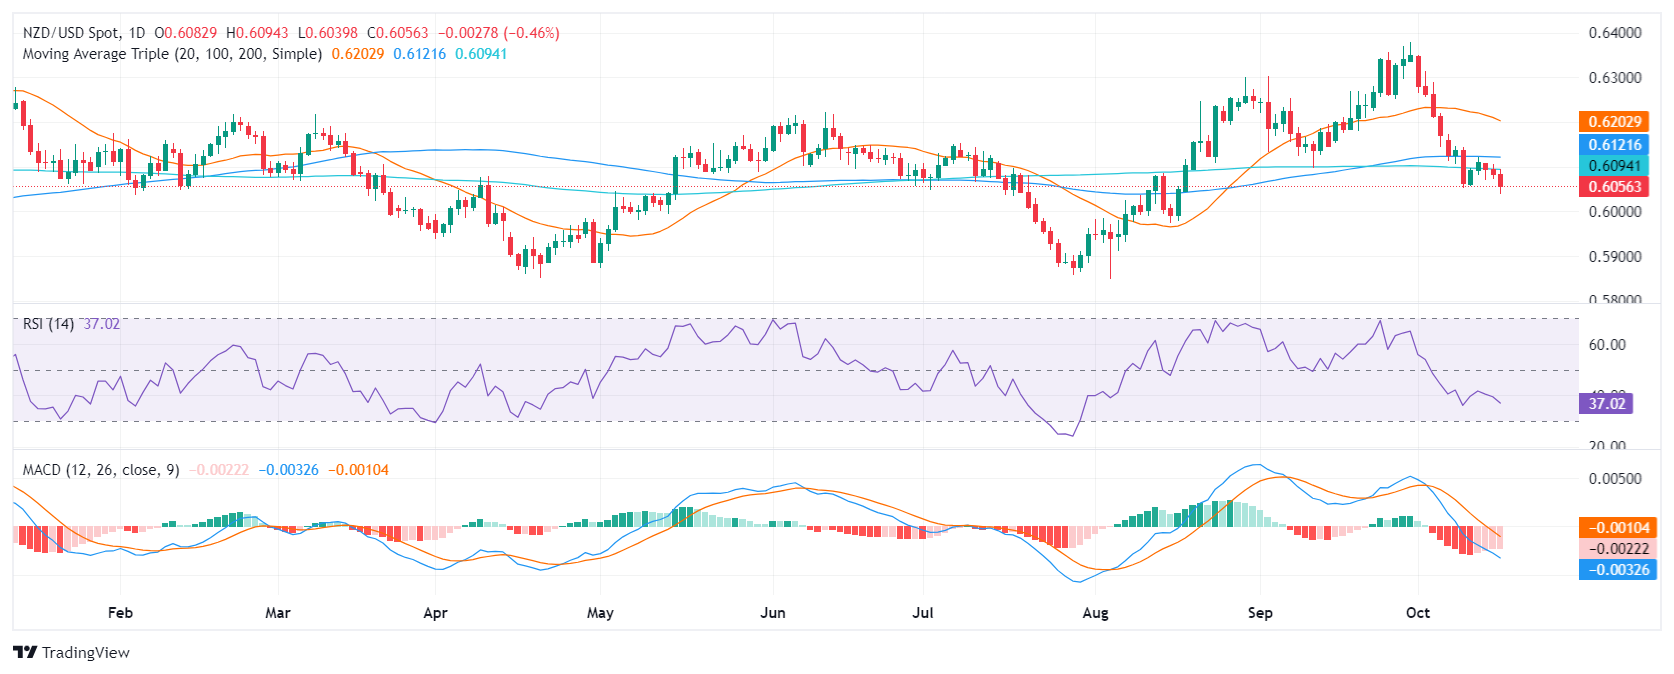
The overall outlook for the NZD/USD remains bearish. The pair has been trading below key support levels for several sessions and has yet to show any signs of a recovery. The 0.6100 area where the 100 and 200-day Simple Moving Average (SMA) remains a key level to watch, as a consolidation below this level could open the door for a further decline towards 0.6000 while an upwards break of this level might trigger a recovery.
- The NZD/JPY continues trading side-ways using the 20-day SMA as a support.
- RSI and MACD indicate declining buying pressure.
- Buyers must defend th 20-day SMA to avoid losses.
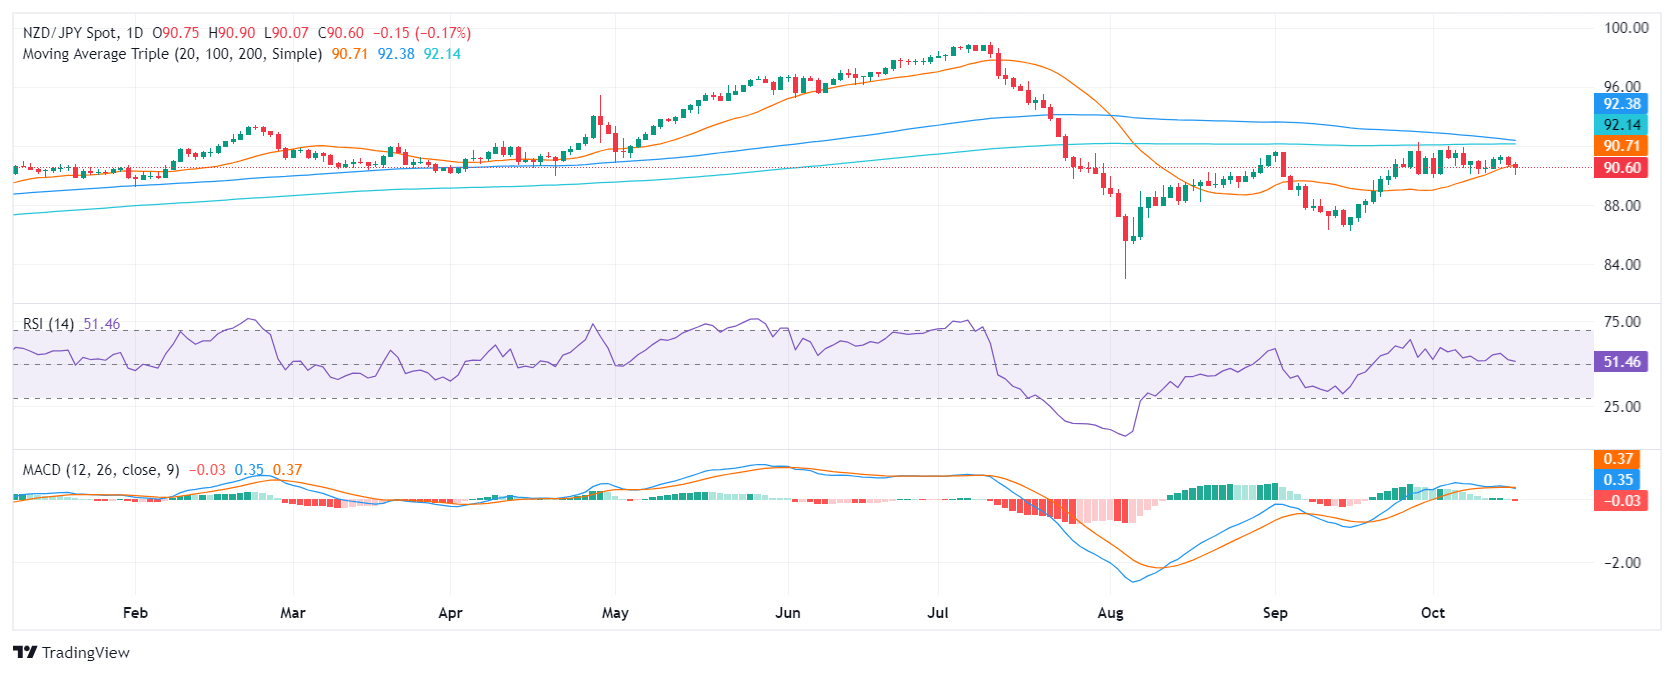
In Wednesday's session, the NZD/JPY mildly fell to 90.60, continuing the sideways movement seen in the past few sessions.
The daily Relative Strength Index (RSI) is currently at 51, indicating that the pair is in the positive area. However, the RSI is declining, suggesting that buying pressure is declining. The Moving Average Convergence Divergence (MACD) histogram is green and decreasing, confirming the bearish momentum.
The 90.60 level remains crucial for the near-term outlook of the NZD/JPY pair. On Wednesday, the pair continued to struggle near this support level. A breakdown below 90.60 could pave the way for further losses, potentially targeting the next psychological support at 89.50. However, if the pair holds above 90.60 and buyers regain strength, a reversal could push the price towards the 91.00 resistance level and even up to 92.00, where the 20, 100, and 200-day Simple Moving Averages (SMA) converge.
Bears have been persistently testing the 20-day SMA, which has served as a notable support. A successful break below this level could solidify the bearish momentum, leading to increased downside pressure.
NZD/JPY Daily chart
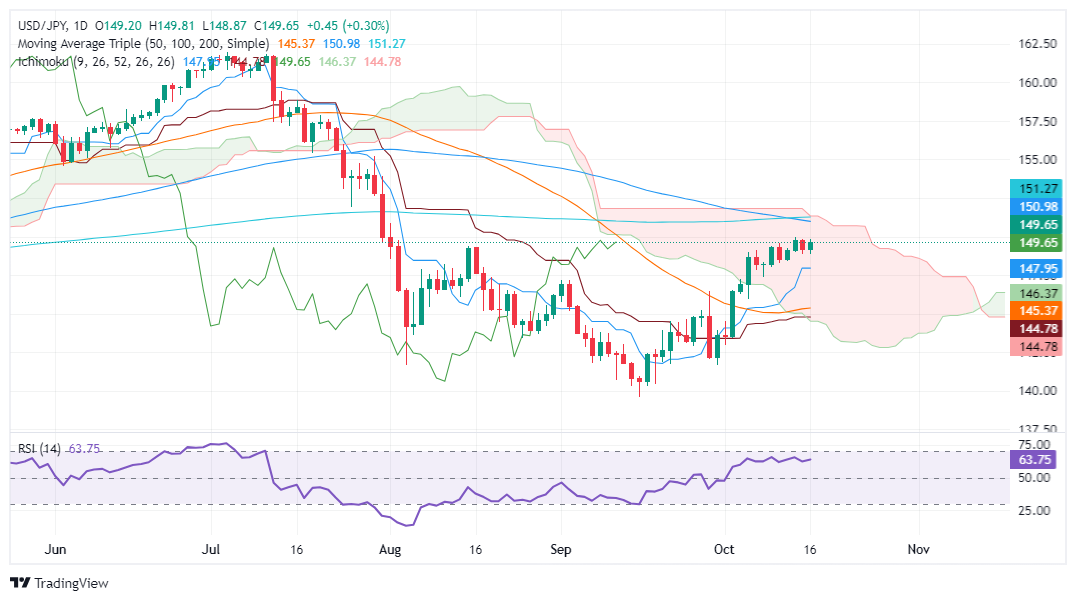
- USD/JPY rises from a two-day low of 148.85, gaining strength amid dip-buying and risk-on sentiment.
- The pair remains within the Ichimoku Cloud, signaling neutral-to-upward bias but suggesting the uptrend could be overextended.
- A break above 150.00 could target the 100-DMA at 150.98, while 149.00 provides key short-term support for bulls.
The US Dollar prints solid gains of more than 0.30% against the Japanese Yen after the pair dropped to a two-day low of 148.85, yet buyers bought the dip and push the exchange rate higher. Although US Treasury bond yields dropped, the USD/JPY trades at 149.71, above its opening price.
USD/JPY Price Forecast: Technical outlook
The daily chart suggests that USD/JPY is on a steady upward trajectory, though it maintains a neutral-to-upward bias. While technical signals indicate that buyers are in control, USD/JPY remains within the Ichimoku Cloud (Kumo), which is limiting its advance. Additionally, despite bullish conditions, the Relative Strength Index (RSI) has failed to surpass its last three peaks, indicating that the uptrend could be overextended.
If USD/JPY rises above 150.00, it could pave the way for a move towards the 100-day moving average (DMA) at 150.98, followed by the 200-DMA at 151.27.
Conversely, if USD/JPY drops below 149.00, the Tenkan-Sen at 147.95 will act as the first support for bulls. If breached, the next key support levels would be the Senkou Span A at 146.48, followed by the 50-DMA at 145.36.
USD/JPY Price Action – Daily Chart
Japanese Yen PRICE Today
The table below shows the percentage change of Japanese Yen (JPY) against listed major currencies today. Japanese Yen was the strongest against the British Pound.
| USD | EUR | GBP | JPY | CAD | AUD | NZD | CHF | |
|---|---|---|---|---|---|---|---|---|
| USD | 0.31% | 0.67% | 0.30% | -0.18% | 0.56% | 0.43% | 0.37% | |
| EUR | -0.31% | 0.37% | 0.02% | -0.46% | 0.26% | 0.14% | 0.02% | |
| GBP | -0.67% | -0.37% | -0.37% | -0.82% | -0.10% | -0.23% | -0.29% | |
| JPY | -0.30% | -0.02% | 0.37% | -0.45% | 0.26% | 0.16% | 0.10% | |
| CAD | 0.18% | 0.46% | 0.82% | 0.45% | 0.72% | 0.59% | 0.54% | |
| AUD | -0.56% | -0.26% | 0.10% | -0.26% | -0.72% | -0.13% | -0.18% | |
| NZD | -0.43% | -0.14% | 0.23% | -0.16% | -0.59% | 0.13% | -0.06% | |
| CHF | -0.37% | -0.02% | 0.29% | -0.10% | -0.54% | 0.18% | 0.06% |
The heat map shows percentage changes of major currencies against each other. The base currency is picked from the left column, while the quote currency is picked from the top row. For example, if you pick the Japanese Yen from the left column and move along the horizontal line to the US Dollar, the percentage change displayed in the box will represent JPY (base)/USD (quote).
- The Australian Unemployment Rate is foreseen stable at 4.2% in September.
- Employment Change is expected at 25K, focus will be on the details.
- AUD/USD is technically bearish, so any data-inspired spike may attract sellers.
The Australian Bureau of Statistics (ABS) will release the monthly employment report at 00:30 GMT on Thursday. The country is expected to have added 25K new positions in September, while the Unemployment Rate is foreseen stable at 4.2%. The Australian Dollar (AUD) has weakened against the US Dollar (USD) ahead of the event, with the AUD/USD pair trading below the 0.6700 mark.
The ABS reports Employment Change separating full-time from part-time positions. According to its own definitions, full-time jobs imply working 38 hours per week or more and usually include additional benefits, but they mostly represent consistent income. On the other hand, part-time employment generally means higher hourly rates but lacks consistency and benefits. That’s why full-time jobs have more weight than part-time ones when setting the directional path for the AUD.
Back in August, the monthly employment report showed that Australia managed to create 50.6K part-time jobs while losing 3.1K full-time positions, resulting in a net Employment Change of 47.5K. The Unemployment Rate, in the meantime, stayed at 4.2%.
Australian Unemployment Rate seen steady in September
As previously noted, financial markets anticipate the Unemployment Rate to be at 4.2%. If that’s the case, it will be the third consecutive reading at such a level. Job creation, in the meantime, is foreseen to have grown at a solid pace.
However, market players will be more attentive to details. The strong headline figure from August showed that most jobs created were part-time, while the country lost full-time positions. That’s usually bad news for the economy, regardless of the total. Still, it could be seen as good news regarding monetary policy updates.
The creation of part-time positions, generally understood to have lower wages and fewer benefits than their counterparts, is usually seen as a weakness in the labor market.
The Reserve Bank of Australia (RBA) is in no rush to trim the interest rate. The Official Cash Rate (OCR) has been steady at 4.35% for almost a year now, as the labor market has remained tight. Indeed, it helped bring headline inflation down towards the RBA’s goal to between 2% and 3%, with core inflation still high. Besides easing inflation, the RBA requires a looser job sector to ease the monetary policy.
With that in mind, the sharp increase in part-time jobs in August sparked a bit of hope among those expecting the RBA will soon start lowering the OCR. But a swallow does make a summer. A one-stand macroeconomic report signaling in the “right” direction is not enough. However, if September employment figures point in the same direction, there is a good chance market players will start pricing in an interest rate cut. Three reports in a row will be heaven for doves.
In the meantime, RBA Governor Michele Bullock repeated after the September meeting that underlying inflation remains too high and that the time to trim interest rates has not yet come. At the time being, market players are betting the central bank will deliver a rate cut in February 2025.
When will the Australian employment report be released, and how could it affect AUD/USD?
The ABS will publish the September employment report early on Thursday. As previously stated, Australia is expected to have added 25K new job positions in the month, while the Unemployment Rate is foreseen at 4.2%. Finally, the Participation Rate is expected to hold at 67.1%.
Generally speaking, a strong report will boost the AUD, even if the larger increase comes from part-time jobs. Any weak underlying subcomponent will likely fuel hopes of rate cuts, but not enough to trigger an AUD sell-off. The opposite case is also valid, with soft figures putting pressure on the Aussie.
Ahead of the announcement, the AUD/USD pair trades a handful of pips below the 0.6700 mark and is technically bearish.
Valeria Bednarik, Chief Analyst at FXStreet, notes: “The AUD/USD pair is trading below the 61.8% Fibonacci retracement of the 0.6621-0.6941 rally at 0.6743, meaning there is a good chance the pair will soon test the bottom of the range. The bearish case is also being supported by technical indicators, as the Momentum and the Relative Strength Index (RSI) head firmly south well below their midlines in the daily chart, reflecting persistent selling interest. At the same time, the pair is currently battling with a directionless 100 Simple Moving Average (SMA) while the 20 SMA gains bearish traction over 100 pips above the current level.”
Bednarik adds: “AUD/USD may surge towards the aforementioned Fibonacci resistance level with an upbeat report, but given the dominant trend, sellers may take their chances around it once the dust settles. Near-term support comes at 0.6670 en route to the 0.6620 price zone. A break below the latter should favor a near-term extension towards a strong static support area surrounding the 0.6570 mark.”
Employment FAQs
Labor market conditions are a key element to assess the health of an economy and thus a key driver for currency valuation. High employment, or low unemployment, has positive implications for consumer spending and thus economic growth, boosting the value of the local currency. Moreover, a very tight labor market – a situation in which there is a shortage of workers to fill open positions – can also have implications on inflation levels and thus monetary policy as low labor supply and high demand leads to higher wages.
The pace at which salaries are growing in an economy is key for policymakers. High wage growth means that households have more money to spend, usually leading to price increases in consumer goods. In contrast to more volatile sources of inflation such as energy prices, wage growth is seen as a key component of underlying and persisting inflation as salary increases are unlikely to be undone. Central banks around the world pay close attention to wage growth data when deciding on monetary policy.
The weight that each central bank assigns to labor market conditions depends on its objectives. Some central banks explicitly have mandates related to the labor market beyond controlling inflation levels. The US Federal Reserve (Fed), for example, has the dual mandate of promoting maximum employment and stable prices. Meanwhile, the European Central Bank’s (ECB) sole mandate is to keep inflation under control. Still, and despite whatever mandates they have, labor market conditions are an important factor for policymakers given its significance as a gauge of the health of the economy and their direct relationship to inflation.
RBA FAQs
The Reserve Bank of Australia (RBA) sets interest rates and manages monetary policy for Australia. Decisions are made by a board of governors at 11 meetings a year and ad hoc emergency meetings as required. The RBA’s primary mandate is to maintain price stability, which means an inflation rate of 2-3%, but also “..to contribute to the stability of the currency, full employment, and the economic prosperity and welfare of the Australian people.” Its main tool for achieving this is by raising or lowering interest rates. Relatively high interest rates will strengthen the Australian Dollar (AUD) and vice versa. Other RBA tools include quantitative easing and tightening.
While inflation had always traditionally been thought of as a negative factor for currencies since it lowers the value of money in general, the opposite has actually been the case in modern times with the relaxation of cross-border capital controls. Moderately higher inflation now tends to lead central banks to put up their interest rates, which in turn has the effect of attracting more capital inflows from global investors seeking a lucrative place to keep their money. This increases demand for the local currency, which in the case of Australia is the Aussie Dollar.
Macroeconomic data gauges the health of an economy and can have an impact on the value of its currency. Investors prefer to invest their capital in economies that are safe and growing rather than precarious and shrinking. Greater capital inflows increase the aggregate demand and value of the domestic currency. Classic indicators, such as GDP, Manufacturing and Services PMIs, employment, and consumer sentiment surveys can influence AUD. A strong economy may encourage the Reserve Bank of Australia to put up interest rates, also supporting AUD.
Quantitative Easing (QE) is a tool used in extreme situations when lowering interest rates is not enough to restore the flow of credit in the economy. QE is the process by which the Reserve Bank of Australia (RBA) prints Australian Dollars (AUD) for the purpose of buying assets – usually government or corporate bonds – from financial institutions, thereby providing them with much-needed liquidity. QE usually results in a weaker AUD.
Quantitative tightening (QT) is the reverse of QE. It is undertaken after QE when an economic recovery is underway and inflation starts rising. Whilst in QE the Reserve Bank of Australia (RBA) purchases government and corporate bonds from financial institutions to provide them with liquidity, in QT the RBA stops buying more assets, and stops reinvesting the principal maturing on the bonds it already holds. It would be positive (or bullish) for the Australian Dollar.
- AUD/USD fell on Wednesday, reaching five-week lows below 0.6700.
- Markets await key employment figures from Australia in Thursday’s session.
- A stronger USD, worries from the Chinese economic situation and falling metal prices are pushing down the Aussie.
The AUD/USD continued its downtrend on Wednesday, declining by 0.60% to 0.6662, marking a five-week low. The pair breached the crucial 0.6700 support level, potentially leading to a test of the 200-day SMA at 0.6625. The outcome of local employment figures to be released on Thursday will also set the pace of the Aussie’s dynamics.
Despite a mixed economic outlook for Australia, the Reserve Bank of Australia's (RBA) focus on combating high inflation has tempered market expectations. As a result, the markets now anticipate only a modest 0.25% interest rate cut in 2024. If employment data comes in weak, markets might place bets on another cut.
Daily digest market movers: Australian Dollar declines after breaking key support, employment figures ahead
- AUD/USD breaks below key support at 0.6700 on USD's recovery as traders doubt China's stimulus efforts.
- China's latest press conference raises uncertainty over stimulus plan's scope and impact.
- Markets only anticipate 50% chance of RBA rate cut by year-end, potentially aiding AUDUSD recovery.
- On Thursday, investors will eye Employment Change and Participation rate figures from September from Australia, which are expected to show weakness in the labor market.
AUD/USD technical outlook: Bearish momentum rising, support at 0.6700 gone
The AUD/USD pair is currently trading in a bearish trend. The Relative Strength Index (RSI) is in the oversold area, suggesting that selling pressure is intense but soon to potentially pause for consolidation. The Moving Average Convergence Divergence (MACD) is also rising, indicating that the overall outlook is bearish.
Support levels include 0.6660, 0.6650 and 0.6630, while resistance levels lie at 0.6700, 0.6730and 0.6750.
Australian Dollar FAQs
One of the most significant factors for the Australian Dollar (AUD) is the level of interest rates set by the Reserve Bank of Australia (RBA). Because Australia is a resource-rich country another key driver is the price of its biggest export, Iron Ore. The health of the Chinese economy, its largest trading partner, is a factor, as well as inflation in Australia, its growth rate and Trade Balance. Market sentiment – whether investors are taking on more risky assets (risk-on) or seeking safe-havens (risk-off) – is also a factor, with risk-on positive for AUD.
The Reserve Bank of Australia (RBA) influences the Australian Dollar (AUD) by setting the level of interest rates that Australian banks can lend to each other. This influences the level of interest rates in the economy as a whole. The main goal of the RBA is to maintain a stable inflation rate of 2-3% by adjusting interest rates up or down. Relatively high interest rates compared to other major central banks support the AUD, and the opposite for relatively low. The RBA can also use quantitative easing and tightening to influence credit conditions, with the former AUD-negative and the latter AUD-positive.
China is Australia’s largest trading partner so the health of the Chinese economy is a major influence on the value of the Australian Dollar (AUD). When the Chinese economy is doing well it purchases more raw materials, goods and services from Australia, lifting demand for the AUD, and pushing up its value. The opposite is the case when the Chinese economy is not growing as fast as expected. Positive or negative surprises in Chinese growth data, therefore, often have a direct impact on the Australian Dollar and its pairs.
Iron Ore is Australia’s largest export, accounting for $118 billion a year according to data from 2021, with China as its primary destination. The price of Iron Ore, therefore, can be a driver of the Australian Dollar. Generally, if the price of Iron Ore rises, AUD also goes up, as aggregate demand for the currency increases. The opposite is the case if the price of Iron Ore falls. Higher Iron Ore prices also tend to result in a greater likelihood of a positive Trade Balance for Australia, which is also positive of the AUD.
The Trade Balance, which is the difference between what a country earns from its exports versus what it pays for its imports, is another factor that can influence the value of the Australian Dollar. If Australia produces highly sought after exports, then its currency will gain in value purely from the surplus demand created from foreign buyers seeking to purchase its exports versus what it spends to purchase imports. Therefore, a positive net Trade Balance strengthens the AUD, with the opposite effect if the Trade Balance is negative.
- The Canadian Dollar has found a brief recovery after steady multi-week declines.
- Canada remains light on the economic calendar until next week’s BoC rate call.
- The BoC is widely expected to trim interest rates by a further 50 bps, decaying the CAD.
The Canadian Dollar (CAD) pared near-term losses on Wednesday, but not nearly enough to spark a fresh bull run. Markets are likely taking a breather after pummeling the CAD for nearly three straight weeks. The Loonie has shed over 3% against the Greenback since hitting a recent peak against the US Dollar in the bottom half of September.
Daily digest market movers
- The Canadian Dollar recovered some lost ground against the US Dollar, but still remains at the bottom of a long slide.
- The Bank of Canada (BoC) is widely expected to trim interest rates by 50 bps next week, leaving the CAD with little support heading into the rate call window.
- Canadian Consumer Price Index (CPI) inflation figures did little to bolster Loonie investor confidence this week, with a sharp drawdown in headline inflation but an uptick in core BoC-measured inflation.
- Canadian Housing Starts rose in September on a seasonally-adjusted basis to 223.8K from the previous 217.4K, but missed the forecast 237.5K.
- Canadian Manufacturing Sales in August beat expectations, but still contracted by 1.3% compared to the previous 1.4% upswing. Markets expected a print of -1.5% or worse.
Canadian Dollar price forecast
The USD/CAD daily chart shows the pair is losing some steam after a strong rally that propelled it above the key resistance of 1.3750. The pair briefly touched the 1.3800 mark, but recent price action indicates a minor pullback, suggesting that the bulls might be taking a pause. However, the price remains well above the 50-day EMA at 1.3624 and the 200-day EMA at 1.3610, signaling that the overall bullish trend remains intact for now. A close below these moving averages could signal a deeper retracement, but as long as USD/CAD holds above these levels, the bullish momentum is likely to continue.
The MACD indicator remains in positive territory, with the MACD line still above the signal line, but the histogram is showing signs of flattening out. This could suggest that the bullish momentum is waning, and traders should be cautious of a potential consolidation or minor pullback in the near term. A clear break above 1.3800 would be needed to confirm further upside, while a drop below the 1.3650 level could invite fresh selling pressure. Traders will be watching closely for any fundamental catalysts that could push the pair decisively in either direction.
USD/CAD daily chart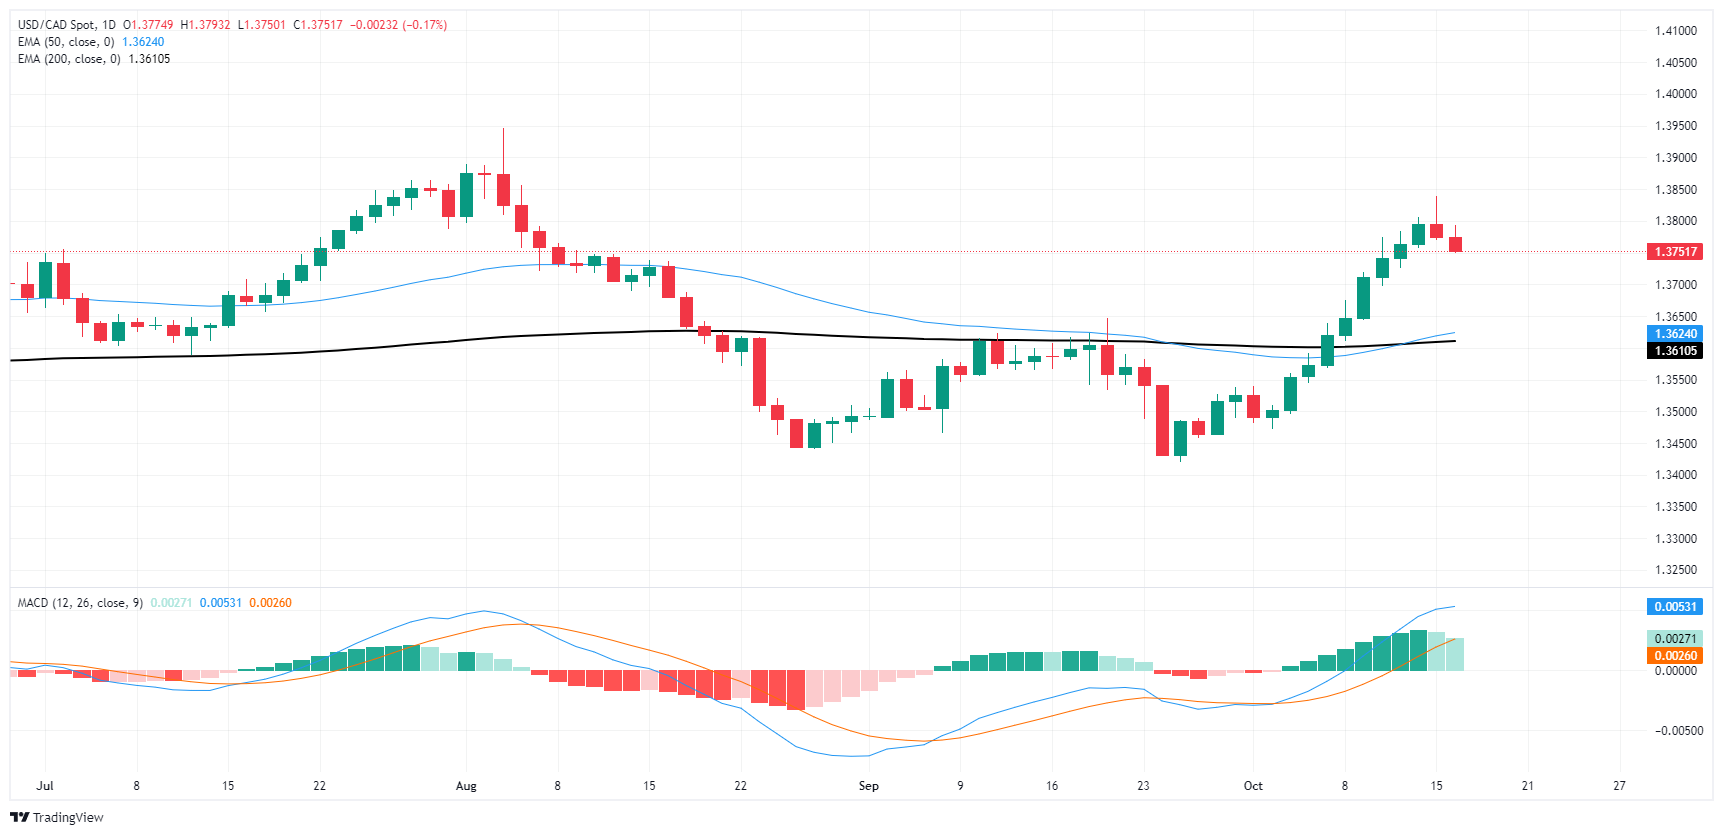
Canadian Dollar FAQs
The key factors driving the Canadian Dollar (CAD) are the level of interest rates set by the Bank of Canada (BoC), the price of Oil, Canada’s largest export, the health of its economy, inflation and the Trade Balance, which is the difference between the value of Canada’s exports versus its imports. Other factors include market sentiment – whether investors are taking on more risky assets (risk-on) or seeking safe-havens (risk-off) – with risk-on being CAD-positive. As its largest trading partner, the health of the US economy is also a key factor influencing the Canadian Dollar.
The Bank of Canada (BoC) has a significant influence on the Canadian Dollar by setting the level of interest rates that banks can lend to one another. This influences the level of interest rates for everyone. The main goal of the BoC is to maintain inflation at 1-3% by adjusting interest rates up or down. Relatively higher interest rates tend to be positive for the CAD. The Bank of Canada can also use quantitative easing and tightening to influence credit conditions, with the former CAD-negative and the latter CAD-positive.
The price of Oil is a key factor impacting the value of the Canadian Dollar. Petroleum is Canada’s biggest export, so Oil price tends to have an immediate impact on the CAD value. Generally, if Oil price rises CAD also goes up, as aggregate demand for the currency increases. The opposite is the case if the price of Oil falls. Higher Oil prices also tend to result in a greater likelihood of a positive Trade Balance, which is also supportive of the CAD.
While inflation had always traditionally been thought of as a negative factor for a currency since it lowers the value of money, the opposite has actually been the case in modern times with the relaxation of cross-border capital controls. Higher inflation tends to lead central banks to put up interest rates which attracts more capital inflows from global investors seeking a lucrative place to keep their money. This increases demand for the local currency, which in Canada’s case is the Canadian Dollar.
Macroeconomic data releases gauge the health of the economy and can have an impact on the Canadian Dollar. Indicators such as GDP, Manufacturing and Services PMIs, employment, and consumer sentiment surveys can all influence the direction of the CAD. A strong economy is good for the Canadian Dollar. Not only does it attract more foreign investment but it may encourage the Bank of Canada to put up interest rates, leading to a stronger currency. If economic data is weak, however, the CAD is likely to fall.
- XAU/USD climbs as falling US Treasury yields boost demand for non-yielding assets.
- Traders anticipate rate cuts from major central banks as inflation cools with the ECB expected to act on October 17.
- Geopolitical uncertainty and upcoming US elections fuel demand for Gold as a safe-haven asset amidst economic slowdown fears.
Gold prices rose during the mid-North American session on Wednesday, underpinned by the drop in US Treasury yields and the shrug off recent US Dollar strength. Expectations that major central banks would cut rates amid soft inflation readings weighed on bond yields and boosted the non-yielding metal. At the time of writing, the XAU/USD trades at $2,674, up by 0.46%.
Market sentiment has improved lately, as portrayed by three of the four US equity indices trading in the green. US Treasury bond yields had extended their fall, a tailwind for Bullion prices, which hit $2,685, the year-to-date (YTD) high, yet lacked the strength to push prices toward $2,700.
During the European session, inflation in the UK tumbled below the Bank of England’s (BoE) 2% goal. Hence, the BoE is expected to resume its easing cycle in tune with the Federal Reserve and the European Central Bank. Traders expect the ECB to lower rates on October 17 as inflation aimed toward the bank’s target and also on fears the bloc's economy is at risk of hitting a recession.
Gold climbed as traders seeking safety bought the dip amid woes that the global economy could be headed for a slowdown and uncertainty on upcoming US elections.
UBS analysts wrote, “We anticipate uncertainty and volatility to rise until the next US administration is settled,” and suggested that gold and oil could be “effective portfolio hedges.”
In the meantime, according to the CME FedWatch tool, traders see a 96% chance of a 25-basis-point US rate cut in November.
The lack of economic data keeps traders focused on Middle East developments and China’s stimulus program.
Market participants' attention turns to upcoming US Retail Sales, Industrial Production data, and Initial Jobless Claims due later this week.
Daily digest market movers: Gold price climbs as investors eye key US data
- Gold prices remained underpinned by the fall of the US 10-year Treasury bond yield.
- The 10-year benchmark note rate is down two basis points to 4.014%.
- Despite that, overall US Dollar strength has capped Bullion’s rally toward $2,700.
- The US Dollar Index, which tracks the buck’s value against a basket of six currencies, gains 0.34% to 103.57.
- Data from the Chicago Board of Trade, based on the December fed funds rate futures contract, indicates that investors are pricing in 50 basis points (bps) of easing by the Fed in the last two months of 2024.
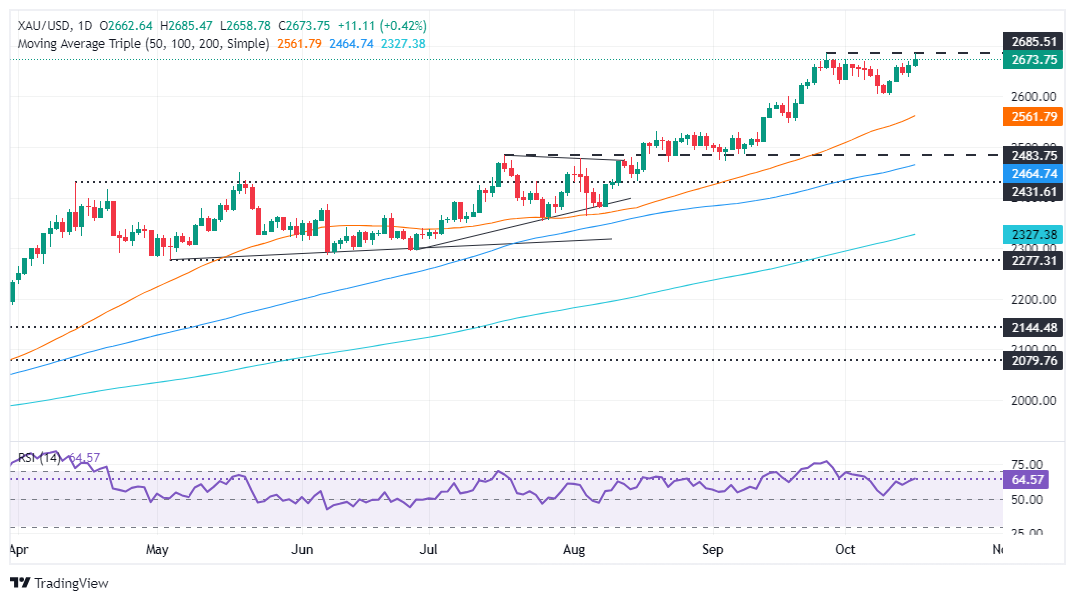
XAU/USD technical outlook: Gold price surges above $2,670, eyes on YTD peak
The uptrend of Gold remains in place, with buyers launching their first attack to the YTD high of $2,685, yet they fell short of cracking the latter. Momentum remains bullish, as shown by the Relative Strength Index (RSI), opening the door for higher prices.
Therefore, Gold’s first resistance is the YTD high at $2,685. Once cleared, a move to $2,700 is on the cards, followed by $2,750 and $2,800.
Conversely, if XAU/USD falls below the October 4 high at $2,670, a retracement toward $2,650 is on the cards. On further weakness, the next support would be $2,600, followed by the 50-day Simple Moving Average (SMA) at $2,561.
Gold FAQs
Gold has played a key role in human’s history as it has been widely used as a store of value and medium of exchange. Currently, apart from its shine and usage for jewelry, the precious metal is widely seen as a safe-haven asset, meaning that it is considered a good investment during turbulent times. Gold is also widely seen as a hedge against inflation and against depreciating currencies as it doesn’t rely on any specific issuer or government.
Central banks are the biggest Gold holders. In their aim to support their currencies in turbulent times, central banks tend to diversify their reserves and buy Gold to improve the perceived strength of the economy and the currency. High Gold reserves can be a source of trust for a country’s solvency. Central banks added 1,136 tonnes of Gold worth around $70 billion to their reserves in 2022, according to data from the World Gold Council. This is the highest yearly purchase since records began. Central banks from emerging economies such as China, India and Turkey are quickly increasing their Gold reserves.
Gold has an inverse correlation with the US Dollar and US Treasuries, which are both major reserve and safe-haven assets. When the Dollar depreciates, Gold tends to rise, enabling investors and central banks to diversify their assets in turbulent times. Gold is also inversely correlated with risk assets. A rally in the stock market tends to weaken Gold price, while sell-offs in riskier markets tend to favor the precious metal.
The price can move due to a wide range of factors. Geopolitical instability or fears of a deep recession can quickly make Gold price escalate due to its safe-haven status. As a yield-less asset, Gold tends to rise with lower interest rates, while higher cost of money usually weighs down on the yellow metal. Still, most moves depend on how the US Dollar (USD) behaves as the asset is priced in dollars (XAU/USD). A strong Dollar tends to keep the price of Gold controlled, whereas a weaker Dollar is likely to push Gold prices up.
- XAG/USD climbs to $31.74, driven by falling US Treasury yields and stronger risk sentiment in the market.
- Momentum favors bulls, with RSI clearing key resistance, suggesting further upside potential towards $33.00.
- Key support lies at $31.60, with a break below potentially leading Silver to retest the $30.76 level.
Silver prices climbed on Wednesday as US Treasury yields fell, a tailwind for the non-yielding metal. An improvement in risk appetite underpins the precious metal sector, pushing the grey metal to hit a seven-day high at $32.17. At the time of writing, XAG/USD trades at $31.74 and gains more than 0.85%.
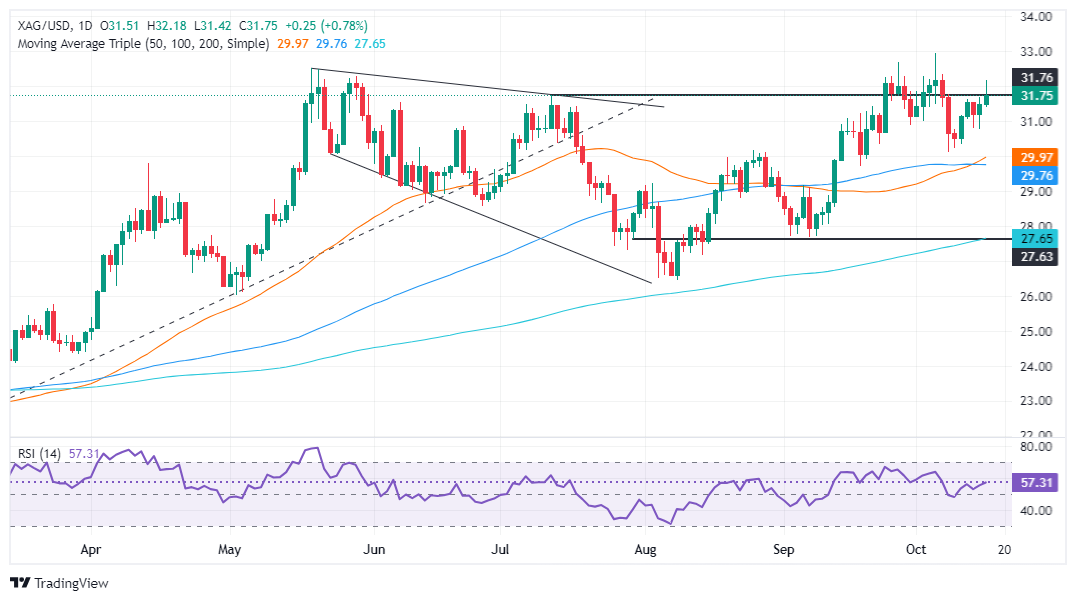
XAG/USD Price Forecast: Technical outlook
After diving almost vertically from a year-to-date (YTD) peak of $32.95 to $30.12 in three days, Silver is recovering, with buyers eyeing a test of $33.00.
The momentum remains constructive, supporting bulls as shown by the Relative Strength Index (RSI. The RSI cleared the 55 peak with enough room to spare before turning overbought.
Hence, Silver’s path of least resistance is tilted to the upside. The first resistance would be the $32.00 figure, followed by today’s high at $32.17. Once those levels are surpassed, the next stop would be the May 20 swing high at $32.51 before challenging the YTD high at $32.95.
Conversely, if XAG/USD slips below $31.60, Silver could drop to the weekly low of $30.76. This clears the path to an October 8 low of $30.12 if surpassed.
XAG/USD Daily Chart
Silver FAQs
Silver is a precious metal highly traded among investors. It has been historically used as a store of value and a medium of exchange. Although less popular than Gold, traders may turn to Silver to diversify their investment portfolio, for its intrinsic value or as a potential hedge during high-inflation periods. Investors can buy physical Silver, in coins or in bars, or trade it through vehicles such as Exchange Traded Funds, which track its price on international markets.
Silver prices can move due to a wide range of factors. Geopolitical instability or fears of a deep recession can make Silver price escalate due to its safe-haven status, although to a lesser extent than Gold's. As a yieldless asset, Silver tends to rise with lower interest rates. Its moves also depend on how the US Dollar (USD) behaves as the asset is priced in dollars (XAG/USD). A strong Dollar tends to keep the price of Silver at bay, whereas a weaker Dollar is likely to propel prices up. Other factors such as investment demand, mining supply – Silver is much more abundant than Gold – and recycling rates can also affect prices.
Silver is widely used in industry, particularly in sectors such as electronics or solar energy, as it has one of the highest electric conductivity of all metals – more than Copper and Gold. A surge in demand can increase prices, while a decline tends to lower them. Dynamics in the US, Chinese and Indian economies can also contribute to price swings: for the US and particularly China, their big industrial sectors use Silver in various processes; in India, consumers’ demand for the precious metal for jewellery also plays a key role in setting prices.
Silver prices tend to follow Gold's moves. When Gold prices rise, Silver typically follows suit, as their status as safe-haven assets is similar. The Gold/Silver ratio, which shows the number of ounces of Silver needed to equal the value of one ounce of Gold, may help to determine the relative valuation between both metals. Some investors may consider a high ratio as an indicator that Silver is undervalued, or Gold is overvalued. On the contrary, a low ratio might suggest that Gold is undervalued relative to Silver.
- EUR/USD withered further on Wednesday, sagging below 1.0900.
- ECB rate cut looms large around the corner, broadly expected to trim rates 25 bps.
- Final EU inflation figures are unlikely to move the needle on Thursday.
EUR/USD is in freefall, plummeting to multi-week lows as the Euro continues to crumple ahead of the European Central Bank’s (ECB) upcoming rate call on Thursday. The ECB is widely expected to trim interest rates by a quarter of a percent, or 25 bps.
All eyes will be on the ECB during Thursday’s European market session. The ECB is widely expected to trim its Main Refinancing Operations Rate by 25 bps to 3.4% from 3.65%, with the ECB’s Rate on Deposit Facility expected to take a matching 25 bps trim to 3.25% from 3.5%. With the ECB broadly expected to reduce rates in the face of a lopsided and cooling pan-EU economy, the Euro is running out of room quickly and can be expected to continue declining in the near-term.
EUR/USD price forecast
EUR/USD continues to tilt firmly into bearish momentum, slumping further below the 200-day Exponential Moving Average (EMA) at the 1.0900 handle. Extended short pressure could see the pair continue its current one-sided backslide to the 1.0800 region.
Fiber is down over 3% and falling fast after tumbling from recent highs above the 1.1200 handle set in late September. The pair has closed in the red for all but four of the last 15 consecutive trading days, and is poised for a third consecutive bearish week.
EUR/USD daily chart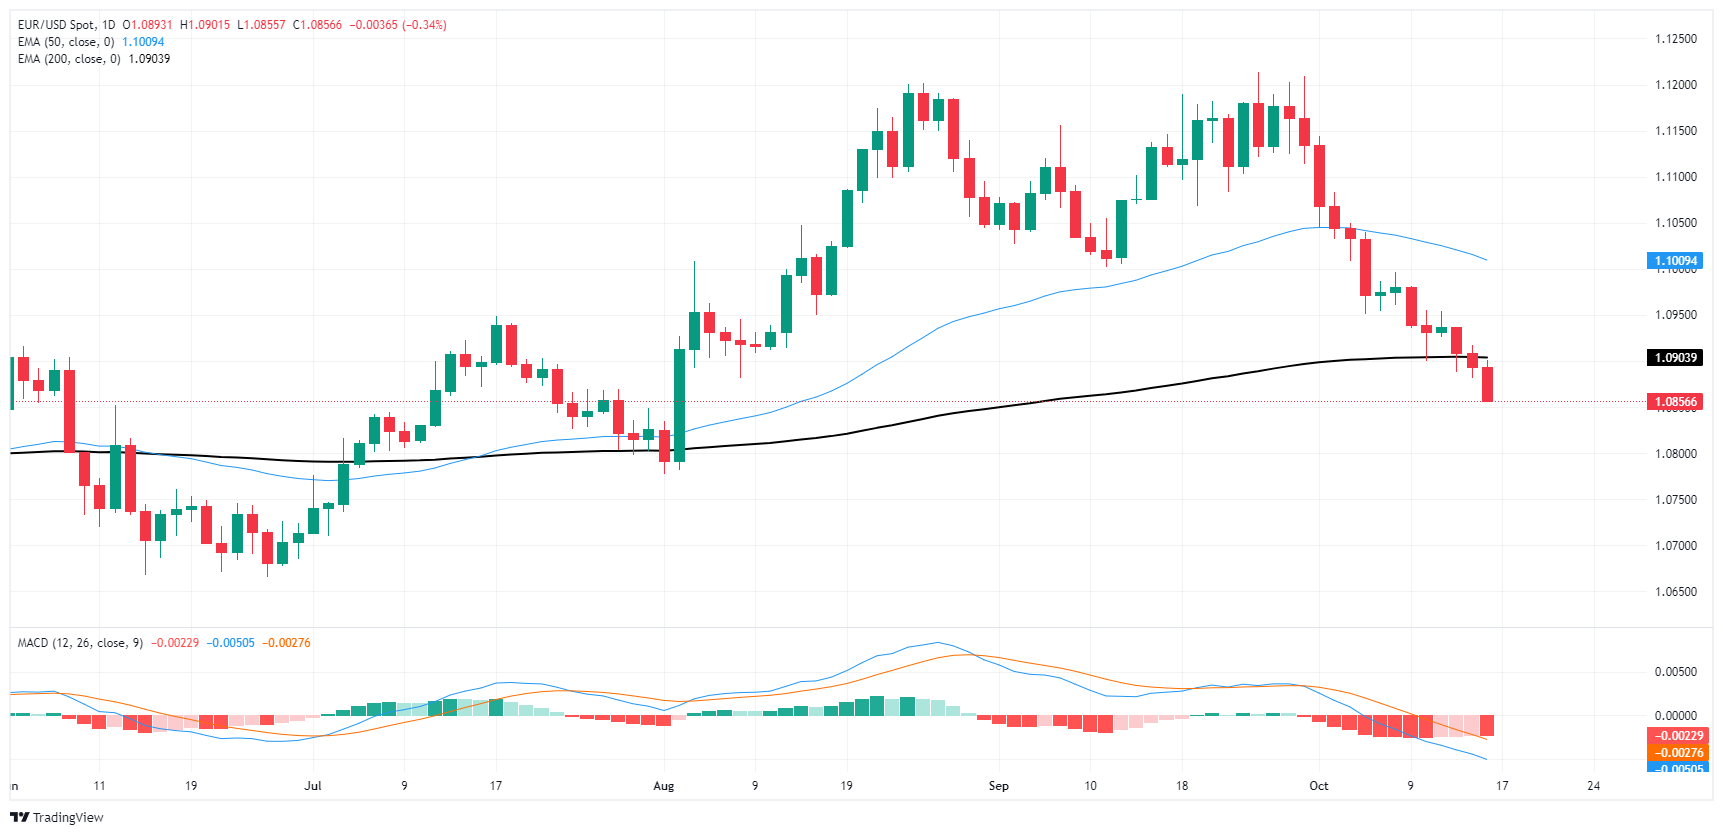
Euro FAQs
The Euro is the currency for the 19 European Union countries that belong to the Eurozone. It is the second most heavily traded currency in the world behind the US Dollar. In 2022, it accounted for 31% of all foreign exchange transactions, with an average daily turnover of over $2.2 trillion a day. EUR/USD is the most heavily traded currency pair in the world, accounting for an estimated 30% off all transactions, followed by EUR/JPY (4%), EUR/GBP (3%) and EUR/AUD (2%).
The European Central Bank (ECB) in Frankfurt, Germany, is the reserve bank for the Eurozone. The ECB sets interest rates and manages monetary policy. The ECB’s primary mandate is to maintain price stability, which means either controlling inflation or stimulating growth. Its primary tool is the raising or lowering of interest rates. Relatively high interest rates – or the expectation of higher rates – will usually benefit the Euro and vice versa. The ECB Governing Council makes monetary policy decisions at meetings held eight times a year. Decisions are made by heads of the Eurozone national banks and six permanent members, including the President of the ECB, Christine Lagarde.
Eurozone inflation data, measured by the Harmonized Index of Consumer Prices (HICP), is an important econometric for the Euro. If inflation rises more than expected, especially if above the ECB’s 2% target, it obliges the ECB to raise interest rates to bring it back under control. Relatively high interest rates compared to its counterparts will usually benefit the Euro, as it makes the region more attractive as a place for global investors to park their money.
Data releases gauge the health of the economy and can impact on the Euro. Indicators such as GDP, Manufacturing and Services PMIs, employment, and consumer sentiment surveys can all influence the direction of the single currency. A strong economy is good for the Euro. Not only does it attract more foreign investment but it may encourage the ECB to put up interest rates, which will directly strengthen the Euro. Otherwise, if economic data is weak, the Euro is likely to fall. Economic data for the four largest economies in the euro area (Germany, France, Italy and Spain) are especially significant, as they account for 75% of the Eurozone’s economy.
Another significant data release for the Euro is the Trade Balance. This indicator measures the difference between what a country earns from its exports and what it spends on imports over a given period. If a country produces highly sought after exports then its currency will gain in value purely from the extra demand created from foreign buyers seeking to purchase these goods. Therefore, a positive net Trade Balance strengthens a currency and vice versa for a negative balance.
There was no timeout for the US Dollar’s rally on Wednesday, which extended its gains for the sixth consecutive day and hit new two-month highs despite global yields retreated further.
Here is what you need to know on Thursday, October 17:
The US Dollar Index (DXY) rose further to multi-week tops above 103.50 on the back of further weakness in the risk complex. Retail Sales will be at the centre of the debate along with the Philly Fed Manufacturing Index, usual weekly Initial Jobless Claims, Industrial and Manufacturing Production, Business Inventories, the NAHB Housing Market Index, and the weekly report by the EIA.
EUR/USD extended further its multi-day leg lower and broke below the 1.0900 support with marked conviction. The ECB will decide on rates seconded by the usual press conference by President Christine Lagarde. Additional data will include Balance of Trade results and the final Inflation Rate, along with the speech by the ECB’s McCaul.
GBP/USD dropped markedly and cleared the key 1.3000 support in the wake of lower UK inflation data. The BoE’s Wood is due to speak.
USD/JPY remained choppy and always below the 150.00 barrier, advancing modestly on Wednesday following Dollar’s gains and dovish remarks from the BoJ’s Adachi. The Balance of Trade results and the Tertiary Industry Index will be published.
AUD/USD retreated to multi-week lows after breaching the key 0.6700 support, shifting its focus to the key 200-day SMA. All the attention shifts to the release of the Australian labour market report.
Shrinking geopolitical effervescence and omnipresent demand concerns from China weighed further on WTI prices, motivating them to break below the $70.00 mark once again on Wednesday.
Lower yields and prospects of further easing by central banks lent extra wings to Gold prices, pushing them to the area of all-time highs around $2,685 per ounce troy. Silver prices added to Tuesday’s advance and climbed to six-day tops past the $32.00 mark per ounce.
- US Dollar proves strong as markets are pricing in a Trump victory in November.
- Fed easing expectations: 150 bps of total easing seen over the next 12 months.
- Retail Sales on Thursday will be closely watched.
The US Dollar Index (DXY), which measures the value of the USD against a basket of six others, continues rising as financial markets are doubling down on a Donald Trump win in the US presidential election. This is mainly due to Trumps’s plans on several sectors of the economy of deregulating according to IG Bank’s analyst. The DXY has broken above key resistance and is on its way to 104.00.
With the US economy showing mixed signs, Federal Reserve (Fed) officials remain cautious, signaling that the pace of the easing will rely on incoming data. In the meantime, political jitters seem to be benefiting the USD ahead of November’s election.
Daily digest market movers: US Dollar adds more ground on quiet Wednesday
- The US economic calendar showed no highlights on Wednesday as markets wait for Thursday’s Retail Sales figures.
- In case those figures come in strong, it could give the USD another boost. As for now, markets are expecting a slight monthly expansion.
- Fed officials Daly and Bostic remain cautious, suggesting only one or two rate cuts this year.
- Market expectations for Fed easing have slightly decreased, with two cuts by year-end no longer fully priced in but still remaining high above 80%.
DXY technical outlook: DXY pierces through key levels, correction looms
Technical analysis for the DXY index indicates continued momentum among indicators with some flashing overbought signals. The index has broken above the crucial 100-day Simple Moving Average (SMA), with the next major resistance at the 200-day SMA at 103.80. While buyers are pushing for an optimistic outlook, a potential correction may occur before the next upswing.
Supports are found at 103.00, 102.50 and 103.00, while resistances lie at 103.30, 103.50 and 104.00.
US Dollar FAQs
The US Dollar (USD) is the official currency of the United States of America, and the ‘de facto’ currency of a significant number of other countries where it is found in circulation alongside local notes. It is the most heavily traded currency in the world, accounting for over 88% of all global foreign exchange turnover, or an average of $6.6 trillion in transactions per day, according to data from 2022. Following the second world war, the USD took over from the British Pound as the world’s reserve currency. For most of its history, the US Dollar was backed by Gold, until the Bretton Woods Agreement in 1971 when the Gold Standard went away.
The most important single factor impacting on the value of the US Dollar is monetary policy, which is shaped by the Federal Reserve (Fed). The Fed has two mandates: to achieve price stability (control inflation) and foster full employment. Its primary tool to achieve these two goals is by adjusting interest rates. When prices are rising too quickly and inflation is above the Fed’s 2% target, the Fed will raise rates, which helps the USD value. When inflation falls below 2% or the Unemployment Rate is too high, the Fed may lower interest rates, which weighs on the Greenback.
In extreme situations, the Federal Reserve can also print more Dollars and enact quantitative easing (QE). QE is the process by which the Fed substantially increases the flow of credit in a stuck financial system. It is a non-standard policy measure used when credit has dried up because banks will not lend to each other (out of the fear of counterparty default). It is a last resort when simply lowering interest rates is unlikely to achieve the necessary result. It was the Fed’s weapon of choice to combat the credit crunch that occurred during the Great Financial Crisis in 2008. It involves the Fed printing more Dollars and using them to buy US government bonds predominantly from financial institutions. QE usually leads to a weaker US Dollar.
Quantitative tightening (QT) is the reverse process whereby the Federal Reserve stops buying bonds from financial institutions and does not reinvest the principal from the bonds it holds maturing in new purchases. It is usually positive for the US Dollar.
- The Dow Jones rose 250 points on Wednesday as the index recovered.
- Equities are rebounding from Tuesday’s declines, with indexes sticking close to record highs.
- The recent ‘Fed frenzy’ has abated, with markets confident of a 25 bps cut in November.
The Dow Jones Industrial Average (DJIA) rallied roughly 250 points on Wednesday as equities pivot around the mid-week inflection point. The Dow Jones is paring away Tuesday’s losses, where the index shed over three-quarters of a percent, keeping price action tight to record highs.
Markets have settled into a holding pattern on Federal Reserve (Fed) rate cuts, with rate traders firmly pricing in 90% odds of a 25 bps rate trim on November 7, with another quarter-point trim firmly priced in for December 18. Investors are exhausted after spending most of 2024 on Fed watch, and Q3 earnings reports have dominated traders’ viewports this week.
The US banking sector posted bumper Q3 earnings this week, dragging multiple indexes to record highs, and a steady stream of warnings about how high interest rates could negatively impact bank profitability has dried up practically overnight. Major players in the tech space, including Amazon (AMZN) and Google (GOOG), are busy inking deals for future nuclear projects. Large-scale companies that deal in data storage and computing farms are looking to provide enough power to server farms being swallowed whole by the amorphous AI sphere.
Costs are rising quickly for the still-budding “AI industry”, a label slapped onto any project that uses large dataset-crunching modeling methods to spit out other recombined, pre-shaped datasets. As energy demand and equivalent power costs soar, the companies selling the shovels in the AI goldrush are looking for ways to deliver cheap, readily available power on a large scale to an industry already grappling with finding value that isn’t direct injections from investors, and future net-positive revenue streams remain elusive.
Dow Jones news
Wednesday is a firm recovery day for the Dow Jones, with two-thirds of the equity index testing into the green. Apple (AAPL) fumbled during the midweek market session, backsliding 1.2% and falling to $231 per share as the tech company took a breather from making recent all-time highs. Intel (INTC) also shed 1.3% to fall below $22.50 per share after it was announced that Qualcomm’s exploratory takeover bid of the chipmaker has been delayed until after the US election in November.
Dow Jones Price forecast
Despite a recent knockback, the Dow Jones continues to test close to record highs. Bullish price action is on pace to take a fresh topside run at the 43,200 level, but intraday bids will first need to firmly recapture the 43,000 handle.
The Dow Jones has climbed over 16% bottom-to-top in 2024, with bullish momentum outrunning the 200-day Exponential Moving Average (EMA) since November of last year. The DJIA has gained nearly 8% in the past two months alone after recovering from a mid-September swing low that pierced the 50-day EMA and tested the 40,000 major price handle.
Dow Jones daily chart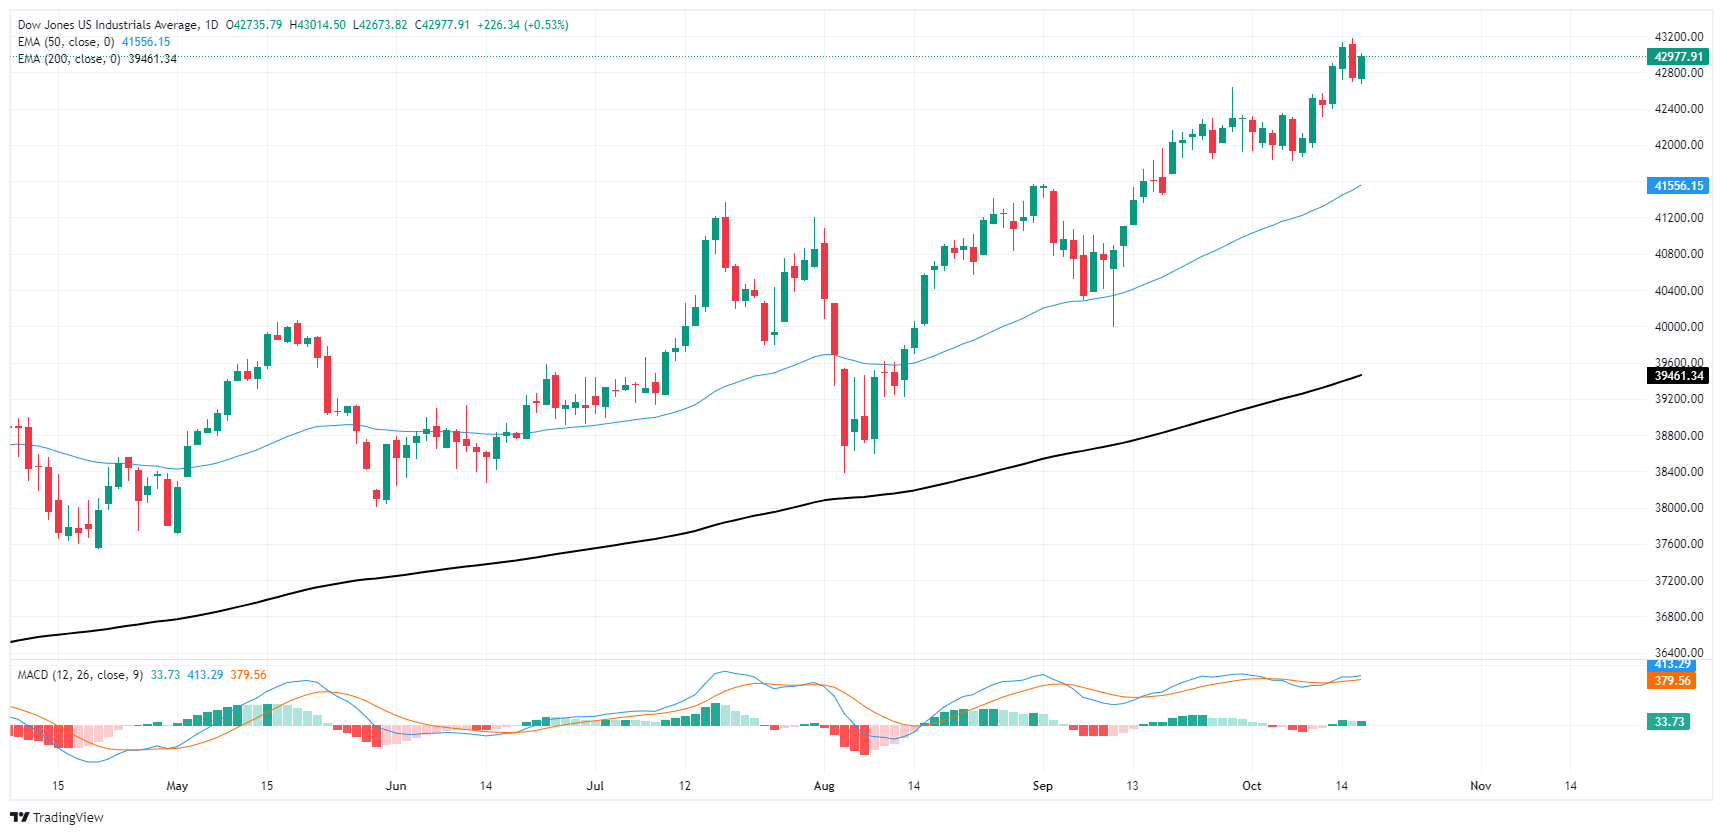
Dow Jones FAQs
The Dow Jones Industrial Average, one of the oldest stock market indices in the world, is compiled of the 30 most traded stocks in the US. The index is price-weighted rather than weighted by capitalization. It is calculated by summing the prices of the constituent stocks and dividing them by a factor, currently 0.152. The index was founded by Charles Dow, who also founded the Wall Street Journal. In later years it has been criticized for not being broadly representative enough because it only tracks 30 conglomerates, unlike broader indices such as the S&P 500.
Many different factors drive the Dow Jones Industrial Average (DJIA). The aggregate performance of the component companies revealed in quarterly company earnings reports is the main one. US and global macroeconomic data also contributes as it impacts on investor sentiment. The level of interest rates, set by the Federal Reserve (Fed), also influences the DJIA as it affects the cost of credit, on which many corporations are heavily reliant. Therefore, inflation can be a major driver as well as other metrics which impact the Fed decisions.
Dow Theory is a method for identifying the primary trend of the stock market developed by Charles Dow. A key step is to compare the direction of the Dow Jones Industrial Average (DJIA) and the Dow Jones Transportation Average (DJTA) and only follow trends where both are moving in the same direction. Volume is a confirmatory criteria. The theory uses elements of peak and trough analysis. Dow’s theory posits three trend phases: accumulation, when smart money starts buying or selling; public participation, when the wider public joins in; and distribution, when the smart money exits.
There are a number of ways to trade the DJIA. One is to use ETFs which allow investors to trade the DJIA as a single security, rather than having to buy shares in all 30 constituent companies. A leading example is the SPDR Dow Jones Industrial Average ETF (DIA). DJIA futures contracts enable traders to speculate on the future value of the index and Options provide the right, but not the obligation, to buy or sell the index at a predetermined price in the future. Mutual funds enable investors to buy a share of a diversified portfolio of DJIA stocks thus providing exposure to the overall index.
- Mexican Peso weakened as US Dollar gains despite falling US yields.
- IMF downgrades Mexico's 2024 GDP growth outlook, citing capacity constraints and tight monetary policy.
- US import prices fell sharply in September, while Fed’s Bostic remains optimistic about inflation hitting the 2% target.
The Mexican Peso depreciated in early trading on Wednesday as the US Dollar strengthened amid a mixed market mood with falling US Treasury yields. Softer inflation readings among developed countries suggest that further easing is coming, indicating that the global economy might slow down. The USD/MXN trades at 19.87, registering gains of 1%.
US equities are fluctuating as traders shifts focus toward small caps as the Russell 2000 outperforms the NASDAQ and S&P 500. Therefore, emerging market currencies sensitive to risk, like the Peso, remained on the back foot.
On Tuesday, the International Monetary Fund (IMF) revised Mexico’s economy downward to 1.5% in 2024 due to capacity constraints and a restrictive monetary policy. This is well below the 2.4% estimated by the Secretaria de Hacienda y Credito Publico (SHCP).
The IMF estimates GDP growth for the next year at 1.3% as inflation closes in on the Bank of Mexico’s (Banxico) 3% objective.
On the US front, the docket revealed that import prices fell the most in nine months in September due to the fall of energy prices. Meanwhile, Export prices fell on monthly and annual figures.
On Tuesday, Atlanta’s Fed President Raphael Bostic commented the US economy is performing well, and that he’s confident that inflation will hit the 2% target. He doesn’t foresee a recession, though he expects inflation to remain choppy and employment robust.
Ahead in the week, Thursday’s economic docket will feature the release of Retail Sales, Initial Jobless Claims, Industrial Production and further Fed speakers.
Daily digest market movers: Mexican Peso slumps as USD/MXN surges past 19.80
- Earlier during the North American session, the Mexican Peso touched a five-week low as the USD/MXN hit a high of 19.93, shy of the psychological 20.00 figure.
- The IMF said that a recent judicial reform creates "important uncertainties about the effectiveness of contract enforcement and the predictability of the rule of law."
- Banxico’s survey revealed that economists estimate the central bank will lower rates by 50 bps for the rest of the year. The USD/MXN exchange rate is projected to end at 19.69, and the economy is expected to grow by 1.45% in 2024.
- US Import Prices plunged -0.4% MoM as expected in September. Export prices plummeted -0.7% more than estimates of -0.4% contraction and less than August’s -0.9%.
- Data from the Chicago Board of Trade via the December fed funds rate futures contract shows investors estimate 50 bps of Fed easing by the end of the year.
USD/MXN technical outlook: Mexican Peso nosedives as buyers eye USD/MXN at 20.00
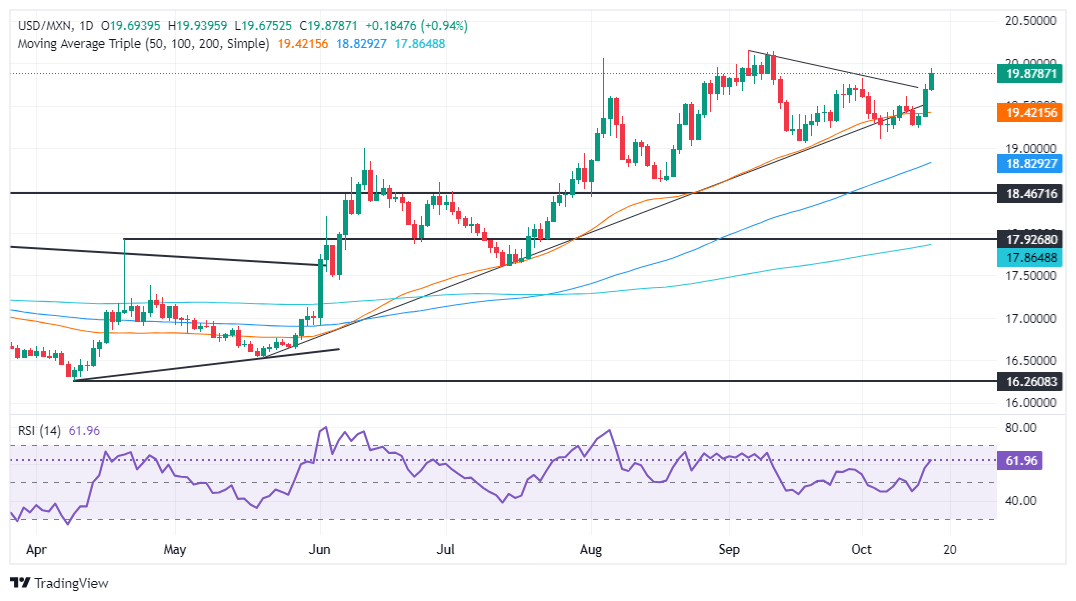
The USD/MXN uptrend remains intact as the pair briefly surpassed 19.90 to hit multi-week highs. Momentum remains bullish as the Relative Strength Index (RSI) depicts. This would exert upward pressure on the exotic pair, which could clear the 20.00 figure as traders brace for safety ahead of the US election.
The USD/MXN next ceiling level would be 20.00. If surpassed, the next resistance would be the YTD high of 20.22, before challenging 20.50.
On the flip side, if USD/MXN tumbles below the October 1 high turned support at 19.82, it could exacerbate a test of the October 10 daily peak at 19.61. On further weakness, the next floor will be the October 4 swing low of 19.10 before testing 19.00.
Mexican Peso FAQs
The Mexican Peso (MXN) is the most traded currency among its Latin American peers. Its value is broadly determined by the performance of the Mexican economy, the country’s central bank’s policy, the amount of foreign investment in the country and even the levels of remittances sent by Mexicans who live abroad, particularly in the United States. Geopolitical trends can also move MXN: for example, the process of nearshoring – or the decision by some firms to relocate manufacturing capacity and supply chains closer to their home countries – is also seen as a catalyst for the Mexican currency as the country is considered a key manufacturing hub in the American continent. Another catalyst for MXN is Oil prices as Mexico is a key exporter of the commodity.
The main objective of Mexico’s central bank, also known as Banxico, is to maintain inflation at low and stable levels (at or close to its target of 3%, the midpoint in a tolerance band of between 2% and 4%). To this end, the bank sets an appropriate level of interest rates. When inflation is too high, Banxico will attempt to tame it by raising interest rates, making it more expensive for households and businesses to borrow money, thus cooling demand and the overall economy. Higher interest rates are generally positive for the Mexican Peso (MXN) as they lead to higher yields, making the country a more attractive place for investors. On the contrary, lower interest rates tend to weaken MXN.
Macroeconomic data releases are key to assess the state of the economy and can have an impact on the Mexican Peso (MXN) valuation. A strong Mexican economy, based on high economic growth, low unemployment and high confidence is good for MXN. Not only does it attract more foreign investment but it may encourage the Bank of Mexico (Banxico) to increase interest rates, particularly if this strength comes together with elevated inflation. However, if economic data is weak, MXN is likely to depreciate.
As an emerging-market currency, the Mexican Peso (MXN) tends to strive during risk-on periods, or when investors perceive that broader market risks are low and thus are eager to engage with investments that carry a higher risk. Conversely, MXN tends to weaken at times of market turbulence or economic uncertainty as investors tend to sell higher-risk assets and flee to the more-stable safe havens.
- EUR/GBP rose on Wednesday, attempting to recover the 20-day SMA.
- RSI is rising sharply, while the MACD is flat and green, suggesting buying pressure is recovering.
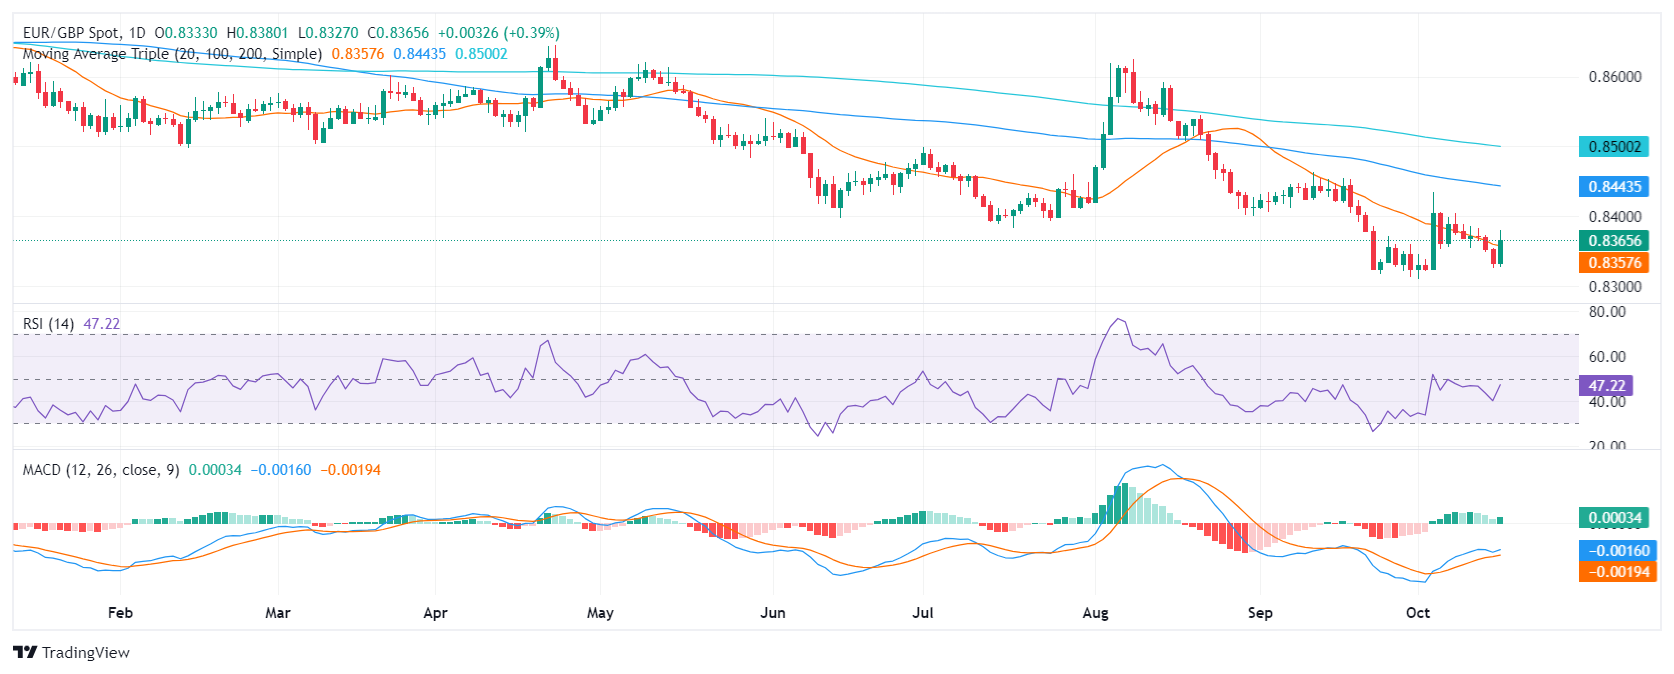
On Wednesday's session, the pair landed at 0.8360 with a gain of 0.37%. The cross surged and attempts to recover the 20-day Simple Moving Average (SMA), but momentum is still flat.
The Relative Strength Index (RSI) is currently at 48, which is in the negative area, but its slope is rising sharply, suggesting that buying pressure is recovering. The Moving Average Convergence Divergence (MACD) is flat and green, which suggests that buying pressure is also flat.
In terms of price action, the pair has been trading within a range of 0.8352 and 0.8390. There are support levels at 0.8350, 0.8330, and 0.8315, and resistance levels at 0.8370, 0.8390, and 0.8400. In case the bulls fail to gain the 0.8360-0.8400 area, it might trigger a sharp selling pressure but a consolidation above could fuel a recovery. In the meantime, buying momentum remains subdued.
EUR/GBP daily chart
US Presidential candidate Trump yesterday declared that ‘tariff’ was the most beautiful word in the dictionary. He made the threat that if other countries were to attempt to move away from the USD as the world’s dominant reserve currency that he would increase trade tariffs on that country, Rabobank’s FX analyst Jane Foley notes.
USD’s position as the dominant reserve currency to continue slipping
“While the aggregated IMF FX reserve data do not show any evidence that the use of sanctions and tariff in recent years has accelerated the movement away from USDs, it is difficult to ignore the potential impact from changing geopolitical factors. Despite Trump’s threats, in our view, it remains likely that the USD’s position as the dominant reserve currency will continue to slip, though the pace is likely to remain slow.”
“For many countries, particularly those strongly aligned with the US, the risk of trade tariffs could be sufficient to prevent a movement away from using the USD as the dominant invoicing currency. However, the implications for countries which already have a soured geopolitical relationship with the US, the implementation of sanctions could provide a greater incentive to by-pass the USD over time.”
“Domestically produced good, however, will usually be either more expensive or of an inferior quality then the import they replace. Tariffs therefore tend to be inflationary which should lift the USD and for this reason we would expect the USD to be stronger in the early months of a Trump presidency than a Harris one. Over time, however, tariffs can reduce productivity and growth potential.”
- GBP/USD drops 0.34%, reaching a low of 1.2981 after soft UK inflation report shocks markets.
- A close below 1.3000 could lead the pair to test the 100-DMA at 1.2951 and further support levels.
- If bulls regain control, resistance at 1.3100 and the 50-DMA at 1.3118 are key upside targets.
The Pound Sterling dived following a softer-than-expected UK inflation report, which dragged the GBP/USD exchange rate to a two-month low of 1.2981. Although it has recovered some ground, the pair is losing 0.49% and trades at 1.3008 at the time of writing.
GBP/USD Price Forecast: Technical outlook
After clearing the October 14 swing low of 1.3029, the GBP/USD accelerated its fall beneath 1.3000, which could pave the way for further downside.
Momentum supports sellers, as depicted by the Relative Strength Index (RSI), which broke the last trough, indicating the downtrend is accelerating.
If GBP/USD achieves a daily close below 1.3000, this could potentially send the pair to challenge the 100-day moving average (DMA) at 1.2951. On further weakness, the next stop would be the March 8 high turned support at 1.2894. If surpassed, the pair might extend its losses to the 200-DMA at 1.2793.
However, if buyers push the exchange rate past today’s high at 1.3076, and a move to 1.3100 is on the cards. Once cleared, the 50-DMA would be the next resistance level at 1.3118.
GBP/USD Price – Daily Chart
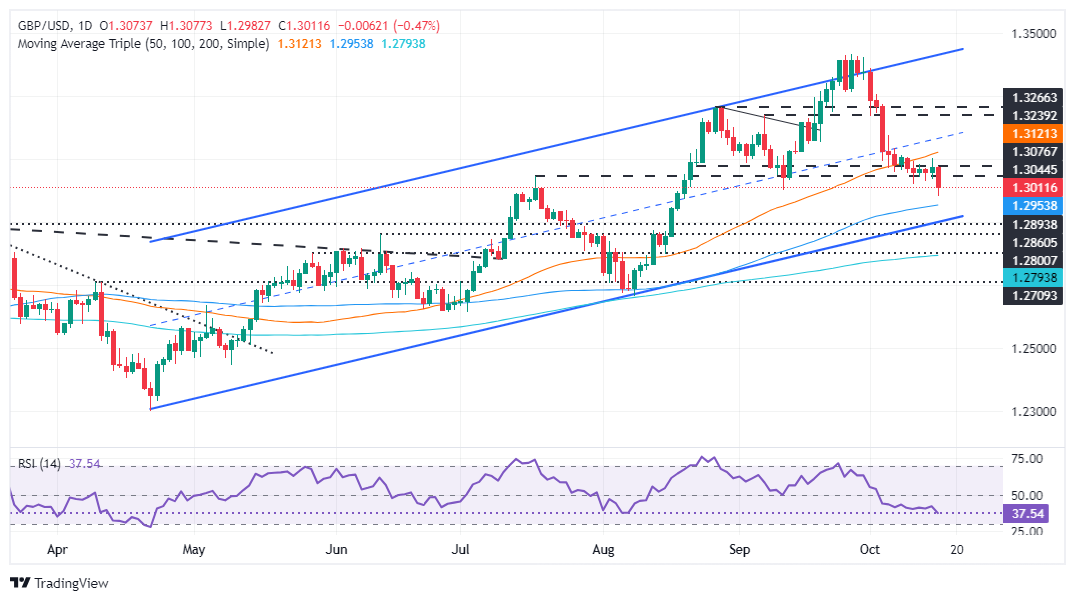
British Pound PRICE Today
The table below shows the percentage change of British Pound (GBP) against listed major currencies today. British Pound was the strongest against the Australian Dollar.
| USD | EUR | GBP | JPY | CAD | AUD | NZD | CHF | |
|---|---|---|---|---|---|---|---|---|
| USD | 0.13% | 0.50% | 0.31% | 0.02% | 0.57% | 0.34% | 0.29% | |
| EUR | -0.13% | 0.39% | 0.20% | -0.08% | 0.45% | 0.24% | 0.10% | |
| GBP | -0.50% | -0.39% | -0.21% | -0.47% | 0.06% | -0.15% | -0.23% | |
| JPY | -0.31% | -0.20% | 0.21% | -0.25% | 0.28% | 0.05% | 0.01% | |
| CAD | -0.02% | 0.08% | 0.47% | 0.25% | 0.53% | 0.31% | 0.24% | |
| AUD | -0.57% | -0.45% | -0.06% | -0.28% | -0.53% | -0.21% | -0.28% | |
| NZD | -0.34% | -0.24% | 0.15% | -0.05% | -0.31% | 0.21% | -0.08% | |
| CHF | -0.29% | -0.10% | 0.23% | -0.01% | -0.24% | 0.28% | 0.08% |
The heat map shows percentage changes of major currencies against each other. The base currency is picked from the left column, while the quote currency is picked from the top row. For example, if you pick the British Pound from the left column and move along the horizontal line to the US Dollar, the percentage change displayed in the box will represent GBP (base)/USD (quote).
- GBP/CAD extends its correction to fresh lows following lower-than-expected UK inflation data.
- The 1.7% rise in prices in September falls below the BoE’s 2.0% target.
- It increases the probability the BoE will cut interest rates decreasing foreign capital inflows and demand for Sterling.
GBP/CAD rolls over on Wednesday and declines almost half a percent to the mid 1.7900s. The fall is caused by the release of lower-than-expected inflation data from the UK – which showed headline inflation falling to 1.7% – as this put downside pressure on the Pound Sterling (GBP).
Cooler inflation increases the likelihood that the Bank of England (BoE) will cut interest rates, and lower interest rates are negative for Sterling as they reduce foreign capital inflows.
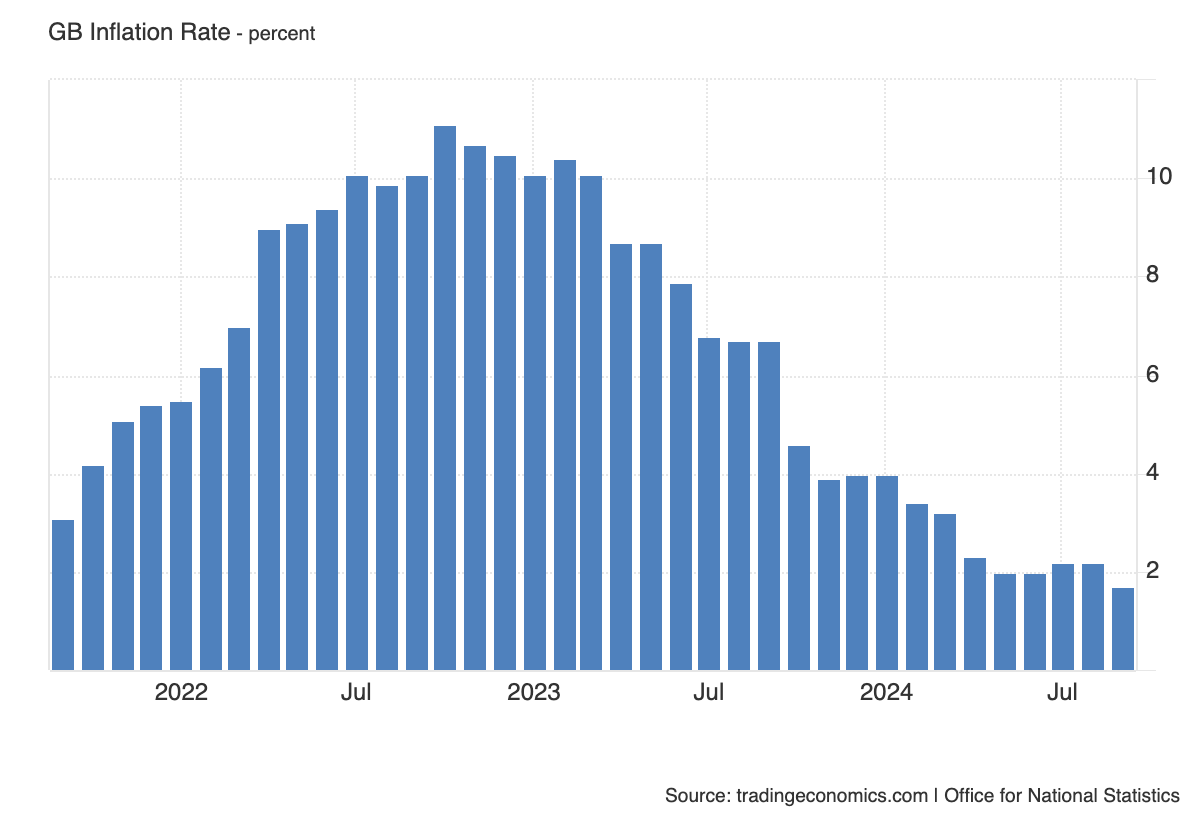
Before the release it was unclear whether the BoE would go ahead with an interest rate cut at their next meeting in November, mainly due to stubbornly high services inflation, however, Wednesday’s figures increase the odds the bank will go ahead with a 25 basis point (bps) (0.25%) rate cut.
Wednesday’s data showed that both core and services sector inflation cooled in September, falling to 3.2% and 4.9% respectively. Core fell from 3.6% in August and was below the 3.4% expected; services fell from 5.5% in August, reaching its lowest level since May 2022.
Bailey vindicated
Last week the Pound depreciated after the Governor of the BoE, Andrew Bailey said the bank should get more “activist” and “aggressive” about cutting interest rates which, at 5.0%, are one of the highest amongst western developed countries.
Although the BoE’s Chief Economist Huw Pill calmed markets on the day after Bailey’s speech – saying the bank should still act with caution when it came to lower interest rates, September’s data suggests Bailey was accurate in his assessment. After all, headline inflation has now fallen well below the BoE’s 2.0% target.
GBP/CAD Daily Chart
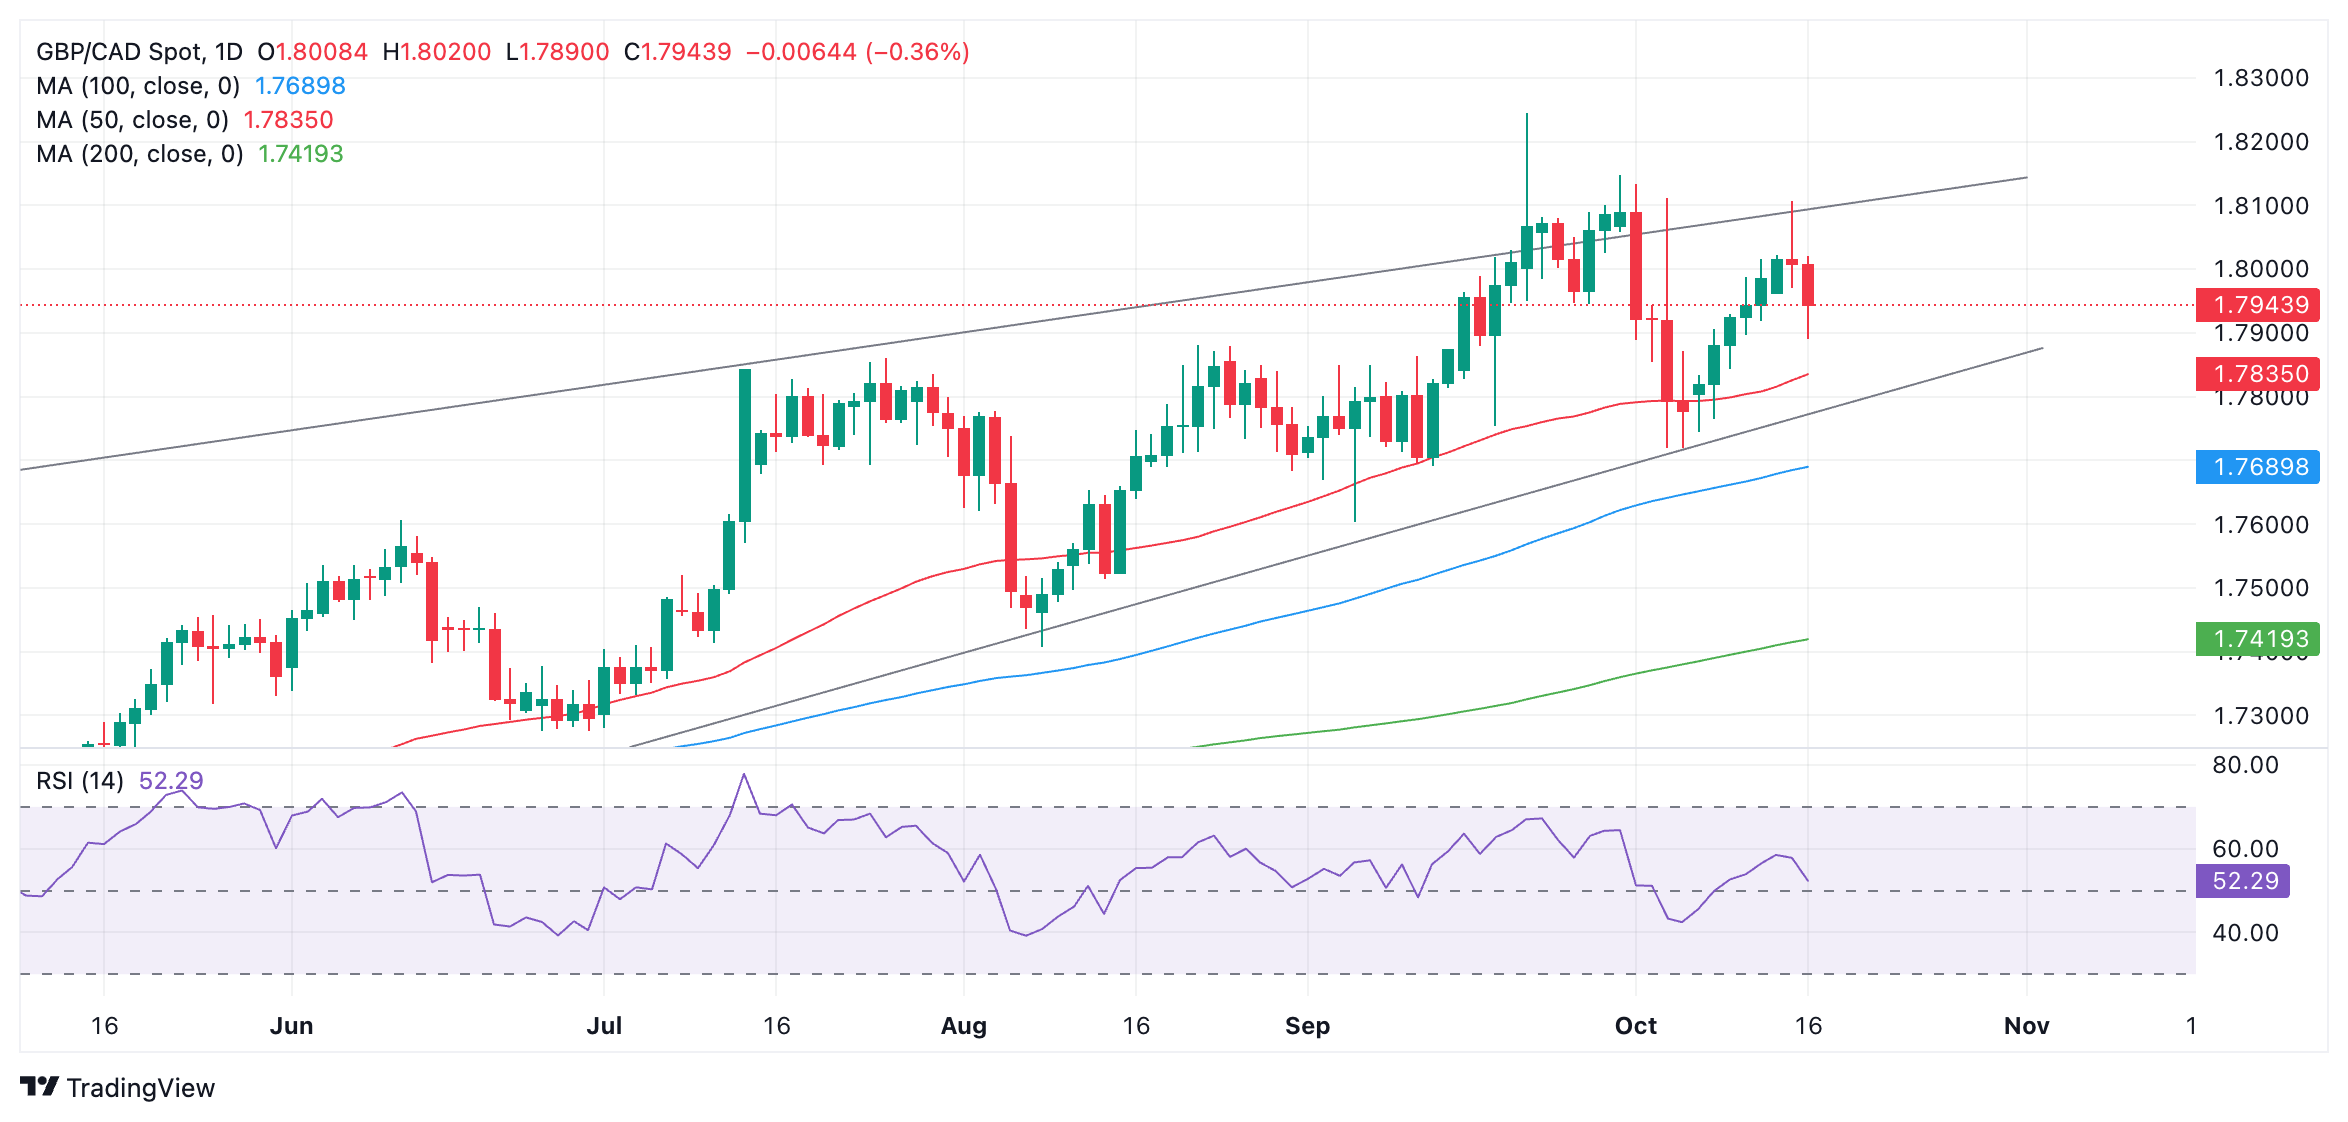
Downside for GBP/CAD may be limited, however, given similarly weak inflation data from Canada.
Data out on Tuesday, for example, showed that the Canadian headline Consumer Price Index (CPI) declined to 1.6% annually in September, from 2.0% in August, and below estimates of 1.8%. This, in turn, suggests the Bank of Canada (BoC) will cut interest rates again (after three consecutive 25 bps cuts already) at its next meeting on October 23.
The fall in Canadian inflation was mainly caused by a 10.7% decline in gasoline prices in September, and also affected related sectors such as transportation (down 1.5%). It marked the second month that headline inflation has fallen below the bank’s 2.0% target. Lower Crude Oil prices were responsible for the decline in gasoline prices. Oil also happens to be Canada’s largest export commodity. This, in turn, undermines the Canadian Dollar (CAD) and is a bullish factor for the GBP/CAD pair.
Trump says he would rip up free trade agreement with neighbors
The Canadian Dollar could be facing headwinds after comments by former president Donald Trump, in which he said that he would pursue a radical “America First” if elected in November.
In an interview with Bloomberg News, Trump said he would act to stop cheap Chinese cars from flooding the US market via carmakers nearshoring in Mexico as this was killing the US auto industry. Mexico has a free trade agreement with the US and Canada (USMCA), however, Trump suggested he would rip this up if he were made President. There is a risk Trump could also extend the trade war to the north and place heavy tariffs on Canadian goods, although the US does rely on Canadian Oil, suggesting it could be spared the same treatment as Mexico.
Trump’s comments carried all the more bite because he is now the favorite to win the election according to betting websites. OddsChecker puts his chances at 58% to Vice-President Kamala Harris’s 42%. Trump is still lagging in the polls however, which show Harris leading with 48.5% versus Trump’s 46.1%, according to website FiveThirtyEight.
- USD/JPY trades sideways near 149.00 amid uncertainty over the Fed interest rate outlook.
- The Fed is expected to cut interest rates by 25 bps in November and December too.
- Investors will pay close attention to Japan’s National CPI data for September.
The USD/JPY pair trades in a tight range near 149.00 in Wednesday’s North American session. The asset consolidates as investors look for fresh cues about the Federal Reserve’s (Fed) likely interest rate action in the remaining year.
Market sentiment remains risk-averse amid growing speculation that former US President Donald Trump could win presidential elections, which are scheduled on November 5. The S&P 500 trades cautiously in the opening session. The US Dollar Index (DXY), which tracks the Greenback’s value against six major currencies, trades in a tight range near a two-month high around 103.40.
According to the CME FedWatch tool, 30-day Federal Funds futures pricing data shows that the central bank will cut interest rates by 25 basis points (bps) in both policy meetings in November and December.
Lately, traders have priced out Fed large rate cut bets as a string of United States (US) data for September showed that economic prospects are not as bad as they appeared earlier. US Nonfarm Payrolls and the Services PMI grew at a robust pace, with inflationary pressures rising faster-than-expected.
On the Tokyo front, the Japanese Yen (JPY) has remained under pressure from a past few weeks as investors doubt about more rate hikes from the Bank of Japan (BoJ) in the remainder of the year. For fresh interest rate cues, investors will pay close attention to the Japan’s National Consumer Price Index (CPI) data for September, which will be published on Friday. National CPI ex Fresh Food is estimated to have grown at a slower pace to 2.3% from 2.8% in August.
Japanese Yen FAQs
The Japanese Yen (JPY) is one of the world’s most traded currencies. Its value is broadly determined by the performance of the Japanese economy, but more specifically by the Bank of Japan’s policy, the differential between Japanese and US bond yields, or risk sentiment among traders, among other factors.
One of the Bank of Japan’s mandates is currency control, so its moves are key for the Yen. The BoJ has directly intervened in currency markets sometimes, generally to lower the value of the Yen, although it refrains from doing it often due to political concerns of its main trading partners. The BoJ ultra-loose monetary policy between 2013 and 2024 caused the Yen to depreciate against its main currency peers due to an increasing policy divergence between the Bank of Japan and other main central banks. More recently, the gradually unwinding of this ultra-loose policy has given some support to the Yen.
Over the last decade, the BoJ’s stance of sticking to ultra-loose monetary policy has led to a widening policy divergence with other central banks, particularly with the US Federal Reserve. This supported a widening of the differential between the 10-year US and Japanese bonds, which favored the US Dollar against the Japanese Yen. The BoJ decision in 2024 to gradually abandon the ultra-loose policy, coupled with interest-rate cuts in other major central banks, is narrowing this differential.
The Japanese Yen is often seen as a safe-haven investment. This means that in times of market stress, investors are more likely to put their money in the Japanese currency due to its supposed reliability and stability. Turbulent times are likely to strengthen the Yen’s value against other currencies seen as more risky to invest in.
Platinum markets hold the most extreme asymmetry in algo flows expected over the coming week, TDS’ macro analyst Daniel Ghali notes.
Window for large-scale selling activity might be opening
“The window for large-scale selling activity could be opening, with a big downtape potentially catalyzing a massive -50% swing in algo positioning, whereas a commensurate uptape would only spark marginal buying activity.”
“Even in a flat tape, we expect substantial CTA selling activity over the coming week, with algos set to sell up to -20% of their max size over this timeframe. This set-up strongly favors continued downside over the coming week.”
- Silver price climbs to near $32.00 as its safe-haven demand has improved amid a sour market mood.
- The white metal has also gained at the US Yields’ cost.
- Traders expect the Fed to cut interest rates by 50 bps in the remainder of the year.
Silver price (XAG/USD) jumps to near the crucial resistance of $32.00 in Wednesday’s North American. The white metal gains as investors’ risk appetite has diminished due to growing speculation that former US President Donald Trump will win the upcoming presidential elections. The Trump 2.O administration is expected to result in an increase in tariffs on imports of various goods.
S&P 500 futures trade cautiously in the North American session. The US Dollar Index (DXY), which tracks the Greenback’s value against six major currencies, clings to gains around 103.40.
Meanwhile, a slight decline in US Treasury yields has also strengthened the Silver price. 10-year US Treasury yields drop to near a weekly low around 4%. Lower yields on interest-bearing assets reduce the opportunity cost of holding an investment in non-yielding assets, such as Silver.
Going forward, the Silver price will be guided by market expectations for the Federal Reserve’s (Fed) interest rate outlook. According to the CME FedWatch tool, traders see the Fed reducing interest rates by 50 basis points (bps) to 4.25%-4.50%, suggesting that the central bank will cut interest rates by 25 bps in November and December meetings.
On the economic data front, investors will pay close attention to the United States (US) monthly Retail Sales data for September, a key measure of consumer spending that drives price pressures, which will be published on Thursday. Economists expect the Retail Sales to have grown by 0.3%.
Silver technical analysis
Silver price strives to reclaim the decade-high of $33.00. Upward-sloping 20- and 50- Exponential Moving Averages (EMAs) near $31.20 and $30.40, respectively, suggest a strong uptrend.
The 14-day Relative Strength Index (RSI) approaches 60.00. A decisive break above the same would activate a bullish momentum.
Silver daily chart
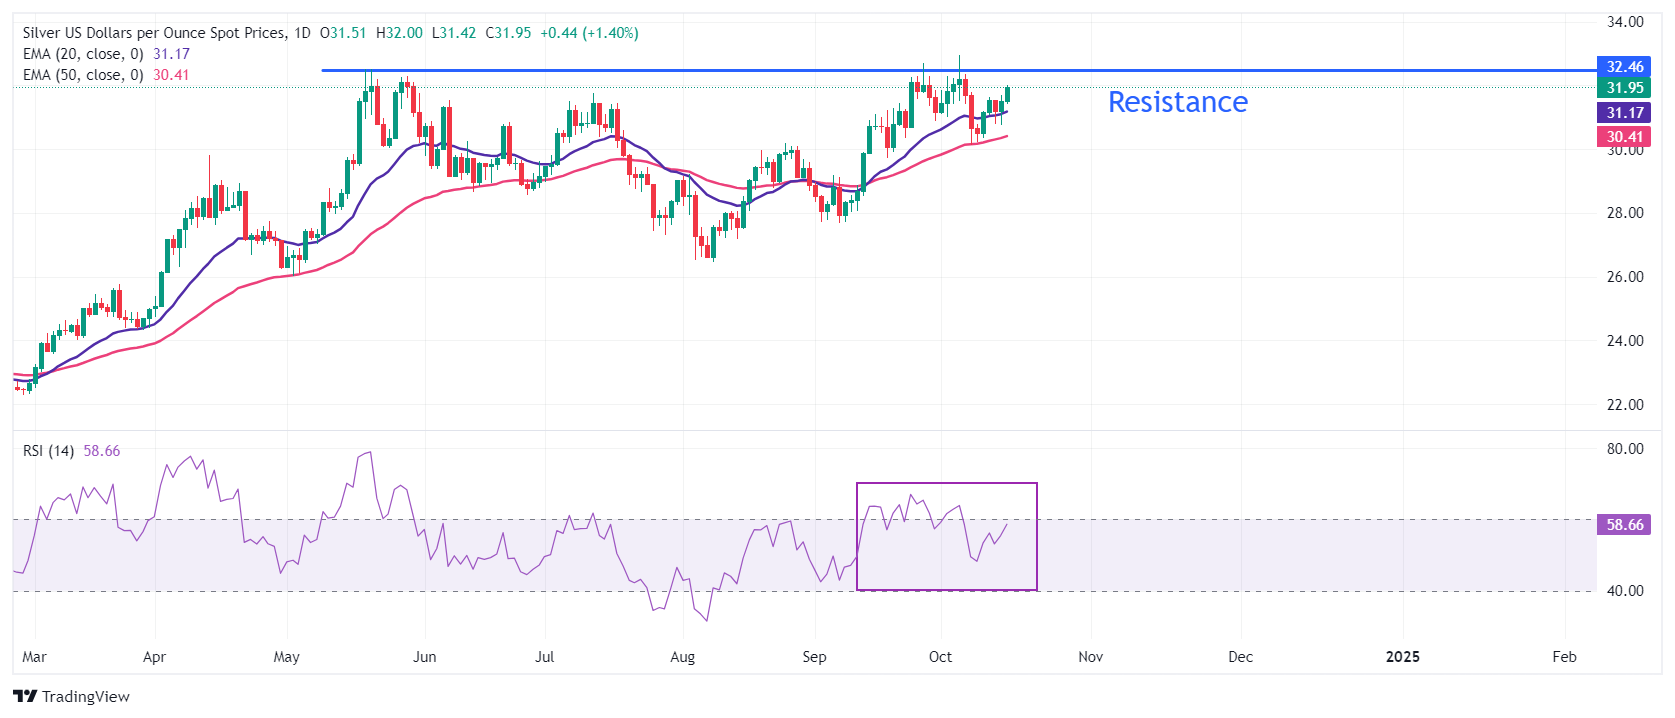
Silver FAQs
Silver is a precious metal highly traded among investors. It has been historically used as a store of value and a medium of exchange. Although less popular than Gold, traders may turn to Silver to diversify their investment portfolio, for its intrinsic value or as a potential hedge during high-inflation periods. Investors can buy physical Silver, in coins or in bars, or trade it through vehicles such as Exchange Traded Funds, which track its price on international markets.
Silver prices can move due to a wide range of factors. Geopolitical instability or fears of a deep recession can make Silver price escalate due to its safe-haven status, although to a lesser extent than Gold's. As a yieldless asset, Silver tends to rise with lower interest rates. Its moves also depend on how the US Dollar (USD) behaves as the asset is priced in dollars (XAG/USD). A strong Dollar tends to keep the price of Silver at bay, whereas a weaker Dollar is likely to propel prices up. Other factors such as investment demand, mining supply – Silver is much more abundant than Gold – and recycling rates can also affect prices.
Silver is widely used in industry, particularly in sectors such as electronics or solar energy, as it has one of the highest electric conductivity of all metals – more than Copper and Gold. A surge in demand can increase prices, while a decline tends to lower them. Dynamics in the US, Chinese and Indian economies can also contribute to price swings: for the US and particularly China, their big industrial sectors use Silver in various processes; in India, consumers’ demand for the precious metal for jewellery also plays a key role in setting prices.
Silver prices tend to follow Gold's moves. When Gold prices rise, Silver typically follows suit, as their status as safe-haven assets is similar. The Gold/Silver ratio, which shows the number of ounces of Silver needed to equal the value of one ounce of Gold, may help to determine the relative valuation between both metals. Some investors may consider a high ratio as an indicator that Silver is undervalued, or Gold is overvalued. On the contrary, a low ratio might suggest that Gold is undervalued relative to Silver.
- USD/CHF is trading in a mini-range after pulling back from new highs.
- This is probably a pause before the pair goes to new highs.
USD/CHF is consolidating within its short-term uptrend in what is likely to be a temporary pull back before the market goes higher again.
The pair is probably in a short-term uptrend now given the rising sequence of peaks and troughs since it broke out of the range-bound consolidation in August and September.
USD/CHF 4-hour Chart
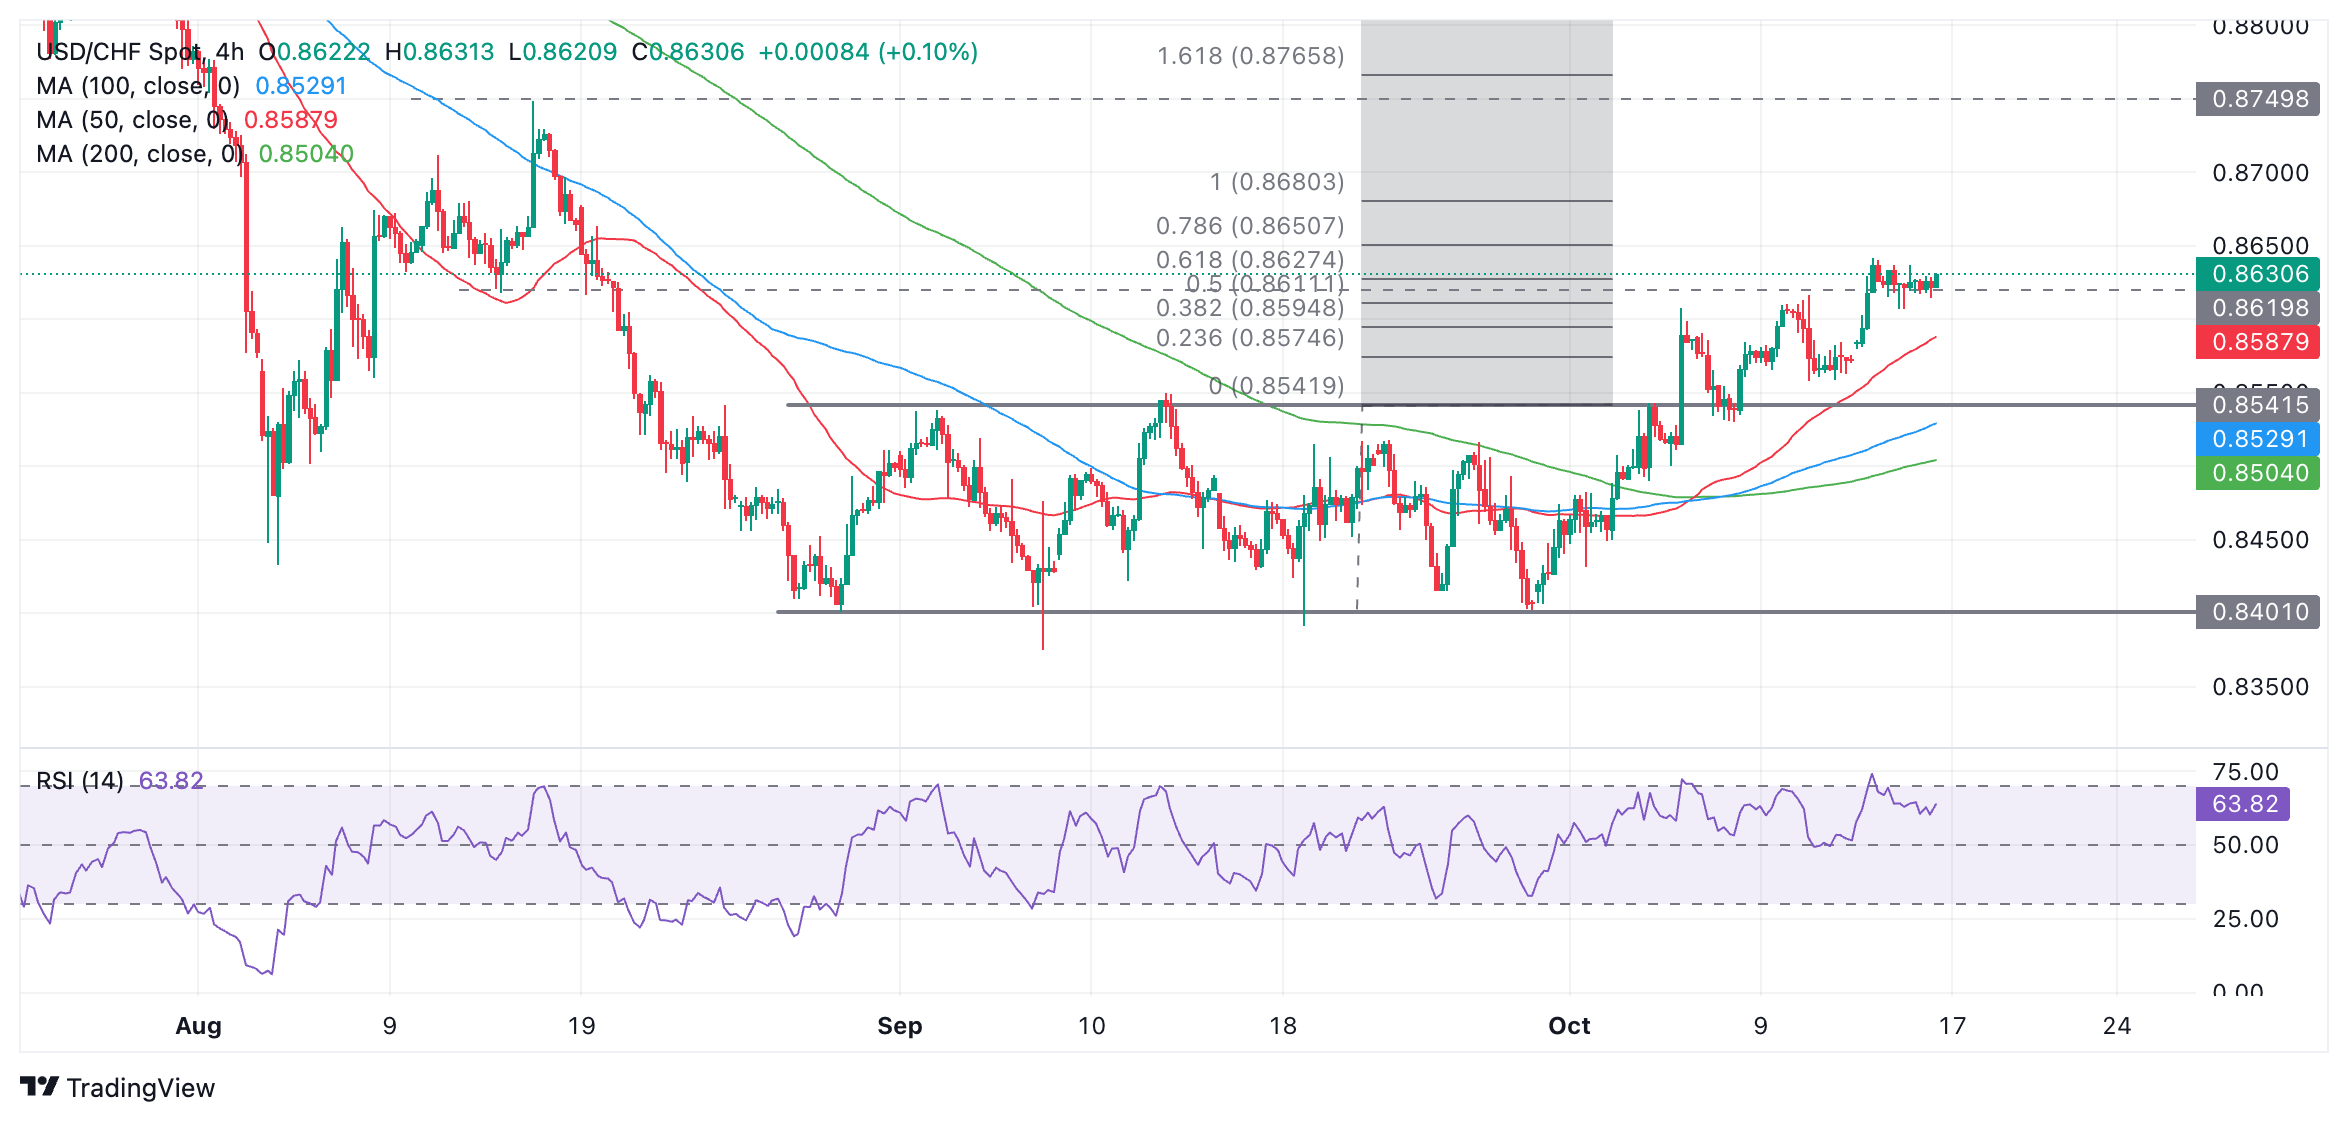
USD/CHF will probably reach the target generated after it broke out of the range, at 0.8680, the 100% Fibonacci (Fib) extrapolation of the height of the range higher. A break above 0.8641 (October 14 high) would provide confirmation. A break above that level could lead to a further extension to the 0.8750 resistance level (August 15 high).
USD/CHF has already met the conservative target at 0.8627, the 61.8% Fib level.
A chart gap opened on Monday morning and there is a risk the market could pull back all the way to fill this gap. If so, it could correct down to 0.8574. It would require a break below the former range highs at 0.8541 to confirm a probable change of trend.
- EUR/JPY is correcting lower after another test of the top of its ten-week range.
- The pair could begin falling within the range if it passes various confirmation levels.
EUR/JPY pulls back after testing the top of its ten-week range. The pair is in a sideways trend with the odds favoring a continuation in line with technical analysis trend theory.
EUR/JPY 4-hour Chart
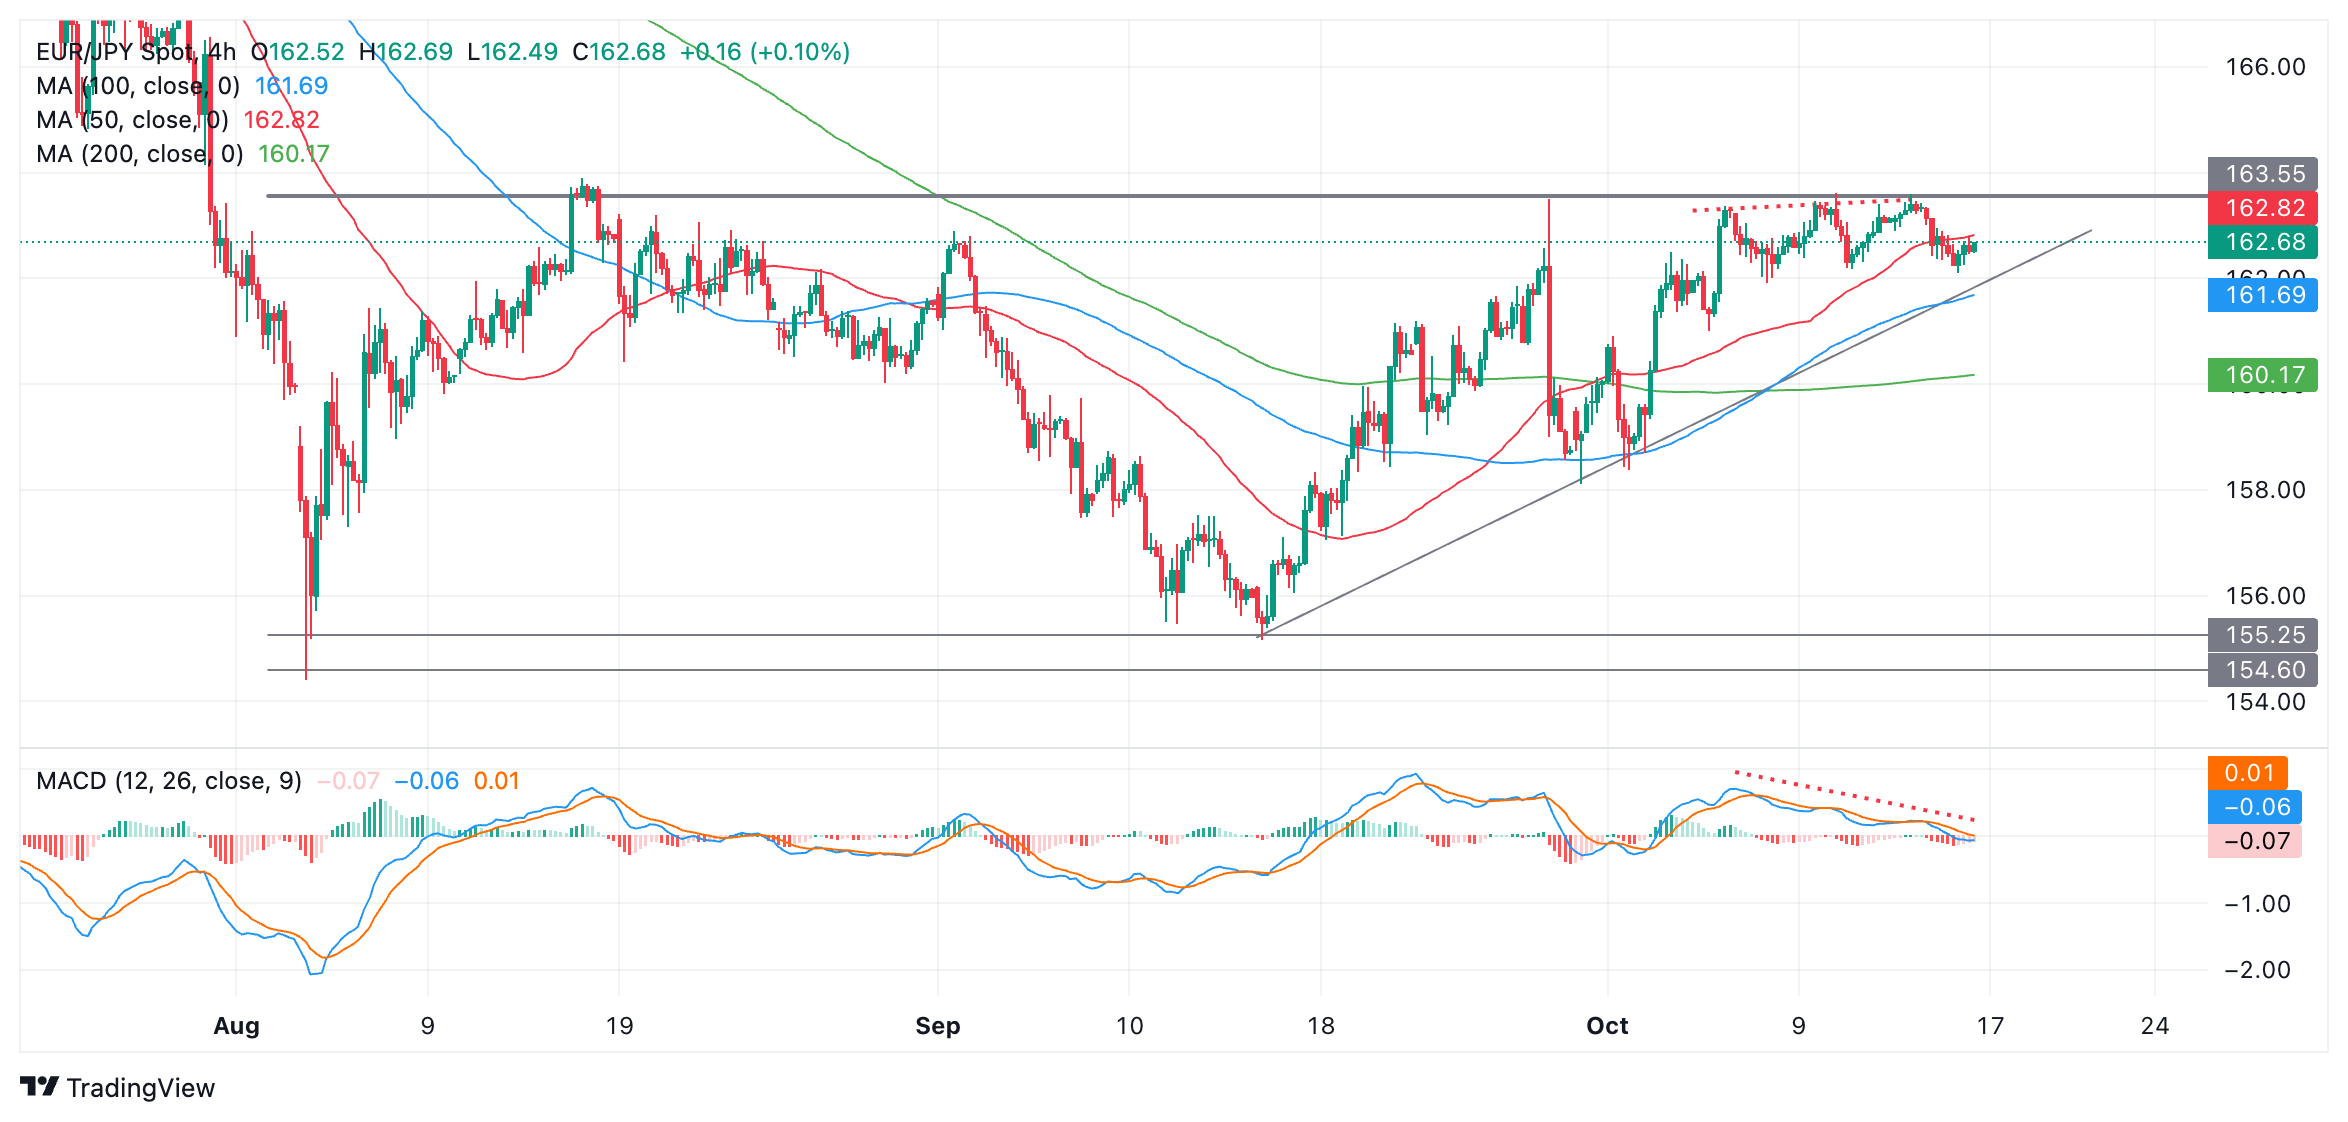
EUR/JPY’s next move will probably be down, therefore, towards the range floor in the 154s.
A break below 161.91 (October 8 low) would help confirm such a move, and a breach of the trendline for the up leg at around 161.80 (black line on chart) would provide stronger confirmation. The next downside target lies at about 158.32 – the October 1 as well as September 30 lows.
The Moving Average Convergence Divergence (MACD) momentum indicator is diverging bearishly with price (red dotted lines on chart). Whilst price has been making slightly higher highs with each breakout attempt, MACD has been declining. This is a further warning sign of losses to come.
Alternatively, it is possible that EUR/JPY breaks out above the range. Such a break would need to be decisive to inspire confidence. A decisive move would be one characterized by a longer-than-average green candlestick which cleared the range high and closed near its high, or three green candles in a row breaking above the top of the range.
- The US Dollar gets propped up and flirts with a fresh two-month high.
- Traders are adding to more bets on a Trump win for a second day in a row.
- The US Dollar Index breaks above a key level on its way to 104.00.
The US Dollar (USD) extends gains on Wednesday after breaking above a very heavy resistance level in the US Dollar Index (DXY). The Greenback received an extra push after former President Donald Trump appeared on Bloomberg television outlining his plans if he wins the November 5 presidential election. Trump delivered some harsh statements on trade, taxes and the Federal Reserve (Fed) which were enough to push the Greenback higher against most major currency peers as traders increasingly seem to price in a victory for the Republican nominee.
The US economic calendar is light on Wednesday, with no real market-moving data ahead and no Fed officials set to speak. Expect traders to sit on their hands in the run-up to the European Central Bank (ECB) meeting on Thursday.
Daily digest market movers: Trump banks on momentum
- During the US session on Tuesday, former President Donald Trump appeared in an interview on Bloomberg. He used the forum to further outline his plans on trade, the US economy and the Fed. His words pushed the US Dollar higher to fresh two-month highs against the Euro (EUR) and against the Chinese Yuan (CNY).
- Looking at the calendar, the weekly Mortgage Applications from the Mortgage Bankers Association (MBA) were due at 11:00 GMT. Applications fell by a staggering 17% after last week applications already fell by 5.1%.
- At 12:30 GMT, the Import/Export Price Index for September is due:
- Monthly Export Prices are set to decline less rapidly, by 0.4%, against the 0.7% decline from August while the Monthly Import Price Index is set to decline further to 0.4, coming from a negative 0.3% in August.
- Equities trade mixed, with Chinese stocks having closed substantially lower, while Japan was up on the day. European equities look sluggish while US futures are rather flat.
- The CME Fed rate expectation for the meeting on November 7 shows a 94.2% probability of a 25 basis point rate cut, while the remaining 5.8% is pricing in no rate cut. Chances for a 50 bps rate cut have been fully priced out.
- The US 10-year benchmark rate is trading at 4.00%, a touch softer than the high from last week at 4.11% seen on Thursday.
US Dollar Index Technical Analysis: Trump effect swells
The US Dollar Index (DXY) is seeing ample amount of support and inflow for a second day in a row after former US President Donald Trump’s interview..
Markets are starting to take positions on the assumption that Trump will win the election, which traders seem to be associating to a stronger US Dollar based on his laid-out plans. With the DXY making its way through that difficult 100-day Simple Moving Average (SMA) at 103.21, the next level up is 103.78 and 104.00.
A double belt of resistance is ahead at 103.78, which aligns with the 200-day SMA. After that, there is a small gap before hitting the pivotal level at 103.99 and the 104.00 big figure. Should Trump start to further lead in the polls, a rapid swing up to 105.00 with 105.53 as first port of call could be on the cards.
On the downside, the 100-day SMA at 103.21 together with the pivotal level at 103.18 is now acting as support and should avoid the DXY from falling lower. With the Relative Strength Index near overbought territory, a test on this level looks granted. Further down, the 55-day SMA at 101.85 and the pivotal level at 101.90 should avoid any further downside moves.
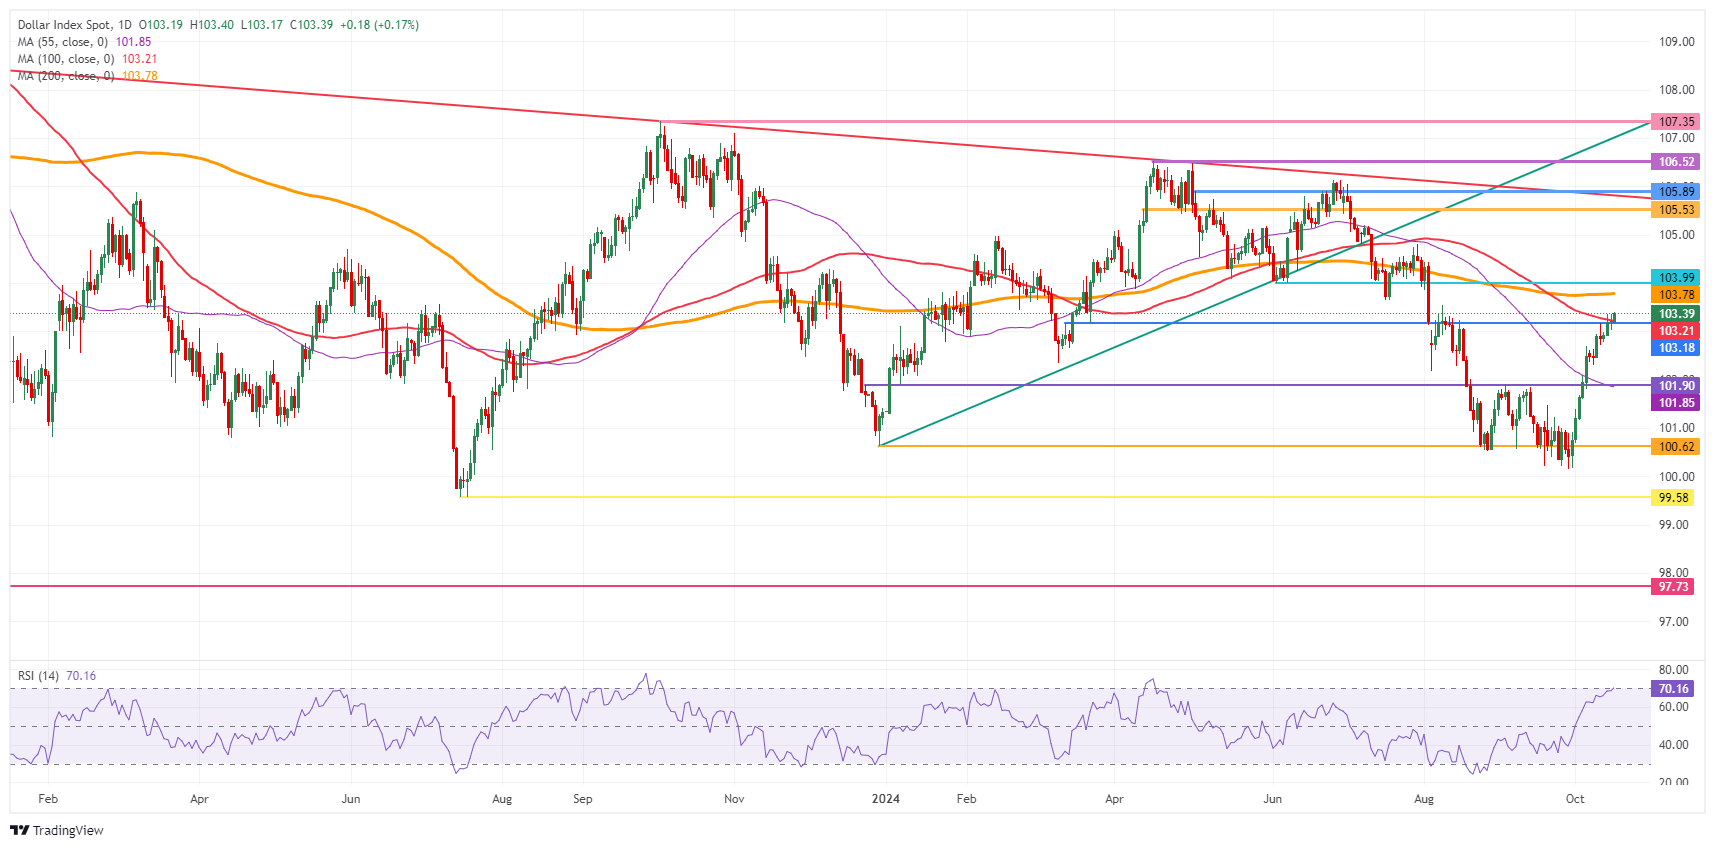
US Dollar Index: Daily Chart
US Dollar FAQs
The US Dollar (USD) is the official currency of the United States of America, and the ‘de facto’ currency of a significant number of other countries where it is found in circulation alongside local notes. It is the most heavily traded currency in the world, accounting for over 88% of all global foreign exchange turnover, or an average of $6.6 trillion in transactions per day, according to data from 2022. Following the second world war, the USD took over from the British Pound as the world’s reserve currency. For most of its history, the US Dollar was backed by Gold, until the Bretton Woods Agreement in 1971 when the Gold Standard went away.
The most important single factor impacting on the value of the US Dollar is monetary policy, which is shaped by the Federal Reserve (Fed). The Fed has two mandates: to achieve price stability (control inflation) and foster full employment. Its primary tool to achieve these two goals is by adjusting interest rates. When prices are rising too quickly and inflation is above the Fed’s 2% target, the Fed will raise rates, which helps the USD value. When inflation falls below 2% or the Unemployment Rate is too high, the Fed may lower interest rates, which weighs on the Greenback.
In extreme situations, the Federal Reserve can also print more Dollars and enact quantitative easing (QE). QE is the process by which the Fed substantially increases the flow of credit in a stuck financial system. It is a non-standard policy measure used when credit has dried up because banks will not lend to each other (out of the fear of counterparty default). It is a last resort when simply lowering interest rates is unlikely to achieve the necessary result. It was the Fed’s weapon of choice to combat the credit crunch that occurred during the Great Financial Crisis in 2008. It involves the Fed printing more Dollars and using them to buy US government bonds predominantly from financial institutions. QE usually leads to a weaker US Dollar.
Quantitative tightening (QT) is the reverse process whereby the Federal Reserve stops buying bonds from financial institutions and does not reinvest the principal from the bonds it holds maturing in new purchases. It is usually positive for the US Dollar.
- EUR/CAD oscillates within a ten-week range – the trend is sideways.
- A breakout higher or lower would be required to alter the trend to something more directional.
EUR/CAD is bouncing down a ten-week corridor that has a floor at 1.4890 and a sloping ceiling in around the 1.5100s. That is to say that the pair is in a range-bound, sideways trend on a short and medium-term basis.
Long-term the trend is bullish.
EUR/CAD Daily Chart
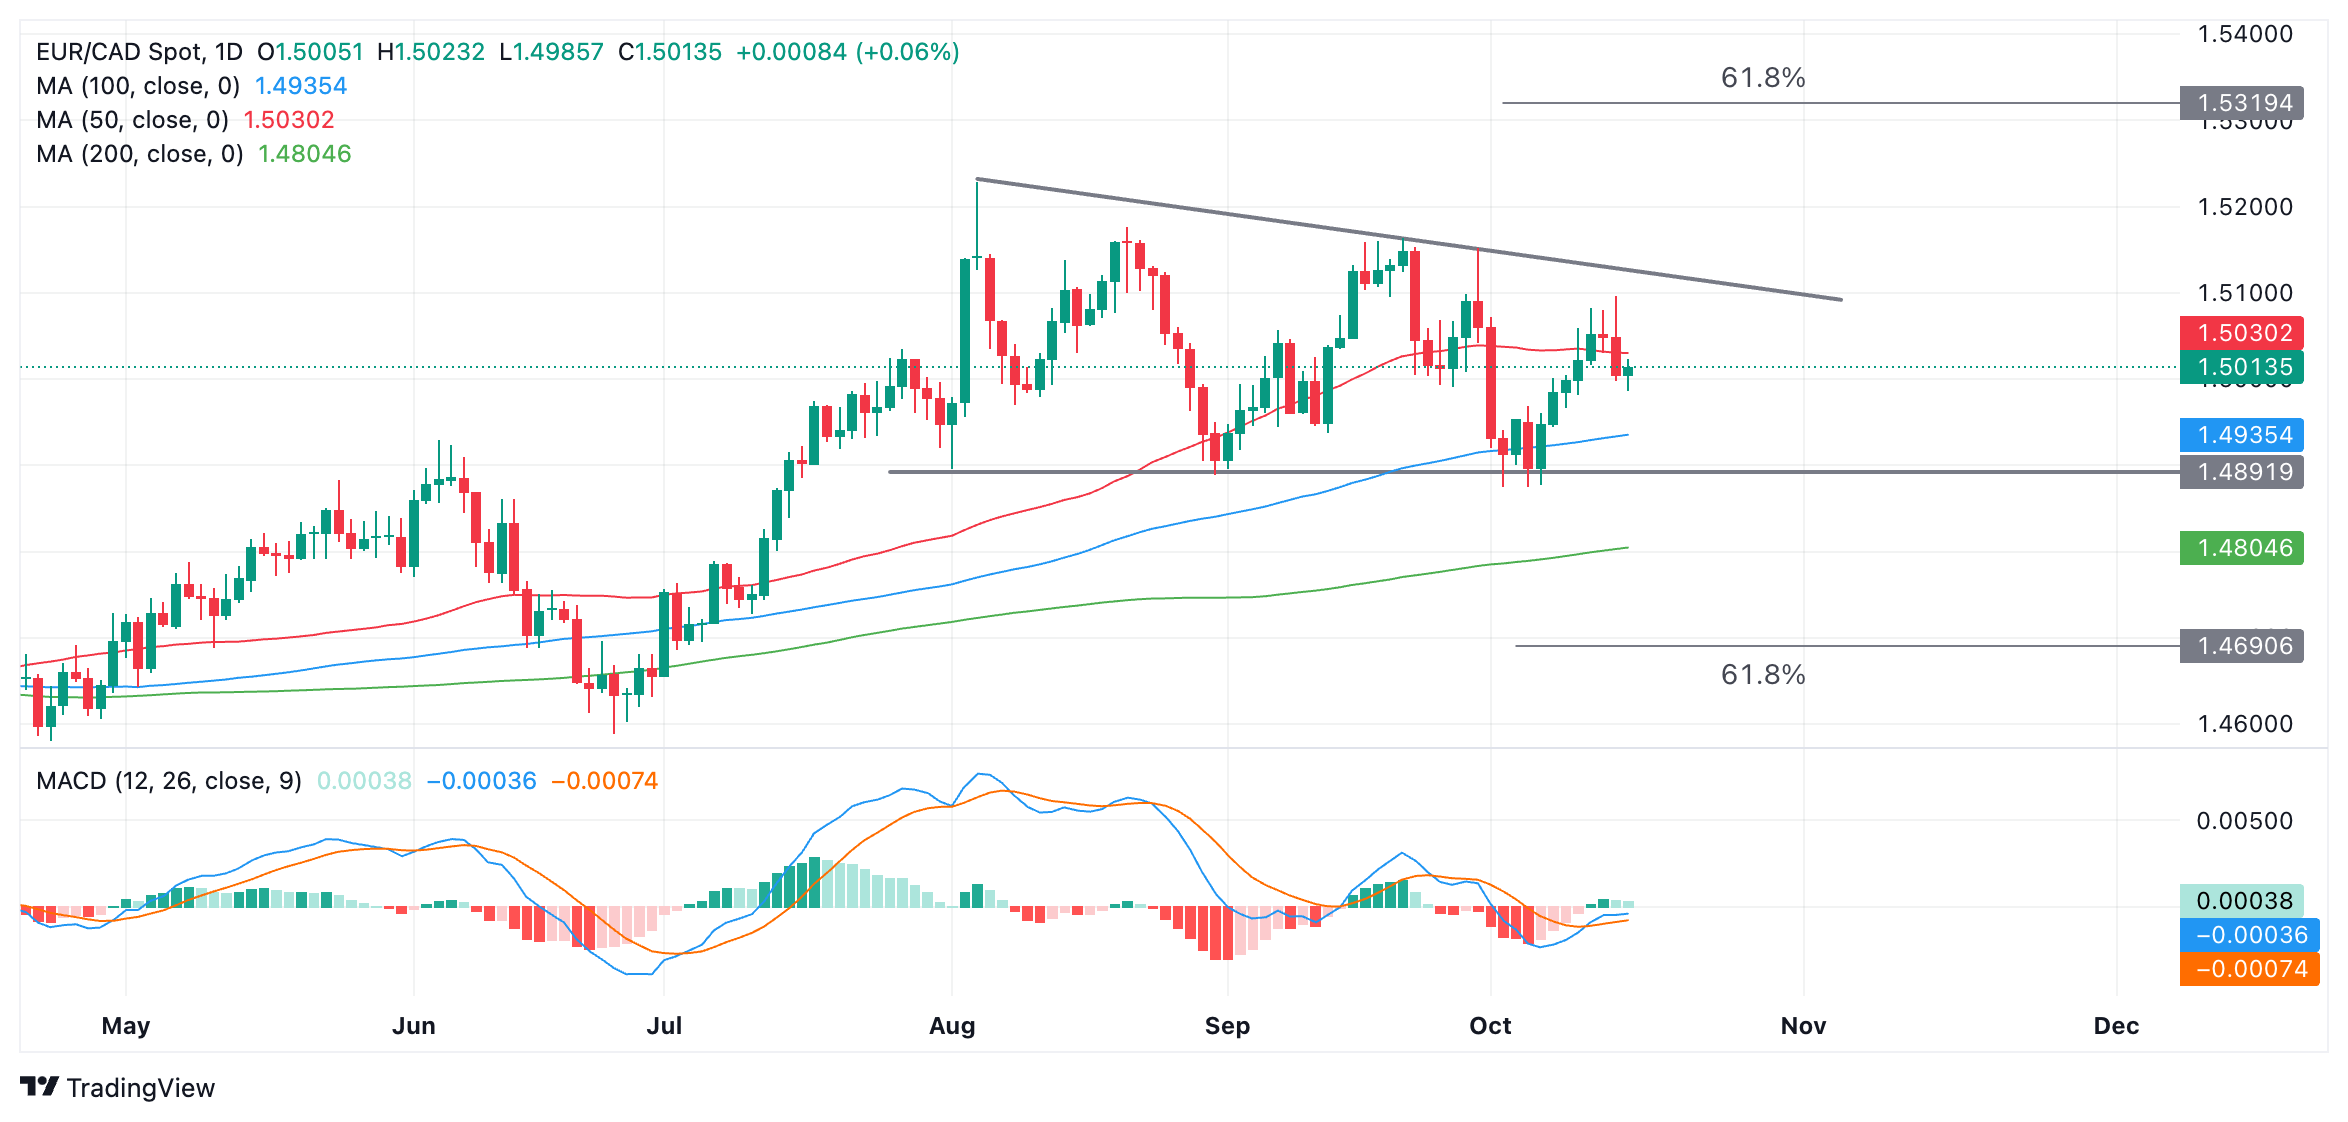
It will probably continue in its range until it decisively breaks out either higher or lower. The fact it is in a longer-term uptrend would normally marginally favor an upside breakout but the range’s flat bottom cancels out the bullish bias because it marginally favors a downside break. Overall there is no obvious bias.
In the event of a breakout higher the pair will probably rise up to a target at 1.5319, the Fibonacci 61.8% extrapolation of the height of the range higher. A decisive break would be one accompanied by a longer-than-average green candlestick that broke clearly above the top of the range and closed near its high, or three green candlesticks that broke above the top of the range.
Alternatively, a decisive break below the floor of the range is also possible and such a move would probably reach 1.4690, the 61.8% Fib extrapolation lower.
New Zealand's third quarter inflation figures were almost in line with expectations: the year-on-year rate fell as expected to 2.2%, while quarter-on-quarter inflation rose slightly less than expected to 0.6%. The data do not really allow for a fundamental reassessment, Commerzbank’s FX analyst Michael Pfister notes.
NZD/USD is well off its early October highs
“In fact, there is still a strong case for the Reserve Bank of New Zealand to continue to ease the restrictiveness of monetary policy at upcoming meetings. After all, New Zealand's real economy continues to falter and the sharp decline in the annual rate should provide arguments for a further 50bp cut next month.”
“The Kiwi came under pressure after the figures were released, only to recover somewhat in early Asian trading. NZD/USD is now well off its early October highs. While last week's 50bp rate cut may have played a role, as it boosted New Zealand's expectations for the November meeting, continued weakness in Chinese data may also have played a role.”
“With inflation, one of New Zealand's most important data points, now behind us, attention should return to Chinese data. If they continue to weaken, the Kiwi's recovery is likely to be delayed.”
The pricing out of Canadian rate cuts following the surprisingly strong US payrolls data wasn’t fundamentally justified. Canadian expectations have been revised sharply and the market is now pricing in even more Canadian rate cuts than before the US payrolls data. This is despite the contrasting developments in interest rate expectations in the euro area, the US and the UK, as well as the surprisingly strong Canadian payrolls last Friday, Commerzbank’s FX analyst Michael Pfister notes.
CAD isn’t expected to rally significantly in the coming weeks
“In fact, this development preceded yesterday's Canadian inflation figures. However, the figures intensified the move in the afternoon and ensured that the market moved even further towards the view that there could be one or even two rate cuts of 50 basis points each at the next two meetings. This was driven by the surprisingly sharp fall in the headline rate to 1.6% year-on-year.”
“While core inflation measures are still just above the midpoint of the target range of 1-3%, the headline rate is now giving rise to concerns that the inflation target is being undershot. The pace of disinflation has been so rapid of late that the BoC's three 75bp rate cuts to date are not enough to make monetary policy less restrictive.”
“We were already inclined to expect a 50bp cut in October after BoC Governor Tiff Macklem's rather clear comments about faster rate cuts, but after yesterday's figures this should be almost a foregone conclusion. And unless inflation picks up in the coming months, another 50bp cut is likely in December. We therefore remain skeptical that the CAD will rally significantly in the coming weeks. Those hoping for lower USD-CAD levels should therefore look for USD weakness rather than CAD strength.”
Yesterday's UK employment data underlined once again why markets are quite bullish on the Pound Sterling (GBP): job growth was very strong, surprisingly pushing the unemployment rate down to its lowest level in half a year. Wage growth slowed, but including bonuses it slowed slightly less than expected. So the UK labor market seems to remain very solid and does not require an urgent interest rate cut, Commerzbank’s FX analyst Michael Pfister notes.
Risk of faster rate cuts is rising in the UK
“This is likely to have been an outlier, as most of the increase was due to an extraordinary rise in travel prices – seasonally adjusted, these prices rose by almost 2% month-on-month, the highest level since the beginning of 2022. As in other European countries, this could be linked to Taylor Swift's world tour. She gave five concerts in London in August, which probably pushed up airfares and hotel prices significantly.”
“This effect is likely to be partly reversed in September. Accordingly, service prices should have risen at a much slower pace, i.e. they should have returned to the trend in wage growth. This is also supported by the fact that only travel prices rose exceptionally strongly in August. Other components of services inflation, such as prices for recreation and culture, are more closely linked to wage growth and have risen at a much slower pace. In short, there is much to suggest that the brief upward blip in August will be smoothed out.”
“We believe that a more gradual pace of rate cuts is more likely, which should support the pound in the coming months. However, the risk of faster rate cuts is also rising in the UK, especially if inflation turns out to be significantly lower than expected. If we see this today, we could see a sharp correction in Sterling, although this is not our base case.”
- The recent sell-off in Crude Oil halts, but losses are still of more than 6% this week so far.
- Oil remains supported as markets see harsh rhetoric from Israel’s opposition party to bomb Iranian Oil fields.
- The US Dollar Index has pushed through strong resistance on its way to 104.00.
Crude Oil sees its sell-off stall on Wednesday on the back of harsh rhetoric from Israel’s opposition party. The comments were published in the Jerusalem Post on Tuesday and came from the Yest Atid Party head, Yair Lapid, who called for an immediate attack on Iranian Oil fields. Such an attack would defy the request from the US administration not to do so, contributing to the escalatory spiral between the two countries and increasing the potential of a wider conflict.
The US Dollar Index (DXY), which tracks the performance of the Greenback against six other currencies, advances to a fresh two-month high to levels not seen since August this year. The additional surge in the Greenback came after former US President Donald Trump interview on Bloomberg, in which he further outlined his economic plans if he were to become President again. Traders are placing more bets on the assumption Trump will win on November 5.
At the time of writing, Crude Oil (WTI) trades at $69.70 and Brent Crude at $73.66.
Oil news and market movers: Libya lifts its export schedule
- Libyan crude oil is expected to accelerate its production and export schedule for October to 27.52m bbl per month or 888k barrels per day, according to a loading program seen by Bloomberg News.
- Crude Oil prices are little changed in European trading on Wednesday amid uncertainty about the future of the Middle East conflict and the effects of output cuts being held in place by the Organization of the Petroleum Exporting Countries (OPEC) and allied producers until December, Reuters reports.
- The weekly Crude Oil Stockpile Change numbers from the American Petroleum Institute will be released at 20:30 GMT. Expectations are for a build of 2.3 million barrels, smaller than the 10.9 million build registered a week earlier.
Oil Technical Analysis: Fragile at $70.00
Crude Oil is trying to hold the $70.00 marker, but it will not be an easy task. With OPEC set to open up the Oil tap soon and supply remaining sluggish, not much upside potential is present. The geopolitical tensions seem to be abating a bit but remain high, not helping out either, so traders are looking for a steady fair value for Oil, which could be further down below $70.00.
There is a challenging path to recovery for Crude Oil. First, the pivotal level at $71.46, which was strong enough to catch the falling knife on Monday, must be regained again with a daily close above it. Once from there, the hefty technical level at $75.35, with the 100-day Simple Moving Average (SMA) and a few pivotal lines, is possibly the first big hurdle ahead.
On the downside, that previously mentioned $71.46 pivotal level has now turned into resistance and no longer has any value as support. Instead, traders need to look much lower, at $67.11, a level that supported the price in May-June 2023. In case that level breaks, the 2024 year-to-date low emerges at $64.75 followed by $64.38, the low of 2023.
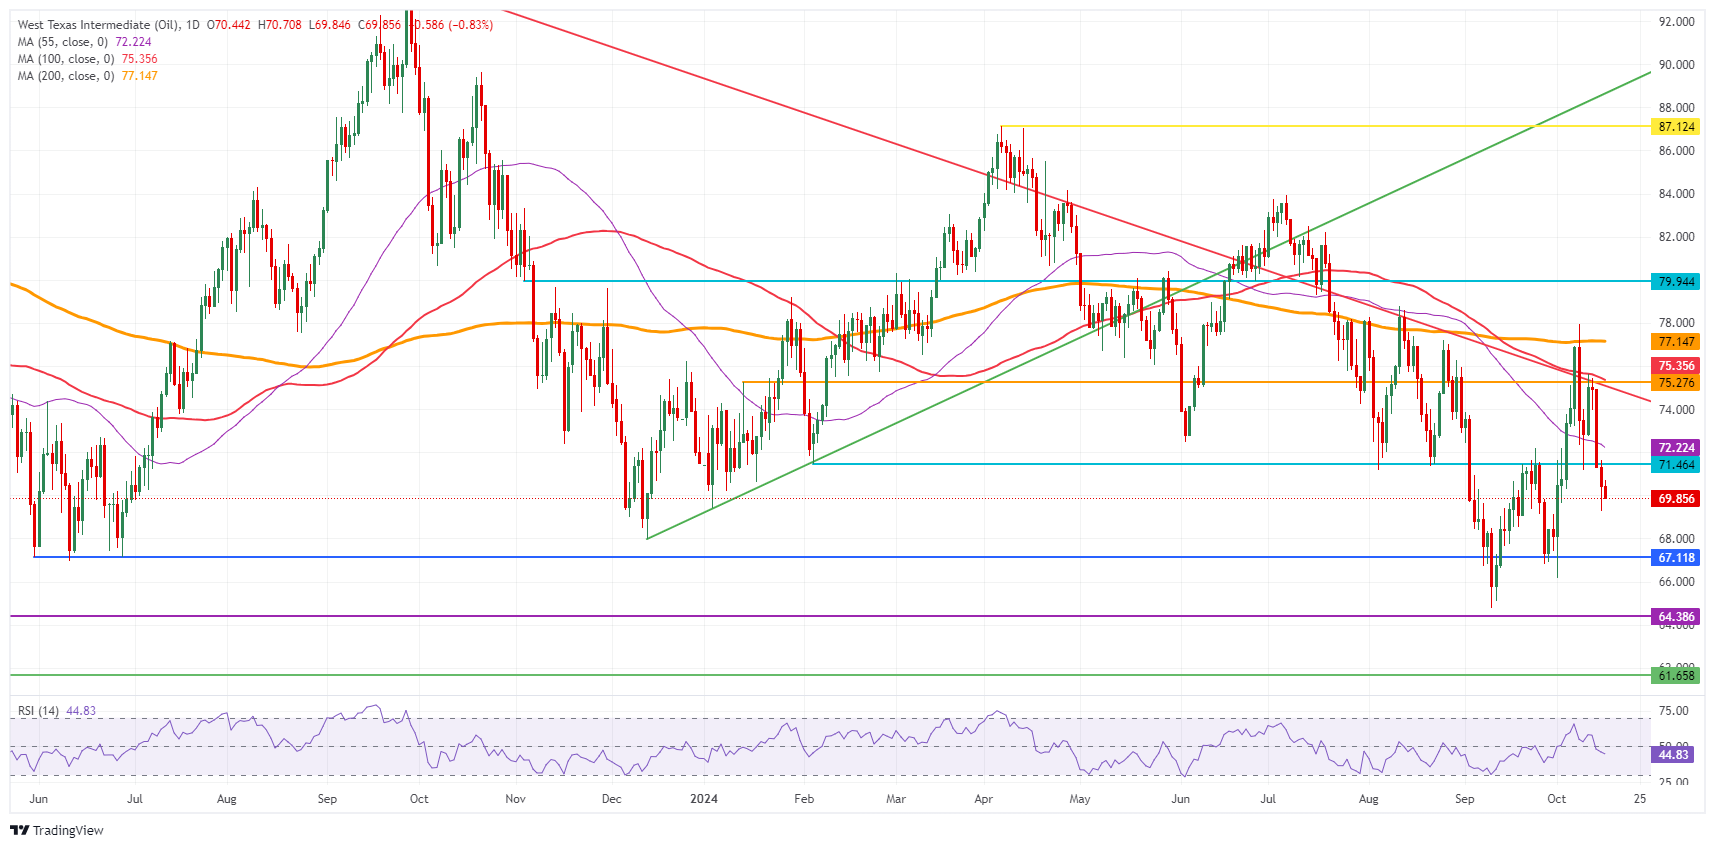
US WTI Crude Oil: Daily Chart
WTI Oil FAQs
WTI Oil is a type of Crude Oil sold on international markets. The WTI stands for West Texas Intermediate, one of three major types including Brent and Dubai Crude. WTI is also referred to as “light” and “sweet” because of its relatively low gravity and sulfur content respectively. It is considered a high quality Oil that is easily refined. It is sourced in the United States and distributed via the Cushing hub, which is considered “The Pipeline Crossroads of the World”. It is a benchmark for the Oil market and WTI price is frequently quoted in the media.
Like all assets, supply and demand are the key drivers of WTI Oil price. As such, global growth can be a driver of increased demand and vice versa for weak global growth. Political instability, wars, and sanctions can disrupt supply and impact prices. The decisions of OPEC, a group of major Oil-producing countries, is another key driver of price. The value of the US Dollar influences the price of WTI Crude Oil, since Oil is predominantly traded in US Dollars, thus a weaker US Dollar can make Oil more affordable and vice versa.
The weekly Oil inventory reports published by the American Petroleum Institute (API) and the Energy Information Agency (EIA) impact the price of WTI Oil. Changes in inventories reflect fluctuating supply and demand. If the data shows a drop in inventories it can indicate increased demand, pushing up Oil price. Higher inventories can reflect increased supply, pushing down prices. API’s report is published every Tuesday and EIA’s the day after. Their results are usually similar, falling within 1% of each other 75% of the time. The EIA data is considered more reliable, since it is a government agency.
OPEC (Organization of the Petroleum Exporting Countries) is a group of 12 Oil-producing nations who collectively decide production quotas for member countries at twice-yearly meetings. Their decisions often impact WTI Oil prices. When OPEC decides to lower quotas, it can tighten supply, pushing up Oil prices. When OPEC increases production, it has the opposite effect. OPEC+ refers to an expanded group that includes ten extra non-OPEC members, the most notable of which is Russia.
- AUD/USD falls below 0.6700 as the US Dollar performs strongly.
- The Fed is expected to cut interest rates gradually in the remainder of the year.
- Investors await the Aussie Employment data for September.
The AUD/USD pair extends its downside below the key support of 0.6700 in Wednesday’s European session. The Aussie asset weakens as the market sentiment remains risk-averse on expectations that US former President Donald Trump could win upcoming presidential elections. Trump’s victory could have a negative impact on risk-sensitive currencies as he favors a closed economy culture.
S&P 500 futures exhibit a subdued performance in European trading hours. The US Dollar Index (DXY), which tracks the Greenback’s value against six major currencies, rises further to near 103.40.
The Greenback posts a fresh two-month high as market participants expect that the Federal Reserve’s (Fed) policy-easing cycle will be gradual in the remainder year. According to the CME FedWatch tool, the Fed will cut interest rates by 50 basis points (bps) to 4.25%-4.50% by the year-end, suggesting that there will be two quarter-to-a-basis rate cuts, which will come in November and December.
Going forward, the next trigger for the US Dollar will be the monthly Retail Sales data for September, which will be published on Thursday. The Retail Sales data, a key measure of consumer spending, rose by 0.3%.
On the Aussie front, investors await the Employment data for September, which will be published on Thursday. The labor market data is expected to show that the Australian economy 25K new workers, lower than 47.5K in August. The Unemployment Rate is expected to remain steady at 4.2%. Sings of steady or stronger job growth would allow the Reserve Bank of Australia (RBA) to keep its Official Cash Rate (OCR) steady at 4.35%.
Australian Dollar FAQs
One of the most significant factors for the Australian Dollar (AUD) is the level of interest rates set by the Reserve Bank of Australia (RBA). Because Australia is a resource-rich country another key driver is the price of its biggest export, Iron Ore. The health of the Chinese economy, its largest trading partner, is a factor, as well as inflation in Australia, its growth rate and Trade Balance. Market sentiment – whether investors are taking on more risky assets (risk-on) or seeking safe-havens (risk-off) – is also a factor, with risk-on positive for AUD.
The Reserve Bank of Australia (RBA) influences the Australian Dollar (AUD) by setting the level of interest rates that Australian banks can lend to each other. This influences the level of interest rates in the economy as a whole. The main goal of the RBA is to maintain a stable inflation rate of 2-3% by adjusting interest rates up or down. Relatively high interest rates compared to other major central banks support the AUD, and the opposite for relatively low. The RBA can also use quantitative easing and tightening to influence credit conditions, with the former AUD-negative and the latter AUD-positive.
China is Australia’s largest trading partner so the health of the Chinese economy is a major influence on the value of the Australian Dollar (AUD). When the Chinese economy is doing well it purchases more raw materials, goods and services from Australia, lifting demand for the AUD, and pushing up its value. The opposite is the case when the Chinese economy is not growing as fast as expected. Positive or negative surprises in Chinese growth data, therefore, often have a direct impact on the Australian Dollar and its pairs.
Iron Ore is Australia’s largest export, accounting for $118 billion a year according to data from 2021, with China as its primary destination. The price of Iron Ore, therefore, can be a driver of the Australian Dollar. Generally, if the price of Iron Ore rises, AUD also goes up, as aggregate demand for the currency increases. The opposite is the case if the price of Iron Ore falls. Higher Iron Ore prices also tend to result in a greater likelihood of a positive Trade Balance for Australia, which is also positive of the AUD.
The Trade Balance, which is the difference between what a country earns from its exports versus what it pays for its imports, is another factor that can influence the value of the Australian Dollar. If Australia produces highly sought after exports, then its currency will gain in value purely from the surplus demand created from foreign buyers seeking to purchase its exports versus what it spends to purchase imports. Therefore, a positive net Trade Balance strengthens the AUD, with the opposite effect if the Trade Balance is negative.
- NZD/USD sees more downside as soft NZ inflation has prompted RBNZ dovish bets.
- The US Dollar refreshes a two-month high as the Fed is expected to cut interest rates gradually.
- NZD/USD declines below the 200-day EMA.
The NZD/USD pair finds some buying interest after posting a fresh almost two-month low near 0.6040 on Wednesday. The near-term outlook of the Kiwi pair remains vulnerable as the New Zealand (NZ) Q3 Consumer Price Index (CPI) decelerated expectedly.
Annualized CPI rose by 2.2%, as expected, slower than 3.3% in the similar quarter of the previous year. Quarter-on-quarter inflation grew at a slower pace of 0.6% from the estimates of 0.7%, However, the pace was higher than 0.4% in the second quarter of the year.
Soft inflation data has prompted expectations that the Reserve Bank of New Zealand (RBNZ) could cut its Official Cash Rate (OCR) with a larger-than-usual size of 50 basis points (bps) for the second time in a row.
Meanwhile, the US Dollar (USD) posts a fresh two-month high as traders have priced out expectations that the Federal Reserve (Fed) would continue with a sizeable interest rate cut in November. According to the CME FedWatch tool, the Fed will cut its key borrowing rates by 25 bps in each of the two meetings remaining this year.
NZD/USD weakens after breaking below the horizontal support plotted from September 11 low of 0.6100 on a daily timeframe. The overall trend of the Kiwi pair has become bearish as it has formed a lower swing low. The asset is also trading below the 200-day Exponential Moving Average (EMA), which trades around 0.6100.
The 14-day Relative Strength Index (RSI) slides below 40.00, suggesting that a bearish momentum has been triggered.
More downside is highly likely towards the psychological support of 0.6000 and the August 15 low of 0.5974.
On the flip side, a reversal move above October 8 high of 0.6146 will drive the asset towards the 50-day EMA at 0.6173 and October 4 high near 0.6220.
NZD/USD daily chart
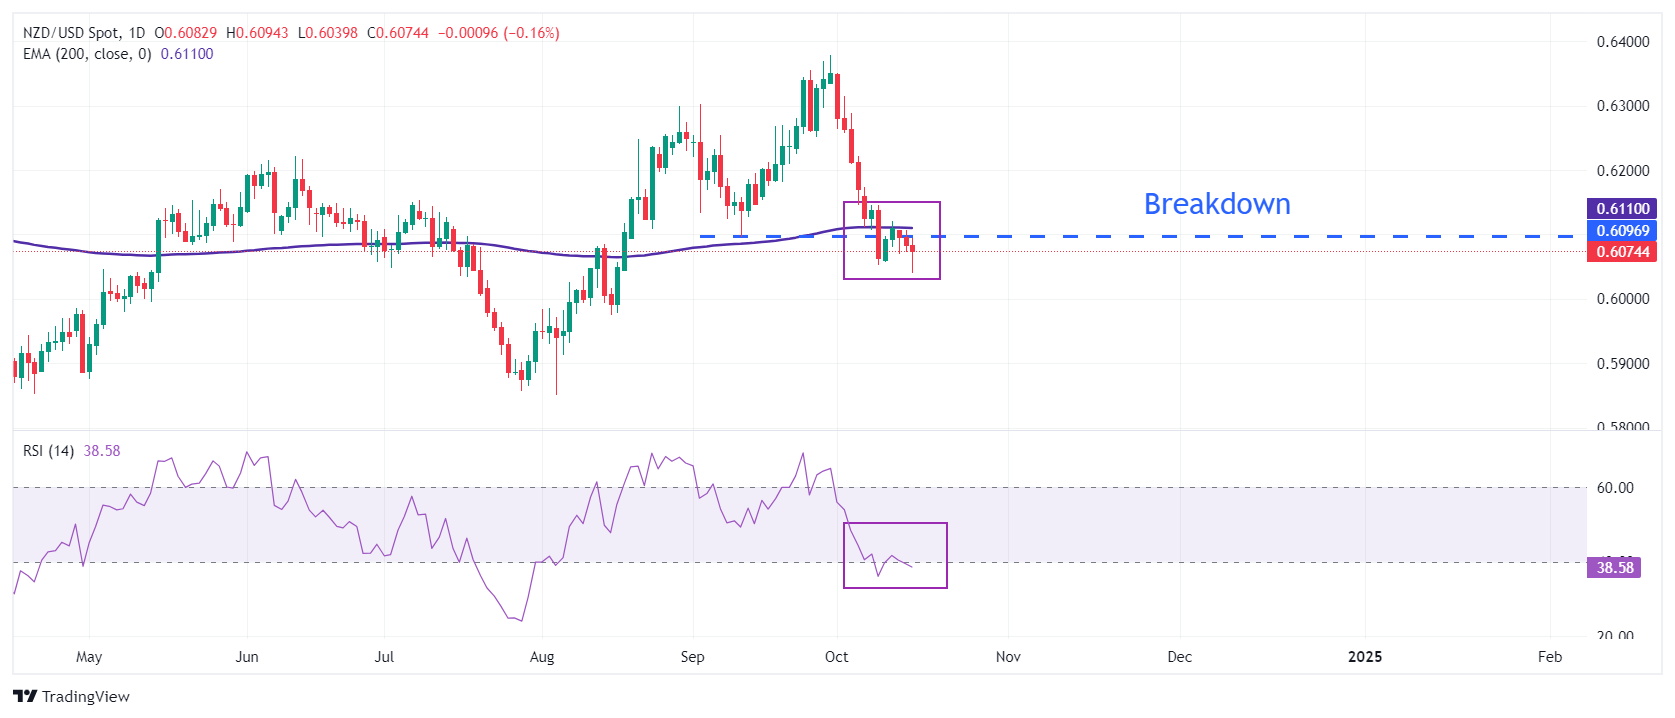
New Zealand Dollar FAQs
The New Zealand Dollar (NZD), also known as the Kiwi, is a well-known traded currency among investors. Its value is broadly determined by the health of the New Zealand economy and the country’s central bank policy. Still, there are some unique particularities that also can make NZD move. The performance of the Chinese economy tends to move the Kiwi because China is New Zealand’s biggest trading partner. Bad news for the Chinese economy likely means less New Zealand exports to the country, hitting the economy and thus its currency. Another factor moving NZD is dairy prices as the dairy industry is New Zealand’s main export. High dairy prices boost export income, contributing positively to the economy and thus to the NZD.
The Reserve Bank of New Zealand (RBNZ) aims to achieve and maintain an inflation rate between 1% and 3% over the medium term, with a focus to keep it near the 2% mid-point. To this end, the bank sets an appropriate level of interest rates. When inflation is too high, the RBNZ will increase interest rates to cool the economy, but the move will also make bond yields higher, increasing investors’ appeal to invest in the country and thus boosting NZD. On the contrary, lower interest rates tend to weaken NZD. The so-called rate differential, or how rates in New Zealand are or are expected to be compared to the ones set by the US Federal Reserve, can also play a key role in moving the NZD/USD pair.
Macroeconomic data releases in New Zealand are key to assess the state of the economy and can impact the New Zealand Dollar’s (NZD) valuation. A strong economy, based on high economic growth, low unemployment and high confidence is good for NZD. High economic growth attracts foreign investment and may encourage the Reserve Bank of New Zealand to increase interest rates, if this economic strength comes together with elevated inflation. Conversely, if economic data is weak, NZD is likely to depreciate.
The New Zealand Dollar (NZD) tends to strengthen during risk-on periods, or when investors perceive that broader market risks are low and are optimistic about growth. This tends to lead to a more favorable outlook for commodities and so-called ‘commodity currencies’ such as the Kiwi. Conversely, NZD tends to weaken at times of market turbulence or economic uncertainty as investors tend to sell higher-risk assets and flee to the more-stable safe havens.
Meanwhile, Brent crude oil prices fell a third day by 3.8% to $74.52 per barrel, its lowest level since October 2, DBS’ FX analyst Philip Wee notes.
Middle-eastern tensions turning point softens oil prices
“OPEC and the International Energy Agency lowered their forecasts for global oil demand in 2024, citing oversupply amid weak demand from China. Fears of a broader conflict in the Middle East eased after Israeli Prime Minister Benjamin Netanyahu assured US President Joe Biden that it would strike military and not target oil or nuclear sites in Iran.”
“On October 13, US Secretary of State Antony Blinken and Defense Secretary Lloyd Austin sent a signed warning letter to Israel to address, over the next 30 days, the significant drop in humanitarian aid into Gaza or risk a cut in arms sales.”
“Although the deadline comes after the US Presidential Elections on November 5, the new President will only take over the White House in January 2025.”
The New Zealand third-quarter CPI came in line with consensus that added pressure to the New Zealand Dollar (NZD) overnight, ING’s FX analyst Francesco Pesole notes.
CPI puts pressure on NZD
“In New Zealand, third-quarter CPI came in line with consensus: 2.2% YoY for headline and 4.9% YoY for non-tradable inflation.”
“That still added pressure to NZD overnight, as markets increased their dovish bets to -60bp for the 27 November Reserve Bank of New Zealand meeting.”
“Admittedly, a 50bp cut is looking more likely with non-tradable CPI back below 5.0%, but 75bp would probably require a dovish repricing in the Fed expectations too.”
- Gold rallies ever closer to its previous all-time high at $2,685.
- A decline in manufacturing activity in the state of New York triggered the latest bout of buying.
- A break above would signal a new all-time high and an extension of the dominant bull trend.
Gold (XAU/USD) extends its recovery into the lower $2,680s on Wednesday after market jitters caused by a dip in US Manufacturing data on Tuesday led to a decline in the US Dollar (USD), a fall in US Treasury yields and a downward revision to the expected path of US interest rates. Lower expected interest rates are bullish for Gold as they reduce the opportunity cost of holding the non-interest paying asset.
Gold rises after US Manufacturing data miss
Gold strengthens after the NY Empire State Manufacturing Index declined into negative territory in October, registering minus 11.4 following an 11.5 rise in September and undershooting expectations of 2.3. This took the index to its lowest level in five months after August’s brief-lived recovery.
That said, the upside for Gold may be limited as Federal Reserve (Fed) officials refrain from adopting a too dovish stance judging from recent commentary. On Tuesday, Bank of San Francisco Fed President Mary Daly said she saw one or two more rate cuts this year, “If forecasts are met.” Her speech scored a neutral 5.8 on the FXStreet FedTracker, which uses a custom AI to gauge the tone of Fed officials’ speeches on a dovish-to-hawkish scale from 0 to 10. This was above her long-running average of 4.5.
Federal Reserve Bank of Atlanta President Raphael Bostic, meanwhile, scored a 6.2 on the FedTracker, which was also above his average of 5.1. Bostic opined the “US economy is doing well,” and that he did not see a recession on the horizon.
Currently, markets are pricing in almost a 94% chance of a 25 basis point cut in the fed funds rate in November and a 6% probability of no-change at all, according to the CME FedWatch tool.
Gold market movers on the calendar
Investors now look ahead to US September’s Retail Sales data on Thursday and a speech from Fed Governor Waller on Friday for further guidance.
Elsewhere, elevated tensions in the Middle East could help sustain upward momentum for Gold, particularly amid heightened expectations Israel will launch an imminent retaliatory attack on Iran.
Technical Analysis: Gold closes in all-time high
Gold extends another leg higher as it recovers from the October 10 low following the conclusion of a three-wave (abc) counter-trend reaction.
XAU/USD 4-hour Chart
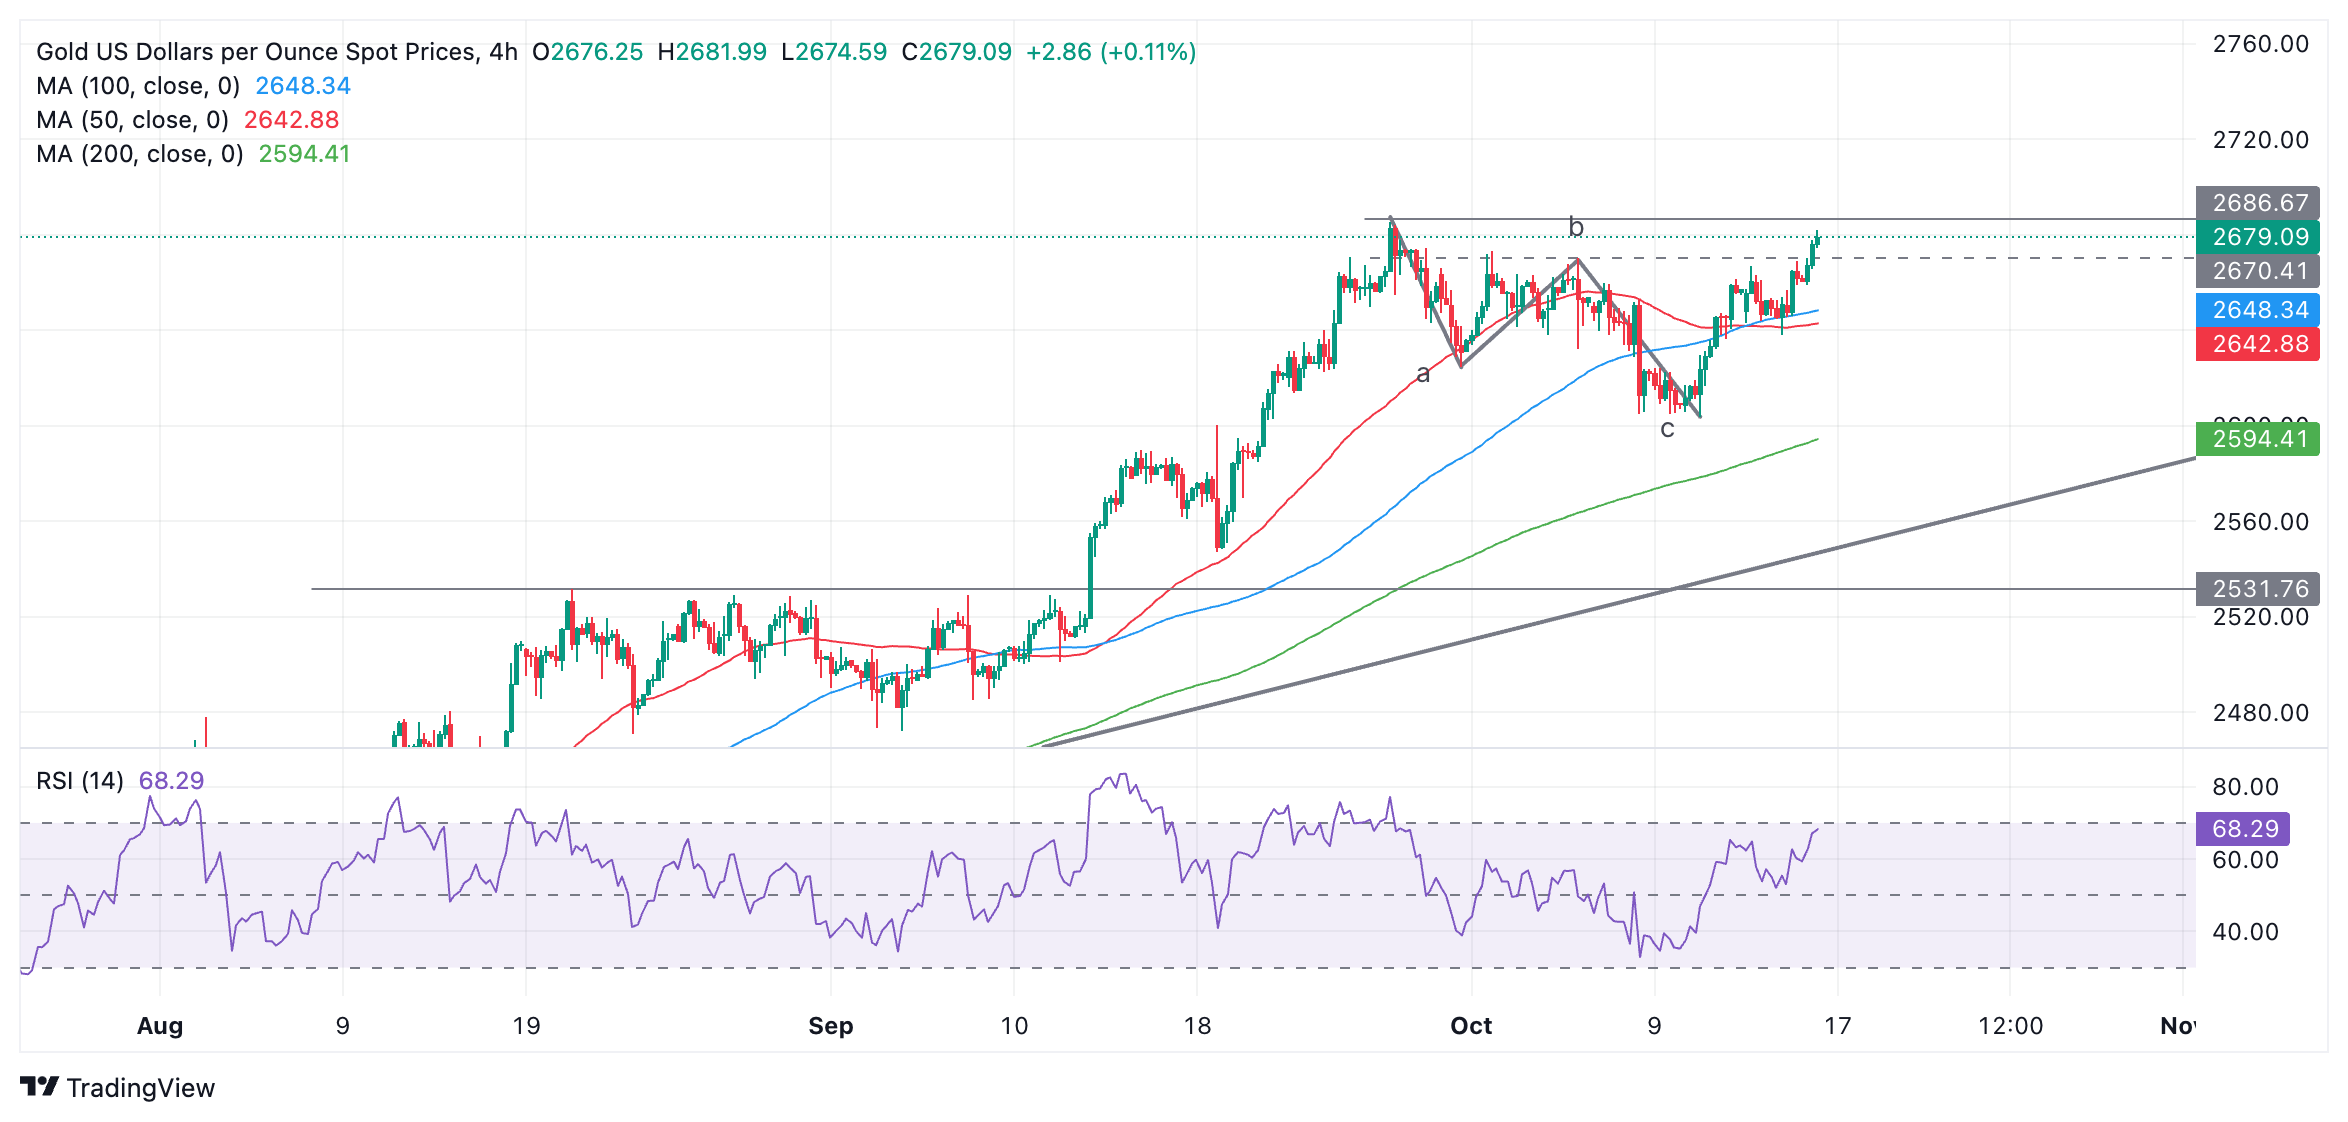
Gold has broken above key resistance at around $2,670, and it is closing in on the $2,685 all-time high. A break above that level would indicate a continuation to the next target at $2,700 – a round number and psychological level.
Gold is in an uptrend on a short, medium, and long-term basis, and given the theory that “the trend is your friend,” the odds continue to favor more upside.
It would require a break below $2,600 (low of wave c on the chart) to flip the uptrend and turn the short and medium-term outlooks bearish.
Gold FAQs
Gold has played a key role in human’s history as it has been widely used as a store of value and medium of exchange. Currently, apart from its shine and usage for jewelry, the precious metal is widely seen as a safe-haven asset, meaning that it is considered a good investment during turbulent times. Gold is also widely seen as a hedge against inflation and against depreciating currencies as it doesn’t rely on any specific issuer or government.
Central banks are the biggest Gold holders. In their aim to support their currencies in turbulent times, central banks tend to diversify their reserves and buy Gold to improve the perceived strength of the economy and the currency. High Gold reserves can be a source of trust for a country’s solvency. Central banks added 1,136 tonnes of Gold worth around $70 billion to their reserves in 2022, according to data from the World Gold Council. This is the highest yearly purchase since records began. Central banks from emerging economies such as China, India and Turkey are quickly increasing their Gold reserves.
Gold has an inverse correlation with the US Dollar and US Treasuries, which are both major reserve and safe-haven assets. When the Dollar depreciates, Gold tends to rise, enabling investors and central banks to diversify their assets in turbulent times. Gold is also inversely correlated with risk assets. A rally in the stock market tends to weaken Gold price, while sell-offs in riskier markets tend to favor the precious metal.
The price can move due to a wide range of factors. Geopolitical instability or fears of a deep recession can quickly make Gold price escalate due to its safe-haven status. As a yield-less asset, Gold tends to rise with lower interest rates, while higher cost of money usually weighs down on the yellow metal. Still, most moves depend on how the US Dollar (USD) behaves as the asset is priced in dollars (XAU/USD). A strong Dollar tends to keep the price of Gold controlled, whereas a weaker Dollar is likely to push Gold prices up.
The Dollar Index (DXY) failed thrice over the past two days to trade above the significant resistance of around 103.30, DBS’ FX analyst Philip Wee notes.
DXY fails to break above 103.30
“The Greenback was caught between two forces. On the one hand, the greenback reprised its haven role from a sell-off in semiconductor counters that pummeled the major US stock indices from record highs. On the other hand, the dollar’s haven appeal was offset by US bond yields accompanying the decline in equities.”
“The US Treasury 10Y yield tumbled to 4.03% after it held a 4.06-4.12% range in the previous two sessions. San Francisco Fed President Mary Daly played down the recent better-than-expected US nonfarm payrolls and CPI inflation data.”
“As the Fed’s renowned labour economist, Daly believed the US job market was no longer a major source of inflation pressures, adding that firms found it difficult to pass on price increases. Despite last month’s 50 bps cut, interest rates were still restrictive and a long way from neutral, working to lower inflation to its 2% target.”
- EUR/USD stays below 1.0900 as the ECB is expected to cut its borrowing rates by 25 bps on Thursday.
- Increasing speculation for Donald Trump’s victory in the US presidential elections has dampened the Eurozone’s economic outlook.
- Fed’s Waller advised a gradual reduction of interest rates over the next year.
EUR/USD falls further to near 1.0880 in Wednesday’s European session. The major currency pair weakens as the Euro (EUR) underperforms on expectations that the European Central Bank (ECB) will cut interest rates again on Thursday.
The ECB is widely anticipated to reduce its Rate on Deposit Facility by 25 basis points (bps) to 3.25%. This would be the second straight interest rate cut by the ECB in a row. With strong confidence that the ECB will cut interest rates tomorrow, investors will pay close attention to the monetary policy statement and ECB President Christine Lagarde’s press conference to get fresh cues on the interest rate outlook.
The comments from Lagarde are expected to be dovish as price pressures in the Eurozone appear to be under control, and fears of an economic slowdown have grown significantly. According to the preliminary estimates, the Eurozone Harmonized Index of Consumer Prices (HICP) decelerated to 1.8% in September. Meanwhile, the second estimate for the monthly Consumer Price Index (CPI) (EU Norm) in France and Italy has shown that price pressures were slower than preliminary expectations.
Growing speculation about former US President Donald Trump winning the United States (US) presidential elections has also raised concerns over the European Union’s (EU) export outlook. Trump's victory is expected to result in tariff hikes on automotive imports to the US, which could dent exports from the old continent and lead to more weakness in economic growth.
Daily digest market movers: EUR/USD remains under pressure as US Dollar rises further
- EUR/USD faces pressure due to the US Dollar’s outperformance in the past few weeks. The US Dollar Index (DXY), which tracks the Greenback’s value against six major currencies, extends its upside to near 103.40. The Greenback strengthens as traders see the US Federal Reserve (Fed) gradually reducing interest rates in the remainder of the year.
- The Fed is expected to shift to a ‘moderate’ policy-easing stance from ‘aggressive’ as fears of an economic slowdown have waned after Nonfarm Payrolls (NFP) and the US Services Purchasing Managers Index (PMI) grew strongly, with price pressures rising faster than expected in September.
- According to the CME FedWatch tool, traders are confident that the central bank will cut interest rates by 25 bps in November and December.
- On the contrary, Fed Governor Christopher Waller cautioned over interest rate cuts this week in a speech at Stanford University, citing that "Whatever happens in the near term, my baseline still calls for reducing the policy rate gradually over the next year," Reuters reported. When asked about the current status of the job market, Waller said, “The labor market remains healthy, even as labor demand is moderating.”
- Going forward, the next trigger for the US Dollar will be the monthly Retail Sales data for September, which will be published on Thursday. Economists expect the Retail Sales data to have grown by 0.3% after rising 0.1% in August.
Technical Analysis: EUR/USD trades close to 200-day EMA
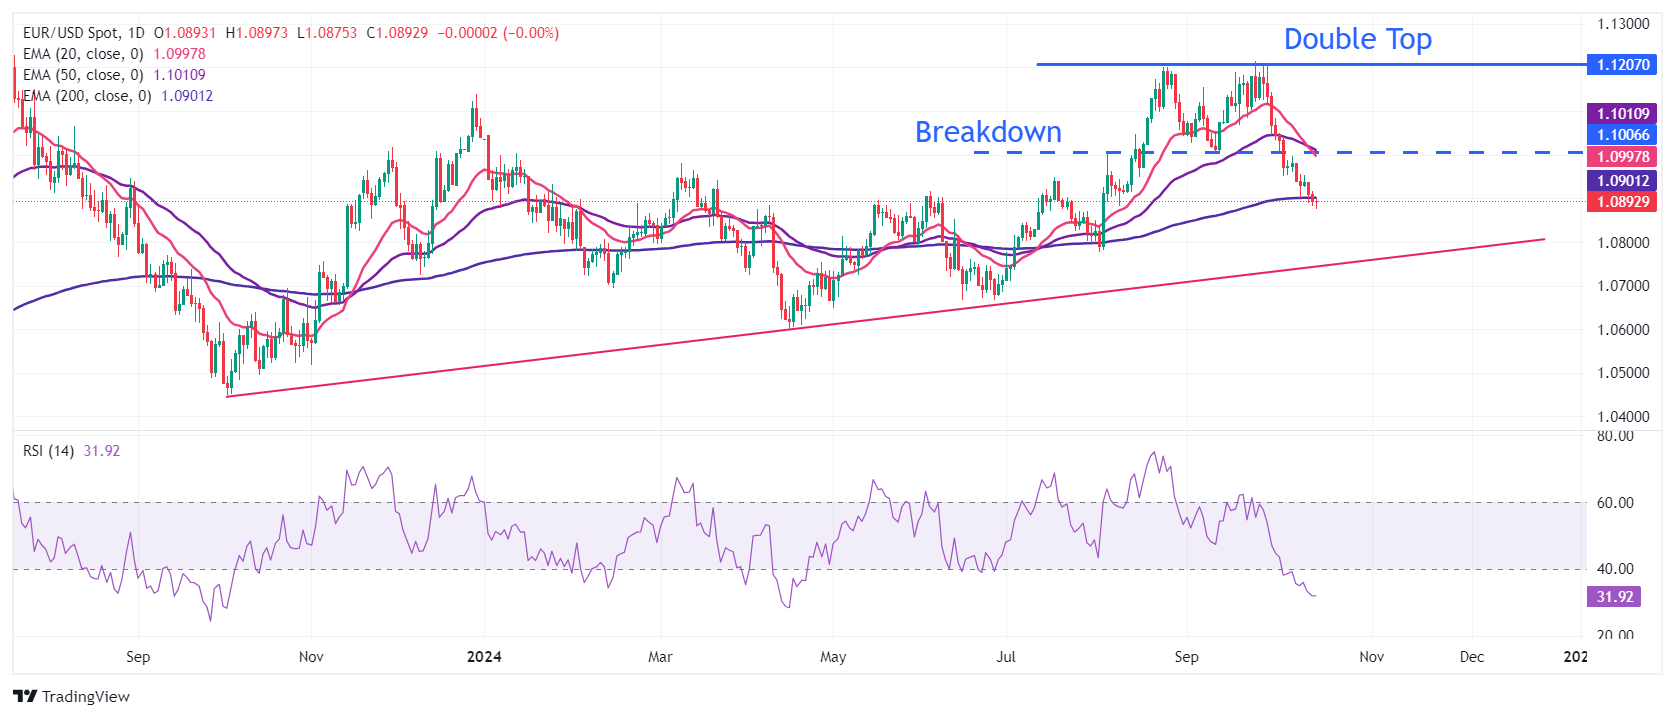
EUR/USD trades cautiously below the key resistance of 1.0900 in the European trading hours. The major currency pair weakened after a breakdown of the Double Top formation on a daily timeframe on October 4, which resulted in a bearish reversal.
The shared currency pair wobbles near the 200-day Exponential Moving Average (EMA) around 1.0900. A bear cross, represented by the 20- and 50-day EMAs near 1.1020, suggests more weakness ahead.
The 14-day Relative Strength Index (RSI) dives to near 30.00, indicating a strong bearish momentum.
On the downside, the major could find support near the upward-sloping trendline at 1.0750, which is plotted from the October 3 low around 1.0450. Meanwhile, the psychological figure of 1.1000 will be the key resistance for the pair.
Euro FAQs
The Euro is the currency for the 19 European Union countries that belong to the Eurozone. It is the second most heavily traded currency in the world behind the US Dollar. In 2022, it accounted for 31% of all foreign exchange transactions, with an average daily turnover of over $2.2 trillion a day. EUR/USD is the most heavily traded currency pair in the world, accounting for an estimated 30% off all transactions, followed by EUR/JPY (4%), EUR/GBP (3%) and EUR/AUD (2%).
The European Central Bank (ECB) in Frankfurt, Germany, is the reserve bank for the Eurozone. The ECB sets interest rates and manages monetary policy. The ECB’s primary mandate is to maintain price stability, which means either controlling inflation or stimulating growth. Its primary tool is the raising or lowering of interest rates. Relatively high interest rates – or the expectation of higher rates – will usually benefit the Euro and vice versa. The ECB Governing Council makes monetary policy decisions at meetings held eight times a year. Decisions are made by heads of the Eurozone national banks and six permanent members, including the President of the ECB, Christine Lagarde.
Eurozone inflation data, measured by the Harmonized Index of Consumer Prices (HICP), is an important econometric for the Euro. If inflation rises more than expected, especially if above the ECB’s 2% target, it obliges the ECB to raise interest rates to bring it back under control. Relatively high interest rates compared to its counterparts will usually benefit the Euro, as it makes the region more attractive as a place for global investors to park their money.
Data releases gauge the health of the economy and can impact on the Euro. Indicators such as GDP, Manufacturing and Services PMIs, employment, and consumer sentiment surveys can all influence the direction of the single currency. A strong economy is good for the Euro. Not only does it attract more foreign investment but it may encourage the ECB to put up interest rates, which will directly strengthen the Euro. Otherwise, if economic data is weak, the Euro is likely to fall. Economic data for the four largest economies in the euro area (Germany, France, Italy and Spain) are especially significant, as they account for 75% of the Eurozone’s economy.
Another significant data release for the Euro is the Trade Balance. This indicator measures the difference between what a country earns from its exports and what it spends on imports over a given period. If a country produces highly sought after exports then its currency will gain in value purely from the extra demand created from foreign buyers seeking to purchase these goods. Therefore, a positive net Trade Balance strengthens a currency and vice versa for a negative balance.
Canadian headline inflation slowed to 1.6%. The jobs market strengthened in September, expect CAD outperformance next week around the Bank of Canada rate announcement, ING’s FX analyst Francesco Pesole notes.
BoC to announce a new rate policy next week
“Elsewhere in G10, Canadian headline inflation slowed to 1.6% yesterday (consensus 1.8%), which prompted markets to price an even higher chance (77%) of a 50bp Bank of Canada cut next week. We remain in the 25bp camp though.”
“The jobs market strengthened in September and the core measures did not decline further and remain above 2.0%. We expect CAD outperformance next week around the Bank of Canada rate announcement.”
USD strength is likely to continue; the levels to monitor are 7.1480 and 7.1600. In the longer run, strong and sudden surge suggests further USD strength to 7.1600, potentially 7.1900, UOB Group’s FX analysts Quek Ser Leang and Peter Chia note.
Levels to monitor are 7.1480 and 7.1600
24-HOUR VIEW: “When USD was trading at 7.0930 yesterday, we indicated that ‘while USD is likely to rise today, the major resistance at 7.1200 is still unlikely to come under threat.’ We did not anticipate USD to rally sharply, as it soared to a high of 7.1430. USD closed on a strong note at 7.1363 (+0.59%). Today, we continue to expect USD strength, even though overbought conditions suggest the upside potential could be limited, and advance is likely to be at a more gradual pace. The levels to monitor are 7.1480 and 7.1600. On the downside, any pullback is likely to remain above 7.1100 with minor support at 7.1200.”
1-3 WEEKS VIEW: “Our latest narrative was from last Wednesday (09 Oct, spot at 7.0750), wherein ‘the current price movements are likely part of a range trading phase’ and ‘for the time being, USD is expected to trade between 7.0300 and 7.1200.’ After USD rose to 7.1000 two days ago, we highlighted that ‘there has been an increase in momentum, but not enough to suggest the start of a sustained advance.’ We added, ‘USD must break and remain above 7.1200 before a sustained advance is likely.’ We did not expect the sudden and strong surge that sent USD to a high of 7.1430. The price action indicates further USD strength to 7.1600, potentially 7.1900. To keep the momentum going, USD must not break below the ‘strong support’ level, now at 7.0900.”
EUR/USD depreciated 0.2% to 1.0893 overnight before tomorrow’s European Central Bank meeting, DBS’ FX analyst Philip Wee notes.
EUR priced in ECB rate cut
Following the drop in the Eurozone’s CPI inflation to 1.8% YoY in September, the ECB will likely lower the deposit facility rate by 25 bps to 3.25%. However, this month’s short EUR/USD strategy risks running into a classic ‘buy the rumour, sell the fact’ scenario.
“This month’s 2.2% depreciation has exceeded all monthly losses this year. Since November 2023, the 100-week moving average (currently around 1.0825) has significantly supported the EUR. Assuming this back-to-back cut materialises, the ECB may not pivot for another cut in December amid expectations for two Fed cuts in November and December.”
“Eurozone’s core inflation, at 2.7% YoY in September, remained above the ECB’s 2% target. Economic pessimism also eased after the ZEW survey expectations improved to a six-month high of 20.1 in October, following three months of declines.”
The US Dollar (USD) is likely to trade in a 148.55/149.60 range. In the longer run, there has been no further increase in momentum; a breach of 148.40 would indicate that USD is not rising further, UOB Group’s FX analysts Quek Ser Leang and Peter Chia note.
USD has a chance to break below 148.40
24-HOUR VIEW: “Two days ago, USD rose to 149.98. Yesterday, we indicated that ‘despite the advance, there has been no significant increase in momentum.’ We also indicated that ‘instead of continuing to advance, USD is more likely to trade in a range, probably between 149.00 and 149.95.’ USD then traded in a range of 148.84/149.83, closing at 149.19 (-0.37%). While further range trading appears likely today, the slightly softened underlying tone suggests a lower range of 148.55/149.60.”
1-3 WEEKS VIEW: “We have been expecting a higher USD since early this month. In our most recent narrative from last Thursday (10 Oct, spot at 149.20), we highlighted that “although upward momentum has not increased much, further USD strength seems likely, and the levels to watch are at 150.05 and 151.00.” USD rose to 149.98 two days ago before easing off. There has been no further increase in momentum, and a breach of 148.40 (no change in ‘strong support’ level) would indicate that USD is not rising further.”
Yesterday's final inflation numbers confirmed an increase in inflation in Poland from 4.3% to 4.9%, ING’s FX analyst Frantisek Taborsky notes.
CEE FX appreciates the current calm
“Official core inflation numbers for September will follow today. We also expect a rise here from 3.7% to 4.3% YoY. In the Czech Republic, PPI numbers will be released, one of the last key numbers before the November Czech National Bank meeting.”
“The markets saw another dose of reassurance yesterday, supporting the entire emerging market space in a recovery. Central and Eastern Europe (CEE) FX appreciated the calm, especially in the Czech Republic and Hungary, however rates markets rallied across the region. Signs of calm or at least avoidance of further escalation in the Middle East benefit the EM space and sets the stage for further gains within the region.”
“Although the calendar doesn't have much to offer today, yesterday's turn in the global story should be supportive today as well. Like yesterday, the CZK is our currency of choice for current conditions.”
The New Zealand Dollar (NZD) is likely to decline further; the major support at 0.6005 is likely out of reach (there is another support at 0.6030). In the longer run, NZD is likely to decline further; the level to watch is 0.6005, UOB Group’s FX analysts Quek Ser Leang and Peter Chia note.
NZD is likely to decline further
24-HOUR VIEW: “Yesterday, we expected NZD to consolidate in a range of 0.6070/0.6110. NZD then traded between 0.6074 and 0.6105, closing at 0.6083 (-0.23%). In early Asian trade today, NZD plummeted, and given the sharp increase in momentum, it is likely to decline further. That said, the major support at 0.6005 is likely out of reach (there is another support at 0.6030). Resistance levels are at 0.6080 and 0.6095.”
1-3 WEEKS VIEW: “We turned negative in NZD two weeks ago. As we tracked the subsequent decline, in our most recent narrative from last Thursday (10 Oct, spot at 0.6070), we highlighted, while the oversold weakness has not stabilised, NZD ‘must break and remain below 0.6050 before further sustained decline is likely.’ We added, ‘the probability of NZD breaking clearly below 0.6050 will remain intact as long as 0.6145 (‘strong resistance’ level) is not breached.’ At the time of writing in early Asian session today, NZD fell sharply. While the 0.6050 has not been clearly breached yet, the sharp increase in short-term momentum suggests NZD is likely to decline further. The level to watch is at 0.6005. On the upside, the ‘strong resistance’ level has moved lower to 0.6115 from 0.6145.”
The Pound Sterling (GBP) is trading almost half a percent lower this morning after the September CPI report showed the closely-monitored services inflation falling more than expected from 5.6% to 4.9%, ING’s FX analyst Francesco Pesole notes.
Dovish data paves the way for rate cuts
“The data is unequivocally dovish for the Bank of England and paves the way for rate cuts at the two remaining meetings this year (November and December). We think that has incidentally opened the door for a period of underperformance by sterling. Market pricing for BoE easing is adjusting as we write but currently shows a 25bp priced in for November.”
“Given the comments by Governor Andrew Bailey earlier this month suggesting the BoE could increase the pace of easing, markets may be tempted to price in some chance of a 50bp rate cut in November now that services inflation has fallen 5.0%.
“Ultimately, the chances of the BoE delivering a 50bp cut are probably low, but the greater flexibility of pricing to the dovish end in the Sonia curve – paired with some positioning ahead of the UK Budget and the US election – can result in GBP/USD trading well below 1.30. The euro's softish momentum means EUR/GBP probably doesn’t look as appealing as Cable to play sterling’s weakened momentum, but a return above 0.840 now seems appropriate in the near term.”
Silver prices (XAG/USD) rose on Wednesday, according to FXStreet data. Silver trades at $31.86 per troy ounce, up 1.14% from the $31.51 it cost on Tuesday.
Silver prices have increased by 33.91% since the beginning of the year.
| Unit measure | Silver Price Today in USD |
|---|---|
| Troy Ounce | 31.86 |
| 1 Gram | 1.02 |
The Gold/Silver ratio, which shows the number of ounces of Silver needed to equal the value of one ounce of Gold, stood at 84.07 on Wednesday, down from 84.51 on Tuesday.
Silver FAQs
Silver is a precious metal highly traded among investors. It has been historically used as a store of value and a medium of exchange. Although less popular than Gold, traders may turn to Silver to diversify their investment portfolio, for its intrinsic value or as a potential hedge during high-inflation periods. Investors can buy physical Silver, in coins or in bars, or trade it through vehicles such as Exchange Traded Funds, which track its price on international markets.
Silver prices can move due to a wide range of factors. Geopolitical instability or fears of a deep recession can make Silver price escalate due to its safe-haven status, although to a lesser extent than Gold's. As a yieldless asset, Silver tends to rise with lower interest rates. Its moves also depend on how the US Dollar (USD) behaves as the asset is priced in dollars (XAG/USD). A strong Dollar tends to keep the price of Silver at bay, whereas a weaker Dollar is likely to propel prices up. Other factors such as investment demand, mining supply – Silver is much more abundant than Gold – and recycling rates can also affect prices.
Silver is widely used in industry, particularly in sectors such as electronics or solar energy, as it has one of the highest electric conductivity of all metals – more than Copper and Gold. A surge in demand can increase prices, while a decline tends to lower them. Dynamics in the US, Chinese and Indian economies can also contribute to price swings: for the US and particularly China, their big industrial sectors use Silver in various processes; in India, consumers’ demand for the precious metal for jewellery also plays a key role in setting prices.
Silver prices tend to follow Gold's moves. When Gold prices rise, Silver typically follows suit, as their status as safe-haven assets is similar. The Gold/Silver ratio, which shows the number of ounces of Silver needed to equal the value of one ounce of Gold, may help to determine the relative valuation between both metals. Some investors may consider a high ratio as an indicator that Silver is undervalued, or Gold is overvalued. On the contrary, a low ratio might suggest that Gold is undervalued relative to Silver.
(An automation tool was used in creating this post.)
The Australian Dollar (AUD) could decline further to 0.6650; the major support at 0.6620 is likely out of reach. In the longer run, rapid increase in momentum is likely to lead to further AUD weakness; the levels to monitor are 0.6650 and 0.6620, UOB Group’s FX analysts Quek Ser Leang and Peter Chia note.
Levels to monitor are 0.6650 and 0.6620
24-HOUR VIEW: “We indicated yesterday that AUD ‘could retest the 0.6700 level before another rebound is likely.’ AUD subsequently dropped to 0.6698 but did not rebound. AUD closed at 0.6703 in NY trade (-0.34%) but dropped sharply in early Asian session today. Downward momentum is increasing rapidly, and AUD could continue to decline to 0.6650. The major support at 0.6620 is likely of reach today. To keep the momentum going, AUD must remain below 0.6715 (minor resistance is at 0.6700).”
1-3 WEEKS VIEW: “In our most recent narrative from last Thursday (10 Oct, spot at 0.6720), we indicated that ‘while there has been no significant increase in momentum, the bias for AUD remains on the downside.’ Yesterday, AUD dropped to a low of 0.6698. Today, it fell clearly below 0.6700. The price action has resulted in a rapid increase in momentum, and this is likely to lead to further AUD weakness. The levels to monitor are 0.6650 and 0.6620. On the upside, should AUD break above 0.6740 (‘strong resistance’ level previously at 0.6785), it would mean that the AUD weakness that started early this month has stabilised.”
- The USD/CAD pair tests the lower boundary of the ascending channel at 1.3790 level.
- The 14-day RSI remains close to the 70 mark, indicating overbought conditions and forthcoming downward correction.
- The pair could target the upper boundary around the 1.3870 level if it remains within the ascending channel.
The USD/CAD pair recovers from recent losses and trades around 1.3790 during European hours on Wednesday. On the daily chart, the analysis shows that the pair is testing the lower boundary of an ascending channel, which, if remains within the channel, supports the bullish trend.
The 14-day Relative Strength Index (RSI) is slightly below 70 level, confirming the ongoing bullish sentiment is in play. However, a move above the 70 mark would suggest overbought conditions and signal a potential downward correction.
On the upside, if USD/CAD remains within the ascending channel, it could explore the region around the upper boundary around 1.3870. A break above this level could strengthen bullish momentum, potentially driving the pair toward 1.3946, its highest point since October 2022.
In terms of the support, a decisive break below the lower boundary of the ascending channel at the 1.3790 level, could weaken bullish sentiment, pushing the USD/CAD pair to target its nine-day Exponential Moving Average (EMA) at 1.3718.
Further support is found at the former resistance, now acting as support, around 1.3620, with the key psychological level of 1.3600 just below.
USD/CAD: Daily Chart
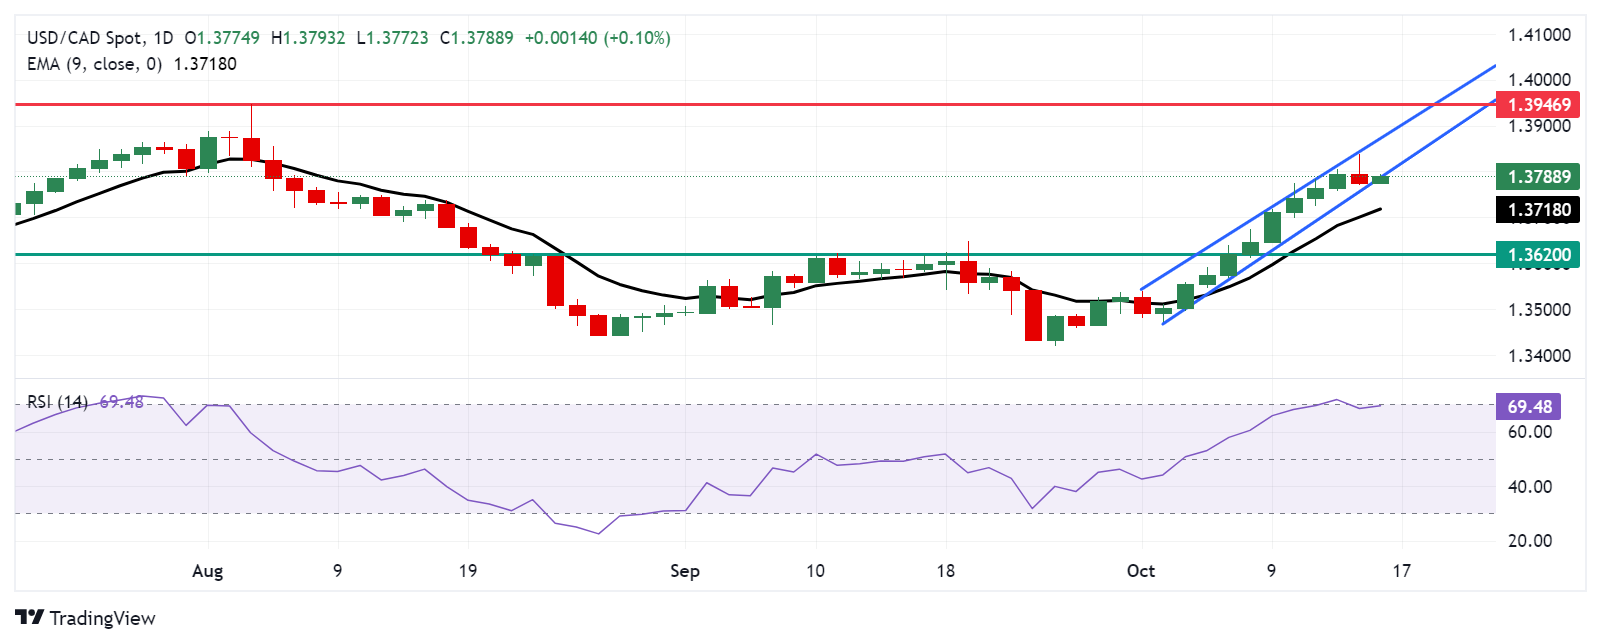
Canadian Dollar PRICE Today
The table below shows the percentage change of Canadian Dollar (CAD) against listed major currencies today. Canadian Dollar was the weakest against the Swiss Franc.
| USD | EUR | GBP | JPY | CAD | AUD | NZD | CHF | |
|---|---|---|---|---|---|---|---|---|
| USD | -0.00% | 0.46% | 0.12% | 0.08% | 0.18% | 0.16% | -0.06% | |
| EUR | 0.00% | 0.47% | 0.13% | 0.10% | 0.20% | 0.19% | -0.10% | |
| GBP | -0.46% | -0.47% | -0.37% | -0.35% | -0.27% | -0.27% | -0.50% | |
| JPY | -0.12% | -0.13% | 0.37% | -0.02% | 0.06% | 0.05% | -0.15% | |
| CAD | -0.08% | -0.10% | 0.35% | 0.02% | 0.09% | 0.08% | -0.15% | |
| AUD | -0.18% | -0.20% | 0.27% | -0.06% | -0.09% | -0.01% | -0.24% | |
| NZD | -0.16% | -0.19% | 0.27% | -0.05% | -0.08% | 0.00% | -0.23% | |
| CHF | 0.06% | 0.10% | 0.50% | 0.15% | 0.15% | 0.24% | 0.23% |
The heat map shows percentage changes of major currencies against each other. The base currency is picked from the left column, while the quote currency is picked from the top row. For example, if you pick the Canadian Dollar from the left column and move along the horizontal line to the US Dollar, the percentage change displayed in the box will represent CAD (base)/USD (quote).
The euro received some unusually positive news on the activity side yesterday, as the ZEW surveys came in slightly stronger than expected in Germany (13 vs 10) while rebounding quite markedly (from nine to 20) in the eurozone-wide index, ING’s FX analyst Francesco Pesole notes.
EUR to stabilize around 1.09 for now
“Those are all soft indicators that the ECB itself has often disregarded, but might contribute to a sense that the negative growth narrative has bottomed out, ultimately curbing dovish expectations.”
“EUR/USD is predominantly driven by external factors. The substantial drop in oil prices has narrowed the scope for a further drop based on market factors, but we continue to suspect that pre-US election positioning should favour a weaker EUR/USD.”
“Tomorrow’s ECB meeting may prove to have only a marginal impact on markets. Our baseline is for stabilisation around 1.09 for now, but – as mentioned – the balance of risks is tilted to the downside heading into 5 November.”
There has been no further increase in momentum; a breach of 1.3125 would suggest that 1.3000 is out of reach, UOB Group’s FX analysts Quek Ser Leang and Peter Chia note.
GBP can break above of 1.3125
24-HOUR VIEW: “Yesterday, we expected GBP to trade in a sideways range of 1.3035/1.3085. GBP subsequently dipped to 1.3038, rebounded to 1.3103 before closing slightly higher at 1.3074 (+0.10%). There has been no increase in either downward or upward momentum, and we continue to expect GBP to trade sideways. Expected range for today: 1.3040/1.3105.”
1-3 WEEKS VIEW: “We have held a negative GBP view for two weeks now (see annotations in the chart below). After GBP fell to 1.3011 and rebounded, we highlighted last Friday (11 Oct, spot at 1.3060) that ‘despite the decline, there has been no further increase in downward momentum’. We added, only a breach of 1.3125 (‘strong resistance’ level) would suggest that 1.3000 is out of reach this time around. GPB traded sideways over the past few days, and we continue to hold the same view for now.”
The sharp drop in oil prices has been the biggest market story this week. Yesterday, the Israeli prime minister said the country is considering US concerns when planning a retaliatory attack on Iran. That broadly endorsed reports that Israel should target military infrastructures but not Iran’s oil and nuclear facilities. The soft growth story and some disappointment about the recent stimulus announcement in China are contributing to oil’s underperformance, ING's FX analyst Francesco Pesole notes.
Upcoming retail sales may print respectable numbers
“There is probably a case for oil prices to stabilise now that most Middle-East-related gains have been trimmed, and considering some lingering uncertainty about Israel’s retaliation. Another leg lower in the dollar would likely need to be triggered by some soft data, but the US calendar is currently quite light, and tomorrow’s retail sales may print respectable numbers.”
“Instead, we continue to see a non-negligible risk that markets will place some ‘Trump hedges’ by buying dollars ahead of a closely-contested US election, which could end up out-shadowing a potential downward correction in front-end USD rates. The timing of that is – however – quite uncertain. The predominance of the Fed story as a driver, mixed with earnings and the Middle East turmoil, means markets may keep trading outside of the US election sphere until only a few days before the vote, and then unwind the riskiest positions.”
“Yesterday, Donald Trump spoke at an event and discussed two important points for markets: tariffs and Fed independence. He sounded particularly hawkish on protectionism, particularly targeting US car imports from Europe and Mexico. On the Fed, he said that he would not temper with the Fed’s independence, but equally claimed that the president should have a say on rates.”
- GBP/JPY attracts sellers for the second straight day in reaction to softer UK CPI print.
- The data reaffirms bets for a BoE rate cut in November and weighs heavily on the GBP.
- A sustained break below the key 200-day SMA should pave the way for further losses.
The GBP/JPY cross attracts heavy selling following the release of the UK consumer inflation figures on Wednesday and retreats further from over a two-week high touched the previous day. The second straight day of a downfall drags spot prices to a multi-day low, around the 193.70 area during the first half of the European session, with bears now awaiting a break below the 200-day Simple Moving Average (SMA) before placing fresh bets.
The UK Office for National Statistics (ONS) reported that the headline Consumer Price Index (CPI) remained flat in September and the yearly rate decelerated to 1.7% from 2.2% in August. This was the lowest reading since April 2021 and comes on top of the recent remarks by the Bank of England (BoE) Governor Andrew Bailey, saying that the central bank could cut interest rates more aggressively if there's further good news on inflation. The markets were quick to react and are now pricing in a 90% chance that the BoE will lower borrowing costs in November, which, in turn, weighs heavily on the British Pound (GBP).
Meanwhile, the lack of specifics about the overall size of the fiscal stimulus from China left investors uncertain. Apart from this, persistent geopolitical risks stemming from the ongoing conflicts in the Middle East take a toll on the global risk sentiment, which is evident from a generally weaker tone across the equity markets. This, in turn, benefits the Japanese Yen's (JPY) relative safe-haven status and exerts additional pressure on the GBP/JPY cross. That said, doubts over the Bank of Japan's (BoJ) rate-hike plans keep a lid on any meaningful appreciating move for the JPY and should act as a tailwind for the currency pair.
Even from a technical perspective, the GBP/JPY cross has been oscillating in a familiar range over the past two weeks or so. This constitutes the formation of a rectangle on the daily chart and points to indecision over the next leg of a directional move. Moreover, the aforementioned mixed fundamental backdrop makes it prudent to wait for strong follow-through selling and a sustained break below the 200-day SMA before confirming a bearish breakdown.
Economic Indicator
Consumer Price Index (YoY)
The United Kingdom (UK) Consumer Price Index (CPI), released by the Office for National Statistics on a monthly basis, is a measure of consumer price inflation – the rate at which the prices of goods and services bought by households rise or fall – produced to international standards. It is the inflation measure used in the government’s target. The YoY reading compares prices in the reference month to a year earlier. Generally, a high reading is seen as bullish for the Pound Sterling (GBP), while a low reading is seen as bearish.
Read more.Last release: Wed Oct 16, 2024 06:00
Frequency: Monthly
Actual: 1.7%
Consensus: 1.9%
Previous: 2.2%
Source: Office for National Statistics
The Bank of England is tasked with keeping inflation, as measured by the headline Consumer Price Index (CPI) at around 2%, giving the monthly release its importance. An increase in inflation implies a quicker and sooner increase of interest rates or the reduction of bond-buying by the BOE, which means squeezing the supply of pounds. Conversely, a drop in the pace of price rises indicates looser monetary policy. A higher-than-expected result tends to be GBP bullish.
- The Mexican Peso declines steeply after Donald Trump says he will stop Mexican-made cars from entering the US.
- A critical report by the IMF about Mexico’s economic outlook further weighs.
- USD/MXN rallies strongly from its bedrock of support at the base of a rising channel.
The Mexican Peso (MXN) manages to hold the line on Wednesday after depreciating an average of 1.5% in its most heavily traded pairs the previous day. The Peso sold off heavily after former US President Donald Trump said he would put tariffs of over “100%, 200% or even 300%” on Mexican cars entering the US to prevent a further erosion of the beleaguered US car industry by foreign competitors. This, along with a critical report about Mexico’s economy from the International Monetary Fund (IMF), contributed to the Peso’s steep sell-off.
Mexican Peso rolls off the back of the trailer during Trump interview
The Mexican Peso depreciated over 1.60% against the US Dollar (USD) on Tuesday after Donald Trump threatened to whack prohibitory tariffs on Mexican-made autos entering the US market.
“Mexico is a tremendous challenge for us,” said Trump in an interview with John Micklethwait, the Editor-in-Chief of Bloomberg News, “China is building massive auto plants in Mexico. And they are going to make those cars and then take those cars and sell them into the border – they are very near the border. And they are going to have all the advantages and none of the disadvantages. And that is going to be the end of Michigan, the end of South Carolina,” the former president said at the Chicago Economic Club.
Trump’s comments had all the more bite because, according to bookmakers he is now more likely to win the presidential election than Harris. According to OddsChecker Trump has an almost 58% probability of winning against Harris’ 42%.
That said, in the latest opinion polls, Vice-President Kamala Harris is still in the lead with 48.5% of the vote versus Trump’s 46.1%, according to FiveThirtyEight.
Mexican Peso hit by damaging IMF report
The Mexican Peso was further undermined after the release of an IMF report on the country, which highlighted a slowdown in activity and growth.
“Activity is decelerating. Despite an expansionary fiscal stance, growth is slowing to around 1.50% percent this year, partly due to binding capacity constraints and a tight monetary policy stance,” said the IMF report, adding, “Risks to growth are tilted to the downside while inflation risks remain on the upside.”
That said, the IMF saw inflation falling steadily to the Bank of Mexico’s (Banxico) 3.0% target in 2025.
Downside risks to the outlook came from weaker-than-expected growth in the US, an increase in global risk aversion, and the “unforeseen effects from recent institutional reforms”, said the IMF.
On the upside, the IMF highlighted Mexico’s unique nearshoring advantages given its proximity and current free-trade agreement with the US.
In relation to Mexico’s controversial new judicial reforms, which seek to have judges elected by popular vote rather than appointed, the IMF said these could “create important uncertainties about the effectiveness of contract enforcement and the predictability of the rule of law,” adding they were “a new source of uncertainty that may impinge upon private investment decisions.” However, overall, the IMF was optimistic about the new laws, saying, “Staff’s current baseline does not incorporate potential headwinds from these uncertainties.”
Technical Analysis: USD/MXN spikes from base of rising channel
USD/MXN rallies from a strong belt of support at the base of a rising channel and the 50-day Simple Moving Average (SMA) situated at 19.42.
USD/MXN Daily Chart
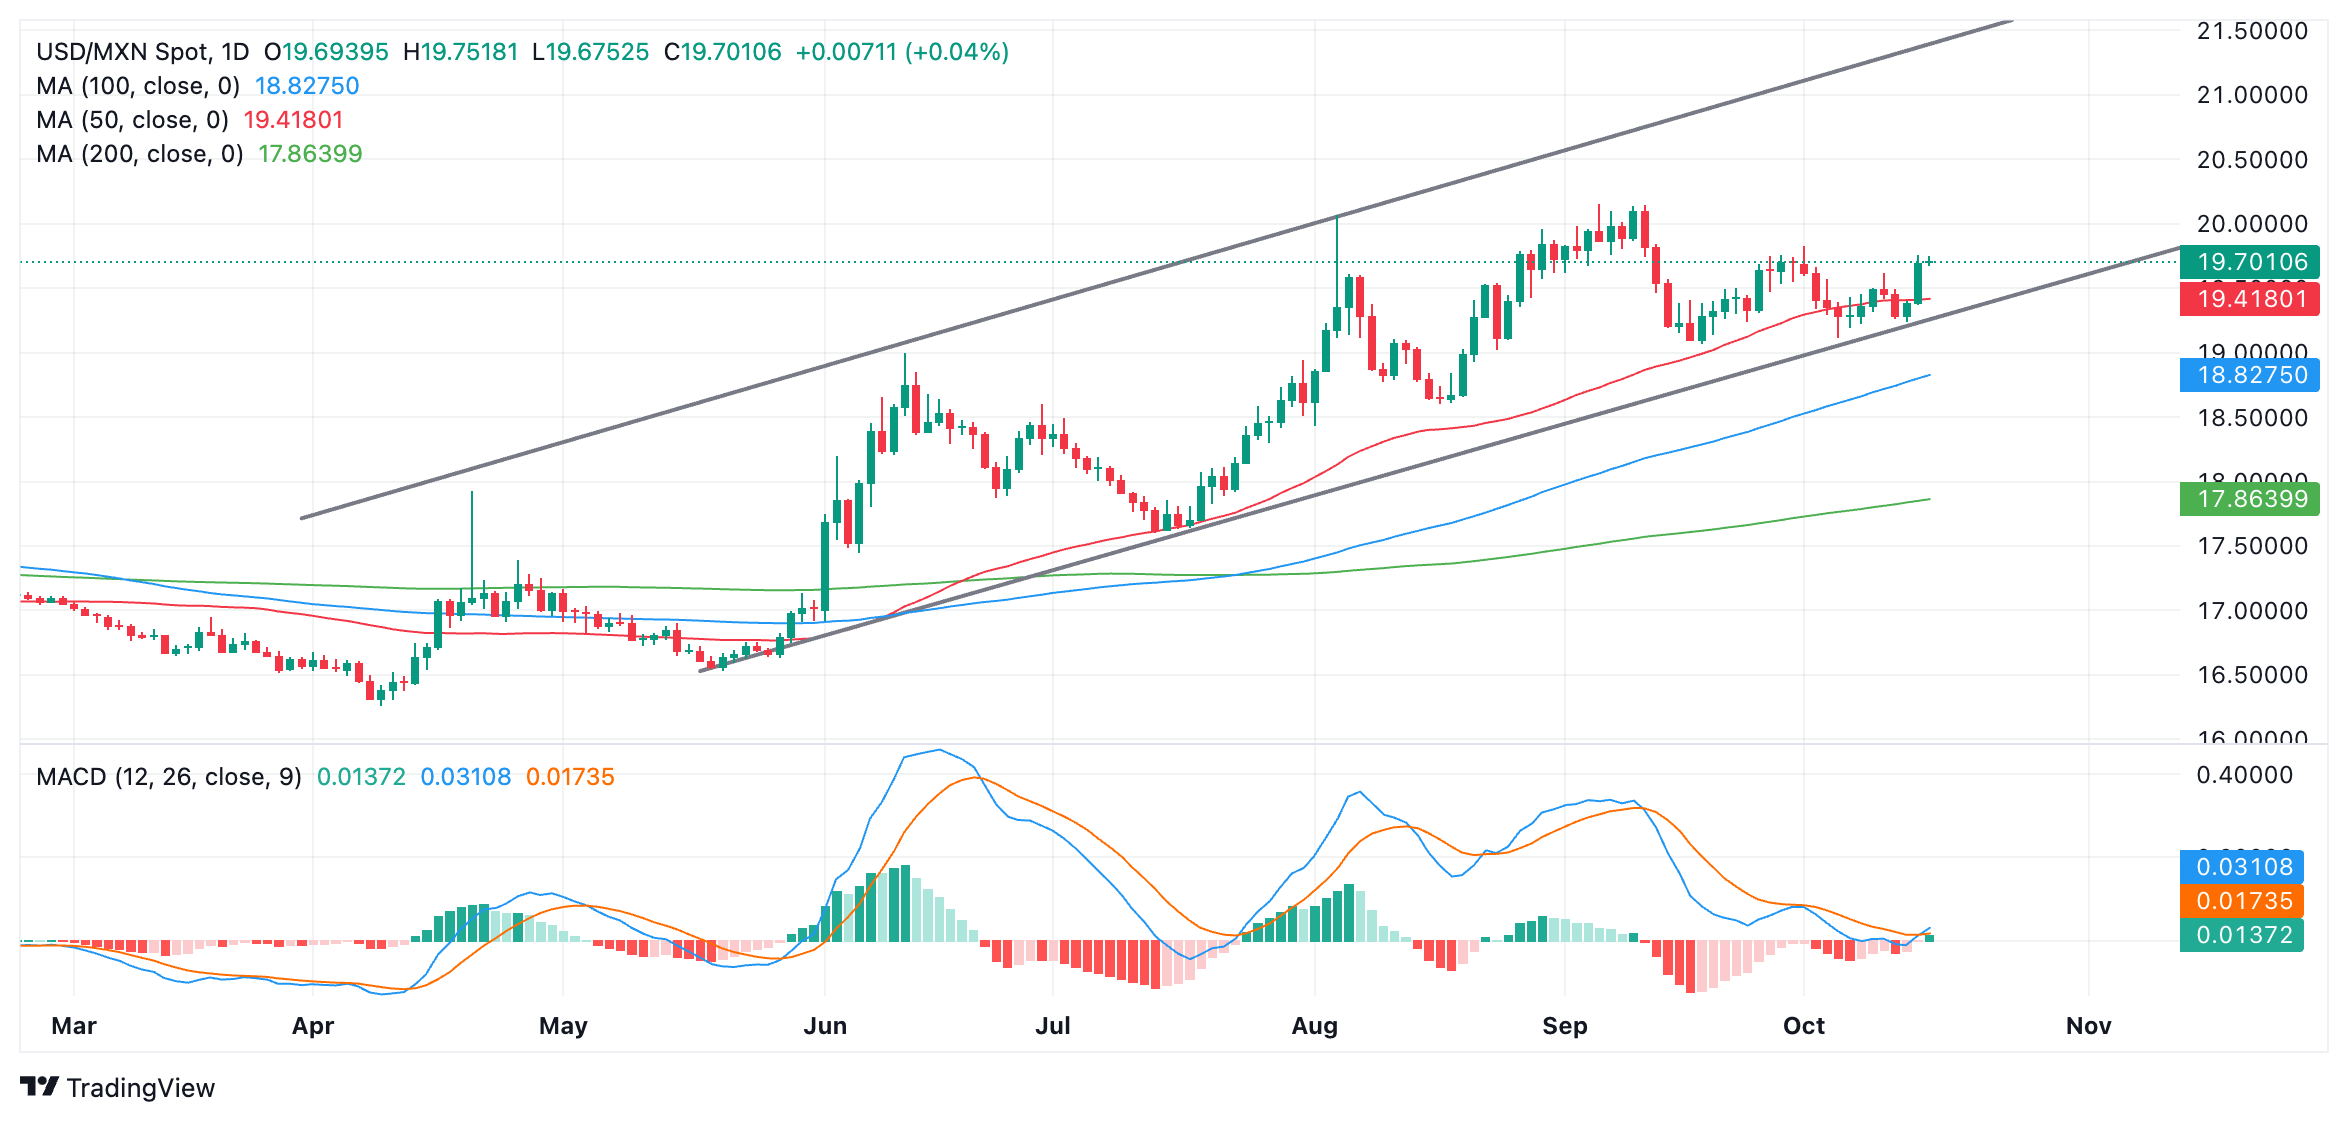
USD/MXN is now probably in a short-term uptrend, and given the technical analysis principle that “the trend is your friend,” this favors a continuation higher.
The next target is at 19.83 (October 1 high), and a break above that would probably lead to a move up to 20.10 and the vicinity of the September 10 high.
The Moving Average Convergence Divergence (MACD) (blue) line has broken above its (red) signal line, further indicating a bullish bias.
Mexican Peso FAQs
The Mexican Peso (MXN) is the most traded currency among its Latin American peers. Its value is broadly determined by the performance of the Mexican economy, the country’s central bank’s policy, the amount of foreign investment in the country and even the levels of remittances sent by Mexicans who live abroad, particularly in the United States. Geopolitical trends can also move MXN: for example, the process of nearshoring – or the decision by some firms to relocate manufacturing capacity and supply chains closer to their home countries – is also seen as a catalyst for the Mexican currency as the country is considered a key manufacturing hub in the American continent. Another catalyst for MXN is Oil prices as Mexico is a key exporter of the commodity.
The main objective of Mexico’s central bank, also known as Banxico, is to maintain inflation at low and stable levels (at or close to its target of 3%, the midpoint in a tolerance band of between 2% and 4%). To this end, the bank sets an appropriate level of interest rates. When inflation is too high, Banxico will attempt to tame it by raising interest rates, making it more expensive for households and businesses to borrow money, thus cooling demand and the overall economy. Higher interest rates are generally positive for the Mexican Peso (MXN) as they lead to higher yields, making the country a more attractive place for investors. On the contrary, lower interest rates tend to weaken MXN.
Macroeconomic data releases are key to assess the state of the economy and can have an impact on the Mexican Peso (MXN) valuation. A strong Mexican economy, based on high economic growth, low unemployment and high confidence is good for MXN. Not only does it attract more foreign investment but it may encourage the Bank of Mexico (Banxico) to increase interest rates, particularly if this strength comes together with elevated inflation. However, if economic data is weak, MXN is likely to depreciate.
As an emerging-market currency, the Mexican Peso (MXN) tends to strive during risk-on periods, or when investors perceive that broader market risks are low and thus are eager to engage with investments that carry a higher risk. Conversely, MXN tends to weaken at times of market turbulence or economic uncertainty as investors tend to sell higher-risk assets and flee to the more-stable safe havens.
The Euro (EUR) is expected to edge lower; due to mild momentum, any decline is unlikely to break clearly below 1.0860. In the longer run, chance of EUR breaking below the major support zone of 1.0860/1.0885; it remains to be seen if it can maintain a foothold below these levels, UOB Group’s FX analysts Quek Ser Leang and Peter Chia note.
EUR can break below of 1.0860/1.0885
24-HOUR VIEW: “We highlighted yesterday that EUR ‘could dip to 1.0885 before the risk of a more sustained rebound is likely.’ We added, ‘the next support at 1.0860 is unlikely to come into view.’ Our view was not wrong, as EUR edged lower to 1.0881, closing at 1.0890 (-0.17%). There has been a slight increase in momentum. Today, we expect EUR to edge lower, but due to the mild momentum, any decline is unlikely to break clearly below 1.0860. Resistance is at 1.0900; a breach of 1.0915 would indicate that the current mild downward pressure has faded.”
1-3 WEEKS VIEW: “We highlighted yesterday (15 Oct, spot at 1.0905) that ‘the slight increase in momentum suggests there is a chance of EUR breaking below the support zone of 1.0860/1.0885, but it remains to be seen if it can maintain a foothold below these levels.’ EUR then dipped to a low of 1.0886. We continue to hold the same view. Looking ahead, the next support level below the support zone is at 1.0775. At this time, the likelihood of EUR declining to this level is low. On the upside, a breach of 1.0950 (‘strong resistance’ level was at 1.0960 yesterday) would indicate that the weakness in EUR that started early in this month has stabilised.”
- USD/CHF edges higher as robust US labor and inflation data have diminished the likelihood of bumper rate cuts by the Fed.
- Atlanta Fed President Raphael Bostic expects just one more interest rate cut of 25 basis points this year.
- The Swiss Franc strengthened as lower inflation in September reduced the need for the SNB to implement substantial rate cuts.
USD/CHF retraces its recent losses registered in the previous session, trading around 0.8630 during the early European hours on Wednesday. The US Dollar (USD) continues to gain support as robust US Employment and Consumer Price Index (CPI) data have dampened expectations of aggressive Federal Reserve (Fed) easing.
Markets are now anticipating a total of 125 basis points in rate cuts over the next 12 months. According to the CME FedWatch Tool, there is currently a 94.1% probability of a 25-basis-point rate cut in November, with no expectation of a larger 50-basis-point reduction.
On Tuesday, Raphael Bostic, President of the Federal Reserve Bank of Atlanta, indicated that he expects only one additional interest rate cut of 25 basis points this year, in line with his projections from the US central bank's meeting last month. "The median forecast called for a total of 50 basis points in cuts, on top of the 50 basis points already implemented in September," according to Reuters.
On the Swiss side, the yield on the 10-year government bond declined to 0.41% as traders assess the broader economic and financial environment in Switzerland. Bond yields are often a reflection of inflation expectations. Low inflation typically bolsters the currency by preserving its purchasing power, which means the Swiss Franc (CHF) could find support even as bond yields decrease.
Swiss Franc FAQs
The Swiss Franc (CHF) is Switzerland’s official currency. It is among the top ten most traded currencies globally, reaching volumes that well exceed the size of the Swiss economy. Its value is determined by the broad market sentiment, the country’s economic health or action taken by the Swiss National Bank (SNB), among other factors. Between 2011 and 2015, the Swiss Franc was pegged to the Euro (EUR). The peg was abruptly removed, resulting in a more than 20% increase in the Franc’s value, causing a turmoil in markets. Even though the peg isn’t in force anymore, CHF fortunes tend to be highly correlated with the Euro ones due to the high dependency of the Swiss economy on the neighboring Eurozone.
The Swiss Franc (CHF) is considered a safe-haven asset, or a currency that investors tend to buy in times of market stress. This is due to the perceived status of Switzerland in the world: a stable economy, a strong export sector, big central bank reserves or a longstanding political stance towards neutrality in global conflicts make the country’s currency a good choice for investors fleeing from risks. Turbulent times are likely to strengthen CHF value against other currencies that are seen as more risky to invest in.
The Swiss National Bank (SNB) meets four times a year – once every quarter, less than other major central banks – to decide on monetary policy. The bank aims for an annual inflation rate of less than 2%. When inflation is above target or forecasted to be above target in the foreseeable future, the bank will attempt to tame price growth by raising its policy rate. Higher interest rates are generally positive for the Swiss Franc (CHF) as they lead to higher yields, making the country a more attractive place for investors. On the contrary, lower interest rates tend to weaken CHF.
Macroeconomic data releases in Switzerland are key to assessing the state of the economy and can impact the Swiss Franc’s (CHF) valuation. The Swiss economy is broadly stable, but any sudden change in economic growth, inflation, current account or the central bank’s currency reserves have the potential to trigger moves in CHF. Generally, high economic growth, low unemployment and high confidence are good for CHF. Conversely, if economic data points to weakening momentum, CHF is likely to depreciate.
As a small and open economy, Switzerland is heavily dependent on the health of the neighboring Eurozone economies. The broader European Union is Switzerland’s main economic partner and a key political ally, so macroeconomic and monetary policy stability in the Eurozone is essential for Switzerland and, thus, for the Swiss Franc (CHF). With such dependency, some models suggest that the correlation between the fortunes of the Euro (EUR) and the CHF is more than 90%, or close to perfect.
- EUR/GBP rises strongly to near 0.8380 as soft UK inflation prompts BoE dovish bets.
- UK service inflation slowed to 4.9% and the core CPI decelerated to 3.2% in September.
- Investors await ECB Lagarde’s speech for fresh interest rate outlook.
The EUR/GBP pair surges to near 0.8380 in Wednesday’s European session. The cross strengthens after the release of the United Kingdom (UK) Consumer Price Index (CPI) report for September, which showed that price pressures grew at a slower-than-expected pace.
Signs of inflationary pressures taming have prompted expectations of more interest rate cuts by the Bank of England (BoE) in the remaining year.
The CPI report showed that the annual headline inflation decelerated to 1.7%, below the bank’s target of 2%. Month-on-month headline CPI remained flat, which was expected to hardly grow. Annual core CPI – which excludes volatile items – rose by 3.2%, slower than estimates of 3.4% and the former release of 3.6%.
Meanwhile, inflation in the services sector also slowed sharply due to lower wage growth. The Service inflation, a closely watched indicator by BoE officials, grew by 4.9%, slower than 5.6% in August.
The Pound Sterling (GBP) was underperforming against its major peers from a few days after BoE Governor Andrew Bailey’s interview with the Guardian newspaper in which his comments were a bit dovish on the interest rate outlook. Bailey said the BoE could become "a bit more activist" and "a bit more aggressive" in its approach to lowering rates if there was further welcome news on inflation for the central bank, Reuters reported.
On the Euro (EUR) front, investors await European Central Bank (ECB) President Christine Lagarde’s speech for fresh guidance on interest rates, which is scheduled at 19:40 GMT. Comments from ECB Lagarde could be on the dovish side as price pressures in the Eurozone have decelerated sharply in September.
According to revised estimates, the annual CPI (EU norm) in France slowed to 1.4% in September from expectations and the prior estimates of 1.5%.
- The Pound Sterling falls vertically after the UK inflation data for September came in slower than expected.
- UK annual headline CPI decelerated below the bank’s target of 2%.
- Traders expect the Fed to cut interest rates moderately in the remainder of the year.
The Pound Sterling (GBP) faces an intense sell-off as the United Kingdom (UK) Office for National Statistics (ONS) has published a soft Consumer Price Index (CPI) report for September. The CPI report showed that the annual headline inflation softened to 1.7%. Price pressures were expected to decelerate but at a slower pace to 1.9% from 2.2% in August. Month-on-month headline inflation remained flat.
The core CPI inflation – which excludes volatile items such as food, energy, oil, and tobacco – decelerated at a faster-than-expected pace to 3.2%, from the estimates of 3.4% and the former reading of 3.6%. Services inflation, a closely watched indicator by Bank of England (BoE) officials, grew at a slower pace of 4.9% from 5.6% in August. A sharp deceleration in price pressures is expected to force traders to raise bets supporting interest rate cuts in each of the two policy meetings remaining this year.
Currently, financial market participants expect the BoE to cut interest rates by 25 basis points (bps) in one of the policy meetings scheduled in November and December.
Market experts were anticipating a slowdown in the service inflation as growth in the UK’s Average Earnings Excluding Bonuses, a wage growth measure that drives consumer spending, in the three months ending August was the slowest in two years. The wage growth measure rose expectedly by 4.9%, slower than the prior release of 5.1%.
Daily digest market movers: Pound Sterling weakens against US Dollar
- The Pound Sterling falls vertically below the psychological support of 1.3000 against the US Dollar (USD) in Wednesday’s London session. The US Dollar stays afloat near a more than two-month high as traders have priced in moderate interest rate cuts from the Federal Reserve (Fed) in the remaining policy meetings this year, with the US Dollar Index (DXY) holding onto gains near 103.30. The Fed started the policy-easing cycle with a larger-than-usual size of 50 basis points (bps) in September.
- According to the CME FedWatch tool, 30-day Federal Funds futures pricing data suggests that there will be interest rate cuts by 25 bps in the November and December meetings.
- Traders have priced out expectations of another 50 bps rate cut in November after a string of better-than-expected United States (US) data for September, which showed signs of economic resilience. US data such as Nonfarm Payrolls (NFP) and the ISM Services PMI grew at a robust pace, diminishing fears of an economic slowdown.
- Apart from the upbeat US data, price pressures grew at a faster-than-expected pace in September, signaling that the battle against inflation is far from over.
- Going forward, investors will pay close attention to the monthly US Retail Sales data for September, which will be published on Thursday. The Retail Sales data, a key measure of consumer spending, is estimated to have grown by 0.3%.
Technical Analysis: Pound Sterling tests region below 1.3000
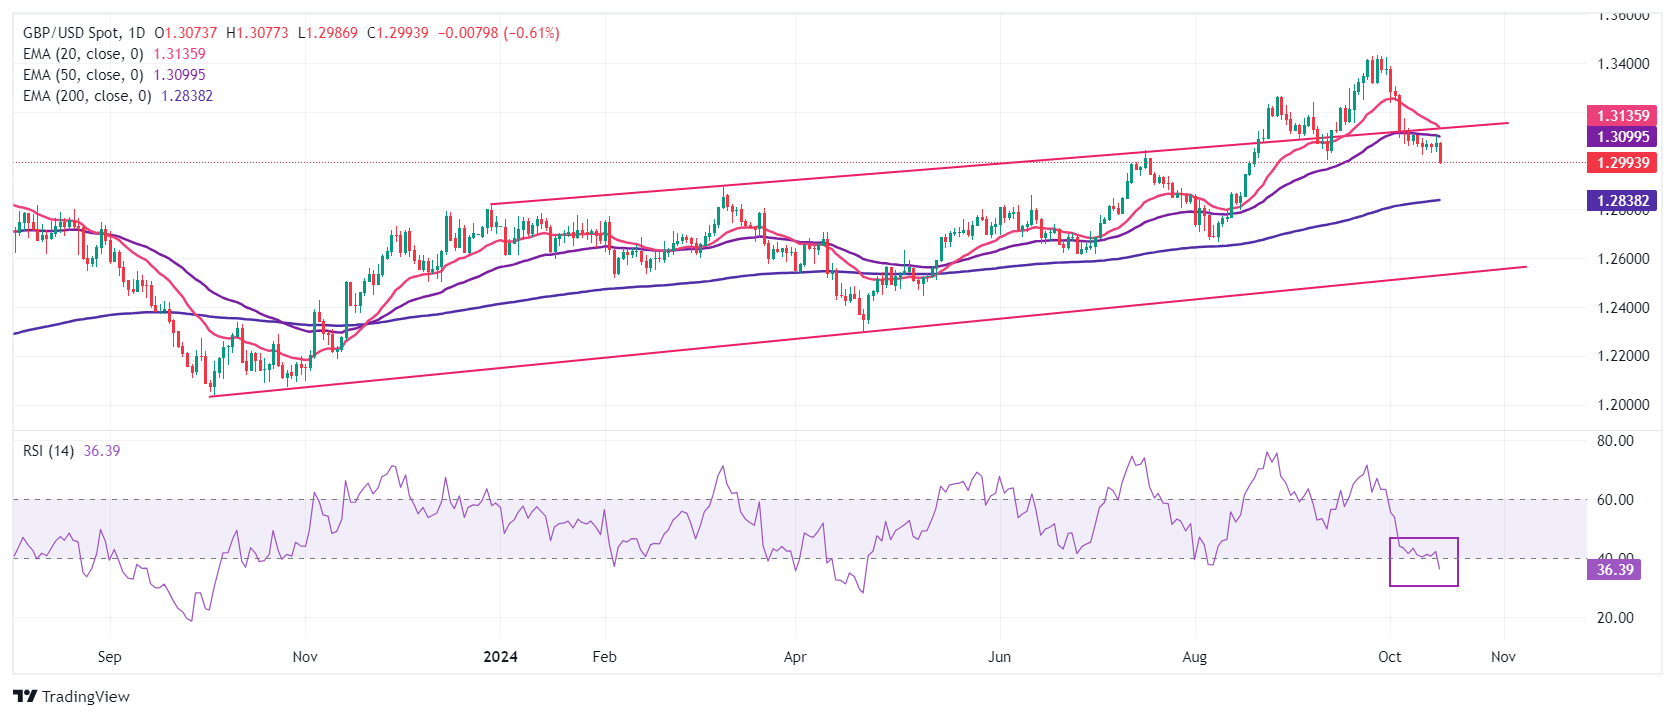
The Pound Sterling slides below 1.3000 against the US Dollar in European trading hours. The GBP/USD pair weakens after breaking below the four-day trading range of 1.3020-1.3100. The Cable was already under pressure after slipping below the upward-sloping trendline plotted from the 28 December 2023 high of 1.2827 earlier in October.
The near-term trend of the major appears to be vulnerable as the 20- and 50-day Exponential Moving Averages (EMAs) near 1.3135 and 1.3100, respectively, are sloping downwards.
A downside move in the Relative Strength Index (RSI) below 40.00 suggests a bearish momentum.
Looking down, the 200-day EMA near 1.2840 will be a major support zone for Pound Sterling bulls. On the upside, the Cable will face resistance near the round-level figure of 1.3100.
Pound Sterling FAQs
The Pound Sterling (GBP) is the oldest currency in the world (886 AD) and the official currency of the United Kingdom. It is the fourth most traded unit for foreign exchange (FX) in the world, accounting for 12% of all transactions, averaging $630 billion a day, according to 2022 data. Its key trading pairs are GBP/USD, also known as ‘Cable’, which accounts for 11% of FX, GBP/JPY, or the ‘Dragon’ as it is known by traders (3%), and EUR/GBP (2%). The Pound Sterling is issued by the Bank of England (BoE).
The single most important factor influencing the value of the Pound Sterling is monetary policy decided by the Bank of England. The BoE bases its decisions on whether it has achieved its primary goal of “price stability” – a steady inflation rate of around 2%. Its primary tool for achieving this is the adjustment of interest rates. When inflation is too high, the BoE will try to rein it in by raising interest rates, making it more expensive for people and businesses to access credit. This is generally positive for GBP, as higher interest rates make the UK a more attractive place for global investors to park their money. When inflation falls too low it is a sign economic growth is slowing. In this scenario, the BoE will consider lowering interest rates to cheapen credit so businesses will borrow more to invest in growth-generating projects.
Data releases gauge the health of the economy and can impact the value of the Pound Sterling. Indicators such as GDP, Manufacturing and Services PMIs, and employment can all influence the direction of the GBP. A strong economy is good for Sterling. Not only does it attract more foreign investment but it may encourage the BoE to put up interest rates, which will directly strengthen GBP. Otherwise, if economic data is weak, the Pound Sterling is likely to fall.
Another significant data release for the Pound Sterling is the Trade Balance. This indicator measures the difference between what a country earns from its exports and what it spends on imports over a given period. If a country produces highly sought-after exports, its currency will benefit purely from the extra demand created from foreign buyers seeking to purchase these goods. Therefore, a positive net Trade Balance strengthens a currency and vice versa for a negative balance.
Here is what you need to know on Wednesday, October 16:
Pound Sterling stays under selling pressure early Wednesday as markets assess September inflation readings from the UK. In the second half of the day, Export Price Index and Import Price Index data for September will be featured in the US economic docket.
British Pound PRICE Today
The table below shows the percentage change of British Pound (GBP) against listed major currencies today. British Pound was the weakest against the US Dollar.
| USD | EUR | GBP | JPY | CAD | AUD | NZD | CHF | |
|---|---|---|---|---|---|---|---|---|
| USD | 0.13% | 0.64% | 0.03% | 0.02% | 0.24% | 0.36% | 0.05% | |
| EUR | -0.13% | 0.53% | -0.06% | -0.08% | 0.13% | 0.26% | -0.11% | |
| GBP | -0.64% | -0.53% | -0.62% | -0.59% | -0.40% | -0.27% | -0.58% | |
| JPY | -0.03% | 0.06% | 0.62% | 0.00% | 0.20% | 0.32% | 0.04% | |
| CAD | -0.02% | 0.08% | 0.59% | -0.01% | 0.20% | 0.32% | 0.02% | |
| AUD | -0.24% | -0.13% | 0.40% | -0.20% | -0.20% | 0.12% | -0.18% | |
| NZD | -0.36% | -0.26% | 0.27% | -0.32% | -0.32% | -0.12% | -0.31% | |
| CHF | -0.05% | 0.11% | 0.58% | -0.04% | -0.02% | 0.18% | 0.31% |
The heat map shows percentage changes of major currencies against each other. The base currency is picked from the left column, while the quote currency is picked from the top row. For example, if you pick the British Pound from the left column and move along the horizontal line to the US Dollar, the percentage change displayed in the box will represent GBP (base)/USD (quote).
The UK's Office for National Statistics (ONS) reported that annual inflation in the UK, as measured by the change in the Consumer Price Index (CPI), declined to 1.7% in September from 2.2% in August. This reading came in below the market expectation of 1.9%. In the same period, the Producer Price Index (PPI) - Input declined by 2.3%. Finally, the Retail Price Index rose 2.7%, down sharply from 3.5% in August. GBP/USD turned south following UK inflation prints and was last seen losing more than 0.5% on the day below 1.3000.
The negative shift seen in the risk mood in the American session on Tuesday helped the US Dollar (USD) preserve its strength. The USD Index registered small gains on Tuesday and continued to edge higher early Wednesday. At the time of press, the index was trading at its highest level since early August above 103.30. Meanwhile, US stock index futures trade mixed after Wall Street's main indexes registered large losses on Tuesday.
During the Asian trading hours, the data from Japan showed that Machinery Orders declined by 1.9% on a monthly basis in August, following the 0.1% decline recorded in July. USD/JPY showed no immediate reaction to this data and was last seen moving sideways in a narrow range above 149.00.
EUR/USD finds it difficult to stage a rebound after closing in the red on Tuesday. The pair inches lower in the European morning on Wednesday and trades below 1.0900.
AUD/USD stays on the back foot and fluctuates in negative territory below 0.6700 early Wednesday. In the Asian session on Thursday, September employment data from Australia will be watched closely by investors. The market expectation is for the Unemployment Rate to hold steady at 4.2%.
After reaching its highest level in over two months above 1.3830 on Tuesday, USD/CAD reversed its direction and snapped a nine-day winning streak after the data from Canada showed that the BoC Consumer Price Index Core rose 1.6% on a yearly basis in September, compared to the 1.5% increase recorded in August. At the time of press, USD/CAD was trading in a tight range below 1.3800.
Gold continues to edge higher early Wednesday and trades at its highest level since September 26 above $2,670.
Inflation FAQs
Inflation measures the rise in the price of a representative basket of goods and services. Headline inflation is usually expressed as a percentage change on a month-on-month (MoM) and year-on-year (YoY) basis. Core inflation excludes more volatile elements such as food and fuel which can fluctuate because of geopolitical and seasonal factors. Core inflation is the figure economists focus on and is the level targeted by central banks, which are mandated to keep inflation at a manageable level, usually around 2%.
The Consumer Price Index (CPI) measures the change in prices of a basket of goods and services over a period of time. It is usually expressed as a percentage change on a month-on-month (MoM) and year-on-year (YoY) basis. Core CPI is the figure targeted by central banks as it excludes volatile food and fuel inputs. When Core CPI rises above 2% it usually results in higher interest rates and vice versa when it falls below 2%. Since higher interest rates are positive for a currency, higher inflation usually results in a stronger currency. The opposite is true when inflation falls.
Although it may seem counter-intuitive, high inflation in a country pushes up the value of its currency and vice versa for lower inflation. This is because the central bank will normally raise interest rates to combat the higher inflation, which attract more global capital inflows from investors looking for a lucrative place to park their money.
Formerly, Gold was the asset investors turned to in times of high inflation because it preserved its value, and whilst investors will often still buy Gold for its safe-haven properties in times of extreme market turmoil, this is not the case most of the time. This is because when inflation is high, central banks will put up interest rates to combat it. Higher interest rates are negative for Gold because they increase the opportunity-cost of holding Gold vis-a-vis an interest-bearing asset or placing the money in a cash deposit account. On the flipside, lower inflation tends to be positive for Gold as it brings interest rates down, making the bright metal a more viable investment alternative.
FX option expiries for Oct 16 NY cut at 10:00 Eastern Time, via DTCC, can be found below.
EUR/USD: EUR amounts
- 1.0950 2.1b
- 1.0955 924m
- 1.0975 1.3b
USD/JPY: USD amounts
- 147.00 702m
- 150.00 708m
USD/CHF: USD amounts
- 0.8600 520m
AUD/USD: AUD amounts
- 0.6575 870m
- 0.6750 903m
- 0.6775 498m
USD/CAD: USD amounts
- 1.3660 419m
- 1.3700 528m
- 1.3850 438m
Bank of Japan (BoJ) board member Seiji Adachi is back on the wires on Wednesday, commenting on the interest rate and the exchange rate outlooks.
Additional quotes
Markets have stabilized compared with when we saw huge volatility in August.
Risk of sharp Yen falls likely subsided, though watching for any build-up of positions.
Impact of expected new spending package on underlying inflation, which we focus on in setting policy, likely neutral.
Don't have preset image in mind on level of Japan's natural rate of interest, which likely changes due to various factors.
When I talk about sufficient wage hike, hope to see wage hikes next year at least around level achieved this year.
BoJ’s next regional branch managers' meeting in January could offer clues on next year's wage outlook, serve as among factors to decide policy.
No set pace in mind when it comes to rate hikes.
Must scrutinize data particularly on the real economy.
Rate hike so far has had intended effect.
But must avoid falling back into deflation with premature rate hikes.
Risk of upward pressure heightening from yen declines has reduced significantly.
- Silver price appreciated as US Treasury yields declined following weak NY Empire State Manufacturing Index release on Tuesday.
- 2-year and 10-year yields on US Treasury bonds stand at 3.95% and 4.03%, respectively, by the press time.
- The safe-haven Silver may appreciate further as Israel may intensify its ground operations against Hezbollah.
Silver price (XAG/USD) continues its winning streak for the fifth consecutive day, hovering around $31.70 per troy ounce during the Asian trading hours on Wednesday. The non-yielding Silver has found support as US Treasury yields declined in response to disappointing manufacturing data released on Tuesday.
The NY Empire State Manufacturing Index unexpectedly dropped by 23 points to a reading of -11.9 in October, marking its lowest level in five months. This decline indicates a contraction in business activity in New York, following a growth reading of 11.5 in September.
2-year and 10-year yields on US Treasury bonds stand at 3.95% and 4.03%, respectively, at the time of writing. Lower yields boost the appeal of precious metals like Silver. However, last week’s strong US jobs and inflation data have reduced expectations for aggressive easing by the Federal Reserve (Fed) in 2024.
Markets are now forecasting a total of 125 basis points in rate cuts over the next year. According to the CME FedWatch Tool, there is currently a 94.1% probability of a 25-basis-point rate cut in November, with no expectation of a larger 50-basis-point reduction.
On Tuesday, Federal Reserve Bank of Atlanta President Raphael Bostic stated that he anticipates just one more interest rate cut of 25 basis points this year, as reflected in his projections during last month's US central bank meeting. "The median forecast was for 50 basis points beyond the 50 basis points already implemented in September, according to Reuters.
Silver prices are also receiving support from safe-haven flows due to the ongoing uncertainty surrounding the Middle East conflict. Israel may intensify its ground operations against Hezbollah while reinforcing its defenses. Reports from Reuters indicate that Israeli troops have cleared landmines and set up new barriers along the border between the Israeli-occupied Golan Heights and the demilitarized zone adjacent to Syria.
Silver FAQs
Silver is a precious metal highly traded among investors. It has been historically used as a store of value and a medium of exchange. Although less popular than Gold, traders may turn to Silver to diversify their investment portfolio, for its intrinsic value or as a potential hedge during high-inflation periods. Investors can buy physical Silver, in coins or in bars, or trade it through vehicles such as Exchange Traded Funds, which track its price on international markets.
Silver prices can move due to a wide range of factors. Geopolitical instability or fears of a deep recession can make Silver price escalate due to its safe-haven status, although to a lesser extent than Gold's. As a yieldless asset, Silver tends to rise with lower interest rates. Its moves also depend on how the US Dollar (USD) behaves as the asset is priced in dollars (XAG/USD). A strong Dollar tends to keep the price of Silver at bay, whereas a weaker Dollar is likely to propel prices up. Other factors such as investment demand, mining supply – Silver is much more abundant than Gold – and recycling rates can also affect prices.
Silver is widely used in industry, particularly in sectors such as electronics or solar energy, as it has one of the highest electric conductivity of all metals – more than Copper and Gold. A surge in demand can increase prices, while a decline tends to lower them. Dynamics in the US, Chinese and Indian economies can also contribute to price swings: for the US and particularly China, their big industrial sectors use Silver in various processes; in India, consumers’ demand for the precious metal for jewellery also plays a key role in setting prices.
Silver prices tend to follow Gold's moves. When Gold prices rise, Silver typically follows suit, as their status as safe-haven assets is similar. The Gold/Silver ratio, which shows the number of ounces of Silver needed to equal the value of one ounce of Gold, may help to determine the relative valuation between both metals. Some investors may consider a high ratio as an indicator that Silver is undervalued, or Gold is overvalued. On the contrary, a low ratio might suggest that Gold is undervalued relative to Silver.
- GBP/USD remains confined in a familiar range held over the past week or so.
- Traders opt to wait on the sidelines ahead of the release of the UK CPI report.
- The technical setup favors bears and supports prospects for further losses.
The GBP/USD pair extends its sideways consolidative price move on Wednesday and remains confined in a familiar range held over the past week or so. Spot prices currently trade around the 1.3070-1.3075 region, nearly unchanged for the day, as traders opt to wait on the sidelines ahead of the UK consumer inflation figures.
Heading into the key data risk, speculation that the Bank of England (BoE) might be headed towards speeding up its rate-cutting cycle continues to undermine the British Pound (GBP) and act as a headwind for the GBP/USD pair. That said, a modest US Dollar (USD) downtick offers some support to the currency pair and helps limit the downside.
From a technical perspective, the range-bound price action might still be categorized as a bearish consolidation phase against the backdrop of the recent pullback from the 1.3435 area, or the highest level since March 2022 touched last month. Furthermore, oscillators on the daily chart are holding in negative territory and are still far from being in the oversold zone.
This, in turn, suggests that the path of least resistance for the GBP/USD pair remains to the downside. Hence, a subsequent slide to the 1.3020 area, or a one-month low touched last Thursday, en route to the 1.3000 psychological mark, looks like a distinct possibility. The downfall could extend towards the 100-day Simple Moving Average (SMA), around mid-1.2900s.
On the flip side, the 1.3100 round figure is likely to act as an immediate hurdle ahead of the 1.3125 horizontal zone. A sustained strength beyond the latter might trigger a short-covering rally and allow the GBP/USD pair to aim to reclaim the 1.3200 mark. Spot prices could climb further towards the next relevant hurdle near the 1.3235-1.3240 region.
GBP/USD daily chart
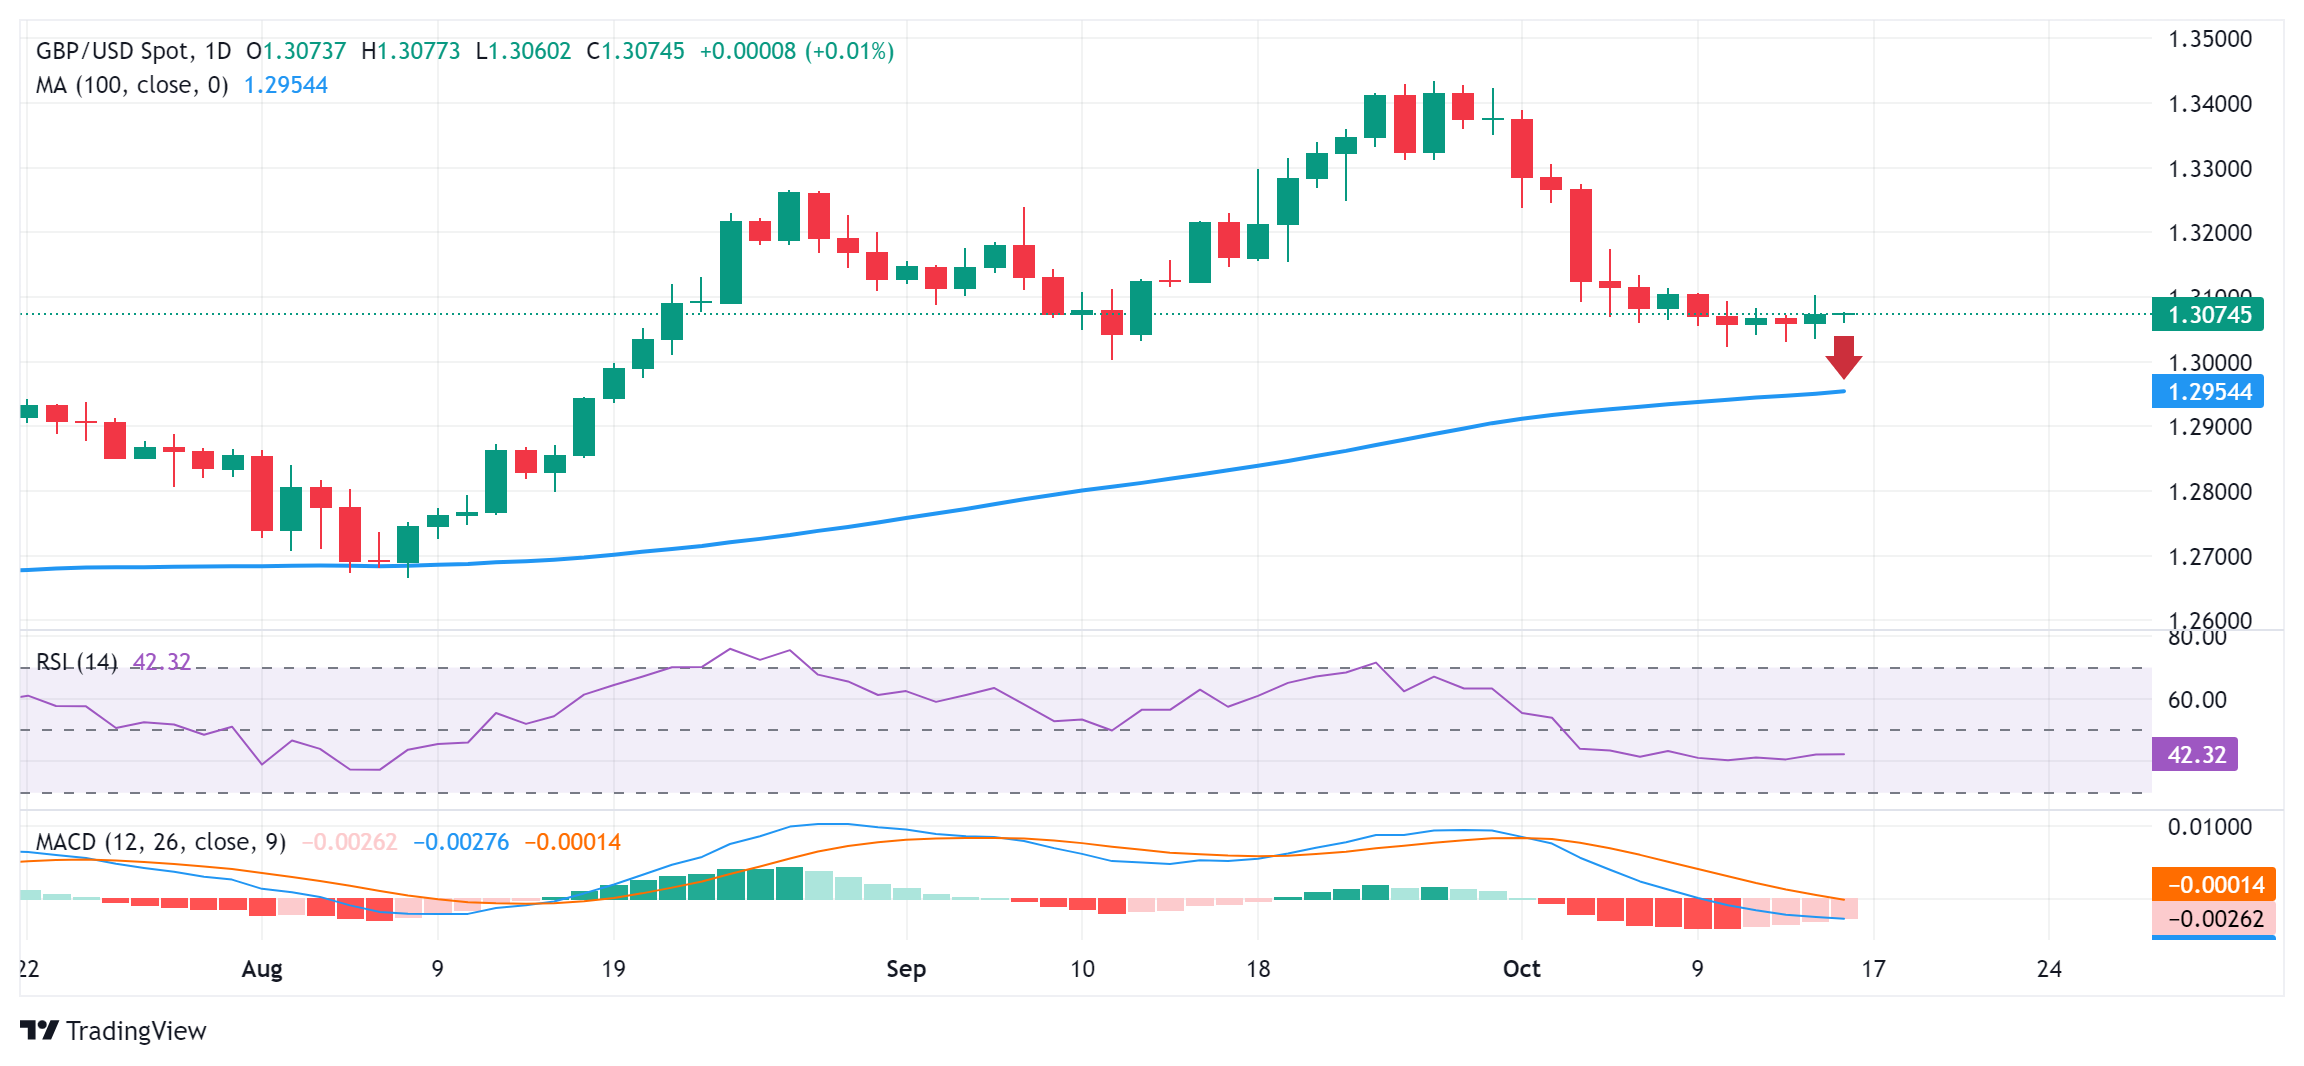
Economic Indicator
Consumer Price Index (YoY)
The United Kingdom (UK) Consumer Price Index (CPI), released by the Office for National Statistics on a monthly basis, is a measure of consumer price inflation – the rate at which the prices of goods and services bought by households rise or fall – produced to international standards. It is the inflation measure used in the government’s target. The YoY reading compares prices in the reference month to a year earlier. Generally, a high reading is seen as bullish for the Pound Sterling (GBP), while a low reading is seen as bearish.
Read more.Next release: Wed Oct 16, 2024 06:00
Frequency: Monthly
Consensus: 1.9%
Previous: 2.2%
Source: Office for National Statistics
The Bank of England is tasked with keeping inflation, as measured by the headline Consumer Price Index (CPI) at around 2%, giving the monthly release its importance. An increase in inflation implies a quicker and sooner increase of interest rates or the reduction of bond-buying by the BOE, which means squeezing the supply of pounds. Conversely, a drop in the pace of price rises indicates looser monetary policy. A higher-than-expected result tends to be GBP bullish.
- EUR/USD depreciates as the ECB could deliver a 25 basis cut on Main Refinancing Operations and the Deposit Facility.
- The US Dollar Index hovers near its two-month high of 103.35, reached on Monday.
- Atlanta Fed President Raphael Bostic anticipates just one more interest rate cut of 25 basis points in 2024.
EUR/USD holds its position after a four-day losing streak, trading around 1.0890 during the Asian session on Wednesday. The Euro may face downward pressure as the European Central Bank (ECB) is widely anticipated to implement a 25 basis point cut on both the Main Refinancing Operations and the Deposit Facility Rate during Thursday’s policy meeting.
Traders are expected to closely watch the Harmonized Index of Consumer Prices (HICP) data from the Eurozone, set to be released on Thursday, ahead of the European Central Bank (ECB) policy decision.
Additionally, the ECB's Monetary Policy Statement and President Christine Lagarde's speech during the post-meeting press conference will be key events of interest, as they may provide insights into the bank's monetary policy direction.
The US Dollar Index (DXY), which measures the value of the US Dollar (USD) against other six major currencies, maintains its position around its two-month high of 103.35, recorded on Monday. Last week’s strong jobs and inflation data have reduced expectations for aggressive easing by the Federal Reserve (Fed) in 2024.
Markets are now forecasting a total of 125 basis points in rate cuts over the next year. According to the CME FedWatch Tool, there is currently a 94.1% probability of a 25-basis-point rate cut in November, with no expectation of a larger 50-basis-point reduction.
On Tuesday, Federal Reserve Bank of Atlanta President Raphael Bostic stated that he anticipates just one more interest rate cut of 25 basis points this year, as reflected in his projections during last month's US central bank meeting. "The median forecast was for 50 basis points beyond the 50 basis points already implemented in September, according to Reuters.
Interest rates FAQs
Interest rates are charged by financial institutions on loans to borrowers and are paid as interest to savers and depositors. They are influenced by base lending rates, which are set by central banks in response to changes in the economy. Central banks normally have a mandate to ensure price stability, which in most cases means targeting a core inflation rate of around 2%. If inflation falls below target the central bank may cut base lending rates, with a view to stimulating lending and boosting the economy. If inflation rises substantially above 2% it normally results in the central bank raising base lending rates in an attempt to lower inflation.
Higher interest rates generally help strengthen a country’s currency as they make it a more attractive place for global investors to park their money.
Higher interest rates overall weigh on the price of Gold because they increase the opportunity cost of holding Gold instead of investing in an interest-bearing asset or placing cash in the bank. If interest rates are high that usually pushes up the price of the US Dollar (USD), and since Gold is priced in Dollars, this has the effect of lowering the price of Gold.
The Fed funds rate is the overnight rate at which US banks lend to each other. It is the oft-quoted headline rate set by the Federal Reserve at its FOMC meetings. It is set as a range, for example 4.75%-5.00%, though the upper limit (in that case 5.00%) is the quoted figure. Market expectations for future Fed funds rate are tracked by the CME FedWatch tool, which shapes how many financial markets behave in anticipation of future Federal Reserve monetary policy decisions.
Gold prices rose in India on Wednesday, according to data compiled by FXStreet.
The price for Gold stood at 7,206.53 Indian Rupees (INR) per gram, up compared with the INR 7,195.18 it cost on Tuesday.
The price for Gold increased to INR 84,055.55 per tola from INR 83,923.16 per tola a day earlier.
| Unit measure | Gold Price in INR |
|---|---|
| 1 Gram | 7,206.53 |
| 10 Grams | 72,066.12 |
| Tola | 84,055.55 |
| Troy Ounce | 224,150.00 |
FXStreet calculates Gold prices in India by adapting international prices (USD/INR) to the local currency and measurement units. Prices are updated daily based on the market rates taken at the time of publication. Prices are just for reference and local rates could diverge slightly.
Gold FAQs
Gold has played a key role in human’s history as it has been widely used as a store of value and medium of exchange. Currently, apart from its shine and usage for jewelry, the precious metal is widely seen as a safe-haven asset, meaning that it is considered a good investment during turbulent times. Gold is also widely seen as a hedge against inflation and against depreciating currencies as it doesn’t rely on any specific issuer or government.
Central banks are the biggest Gold holders. In their aim to support their currencies in turbulent times, central banks tend to diversify their reserves and buy Gold to improve the perceived strength of the economy and the currency. High Gold reserves can be a source of trust for a country’s solvency. Central banks added 1,136 tonnes of Gold worth around $70 billion to their reserves in 2022, according to data from the World Gold Council. This is the highest yearly purchase since records began. Central banks from emerging economies such as China, India and Turkey are quickly increasing their Gold reserves.
Gold has an inverse correlation with the US Dollar and US Treasuries, which are both major reserve and safe-haven assets. When the Dollar depreciates, Gold tends to rise, enabling investors and central banks to diversify their assets in turbulent times. Gold is also inversely correlated with risk assets. A rally in the stock market tends to weaken Gold price, while sell-offs in riskier markets tend to favor the precious metal.
The price can move due to a wide range of factors. Geopolitical instability or fears of a deep recession can quickly make Gold price escalate due to its safe-haven status. As a yield-less asset, Gold tends to rise with lower interest rates, while higher cost of money usually weighs down on the yellow metal. Still, most moves depend on how the US Dollar (USD) behaves as the asset is priced in dollars (XAU/USD). A strong Dollar tends to keep the price of Gold controlled, whereas a weaker Dollar is likely to push Gold prices up.
(An automation tool was used in creating this post.)
- USD/CAD bulls remain on the defensive amid a modest USD pullback from a two-month top.
- Expectations for a less aggressive Fed policy easing to limit losses for the USD and the major.
- Bets for a larger BoC rate cut and weaker Crude Oil prices could also offer support to the pair.
The USD/CAD pair struggles to capitalize on a modest Asian session uptick on Wednesday and remains below its highest level since August 6, around the 1.3835-1.3840 region touched the previous day. Spot prices currently trade around the 1.3775 region, nearly unchanged for the day, though the fundamental backdrop supports prospects for an extension of the recent strong rally witnessed over the past three weeks or so.
The US Dollar (USD) eases from over a two-month high touched earlier this week and turns out to be a key factor acting as a headwind for the USD/CAD pair. That said, any meaningful USD corrective decline still seems elusive in the wake of firming expectations for a less aggressive policy easing by the Federal Reserve (Fed) and a regular 25 basis points (bps) interest rate cut in November. Apart from this, bets for a larger, 50 bps rate cut by the Bank of Canada, bolstered by softer domestic consumer inflation figures, might continue to weigh on the Canadian Dollar (CAD) and offer some support to the currency pair.
A report from Statistics Canada released on Tuesday showed that the headline Consumer Price Index (CPI) contracted by 0.4% in September and the yearly rate decelerated from 2.0% in August to 1.6%. This marks the smallest annual increase since February 2021 and raises hopes for a larger-than-usual BoC rate cut next week. Furthermore, a bearish sentiment around Crude Oil prices, led by easing fears of supply disruptions from the Middle East, could undermine the commodity-linked Loonie. This, in turn, validates the positive outlook for the USD/CAD pair and suggests that the path of least resistance remains to the upside.
Even from a technical perspective, the Relative Strength Index (RSI) eased from slightly overbought conditions on the daily chart and supports prospects for the emergence of some dip-buying at lower levels. Hence, it will be prudent to wait for strong follow-through selling before confirming that the USD/CAD pair has topped out in the near term and positioning for any meaningful corrective decline. Traders now look to the Canadian economic docket – featuring the release of Manufacturing Sales and Housing Starts. Apart from this, the USD and Crude Oil price dynamics should provide some impetus to the currency pair.
Canadian Dollar FAQs
The key factors driving the Canadian Dollar (CAD) are the level of interest rates set by the Bank of Canada (BoC), the price of Oil, Canada’s largest export, the health of its economy, inflation and the Trade Balance, which is the difference between the value of Canada’s exports versus its imports. Other factors include market sentiment – whether investors are taking on more risky assets (risk-on) or seeking safe-havens (risk-off) – with risk-on being CAD-positive. As its largest trading partner, the health of the US economy is also a key factor influencing the Canadian Dollar.
The Bank of Canada (BoC) has a significant influence on the Canadian Dollar by setting the level of interest rates that banks can lend to one another. This influences the level of interest rates for everyone. The main goal of the BoC is to maintain inflation at 1-3% by adjusting interest rates up or down. Relatively higher interest rates tend to be positive for the CAD. The Bank of Canada can also use quantitative easing and tightening to influence credit conditions, with the former CAD-negative and the latter CAD-positive.
The price of Oil is a key factor impacting the value of the Canadian Dollar. Petroleum is Canada’s biggest export, so Oil price tends to have an immediate impact on the CAD value. Generally, if Oil price rises CAD also goes up, as aggregate demand for the currency increases. The opposite is the case if the price of Oil falls. Higher Oil prices also tend to result in a greater likelihood of a positive Trade Balance, which is also supportive of the CAD.
While inflation had always traditionally been thought of as a negative factor for a currency since it lowers the value of money, the opposite has actually been the case in modern times with the relaxation of cross-border capital controls. Higher inflation tends to lead central banks to put up interest rates which attracts more capital inflows from global investors seeking a lucrative place to keep their money. This increases demand for the local currency, which in Canada’s case is the Canadian Dollar.
Macroeconomic data releases gauge the health of the economy and can have an impact on the Canadian Dollar. Indicators such as GDP, Manufacturing and Services PMIs, employment, and consumer sentiment surveys can all influence the direction of the CAD. A strong economy is good for the Canadian Dollar. Not only does it attract more foreign investment but it may encourage the Bank of Canada to put up interest rates, leading to a stronger currency. If economic data is weak, however, the CAD is likely to fall.
- Gold price attracts some haven flows amid the risk-off mood and Middle East tensions.
- A modest USD downtick further benefits the XUA/USD, though the upside seems limited.
- Bets for smaller rate cuts by the Fed should limit the USD losses and cap the yellow metal.
Gold price (XAU/USD) edges higher for the second straight day on Wednesday – also marking the fourth day of a positive move in the previous five – and touches a one-and-half-week high, around the $2,670 region during the Asian session. Retreating US Treasury bond yields drags the US Dollar (USD) away from over a two-month peak touched earlier this week and turns out to be a key factor underpinning the commodity. Furthermore, a turnaround in the global risk sentiment – as depicted by a weaker tone across the global equity markets – drives some haven flows towards the precious metal amid persistent geopolitical risks.
Adding to this, elevated demand from central banks offers additional support to the Gold price. That said, firming expectations for a less aggressive policy easing by the Federal Reserve (Fed) and bets for a regular 25 basis points (bps) rate cut in November should limit any meaningful USD corrective decline. This, in turn, might hold back bulls from placing fresh bets around the non-yielding yellow metal. Moreover, reports that Israel will refrain from targeting Iran's oil and nuclear sites might contribute to capping gains for the XAU/USD, warranting some caution before positioning for any further near-term appreciating move.
Daily Digest Market Movers: Gold price benefits from softer risk tone, modest USD downtick
- US Treasury bond yields fell for a second day on Tuesday as traders reacted to weaker-than-expected manufacturing data and easing inflation risks on the back of fall oil prices, boosting demand for the non-yielding Gold price.
- The New York Federal Reserve's Empire State Manufacturing Index fell following a surge to a 29-month high in September, to -11.9 in October, marking the weakest reading since May and indicating deteriorating conditions.
- Easing fears of a supply disruption, along with a weaker demand outlook, drag Crude Oil prices to a two-week low, which is expected to reduce inflationary pressures and allow the US central bank to cut interest rates further.
- The markets, however, are pricing in a greater possibility of a smaller interest rate cut at the next FOMC policy meeting in November, which should underpin the US Dollar and keep a lid on any further gains for the XAU/USD.
- Meanwhile, San Francisco Fed President Mary Daly noted on Tuesday that the US central bank has made significant progress on tamping down inflation and sees one or two more rate cuts this year if economic forecasts are met.
- Separately, Atlanta Fed President Raphael Bostic said that he doesn't see strong signs of a potential recession looming over the horizon as the US economy continues to perform well and that the inflation is heading back to 2%.
- On Tuesday, Israeli Prime Minister Benjamin Netanyahu rejected the idea of a ceasefire in Lebanon, while the militant group Hezbollah threatened to widen its attacks, raising the risk of a further escalation of the conflict.
- The Biden administration has warned Israel that it faces possible punishment, including the potential stopping of US weapons transfers if it does not take immediate action to let more humanitarian aid into Gaza.
- The market attention will be on the US economic releases – Monthly Retail Sales, Industrial Production, and the usual Weekly Initial Jobless Claims – and the Chinese macro data dump due later this week.
Technical Outlook: Gold price seems poised to surpass the all-time peak and conquer $2,700
From a technical perspective, any subsequent move up is likely to confront some resistance near the $2,685-2,686 region, or the
all-time peak touched in September. This is closely followed by the $2,700 round-figure mark, which if cleared decisively will set the stage for an extension of a well-established multi-month-old uptrend amid positive oscillators on the daily chart.
On the flip side, immediate support is pegged near the $2,650 area, below which the Gold price could slide to the $2,632-2,630 region. Any further decline is likely to attract some buyers and remain limited near the $2,600 round-figure mark. The latter should act as a key pivotal point, which if broken decisively might prompt some technical selling and pave the way for deeper losses.
Gold FAQs
Gold has played a key role in human’s history as it has been widely used as a store of value and medium of exchange. Currently, apart from its shine and usage for jewelry, the precious metal is widely seen as a safe-haven asset, meaning that it is considered a good investment during turbulent times. Gold is also widely seen as a hedge against inflation and against depreciating currencies as it doesn’t rely on any specific issuer or government.
Central banks are the biggest Gold holders. In their aim to support their currencies in turbulent times, central banks tend to diversify their reserves and buy Gold to improve the perceived strength of the economy and the currency. High Gold reserves can be a source of trust for a country’s solvency. Central banks added 1,136 tonnes of Gold worth around $70 billion to their reserves in 2022, according to data from the World Gold Council. This is the highest yearly purchase since records began. Central banks from emerging economies such as China, India and Turkey are quickly increasing their Gold reserves.
Gold has an inverse correlation with the US Dollar and US Treasuries, which are both major reserve and safe-haven assets. When the Dollar depreciates, Gold tends to rise, enabling investors and central banks to diversify their assets in turbulent times. Gold is also inversely correlated with risk assets. A rally in the stock market tends to weaken Gold price, while sell-offs in riskier markets tend to favor the precious metal.
The price can move due to a wide range of factors. Geopolitical instability or fears of a deep recession can quickly make Gold price escalate due to its safe-haven status. As a yield-less asset, Gold tends to rise with lower interest rates, while higher cost of money usually weighs down on the yellow metal. Still, most moves depend on how the US Dollar (USD) behaves as the asset is priced in dollars (XAU/USD). A strong Dollar tends to keep the price of Gold controlled, whereas a weaker Dollar is likely to push Gold prices up.
- The Indian Rupee faces challenges due to foreign exchange outflows.
- India’s annual inflation rose to a nine-month high of 5.49% in September, dampening the likelihood of RBI’s rate cuts.
- The downside of the INR could be restrained due to falling Oil prices, as India is world's third-largest Oil importer.
The USD/INR pair remains near its all-time high at 84.14 as the Indian Rupee (INR) grapples with challenges stemming from foreign exchange outflows. This situation arises as traders evaluate the policy outlook for the Reserve Bank of India (RBI) in light of the recent inflation data from India.
India’s Consumer Price Index (CPI) rose to a nine-month high of 5.49% year-over-year in September, up from 3.65% in the previous month and well above market expectations of 5.0%. This increase represents the highest inflation rate recorded this year, surpassing the Reserve Bank of India’s (RBI) target of 4%. As a result, expectations for earlier rate cuts by the RBI have been tempered.
The Indian Rupee may receive support from falling Oil prices, given that India is the world's third-largest Oil importer. Crude Oil prices are facing downward pressure due to concerns about global demand, which have outweighed the impact of supply worries related to the ongoing uncertainty in the Middle East conflict.
West Texas Intermediate (WTI) Oil price extends its losing streak for the fourth successive session, trading around $70.30 per barrel, at the time of writing.
Daily Digest Market Movers: Indian Rupee struggles due to foreign exchange outflows
- The US Dollar (USD) continues to strengthen, bolstered by strong employment and Consumer Price Index (CPI) data that have lowered expectations for aggressive easing by the Federal Reserve (Fed). Markets are now projecting a total of 125 basis points in rate cuts over the next 12 months.
- According to the CME FedWatch Tool, there is currently a 94.1% probability of a 25-basis-point rate cut in November, with no expectation of a larger 50-basis-point reduction.
- On Tuesday, Federal Reserve Bank of Atlanta President Raphael Bostic stated that he anticipates just one more interest rate cut of 25 basis points this year, as reflected in his projections during last month's US central bank meeting. "The median forecast was for 50 basis points beyond the 50 basis points already implemented in September, according to Reuters.
- On Monday, Foreign institutional investors sold a net total of 37.32 billion rupees ($444 million) in stocks, marking their eleventh consecutive session of net selling. In contrast, domestic investors net purchased shares valued at 22.78 billion rupees, per Reuters.
- The Washington Post reported on Monday that Israeli Prime Minister Benjamin Netanyahu informed the United States (US) that Israel plans to focus on Iranian military targets rather than nuclear or Oil infrastructure.
- Federal Reserve (Fed) Bank of Minneapolis President Neel Kashkari reassured markets late on Monday by reaffirming the Fed's data-dependent approach. Kashkari reiterated familiar Fed policymaker views on the strength of the US economy, noting continued easing of inflationary pressures and a robust labor market, despite a recent uptick in the overall unemployment rate, per Reuters.
Technical Analysis: USD/INR holds position above 84.00, close to all-time highs
The USD/INR pair hovers around 84.00 on Wednesday. Analyzing the daily chart shows that the pair is testing the lower boundary of an ascending channel pattern. If it breaks below this channel, it could indicate a potential shift away from the current bullish sentiment. However, the 14-day Relative Strength Index (RSI) remains above the 50 level, which suggests that bullish momentum is still intact.
In terms of resistance, the USD/INR pair may encounter a barrier at its all-time high of 84.14, recorded on August 5. A breakthrough above this level could push the pair toward the upper boundary of the ascending channel, estimated at around 84.35.
On the downside, if the pair breaks below the immediate support at the psychological level of 84.00, it may target the nine-day Exponential Moving Average (EMA) at approximately 83.97.
USD/INR: Daily Chart
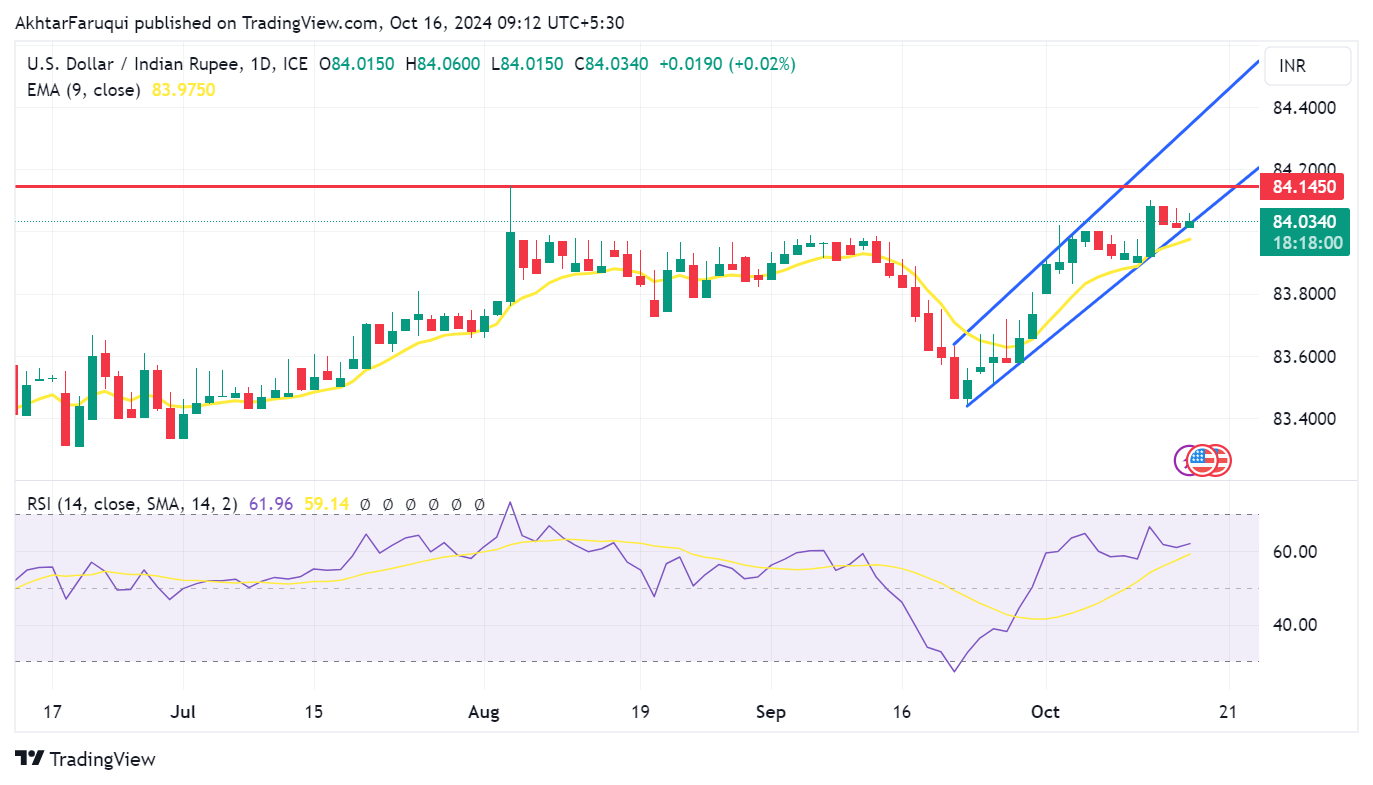
Indian Rupee FAQs
The Indian Rupee (INR) is one of the most sensitive currencies to external factors. The price of Crude Oil (the country is highly dependent on imported Oil), the value of the US Dollar – most trade is conducted in USD – and the level of foreign investment, are all influential. Direct intervention by the Reserve Bank of India (RBI) in FX markets to keep the exchange rate stable, as well as the level of interest rates set by the RBI, are further major influencing factors on the Rupee.
The Reserve Bank of India (RBI) actively intervenes in forex markets to maintain a stable exchange rate, to help facilitate trade. In addition, the RBI tries to maintain the inflation rate at its 4% target by adjusting interest rates. Higher interest rates usually strengthen the Rupee. This is due to the role of the ‘carry trade’ in which investors borrow in countries with lower interest rates so as to place their money in countries’ offering relatively higher interest rates and profit from the difference.
Macroeconomic factors that influence the value of the Rupee include inflation, interest rates, the economic growth rate (GDP), the balance of trade, and inflows from foreign investment. A higher growth rate can lead to more overseas investment, pushing up demand for the Rupee. A less negative balance of trade will eventually lead to a stronger Rupee. Higher interest rates, especially real rates (interest rates less inflation) are also positive for the Rupee. A risk-on environment can lead to greater inflows of Foreign Direct and Indirect Investment (FDI and FII), which also benefit the Rupee.
Higher inflation, particularly, if it is comparatively higher than India’s peers, is generally negative for the currency as it reflects devaluation through oversupply. Inflation also increases the cost of exports, leading to more Rupees being sold to purchase foreign imports, which is Rupee-negative. At the same time, higher inflation usually leads to the Reserve Bank of India (RBI) raising interest rates and this can be positive for the Rupee, due to increased demand from international investors. The opposite effect is true of lower inflation.
- NZD/USD falls to a two-month low of 0.6039 following the inflation data release on Wednesday.
- New Zealand's CPI rose 2.2% YoY in the September quarter, falling within the RBNZ target range of 1% to 3%.
- Atlanta Fed President Raphael Bostic anticipates just one more interest rate cut of 25 basis points in 2024.
NZD/USD experiences a decline for the second consecutive day, trading around 0.6060 during Asian trading hours. The pair hit a two-month low of 0.6039 after the latest data showed that inflation in New Zealand has slowed to its lowest level in over three years.
In the September quarter, New Zealand's Consumer Price Index (CPI) rose 2.2% year-over-year, down from a 3.3% annual increase in the previous quarter. The CPI increased by 0.6% quarter-over-quarter in September, compared to a 0.4% rise in the June quarter, according to figures released by Stats NZ.
Nicola Growden, the consumer prices manager at Stats NZ, noted, “For the first time since March 2021, annual inflation is within the Reserve Bank of New Zealand’s (RBNZ) target range of 1% to 3%. Prices are still increasing but at a slower rate than before.”
The US Dollar (USD) receives support, bolstered by strong jobs reports and inflation data that have reduced expectations for aggressive easing by the Federal Reserve (Fed). As a result, markets are now forecasting a total of 125 basis points in rate cuts over the next year.
According to the CME FedWatch Tool, there is currently a 94.1% probability of a 25-basis-point rate cut in November, with no expectation of a larger 50-basis-point reduction.
On Tuesday, Federal Reserve Bank of Atlanta President Raphael Bostic stated that he anticipates just one more interest rate cut of 25 basis points this year, as reflected in his projections during last month's US central bank meeting. "The median forecast was for 50 basis points beyond the 50 basis points already implemented in September, according to Reuters.
Economic Indicator
Consumer Price Index (YoY)
The Consumer Price Index (CPI), released by Statistics New Zealand on a quarterly basis, measures changes in the price of goods and services bought by New Zealand households.The CPI is a key indicator to measure inflation and changes in purchasing trends. The YoY reading compares prices in the reference quarter to the same quarter a year earlier. A high reading is seen as bullish for the New Zealand Dollar (NZD), while a low reading is seen as bearish.
Read more.Last release: Tue Oct 15, 2024 21:45
Frequency: Quarterly
Actual: 2.2%
Consensus: 2.2%
Previous: 3.3%
Source: Stats NZ
With the Reserve Bank of New Zealand's (RBNZ) inflation target being around the midpoint of 2%, Statistics New Zealand’s quarterly Consumer Price Index (CPI) publication is of high significance. The trend in consumer prices tends to influence RBNZ’s interest rates decision, which in turn, heavily impacts the NZD valuation. Acceleration in inflation could lead to faster tightening of the rates by the RBNZ and vice-versa. Actual figures beating forecasts render NZD bullish.
| Raw materials | Closed | Change, % |
|---|---|---|
| Silver | 31.488 | 0.85 |
| Gold | 266.247 | 0.5 |
| Palladium | 1012.48 | -1.46 |
- WTI remains on the back foot near a two-week low and is pressured by a combination of factors.
- Easing fears of supply disruptions and demand concerns continue to weigh on the black liquid.
- Bets for smaller Fed rate cuts underpin the USD and support prospects for a further downfall.
West Texas Intermediate (WTI) US Crude Oil prices struggle to capitalize on the overnight modest bounce from the $69.25 area, or a two-week low and attract some sellers during the Asian session on Wednesday. The commodity currently trades around the $70.25 region, down 0.30% for the day, and seems vulnerable to decline further.
Despite worries about an escalation of conflict in the Middle East, reports that Israel would not strike Iranian nuclear and oil sites eased fears of a supply disruption. This comes on top of a fall in China's oil imports for the fifth straight month raised concerns about weak demand in the world's top importer. Adding to this, OPEC lowered its forecast for global oil demand growth in 2024 and 2025 and in turn, validates the negative outlook for Crude Oil prices.
Meanwhile, the US Dollar (USD) stands tall near its highest level since August 8 amid firming expectations for a less aggressive policy easing by the Federal Reserve (Fed) and bets for a regular 25 basis points (bps) interest rate cut in November. A stronger buck tends to undermine demand for USD-denominated commodities and supports prospects for an extension of the recent fall from the vicinity of the $78.00 mark, or the monthly peak touched last week.
WTI Oil FAQs
WTI Oil is a type of Crude Oil sold on international markets. The WTI stands for West Texas Intermediate, one of three major types including Brent and Dubai Crude. WTI is also referred to as “light” and “sweet” because of its relatively low gravity and sulfur content respectively. It is considered a high quality Oil that is easily refined. It is sourced in the United States and distributed via the Cushing hub, which is considered “The Pipeline Crossroads of the World”. It is a benchmark for the Oil market and WTI price is frequently quoted in the media.
Like all assets, supply and demand are the key drivers of WTI Oil price. As such, global growth can be a driver of increased demand and vice versa for weak global growth. Political instability, wars, and sanctions can disrupt supply and impact prices. The decisions of OPEC, a group of major Oil-producing countries, is another key driver of price. The value of the US Dollar influences the price of WTI Crude Oil, since Oil is predominantly traded in US Dollars, thus a weaker US Dollar can make Oil more affordable and vice versa.
The weekly Oil inventory reports published by the American Petroleum Institute (API) and the Energy Information Agency (EIA) impact the price of WTI Oil. Changes in inventories reflect fluctuating supply and demand. If the data shows a drop in inventories it can indicate increased demand, pushing up Oil price. Higher inventories can reflect increased supply, pushing down prices. API’s report is published every Tuesday and EIA’s the day after. Their results are usually similar, falling within 1% of each other 75% of the time. The EIA data is considered more reliable, since it is a government agency.
OPEC (Organization of the Petroleum Exporting Countries) is a group of 12 Oil-producing nations who collectively decide production quotas for member countries at twice-yearly meetings. Their decisions often impact WTI Oil prices. When OPEC decides to lower quotas, it can tighten supply, pushing up Oil prices. When OPEC increases production, it has the opposite effect. OPEC+ refers to an expanded group that includes ten extra non-OPEC members, the most notable of which is Russia.
- United Kingdom’s Office for National Statistics will release the CPI report on Wednesday.
- The annual UK headline and core inflation are expected to ease in September.
- The UK CPI data could seal in a BoE November interest-rate cut, a scenario that would weigh on Pound Sterling.
The United Kingdom’s (UK) Office for National Statistics (ONS) will release the highly anticipated Consumer Price Index (CPI) data for September on Wednesday at 06:00 GMT.
The UK CPI inflation report could affirm expectations of 25 basis points (bps) interest-rate cut by the Bank of England (BoE) in November, injecting a fresh bout of volatility into the Pound Sterling.
What to expect from the next UK inflation report?
The UK annual Consumer Price Index is likely to increase by 1.9% in September, sharply slowing down from August’s 2.2% growth while moving back below the BoE’s 2.0% target.
The core CPI inflation is set to ease to 3.4% YoY in September from 3.6% in August.
Official data is expected to show that services inflation fell to 5.2% in September from 5.6% the prior month, according to a Bloomberg survey of economists.
The BoE projected the annual headline CPI at 2.1% and services CPI at 5.5% for September.
Meanwhile, the British monthly CPI is seen rising 0.2% in the same period, as against the previous increase of 0.3%.
Previewing the UK inflation data, TD Securities (TDS) analysts noted: “We look for UK inflation to continue its steady march downward. But rapidly falling energy prices still heavily distort the headline number, and services inflation is likely to remain above 5.0% YoY (TDS: 5.2%, mkt: 5.3%), leaving core well above a range the MPC is comfortable with.”
“Hotel and airfare prices remain key sources of volatility in the month,” the TDS analysts said.
How will the UK Consumer Price Index report affect GBP/USD?
Heading into the UK CPI event risk, Pound Sterling traders weigh in on the odds of the BoE rate cut next month, especially after the contradictory messages from BoE policymakers earlier in October.
BoE Chief Economist Huw Pill said that there is “ample reason for caution in assessing the dissipation of inflation persistence,” adding that the “need for such caution points to a gradual withdrawal of monetary policy restriction.” Just a day before Pill’s appearance, Governor Andrew Bailey noted that the UK central bank “could become a bit more activist on rate cuts if there’s further good news on inflation.”
Therefore, the UK CPI data could help confirm whether the BoE will resume its rate-cutting cycle after pausing in September.
An upside surprise to the headline and core inflation data would likely douse the market’s expectations of a rate cut next month, lifting the Pound Sterling. In such a case, GBP/USD could stage a decisive comeback from multi-week troughs.
Conversely, the GBP/USD downtrend could extend if the UK CPI readings meet forecasts or come in softer-than-expectations. Thus, the UK central bank’s progress on disinflation could confirm another rate reduction in November, throwing the British Pound under the bus.
Dhwani Mehta, Asian Session Lead Analyst at FXStreet, offers a brief technical outlook for the major and explains: “GBP/USD has entered a downside consolidative mode in the countdown to the UK CPI data release. The 14-day Relative Strength Index (RSI) holds near 40, suggesting that more losses remain in the offing.”
Dhwani adds: “The pair needs to find acceptance above the 50-day Simple Moving Average (SMA) at 1.3115 on a daily closing basis to negate the near-term bearish bias. The next upside targets are seen at the October 4 high at 1.3175 and the 21-day SMA at 1.3215. Alternatively, the immediate support is aligned at the 100-day SMA at 1.2950, below which the March 8 high of 1.2894 could be tested.”
Economic Indicator
Consumer Price Index (YoY)
The United Kingdom (UK) Consumer Price Index (CPI), released by the Office for National Statistics on a monthly basis, is a measure of consumer price inflation – the rate at which the prices of goods and services bought by households rise or fall – produced to international standards. It is the inflation measure used in the government’s target. The YoY reading compares prices in the reference month to a year earlier. Generally, a high reading is seen as bullish for the Pound Sterling (GBP), while a low reading is seen as bearish.
Read more.Next release: Wed Oct 16, 2024 06:00
Frequency: Monthly
Consensus: 1.9%
Previous: 2.2%
Source: Office for National Statistics
The Bank of England is tasked with keeping inflation, as measured by the headline Consumer Price Index (CPI) at around 2%, giving the monthly release its importance. An increase in inflation implies a quicker and sooner increase of interest rates or the reduction of bond-buying by the BOE, which means squeezing the supply of pounds. Conversely, a drop in the pace of price rises indicates looser monetary policy. A higher-than-expected result tends to be GBP bullish.
Inflation FAQs
Inflation measures the rise in the price of a representative basket of goods and services. Headline inflation is usually expressed as a percentage change on a month-on-month (MoM) and year-on-year (YoY) basis. Core inflation excludes more volatile elements such as food and fuel which can fluctuate because of geopolitical and seasonal factors. Core inflation is the figure economists focus on and is the level targeted by central banks, which are mandated to keep inflation at a manageable level, usually around 2%.
The Consumer Price Index (CPI) measures the change in prices of a basket of goods and services over a period of time. It is usually expressed as a percentage change on a month-on-month (MoM) and year-on-year (YoY) basis. Core CPI is the figure targeted by central banks as it excludes volatile food and fuel inputs. When Core CPI rises above 2% it usually results in higher interest rates and vice versa when it falls below 2%. Since higher interest rates are positive for a currency, higher inflation usually results in a stronger currency. The opposite is true when inflation falls.
Although it may seem counter-intuitive, high inflation in a country pushes up the value of its currency and vice versa for lower inflation. This is because the central bank will normally raise interest rates to combat the higher inflation, which attract more global capital inflows from investors looking for a lucrative place to park their money.
Formerly, Gold was the asset investors turned to in times of high inflation because it preserved its value, and whilst investors will often still buy Gold for its safe-haven properties in times of extreme market turmoil, this is not the case most of the time. This is because when inflation is high, central banks will put up interest rates to combat it. Higher interest rates are negative for Gold because they increase the opportunity-cost of holding Gold vis-a-vis an interest-bearing asset or placing the money in a cash deposit account. On the flipside, lower inflation tends to be positive for Gold as it brings interest rates down, making the bright metal a more viable investment alternative.
The Reserve Bank of New Zealand (RBNZ) released its Sectoral Factor Model Inflation gauge for the third quarter of 2024, following the release of the official Consumer Price Index (CPI) by the NZ Stats early Wednesday.
The inflation measure continues to fall, arriving at 3.4% YoY in Q3 2024 vs. 3.6% in Q2.
The inflation measures are closely watched by the RBNZ, which has a monetary policy goal of achieving 1% to 3% inflation.
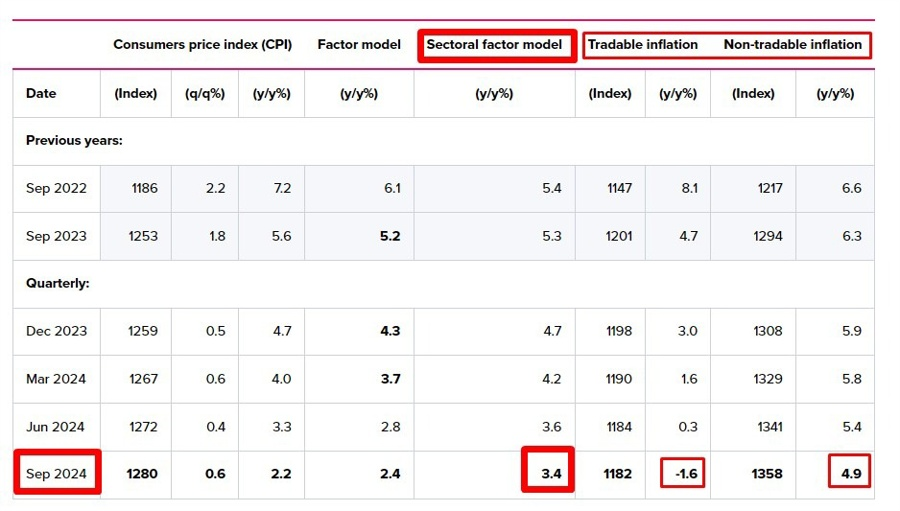
Data released by NZ Stats showed Wednesday that New Zealand’s annual Consumer Price Index (CPI) rose 2.2% in Q3, a sharp slowdown from the 3.3% growth in Q2. The market forecast was for +2.2%. Meanwhile, CPI inflation edged higher to 0.6% QoQ in Q3 versus 0.4% in Q2 and 0.7% expected.
FX implications
The Kiwi Dollar remains under heavy selling pressure after the RBNZ’s inflation data. At the time of writing, NZD/USD is down 0.33% on the day to trade at 0.6062.
About the RBNZ Sectoral Factor Model Inflation
The Reserve Bank of New Zealand has a set of models that produce core inflation estimates. The sectoral factor model estimates a measure of core inflation based on co-movements - the extent to which individual price series move together. It takes a sectoral approach, estimating core inflation based on two sets of prices: prices of tradable items, which are those either imported or exposed to international competition, and prices of non-tradable items, which are those produced domestically and not facing competition from imports.
- The Japanese Yen attracts some haven flows, though it lacks bullish conviction.
- The BoJ rate-hike uncertainty and disappointing data cap the upside for the JPY.
- Smaller Fed rate cut bets underpin the USD and offer some support to USD/JPY.
The Japanese Yen (JPY) strengthened against its American counterpart on Tuesday and reversed a major part of the previous day's losses to the lowest level since early August. The overnight downfall in the US equity markets, along with persistent geopolitical risks, turned out to be key factors that drove flows towards the safe-haven JPY. That said, the uncertainty over the Bank of Japan's (BoJ) rate-hike plans keeps a lid on any meaningful appreciating move.
Adding to this, the disappointing release of Japan's Core Machinery Orders for August contributes to capping the JPY during the Asian session on Wednesday. Meanwhile, the US Dollar (USD) stands firm near its highest level in more than two months amid expectations that the Federal Reserve (Fed) will proceed with modest interest rate cuts over the next year. This further assists the USD/JPY pair to hold steady around the 149.00 mark and warrants caution for the JPY bulls.
Daily Digest Market Movers: Japanese Yen bulls seem non-committed amid doubts over BoJ’s rate hike plans
- The Japanese Yen struggles to capitalize on the previous day's recovery against the US Dollar, from its lowest level since early August, amid doubts over when the Bank of Japan would raise interest rates again.
- A significant dovish shift in rhetoric from the BoJ Governor Kazuo Ueda and a surprising opposition to further rate hikes from Japan's Prime Minister Shigeru Ishiba fueled uncertainty around the monetary policy.
- Government data showed this Wednesday that Japan's Core Machinery Orders fell for the second straight month, by 1.9% in August, missing estimates by a big margin and signaling deterioration in demand.
- Given that manufacturing represents about 15% of Japan’s workforce, weaker orders may affect the labor market, resulting in slower wage growth, reduced consumer spending and complicating BoJ's rate-hike plans.
- The US Dollar consolidates near its highest level since August 8 amid firming expectations for a less aggressive policy easing by the Federal Reserve and bets for a regular 25 basis points interest rate cut in November.
- San Francisco Fed President Mary Daly noted on Tuesday that the US central bank has made significant progress on tamping down inflation and sees one or two more rate cuts this year if economic forecasts are met.
- Atlanta Fed President Raphael Bostic said that he doesn't see strong signs of a potential recession looming over the horizon as the US economy continues to perform well and that the inflation is heading back to 2%.
- The Biden administration has warned Israel that it faces possible punishment, including the potential stopping of US weapons transfers if it does not take immediate action to let more humanitarian aid into Gaza.
Technical Outlook: USD/JPY could accelerate the fall once the 148.60-148.55 support is broken decisively
From a technical perspective, any further decline is likely to find decent support near the 148.60-148.55 region. Some follow-through selling, however, could make the USD/JPY pair vulnerable to weaken further below the 148.00 round figure and test last week's swing low, around the 147.35 area. The latter is followed by the 147.00 mark, which if broken decisively will suggest that the recent move-up witnessed over the past month or so has run its course and pave the way for deeper losses.
On the flip side, the 150.00 psychological mark seems to act as an immediate strong barrier, above which the USD/JPY pair could accelerate the positive move towards the August monthly swing high, around the 150.85-150.90 region. Some follow-through buying beyond the 151.00 mark will be seen as a fresh trigger for bullish traders and lift spot prices to the 152.00 neighborhood en route to the 152.65-152.70 region.
Japanese Yen FAQs
The Japanese Yen (JPY) is one of the world’s most traded currencies. Its value is broadly determined by the performance of the Japanese economy, but more specifically by the Bank of Japan’s policy, the differential between Japanese and US bond yields, or risk sentiment among traders, among other factors.
One of the Bank of Japan’s mandates is currency control, so its moves are key for the Yen. The BoJ has directly intervened in currency markets sometimes, generally to lower the value of the Yen, although it refrains from doing it often due to political concerns of its main trading partners. The BoJ ultra-loose monetary policy between 2013 and 2024 caused the Yen to depreciate against its main currency peers due to an increasing policy divergence between the Bank of Japan and other main central banks. More recently, the gradually unwinding of this ultra-loose policy has given some support to the Yen.
Over the last decade, the BoJ’s stance of sticking to ultra-loose monetary policy has led to a widening policy divergence with other central banks, particularly with the US Federal Reserve. This supported a widening of the differential between the 10-year US and Japanese bonds, which favored the US Dollar against the Japanese Yen. The BoJ decision in 2024 to gradually abandon the ultra-loose policy, coupled with interest-rate cuts in other major central banks, is narrowing this differential.
The Japanese Yen is often seen as a safe-haven investment. This means that in times of market stress, investors are more likely to put their money in the Japanese currency due to its supposed reliability and stability. Turbulent times are likely to strengthen the Yen’s value against other currencies seen as more risky to invest in.
Bank of Japan (BoJ) board member Seiji Adachi said on Wednesday that “if inflation moves sustainably, stably around 2%, the BoJ can guide monetary policy in a way allowing for policy rate to move roughly in line with neutral rate.”
Additional quotes
If chance of underlying inflation exceeding 2% heightens, the BoJ will raise its policy rate at pace exceeding rate of inflation.
Given uncertainty over outlook, cannot project specific level of neutral rate.
Consumption moving in line with trend projected by the BoJ.
Output, exports and capex firm but corporate sector appears to be lacking momentum.
Cannot ignore overseas economic uncertainties for time being.
Reversal of Yen weakness may intensify, put downward pressure on consumer inflation.
I am somewhat cautious on whether firms will continue sufficient wage hikes next year.
Given global uncertainties, we must scrutinize developments in next year's wage talks.
Key to next year's wage development is corporate profits, whether external demand and capex have room to expand further.
Market reaction
USD/JPY was last seen trading at 149.05, down 0.09% on the day, as the Japanese Yeb draws some support from these comments.
- The Australian Dollar extends its losing streak due to economic woes in China.
- RBA’s Hunter indicated that although inflation expectations remain anchored, persistent price growth continues to present challenges for the central bank.
- The US Dollar appreciates as strong jobs and inflation data have reduced the odds for aggressive easing by the Fed.
The Australian Dollar (AUD) extends its losing streak for the third consecutive day against the US Dollar (USD) on Wednesday, despite hawkish comments from Reserve Bank of Australia (RBA) Deputy Governor Sarah Hunter.
RBA’s Hunter reaffirmed the Australian central bank’s commitment to controlling inflation, noting that while inflation expectations remain anchored, persistent price growth continues to pose challenges.
The Aussie Dollar is facing downward pressure due to economic uncertainty in its largest trading partner, China. Furthermore, China's recently announced fiscal stimulus plan did little to lift market sentiment, as investors remain uncertain about the scale and impact of the package.
The US Dollar (USD) continues to gain support as robust jobs and Consumer Price Index (CPI) data have dampened expectations of aggressive Federal Reserve (Fed) easing. Markets are now anticipating a total of 125 basis points in rate cuts over the next 12 months.
Daily Digest Market Movers: Australian Dollar struggles due to economic uncertainty in China
- According to the CME FedWatch Tool, there is currently a 94.1% probability of a 25-basis-point rate cut in November, with no expectation of a larger 50-basis-point reduction.
- The Westpac Leading Index in Australia remained unchanged in September on a month-over-month basis, marking the sixth consecutive month of stagnation.
- On Tuesday, Federal Reserve Bank of Atlanta President Raphael Bostic stated that he anticipates just one more interest rate cut of 25 basis points this year, as reflected in his projections during last month's US central bank meeting. "The median forecast was for 50 basis points beyond the 50 basis points already implemented in September. My projection was for an additional 25 basis points," he said, according to Reuters.
- The Australian weekly survey of Consumer Confidence showed little movement, with the ANZ-Roy Morgan Consumer Confidence index remaining steady at 83.4 this week. Despite the unchanged figure, the longer-term trend shows that Consumer Confidence has been below the 85.0 mark for a record 89 consecutive weeks. The current reading is 1.3 points higher than the 2024 weekly average of 82.1.
- Federal Reserve (Fed) Bank of Minneapolis President Neel Kashkari reassured markets late on Monday by reaffirming the Fed's data-dependent approach. Kashkari reiterated familiar Fed policymaker views on the strength of the US economy, noting continued easing of inflationary pressures and a robust labor market, despite a recent uptick in the overall unemployment rate, per Reuters.
- The AUD might have received downward pressure from a detailed note from the Commonwealth Bank of Australia indicating expectations that the Reserve Bank of Australia (RBA) will implement a 25 basis point rate cut by the end of 2024. The report suggested that a stronger disinflationary trend than the RBA anticipates is essential for the Board to consider easing policy within this calendar year.
- China's military initiated drills on Monday in the Taiwan Strait and around Taiwan. A spokesperson for the US Department of State expressed serious concern regarding the People's Liberation Army's (PLA) military actions. In response, Taiwan's Defense Ministry stated, “We will not escalate conflict in our response.”
- The National Bureau of Statistics of China reported that the country's monthly Consumer Price Index (CPI) remained unchanged at 0% in September, down from August's 0.4% increase. The annual inflation rate rose by 0.4%, falling short of the anticipated 0.6%. Additionally, the Producer Price Index (PPI) decreased by 2.8% year-on-year, a larger drop than the previous decline of 1.8% and exceeding expectations of a 2.5% decrease.
Technical Analysis: Australian Dollar moves below 0.6700; 14-day RSI reinforces the ongoing bearish bias
The AUD/USD pair hovers around 0.6680 on Wednesday. Technical analysis of the daily chart indicates that the pair is moving downward along the upper boundary of a descending channel, signaling a bearish bias. The 14-day Relative Strength Index (RSI) also remains below the 50 level, reinforcing the ongoing bearish momentum.
On the downside, the AUD/USD pair may target its eight-week low of 0.6622, last seen on September 11. A break below this level could open the pair's door to test the descending channel's lower boundary near the psychological support level of 0.6600.
In terms of resistance, if the pair breaks above the upper boundary of the descending channel at 0.6720 level, it may face an initial barrier at the nine-day Exponential Moving Average (EMA) around 0.6738, followed by the key psychological resistance at 0.6800.
AUD/USD: Daily Chart
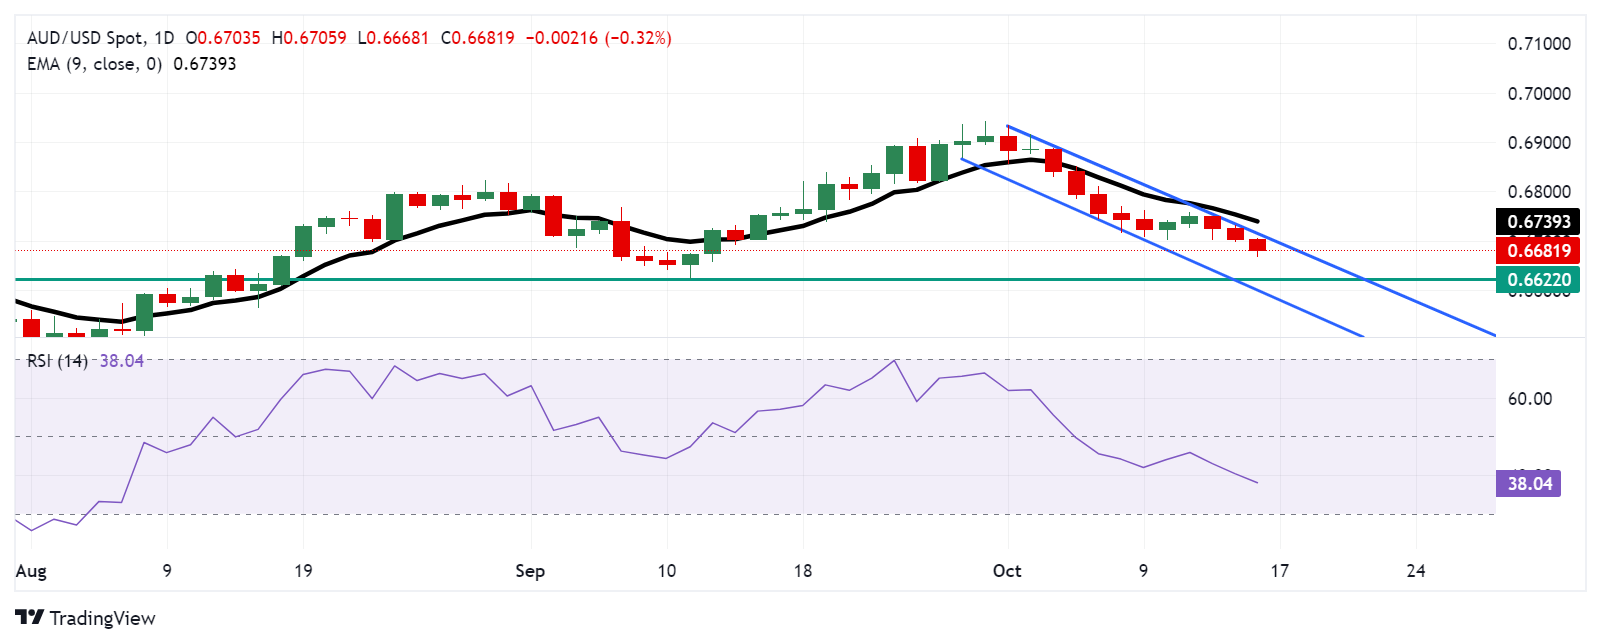
Australian Dollar PRICE Today
The table below shows the percentage change of Australian Dollar (AUD) against listed major currencies today. Australian Dollar was the weakest against the Japanese Yen.
| USD | EUR | GBP | JPY | CAD | AUD | NZD | CHF | |
|---|---|---|---|---|---|---|---|---|
| USD | 0.03% | 0.04% | -0.10% | 0.05% | 0.30% | 0.43% | -0.03% | |
| EUR | -0.03% | 0.02% | -0.11% | 0.04% | 0.28% | 0.43% | -0.09% | |
| GBP | -0.04% | -0.02% | -0.16% | 0.03% | 0.26% | 0.40% | -0.06% | |
| JPY | 0.10% | 0.11% | 0.16% | 0.17% | 0.41% | 0.54% | 0.11% | |
| CAD | -0.05% | -0.04% | -0.03% | -0.17% | 0.23% | 0.37% | -0.08% | |
| AUD | -0.30% | -0.28% | -0.26% | -0.41% | -0.23% | 0.14% | -0.32% | |
| NZD | -0.43% | -0.43% | -0.40% | -0.54% | -0.37% | -0.14% | -0.47% | |
| CHF | 0.03% | 0.09% | 0.06% | -0.11% | 0.08% | 0.32% | 0.47% |
The heat map shows percentage changes of major currencies against each other. The base currency is picked from the left column, while the quote currency is picked from the top row. For example, if you pick the Australian Dollar from the left column and move along the horizontal line to the US Dollar, the percentage change displayed in the box will represent AUD (base)/USD (quote).
Australian Dollar FAQs
One of the most significant factors for the Australian Dollar (AUD) is the level of interest rates set by the Reserve Bank of Australia (RBA). Because Australia is a resource-rich country another key driver is the price of its biggest export, Iron Ore. The health of the Chinese economy, its largest trading partner, is a factor, as well as inflation in Australia, its growth rate and Trade Balance. Market sentiment – whether investors are taking on more risky assets (risk-on) or seeking safe-havens (risk-off) – is also a factor, with risk-on positive for AUD.
The Reserve Bank of Australia (RBA) influences the Australian Dollar (AUD) by setting the level of interest rates that Australian banks can lend to each other. This influences the level of interest rates in the economy as a whole. The main goal of the RBA is to maintain a stable inflation rate of 2-3% by adjusting interest rates up or down. Relatively high interest rates compared to other major central banks support the AUD, and the opposite for relatively low. The RBA can also use quantitative easing and tightening to influence credit conditions, with the former AUD-negative and the latter AUD-positive.
China is Australia’s largest trading partner so the health of the Chinese economy is a major influence on the value of the Australian Dollar (AUD). When the Chinese economy is doing well it purchases more raw materials, goods and services from Australia, lifting demand for the AUD, and pushing up its value. The opposite is the case when the Chinese economy is not growing as fast as expected. Positive or negative surprises in Chinese growth data, therefore, often have a direct impact on the Australian Dollar and its pairs.
Iron Ore is Australia’s largest export, accounting for $118 billion a year according to data from 2021, with China as its primary destination. The price of Iron Ore, therefore, can be a driver of the Australian Dollar. Generally, if the price of Iron Ore rises, AUD also goes up, as aggregate demand for the currency increases. The opposite is the case if the price of Iron Ore falls. Higher Iron Ore prices also tend to result in a greater likelihood of a positive Trade Balance for Australia, which is also positive of the AUD.
The Trade Balance, which is the difference between what a country earns from its exports versus what it pays for its imports, is another factor that can influence the value of the Australian Dollar. If Australia produces highly sought after exports, then its currency will gain in value purely from the surplus demand created from foreign buyers seeking to purchase its exports versus what it spends to purchase imports. Therefore, a positive net Trade Balance strengthens the AUD, with the opposite effect if the Trade Balance is negative.
On Wednesday, the People’s Bank of China (PBoC) set the USD/CNY central rate for the trading session ahead at 7.1191, as compared to the previous day's fix of 7.0830 and 7.1208 Reuters estimates.
| Index | Change, points | Closed | Change, % |
|---|---|---|---|
| NIKKEI 225 | 304.75 | 39910.55 | 0.77 |
| Hang Seng | -774.08 | 20318.79 | -3.67 |
| KOSPI | 10.16 | 2633.45 | 0.39 |
| ASX 200 | 65.6 | 8318.4 | 0.79 |
| DAX | -22.1 | 19486.19 | -0.11 |
| CAC 40 | -80.09 | 7521.97 | -1.05 |
| Dow Jones | -324.8 | 42740.42 | -0.75 |
| S&P 500 | -44.59 | 5815.26 | -0.76 |
| NASDAQ Composite | -187.1 | 18315.59 | -1.01 |
| Pare | Closed | Change, % |
|---|---|---|
| AUDUSD | 0.67015 | -0.33 |
| EURJPY | 162.485 | -0.51 |
| EURUSD | 1.08921 | -0.12 |
| GBPJPY | 195.019 | -0.28 |
| GBPUSD | 1.30693 | 0.08 |
| NZDUSD | 0.60649 | -0.48 |
| USDCAD | 1.37726 | -0.17 |
| USDCHF | 0.86194 | -0.09 |
| USDJPY | 149.192 | -0.37 |


© 2000-2024. Sva prava zaštićena.
Sajt je vlasništvo kompanije Teletrade D.J. LLC 2351 LLC 2022 (Euro House, Richmond Hill Road, Kingstown, VC0100, St. Vincent and the Grenadines).
Svi podaci koji se nalaze na sajtu ne predstavljaju osnovu za donošenje investicionih odluka, već su informativnog karaktera.
The company does not serve or provide services to customers who are residents of the US, Canada, Iran, The Democratic People's Republic of Korea, Yemen and FATF blacklisted countries.
Izvršenje trgovinskih operacija sa finansijskim instrumentima upotrebom marginalne trgovine pruža velike mogućnosti i omogućava investitorima ostvarivanje visokih prihoda. Međutim, takav vid trgovine povezan je sa potencijalno visokim nivoom rizika od gubitka sredstava. Проведение торговых операций на финанcовых рынках c маржинальными финанcовыми инcтрументами открывает широкие возможноcти, и позволяет инвеcторам, готовым пойти на риcк, получать выcокую прибыль, но при этом неcет в cебе потенциально выcокий уровень риcка получения убытков. Iz tog razloga je pre započinjanja trgovine potrebno odlučiti o izboru odgovarajuće investicione strategije, uzimajući u obzir raspoložive resurse.
Upotreba informacija: U slučaju potpunog ili delimičnog preuzimanja i daljeg korišćenja materijala koji se nalazi na sajtu, potrebno je navesti link odgovarajuće stranice na sajtu kompanije TeleTrade-a kao izvora informacija. Upotreba materijala na internetu mora biti praćena hiper linkom do web stranice teletrade.org. Automatski uvoz materijala i informacija sa stranice je zabranjen.
Ako imate bilo kakvih pitanja, obratite nam se pr@teletrade.global.
транcфери