- Analiza
- Novosti i instrumenti
- Vesti sa tržišta
Forex-novosti i prognoze od 16-07-2019
| Time | Country | Event | Period | Previous value | Forecast |
|---|---|---|---|---|---|
| 00:30 | Australia | Leading Index | June | -0.1% | |
| 07:30 | Eurozone | ECB's Benoit Coeure Speaks | |||
| 08:30 | United Kingdom | Producer Price Index - Input (YoY) | June | 1.3% | 0.5% |
| 08:30 | United Kingdom | Producer Price Index - Input (MoM) | June | 0.0% | -0.8% |
| 08:30 | United Kingdom | Producer Price Index - Output (YoY) | June | 1.8% | 1.7% |
| 08:30 | United Kingdom | Producer Price Index - Output (MoM) | June | 0.3% | 0.1% |
| 08:30 | United Kingdom | Retail Price Index, m/m | June | 0.3% | 0.1% |
| 08:30 | United Kingdom | HICP ex EFAT, Y/Y | June | 1.7% | 1.8% |
| 08:30 | United Kingdom | Retail prices, Y/Y | June | 3% | 2.9% |
| 08:30 | United Kingdom | HICP, m/m | June | 0.3% | 0% |
| 08:30 | United Kingdom | HICP, Y/Y | June | 2% | 2% |
| 09:00 | Eurozone | Construction Output, y/y | May | 3.9% | 2.4% |
| 09:00 | Eurozone | Harmonized CPI | June | 0.1% | 0.1% |
| 09:00 | Eurozone | Harmonized CPI ex EFAT, Y/Y | June | 0.8% | 1.1% |
| 09:00 | Eurozone | Harmonized CPI, Y/Y | June | 1.2% | 1.2% |
| 10:00 | Germany | German Buba President Weidmann Speaks | |||
| 12:30 | Canada | Manufacturing Shipments (MoM) | May | -0.6% | 2% |
| 12:30 | U.S. | Housing Starts | June | 1.269 | 1.261 |
| 12:30 | U.S. | Building Permits | June | 1.294 | 1.3 |
| 12:30 | Canada | Bank of Canada Consumer Price Index Core, y/y | June | 2.1% | 2.6% |
| 12:30 | Canada | Consumer Price Index m / m | June | 0.4% | -0.2% |
| 12:30 | Canada | Consumer price index, y/y | June | 2.4% | 2% |
| 14:30 | U.S. | Crude Oil Inventories | July | -9.499 | -3.375 |
| 18:00 | U.S. | Fed's Beige Book | |||
| 23:50 | Japan | Trade Balance Total, bln | June | -967.1 | 420 |
Major US stock indexes fell moderately, being under pressure from Donald Trump's statements that the United States and China “have a long way to go” to reach a trade agreement. In addition, investors have ambiguously responded to the statements of the three largest US banks.
Statements by the President of the United States questioned the progress in trade negotiations between Washington and Beijing. Trump also added that the US may impose additional tariffs on Chinese imports amounting to $ 325 billion, "if we want." Trump's comments came after China and the United States agreed not to exacerbate trade tensions, trying to resume negotiations.
Market participants also received a block of mixed statistical data. Thus, the report of the Ministry of Commerce showed that retail sales in June increased by 0.4%, which corresponds to the downwardly revised May value. Economists had expected retail sales to grow by 0.1% compared with a 0.5% increase, which was originally reported in the previous month.
At the same time, the Department of Labor said that US import prices fell most strongly in June in 6 months due to lower prices for oil and other goods, suggesting that imported inflation remains restrained. According to the report, import prices fell by 0.9% last month, the biggest decline since December. Economists had forecast a fall in prices by 0.7%. For 12 months to June, import prices fell by 2.0% after declining by 1.1% in May.
Fed data showed that industrial output remained unchanged last month after a 0.4% increase in the previous month. Economists had forecast a 0.1% increase in industrial production in June.
A report by the National Association of Home Builders (NAHB) and Wells Fargo indicated that the mood of home builders in the United States improved slightly as the housing shortage increased. According to the report, the housing market index from the NAHB rose by only 1 point in July, to 65 points. However, the value of the indicator above the level of 50 points indicates favorable sales prospects. Experts expected the index to remain at the level of 64 points.
Most of the components of DOW finished trading in the red (19 out of 30). Intel Corporation (INTC; -1.66%) turned out to be an outsider. The growth leader was Dow Inc. (DOW; + 2.72%).
Most sectors of the S & P recorded a decline. The largest drop was shown by the base materials sector (-0.8%). The industrial goods sector grew the most (+ 0.5%).
At the time of closing:
Dow 27,335.63 -23.53 -0.09%
S & P 500 3,004.04 -10.26 -0.34%
Nasdaq 100 8,222.80 -35.39 -0.43%
| Time | Country | Event | Period | Previous value | Forecast |
|---|---|---|---|---|---|
| 00:30 | Australia | Leading Index | June | -0.1% | |
| 07:30 | Eurozone | ECB's Benoit Coeure Speaks | |||
| 08:30 | United Kingdom | Producer Price Index - Input (YoY) | June | 1.3% | 0.5% |
| 08:30 | United Kingdom | Producer Price Index - Input (MoM) | June | 0.0% | -0.8% |
| 08:30 | United Kingdom | Producer Price Index - Output (YoY) | June | 1.8% | 1.7% |
| 08:30 | United Kingdom | Producer Price Index - Output (MoM) | June | 0.3% | 0.1% |
| 08:30 | United Kingdom | Retail Price Index, m/m | June | 0.3% | 0.1% |
| 08:30 | United Kingdom | HICP ex EFAT, Y/Y | June | 1.7% | 1.8% |
| 08:30 | United Kingdom | Retail prices, Y/Y | June | 3% | 2.9% |
| 08:30 | United Kingdom | HICP, m/m | June | 0.3% | 0% |
| 08:30 | United Kingdom | HICP, Y/Y | June | 2% | 2% |
| 09:00 | Eurozone | Construction Output, y/y | May | 3.9% | 2.4% |
| 09:00 | Eurozone | Harmonized CPI | June | 0.1% | 0.1% |
| 09:00 | Eurozone | Harmonized CPI ex EFAT, Y/Y | June | 0.8% | 1.1% |
| 09:00 | Eurozone | Harmonized CPI, Y/Y | June | 1.2% | 1.2% |
| 10:00 | Germany | German Buba President Weidmann Speaks | |||
| 12:30 | Canada | Manufacturing Shipments (MoM) | May | -0.6% | 2% |
| 12:30 | U.S. | Housing Starts | June | 1.269 | 1.261 |
| 12:30 | U.S. | Building Permits | June | 1.294 | 1.3 |
| 12:30 | Canada | Bank of Canada Consumer Price Index Core, y/y | June | 2.1% | 2.6% |
| 12:30 | Canada | Consumer Price Index m / m | June | 0.4% | -0.2% |
| 12:30 | Canada | Consumer price index, y/y | June | 2.4% | 2% |
| 14:30 | U.S. | Crude Oil Inventories | July | -9.499 | -3.375 |
| 18:00 | U.S. | Fed's Beige Book | |||
| 23:50 | Japan | Trade Balance Total, bln | June | -967.1 | 420 |
Elliot Clarke, an analyst at Westpac, suggests that China’s latest credit data has highlighted that further easing is necessary while private investment a significant concern.
- “Over the past year, Chinese authorities have sought to accelerate the economy by increasing credit availability and lowering its cost. Consequent growth in credit has however been slow in coming.
- In part, this is due to the circumstances that China currently finds itself in, with corporate demand for credit restricted by persistent uncertainty over US trade relations as well as softer global growth.
- In addition to these macro-demand factors, however, anecdotes suggest the supply of credit is also still an issue for business.
- Small and medium private firms won’t be able to access capital markets anytime soon, and more work needs to be done before the quality of lending by shadow banking agents can be relied upon. Hence improved access to credit for small and medium-sized enterprise will have to rely on the banks. Further targeted easing by authorities is, therefore, a necessity, as are broader liquidity measures to reduce the overall cost of credit.
- The bright spot for the short-term however is that, with local-government issuance having accelerated in 2019, infrastructure activity will continue to build in the second half. This activity will provide enduring support for aggregate growth and incomes amid uncertainty, and hopefully elicit a response from public and private corporates in time.”
The Commerce
Department announced on Tuesday that business inventories rose 0.3 percent
m-o-m in May, following an unrevised 0.5 percent m-o-m increase in April.
That was in
line with economists’ forecast.
According to
the report, both retail inventories and wholesale inventories rose 0.4 percent m-o-m
in May, while factory inventories increased 0.2 percent m-o-m.
Retail
inventories excluding autos, which go into the calculation of GDP, advanced 0.3 percent m-o-m, as reported last month.
In y-o-y terms,
business inventories climbed 5.3 percent in May.
The National
Association of Homebuilders (NAHB) announced on Tuesday its housing market
index (HMI) rose one point to 65 in July.
Economists had forecast
the HMI to stay at 64.
A reading over
50 indicates more builders view conditions as good than poor.
All three HMI
components were higher this month. The indicator gauging current sales
conditions increased one point to 72, the measure charting sales expectations
in the next six months rose a single point to 71 and the component measuring
traffic of prospective buyers moved up one point to 48.
NAHB Chairman
Greg Ugalde said: “Builders report solid demand for single-family homes.
However, they continue to grapple with labor shortages, a dearth of buildable
lots and rising construction costs that are making it increasingly challenging
to build homes at affordable price points relative to buyer incomes”.
Meanwhile, NAHB
Chief Economist Robert Dietz noted: “Even as builders try to rein in costs,
home prices continue to outpace incomes. The current low mortgage interest rate
environment should be getting more buyers off the sidelines, but they remain
hesitant due to affordability concerns. Still, attractive rates should help
spur new home purchases in large metro suburban markets, where approximately
one-third of new construction takes place”.
The Federal
Reserve reported on Tuesday that the U.S. industrial production was unchanged
m-o-m in June, following an unrevised 0.4 percent m-o-m increase in May.
Economists had
forecast industrial production would increase 0.1 percent m-o-m in June.
According to
the report, the manufacturing output advanced 0.4 percent m-o-m in June, helped
by a significant increase in production of motor vehicles and part (+3 percent
m-o-m). Excluding motor vehicles and parts, manufacturing output rose only 0.2
percent m-o-m. Meanwhile, the output of utilities plunged 3.6 percent m-o-m, as
milder-than-usual temperatures in June reduced the demand for air conditioning.
The mining production moved up 0.2 percent m-o-m.
Capacity
utilization for the industrial sector decreased 0.2 percentage point m-o-m in June
to 77.9 percent. That was 0.2 percentage point below economists’ forecast and
1.9 percentage points below its long-run (1972-2018) average.
In y-o-y terms,
the industrial output rose 1.3 percent in June, following a revised 2.1 percent
advance in the prior month (originally a gain of 2.0 percent).
For the second
quarter as a whole, industrial production reduced at an annual rate of 1.2
percent, its second consecutive quarterly decrease.
U.S. stock-index futures rose on Monday, as investors responded mixed to the banks’ earnings reports and a set of important macroeconomic data.
Global Stocks:
Index/commodity | Last | Today's Change, points | Today's Change, % |
Nikkei | 21,535.25 | -150.65 | -0.69% |
Hang Seng | 28,619.62 | +64.74 | +0.23% |
Shanghai | 2,937.62 | -4.57 | -0.16% |
S&P/ASX | 6,641.00 | -12.00 | -0.18% |
FTSE | 7,574.12 | +42.40 | +0.56% |
CAC | 5,609.38 | +31.17 | +0.56% |
DAX | 12,430.96 | +43.62 | +0.35% |
Crude oil | $59.88 | +0.50% | |
Gold | $1,411.80 | -0.13% |
The Labor
Department reported on Tuesday the import-price index, measuring the cost of
goods ranging from Canadian oil to Chinese electronics, fell 0.9 percent m-o-m
in June, following a revised flat m-o-m performance in May (originally a 0.3
percent m-o-m decline). It was the first monthly drop since December 2018. Economists
had expected prices to decrease 0.7 percent m-o-m last month.
According to
the report, both lower fuel (-6.5 percent m-o-m) and nonfuel (-0.3 percent
m-o-m) prices contributed to the June decline in import prices.
Over the
12-month period ended in June, import prices dropped 2.0 percent, weighed down
by declines in both fuel and nonfuel prices. That was the largest over-the-year
drop since the index fell 2.2 percent from August 2015 to August 2016.
At the same
time, the price index for U.S. exports declined 0.7 percent m-o-m in June, following
an unrevised 0.2 percent m-o-m drop in the previous month. That represented the
largest monthly drop for the index since November 2018.
Lower prices
for prices for nonagricultural exports (-1.1 percent m-o-m) more than offset higher
prices for agricultural exports (+2.7 percent m-o-m) exports contributed to the
May decline.
Over the past
12 months, the price index for exports dropped 1.6 percent, the largest
12-month decline since the index decreased 2.4 percent from August 2015 to
August 2016.
(company / ticker / price / change ($/%) / volume)
3M Co | MMM | 172.3 | -0.54(-0.31%) | 660 |
ALTRIA GROUP INC. | MO | 49.5 | -0.04(-0.08%) | 2653 |
Amazon.com Inc., NASDAQ | AMZN | 2,016.75 | -4.24(-0.21%) | 20157 |
American Express Co | AXP | 129.4 | 0.83(0.65%) | 4632 |
Apple Inc. | AAPL | 205.29 | 0.08(0.04%) | 73540 |
AT&T Inc | T | 33.74 | 0.03(0.09%) | 1784 |
Boeing Co | BA | 361.8 | 0.19(0.05%) | 2212 |
Caterpillar Inc | CAT | 139.4 | -0.24(-0.17%) | 4648 |
Chevron Corp | CVX | 126 | 0.28(0.22%) | 1487 |
Cisco Systems Inc | CSCO | 58.2 | 0.15(0.26%) | 7234 |
Citigroup Inc., NYSE | C | 71.21 | -0.50(-0.70%) | 36444 |
Facebook, Inc. | FB | 203.94 | 0.03(0.01%) | 47448 |
Ford Motor Co. | F | 10.41 | -0.01(-0.10%) | 3623 |
Freeport-McMoRan Copper & Gold Inc., NYSE | FCX | 11.18 | 0.04(0.36%) | 16922 |
General Electric Co | GE | 10.22 | -0.05(-0.49%) | 27747 |
Goldman Sachs | GS | 214.32 | 2.74(1.30%) | 165173 |
Google Inc. | GOOG | 1,142.00 | -8.34(-0.73%) | 7109 |
Home Depot Inc | HD | 217.83 | -0.87(-0.40%) | 1015 |
Intel Corp | INTC | 50.05 | -0.07(-0.14%) | 6937 |
International Business Machines Co... | IBM | 143.21 | -0.11(-0.08%) | 375 |
Johnson & Johnson | JNJ | 134 | -0.71(-0.53%) | 73781 |
JPMorgan Chase and Co | JPM | 112.23 | -1.67(-1.47%) | 682570 |
McDonald's Corp | MCD | 214.58 | 0.37(0.17%) | 551 |
Merck & Co Inc | MRK | 81.2 | 0.24(0.30%) | 1042 |
Microsoft Corp | MSFT | 139.16 | 0.26(0.19%) | 37968 |
Pfizer Inc | PFE | 42.69 | -0.06(-0.14%) | 516 |
Procter & Gamble Co | PG | 115.37 | -0.11(-0.09%) | 396 |
Starbucks Corporation, NASDAQ | SBUX | 90.45 | 0.29(0.32%) | 4394 |
Tesla Motors, Inc., NASDAQ | TSLA | 249.25 | -4.25(-1.68%) | 185083 |
The Coca-Cola Co | KO | 52.15 | 0.02(0.04%) | 731 |
Twitter, Inc., NYSE | TWTR | 38.72 | 0.04(0.10%) | 14748 |
UnitedHealth Group Inc | UNH | 266 | 0.04(0.02%) | 1101 |
Verizon Communications Inc | VZ | 57.63 | 0.05(0.09%) | 2532 |
Visa | V | 180.75 | 0.18(0.10%) | 6625 |
Wal-Mart Stores Inc | WMT | 114.7 | -0.28(-0.24%) | 2806 |
Walt Disney Co | DIS | 145 | -0.06(-0.04%) | 1880 |
Yandex N.V., NASDAQ | YNDX | 40.64 | 0.16(0.40%) | 5551 |
Microsoft (MSFT) target raised to $153 at BMO Capital Markets
Freeport-McMoRan (FCX) upgraded to Equal Weight from Underweight at Barclays; target $12
Facebook (FB) added to Focus List at William O'Neil
The Commerce
Department announced on Tuesday the sales at U.S. retailers rose 0.4 percent
m-o-m in June, following a revised 0.4 percent m-o-m advance in May (originally
a gain of 0.5 percent m-o-m), supported by higher purchases of motor vehicles
and a variety of other goods.
Economists had
expected total sales would increase 0.1 percent m-o-m in June.
Excluding auto,
retail sales also increased 0.4 percent m-o-m in June after a revised 0.4
percent m-o-m advance in the previous month (originally an advance of 0.5
percent m-o-m), exceeding economists’ forecast for a 0.1 percent m-o-m uptick.
Meanwhile,
closely watched core retail sales, which exclude automobiles, gasoline,
building materials and food services, and are used in GDP calculations,
advanced 0.7 percent m-o-m in June after an upwardly revised 0.6 percent m-o-m
rise in May (originally an increase of 0.4 percent m-o-m).
In y-o-y terms,
the U.S. retail sales surged 3.4 percent in June, accelerating from a revised +2.9
percent in the previous month (originally +3.2 percent).
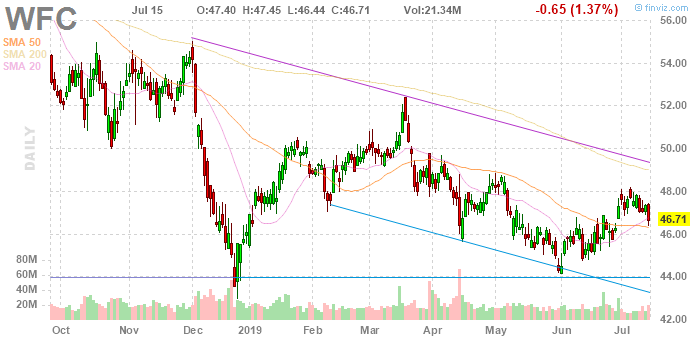
Wells Fargo (WFC) reported Q2 FY 2019 earnings of $1.30 per share (versus $1.08 in Q2 FY 2018), beating analysts’ consensus of $1.16.
The company’s quarterly revenues amounted to $21.584 bln (+0.1% y/y), beating analysts’ consensus estimate of $20.949 bln.
WFC rose to $46.75 (+0.09%) in pre-market trading.
- Notes that downwards pressure on the economy has increased
- Says China is to expand effective investment
- Calls for stable, healthy economic development
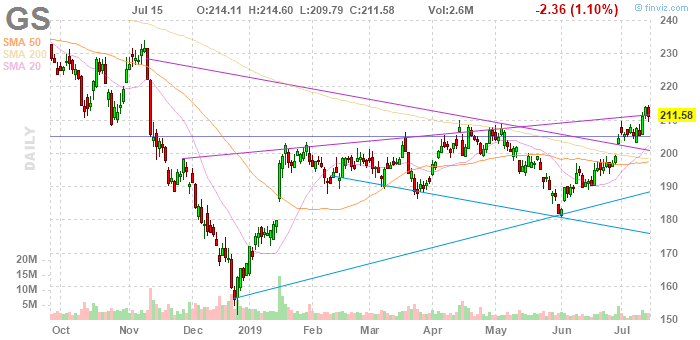
Goldman Sachs (GS) reported Q2 FY 2019 earnings of $5.81 per share (versus $5.98 in Q2 FY 2018), beating analysts’ consensus of $5.03.
The company’s quarterly revenues amounted to $9.461bln (+0.6% y/y), beating analysts’ consensus estimate of $8.879 bln.
The company also increased its quarterly dividend by 47% to $1.25/share from $0.85/share.
GS rose to $213.52 (+0.92%) in pre-market trading.
Sean Callow, an analyst at Westpac, notes that AUD has printed 6-month highs against the pound this week even as markets continue to price in further RBA rate cuts to follow up on the June and July moves.
- “The rebound in Australia’s commodity price basket from mid-June lows has reinforced official data showing Australia is recording record trade surpluses despite the ongoing angst over US-China trade tensions.
- This has shrunk Australia’s current account deficit to near balance, its strongest position since the mid-1970s and in stark contrast to the UK, whose C/A deficit of -5.6%/GDP the BoE drily notes is “large by international standards.
- Such a backdrop, supported by equity market gains and low volatility, maybe encouraging AUD short-covering despite the Australian economy’s sluggish domestic growth and inflation pulse which leaves the door open to another rate cut in coming months.
- But the steepest GBP decline in recent weeks came after BoE governor Carney took a notably dovish turn, showing particular concern over protectionism. Meanwhile, the seemingly imminent selection of Brexit hardliner Boris Johnson as UK PM reinforces underlying GBP pessimism.
- We look for further sterling underperformance multi-week to around AUD/GBP 0.5675/0.5700 or GBP/AUD 1.7550/1.7625. Multi-month though, AUD should soften on a range of crosses, including against the pound, so the next few weeks could be its strongest levels for 2019.”
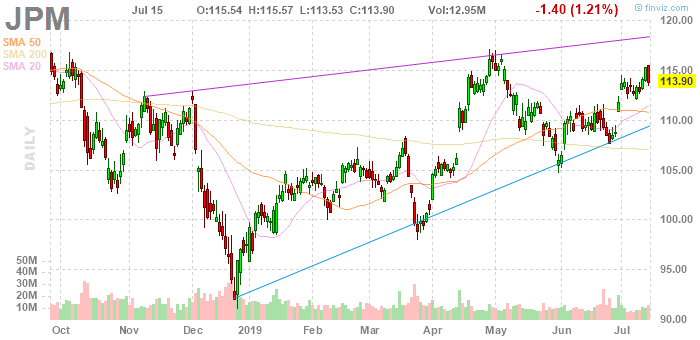
JPMorgan Chase (JPM) reported Q2 FY 2019 earnings of $2.82 per share (versus $2.29 in Q2 FY 2018), beating analysts’ consensus of $2.49.
The company’s quarterly revenues amounted to $28.832 bln (+3.9% y/y), beating analysts’ consensus estimate of $28.525 bln.
JPM fell to $112.49 (-1.24%) in pre-market trading.
James Smith, a Developed Markets Economist at ING, notes that the UK wage growth has a hit another post-crisis high as skill shortages continue to bite.
- "At 3.6%, UK wage growth (excluding bonuses) has reached another post-crisis high. While this is being partially boosted by an increase in public sector pay at the start of the second quarter, wage growth is nevertheless one of the few remaining hawkish factors for the Bank of England. It has been a key ingredient in policymakers’ recent signal that rates may need to rise if Brexit goes smoothly. The question is, how long will this trend continue?
- Well, from a structural standpoint, the signs suggest that the upward pressure on wages is likely to persist. The recent uplift in pay is linked to skill shortages in various industries - most notably in construction, IT & hospitality, according to last year’s Employer Skill Survey.
- In some cases this can be linked back to demographic factors. In the road haulage sector for instance, almost 30% of the workforce is over the age of 55, according to ONS figures. With a fewer number of younger entrants relative to the number of retirees, this is reportedly resulting in shortages of drivers and is prompting firms to offer higher pay packages to guarantee coverage for shifts.
- These structural forces are unlikely to fade imminently, however there are some signs that the cyclical story is starting to look a little less positive. Vacancies, while still high, fell for the fifth consecutive month and this tallies with the more lacklustre employment growth – the 3M/3M change in employment slipped to 28,000 in the latest data for May. The latest Markit/RECS jobs report also hints at a slower pace of wage growth, with permanent starting salaries softening to a 25-month low."
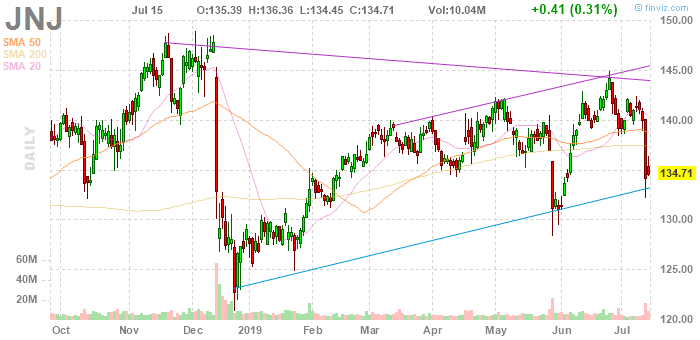
Johnson & Johnson (JNJ) reported Q2 FY 2019 earnings of $2.58 per share (versus $2.10 in Q2 FY 2018), beating analysts’ consensus of $2.44.
The company’s quarterly revenues amounted to $20.562 bln (-1.3% y/y), generally in line with analysts’ consensus estimate of $20.388 bln.
The company also announced it continued to see FY 2019 EPS of $8.53-8.63 (versus analysts’ consensus estimate of $8.62) but raised FY 2019 revenues guidance to $80.8-81.6 bln from prior $80.4-81.2 bln (versus analysts’ consensus estimate of $81.27 bln).
JNJ rose to $135.95 (+0.92%) in pre-market trading.
TD Securities' analysts note that the minutes from the RBA's July meeting indicate the Australian central bank will continue to monitor developments in the labour market and spare capacity and adjust monetary policy "if needed".
- “We find no indication in the July RBA Minutes that the Bank is considering cutting rates again in the near term. Interesting that the June minutes were a lot more direct regarding the prospect of further cuts when the Bank said: "Given the amount of spare capacity in the labour market and the economy more broadly, members agreed that it was more likely than not that a further easing in monetary policy would be appropriate in the period ahead." That urgency does not appear in today's Minutes and is consistent with the RBA moving to the sidelines for the next few months to assess the impact of rate cuts, tax payments and housing developments.”
Bert Colijn, a Senior Eurozone Economist at ING, notes that a 1.4% seasonally-adjusted increase in exports in May comes after a large drop in April, and while the trend still seems to be positive, the question is whether nominal exports will have grown over the quarter.
- "A decline in exports of goods has been expected for a while, but 1Q figures were still quite positive. That was not least related to UK stockpiling ahead of a no-deal Brexit though. With that out of the way, 2Q was set to come in weak.
- Weakening global growth and the trade conflict uncertainty have clouded the outlook for some time and eurozone businesses have been indicating that their competitiveness outside of the EU has been faltering over recent quarters, which is usually closely related to growth in real exports. For now, declining demand among large export markets has been limited to Turkey and South Korea, but expectations for the quarters ahead remain rather cautious.
- The second quarter is likely to have been very soft and the question is whether net exports will have still contributed positively given the large increase in March thanks to UK stockpiling. Expect a poor GDP reading for 2Q, which is something that the European Central Bank will be pencilling in as well ahead of next week's meeting."
- We still see the global economy as sluggish
- China's growth to slow gradually and more if trade dispute worsens
- U.S. economy has low jobless rate but no inflation pickup
- All of Europe's policy levers need to be ready for use
- IMF baseline scenario is not for the world economy to stall or fall into a recession
According to Petr Krpata, chief EMEA FX and IR strategist at ING, the expected solid US activity data today should confirm ING’s view that a 25 basis point Fed rate cut in July (rather than 50bp) should be sufficient as a first insurance move to offset the negative effect of trade wars.
“US retail sales should be stronger, especially when the volatile auto and gasoline components are removed, while industrial production should post a modest increase given the fact that the ISM remains in growth territory. This is consistent with the idea that US personal spending should grow around 4% in the second quarter – an environment which should not warrant material monetary easing. This suggests support for the dollar today, particularly against the low yielders such as EUR and JPY as (a) market expectations of an aggressive Fed easing cycle will be further tamed and (b) the sufficiently high interest rate differential will remain supportive for the dollar.”
According to the report from Italian National Institute of Statistics (ISTAT), in June 2019 the rate of change of Italian consumer price index for the whole nation (NIC) increased by 0.1% on the previous month and by 0.7% with respect to June 2018, down from +0.8% in the previous month. The flash estimate was +0.8%.
The slowdown of the growth on annual basis of All items index was mainly due to the trend reversal of prices of Non-regulated energy products (from +2.4% to -0.6%) and, to a lesser extent, to the wider decrease of prices of Durable goods (from -1.2% to -1.9%). These dynamics were partially offset by the growth of prices of Services related to recreation, including repair and personal care (from +1.0% to +1.3%) and by the lower decrease of those of Services related to communication (from -7.2% to -5.9%).
The core inflation excluding energy and unprocessed food was +0.4% and inflation excluding energy was +0.5%, both the same as in the previous month.
Eurostat said the first estimate for euro area (EA19) exports of goods to the rest of the world in May 2019 was €203.4 billion, an increase of 7.1% compared with May 2018 (€189.9 bn). Imports from the rest of the world stood at €180.3 bn, a rise of 4.2% compared with May 2018 (€173.0 bn). As a result, the euro area recorded a €23.0 bn surplus in trade in goods with the rest of the world in May 2019, compared with +€16.9 bn in May 2018. Intra-euro area trade rose to €172.0 bn in May 2019, up by 4.9% compared with May 2018.
In January to May 2019, euro area exports of goods to the rest of the world rose to €973.5 bn (an increase of 5.0% compared with January May 2018), and imports rose to €890.8 bn (an increase of 5.2% compared with January-May 2018). As a result the euro area recorded a surplus of €82.7 bn, compared with +€80.5 bn in January-May 2018. Intra-euro area trade rose to €838.7 bn in January-May 2019, up by 3.3% compared with January-May 2018.
According to the report from Center for European Economic Research (ZEW), indicator of economic sentiment for Germany decreased slightly in July 2019. Expectations are now at -24.5 points. This corresponds to a drop of 3.4 points compared to the previous month. Economists had expected a decrease to -22.3 points. The indicator’s long-term average is 21.8 points. In July, the assessment of the economic situation in Germany worsened by 8.9 points, with the corresponding indicator falling to a current reading of -1.1 points.
“In particular the continued negative trend in incoming orders in the German industry is likely to have reinforced the financial market experts’ pessimistic sentiment. A lasting containment of the factors that are causing uncertainty in the export-oriented sectors of the German economy is currently not in sight,” comments ZEW President Professor Achim Wambach.
The financial market experts’ sentiment concerning the economic development of the eurozone has slightly decreased, with the corresponding indicator falling 0.1 points to a current level of -20.3 points. The indicator for the current economic situation in the eurozone fell 6.9 points to a level of -10.6 points in July.
According to the report from Office for National Statistics, from March to May the UK employment rate was estimated at 76.0%, higher than a year earlier (75.6%); on the quarter, the rate was 0.1 percentage points lower, the first quarterly decrease since June to August 2018.
The UK unemployment rate was estimated at 3.8%; it has not been lower since October to December 1974. For March to May 2019, an estimated 1.29 million people were unemployed, 116,000 fewer than a year earlier and 820,000 fewer than five years earlier. Looking in more detail at this fall of 820,000 unemployed people over the last five years:
people unemployed for up to six months fell by 246,000 to 766,000
people out of work for between 6 and 12 months fell by 160,000 to 187,000
the largest fall was for people unemployed for over one year (down 414,000 to 340,000)
Estimated annual growth in average weekly earnings for employees in Great Britain increased from 3.2% to 3.4% for total pay (including bonuses) and from 3.4% to 3.6% for regular pay (excluding bonuses).
In real terms (after adjusting for inflation), total pay is estimated to have increased by 1.4% compared with a year earlier, and regular pay is estimated to have increased by 1.7%.
According to Karen Jones, analyst at Commerzbank, USD/CHF remains under pressure following its recent failure ahead of its 50% retracement at .9967 and the 200 day ma at .9982, which is tough resistance for the market and suspect that the market has topped here.
“We look for further losses to .9695 25th June low. Above the 200 moving average lies the mid-June high at 1.0014. Longer term we target .9211/.9188, the 2018 low. Only a close above 1.0014 (high 19th June) would alleviate immediate downside pressure and target 1.0097 and possibly 1.0128 before failure again (November and March highs at 1.0124/28).”
Danske Bank analysts point out that in Europe, at 16:00 GMT the European Parliament will vote on Ursula von der Leyen's appointment as Commission President and will be a key event today.
“She is potentially facing a knife-edge vote after policymakers from the Greens and Left already ruled out their support and the centre-left Socialists remain divided. Should she fail to secure the 374 votes for a majority, it risks triggering an institutional crisis in the EU. Also on the agenda today in Europe is the ZEW business survey, which is one of the first sentiment indicators in July. While last week saw improved risk sentiment stemming from surprise candidates (e.g. French industrial production), we expect further downside in the expectations component or some stabilisation at best. Fed Chairman Jerome Powell will speak about 'Aspects of Monetary Policy in the Post-Crisis Era' at an event in Paris today. In the US, retail sales and industrial production numbers for June are due for release.”
Monetary policy cannot do everything, cannot repair protectionist damage
It also cannot replace reforms, fiscal policy
Monetary policy is guided by central bank mandate, not targeting exchange rate
ECB is data dependent, not market dependent
That means not relying too exclusively on market-based inflation expectations
Will assess economic data at meeting next week
ECB will act accordingly if and when is needed
The Bank of Japan would offer support for a government spending package likely to be unveiled in October when a national sales tax is increased, according to a former central bank official.
The move would have symbolic importance, showing the central bank and government working in tandem to support the economy as it faced the additional risk of the higher tax hitting consumption, Hideo Hayakawa, a former executive director at the BOJ, said.
The BOJ support would likely take the form of a commitment to buy up extra bonds issued to pay for the government stimulus rather than a change of policy settings, he added. The central bank has plenty of room to expand its purchases of government debt after scaling back its buying to well below half an 80 trillion yen annual target.
Hayakawa’s view is that Japan’s economy is holding up better-than-expected despite slowing global growth exacerbated by U.S.-China trade tensions and a downturn in the tech sector. While the BOJ will want to show its commitment to maintaining its stimulus for longer, the health of the economy doesn’t dictate a need to take further action.
Karen Jones, analyst at Commerzbank, points out that EUR/USD held steady yesterday, and they maintain a positive bias while the March and mid-June lows at 1.1181/76 hold the downside.
“While this holds, the 200 day moving average and early June high at 1.1322/48 will remain in sight. This guards the more important 1.1394/1.1412 55 week ma and recent high. Above the 1.1412 June high we look for resumption of the up move and a test of the 1.1570 2019 high. Slightly longer term we target 1.1815/54, the highs from June and September 2018. We regard the April and May lows at 1.1110/06 as a turning point and continue to view the market as based longer term and target 1.1990 (measurement higher from the wedge).”
China's fixed-asset investment project approval in the first six months increased 81% by value compared with a year earlier as Beijing ramped up infrastructure spending to help support a slowing economy.
The National Development and Reform Commission (NDRC) approved 94 fixed-asset investment projects in January-June worth a total of 471.5 billion yuan, Meng Wei, spokeswoman at the state planner, told.
That was an increase of 211.2 billion yuan of projects approved compared with the first six months of 2018, when 102 projects worth 260.3 billion yuan were approved.
ANZ analysts note that New Zealand’s headline CPI increased 0.6% q/q in Q2, which saw annual inflation pick up to 1.7% y/y from 1.5%.
“Strength was driven by tradable prices, up 0.9% q/q (0.1% y/y), which was boosted by petrol price strength and will be transitory. Outside of petrol prices, there was some broader strength in tradable prices, likely reflecting recent NZD weakness. Non-tradable inflation rose 0.3% q/q, boosted by rents, insurance, and restaurant meals. Annual non-tradable inflation was flat at 2.8% – a respectable five-year high, but still short of the 3% or more needed to see headline inflation comfortably and sustainably at 2%. Core inflation measures did tick up slightly, despite the reasonably subdued non-tradable inflation print. Underlying inflation continues to track just short of 2%, following strength early in 2018. Annual trimmed mean measures reversed last quarter’s tick down, to sit around 2% across various measures of trim. The weighted median also ticked up from 2.2 to 2.3% y/y, and inflation excluding food and energy increased from 1.5% to 1.7% y/y. All up, it looks like Q2 CPI is as good as it will get for domestic inflation for some time.”
Lower rates to hold AUD lower than otherwise
spare capacity likely to remain in labour market for "some time"
lower borrowing costs to free up cash for consumer spending
Board recognised uneven effect of lower rates on different households
extent of spare capacity meant rate cut unlikely to lead to risky rise in borrowing
labour demand being met by rise in participation, rather than fall in unemployment rate
Board saw prospects of lift in household income, support from tax rebates signs of stabilisation in Sydney, Melbourne housing markets
funding costs for major Australian banks had reached historic low
retail data suggested discretionary spending remained soft in Q2
Board noted significant change in outlook for monetary easing globally, esp US
risks from trade disputes remained high, inflation subdued in developed world
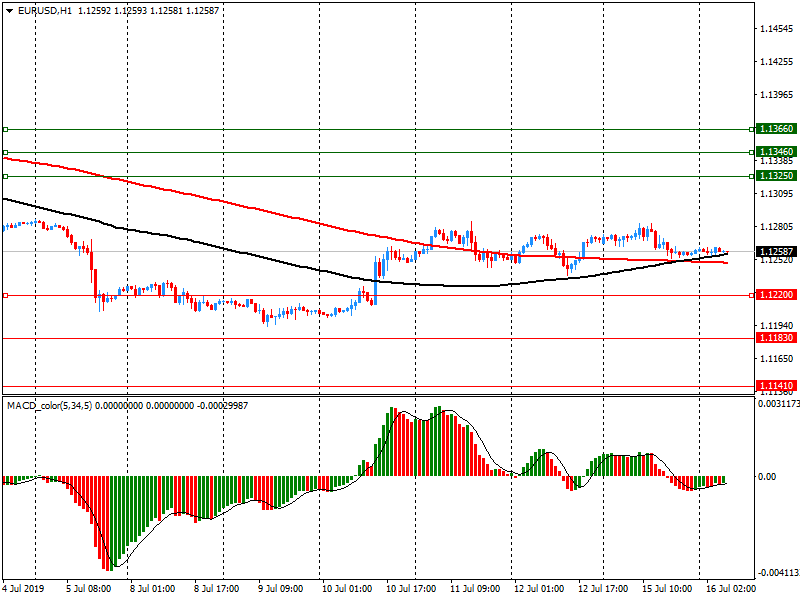
EUR/USD
Resistance levels (open interest**, contracts)
$1.1366 (1157)
$1.1346 (783)
$1.1325 (237)
Price at time of writing this review: $1.1259
Support levels (open interest**, contracts):
$1.1220 (3434)
$1.1183 (2859)
$1.1141 (3505)
Comments:
- Overall open interest on the CALL options and PUT options with the expiration date August, 9 is 61114 contracts (according to data from July, 15) with the maximum number of contracts with strike price $1,1500 (3811);
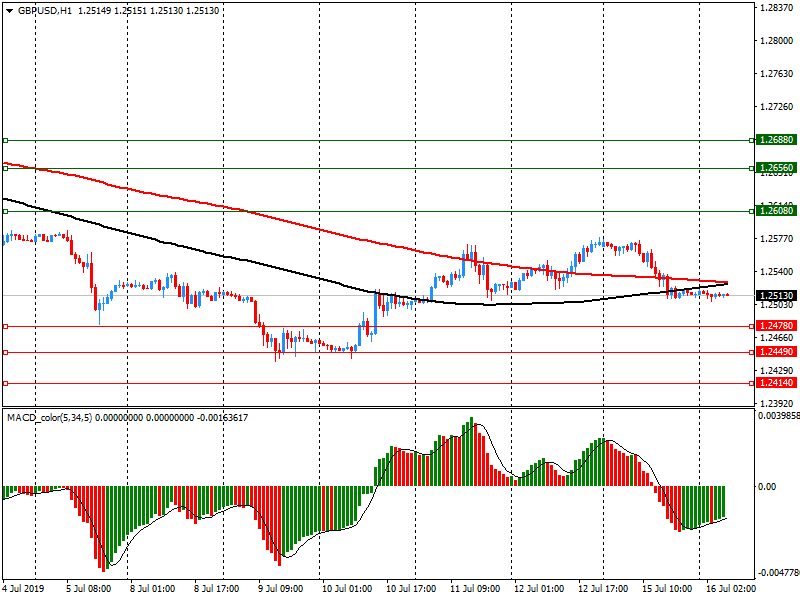
GBP/USD
Resistance levels (open interest**, contracts)
$1.2688 (1815)
$1.2656 (524)
$1.2608 (322)
Price at time of writing this review: $1.2513
Support levels (open interest**, contracts):
$1.2478 (1421)
$1.2449 (2418)
$1.2414 (2562)
Comments:
- Overall open interest on the CALL options with the expiration date August, 9 is 14842 contracts, with the maximum number of contracts with strike price $1,3000 (2052);
- Overall open interest on the PUT options with the expiration date August, 9 is 16228 contracts, with the maximum number of contracts with strike price $1,2450 (2562);
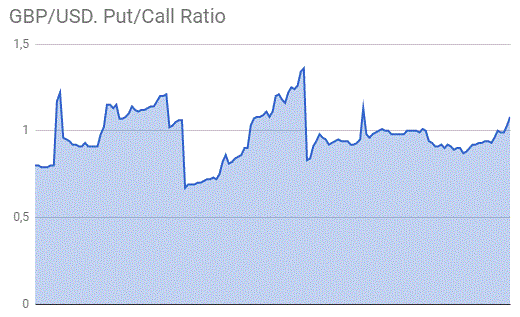
- The ratio of PUT/CALL was 1.09 versus 1.07 from the previous trading day according to data from July, 15
* - The Chicago Mercantile Exchange bulletin (CME) is used for the calculation.
** - Open interest takes into account the total number of option contracts that are open at the moment.
| Raw materials | Closed | Change, % |
|---|---|---|
| Brent | 65.74 | -0.95 |
| WTI | 59.34 | -1.4 |
| Silver | 15.36 | 1.05 |
| Gold | 1413.651 | -0.14 |
| Palladium | 1563.84 | 1.23 |
| Index | Change, points | Closed | Change, % |
|---|---|---|---|
| Hang Seng | 83.26 | 28554.88 | 0.29 |
| KOSPI | -4.18 | 2082.48 | -0.2 |
| ASX 200 | -43.5 | 6653 | -0.65 |
| FTSE 100 | 25.75 | 7531.72 | 0.34 |
| DAX | 64.02 | 12387.34 | 0.52 |
| Dow Jones | 27.13 | 27359.16 | 0.1 |
| S&P 500 | 0.53 | 3014.3 | 0.02 |
| NASDAQ Composite | 14.05 | 8258.19 | 0.17 |
| Pare | Closed | Change, % |
|---|---|---|
| AUDUSD | 0.70385 | 0.29 |
| EURJPY | 121.471 | -0.09 |
| EURUSD | 1.12601 | -0.05 |
| GBPJPY | 135.01 | -0.43 |
| GBPUSD | 1.25148 | -0.43 |
| NZDUSD | 0.67181 | 0.42 |
| USDCAD | 1.30435 | 0.13 |
| USDCHF | 0.98392 | -0.04 |
| USDJPY | 107.876 | 0 |
© 2000-2026. Sva prava zaštićena.
Sajt je vlasništvo kompanije Teletrade D.J. LLC 2351 LLC 2022 (Euro House, Richmond Hill Road, Kingstown, VC0100, St. Vincent and the Grenadines).
Svi podaci koji se nalaze na sajtu ne predstavljaju osnovu za donošenje investicionih odluka, već su informativnog karaktera.
The company does not serve or provide services to customers who are residents of the US, Canada, Iran, The Democratic People's Republic of Korea, Yemen and FATF blacklisted countries.
Izvršenje trgovinskih operacija sa finansijskim instrumentima upotrebom marginalne trgovine pruža velike mogućnosti i omogućava investitorima ostvarivanje visokih prihoda. Međutim, takav vid trgovine povezan je sa potencijalno visokim nivoom rizika od gubitka sredstava. Проведение торговых операций на финанcовых рынках c маржинальными финанcовыми инcтрументами открывает широкие возможноcти, и позволяет инвеcторам, готовым пойти на риcк, получать выcокую прибыль, но при этом неcет в cебе потенциально выcокий уровень риcка получения убытков. Iz tog razloga je pre započinjanja trgovine potrebno odlučiti o izboru odgovarajuće investicione strategije, uzimajući u obzir raspoložive resurse.
Upotreba informacija: U slučaju potpunog ili delimičnog preuzimanja i daljeg korišćenja materijala koji se nalazi na sajtu, potrebno je navesti link odgovarajuće stranice na sajtu kompanije TeleTrade-a kao izvora informacija. Upotreba materijala na internetu mora biti praćena hiper linkom do web stranice teletrade.org. Automatski uvoz materijala i informacija sa stranice je zabranjen.
Ako imate bilo kakvih pitanja, obratite nam se pr@teletrade.global.

