- Analiza
- Novosti i instrumenti
- Vesti sa tržišta
Forex-novosti i prognoze od 15-10-2021
- The Dow Jones Industrial, the S&P 500, and the Nasdaq Composite posted gains between 0.7% and 1.6% on Friday.
- US Retail Sales surprised to the upside, while the University of Michigan Consumer Sentiment Index fell.
- The USD/JPY reached five-year highs above 114.00.
- Bitcoin broke the $60,000 barrier, trades at All-Time-Highs.
US equities finished on a higher note in the week, the best since July on the back of solid corporate earnings and a better than expected Retail Sales report. The US T-bond yields rose while the greenback fell.
The Dow Jones Industrial Average advanced 1.1% to 35,294.76, up 1.6% on the week. The S&P 500 added 0.7% to 4,471.37 and climbed 1.8% for the week, while the heavy-tech Nasdaq Composite ticked up 0.5%, to 14,897.34, and gained 2.2% for the week.
Mixed US macroeconomic data could not suppress the rise of stocks
US Retail Sales surprisingly increased in September, suggesting resilient demand for goods. The headline showed an increase of 0.7% more than the 0.2% contraction foreseen by analysts. Excluding Autos, it expanded 0.8% higher than the 0.5% estimated.
As coronavirus infections increased in August and September, demand for services decreased as people shifted their spending toward goods. Increasing spending on merchandise would likely exert additional pressure on the supply chains, which have not been able to keep up with growing demand.
Further, the University of Michigan Consumer Sentiment Index fell to its lowest level since 2011. The preliminary reading fell to 71.4 from 72.8 in September, data showed. Estimations were at 73.1. Additionally, according to the report, consumers expect an inflationary reading of 4.8% over the next year.
The US Dollar Index, which tracks the greenback's performance against a basket of six rivals, lost 0.02% and was last seen at 93.957, while the US 10-year Treasury yield rose five basis points (bps) closed at 1.574%, finishing down for the first week out of five.
In the forex market, the EUR/USD advanced 0.04% to finish at 1.1601, while the GBP/USD closed at five-week highs, at 1.3743 for a 0.52% gain on Friday. The USD/JPY followed the US T-bond 10-year benchmark note coupon, ended at five-year highs, at 114.20, 0.46% up in the day. The AUD/USD held to its five-week highs around 0.7414.
In the commodities market, Gold (XAU/USD) slid 1.59%, finished at $1,767.20 troy ounce, whereas Silver (XAG/USD) followed its footprints, slumped 0.98%, at $23.28. US Crude oil benchmark, Western Texas Intermediate (WTI), heightened 1.22%, at $81.93 per barrel.
In the Crypto environment, at the time of writing, Bitcoin is trading at new all-time highs, above $62,000, on the possibility of a 90% chance that the SEC will approve a Bitcoin ETF while Ethereum is trading around $3,878.
- USD/JPY soars during the week, despite US dollar weakness across the board.
- Rising US T-bond yields underpins the USD/JPY pair.
- US Retail Sales upwardly surprised, rose by 0.7%, more than expectations.
The USD/JPY extends its one-and-a-half month rally, advances 0.47% during the New York session, trading at 114.21 at the time of writing. As portrayed by US equity indexes rising between 0.46% and 1.12%, positive market sentiment in the financial markets weighs on the Japanese yen.
Additionally, the US T-bond yields, which correlate positively with the USD/JPY pair, are climbing. The 10-year US Treasury yield is up to six basis points, sitting at 1.577%, boosts the greenback against the yen.
Meanwhile, upbeat US macroeconomic data lend a hand to the greenback. Surprisingly, US Retail Sales for September rose by 0.7%, higher than the 0.2% contraction foreseen by economists. Excluding autos and gas, sales expanded by 0.7%, better than the 0.5% in the previous month.
Furthermore, the University of Michigan Consumer Sentiment Index reading was 71.4, worse than the 72.8 estimated by investors, the second-lowest reading since 2011, as consumers grew more concerned about current conditions and the economic outlook.
USD/JPY Price Forecast: Technical outlook
The USD/JPY had witnessed a 400 pip rally since October 4, when it was trading around 110.50. The Relative Strenght Index (RSI) at 75, depicts that the upward move is overextended, as the RSI showed oversold conditions since October 11. On that same day, the 50-day moving average (DMA) crossed over the 100-DMA, giving a boost to the pair, as the correct order for moving averages in an uptrend is the shorter-time frames moving average, over the longer time frame ones.
That said, the USD/JPY first resistance level is October 4, 2018, high at 114.54, which is a crucial price level, unsuccessfully tested four times in four years. A break above the latter can clear the way for further gains, exposing key resistance levels like January 27, 2017, high at 115.37, followed by January 9, 2017, high at 117.52.
On the other hand, failure at 114.00 could open the door for a leg-down in confluence with the current RSI oversold conditions. The first of the critical support levels to be tested would be the October 13 high at 113.79, followed by the October 12 low at 112.99, and then the October 8 high at 112.24.
KEY ADDITIONAL LEVELS TO WATCH
- The British pound continues its rally against the Japanese yen on the back of BoE’s hiking rates expectations.
- The market sentiment is upbeat, boosting risk-sensitive currencies like the Sterling.
- Japanese Finance Minister said that currency stability is “very important” and will keep an eye on the forex market moves.
The GBP/JPY extends its seven-day rally during the New York session, advances 1.09%, is trading at 157.14 at the time of writing. As witnessed by the US equity stocks rising between 0.48% and 1.13%, risk-on market sentiment in the financial markets weighs on the safe-haven yen.
The British pound and the New Zealand dollar are the stronger currencies in the forex market, whereas the Japanese yen is the laggard. Factors like risk appetite and central bank divergence exert additional pressure on the yen.
Since Monday of this week, the British pound has been on the right foot against the yen. Over the last weekend, members of the Bank of England expressed concerns about higher energy prices, which in part spurred consumer prices that passed the levels tolerated by the central bank. That said, Michael Saunders, and Governor Andrew Bailey, talked openly about the need for higher rates to contain inflationary pressures.
In the meantime, Finance MinisterShunichi Suzuki said that currency stability is “very important” and that Japan’s government will scrutinize the economic impact of the forex market moves. Further added, that “we will continue to closely watch currency market moves and their impact on the economy.”
GBP/JPY Price Forecast: Technical outlook
The weekly chart depicts that the cross-currency is at five-year highs, approaching the June 2016 swing highs, around 160.10, which is the next resistance for the GBP/JPY pair.
The GBP/JPY is in an uptrend, confirmed by the Relative Strenght Index (RSI) at 66, aiming higher, accelerating toward oversold levels, but with room left, for another leg-up. However, to resume the upward trend, it will need a close above 157.00.
GBP/JPY Key additional levels to watch
- The aussie extends rally to five-week highs at 0.7440.
- A higher risk appetite has boosted the Australian dollar.
- AUD/USD is heading towards 0.7450.
The Australian dollar has rallied for the fifth consecutive day on Friday, extending its rebound from 0.7170 lows in late September, to five-week highs at 0.7440, before pulling back to consolidate in the 0.7415/20 area.
Risk appetite has boosted the AUD
An improved market sentiment, with the stock markets advancing for the second consecutive day on the back of upbeat quarterly earnings by major banks and better than expected US retail sales have favored the risk-sensitive Aussie, weighing on safe assets like the US dollar.
Beyond that, the relaxation of COVID-19 restrictions in Sydney, the country’s most populated city after a four-month lockdown has improved optimism. Australian authorities have pledged that the quarantine required for vaccinated travelers that arrive in New South Wales would not be necessary since November 1, since the New South Wales state is set to reach an 80% first-vaccination dose rate on Saturday.
Furthermore, the Chinese central bank has finally assured that Evergrande’s risks to the financial system are “controllable” and unlikely to spread which has eased concerns about a chain reaction affecting the financial sector of the world’s second-largest economy.
AUD/USD heading towards 0.7450 – UOB
According to the FX analysis team at UOB, the pair is heading towards 0.7450: “There is no change in our view even though AUD could consolidate for a couple of days first before heading towards 0.7450. On the downside, a break of the ‘strong support’ at 0.7350 (level was at 0.7325 yesterday) would indicate that the current positive phase has come to an end.”
Technical levels to watch
- Gold, rejected at $1,800, retreats to levels below $1,770.
- Risk appetite and higher US bonds have hit gold futures.
- XAU/USD's bearish momentum might increase below $1,745.
Gold futures have dropped sharply on Friday, hurt by a combination of factors that have boosted appetite for risk. The yellow metal has depreciated more than $30 after having topped at $1,800 on Thursday, to find supporet right below $1,770 during the afternoon US trading session.
Upbeat data and a rebound of US yields have weighed on gold
Bullion has given away Thursday’s gains, amid a risk rally and a rebound on US T-Bond yields, which have dented the appeal of the safe-haven metal. The upbeat quarterly results on the financial sector, with Goldman Sachs reporting a 66% increase on earnings in the third quarter to conclude a string of better than expected readings on other major banks earlier this week, have boosted investors’ optimism and easing fears about inflationary pressures and supply chain disruptions.
On the other hand, long-term US T-Bond yields have bounced up, with the 10-year bond, which had dropped from the 1.61% top hit on Monday, to 1.51% on Thursday, has picked up to 1.55% on Friday, curbing attractive for gold, further.
The macroeconomic calendar has not been of any particular help for gold buyers either. The US retail sales have increased by 0.7% in September, according to data released by the Commerce Department on Friday, beating market expectations of a 0.4% increment, although partially due to higher prices, namely in auto dealers who are struggling with a global shortage of computer chips.
XAU/USD: Breach of 1.745 support might accelerate the decline
From a technical perspective, XAU/USD seems to have found buyers at $1.770 area to take a breather after a 1.8% reversal. Below here, the next potential support area lies at $1,745 (October 6 low) which would open the path towards a key support area at $1,725 (September 29, 30 low).
On the upside, resistance levels remain at $1,807 (Sept. 15 high) ahead of $1.830, July and September’s peak. If that level is surpassed, the next potential target might be June 8 and 11 highs at $1,905.
Technical levels to watch
- Western Texas Intermediate (WTI) rises as the winter season approaches, increases demand for energy products.
- OPEC+ decision was based on the belief that oil demand will wane once other energy markets stabilize.
- US Baker Hughes Rig Count for the week ending on October 15 increased to 543 from the estimated.
Western Texas Intermediate (WTI) is climbing for the seventh day in a row, gains 0.95%, is trading at $81.71 during the New York session at the time of writing. As the winter season for the northern hemisphere approaches, the shortage of gas and coal is spurring the demand for oil products.
Furthermore, the Organization of Petroleum Exporting Countries and its allies (OPEC+) stick to the 400K crude oil increase, despite efforts from the White House to expand it. According to delegates, in the last week, the group’s decision to keep their stance was based on the belief that the current tightness in the oil market is temporary and will pass once the gas, NGL, and coal markets stabilize.
In the meantime, the US Dollar Index is advancing 0.01%, sitting at 93.99, capped the upside move in the black gold, as a stronger dollar usually contains any upside reactions in the WTI price.
Meanwhile, the US Baker Hughes Rig Count increased to 543, more than the 540 estimates. Oil rigs increased to 445, from 433, 8 more than the expected, whereas Gas rigs decreased to 98 from 99, 2 less than foreseen.
The market’s reaction was seen an hour before the release when WTI dipped to $81.16. Once the Rig Count was known, WTI bounced off the day lows to settle around the $81.50-60 area.
WTI KEY ADDITIONAL LEVELS TO WATCH
- The kiwi extends gains beyond 0.7040 to approach 0.7100 area.
- Risk appetite is supporting the NZD against a weaker USD.
- NZD/USD: Breach of 0.6980 might send the pair to 0.7400 – Westpac.
New Zealand keeps heading north for the third consecutive day on Friday. The pair has breached previous highs at 0.7030/40 area and is reaching levels near 0.7100, on track to a 2.15% appreciation this week, after having lost about 4% in September's sell-off.
The NZD appreciates as the market sentiment brightens
The risk-sensitive kiwi has rallied sharply over the last three days on the back of a higher appetite for risk. The release of better-than-expected quarterly earnings in the financial sector has sent equity markets higher, weighing on safe assets like the USD.
The US Dollar Index, which measures the value of the dollar against the most traded currencies, has depreciated this week for the first time since late August. The greenback, which had reached one-year highs earlier this week, lost momentum over the last half of the week after the US CPI confirmed the persistent inflationary pressures in consumer prices, and the Fed reassured that they will start rolling back their monetary stimulus program before the end of the year.
Furthermore, The US Treasury yields' rally, has lost steam this week. The yield of the benchmark 10-year note retreated from levels above 1.60% on Monday to week lows around 1.51% on Thursday, while shorter-term yields have surged to multi-month highs, thus flattening the US yield curve.
NZD/USD: Breach of 0.6980 might send the pair towards 0.7400– Westpac
From a technical perspective, the FX Analysis team at Westpac observes the pair right below a key level, that might accelerate the uptrend: “NZD/USD has been rangebound inside 0.6860-0.6980, with few near-term directional clues. One possibility is that the downward correction since early September is complete, and a base is forming to launch a retest of 0.7200 multi-week, and 0.7400 by year-end”.
Technical levels to watch
- Euro recovery attempt remains capped below 1.1600.
- The common currency fails to take advantage of USD weakness.
- EUR/USD is expected to extend its decline towards 1.1100 – Scotiabank.
The euro keeps treading water on both sides of the 1.1600 level, unable to take advantage of a weaker US dollar. The common currency bounced up from year-to-date lows at 1.1520 earlier this week but is missing follow-through to post a significant recovery and remains hesitating between 1.1580 and 1.1620 for the second day in a row.
The euro inched up as the USD loses steam
The euro is set to close the week with gains, to put an end to a four-week decline. The market mood has improved this week, with quarterly earnings in the financial sector beating expectations, which has boosted appetite for risk, offsetting concerns about inflation and supply chain bottlenecks and hurting safe assets like the dollar.
The US Treasury yields rally, another source of strength for the US dollar, has lost steam this week. The yield of the benchmark 10-year note has retreated from levels above 1.60% on Monday to week lows around 1.51% on Thursday, with shorter-term yields rallying to multi-month highs, thus flattening the US yield curve.
Furthermore, some market sources suggest that the investors have “sold the fact” this week, closing long dollar positions after the US CPI confirmed that price inflation will remain for longer than previously expected and so did the Fed regarding their plan to start tapering bond purchases before the end of the year.
EUR/USD likely to extend losses towards 1.1100 – Scotiabank
The FX Analysis team at Scotiabank sees the current euro recovery as a selling opportunity within a longer-term bearish trend: “Gains have alleviated short-term bearish pressure on spot but longer-term (daily, weekly) trend studies remain firmly negative for the EUR; we expect limited EUR upside potential as a result (…) Minor, short-term gains are a selling opportunity; we continue to target the low 1.14s in the short run for EUR/USD and feel the 1.11 is reachable in the next few months.”
Technical levels to watch
- USD/CAD pares some weekly losses amid broad US dollar strength across the board.
- Risk-on market mood, depicted by US stock indexes, hurts safe-haven currencies, except for the greenback.
- The Loonie falls, despite rising crude oil prices.
The USD/CAD is advancing during the New York session, up 0.19%, trading at 1.2393 at the time of writing. An upbeat market sentiment surrounds the market portrayed by US equity indexes rising between 0.17% and 0.92%.
Western Texas Intermediate (WTI), the US benchmark for crude oil, which significantly influences the Canadian dollar, is rising 0.61%, trades at $81.42, failing to lift the CAD.
The US Dollar trims some weekly losses, rises above the 94.00 threshold
The US Dollar Index that tracks the greenback’s performance against a basket of rivals advances 0.03%, currently at 94.01, underpinned by the US 10-year benchmark note yield, which rises almost six basis points, sitting at 1.574%
On Friday, the Bank of Canada Governor Tim Macklem warned that the faster pace of price increases may persist longer than expected and may slow the pace of Canada’s economic recovery, as global supply-chain issues weigh on the domestic economy. Further added that bottlenecks, international shipping shortages, and higher oil prices are not easing as quickly as central bankers across the globe expected.
Moving to macroeconomic data, the Canadian docket featured Wholesale Sales for August, which rose by 0.3%, lower than the 0.5% estimated by economists. Regarding the US, September’s Retail Sales unexpectedly increased by 0.7%, better than the 0.2% contraction foreseen by analysts, whereas excluding autos, expanded 0.8% more than the 0.5% expected.
Additionally, the University of Michigan Consumer Sentiment Index came at 71.4, lower than the 72.8 expected by investors, the second-lowest reading since 2011, as consumers grew more worried about current conditions and the economic outlook.
USD/CAD Technical outlook: To plunge to 1.22 sooner than expected – Scotiabank
Economists at Scotiabank expect the USD/CAD pair to plunge to 1.2200 in the following few weeks:
“We continue to forecast 1.22 for year-end but feel the USD/CAD risks hitting that point in the next few weeks before perhaps rebounding somewhat in December.”
“There is little, obvious support for the USD until the low 1.22s (76.4% Fibonacci support at 1.2229), but we can see some potential congestion in the 1.2275/1.2325 range that may slow USD losses.”
“Resistance is 1.2340/45 and 1.25.”
USD/CAD KEY ADDITIONAL LEVELS TO WATCH
- The sterling trims gains after hitting a one-month high at 1.3775.
- Pound rally accelerates with risk appetite hurting the USD.
- GBP/USD, above 1.3750 resistance, heading towards 1.3820/25 – Scotiabank.
The British pound has rallied on Friday to break above 1.3750, reaching 1.3775 for the first time since mid-September. The pair has appreciated about 0.65% in the best daily performance over the last few weeks and is set to close the week with a substantial advance after having appreciated nearly 2.5% so far in October.
The pound appreciates with the US dollar losing momentum
The sterling has extended its recovery for the second consecutive week, buoyed by a higher appetite for risk, which is hurting the safe-haven dollar. The major stock indexes are closing the week on a strong note, buoyed by better than expected quarterly earnings in the financial sector, which have eased fears about surging inflation and supply chain disruptions.
The Dow Jones Index appreciates 0.8%, with the S&P 500 0.5% higher and the Nasdaq technical index 0.27% up at the time of writing. Goldman & Sachs has reported a 66% increase in the third quarter’s profit, beating expectations and extending optimism following upbeat earnings by JP Morgan, Citigroup, Wells Fargo and Bank of America released earlier this week.
Beyond that, higher expectations the Bank of England might be the first of the world’s major central banks to hike interest rates are also increasing demand for the GBP. With inflation accelerating at levels almost twice the Bank’s target for price stability, BoE officials have started to openly suggest the possibility of accelerating the monetary policy normalization plan.
On the macroeconomic domain, US retail sales increased 0.7% in September, twice the 0.4% increase expected by the markets. These figures, however, have been boosted partially by higher prices in auto dealers as the shortage of chips is boosting auto prices.
GBP/USD aiming towards 1.3820/25 after eroding the 1.3750 resistance – Scotiabank
From a broader perspective, the FX analysis team at Scotiabank sees the pair heading towards the 1.3820/25 area: “We spot minor resistance at 1.3750, with gains through here targeting 1.3820/25.”
Technical levels to watch
- The euro extends decline below 0.8450 to explore YTD lows nearing 0.8400.
- Risk appetite and BoE tightening expectations are underpinning the pound's rally.
- EUR/GBP: Below 0.8450 the pair could dive to 08281/39 – Credit Suisse.
The euro has extended its decline against a firmer British pound on Friday, breaking below the 0.8450 level for the first time since February 2020, to hit fresh lows at 0.8425 so far. The common currency has accelerated its decline this week and is set to post its third consecutive weekly decline.
Risk appetite, BoE hawkishness boosting the GBP
The sterling has been trading on a strong note over the last few days, with the market anticipating the Bank of England to lead the world’s major central banks and hike rates early next year. The escalating energy prices have boosted consumer prices to levels way past the Bank of England’s target for price stability and some Bank officials, including Governor Andrew Bailey, have openly suggested the need for some action to tackle inflationary pressures.
Furthermore, a risk rally, caused by upbeat quarterly earnings in the financial sector, has triggered substantial advances on the world’s major stock indexes easing concerns about inflation and supply chain bottlenecks. This has boosted the pound against the US dollar, which has increased bearish pressure on the euro.
EUR/GBP: Confirmation below 0.8437 might send the pair towards 0.8239 – Credit Suisse
The Credit Suisse FX Analysis team warn about a bearish confirmation below 0.8449/37: “Whilst we would again look for a fresh hold at 0.8449/37 and swing higher in the channel, a sustained move below 0.8437 would mark an acceleration in the downtrend, then exposing the key lows of 2019 and 2020 at 0.8281/39.”
Technical levels to watch
- AUD/USD extends its rally against the greenback for the seventh consecutive day.
- An upbeat market sentiment weighs on the US dollar safe-haven status.
- The PBoC said that Evergrande’s risks to the financial system are “controllable.”
- US Retail Sales rose by 0.7%, better than the 0.2% contraction foreseen.
The Australian dollar advances during the New York session, up some 0.12%, trading at 0.7425 at the time of writing. The market sentiment is upbeat, depicted by European and American stocks rising, whereas commodity-linked currencies like the AUD, the CAD, and the NZD trim earlier losses against the greenback.
DXY stalls at the 94.00 threshold on better than expected US data
The US Dollar Index that measures the buck’s performance versus its peers slides 0.11%, is at 93.87, despite a rebound after three days of consecutive losses, in the US 10-year note yield, which rises four and a half basis points, sitting at 1.561%.
Meanwhile, COVID-19 measures in Australia begin to ease. According to authorities, quarantine required for vaccinated travelers that arrive in New South Wales would not be necessary since November 1. The decision comes as the New South Wales state is set to reach an 80% first-vaccination dose rate on Saturday.
Nearby, in China, the PBoC central bank finally spoke about the Evergrande debt crisis, saying that risks to the financial system derived from the developer’s struggles are “controllable” and unlikely to spread. Furthermore, the central bank has asked lenders to keep the credit to the real estate sector “stable and orderly,” according to Zou Lan, PBoC head of the financial market department.
Data-wise, the Australian economic docket is absent. Concerning the US, Retail Sales for September surprisingly rose by 0.7%, higher than the 0.2% contraction estimated by analysts. Excluding autos and gas, sales increased by 0.7% more than the 0.5% in August.
Investors reacted positively to the data, as US equity indexes are rising between 0.50% and 0.65%, while the US T-bond yields trim this week’s losses.
Additionally, the University of Michigan Consumer Sentiment Index came at 71.4, lower than the 72.8 expected by investors, the second-lowest reading since 2011, as consumers grew more worried about current conditions and the economic outlook.
AUD/USD Price Forecast: Technical outlook.
The AUD/USD daily chart depicts the pair is tilted to the upside, has the 100-day moving average (DMA) under the spot price, and the Relative Strenght Index (RSI) at 65, which is aiming higher, supports the upward trend. However, to accelerate the upward move, a daily close above the September 3 high at 0.7477 could open the way towards the 200-DMA at 0.75670
AUD/USD KEY LEVELS TO WATCH
- XAU/USD has been on the back foot as US yields rise.
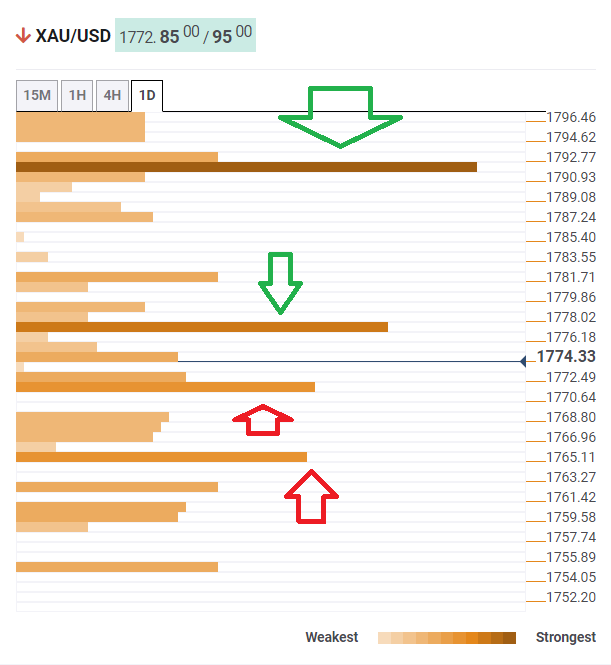
- The Confluence Detector is showing is that gold faces two hurdles ahead of $1,800
- Gold is not a dream risk-off hedge, nor is Bitcoin [Video]
Gold and Bitcoin – many tend to compare them, and this week, they have both made false breaks at round levels. The granddaddy of cryptos at $60,000, and the precious metal at $1,800. In gold's case, the drop can be attributed to the rise of US Treasury yields. The sell-off in bonds has put pressure on XAU/USD, especially after US Retail Sales shattered expectations.
How is gold technically positioned? Bears seem to have the upper hand.
The Technical Confluences Detector is showing that XAU/USD faces initial resistance at around $1,777, which is the convergence of the Bollinger Band 15min-Middle, 50-day Simple Moving Average and the Pivot Point one-week Resistance 1.
The bigger hurdle awaits gold at $1,791, which is where the Fibonacci 61.8% one-month, the SMA 50-1h and the BB one-day Upper all meet.
Some support awaits at $1,770, which is where the 5-day SMA and the BB 1h-Lower hit the price.
The next cushion is at $1,765, which is the confluence of the Fibonacci 38.2% one-month and the BB 15min-Lower.
XAU/USD resistance and support levels
Confluence Detector
The Confluence Detector finds exciting opportunities using Technical Confluences. The TC is a tool to locate and point out those price levels where there is a congestion of indicators, moving averages, Fibonacci levels, Pivot Points, etc. Knowing where these congestion points are located is very useful for the trader, and can be used as a basis for different strategies.
Learn more about Technical Confluence
- UoM Consumer Sentiment Index edged lower in early October.
- US Dollar Index continues to fluctuate around 94.00.
Consumer confidence in the US weakened modestly in October with the University of Michigan's Consumer Sentiment Index declining to 71.4 in October's flash reading from 72.8 in September. This print came in lower than the market expectation of 73.1.
Further details of the publication revealed that the Current Conditions Index edged lower to 77.9 from 80.1 and the Consumer Expectations Index fell to 67.2 from 68.1.
Commenting on the data, "the Delta variant, supply chain shortages, and reduced labor force participation rates will continue to dim the pace of consumer spending into 2022," said Richard Curtin, Surveys of Consumers chief economist.
Market reaction
This report doesn't seem to be having a noticeable impact on the dollar's performance against its rivals. As of writing, the US Dollar Index was virtually unchanged on the day at 94.00.
The GBP has taken advantage of the modestly softer USD tone to revisit the mid 1.37s. Above here, the cable would target the 1.3820/25 region, economists at Scotiabank report.
Trend signals are mixed
“We spot minor resistance at 1.3750, with gains through here targeting 1.3820/25.”
“Trend signals are mixed and not supportive of a stronger move up in the GBP at this point, however.”
The EUR/USD pair has steadied around the 1.16 level through late week trade. Though the world’s most popular currency pair is set to snap a five-week losing streak, economists at Scotiabank see EUR/USD diving as low as 1.11.
Limited euro upside potential
“Economic data have reflected softness in the industrial sector, the energy crunch persists and key ECB policy makers have suggested that policy accommodation will remain in place for some time. We continue to favour fading modest EUR gains.”
“Gains have alleviated short-term bearish pressure on spot but longer-term (daily, weekly) trend studies remain firmly negative for the EUR; we expect limited EUR upside potential as a result.”
“Minor, short-term gains are a selling opportunity; we continue to target the low 1.14s in the short run for EUR/USD and feel the 1.11 is reachable in the next few months.”
Zinc (LME) surged to more than $3,700/t on Friday while aluminium remains comfortably above $3,100/t. As for copper, LME prices have returned to over $10,000/t. An intensifying energy crisis and heightened inflation fears are reigniting investor enthusiasm for base metals.
Energy crisis and inflation fears to fuel metals
“The energy crisis has added fuel to the inflation debate in Europe, and rising energy costs will certainly push headline inflation higher for some time. Meanwhile, our US economist has pointed out that there are cracks in the Federal Reserve’s ‘transitory’ narrative in terms of inflation.”
“Fears of inflation could increase demand for metals as there is a perception that they are a hedge against inflation, which is especially true for copper. In the meantime, a retreat in US real rates, along with the broad trade-weighted dollar index over the last couple of days, is also driving momentum.”
“The recent stronger renminbi has accentuated the broader demand expectations for commodities from China and has led to the open of import arbitrage in some metals. The broad trade-weighted renminbi is up nearly 6%.”
- Wall Street's main indexes continue to push higher on Friday.
- All major sectors of the S&P 500 trade in the positive territory.
- Rising crude oil prices provide a boost to energy stocks.
After registering impressive gains on Thursday, major equity indexes opened higher on Friday. As of writing, the S&P 500 was up 0.45% on the day at 4,457, the Dow Jones Industrial Average was rising 0.65% at 35,141 and the Nasdaq Composite Index was gaining 0.3% at 14,864.
All major sectors of the S&P 500 trade in the positive territory as the CBOE Volatility Index (VIX), Wall Street's fear gauge, is losing 2% at 16.5.
With the barrel of West Texas Intermediate rising nearly 1% and trading above $82, the Energy Index is up 1.1% in the early trade. In the meantime, the more-than-3% increase witnessed in the benchmark 10-year US Treasury bond yield is supporting the Financials Index, which was last seen gaining 0.8%.
Earlier in the day, the data published by the US Census Bureau showed that Retail Sales rose by 0.7% on a monthly basis in September. This reading came in much better than the market expectation for a decrease of 0.2% and helped the mood remain upbeat ahead of the weekend.
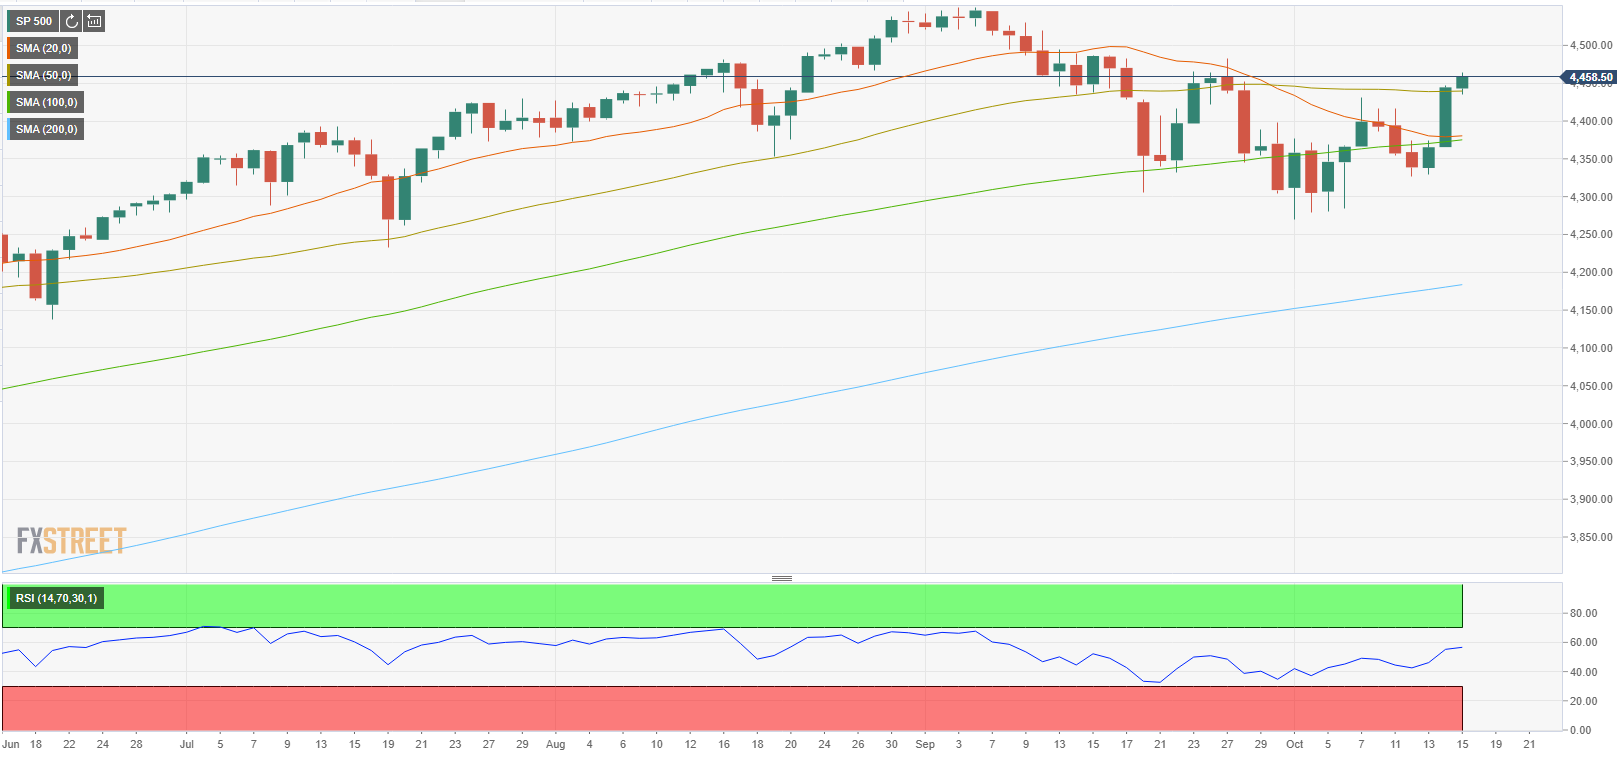
S&P 500 chart (daily)
The CAD has made marginal progress to probe the mid-1.23 zone. Economists at Scotiabank expect the USD/CAD pair to slump to the 1.22 mark in the next few weeks.
Potential congestion in the 1.2275/1.2325 range
“We continue to forecast 1.22 for year-end but feel the USD/CAD risks hitting that point in the next few weeks before perhaps rebounding somewhat in December.”
“The pro-risk mood is CAD supportive alongside high energy prices. Note, however, that the 2Y spread, while still CAD-supportive, did narrow some 5bps yesterday. That may impede the CAD’s progress somewhat.”
“There is little, obvious support for the USD until the low 1.22s (76.4% Fibonacci support at 1.2229) but we can see some potential congestion in the 1.2275/1.2325 range that may slow USD losses.”
“Resistance is 1.2340/45 and 1.25.”
- EUR/USD faces some pressure and drops below 1.1600.
- The greenback clings to daily gains just above 94.00.
- US Retail Sales surprised to the upside in September.
After climbing to daily tops near 1.1620, EUR/USD met some selling pressure and now recedes back to the sub-1.1600 area at the end of the week.
EUR/USD stays capped by the 1.1620 area
The earlier bullish attempt to the 1.1620 zone lacked follow through and forced EUR/USD to give away initial gains and return to the 1.1600 neighbourhood.
The dollar, in the meantime, clings to the positive territory just above the 94.00 yardstick after US Retail Sales expanded at a monthly 0.7% in September while sales excluding Autos expanded 0.8% inter-month, both prints bettering estimates.
Further US data saw the Export Prices rising 0.1% MoM during last month and Import Prices advancing 0.4%. In addition, the NY Empire State Index deflated to 19.8 for the current month (from 34.3). Later in the session the preliminary gauge of the Consumer Sentiment is also due.
EUR/USD levels to watch
So far, spot is gaining 0.08% at 1.1606 and faces the next up barrier at 1.1624 (weekly high Oct.14) followed by 1.1640 (weekly high Oct.4) and finally 1.1727 (55-day SMA). On the other hand, a break below 1.1576 (10-day SMA) would target 1.1524 (2021 low Oct.12) en route to 1.1495 (high Mar.9 2020).
S&P 500 has gapped higher for a fresh and concerted test of key resistance from its 63-day average and price/gap resistance at 4423/43. A close above here would suggest the correction lower is over, with 4465 then seen as the trigger to a move back to the high at 4546, the Credit Suisse analyst team reports.
Close above 4443 to suggest the worst of the corrective setback is over
“A close above 4423/43 would suggest the worst of the corrective setback may already be over with resistance then seen next at the 4465 late September high. Above here should be sufficient to then clear the way for a move back to 4486/87 initially ahead of an eventual retest of the 4546 record high.”
“If 4443 continues to cap on a closing basis then the potential for a deeper corrective setback will remain seen with support seen at 4430 initially, then 4417.”
“Below the price gap from yesterday morning at 4387/64 though is needed to warn of a fall back to the 4329 low from earlier in the week.”
- USD/JPY preserves its bullish momentum in the early American session.
- 10-year US Treasury bond yield is rising more than 3%.
- Retail Sales in the US rose unexpectedly in September.
The USD/JPY pair extended its daily rally in the early trading hours of the American session and was last seen trading at its strongest level in three years at 114.44, rising 0.68% on a daily basis.
10-year US T-bond yield rises sharply
The decisive rebound witnessed in the US Treasury bond yields following a three-day slide seems to be fueling USD/JPY's upside ahead of the weekend. The benchmark 10-year US T-bond yield is currently up 3.37% on the day at 1.565%.
Meanwhile, the upbeat data from the US seems to be helping the dollar stay resilient against its major rivals. At the moment, the US Dollar Index is posting small daily gains at 94.02. The US Census Bureau reported on Friday that Retail Sales in September increased by 0.7% on a monthly basis to $625.4 billion in September. This reading beat the market expectation for a contraction of 0.2%:
Meanwhile, US stocks index futures stay in the positive territory minutes ahead of the opening bell, suggesting that the risk-positive market environment is likely to allow USD/JPY to preserve its bullish momentum.
Later in the session, the University of Michigan's preliminary Consumer Sentiment Index data for October will be the last data release of the week from the US.
Technical levels to watch for
In an interview with Bloomberg on Friday, European Central Bank (ECB) Governing Council member Francois Villeroy de Galhau said that the ECB's toolbox needs flexibility for times of stress, as reported by Reuters.
Villeroy further explained that there can be various means to keep the Pandemic Emergency Purchase Program's (PEPP) virtual flexibility as a contingent option and noted that they need to study them until December.
Market reaction
These comments don't seem to be having a noticeable impact on the shared currency's performance against its rivals. As of writing, the EUR/USD pair was virtually unchanged on a daily basis at 1.1594.
- Gold is suffering heavy losses ahead of the weekend.
- 10-year US Treasury bond yield is up more than 2% on Friday.
- US Dollar Index stays near 94.00 after US Retail Sales data.
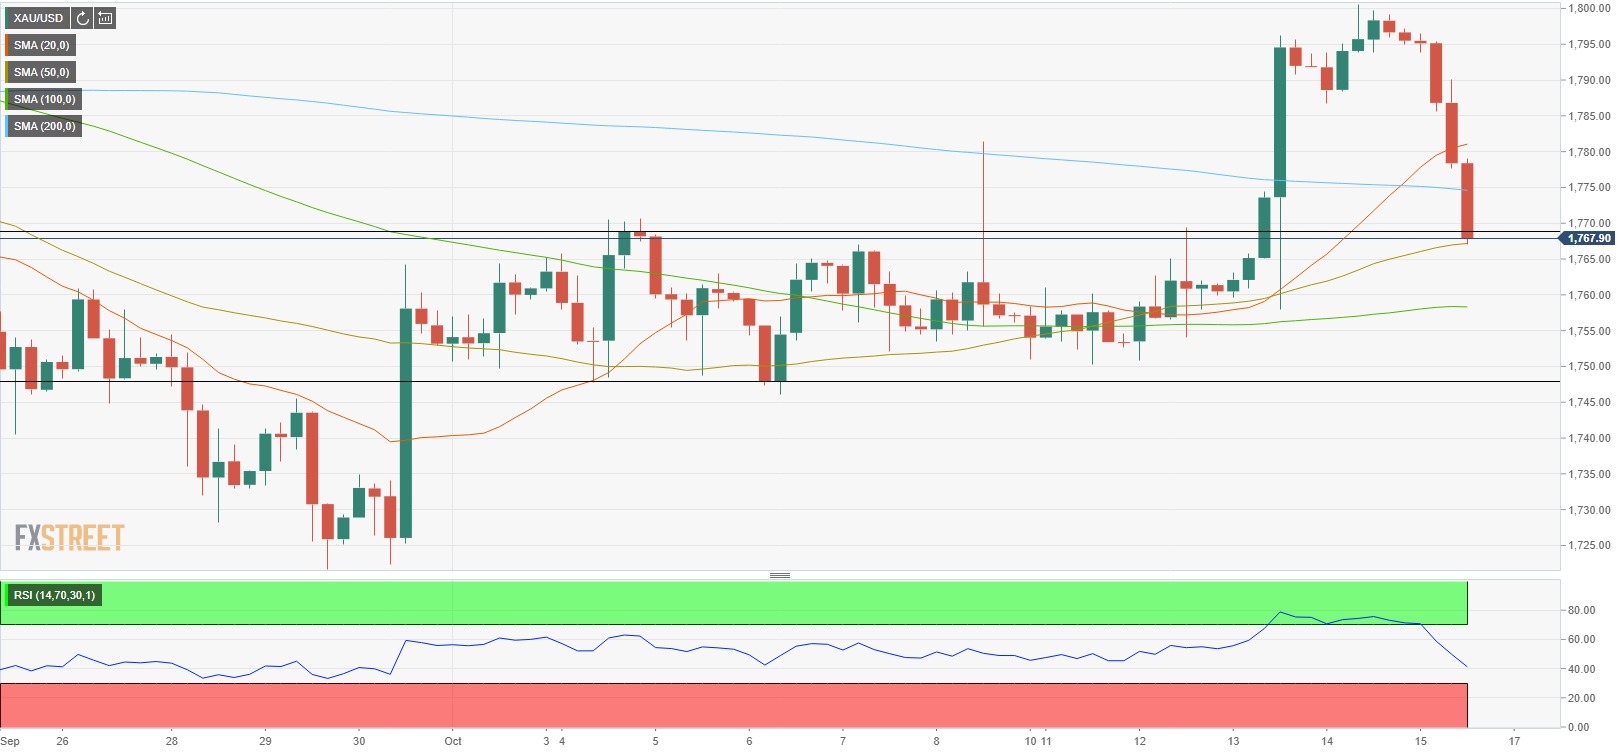
Gold started the last day of the week on the back foot and extended its slide to a fresh daily low of $1,770 in the early trading hours of the American session. As of writing, the XAU/USD pair was down 1.2% on the day at $1,774.
The sharp rebound witnessed in the US Treasury bond yields seem to be weighing heavily on XAU/USD on Friday. The benchmark 10-year US T-bond yield, which closed the previous three days in the negative territory, is currently rising 2.3% at 1.55%.
Meanwhile, the upbeat data from the US is helping the greenback find demand as well. The US Census Bureau reported that Retail Sales in September rose by 0.7% on a monthly basis, surpassing the market expectation for a contraction of 0.2% by a wide margin. Moreover, August's increase of 0.7% got revised higher to 0.9%.
At the moment, the US Dollar Index is steady around 94.00. Later in the session, the University of Michigan's preliminary October Consumer Sentiment Index will be looked upon for fresh impetus.
It's also worth noting that US stock index futures are up between 0.35% and 0.6% on the day, suggesting that risk flows are likely to dominate the financial markets ahead of the weekend.
Gold technical outlook
On the four-hour chart, gold is trading below the 200-period SMA. Additionally, the Relative Strength Index (RSI) indicator stays around 40, suggesting that there is more room on the downside before XAU/USD becomes technically oversold.
The previous static resistance at $1,768 now aligns as the first support before $1,758 (100-period SMA) and $1,750 (static level). On the upside, the initial hurdle is located at $1,775 (200-period SMA). In case the pair manages to make a daily close above that level, buyers could look to test $1,800 (psychological level).
Additional levels to watch for
UOB Group’s Head of Research Suan Teck Kin, CFA, reviews the latest inflation figures in the US economy.
Key Quotes
“On Wed (13 Oct), the latest CPI data released by US Bureau of Labor Statistics (BLS) showed consumer prices in Sep rose by 5.4% y/y from 5.2% in Aug, and at the fastest pace since Jul 2008. The outcome beat market expectation for a 5.3% gain. On a m/m basis, the headline CPI edged higher at 0.4%, ahead of both the reading for Aug and market expectation of 0.3%.”
“Core CPI (which excludes food and energy) in Sep rose by 4% y/y (same pace as in Aug) and 0.2% m/m, higher compared to 0.1% in Aug.”
“YTD to Sep, the headline CPI averaged about 4.0%, which is on track to meet our forecast of 4.5% for 2021, before easing to 2.0% in 2022. Core CPI averaged around 3.1% YTD and is also headed towards our 3.5% target for this year before easing to 1.6% in 2022. We anticipate further inflationary pressures in the US in the remaining months of the year, given the range of factors driving up prices that will take time to resolve: recovering consumer demand, logistics bottlenecks, supply disruptions including key components such as semiconductors and in major production hubs including Vietnam and China, as well as elevated commodities and energy prices.”
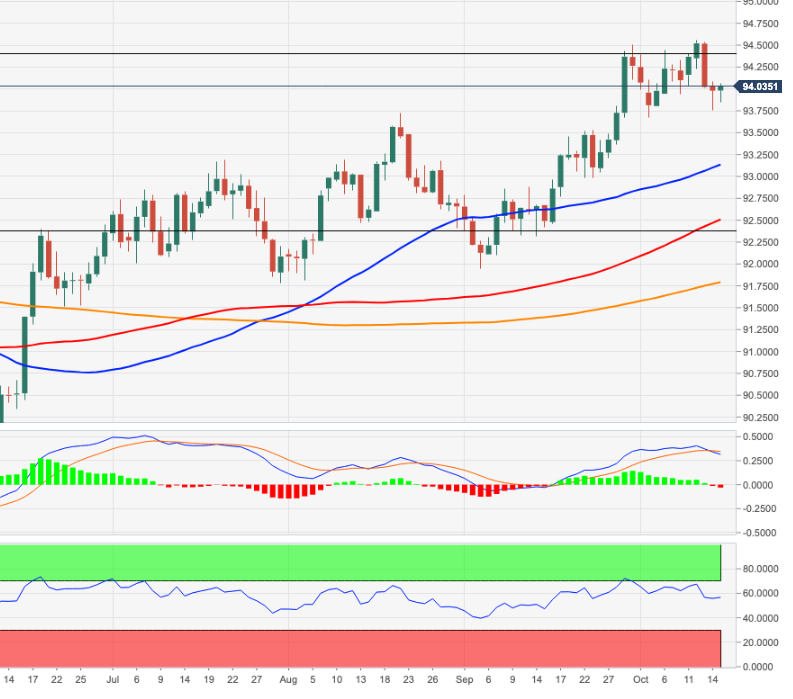
- DXY looks initially contained by the weekly low around 93.75.
- Further consolidation looks likely ahead of further gains.
DXY remains on the defensive although the downside seems limited around 93.75 so far.
The index could attempt some consolidation ahead of the resumption of the upside as long as 93.75 holds the downside in the near term. The loss of this level is expected to pave the way for a deeper move to the mid-93.00s. On the upside, there are no levels of significance until the 2021 high at 94.56 (October 12).
Looking at the broader picture, the constructive stance on the index is seen unchanged above the 200-day SMA at 91.79
DXY daily chart
Retail Sales in the US rose by 0.7% on a monthly basis to $625.4 billion in September, the data published by the US Census Bureau revealed on Friday. This reading followed August's increase of 0.9% (revised from 0.7%) and came in much better than the market expectation for a decline of 0.2%.
Further details of the publication showed that Retail Sales Excluding Autos were up 0.8% in the same period, compared to the market expectation of 0.5%.
"Total sales for the July 2021 through September 2021 period were up 14.9% from the same period a year ago," the press release read.
Market reaction
The greenback seems to have started to gather strength against its rivals after this report and the US Dollar Index was last seen posting small daily gains at 94.05.
In an interview with CNBC on Friday, Richmond Federal Reserve Bank President Thomas Barkin noted that inflation in the US is heavily driven by the auto sector, as reported by Reuters.
Barkin further said that eventual rate rises depend on inflation and the state of the labour market. "The Fed has gone a long way toward meeting inflation and jobs goals," he added.
Market reaction
These comments don't seem to be having a significant impact on the greenback's performance against its major rivals. As of writing, the US Dollar Index was virtually unchanged on the day at 94.00.
Economist at UOB Group Ho Woei Chen, CFA, comments on the release of the Producer Prices in the Chinese economy.
Key Takeaways
“China’s Producer Price Index (PPI) inflation surged to a record high of 10.7% y/y in September (Bloomberg est: 10.5%; Aug: 9.5%) while Consumer Price Index (CPI) rose at a more subdued pace of 0.7% y/y (Bloomberg est: 0.8%; Aug: 0.8%) due to a larger food price deflation.”
“We estimate the impact of the electricity price hike will bring the PPI close to 12% y/y in 4Q21. With the PPI averaging 6.7% y/y YTD and further upside price pressure, we are raising our full-year PPI forecast to 8.0% from 7.5% (2020: -1.8%).”
“CPI inflation averaged just 0.6% y/y YTD as a result of limited pass-through from higher PPI. Having said that, we expect CPI gains to pick up in 4Q21, due to a low base of comparison while pass-through from higher energy prices is also expected to increase. For now, we maintain our full-year 2021 CPI forecast at 0.8% (2020: 2.5%) with consumer price inflation expected to rise to 1.7% y/y in 4Q21.”
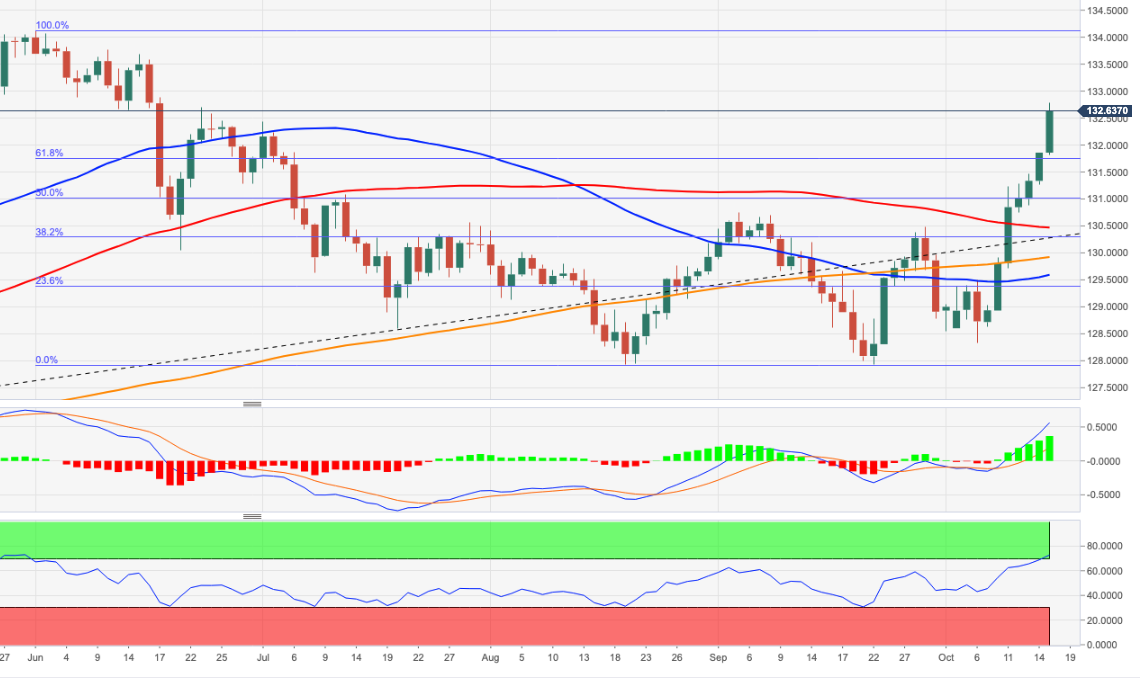
- EUR/JPY regains the 132.00 mark and above on Friday.
- The next target of relevance comes at the YTD peaks past 134.00.
EUR/JPY’s march north remains unabated and already surpassed the key barrier at 132.00 the figure on Friday.
The abrupt move higher in the cross left behind minor resistance levels at Fibo retracements and now faces the next hurdle at the Fibo level at 132.79. Further up from here there are no obstacles of relevance until the 2021 high at 134.12 recorded on June 1.
In the broader scenario, while above the 200-day SMA at 129.88, the outlook for EUR/JPY is expected to remain constructive.
EUR/JPY daily chart
- GBP/USD preserves its bullish momentum ahead of the weekend.
- Upbeat market mood seems to be providing a boost to GBP/USD.
- US Dollar Index stays below 94.00 ahead of September Retail Sales data.
After posting small daily gains on Thursday, the GBP/USD pair regathered bullish momentum in the early trading hours of the European session on Friday and reached its strongest level since September 17 at 1.3758. As of writing, the pair was up 0.6% on the day at 1.3755.
The risk-positive market environment ahead of the weekend seems to be helping GBP/USD push higher. Reflecting the upbeat market mood, the UK's FTSE Index is up 0.3% on the day and the US stocks futures are up between 0.3% and 0.45% ahead of Wall Street's opening bell.
On the other hand, the US Dollar Index (DXY) stays in a consolidation phase below 94.00 as investors await the September Retail Sales report and the University of Michigan's advanced October Consumer Sentiment Index data. Nevertheless, the 2% recovery witnessed in the benchmark 10-year US T-bond yield seems to be helping the DXY limit its losses.
US Michigan Consumer Sentiment September Preview: Happy consumer, happy economy?
Meanwhile, investors will keep a close eye on fresh Brexit developments. Maroš Šefčovič, European Commission Vice President, and David Frost, the British minister responsible for implementing the Brexit deal, will be meeting in Brussels on Friday to discuss the EU's proposal on the Northern Ireland protocol.
Technical levels to watch for
- USD/CAD is edging lower for the fourth straight day on Friday.
- WTI trades at fresh multi-year highs above $82.
- Eyes on US Retail Sales and consumer sentiment data.
After closing the previous three trading days in the negative territory, the USD/CAD pair extended its slide on Friday and touched its lowest level since early July at 1.2336 before going into a consolidation phase. As of writing, the pair was down 0.15% on the day at 1.2349.
Eyes on US data
Rising crude oil prices continue to provide a boost to the commodity-related loonie ahead of the weekend. The barrel of West Texas Intermediate (WTI) is currently trading at its highest level in nearly four years at $82, rising 0.7% on a daily basis.
On the other hand, the risk-positive market environment makes it difficult for the greenback to gather strength on Friday despite a 2% rebound witnessed in the benchmark 10-year US Treasury bond yields. Currently, the US Dollar Index is posting small losses around 93.90, not allowing USD/CAD to gain traction.
Meanwhile, Wall Street's main indexes remain on track to open higher following Thursday's upsurge with the US stock index futures rising between 0.25% and 0.42%.
Later in the session, the US Census Bureau will release the September Retail Sales data. The University of Michigan's preliminary Consumer Sentiment Index for October will be featured in the US economic docket as well.
US Michigan Consumer Sentiment September Preview: Happy consumer, happy economy?
Technical levels to watch for
- A combination of factors prompted some selling around gold on Friday.
- The risk-on mood, rebounding US bond yields weighed on the XAU/USD.
- A subdued USD price action might lend some support to the commodity.
- Gold Price Forecast: XAU/USD bulls testing bears’ commitment at crucial daily resistance, US consumer data eyed
Having failed to conquer the $1,800 mark on Thursday, gold witnessed some selling on the last day of the week and snapped three consecutive days of the winning streak to near one-month tops. The intraday retracement slide extended through the first half of the European session and dragged the XAU/USD to fresh daily lows, around the $1,781-80 region in the last hour. The prevalent risk-on mood – as depicted by a generally positive tone around the equity markets – was seen as a key factor that acted as a headwind for the safe-haven precious metal.
Adding to this, a solid rebound in the US Treasury bond yields and prospects for an early policy tightening by the Fed further undermined the non-yielding gold. The latest FOMC meeting minutes released on Wednesday revealed that the Fed remains on track to begin rolling back its massive pandemic-era stimulus by the end of 2021. The markets have also started pricing in the possibility of an interest rate hike in 2022 amid worries that the recent widespread rally in commodity prices will stoke inflation. That said, a combination of factors warrant some caution before confirming that the XAU/USD has topped out in the near term.
Gold, which is considered as a hedge against inflation, should benefit from growing market fears about a faster than expected rise in inflationary pressure. This comes amid signs of a slowdown in the global economic recovery, which have been fueling concerns over the return of stagflation and should further extend some support to the safe-haven XAU/USD. Apart from this, a subdued US dollar price action might further hold traders from placing aggressive bearish bets around the dollar-denominated commodity and limit the downside, at least for now.
Market participants now look forward to the US economic docket – highlighting the release of monthly Retail Sales, Empire State Manufacturing Index and Prelim Michigan Consumer Sentiment Index. This, along with the US bond yields and a scheduled speech by New York Fed President John Williams, will influence the USD price dynamics later during the early North American session. Traders might further take cues from the broader market risk sentiment to grab some short-term opportunities around gold.
Technical outlook
From current levels, any subsequent decline is likely to find decent support near the $1,775-73 region. Sustained weakness below might prompt some technical selling and drag spot prices back towards the $1,750 static support. A convincing break below will shift the bias back in favour of bearish traders and turn the XAU/USD vulnerable to retest September monthly swing lows, around the $1,722-21 zone. On the flip side, bulls are likely to wait for a sustained strength above the $1,800 mark before placing fresh bets. Gold might then accelerate the momentum further towards the $1,816-18 intermediate hurdle before eventually darting towards the $1,832-34 heavy supply zone.
UOB Group’s Head of Research Suan Teck Kin, CFA, comments on the recently published FOMC Minutes of the September 21-22 meeting.
Key Takeaways
“In the 21-22 Sep FOMC minutes… policymakers at the US Federal Reserve (Fed) indicated the central bank could begin tapering its US$120 bn monthly bond purchase program starting from mid-Nov or mid-Dec. The minutes read that participants noted that ‘if a decision to begin tapering purchases occurred at the next meeting, the process of tapering could commence with the monthly purchase calendars beginning in either mid-November or mid-December’.”
“The minutes noted that committee members commented on the “illustrative path” developed by the Fed staff on the tapering process as a “straightforward and appropriate” template that policymakers might follow. Some participants said that giving advance notice to the public may reduce the risk of an “adverse market reaction” to the tapering process. The path featured monthly reductions in the pace of asset purchases by US$10 bn of US Treasury and US$5 bn of agency mortgage-backed securities (MBS). Several participants though noted that they preferred to proceed with “a more rapid moderation” of purchases than described in the illustrative examples.”
“While noting that labor market conditions had continued to improve in recent months, participants also expected the labor market to continue to improve in coming months.”
“On inflation, participants acknowledged that inflation rate was “elevated” and they expected it would “likely remain so in coming months before moderating”, although it reflected largely “transitory” factors.”
“The latest FOMC minutes essentially reaffirm the view that the tapering process is set to begin from Nov 2021, and complete in about 8 months’ time, as laid out in our earlier report, so as to allow for greater policy flexibility for the Fed should there be a need to hike the Fed funds interest rates earlier than our projected “lift off” in Dec 2022.”
“By the end of the tapering in July 2022, we are projecting one 25bps hike of the Fed funds rate to 0.25-0.50% at end-2022, followed by two more 25bps hikes in 2023.”
Finally, the Chinese central bank, the People Bank of China (PBOC) is out with its take on the persisting concerns over the indebted China Evergrande Group.
Key takeaways
“PBOC urges developers, shareholders, to fulfill debt obligations.”
“China asks banks to keep stable, orderly loans to real estate.”
more to come ...
Economist at UOB Group Barnabas Gan, Senior FX Strategist Peter Chia and Rates Strategist Victor Yong assess the latest decision by the MAS.
Key Takeaways
“Based on the advance estimates by the Ministry of Trade and Industry (MTI), Singapore’s 3Q21 GDP expanded 6.5% y/y (+0.8% q/q sa), disappointing market estimates at 6.6% y/y (+1.1% q/q sa).”
“Policy makers kept their GDP growth outlook in 2021 at a range of 6-7% while recognising an “above trend” growth pace in 2022. Moreover, they cite that labour conditions will continue to tighten and the negative output gap is expected to close in 2022.”
“Singapore’s growth momentum has continued to strengthen materially since the start of 2021. Year-to-date, high-frequency data such as manufacturing and NODX supported the positive outlook.”
“Meanwhile, the MAS has slightly raised the slope of the S$NEER policy band, from zero percent previously. The width of the policy band and the level at which it is centred will be unchanged. The MAS cited that the ‘appreciation path for the S$NEER policy band will ensure price stability over the medium term while recognising the risks to the economic recovery’.”
“The surprise decision by MAS to tighten its policy this morning suggests that policymakers are increasingly cautious over inflationary pressures over the medium term. Barring any unexpected deterioration of economic conditions, we think that further tightening in April 2022 and beyond is possible to normalise policy stance to pre-pandemic levels. As such, we think that another ‘slight’ steepening of the policy band in April 2022 by another 0.5% may be possible, to bring the full gradient to 1.0% then.”
- A combination of supporting factors assisted GBP/JPY to gain strong traction on Friday.
- The momentum took along trading stops placed near the 156.00 mark/previous YTD tops.
- Bulls might opt to take some profits off the table amid extremely overbought conditions.
The GBP/JPY cross continued scaling higher through the first half of the European session and surged to the highest level since June 2016 in the last hour. Bulls are now looking to build on the momentum further beyond the 157.00 round-figure mark.
The cross prolonged its recent strong bullish trajectory that has been underway since the beginning of this month and gained strong follow-through traction on the last day of the week. This marked the seventh successive day of a positive move – also the tenth in the previous eleven – and was supported by a combination of factors.
The Japanese government – in the October economic report – slashed its view on exports for the first time in seven months and said that the pace of economic recovery is slowing. This comes amid the prevalent risk-on mood in the financial markets, which was seen as a key factor that weighed heavily on the safe-haven Japanese yen.
On the other hand, the British pound was supported by positive Brexit-related development. After days of rising tensions, the European Union agreed to scrap most checks on goods and medicines arriving into Northern Ireland from the rest of the UK. This, along with rising bets for a BoE rate hike this year, acted as a tailwind for the sterling.
The momentum took along some short-term trading stops placed near the previous YTD tops, around the 156.00 mark. This seemed to have prompted aggressive short-covering and further contributed to the strong bid surrounding the GBP/JPY cross. With the latest leg up, the cross has now rallied nearly 800 pips from monthly swing lows, around the 149.20 area.
Meanwhile, technical indicators on short-term charts are already flashing overbought conditions and warrant some caution for bullish traders. Hence, it will now be interesting to see if the GBP/JPY cross continues with its positive move or bulls opt to take some profits off the table heading into the weekend.
Technical levels to watch
- USD/TRY extends its six-day winning streak above 9.00
- Turkish central bank drama continues to overwhelm lira bulls.
- Bull cross outweighs overbought RSI conditions, with more record highs in the making.
The buying interest around USD/TRY remains unabated, as the price extends its six-day winning streak, making fresh lifetime highs near the 9.25 region.
The upside in the spot got an additional boost, as the lira slumped to record lows after the question on the Turkish central bank’s credibility was raised once again.
This came after the country’s President Tayyip Erdoğan sacked deputy central bank governors Semih Tumen and Ugur Namik Kucuk as well as Abdullah Yavas, a member of the bank’s monetary policy committee early Thursday.
Looking at USD/TRY technically, the price remains on track to touch the 9.50 psychological barrier, with the bullish crossover in play on the daily time frame.
The 50-Daily Moving Average (DMA) crossed the 100-DMA for the upside on Wednesday, triggering a fresh leg higher in the cross.
Given that, the bulls seem to ignore a sign of caution, indicated by the overbought Relative Strength Index (RSI) conditions on the daily chart.
USD/TRY: Daily chart
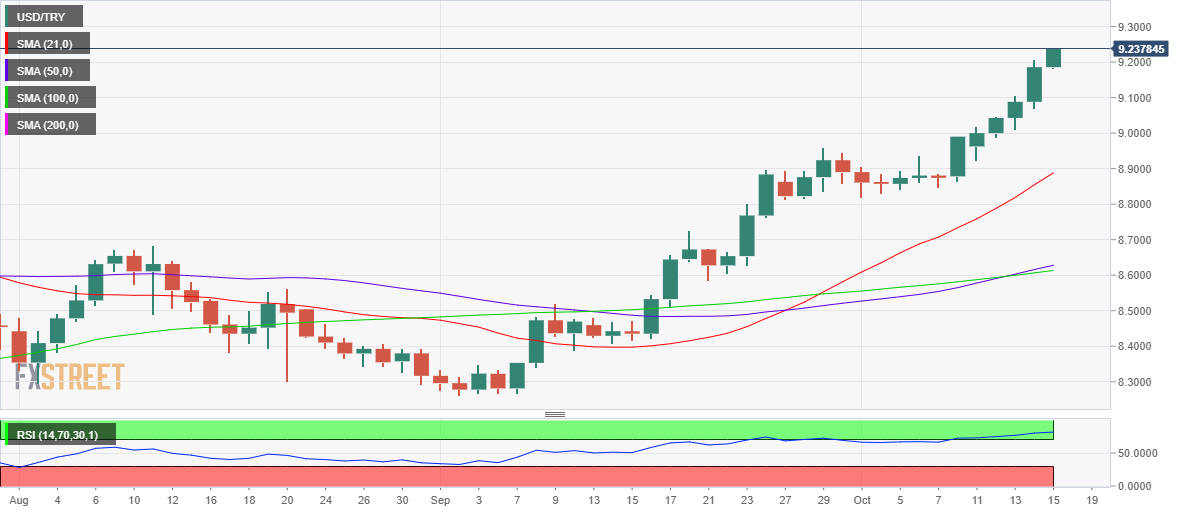
On the downside, immediate support awaits at the 9.00 threshold, below that a drop towards the upward-pointing 21-DMA at 8.88 cannot be ruled out.
If the bearish pressure intensifies, then the sellers will target the September 24 lows of 8.76.
- EUR/USD extends the weekly rebound beyond 1.1600.
- Persistent selling pressure in the dollar helps the pair’s upside.
- US Retail Sales, U-Mich Index take centre stage later on Friday.
The optimism around the single currency and the broader risk complex remains well and sound and now pushes EUR/USD back above the key 1.1600 barrier at the end of the week.
EUR/USD up on dollar selling
EUR/USD advances for the third consecutive session for the first time since late August on Friday, always in response to the steady/bearish stance surrounding the greenback and the investors’ appetite for riskier assets.
The move higher in spot comes on the back of the recovery in yields of the German 10-year Bund along with the rebound in US yields in the belly and the long end of the curve.
In the docket, the final CPI in France rose 2.2% in a year to September while the Italian CPI advanced 2.5% during the same period. Additionally, the trade surplus in the Euroland shrank abruptly to €4.8B during August.
Later in the NA calendar, September’s Retail Sales will be in the limelight along with the U-Mich index, the NY Empire State Index as well as Export and Import Prices.
What to look for around EUR
EUR/USD woke up and regained the 1.1600 mark on the back of the corrective downside in the dollar following recent YTD highs. Despite the move higher, the pair still could not close a session above that barrier. In the meantime, dollar dynamics are expected to keep dictating the price action around the pair for the time being. The firmer tone in the buck along with higher US yields and bouts of risk aversion – particularly in response to inflation jitters and the energy crunch - continue to undermine the performance of the risk universe, while the growth outlook appears under pressure on rising speculations that the inflation could take longer to reverse the ongoing elevated levels. In addition, the likely loss of momentum in the economic recovery, as per some weakness seen in key fundamentals, also caps the upside potential in the pair.
Key events in the euro area this week : European Council Meeting, EMU Balance of Trade (Friday).
Eminent issues on the back boiler: Asymmetric economic recovery in the region. Sustainability of the pick-up in inflation figures. Progress of the Delta variant of the coronavirus and pace of the vaccination campaign. Probable political effervescence around the EU Recovery Fund. Investors’ shift to European equities in the wake of the pandemic could lend extra oxygen to the single currency. ECB tapering speculations.
EUR/USD levels to watch
So far, spot is gaining 0.08% at 1.1606 and faces the next up barrier at 1.1624 (weekly high Oct.14) followed by 1.1640 (weekly high Oct.4) and finally 1.1727 (55-day SMA). On the other hand, a break below 1.1576 (10-day SMA) would target 1.1524 (2021 low Oct.12) en route to 1.1495 (high Mar.9 2020).
“Global oil consumption could return to pre-crisis levels by next year,” Russia's Gazprom Neft Chief Executive Officer (CEO) Alexander Dyukov said in a statement on Friday.
“Global oil market will stabilize in nearest future,” Dyukov added.
Related reads
- Russia’s Novak: Average crude oil output seen at 9.8 mln bpd in October
- Brent Oil may trade as high as $100/bbl in the depth of winter – TDS
- A combination of factors prompted fresh selling around EUR/GBP on Friday.
- Dovish ECB tilt was seen as a key factor behind the euro’s underperformance.
- Positive Brexit-related headlines underpinned the GBP and exerted pressure.
The EUR/GBP cross witnessed heavy selling during the early European session and refreshed daily lows, around the 0.8455 region in the last hour.
The cross struggled to capitalize on a modest intraday uptick, instead met with some fresh supply near the 0.8485 area and has now drifted back closer to YTD lows touched on August 12. The shared currency's relative underperformance comes amid a flurry of dovish comments by core members of the ECB, stressing that the recent rise in inflationary pressures is mostly transitory.
The ECB President, Christine Lagarde said on Thursday the upswing in inflation is largely driven by temporary factors. This was followed by comments by the ECB governing council member, Pierre Wunsch, noting that the rising price pressures in the Euro area are transitory. This underscores the policymakers' desire to avoid any premature withdrawal of policy accommodation.
Conversely, the money market had fully priced in a 25bps rate hike by the Bank of England in December, though two officials signalled that they’re in no rush to raise interest rates. Nevertheless, a more hawkish BoE acted as a tailwind for the British pound, which was further supported by positive developments around the Northern Ireland Protocol of the Brexit agreement.
After days of rising tensions, the European Union agreed to scrap most checks on goods and medicines arriving into Northern Ireland from the rest of the UK. That said, fears that the UK will reject the EU's proposal might hold the GBP bulls from placing aggressive bets. This, along with a weaker US dollar, might lend some support to the euro and limit losses for the EUR/GBP cross.
Hence, it will be prudent to wait for some follow-through selling below mid-0.8400s before positioning for an extension of the recent depreciating move witnessed over the past three weeks or so. The EUR/GBP cross might then accelerate the downward trajectory towards testing the next relevant support near the 0.8400 round-figure mark.
Technical levels to watch
Russian Energy Minister Alexander Novak said on Friday, “average crude oil output is seen at 9.8 million barrels per day (bpd) in October.”
Key quotes
“Gas production in Russia running at maximum capacity.”
“Spot gas sales could resume once filling of Russian gas storages is completed.”
Market reaction
WTI is consolidating around the $81.50 mark, up 0.85% on the day, having reached fresh multi-year highs at $81.75 earlier on.
In view of FX Strategists, a break below 6.4240 should allow for a deeper pullback in USD/CNH in the short-term horizon.
Key Quotes
24-hour view: “We highlighted yesterday that the weakness in USD could ‘retest the 6.4240 level before stabilization can be expected’. However, USD traded between 6.4273 and 6.4391 before closing at 6.4350 (+0.10%). The quiet price actions are viewed as part of a consolidation and USD is likely to trade sideways for today, expected to be within a range of 6.4280/6.4480.”
Next 1-3 weeks: “There is not much to add to our update from yesterday (14 Oct, spot at 6.4340). As highlighted, downward momentum is beginning to build but USD has to close below 6.4240 before a sustained decline can be expected (next support is at 6.4100). The chance for USD to close below 6.4240 is quite high as long as it does not move above the ‘strong resistance’ level (currently at 6.4540) within these few days.”
- DXY remains on the defensive near 93.80 on Friday.
- US 10-year yields edge higher and approach 1.55%.
- Retail Sales, flash Consumer Sentiment next on tap.
The greenback loses further ground and approaches the 93.80 region when tracked by the US Dollar Index (DXY) on Friday.
US Dollar Index now looks to data
The index sheds ground for the third consecutive session and at the same time extends the rejection from YTD peaks in the 94.55/60 band recorded earlier in the week.
The mild recovery in US yields, mainly in the belly and the long end of the curve, remains unnoticed so far while the front end recedes marginally after hitting new 19-month highs in past sessions in the wake of September’s inflation figures.
In the meantime, Fedspeak remains supportive of starting the tapering process in November or December, while some concerns have re-emerged on the back of the probability that elevated inflation could last longer than previously estimated.
In the docket, the focus of attention will be on the release of Retail Sales for the month of September along with the advanced October’s Consumer Sentiment gauged by the U-Mich index, all seconded by Export/Import Prices, Business Inventories and the NY Empire State Index.
What to look for around USD
The index remains in corrective-mode and already approaches the 93.80 region, always on the back of the recent improvement in the risk galaxy, profit-taking in the buck and somewhat diminishing US yields. Looking beyond the immediate term, the dollar remains underpinned by markets’ adjustment to prospects for a “soon” start of the tapering process, probable rate hikes at some point during next year and the rising view that elevated inflation could last more than initially expected.
Key events in the US this week: Retail Sales, flash Consumer Sentiment (Friday).
Eminent issues on the back boiler: Biden’s multi-billion Build Back Better plan. US-China trade conflict under the Biden’s administration. Tapering speculation vs. economic recovery. Debt ceiling debate. Geopolitical risks stemming from Afghanistan
US Dollar Index relevant levels
Now, the index is losing 0.10% at 93.89 and a break above 94.56 (2021 high Oct.12) would open the door to 94.74 (monthly high Sep.25 2020) and then 94.76 (200-week SMA). On the flip side, the next down barrier emerges at 93.75 (weekly low October 14) followed by 93.67 (monthly low Oct.4) and finally 92.98 (weekly low Sep.23).
- AUD/USD gained some follow-through traction on Friday and shot to five-week tops.
- A modest USD weakness, the risk-on mood benefitted the perceived riskier aussie.
- Rebounding US bond yields helped limit the USD losses and capped gains for the pair.
The AUD/USD pair shot to fresh five-week tops during the early European session, albeit quickly retreated few pips thereafter.
The pair has been rallying since late September amid the widespread rally in commodity prices, which tend to benefit the resources-linked aussie. The momentum got an additional boost during the latter half of the current week in the wake of aggressive US dollar long-unwinding trade.
Despite a slightly stronger US CPI print, investors seem unconvinced about a sustained period of inflation. This was reinforced by a sharp decline in the longer-dated US Treasury bond yields, which triggered a USD corrective pullback from 13-month tops touched earlier this week.
Apart from this, the risk-on mood in the financial markets further undermined the safe-haven greenback through the first half of the trading action on Friday. This, in turn, benefitted the perceived riskier aussie and pushed the AUD/USD pair to the highest level since September 7.
However, a solid rebound in the US bond yields, along with prospects for an early policy tightening by the Fed helped limit any deeper USD pullback. The minutes of the September FOMC meeting reaffirmed that the Fed remains on track to begin tapering its bond purchases by the end of 2021.
Moreover, fears of a faster than expected rise in inflationary pressure forced investors to start pricing in the possibility of an interest rate hike in 2022. This seemed to be the only factor that held bulls from placing fresh bets around the AUD/USD pair and capped the upside.
Market participants now look forward to the US economic docket – highlighting the release of Retail Sales, Empire State Manufacturing Index and Prelim Michigan Consumer Sentiment Index. This, along with the US bond yields and a scheduled speech by New York Fed President John Williams, will influence the USD and provide some impetus to the AUD/USD pair on the last trading day of the week.
Technical levels to watch
USD/JPY has renewed multi-year highs above 114.00. Karen Jones, Team Head FICC Technical Analysis Research at Commerzbank, expects the pair to hit the 114.55 October 2018 high.
USD/JPY is approaching the 114.55 2018 high
“USD/JPY has been consolidating its recent gains for two days, but is again already breaking higher. The pair remains extremely bid above its accelerated uptrend at 112.43 and will shortly encounter the 114.55 October 2018 high, where we may see some profit taking.”
“Longer-term, we have 115.60, the 61.8% retracement of the move down from 2015 and then the 117.06 the 1998-2021 resistance line.”
“The accelerated uptrend guards 110.80 the mid-August high.”
Risk flows and falling US Treasury bond yields forced the greenback to stay on the back foot on Thursday. But in the view of economists at MUFG Bank, there is compelling reason to believe the scale of US dollar weakness looks to be more a positioning squeeze rather than any notable change in the global macro backdrop.
Long USD positioning squeeze prompts correction
“Our 2-year z-score measure of overall USD positioning at the most stretched since 2015 backs up the prospect that this move is related to an excessive build-up of USD longs that are now being liquidated.”
“Our view on the US dollar remaining well supported through Q4 is also based on global growth uncertainties persisting. The CRB Index has broken higher again but we doubt this is a sign of increased growth optimism and hence the correlation with a weaker US dollar is unlikely to hold.”
The European Central Bank (ECB) policymaker Pierre Wunsch dismissed the rising price pressures in the Euro area as being transitory.
Additional comments
"The economy is on the right path."
"We are not at our inflation goal just yet."
"There are unknown factors surrounding second-round inflation effects."
"ECB is quite flexible on stimulus."
USD/CHF’s sell-off has tested the 55-day moving average (DMA) at 0.9204. Karen Jones, Team Head FICC Technical Analysis Research at Commerzbank, expects the pair to slide back to the 2020-2021 uptrend at 0.9073.
USD/CHF offered below 0.9313
“USD/CHF has sold off to the 55-DMA at 0.9204, which has held the initial test. However, near-term the market is expected to see a deeper corrective sell off (the intraday Elliott wave count remains negative) to the 0.9134 200-DMA and potentially the 2020-2021 uptrend at 0.9073.”
“Rallies are expected to remain capped by the 0.9313 mid-October high. This guards 0.9357/69 (recent high).”
- GBP/USD builds onto the previous gains to retest 50-DMA at 1.3721.
- The cable’s upside remains favored while above the 21-DMA support.
- RSI edges higher above the midline, supporting the bullish wave.
GBP/USD is looking to extend the advance 1.3700 amid the risk-on market mood, as traders shrug off the rebound in the US Treasury yields and fresh Brexit concerns.
The UK-French tussle extends over the post-Brexit transition rights, as France’s Finance Minister Bruno Le Maire calls for more investment into localized supply chains, blaming the Kingdom for making the supply chain crisis worse.
Meanwhile, European Union (EU) countries want European Commission to be ready if Britain suspends the key part of the Brexit deal, as reported by the Financial Times late Thursday.
Attention now turns towards the US Retail Sales and Michigan Consumer Sentiment releases for further trading impetus on the major.
However, from a near-term technical perspective, the price is aiming for a retest of the descending 50-Daily Moving Average (DMA), now at 1.3721, having recaptured 1.3700, as of writing.
Acceptance above the latter would prompt the bulls to kick start a fresh uptrend towards the bearish 100-DMA at 1.3819. Ahead of that the 1.3750 psychological level could test the bearish commitments on the way higher.
The 14-day Relative Strength Index (RSI) is edging higher above the midline, backing the renewed upside in the spot.
GBP/USD: Daily chart
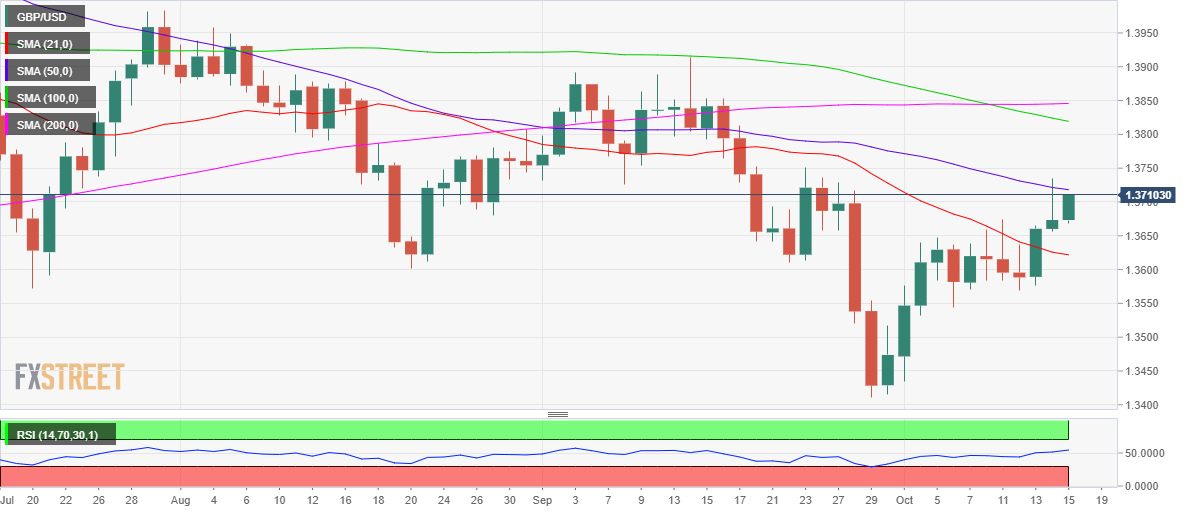
Alternatively, Thursday’s low at 1.3656 could offer temporary reprieve to the GBP buyers if the tide turns in favor of the sellers.
Further south, the downward-pointing 21-DMA at 1.3621 could be tested on the additional downside.
All in all, the upside appears more compelling for the pair in the near term so long as it holds above the 21-DMA
GBP/USD: Additional levels to consider
EUR/USD has reached the near-term downtrend at 1.1620. Karen Jones, Team Head FICC Technical Analysis Research at Commerzbank, expects the pair to reach the 1.1756 four-month downtrend.
RSI has diverged
“EUR/USD’s new low at 1.1522 was not confirmed by the daily RSI and the market has corrected higher to reach the downtrend, which today is located at 1.1620.”
“The intraday Elliott wave counts remain positive and we would allow for a deeper retracement to 1.1756 four-month downtrend.”
“Below 1.1522 lies the 50% retracement of the move from 2020 and the March 2020 high at 1.1492/95.”
“Key support is the previous downtrend (from 2008) which is now located at 1.1395.”
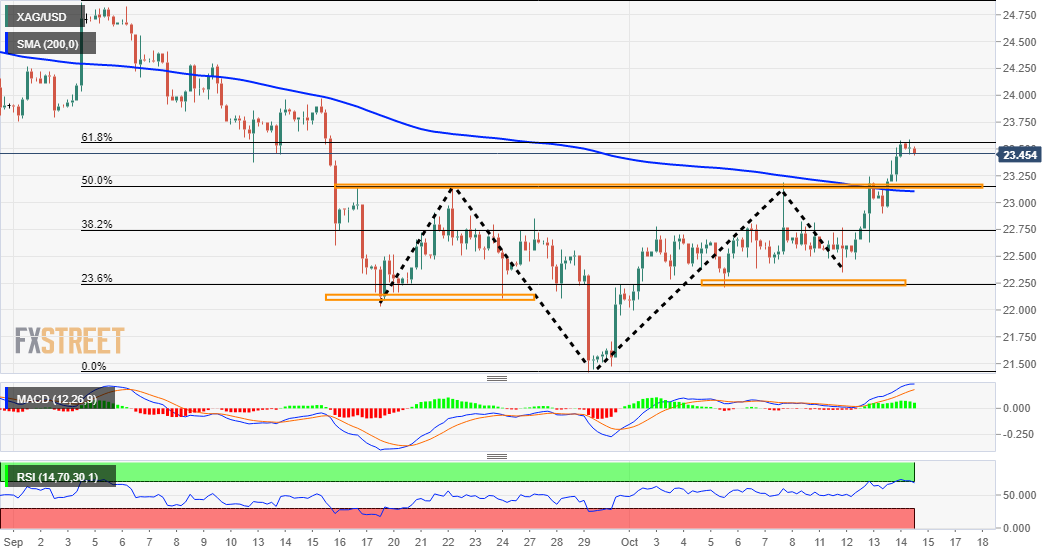
- Silver witnessed a subdued/range-bound price action through the early European session.
- The overnight break through the $23.20 key barrier supports prospects for further gains.
- Any meaningful corrective slide might be seen as a buying opportunity and remain limited.
Silver oscillated in a narrow band, around mid-$23.00s through the first half of the trading action on Friday and consolidated its recent gains to one-month tops.
From a technical perspective, this week's strong bullish momentum stalled near a resistance marked by the 61.8% Fibonacci level of the $24.87-$21.42 downfall. The mentioned barrier should now act as a pivotal point, which if cleared decisively will set the stage for a further near-term appreciating move.
Meanwhile, the overnight sustained move beyond the $23.20 confluence hurdle confirmed a near-term bullish breakout through an inverted head and shoulder pattern. Moreover, technical indicators on the daily chart have just started gaining positive traction and further add credence to the constructive outlook.
A sustained strength above the 61.8% Fibo. resistance will reaffirm the bullish bias and allow bulls to aim back to reclaim the $24.00 mark. Some follow-through buying beyond the $24.25-30 region should push the XAG/USD to September monthly swing highs near the $24.75-80 zone en-route the key $25.00 psychological mark.
On the flip side, any meaningful pullback now seems to find decent support and attract fresh buying near the $23.20 confluence resistance/neckline breakpoint. The mentioned region comprises 200-period SMA on the 4-hour chart and the 50% Fibo. level, which should now act as a strong near-term base for the XAG/USD.
Silver 4-hour chart
Technical levels to watch
GBP/USD climbed to multi-week highs above 1.3700 on Thursday. As the cable seems to have gone into a consolidation phase below that level, Karen Jones, Team Head FICC Technical Analysis Research at Commerzbank, expects the pair to stay below the downtrend at 1.3811.
Cable offered below 1.3914
“GBP/USD has rallied to the 55-day ma at 1.3733, close to this lies 1.3752, the 23rd September high and the 1.3811, the four-month resistance line.”
“We suspect it may be trying to recover but intraday Elliott wave counts are negative so we are going to the side lines today.”
“Above the downtrend will target 1.3914 (mid-September high) and we suspect that we will need to regain this resistance to regenerate further upside momentum. Resistance at 1.3914 guards the more important 1.3984/1.4018 medium term pivot.”
“Interim support at lies at 1.3569 ahead of the 1.3411 recent low.”
EUR/USD closed unchanged around 1.1600 on Thursday, slowing gains as Lagarde pushed cautious policy message. Economists at Scotiabank expect the pair’s rebound to run out of steam and locate initial support at 1.1575.
First real sign of steady selling pressure
“ECB President Lagarde said that while the rebound in the eurozone economy was increasingly advanced, it was ‘crucial that policy support was not withdrawn prematurely’. The dovish messaging clearly contrasts with the relatively more hawkish tone of the Fed and we suspect scope for additional EUR gains is very limited as a result.”
“We think a minor peak, at least, maybe developing but it is too soon to conclude that the rebound is poised to reverse more fully. We still prefer to look for opportunities to fade minor EUR gains, however.”
“We see minor resistance at 1.1640/50 now.”
“Support is 1.1575.”
The current upside bias in USD/JPY carries the potential to extend beyond the 114.00 yardstick in the next weeks, noted FX Strategists at UOB Group.
Key Quotes
24-hour view: “USD traded between 113.20 and 113.71 yesterday, narrower than our expected sideway-trading range of 113.10/113.75. USD traded on a firm note during early Asian hours as it rose above 113.80. Upward momentum has improved, albeit not by much and USD could rise but the major resistance at 114.20 is likely out of reach for today (minor resistance is at 114.00). Support is at 113.60 followed by 113.40.”
Next 1-3 weeks: “Our view from Tuesday (12 Oct, spot at 113.40) still stands. As highlighted, the recent impulsive surge suggests that further USD strength would not be surprising and the next resistance is at 114.20. The USD strength is deemed intact as long as it does not breach 113.00 (‘strong support’ level was at 112.80 previously). Looking ahead, the next resistance above 114.20 is at 114.55.”
WTI and Brent are over $81/bbl and 84/bbl, respectively. According to strategists at TD Securities, the bull run is not over, Brent Oil could soar as high as $100/bbl.
Extra call on petroleum products due to the energy crisis in Asia and Europe
“We project that the world will see a deficit in the last three months of 2021 and likely in early winter months of 2022.”
“With distillate product inventories at below the five-year average and significantly below normal natural gas stocks in Europe and Asia, an unusually cold winter can significantly increase the call on petroleum products which could see Brent, at least for a time, hit $100+/bbl, along with strength in fuel oils.”
According to advanced prints from CME Group for natural gas futures markets, open interest increased for the second session in a row on Thursday, now by almost 5K contracts. Volume, on the other hand, dropped for the second straight day, now by around 115.5K contracts.
Natural Gas stays capped by $6.500 so far
Prices of natural gas charted a doji-like session on Thursday amidst rising open interest. That said, extra range bound should not be ruled out in the very near term, while the upside remains limited by the 2021 high around the $6.50 mark per MMBtu (October 6).
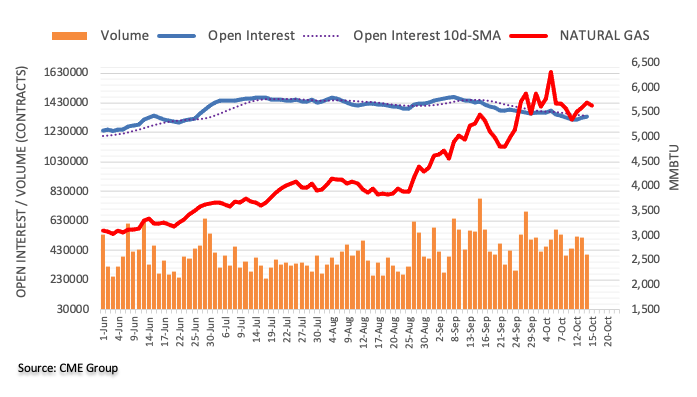
The Bank of Japan (BOJ) Deputy Governor Masayoshi Amamiya said in his appearance on Friday, the Japanese central bank “will continue to support corporate funding with the pandemic-relief program now in place.”
Additional quotes
Japan's economy picking up as a trend.
Japan's economic recovery trend to become clearer as pandemic impact subsides.
Consumption continues to stagnate.
Exports, output being affected somewhat by supply constraints but continue to increase.
Must be vigilant to impact of supply chain disruptions in Asia on Japan’s economy.
Consumption likely to pick up on pent-up demand.
Japan's price trend remains solid.
BOJ will continue to support corporate funding with pandemic-relief programme now in place.
Japan's financial system remains stable as a whole.
Related reads
- USD/JPY Price Analysis: Rallies toward 2018 highs above 114.00
- Forex Today: Dollar bulls remain hesitant, US Retail Sales and confidence data awaited
Here is what you need to know on Friday, October 15:
Risk flows and falling US Treasury bond yields forced the greenback to stay on the back foot on Thursday. With the benchmark 10-year US T-bond yield holding above critical 1.5% handle, the dollar stays resilient in the early European session on Friday as investors await the September Retail Sales report and the University of Michigan's (UoM) preliminary October Consumer Sentiment Index data.
US Michigan Consumer Sentiment September Preview: Happy consumer, happy economy?
Macro data: The US Bureau of Labor Statistics reported on Thursday that the Producer Price Index (PPI) rose to 8.6% on a yearly basis in September from 8.3% in August. Meanwhile, the weekly Initial Jobless Claims dropped to the lowest level since March 2019 at 293,000.
Retail Sales in September in the US is forecast to decline by 0.2% while consumer confidence is expected to improve modestly in October's flash estimate. August Trade Balance will be featured in the European economic docket on Friday.
US September Retail Sales Preview: Analyzing major pairs' reaction to previous releases.
Wall Street: Boosted by upbeat third-quarter earnings figures and robust US data, the S&P 500 and the Dow Jones Industrial Average indexes gained 1.7% and 1.5%, respectively.
Gold managed to build on Wednesday's impressive gains and advanced to a monthly high of $1,800 on Thursday but seems to have lost its bullish momentum. XAU/USD is currently moving sideways around $1,790.
EUR/USD closed unchanged around 1.1600 on Thursday and continues to move sideways above that level. Unless the pair retreats below 1.1575 by the end of the day, it will snap a five-week losing streak.
GBP/USD climbed to multi-week highs above 1.3700 on Thursday but seems to have gone into a consolidation phase below that level. Investors remain focused on Brexit headlines.
USD/JPY renewed multi-year highs above 114.00 as the safe-haven JPY struggled to find demand despite falling US Treasury bond yields.
Cryptocurrencies: Following a small correction on Thursday, Bitcoin regained its traction and was last seen testing $60,000 while gaining nearly 4% on the day. Ethereum is rising for the third straight trading day on Friday and closes in on $4,000.
USD/CAD has eased through the 1.24 area. Economists at Scotiabank highlight the potential for the Canadian dollar – they expect the USD/CAD pair to slump to the 1.22 region.
Loonie to take fuller advantage of high crude oil prices
“The pause in the broader USD rally paves the way for the CAD to take fuller advantage of high crude oil prices and wide/wider short-term spreads.”
“We estimate fair value for spot to be nearer 1.2344 currently, taking into account the broader USD performance, and still rather feel that the window has opened – a little further – towards the CAD pushing on to 1.22/1.23 zone in the next few weeks.”
“A push below the Fib retracement support at 1.2367 opens up the downside for a push to 1.22.”
“Resistance is 1.2420/25.”
AUD/USD is still expected to test the 0.7450 level in the short-term horizon, suggested FX Strategists at UOB Group.
Key Quotes
24-hour view: “Yesterday, we highlighted that AUD ‘is likely to advance even though it may not be able to maintain a foothold above the major resistance at 0.7405’. We added, ‘the next resistance at 0.7450 is not expected to come into the picture’. AUD subsequently rose to 0.7427 before closing on a firm note at 0.7416 (+0.48%). The advance is deeply overbought and AUD is unlikely to strengthen much further. For today, AUD is more likely to trade between 0.7385 and 0.7430.”
Next 1-3 weeks: “We detected the build-up in upward momentum last Friday (08 Oct, spot 0.7310) and has held a positive view in AUD since then. As AUD rose strongly, we highlighted yesterday (14 Oct, spot at 0.7380) that ‘0.7405 appears to be within reach and a break of this level would open up the way for further AUD gains towards 0.7450’. AUD subsequently rose to a high of 0.7427. There is no change in our view even though AUD could consolidate for a couple of days first before heading towards 0.7450. On the downside, a break of the ‘strong support’ at 0.7350 (level was at 0.7325 yesterday) would indicate that the current positive phase has come to an end.”
EUR/JPY continues to track higher. The pair’s next target is the 134.12 June high, Karen Jones, Team Head FICC Technical Analysis Research at Commerzbank, reports.
EUR/JPY is looking for further gains
“EUR/JPY has maintained its gains. We look for a move to 132.69/80, the 23rd June high and 78.6% retracement. This is regarded as the last defence for the 134.12 June peak.”
“Longer-term, a break above here is favoured and will introduce scope to 137.51.”
“Dips should find initial support at 130.74/46, the September highs and 129.57, the 20-day ma ahead of 128.74, the 6th October low and the 127.94/50, August and September lows and the February 2019 high.”
Open interest in crude oil futures markets noted traders scaled back their open interest positions by nearly 4K contracts on Thursday after two consecutive daily builds considering flash data from CME Group. Volume followed suit and went down for the third consecutive session, this time by around 60.3K contracts.
WTI faces a probable correction
Prices of the WTI closed above the $81.00 mark per barrel amidst decent gains on Thursday. The uptick, however, was in tandem with shrinking open interest and volume, indicative that a potential correction remains on the cards in the not-so-distant future. The current overbought condition of the commodity reinforces that view.
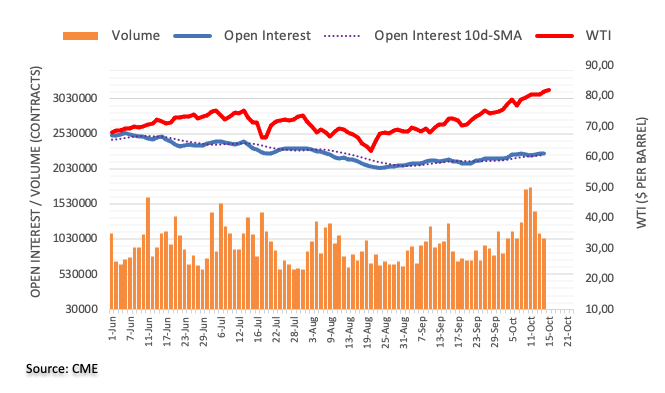
- A combination of factors pushed NZD/USD higher for the third successive session on Friday.
- The risk-on mood benefitted the perceived riskier kiwi amid a subdued USD price action.
- Investors now look forward to a rather busy US economic docket for some trading impetus.
The NZD/USD pair extended its appreciating move heading into the European session and shot to three-week tops, around the 0.7060 region in the last hour.
A combination of factors assisted the NZD/USD pair to prolong this week's strong positive move from the vicinity of the 0.6900 mark and gain traction for the third consecutive session on Friday. The prevalent risk-on mood was seen as a key factor that benefitted the perceived riskier kiwi. This, along with a subdued US dollar price action, provided an additional boost to the major.
The greenback has been rallying rallied since early September on expectations for an early policy tightening by the Fed. The minutes of the September FOMC meeting reaffirmed that the Fed remains on track to begin tapering its bond purchases in 2021. Adding to this, fears of a faster than expected rise in inflation have been fueling speculations about a potential Fed rate hike move in 2022.
Investors, however, still seem unconvinced about a sustained period of inflation despite Wednesday's slightly stronger than expected US CPI report. This was reinforced by a sharp pullback in the longer-dated US Treasury bond yields, which triggered a USD corrective slide from 13-month tops touched earlier this week. This, in turn, was seen as a key factor driving the NZD/USD pair higher.
Apart from this, the ongoing positive momentum could further be attributed to some technical buying on a sustained breakthrough the 50-day SMA, around the key 0.7000 psychological mark on Thursday. Given that technical indicators on the daily chart have just started gaining positive traction, a subsequent move beyond 100-day SMA might have set the stage for additional gains for the NZD/USD pair.
Market participants now look forward to the US economic docket – highlighting the release of Retail Sales, Empire State Manufacturing Index and Prelim Michigan Consumer Sentiment Index. This, along with the US bond yields and a scheduled speech by New York Fed President John Williams, will influence the USD later during the early North American session. Apart from this, the broader market risk sentiment would provide some impetus to the NZD/USD pair and produce some short-term trading opportunities.
Technical levels to watch
In opinion of FX Strategists at UOB Group, Cable could move into a consolidative phase ahead of extra gains in the next weeks.
Key Quotes
24-hour view: “We highlighted yesterday that ‘there is room for GBP to advance to 1.3695, possibly 1.3715’. The subsequent advance exceeded our expectations as GBP rose to 1.3734. However, GBP pulled back sharply from the high. The pullback has room to extend but any weakness is likely limited to a test of 1.3645. The strong support at 1.3595 is not expected to come into the picture. Resistance is at 1.3695 followed by 1.3715.”
Next 1-3 weeks: “Yesterday, we highlighted that GBP ‘is likely to head higher to 1.3715’. We added, ‘a break of 1.3715 would shift the focus to 1.3750’. We did not quite expect the rapid manner by which GBP moved above 1.3715 as it popped to 1.3734 during London hours before retreating. There is no change in our view for now but GBP could consolidate for a couple of days first before heading higher. Only a break of the ‘strong support’ at 1.3595 (no change in level) would indicate that 1.3750 is out of reach.”
- Gold price pauses a three-day uptrend amid rebounding US Treasury yields.
- The dollar bounces with yields amid risk-on mood, US Retail Sales in focus.
- Elliott Wave view: Gold should rally further short term.
Gold price is reversing from monthly highs just ahead of the $1800 mark, as the US dollar rebounds in tandem with Treasury yields amid the upbeat market mood. Robust US corporate earnings douse fears over growing inflation risks, boosting the investors’ sentiment at the expense of the safe-haven gold. Meanwhile, failure to find a hold above the $1800 mark pushes gold price lower, as traders await the US consumer-centric data for a decisive move in the bright metal.
Read: Gold Price Forecast: XAU/USD bulls testing bears’ commitment at crucial daily resistance, US consumer data eyed
Gold Price: Key levels to watch
According to the Technical Confluences Detector, gold is consolidating the recent upsurge, lacking a follow-through upside bias, as a dense cluster of significant resistance levels around $1798 remains a tough nut to crack for the buyers.
The Fibonacci 23.6% one-day, pivot point one-week R2, SMA200 and SMA100 one-day coincide around that price zone.
Acceptance above the latter will expose the $1803 barrier, which is the confluence of the Fibonacci 161.8% one-week and pivot point one-day R1.
The next bullish target is seen at $1809, the pivot point one-day R2, above which $1812 will be on the buyers’ radars.
Alternatively, gold price sees an immediate cushion at $1790, where the Fibonacci 61.8% one-month aligns.
Additional downside pressure will prompt gold sellers to test $1787, the intersection of the previous day’s low and pivot point one-day S1.
The next significant support awaits at the previous week’s high of $1781.
Further south, the convergence of the SMA50 one-day and pivot point one-week R1 at $1778 will be the level to beat for the bears
Here is how it looks on the tool
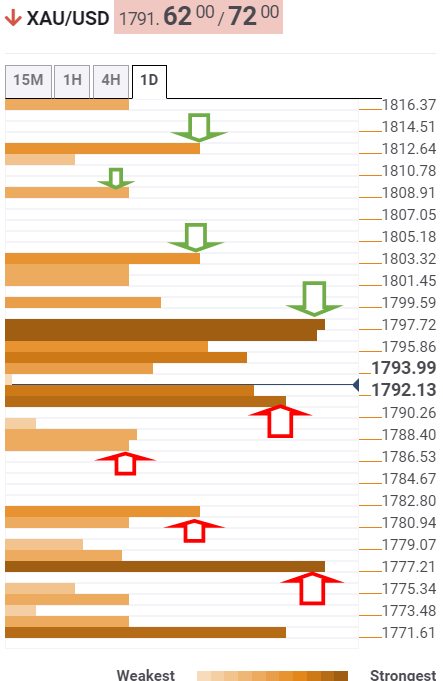
About Technical Confluences Detector
The TCD (Technical Confluences Detector) is a tool to locate and point out those price levels where there is a congestion of indicators, moving averages, Fibonacci levels, Pivot Points, etc. If you are a short-term trader, you will find entry points for counter-trend strategies and hunt a few points at a time. If you are a medium-to-long-term trader, this tool will allow you to know in advance the price levels where a medium-to-long-term trend may stop and rest, where to unwind positions, or where to increase your position size.
CME Group’s preliminary readings for gold futures markets noted open interest rose for the second session in a row on Friday, this time by just 731 contracts. Volume, instead, shrank by around 142.2K contracts, the largest daily drop since July 29.
Gold still targets $1,800
Gold extended the upside momentum on Thursday although a close above the $1,800 yardstick still remains elusive. Rising open interest coupled with positive price action allows for further gains in the very near term and always with the immediate target at the $1,800 mark per ounce troy.
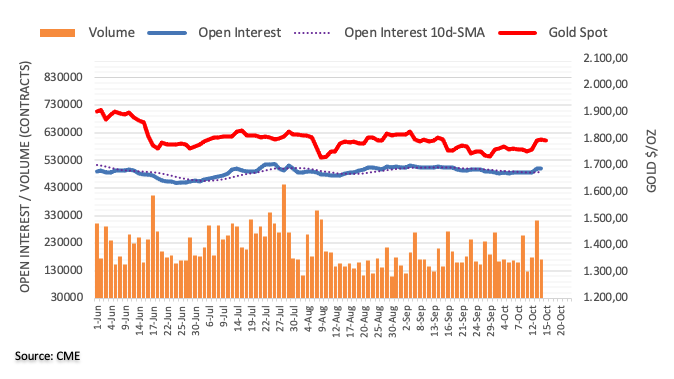
- USD/JPY records fresh daily gains on Friday in the European session.
- The pair remains poised for weekly gains of nearly 1%.
- Momentum oscillators hold onto the overbought zone warrants caution for the pair.
USD/JPY extend the previous session’s gains on the last trading day of the week. The pair opened lower but swiftly rallies toward the YTD highs as the pair gathers momentum in the European trading hour. At the time of writing, USD/JPY is trading at 114.15, up 0.43% so far.
USD/JPY daily chart
-637698751961274347.png)
On the daily chart, the USD/JPY pair has been riding higher after testing the low of 109.12 on September 22. The pair posted gains of nearly 50-pips in the intraday session, indicating the underlying bullish sentiment. Having said that, if the price sustains above the intraday high, the bulls will be next looking for October 2018 high at 114.55.
Alternatively, the Moving Average Convergence Divergence (MACD) indicator trades in the overbought zone. Any downtick in the MACD could call the USD/JPY bears to takeout the 113.50 horizontal support level. Next, on the bear’s radar will be the 23.6% Fibonacci retracement, which extends from the low of 109.21, at 113.00 followed by this Monday’s low of 112.15.
USD/JPY additional levels
Gold price is meandering in a narrow range below $1800 so far this Friday, awaiting the US economic releases for the next big move. As FXStreet’s Dhwani Mehta notes, XAU/USD still awaits a weekly closing above the critical 200-Daily Moving Average (DMA) at $1796 to see further upside.
See – Gold Price Forecast: XAU/USD to hit $1850 before tanking through next year and beyond – ANZ
The path of least resistance appears to the upside for XAU/USD
“Attention now turns towards the critical US consumer-centric data. The US Retail Sales are expected to drop 0.2% MoM in September while the core figure is seen lower at 0.5%. Below-forecast American data is likely to add to the corrective pullback in the USD, as the Treasury yields could resume the downside.”
“The bulls await a daily closing above the 200-Daily Moving Average (DMA) at $1796 to unleash further upside. At that level, the bearish 100-DMA hurdle coincides. The next relevant target is seen near $1807-$1809, mid-September highs. The September highs of $1834 will be in sight if gold bulls gain conviction.”
“Any pullback in the price would call for a test of the horizontal 50-DMA support at $1777, below which the previous important resistance-turned-support of the mildly bullish 21-DMA at $1761 will get tested.
FX option expiries for October 15 NY cut at 10:00 Eastern Time, via DTCC, can be found below.
- EUR/USD: EUR amounts
- 1.1450 715m
- 1.1550 1.1b
- 1.1600 825m
- 1.1650 752m
- USD/JPY: USD amounts
- 112.65 740m
- 113.00 870m
- 113.15 500m
- 113.50 501m
- USD/CHF: USD amounts
- 0.9350 430m
- USD/CAD: USD amounts
- 1.2410-15 1.1b
- 1.2480 795m
- 1.2500 1b
- 1.2550 572m
- NZD/USD: NZD amounts
- 0.6820 573m
FX Strategists at UOB Group still see EUR/USD attempting a move to 1.1640 in the next weeks.
Key Quotes
24-hour view: “Yesterday, we held the view that ‘further gains are not ruled out but the major resistance at 1.1640 is unlikely to come into the picture’. Our view was not wrong as EUR rose to 1.1624 before pulling back. Upward pressure has eased and EUR is unlikely to strengthen much further. For today, EUR is more likely to trade sideways within a range of 1.1570/1.1620.”
Next 1-3 weeks: “There is no change in our view from yesterday (14 Oct, spot at 1.1595). As highlighted, the recent weak phase has ended. The rapid rebound has gained momentum and EUR is likely trade with an upward bias towards 1.1640. Further advance is not ruled out but 1.1640 may not be easy to crack. The upward bias is deemed intact as long as EUR does not move below 1.1540 within these few days.”
- Asian stocks are trading mostly higher following Wall Street action.
- Upbeat corporate earnings, higher commodity prices attract traders attention, US Retail Sales eyed.
- Japan dissolves its parliament on Thursday ahead of October, 31 elections.
Asian stocks trade higher on the last trading day of the week tracing the firmly positive Wall Street cues in the overnight session. Investors remain optimistic about upbeat US corporate earnings and better-than-expected labor data.
MSCI’s broadest index of Asia-pacific shares outside Japan rose 0.6%.
The ASX 200 trades higher 0.7% on Friday led by miners amid rising energy and metal prices. However, the coronavirus cases in Victoria hovered near record levels with a total of 2,179 new cases.
The Nikkei 225 index jumps 0.7% higher following the Japanese technology sector gains. Meanwhile, the policymakers in Japan cut their outlook for exports despite a weaker yen.
Hang Seng rose 1.21% whereas South Korea’s Kospi gained 0.94%.
Gold retreats from five-month highs and trades near $1,793 with 0.26% losses. Lower US T-bond yields and the greenback capped the precious metal losses.
- GBP/JPY continues with its weekly gains on Friday in the early European session.
- A successful weekly close above 156.00 exposes 2018 highs.
- Momentum oscillator support bullish momentum.
The GBP/JPY cross-currency pair pushes higher on Friday morning. The pair remains on track to book gains for the second week in a row. At the time of writing, GBP/JPY is trading at 155.96, up 0.37% on the day.
GBP/JPY daily chart
-637698699815525273.png)
On the daily chart, the GBP/JPY cross currency pair has risen sharply after breaking the strong long-time resistance barrier near the 152.90-153.00 zone. The pair touched the 156.00 mark for the first time since May. A successful weekly close above 156.00 would open the doors for the 2018 highs near 156.61. Furthermore, the Moving Average Convergence Divergence (MACD) indicator holds the overbought zone, which signifies the underlying bullish sentiment.
Alternatively, on the reverse side, the bears would meet the 155.00 horizontal support level and then this Tuesday’s low at 153.68. The GBP/JPY bears would then approach toward the 153.00 psychological mark.
GBP/JPY additional levels
- WTI remains on track of the weekly gains in the early European trading hours.
- Retreats in the US dollar helps crude oil to gain further.
- Oil set for a weekly gain above 3% on soaring gas prices.
Crude oil continues to march higher and remains on track to jump around 3% on weekly basis. The prices continues to post gains since August 20. At the time of writing, WTI is trading at $81.75, up 0.54% for the day.
Crude oil prices soar amid supply side concerns and growing fuel demand on falling US crude stockpiles. The rally in the prices recorded in particular of high demand and shortage of gas and coal in Europe and Asia-Pacific. Furthermore, the Energy Information Administration (EIA) said that the output in the US is going to drop in 2021 more than previously anticipated, although it will bounce back in 2022.
The US Dollar Index (DXY), which indicates the performance of the greenback against six major rivals, pushes WTI higher in the European trade. The US dollar was last seen trading at 93.93, down 0.13% for the day.
As for now, the US dollar dynamics and the demand-supply constraints continue to influence WTI prices.
WTI additional levels
- USD/CAD prolonged its weekly bearish trend and dropped to over three-month lows on Friday.
- Bullish oil prices underpinned the loonie and exerted pressure amid a subdued USD demand.
- Oversold RSI on hourly charts warrants some caution before placing aggressive bearish bets.
The USD/CAD pair remained depressed through the Asian session and was last seen hovering near the lowest level since July 6, just above mid-1.2300s.
Crude oil prices held steady near multi-year tops and remained supported by increasing signs of tight supply over the next few months. This, in turn, continued underpinning the commodity-linked loonie and was seen as a key factor that acted as a headwind for the USD/CAD pair amid a subdued US dollar price action.
Despite Wednesday's slightly stronger US CPI report, the USD witnessed a corrective pullback from 13-month tops as investors still seem unconvinced about a sustained period of inflation. This was reinforced by a sharp decline in the longer-dated US Treasury bond yields, which prompted USD long-unwinding trade.
Moreover, the markets now seem to have fully priced in the prospects for an early policy tightening by the Fed. This, along with the prevalent risk-on mood, held traders from placing fresh bullish bets around the safe-haven greenback. This was seen as another factor that exerted some pressure on the USD/CAD pair.
From a technical perspective, the overnight decline below the 1.2400 mark confirmed a bearish break through the lower boundary of a short-term descending channel. This might have already set the stage for further losses, though oversold RSI on hourly charts warrants some caution before placing aggressive bearish bets.
The market focus now shifts to the release of US monthly Retail Sales figures later during the early North American session. This, along with the US bond yields, will influence the USD and provide some impetus to the USD/CAD pair. Traders will further take cues from oil price dynamics for some short-term opportunities.
Technical levels to watch
According to the latest trade data published by the Indonesian Statistics Bureau, the country recorded a bigger-than-expected trade surplus in September, although both imports and exports disappointed.
Indonesia reported a trade surplus of $4.37 billion vs. $3.84 billion expected and $4.74 billion previous. The imports and exports came in at 40.31% and 47.64% respectively vs. 50% and 51.57% expectations and 55.26% and 64.1% respective priors.
FX implications
USD/IDR trades close to eight-month lows of 14,065 on mixed Trade Balance data. The cross loses 0.27% on a daily basis.
About Indonesia’s Trade Balance
The Trade Balance released by Statistics Indonesia is a balance between exports and imports of total goods and services. A positive value shows trade surplus, while a negative value shows trade deficit. If a steady demand in exchange for Indonesian exports is seen, the Rupiah will receive a positive (or bullish) effect, while a low reading is seen as negative (or bearish).
- EUR/USD catches fresh bids, looks to resume the recovery above 1.1600.
- Risk-on mood caps the US dollar’s rebound but positive yields could weigh on the spot.
- Upbeat US earnings reports cheer markets ahead of the critical Retail Sales report.
EUR/USD is advancing above 1.1600, extending its bounce amid improving market sentiment, which snaps the rebound in the safe-haven US dollar.
However, the EUR bulls remain cautious due to a buying resurgence seen in the US Treasury yields across the curve. The upbeat market mood is reflective of a 0.30% rise in the S&P 500 futures, as the Asian equities track the Wall Street optimism, fuelled by strong corporate earnings for the third quarter.
Robust earning seems to have shifted investors’ attention from growing inflationary risks on the global economy and China’s indebted property sector crisis. Meanwhile, the recent comments from European Central Bank (ECB) President Christine Lagarde also aides the upswing in the euro, especially after she said, "the rebound phase of the euro area economy is increasingly advanced."
However, it remains to be seen if the recovery attempts in the main currency pair from 15-month lows of 1.1524 sustain amid rising bets for earlier Fed rate hike while the European Central Bank (ECB) refrains from providing any hints on the scale back of the pandemic stimulus.
Further, the risk-on mood-driven rebound in the US Treasury yields could also limit EUR/USD’s advance above 1.1600. Meanwhile, the bulls may turn cautious heading towards the US Retail Sales release, with the American consumer spending likely to drop 0.2% MoM in September while the core figure seen lower at 0.5% as well.
Also, of note remains the US Michigan Consumer Sentiment data and Fedspeak for fresh cues on the Fed’s policy moves and the dollar valuations.
EUR/USD: Technical levels to consider
- USD/JPY added to the overnight positive move and gained follow-through traction on Friday.
- A combination of factors undermined the safe-haven JPY and remained supportive of the move.
- A subdued USD price action did little to hinder the ongoing bullish trajectory to multi-year tops.
The USD/JPY pair refreshed multi-year tops during the Asian session, with bulls now awaiting a sustained move beyond the 114.00 round-figure mark.
The pair built on the previous day's positive move and gained some follow-through traction on the last trading day of the week. The momentum pushed the USD/JPY pair to the highest level since November 2018 and was sponsored by a heavily offered tone surrounding the Japanese yen (JPY).
The Japanese government – in the October economic report – slashed its view on exports for the first time in seven months. This, along with the prevalent risk-on mood, undermined the JPY's safe-haven demand. Bulls further took cues from a modest uptick in the US Treasury bond yields.
This, to a larger extent, helped offset a subdued US dollar price action and did little to hinder the ongoing positive momentum. The USD witnessed a typical 'buy the rumour, sell the fact' kind of trade following the release of a slightly stronger US CPI report on Wednesday.
Investors seem unconvinced about a sustained period of inflation, which was reinforced by a sharp pullback in the longer-dated US Treasury bond yields. That said, prospects for an early policy tightening by the Fed acted as a tailwind for the US bond yields and the USD.
The minutes of the September FOMC meeting reaffirmed that the Fed remains on track to begin tapering its bond purchases in 2021. Moreover, the markets have been betting on the possibility of a potential interest rate hike in 2022 amid fears about a faster than expected rise in inflation.
The market focus now shifts to the release of US monthly Retail Sales figures, which, along with the US bond yields, will influence the USD price dynamics. Apart from this, the broader market risk sentiment might produce some meaningful trading opportunities around the USD/JPY pair.
Technical levels to watch
| Raw materials | Closed | Change, % |
|---|---|---|
| Brent | 84.24 | 0.72 |
| Silver | 23.49 | 1.85 |
| Gold | 1795.798 | 0.16 |
| Palladium | 2128.06 | 1.1 |
PM Kishida instructed me to work on additional tax system on jobs.
No comment on fx levels.
Forex stability is important.
Closely watching fx moves impact on Japanese economy.
Weak yen pushes up import costs for some companies and consumers but helps exporters.
- AUD/USD was seen consolidating its recent strong positive move to over one-month tops.
- The risk-on mood benefitted the perceived riskier aussie amid a subdued USD price action.
- Investors now look forward to the US monthly Retail Sales data for some trading impetus.
The AUD/USD pair lacked any firm directional bias and seesawed between tepid gains/minor losses, above the 0.7400 round-figure mark through the Asian session.
Following its recent gains recorded over the past two weeks or so, the AUD/USD pair now seems to have a consolidation phase near one-month tops in the absence of a fresh catalyst. The downside remained cushioned amid the prevalent risk-on mood, which tends to benefit the perceived riskier aussie. Apart from this, a subdued US dollar price action was seen as another factor that acted as a tailwind for the major.
The greenback has been rallying rallied since early September on expectations for an early policy tightening by the Fed. The minutes of the September FOMC meeting reaffirmed that the Fed remains on track to begin tapering its bond purchases in 2021. Adding to this, fears of a faster than expected rise in inflation have been fueling speculations about a potential rate hike in 2022.
The USD, however, witnessed a typical 'buy the rumour, sell the fact' kind of trade following the release of a slightly stronger US CPI report on Wednesday. Investors, however, still seem unconvinced about a sustained period of inflation. This was reinforced by a further decline in the longer-dated US Treasury bond yields, which undermined the USD and provided a goodish lift to the AUD/USD pair.
Moving ahead, the market focus now shifts to the release of US monthly Retail Sales figures, due later during the early North American session. This, along with the US bond yields, will influence the USD price dynamics and provide some impetus to the AUD/USD pair. Traders might further take cues from the broader market risk sentiment for some short-term opportunities on the last day of the week.
Technical levels to watch
- GBP/USD manages to hold the previous session’s momentum on Friday.
- US Dollar Index whipsaws around 94.00 ahead of US Retail Sales data.
- Mixed play amid Brexit concerns and dovish BOE official limits the upside for the British pound.
The GBP/USD pair consolidates gains in the Asian trading hours. The pair retreated after touching 1.3700 since September 28 in Thursday's US session. At the time of writing, GBP/USD is trading at 1.3678, up 0.04% for the day.
Investors digested higher inflation data and a drop in the US Initial Jobless Claims. The readings confirmed Fed’s stance on tapering as soon as mid-November. The US Producer Price Index (PPI) came at 0.5% in September YoY basis. The Initial Jobless Claims fell 295K, much below the market estimates of 319K.
On the other hand, the British pound gains despite the dovish comments from the Monetary Policy Committee (MPC) member Silvana Tenreyo. She shrugged off the current rout in the UK inflation levels as being temporary and urged not to hike interest rates.
In addition to that, the European Union (EU) threatened to escalate the Brexit clash if the UK quits the Northern Ireland deal. Nevertheless, the sterling gains on improved risk sentiment. It is worth noting that, S&P 500 Futures are trading at 4,453, up 0.34% on the day
As for now, traders keep their focus on the US Retail Sales data and Michigan Consumer Sentiment Index to gauge market sentiment.
GBP/USD technical levels
Japan cuts export view for first time in seven months in October
developing story ....
The People’s Bank of China (PBOC) injected CNY500 billion via one-year medium-term lending (MLF) facility on Friday.
The Chinese central bank kept the rate for one-year MLF operation rate unchanged at 2.95%.
Separately, the central bank injected 10 billion yuan of the 7-day reverse repo at 2.20%.
Market reaction
USD/CNY is almost unchanged on the latest PBOC operation. The spot trades at 6.4355, consolidating the previous bounce from four-month lows of 6.4271 reached a day before.
Meanwhile, the AUD/USD pair eases to 0.7415, as of writing, having faced rejection just below the monthly highs of 0.7427.
- USD/INR is meeting the 38.2% Fibonacci as the greenback sinks to fresh lows.
- A period of consolidation would be expected as investors eye next catalyst.
As per the prior analysis, ''USD/INR Price News: Rupee firms at critical daily resistance, eyes 75 the figure,'' the price has continued to deteriorate as forecasted as follows:
USD/INR prior analysis
-637696866727985348.png)
The price, as illustrated above, was projected to retreat from resistance to target the 38.2% Fibonacci retracement.
USD/INR live market, daily chart
-637698588073690993.png)
The price has indeed fallen to the target as the US dollar continues to feel the pinch as markets take profit in a buy the rumour sell the fact scenario with respect to the Federal Reserve. From this juncture, the price would be expected to consolidate as traders await the next catalyst.
Global ratings agency Fitch Ratings is out with its latest assessment on the Australian economy, with the key findings noted below.
“Financial flexibility supports issuers as Australia transitions to living with COVID-19.”
“Expect activity to begin to rebound in late 2021, as Australia’s two largest cities, Sydney and Melbourne, emerge from pandemic-related lockdowns.”
Market reaction
AUD/USD is trading 0.10% higher on the day at 0.7422, as of writing, flirting with fresh monthly tops of 0.7427 reached on Thursday.
- AUD/NZD edges lower on Friday in the Asian trading hours.
- Upside momentum recedes upon reaching 1.0600.
- Momentum oscillators hold onto the overbought zone warn caution.
AUD/NZD is on the verge to erase weekly gains on Friday. The cross-currency pair confides in a narrow trade band with no meaningful traction. At the time of writing, AUD/NZD is trading at 1.0535, down 0.03% for the day.
AUD/NZD daily chart
-637698575730021158.png)
On the daily chart, the AUD/NZD pair has been under selling pressure after testing multi-month highs above 1.0600 on Wednesday. Now, the pair retreats below the 100-day Simple Moving Average (SMA) at 1.0550.
Having said that, if the price breaks the intraday low, it could test the 1.0500 horizontal support level. Now, a break beneath the ascending trendline from the lows of 1.0278 would prompt bears to capture the 1.0450 horizontal support area. Overbought Moving Average Convergence (MACD) suggests the possibility of the key 1.0400 level.
Alternatively, if the price moves higher manages to scale up beyond 100-day SMA, it could retest the 1.0590 horizontal resistance level followed by this Wednesday’s high at 1.0615. Next, AUD/NZD bulls would testify to the 1.0650 horizontal resistance level.
AUD/NZD additional levels
In recent trade today, the People’s Bank of China (PBOC) set the yuan (CNY) at 6.4386 vs the previous fix of 6.4414 and the prior close of 6.4404.
About the fix
China maintains strict control of the yuan’s rate on the mainland.
The onshore yuan (CNY) differs from the offshore one (CNH) in trading restrictions, this last one is not as tightly controlled.
Each morning, the People’s Bank of China (PBOC) sets a so-called daily midpoint fix, based on the yuan’s previous day closing level and quotations taken from the inter-bank dealer.
- NZD/USD grinds lower on Friday in the early Asian session.
- US Dollar Index pares initial losses to trade near 94.00 with 0.07% gains.
- Kiwi under pressure on biggest rise in COVID-19 cases despite upbeat PMI.
NZD/USD surrenders the previous session’s gains on Friday’s Asian session. The pair jumped more than 80-pips in the US session following the USD broad-based sell-off. At the time of writing, NZD/USD is trading at 0.7032, down 0.5% for the day,
The US Dollar Index (DXY), which measures the greenback performance against its six major rivals, trades at 94.05. Wall Street surges more than 1.5% on strong earnings denting the prospects of the US dollar. The greenback losses despite upbeat economic data. The US Initial Jobless Claims drops below 300K, for the first time since the pandemic begins.
On the other hand, Kiwi pares part of its gains as there are 65 fresh coronavirus infections reported in Auckland, the biggest single-day rise in six weeks. NZD fails to capitalize on the upbeat manufacturing sector activity. The New Zealand Business Purchasing Managers Index (PMI) rebounds in September at 51.4, from a downwardly revised 39.7 in the previous month.
As for now, all eyes are on the US Retails sales data to take fresh trading impetus.
NZD/USD additional levels
President Joe Biden on Thursday signed into law a bill raising the nation’s debt limit until early December. This has delayed the risk of an unprecedented federal default. Markets had already given a sigh of relief when this passed Congress, but December looms.
The House passed the $480 billion increase in the country’s borrowing ceiling on Tuesday, following the Senate approving it on a party-line vote last week. However, Minority Leader Mitch McConnell has said Republicans will offer no support for another increase in December.
- Gold reached $1,800 and could be firmer for longer.
- Markets are concerned about stagflation and gold is seen as a hedge against it.
The price of gold is flat in the Tokyo open on Friday, trading near $1,796 as the price consolidates its recent rally from out of consolidation near $1,750. The highs of the rally were $1,800 stored the prior European session.
The US dollar has been sinking of late as markets take profit in heavily long positioning that has been building ever since the markets had started to price in the Federal Reserve's hawkish turn and the prospects of not only tapering but higher interest rates next year.
However, the US dollar reversed course mid-week even after the minutes of the Fed's Sept. 21-22 policy meeting confirmed the intentions to start tapering of stimulus as soon as November. Inflation is regarded as being here to stay for longer at the Fed and that has raised concerns over stagflation for which gold is recognised as a hedge.
Gold, a hedge against stagflation
''The market's intense focus on pricing the Fed's exit has ignored rising stagflationary risks brewing on the horizon, with speculators offloading their length onto central banks and physical buyers,'' analysts at TD Securities said.
''In fact, while stagflation has captured share of mind, with the story-count of stagflation-themed news rising to unprecedented levels, it has yet to translate into additional gold demand. However, as the global energy crisis intensifies, reasons to own the yellow metal are also growing more compelling, particularly as a cold winter could send energy prices astronomically higher, potentially pricing-out industries and fueling price asymmetries in markets.''
Brent monthly chart
-637698547793844717.png)
''This translates into a fat right tail in gold prices, which informs our long $1850/2000 call spread in gold. Real rates are just starting to sink, reflecting these growing risks,'' the analysts at TD Securities said.
''Further, ongoing purchases from CTA trend followers may catalyze a change in tune from the speculative community which could result in sustained price strength.''
Gold technical analysis
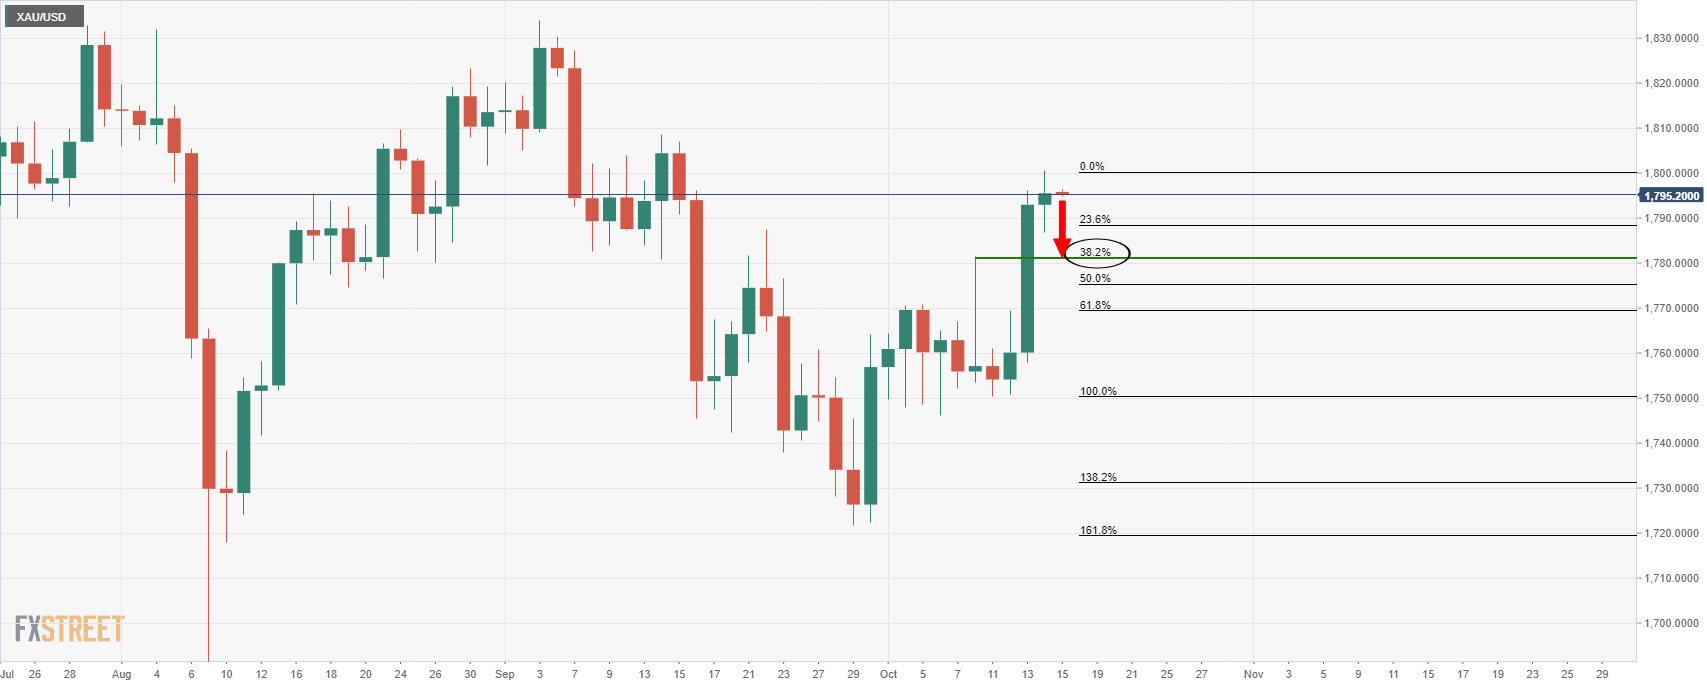
| Time | Country | Event | Period | Previous value | Forecast |
|---|---|---|---|---|---|
| 04:30 (GMT) | Japan | Tertiary Industry Index | August | -0.6% | |
| 06:45 (GMT) | France | CPI, y/y | September | 1.9% | 2.1% |
| 06:45 (GMT) | France | CPI, m/m | September | 0.6% | -0.2% |
| 09:00 (GMT) | Eurozone | Trade balance unadjusted | August | 20.7 | 16.1 |
| 12:30 (GMT) | Canada | Wholesale Sales, m/m | August | -2.1% | 0.5% |
| 12:30 (GMT) | U.S. | NY Fed Empire State manufacturing index | October | 34.3 | 27 |
| 12:30 (GMT) | U.S. | Import Price Index | September | -0.3% | 0.5% |
| 12:30 (GMT) | U.S. | Retail Sales YoY | September | 15.1% | |
| 12:30 (GMT) | U.S. | Retail sales excluding auto | September | 1.8% | 0.5% |
| 12:30 (GMT) | U.S. | Retail sales | September | 0.7% | -0.2% |
| 14:00 (GMT) | U.S. | Business inventories | August | 0.5% | 0.6% |
| 14:00 (GMT) | U.S. | Reuters/Michigan Consumer Sentiment Index | October | 72.8 | 73.1 |
| 16:20 (GMT) | U.S. | FOMC Member Williams Speaks | |||
| 17:00 (GMT) | U.S. | Baker Hughes Oil Rig Count | October | 433 |
| Pare | Closed | Change, % |
|---|---|---|
| AUDUSD | 0.74152 | 0.49 |
| EURJPY | 131.815 | 0.37 |
| EURUSD | 1.15967 | -0 |
| GBPJPY | 155.4 | 0.48 |
| GBPUSD | 1.36706 | 0.1 |
| NZDUSD | 0.70291 | 0.95 |
| USDCAD | 1.23675 | -0.57 |
| USDCHF | 0.92281 | -0.05 |
| USDJPY | 113.644 | 0.36 |
- USD/CAD trades cautiously on Friday in the early Asian session.
- Bulls remain hopeful near 1.2370 a crucial support level.
- Momentum oscillator holds onto oversold zone warns caution against aggressive bids.
USD/CAD trades with a cautious tone on Friday in the early Asian trading hours. The pair confides in a narrow trade band with no meaningful traction. At the time of writing, USD/CAD is trading at 1.2372, up 0.04% for the day.
USD/CAD daily chart
-637698527663897063.png)
On the daily chart, after testing the high of 1.2896 on September 20, the USD/CAD pair came under selling pressure. The pair then took solace at 50-day Simple Moving Average (SMA) at 1.2548 and tested the high of 1.2896. Once again a break of the mentioned SMA resulted in a downside movement for the pair toward the multi-month support near 1.2370. If the price sustains the intraday high it could move back to the 1.2450 horizontal resistance level.
The Moving Average Convergence Divergence (MACD trades in the oversold zone. Any uptick in the MACD would trigger a fresh round of buying opportunities for the pair. USD/CAD bulls would look out for the psychological 1.2500 mark followed by the high of October,10, at 1.2562
Alternatively, a break of multi-month support will bring more pain to the pair with the first downside target at a low of July 6 at 1.2303 followed by the 1.2300 horizontal support level. Next, the market participant will test the 50-day SMA at a 1.2262.
USD/CAD additional levels


© 2000-2026. Sva prava zaštićena.
Sajt je vlasništvo kompanije Teletrade D.J. LLC 2351 LLC 2022 (Euro House, Richmond Hill Road, Kingstown, VC0100, St. Vincent and the Grenadines).
Svi podaci koji se nalaze na sajtu ne predstavljaju osnovu za donošenje investicionih odluka, već su informativnog karaktera.
The company does not serve or provide services to customers who are residents of the US, Canada, Iran, The Democratic People's Republic of Korea, Yemen and FATF blacklisted countries.
Izvršenje trgovinskih operacija sa finansijskim instrumentima upotrebom marginalne trgovine pruža velike mogućnosti i omogućava investitorima ostvarivanje visokih prihoda. Međutim, takav vid trgovine povezan je sa potencijalno visokim nivoom rizika od gubitka sredstava. Проведение торговых операций на финанcовых рынках c маржинальными финанcовыми инcтрументами открывает широкие возможноcти, и позволяет инвеcторам, готовым пойти на риcк, получать выcокую прибыль, но при этом неcет в cебе потенциально выcокий уровень риcка получения убытков. Iz tog razloga je pre započinjanja trgovine potrebno odlučiti o izboru odgovarajuće investicione strategije, uzimajući u obzir raspoložive resurse.
Upotreba informacija: U slučaju potpunog ili delimičnog preuzimanja i daljeg korišćenja materijala koji se nalazi na sajtu, potrebno je navesti link odgovarajuće stranice na sajtu kompanije TeleTrade-a kao izvora informacija. Upotreba materijala na internetu mora biti praćena hiper linkom do web stranice teletrade.org. Automatski uvoz materijala i informacija sa stranice je zabranjen.
Ako imate bilo kakvih pitanja, obratite nam se pr@teletrade.global.
транcфери