- Analiza
- Novosti i instrumenti
- Vesti sa tržišta
Forex-novosti i prognoze od 15-08-2024
- EUR/USD pitched lower despite Thursday’s improved risk appetite.
- US Retail Sales climbed much higher than expected.
- US data to dominate the remainder of the trading week with consumer sentiment.
EUR/USD took a dive back below the 1.1000 handle on Thursday despite a broad-market recovery in investor sentiment. US Retail Sales growth lurched to an 18-month high of 1.0% MoM in July, well above the forecast 0.3% and entirely engulfing the previous month’s -0.2% contraction. Improving economic health indicators are helping to stave off recent concerns of a potential recession within the US.
However, not all is rosy in financial markets post-Retail Sales. According to the CME’s FedWatch Tool, rate markets are now pricing in just 25% odds of a 50 bps double cut from the Federal Reserve (Fed) in September, down significantly from last week’s peak bets of 70% odds. Rate traders have still fully priced in a September rate trim as a done deal, with 75% odds of at least 25 basis points off of the top on September 18.
US data will take center stage for Fiber traders on Friday, where the University of Michigan’s Consumer Sentiment Survey Index is expected to show an improvement in consumer economic expectations, with the figure forecast to tick up to 66.9 from an eight-month low of 66.4.
Economic Indicator
Michigan Consumer Sentiment Index
The Michigan Consumer Sentiment Index, released on a monthly basis by the University of Michigan, is a survey gauging sentiment among consumers in the United States. The questions cover three broad areas: personal finances, business conditions and buying conditions. The data shows a picture of whether or not consumers are willing to spend money, a key factor as consumer spending is a major driver of the US economy. The University of Michigan survey has proven to be an accurate indicator of the future course of the US economy. The survey publishes a preliminary, mid-month reading and a final print at the end of the month. Generally, a high reading is bullish for the US Dollar (USD), while a low reading is bearish.
Read more.Next release: Fri Aug 16, 2024 14:00 (Prel)
Frequency: Monthly
Consensus: 66.9
Previous: 66.4
Source: University of Michigan
Consumer exuberance can translate into greater spending and faster economic growth, implying a stronger labor market and a potential pick-up in inflation, helping turn the Fed hawkish. This survey’s popularity among analysts (mentioned more frequently than CB Consumer Confidence) is justified because the data here includes interviews conducted up to a day or two before the official release, making it a timely measure of consumer mood, but foremost because it gauges consumer attitudes on financial and income situations. Actual figures beating consensus tend to be USD bullish.
EUR/USD price forecast
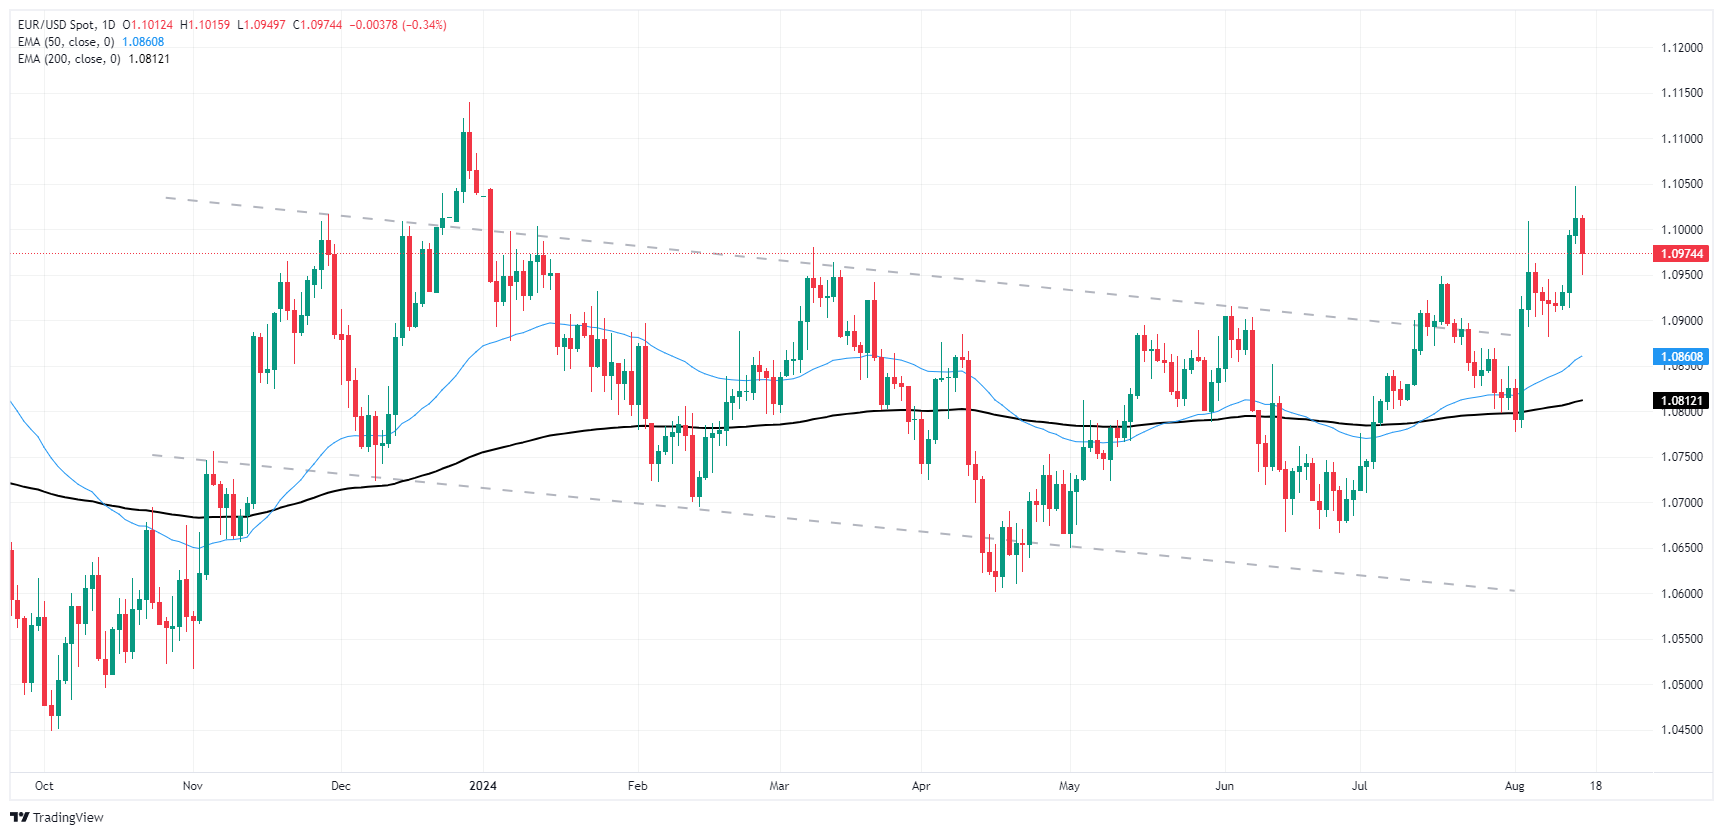
EUR/USD snapped a recent winning streak, tumbling back below the 1.1000 major handle on Friday. Bulls appear set to run out of gas and near-term momentum threatens to drag the Fiber back into a rough descending channel that has plagued the pair through 2024.
Bidders will be looking for technical support from a rising pattern of higher lows on daily candlesticks, but EUR/USD remains poised for a quick snap back toward the 200-day Exponential Moving Average (EMA) at 1.0826.
EUR/USD daily chart
Euro FAQs
The Euro is the currency for the 20 European Union countries that belong to the Eurozone. It is the second most heavily traded currency in the world behind the US Dollar. In 2022, it accounted for 31% of all foreign exchange transactions, with an average daily turnover of over $2.2 trillion a day. EUR/USD is the most heavily traded currency pair in the world, accounting for an estimated 30% off all transactions, followed by EUR/JPY (4%), EUR/GBP (3%) and EUR/AUD (2%).
The European Central Bank (ECB) in Frankfurt, Germany, is the reserve bank for the Eurozone. The ECB sets interest rates and manages monetary policy. The ECB’s primary mandate is to maintain price stability, which means either controlling inflation or stimulating growth. Its primary tool is the raising or lowering of interest rates. Relatively high interest rates – or the expectation of higher rates – will usually benefit the Euro and vice versa. The ECB Governing Council makes monetary policy decisions at meetings held eight times a year. Decisions are made by heads of the Eurozone national banks and six permanent members, including the President of the ECB, Christine Lagarde.
Eurozone inflation data, measured by the Harmonized Index of Consumer Prices (HICP), is an important econometric for the Euro. If inflation rises more than expected, especially if above the ECB’s 2% target, it obliges the ECB to raise interest rates to bring it back under control. Relatively high interest rates compared to its counterparts will usually benefit the Euro, as it makes the region more attractive as a place for global investors to park their money.
Data releases gauge the health of the economy and can impact on the Euro. Indicators such as GDP, Manufacturing and Services PMIs, employment, and consumer sentiment surveys can all influence the direction of the single currency. A strong economy is good for the Euro. Not only does it attract more foreign investment but it may encourage the ECB to put up interest rates, which will directly strengthen the Euro. Otherwise, if economic data is weak, the Euro is likely to fall. Economic data for the four largest economies in the euro area (Germany, France, Italy and Spain) are especially significant, as they account for 75% of the Eurozone’s economy.
Another significant data release for the Euro is the Trade Balance. This indicator measures the difference between what a country earns from its exports and what it spends on imports over a given period. If a country produces highly sought after exports then its currency will gain in value purely from the extra demand created from foreign buyers seeking to purchase these goods. Therefore, a positive net Trade Balance strengthens a currency and vice versa for a negative balance.
- GBP/USD halts downside turnaround, finds another green day.
- UK GDP and industrial activity meet or beat expectations, US Retail Sales surge.
- UK Retail Sales and US Consumer Sentiment on the docket for Friday.
GBP/USD found the gas pedal on Thursday after a steeper-than-expected recovery in US Retail Sales pushed Cable back into the high end. Market sentiment rebounded on the day after fears of a possible US recession were cooled by US data beating expectations, and the Pound Sterling caught additional bullish momentum from UK Gross Domestic Product (GDP) growth meet expectations and UK Manufacturing Production handily exceeding forecasts in July.
Coming up on Friday, UK Retail Sales are expected to rebound from a recent downswing. MoM Retail Sales in July are forecast to rise to 0.5% after the previous month’s -1.2% contraction, with the YoY figure expected to surge to 1.4% from the previous -0.2% contraction. On the US side, the University of Michigan’s Consumer Sentiment Survey Index is expected to show an improvement in consumer economic expectations, with the figure forecast to tick up to 66.9 from an eight-month low of 66.4.
Economic Indicator
Retail Sales (MoM)
The Retail Sales data, released by the US Census Bureau on a monthly basis, measures the value in total receipts of retail and food stores in the United States. Monthly percent changes reflect the rate of changes in such sales. A stratified random sampling method is used to select approximately 4,800 retail and food services firms whose sales are then weighted and benchmarked to represent the complete universe of over three million retail and food services firms across the country. The data is adjusted for seasonal variations as well as holiday and trading-day differences, but not for price changes. Retail Sales data is widely followed as an indicator of consumer spending, which is a major driver of the US economy. Generally, a high reading is seen as bullish for the US Dollar (USD), while a low reading is seen as bearish.
Read more.Last release: Thu Aug 15, 2024 12:30
Frequency: Monthly
Actual: 1%
Consensus: 0.3%
Previous: 0%
Source: US Census Bureau
Retail Sales data published by the US Census Bureau is a leading indicator that gives important information about consumer spending, which has a significant impact on the GDP. Although strong sales figures are likely to boost the USD, external factors, such as weather conditions, could distort the data and paint a misleading picture. In addition to the headline data, changes in the Retail Sales Control Group could trigger a market reaction as it is used to prepare the estimates of Personal Consumption Expenditures for most goods.
GBP/USD technical outlook
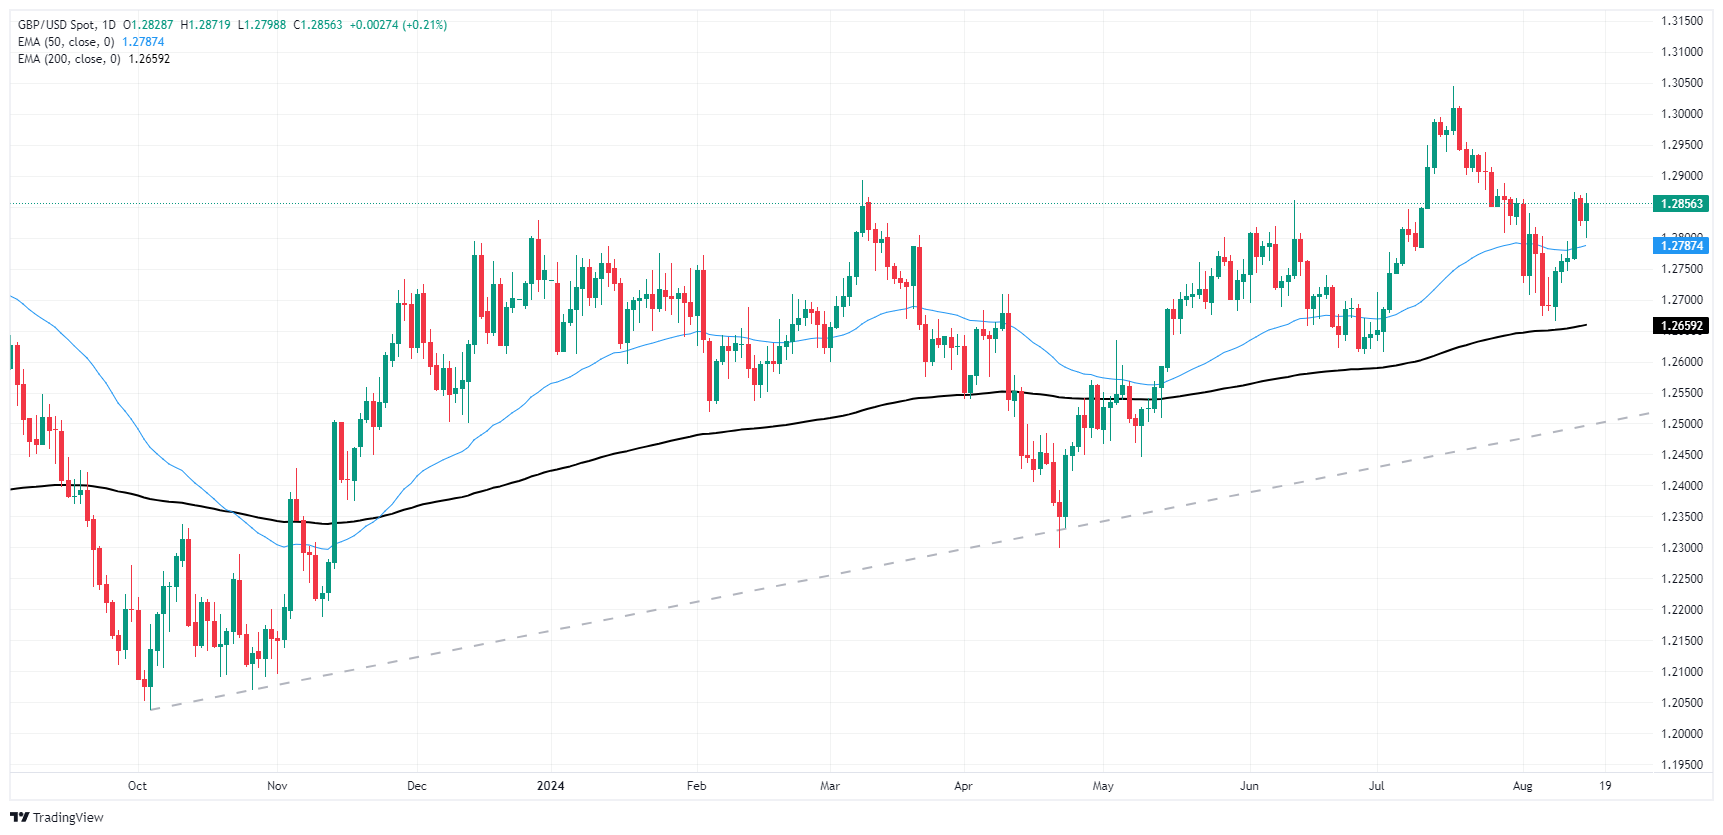
Cable’s bullish recovery on Thursday gave the pair the help it needed to remain on the high side of the 50-day Exponential Moving Average (EMA) 1.2787. GBP/USD caught a technical bounce after hitting the 1.2800 handle early Thursday, but bulls ran out of steam just before they could chalk in a fresh two-week high. Intraday price action is churning just north of 1.2850.
GBP/USD daily chart
Pound Sterling FAQs
The Pound Sterling (GBP) is the oldest currency in the world (886 AD) and the official currency of the United Kingdom. It is the fourth most traded unit for foreign exchange (FX) in the world, accounting for 12% of all transactions, averaging $630 billion a day, according to 2022 data. Its key trading pairs are GBP/USD, aka ‘Cable’, which accounts for 11% of FX, GBP/JPY, or the ‘Dragon’ as it is known by traders (3%), and EUR/GBP (2%). The Pound Sterling is issued by the Bank of England (BoE).
The single most important factor influencing the value of the Pound Sterling is monetary policy decided by the Bank of England. The BoE bases its decisions on whether it has achieved its primary goal of “price stability” – a steady inflation rate of around 2%. Its primary tool for achieving this is the adjustment of interest rates. When inflation is too high, the BoE will try to rein it in by raising interest rates, making it more expensive for people and businesses to access credit. This is generally positive for GBP, as higher interest rates make the UK a more attractive place for global investors to park their money. When inflation falls too low it is a sign economic growth is slowing. In this scenario, the BoE will consider lowering interest rates to cheapen credit so businesses will borrow more to invest in growth-generating projects.
Data releases gauge the health of the economy and can impact the value of the Pound Sterling. Indicators such as GDP, Manufacturing and Services PMIs, and employment can all influence the direction of the GBP. A strong economy is good for Sterling. Not only does it attract more foreign investment but it may encourage the BoE to put up interest rates, which will directly strengthen GBP. Otherwise, if economic data is weak, the Pound Sterling is likely to fall.
Another significant data release for the Pound Sterling is the Trade Balance. This indicator measures the difference between what a country earns from its exports and what it spends on imports over a given period. If a country produces highly sought-after exports, its currency will benefit purely from the extra demand created from foreign buyers seeking to purchase these goods. Therefore, a positive net Trade Balance strengthens a currency and vice versa for a negative balance.
- Gold price trades flat around $2,455 in Friday’s early Asian session.
- US July Retail Sales beat expectations, rising 1.0% MoM; Initials Jobless Claims fell 7K to 227K last week.
- The escalating geopolitical risks in the Middle East might cap the Gold’s downside.
Gold price (XAU/USD) flat lines near $2,455 during the early Asian session on Friday. The yellow metal seesaws between gains and losses amid the consolidation of the US Dollar (USD). Traders will focus on the preliminary of the US Michigan Consumer Sentiment Index for August, along with the Building Permits and Housing Starts.
Following the release of encouraging employment-related data and strong retail sales, speculative interest in the world's biggest economy decreased, easing fears about a potential recession. However, traders still see the US Federal Reserve (Fed) start easing the policy in September. According to the CME FedWatch Tool, the markets are now pricing in a nearly 80% chance of a September rate cut and expect 200 basis points (bps) of reduction in the next 12 months, though that will depend on incoming data.
Data released by the US Census Bureau on Thursday showed that Retail Sales in the United States rose by 1.0% MoM in July, compared to a decline of 0.2% in June. This figure surpassed the estimation of a 0.3 increase. Meanwhile, the Initial Jobless Claims for the week ending August 10 arrived at 227K, better than the expectation of 235K and down from the previous week of 234K. The recent stronger job data and upbeat Retail Sales have strengthened the USD broadly and weighed on the precious metal.
Nonetheless, the elevated geopolitical risks in the Middle East might provide some support to Gold price, a traditional safe-haven asset. Gaza’s Health Ministry says more than 40,000 Palestinians have been killed in Israeli attacks since October 7, with many more buried under rubble and threatened by illness, according to local news source Aljazeera.
Gold FAQs
Gold has played a key role in human’s history as it has been widely used as a store of value and medium of exchange. Currently, apart from its shine and usage for jewelry, the precious metal is widely seen as a safe-haven asset, meaning that it is considered a good investment during turbulent times. Gold is also widely seen as a hedge against inflation and against depreciating currencies as it doesn’t rely on any specific issuer or government.
Central banks are the biggest Gold holders. In their aim to support their currencies in turbulent times, central banks tend to diversify their reserves and buy Gold to improve the perceived strength of the economy and the currency. High Gold reserves can be a source of trust for a country’s solvency. Central banks added 1,136 tonnes of Gold worth around $70 billion to their reserves in 2022, according to data from the World Gold Council. This is the highest yearly purchase since records began. Central banks from emerging economies such as China, India and Turkey are quickly increasing their Gold reserves.
Gold has an inverse correlation with the US Dollar and US Treasuries, which are both major reserve and safe-haven assets. When the Dollar depreciates, Gold tends to rise, enabling investors and central banks to diversify their assets in turbulent times. Gold is also inversely correlated with risk assets. A rally in the stock market tends to weaken Gold price, while sell-offs in riskier markets tend to favor the precious metal.
The price can move due to a wide range of factors. Geopolitical instability or fears of a deep recession can quickly make Gold price escalate due to its safe-haven status. As a yield-less asset, Gold tends to rise with lower interest rates, while higher cost of money usually weighs down on the yellow metal. Still, most moves depend on how the US Dollar (USD) behaves as the asset is priced in dollars (XAU/USD). A strong Dollar tends to keep the price of Gold controlled, whereas a weaker Dollar is likely to push Gold prices up.
- NZD/USD slides lower by 0.25% on Thursday, extending its losing streak.
- Selling pressure gains pace as the RSI and MACD indicate a potential reversal.
- Pair continues trading in the 20-day and 200-day SMA channels.
In Thursday's session, the NZD/USD pair declined to 0.5985, extending its losing streak to two consecutive sessions. The pair has been trading within a narrow range between the 200-day Simple Moving Average (SMA) and the 20-day SMA which are serving as support and resistances.
On the daily chart, the Relative Strength Index (RSI) is currently around 49, but points down while the MACD is showing decreasing green bars, signaling decreasing bullish momentum. This suggests that the selling pressure is increasing and a potential reversal could be on the horizon.
NZD/USD daily chart
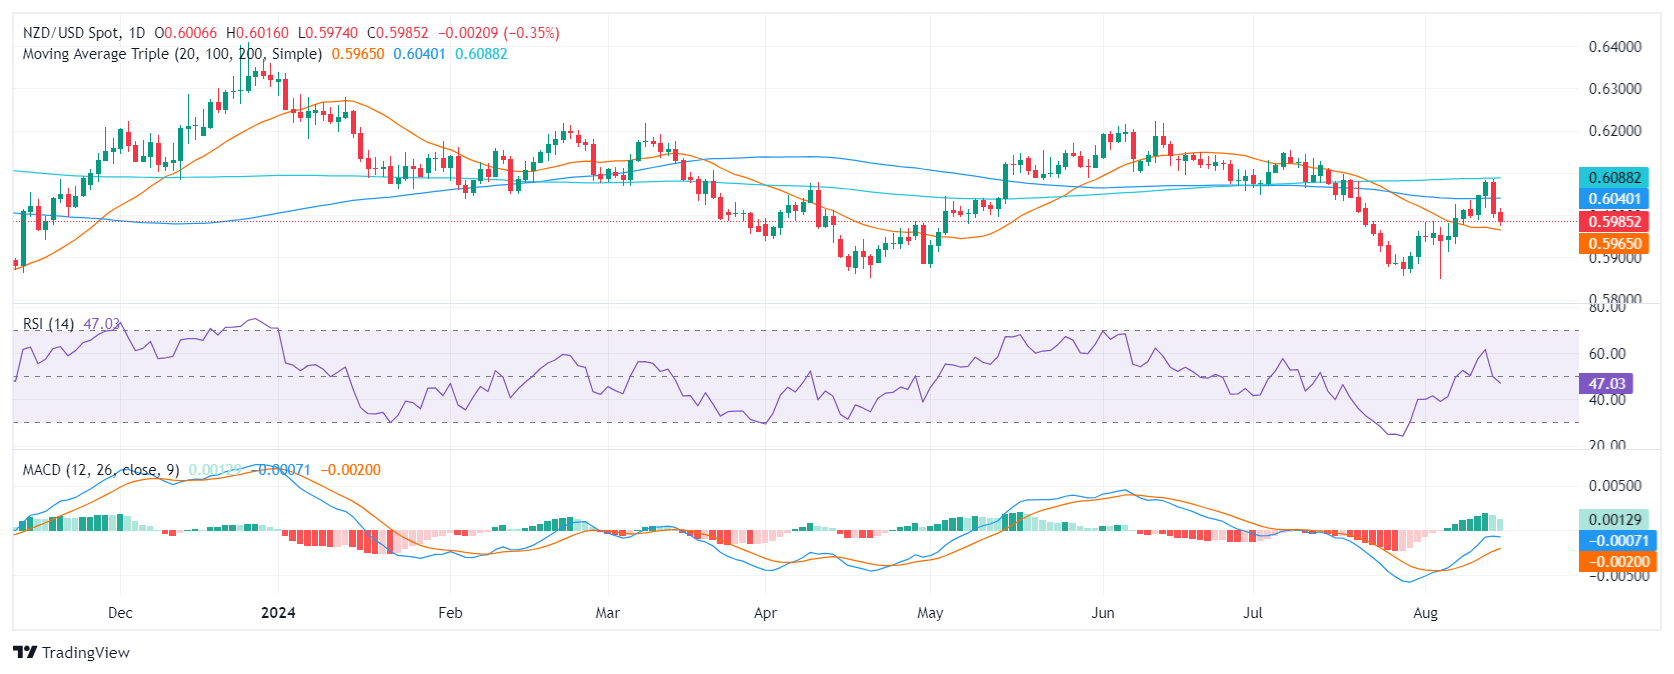
On the daily chart, the NZD/USD pair is facing immediate support at 0.5980. A break below this level could open the door for a deeper correction towards 0.5960 and 0.5930 (20-day SMA). On the upside, resistance lies at 0.6000, 0.6040(100-day SMA) and 0.6100 (200-day SMA). Traders should monitor any brakes above or below the mentioned SMAs as they could trigger sharp movements.
- The Canadian Dollar churned at the mercy of market flows on Thursday.
- Canada reported another, albeit slower, contraction in Wholesale Sales in June.
- Uptick in US Retail Sales pin Greenback lower, but CAD unable to capitalize.
The Canadian Dollar (CAD) was at the mercy of overall market flows on Thursday, rising against the day’s weaker currencies but giving up further ground as the Greenback softens. US markets tilted into a risk-on stance after US Retail Sales jumped in July, helping the market’s overall mood but trimming bets of a double rate cut from the Federal Reserve (Fed) in September.
Canada reported another miss in Wholesale Sales in June, reporting another contraction in large-scale business inventory acquisitions. However, the figure was less than the previous MoM contraction, but the data which runs two months behind the curve, is too late for CAD traders to do anything with.
Daily digest market movers: CAD gives up further ground to Greenback despite risk-on sentiment
- Canadian Wholesale Sales contracted again in June, falling by -0.6% MoM compared to the previous -1.2% decline.
- Despite the low-impact nature of the data, CAD still found a way to ease back against the softening US Dollar.
- US Retail Sales surged to 1.0% in July, the indicator’s highest print since February of 2023.
- The jump in US Retail Sales, a firm indication of good economic health, prompted a broad recovery in risk appetite, sending the Greenback lower.
- Not all is rosy: markets are shrugging off a -0.6% contraction in US Industrial Production in July, the indicator’s worst print since November of 2023.
- Rate markets have pared back bets of a 50 bps double cut from the Fed in September to less than 25%, but they still see 76% odds of at least a quarter-point rate trim.
- Friday’s University of Michigan Consumer Sentiment Index will give one last data point for investors trying to nail down rate cut bets. The index of survey responses is expected to tick higher to 66.9 from 66.4.
Canadian Dollar price forecast: Further losses on the horizon as CAD goes limp
The Canadian Dollar (CAD) broadly followed global market flows, giving a mixed performance overall but shedding a little over one-tenth of one percent against the US Dollar. USD/CAD bids rose back into contention with the 50-day Exponential Moving Average (EMA) at 1.3730, but bidders remain unable to muscle the pair back into fresh positive territory above 1.3750.
USD/CAD daily chart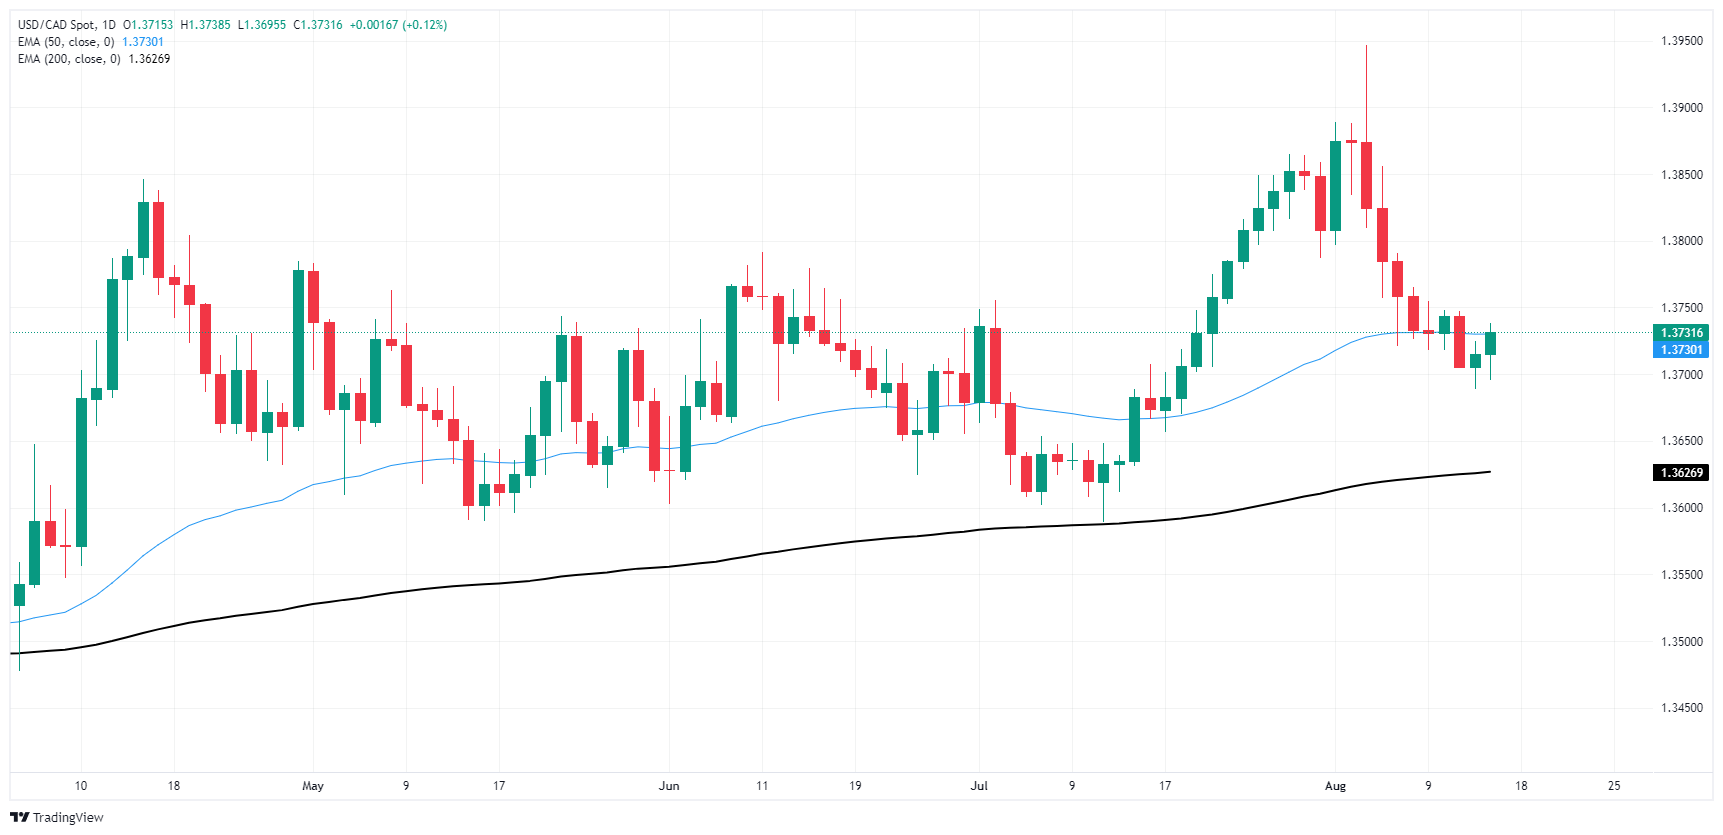
Canadian Dollar FAQs
The key factors driving the Canadian Dollar (CAD) are the level of interest rates set by the Bank of Canada (BoC), the price of Oil, Canada’s largest export, the health of its economy, inflation and the Trade Balance, which is the difference between the value of Canada’s exports versus its imports. Other factors include market sentiment – whether investors are taking on more risky assets (risk-on) or seeking safe-havens (risk-off) – with risk-on being CAD-positive. As its largest trading partner, the health of the US economy is also a key factor influencing the Canadian Dollar.
The Bank of Canada (BoC) has a significant influence on the Canadian Dollar by setting the level of interest rates that banks can lend to one another. This influences the level of interest rates for everyone. The main goal of the BoC is to maintain inflation at 1-3% by adjusting interest rates up or down. Relatively higher interest rates tend to be positive for the CAD. The Bank of Canada can also use quantitative easing and tightening to influence credit conditions, with the former CAD-negative and the latter CAD-positive.
The price of Oil is a key factor impacting the value of the Canadian Dollar. Petroleum is Canada’s biggest export, so Oil price tends to have an immediate impact on the CAD value. Generally, if Oil price rises CAD also goes up, as aggregate demand for the currency increases. The opposite is the case if the price of Oil falls. Higher Oil prices also tend to result in a greater likelihood of a positive Trade Balance, which is also supportive of the CAD.
While inflation had always traditionally been thought of as a negative factor for a currency since it lowers the value of money, the opposite has actually been the case in modern times with the relaxation of cross-border capital controls. Higher inflation tends to lead central banks to put up interest rates which attracts more capital inflows from global investors seeking a lucrative place to keep their money. This increases demand for the local currency, which in Canada’s case is the Canadian Dollar.
Macroeconomic data releases gauge the health of the economy and can have an impact on the Canadian Dollar. Indicators such as GDP, Manufacturing and Services PMIs, employment, and consumer sentiment surveys can all influence the direction of the CAD. A strong economy is good for the Canadian Dollar. Not only does it attract more foreign investment but it may encourage the Bank of Canada to put up interest rates, leading to a stronger currency. If economic data is weak, however, the CAD is likely to fall.
- AUD/USD shows an increase on Thursday, climbing to 0.6630.
- The RBA maintains its hawkish position, potentially balancing the downside.
- The rising Australian Unemployment Rate could affect the Aussie's performance.
The AUD/USD pair experienced an increase of 0.45% during Thursday's session, settling near 0.6630. Despite the rise in Australia's Unemployment Rate in July, strong labor market figures from the country can potentially support the AUD. In addition, the hawkish stance of the Reserve Bank of Australia (RBA) also has a significant impact on the stability of the Aussie.
Relying on the mixed Australian economic outlook and increasing inflation, the RBA's consistent hawkish position has led the markets to predict only 25 bps of easing for 2024.
Daily digest market movers: Aussie sees improvement and shrugs off soft Unemployment figures
- Thursday saw an upbeat day for the AUD/USD pair, even in the face of a rising Unemployment Rate from 4.1% to 4.2%, according to the Australian Bureau of Statistics (ABS).
- Despite this, the strong performance of the Australian Employment Change and Full-Time Employment results, which both surpassed expectations, helped support the AUD.
- Meanwhile, the RBA continues to maintain its hawkish stance, and it all points out that it may be the last among the G10 central banks to implement interest rate cuts.
- On the contrary, the Federal Reserve (Fed) seems poised to facilitate easing in the foreseeable future, a disparity that can potentially benefit the AUD/USD pair in the months to come.
AUD/USD technical outlook: AUD/USD traders exhibit resilience, outlook remains hopeful
On the technical side, the AUD/USD pair reflects a degree of volatility with the Relative Strength Index (RSI) wavering around 54, indicating a primarily neutral momentum. Meanwhile, the Moving Average Convergence Divergence (MACD) prints flat green bars, contributing to the neutral to bullish outlook.
Key support levels are detected at 0.6560 and 0.6500, whereas resistance appears near the 0.6640 and 0.6600 regions. The latter represents the 100 and 200-day Simple Moving Average (SMA) convergence, which is acting as strong support in recent sessions.
Australian Dollar FAQs
One of the most significant factors for the Australian Dollar (AUD) is the level of interest rates set by the Reserve Bank of Australia (RBA). Because Australia is a resource-rich country another key driver is the price of its biggest export, Iron Ore. The health of the Chinese economy, its largest trading partner, is a factor, as well as inflation in Australia, its growth rate and Trade Balance. Market sentiment – whether investors are taking on more risky assets (risk-on) or seeking safe-havens (risk-off) – is also a factor, with risk-on positive for AUD.
The Reserve Bank of Australia (RBA) influences the Australian Dollar (AUD) by setting the level of interest rates that Australian banks can lend to each other. This influences the level of interest rates in the economy as a whole. The main goal of the RBA is to maintain a stable inflation rate of 2-3% by adjusting interest rates up or down. Relatively high interest rates compared to other major central banks support the AUD, and the opposite for relatively low. The RBA can also use quantitative easing and tightening to influence credit conditions, with the former AUD-negative and the latter AUD-positive.
China is Australia’s largest trading partner so the health of the Chinese economy is a major influence on the value of the Australian Dollar (AUD). When the Chinese economy is doing well it purchases more raw materials, goods and services from Australia, lifting demand for the AUD, and pushing up its value. The opposite is the case when the Chinese economy is not growing as fast as expected. Positive or negative surprises in Chinese growth data, therefore, often have a direct impact on the Australian Dollar and its pairs.
Iron Ore is Australia’s largest export, accounting for $118 billion a year according to data from 2021, with China as its primary destination. The price of Iron Ore, therefore, can be a driver of the Australian Dollar. Generally, if the price of Iron Ore rises, AUD also goes up, as aggregate demand for the currency increases. The opposite is the case if the price of Iron Ore falls. Higher Iron Ore prices also tend to result in a greater likelihood of a positive Trade Balance for Australia, which is also positive of the AUD.
The Trade Balance, which is the difference between what a country earns from its exports versus what it pays for its imports, is another factor that can influence the value of the Australian Dollar. If Australia produces highly sought after exports, then its currency will gain in value purely from the surplus demand created from foreign buyers seeking to purchase its exports versus what it spends to purchase imports. Therefore, a positive net Trade Balance strengthens the AUD, with the opposite effect if the Trade Balance is negative.
What you need to take care of on Friday, August 16:
The US Dollar seesawed between gains and losses, ending the day mixed across the FX board after United States (US) data brought relief. Speculative interest dropped concerns about a potential recession in the world’s largest economy following the release of healthy employment-related figures and upbeat Retail Sales. Other figures were not that encouraging but fell short of reviving concerns or affecting the odds for a September interest rate cut.
Stocks made the most out of it, as Wall Street extended its rally to fresh weekly highs, with the three major indexes holding on to substantial gains at the end of the day.
The Euro lost the 1.1000 mark versus the US Dollar and settled around 1.0970, while GBP/USD managed to end the day at around 1.2860, as Sterling Pound found support in local data. The UK Q2 Gross Domestic Product (GDP) showed the economy grew 0.6% in the three months to June as expected. Additionally, Manufacturing Production rose 1.1% MoM in June, surpassing expectations.
Safe-haven CHF and JPY edged lower vs the US Dollar, but commodity-linked currencies such as the AUD and the CAD held within familiar levels as stocks’ rally partially offset USD strength.
Gold managed to trim intraday losses and recovered the $2,450 mark ahead of the US close.
Friday will bring speeches from major central bank Governors. Reserve Bank of Australia (RBA) Michele Bullock is due to testify before Congress alongside other policymakers, while Reserve Bank of New Zealand (RBNZ) Adrian Orr is due to speak about monetary policy at an event hosted by the Wellington Chamber of Commerce.
Later in the day, the United Kingdom (UK) will release July Retail Sales, while the United States (US) will publish the preliminary estimate of the August Michigan Consumer Sentiment Index and the Michigan Consumer Inflation Expectations for the same month.
US Dollar PRICE Today
The table below shows the percentage change of US Dollar (USD) against listed major currencies today. US Dollar was the strongest against the Japanese Yen.
| USD | EUR | GBP | JPY | CAD | AUD | NZD | CHF | |
|---|---|---|---|---|---|---|---|---|
| USD | 0.31% | -0.26% | 1.13% | 0.07% | -0.21% | 0.25% | 0.71% | |
| EUR | -0.31% | -0.58% | 0.80% | -0.25% | -0.61% | -0.23% | 0.40% | |
| GBP | 0.26% | 0.58% | 1.40% | 0.34% | -0.03% | 0.36% | 1.08% | |
| JPY | -1.13% | -0.80% | -1.40% | -1.07% | -1.35% | -1.02% | -0.32% | |
| CAD | -0.07% | 0.25% | -0.34% | 1.07% | -0.28% | 0.02% | 0.74% | |
| AUD | 0.21% | 0.61% | 0.03% | 1.35% | 0.28% | 0.37% | 1.09% | |
| NZD | -0.25% | 0.23% | -0.36% | 1.02% | -0.02% | -0.37% | 0.72% | |
| CHF | -0.71% | -0.40% | -1.08% | 0.32% | -0.74% | -1.09% | -0.72% |
The heat map shows percentage changes of major currencies against each other. The base currency is picked from the left column, while the quote currency is picked from the top row. For example, if you pick the US Dollar from the left column and move along the horizontal line to the Japanese Yen, the percentage change displayed in the box will represent USD (base)/JPY (quote).
- GBP/USD traded back above 1.2860 after US Retail Sales data beat.
- Improving economic data releases ease market fears of US recession.
- UK GDP met expectations, and manufacturing improved more than expected.
GBP/USD recovered back into the high side on Thursday after a bullish tilt in UK data prints coupled with better-than-expected US Retail Sales figures helped to improve overall market sentiment and keep the Greenback pinned on the low side.
US Retail Sales growth lurched to an 18-month high of 1.0% MoM in July, well above the forecast 0.3% and entirely engulfing the previous month’s -0.2% contraction. Improving economic health indicators are helping to stave off recent concerns of a potential recession within the US. However, rate markets got cold water thrown on recent bets of a double cut from the Federal Reserve (Fed) in September.
On the UK side, Gross Domestic Product (GDP) figures for the second quarter printed exactly as expected, rising 0.6% QOQ and 0.9% YoY. Annualized GDP growth figures rebounded from the previous print of 0.3%, and UK Manufacturing Production swelled by 1.1% MoM in June, well above the forecast 0.1% and recovering from the previous month’s revised 0.3%.
GBP/USD price forecast
Cable’s bullish recovery on Thursday gave the pair the help it needed to remain on the high side of the 50-day Exponential Moving Average (EMA) 1.2787. GBP/USD caught a technical bounce after hitting the 1.2800 handle early Thursday, but bulls ran out of steam just before they could chalk in a fresh two-week high. Intraday price action is churning just north of 1.2850.
GBP/USD daily chart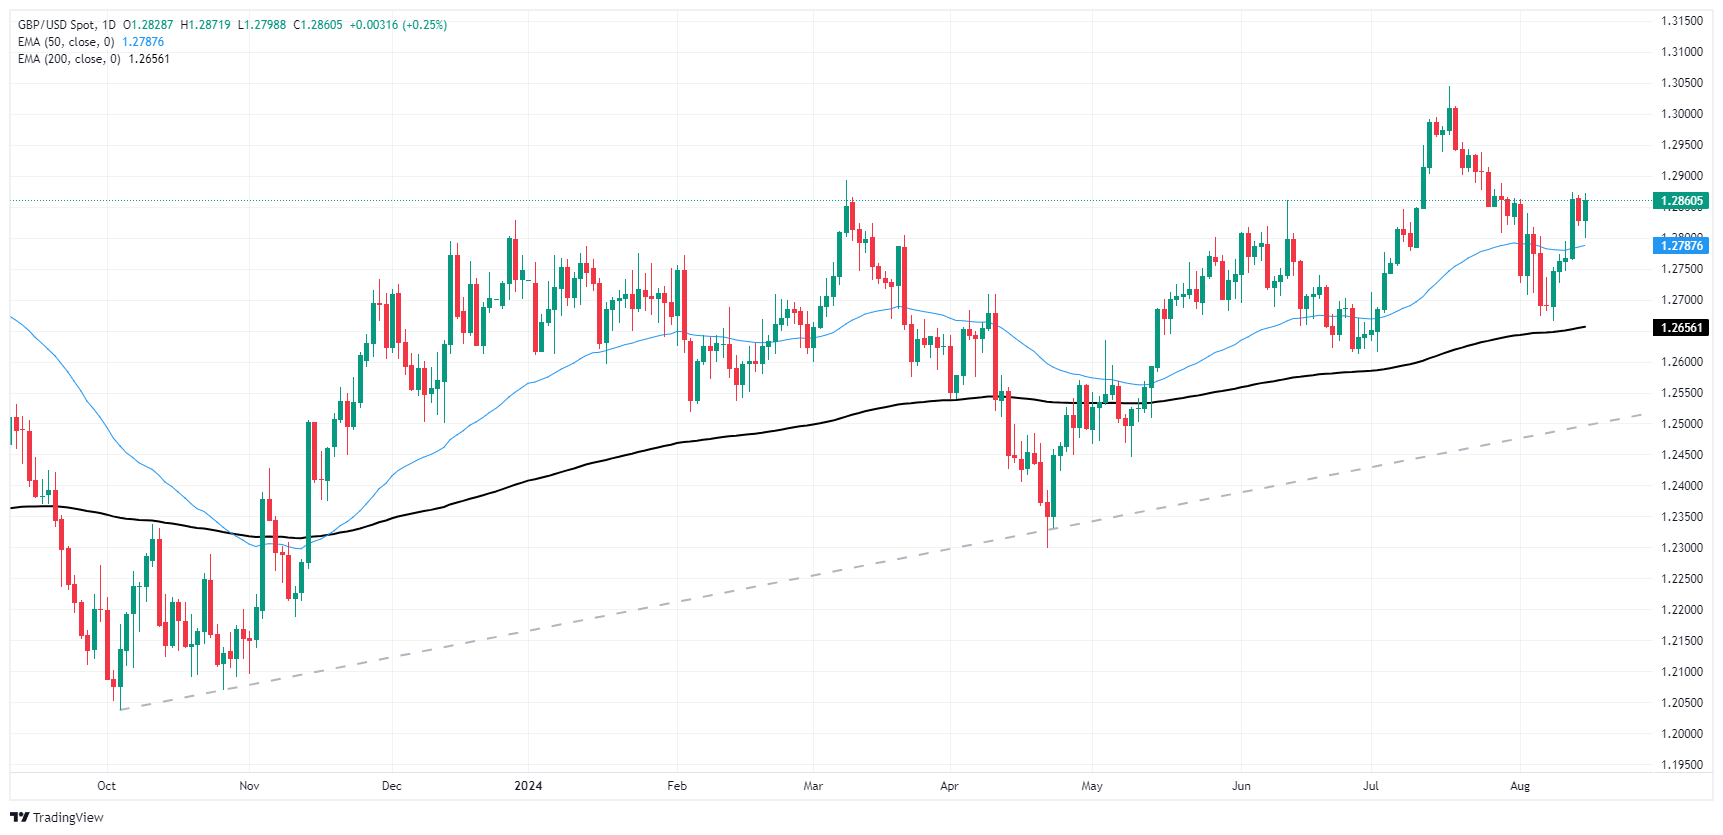
Pound Sterling FAQs
The Pound Sterling (GBP) is the oldest currency in the world (886 AD) and the official currency of the United Kingdom. It is the fourth most traded unit for foreign exchange (FX) in the world, accounting for 12% of all transactions, averaging $630 billion a day, according to 2022 data. Its key trading pairs are GBP/USD, aka ‘Cable’, which accounts for 11% of FX, GBP/JPY, or the ‘Dragon’ as it is known by traders (3%), and EUR/GBP (2%). The Pound Sterling is issued by the Bank of England (BoE).
The single most important factor influencing the value of the Pound Sterling is monetary policy decided by the Bank of England. The BoE bases its decisions on whether it has achieved its primary goal of “price stability” – a steady inflation rate of around 2%. Its primary tool for achieving this is the adjustment of interest rates. When inflation is too high, the BoE will try to rein it in by raising interest rates, making it more expensive for people and businesses to access credit. This is generally positive for GBP, as higher interest rates make the UK a more attractive place for global investors to park their money. When inflation falls too low it is a sign economic growth is slowing. In this scenario, the BoE will consider lowering interest rates to cheapen credit so businesses will borrow more to invest in growth-generating projects.
Data releases gauge the health of the economy and can impact the value of the Pound Sterling. Indicators such as GDP, Manufacturing and Services PMIs, and employment can all influence the direction of the GBP. A strong economy is good for Sterling. Not only does it attract more foreign investment but it may encourage the BoE to put up interest rates, which will directly strengthen GBP. Otherwise, if economic data is weak, the Pound Sterling is likely to fall.
Another significant data release for the Pound Sterling is the Trade Balance. This indicator measures the difference between what a country earns from its exports and what it spends on imports over a given period. If a country produces highly sought-after exports, its currency will benefit purely from the extra demand created from foreign buyers seeking to purchase these goods. Therefore, a positive net Trade Balance strengthens a currency and vice versa for a negative balance.
- USD steadies amid strong economic data releases.
- Retail Sales from July came in strong as well as weekly Jobless Claims.
- Markets continue confident outlook about a September cut by the Fed.
The US Dollar (USD), measured by the US Dollar Index (DXY), consolidated and rose toward the 102.90 level during Thursday's trading session. This was influenced by strong data reported by the US, but steady dovish bets continue to limit the USD upside.
The US economy is persisting above the trend, suggesting that the market may once again be leaning too heavily into firm easing.
Daily digest market movers: USD steadies as Retail Sales and Jobless Claims beat expectations
- Retail Sales rose 1% MoM to $709.7 billion in July, according to the US Census Bureau. This figure surpassed the expected 0.3% increase and compensated for the 0.2% dip in June.
- Retail Sales ex Autos also rose noticeably by 0.4%, beating the expected 0.1%.
- In addition, Initial Jobless Claims for the week ending August 10 came in at 227K, better than the expected 235K and down from the previous week's revised figure of 234K.
- According to the CME FedWatch Tool, odds now point to an 80% chance of a rate cut in September, and markets remain overconfident of 200 bps of easing in the next 12 months though that will depend on incoming data.
DXY technical outlook: Bias remains bearish but showing signs of stabilization
DXY's technical outlook remains bearish, despite some indications of stabilization. The index is positioned below the 20, 100 and 200-day Simple Moving Averages (SMAs), confirming the established bearish bias. Momentum-based indicators such as the Relative Strength Index (RSI) is now hovering around 40, showing signs of stability despite persisting selling pressure.
The Moving Average Convergence Divergence (MACD) also demonstrates red bars that have stabilized deep in the negative region. Though there is a notable shift in momentum, the overall technical narrative does not project a significant bullish rebound just yet.
Support Levels: 102.40, 102.20, 102.00 Resistance Levels: 103.00, 103.50, 104.00
US Dollar FAQs
The US Dollar (USD) is the official currency of the United States of America, and the ‘de facto’ currency of a significant number of other countries where it is found in circulation alongside local notes. It is the most heavily traded currency in the world, accounting for over 88% of all global foreign exchange turnover, or an average of $6.6 trillion in transactions per day, according to data from 2022. Following the second world war, the USD took over from the British Pound as the world’s reserve currency. For most of its history, the US Dollar was backed by Gold, until the Bretton Woods Agreement in 1971 when the Gold Standard went away.
The most important single factor impacting on the value of the US Dollar is monetary policy, which is shaped by the Federal Reserve (Fed). The Fed has two mandates: to achieve price stability (control inflation) and foster full employment. Its primary tool to achieve these two goals is by adjusting interest rates. When prices are rising too quickly and inflation is above the Fed’s 2% target, the Fed will raise rates, which helps the USD value. When inflation falls below 2% or the Unemployment Rate is too high, the Fed may lower interest rates, which weighs on the Greenback.
In extreme situations, the Federal Reserve can also print more Dollars and enact quantitative easing (QE). QE is the process by which the Fed substantially increases the flow of credit in a stuck financial system. It is a non-standard policy measure used when credit has dried up because banks will not lend to each other (out of the fear of counterparty default). It is a last resort when simply lowering interest rates is unlikely to achieve the necessary result. It was the Fed’s weapon of choice to combat the credit crunch that occurred during the Great Financial Crisis in 2008. It involves the Fed printing more Dollars and using them to buy US government bonds predominantly from financial institutions. QE usually leads to a weaker US Dollar.
Quantitative tightening (QT) is the reverse process whereby the Federal Reserve stops buying bonds from financial institutions and does not reinvest the principal from the bonds it holds maturing in new purchases. It is usually positive for the US Dollar.
- The Dow Jones climbed 475 points on Thursday after upbeat US data print.
- US Retail Sales surged to 18-month high in July.
- Upbeat US data sloughs off recession fears, but tempers rate cut bets.
The Dow Jones Industrial Average (DJIA) gained 475 points on Thursday, climbing around 1.25% on the day as equities tipped into the bullish side after US Retail Sales surged well above forecasts. Markets are shedding recent fears of a recession in the US economy, bolstering risk appetite and sending indexes broadly higher.
However, not all is rosy in financial markets post-Retail Sales. According to the CME’s FedWatch Tool, rate markets are now pricing in just 25% odds of a 50 bps double cut from the Federal Reserve (Fed) in September, down significantly from last week’s peak bets of 70% odds. Rate traders have still fully priced in a September rate trim as a done deal, with 75% odds of at least 25 basis points off of the top on September 18.
Dow Jones news
The Dow Jones is broadly higher on Thursday, with all but four of the index’s listed securities testing into the green for the day. Only four stocks on the board are seeing red, with losses being led by Verizon Communications Inc. (VZ) which fell -1.87% to $40.13 per share.
The DJIA is getting dragged higher by firm gains from key listed companies, including Cisco Systems Inc. (CSCO) and Walmart Inc. (WMT). Cisco Systems is extending into a second day of gains after a solid earnings beat this week, rising 7.1% on Thursday to $48.67 per share. Walmart is seeing an earnings beat of its own on Thursday, climbing 6.5% to $73.14 per share after broadly beating growth forecasts.
Read more:
Walmart earnings and guidance impress, helping lead Dow Jones higher
Cisco earnings surprise Wall Street with fiscal Q4 earnings beat
Dow Jones price forecast
Thursday’s upswing puts the Dow Jones to close in the green for a third straight day, climbing even higher above the 40,000.00 handle after a recent plunge into near-term leans below 38,500.00. Price action is trading north of the 50-day Exponential Moving Average (EMA) as bulls return to the fold in force, and bidding continues to drive prices back towards all-time highs above 41,250.00 set in July.
Dow Jones daily chart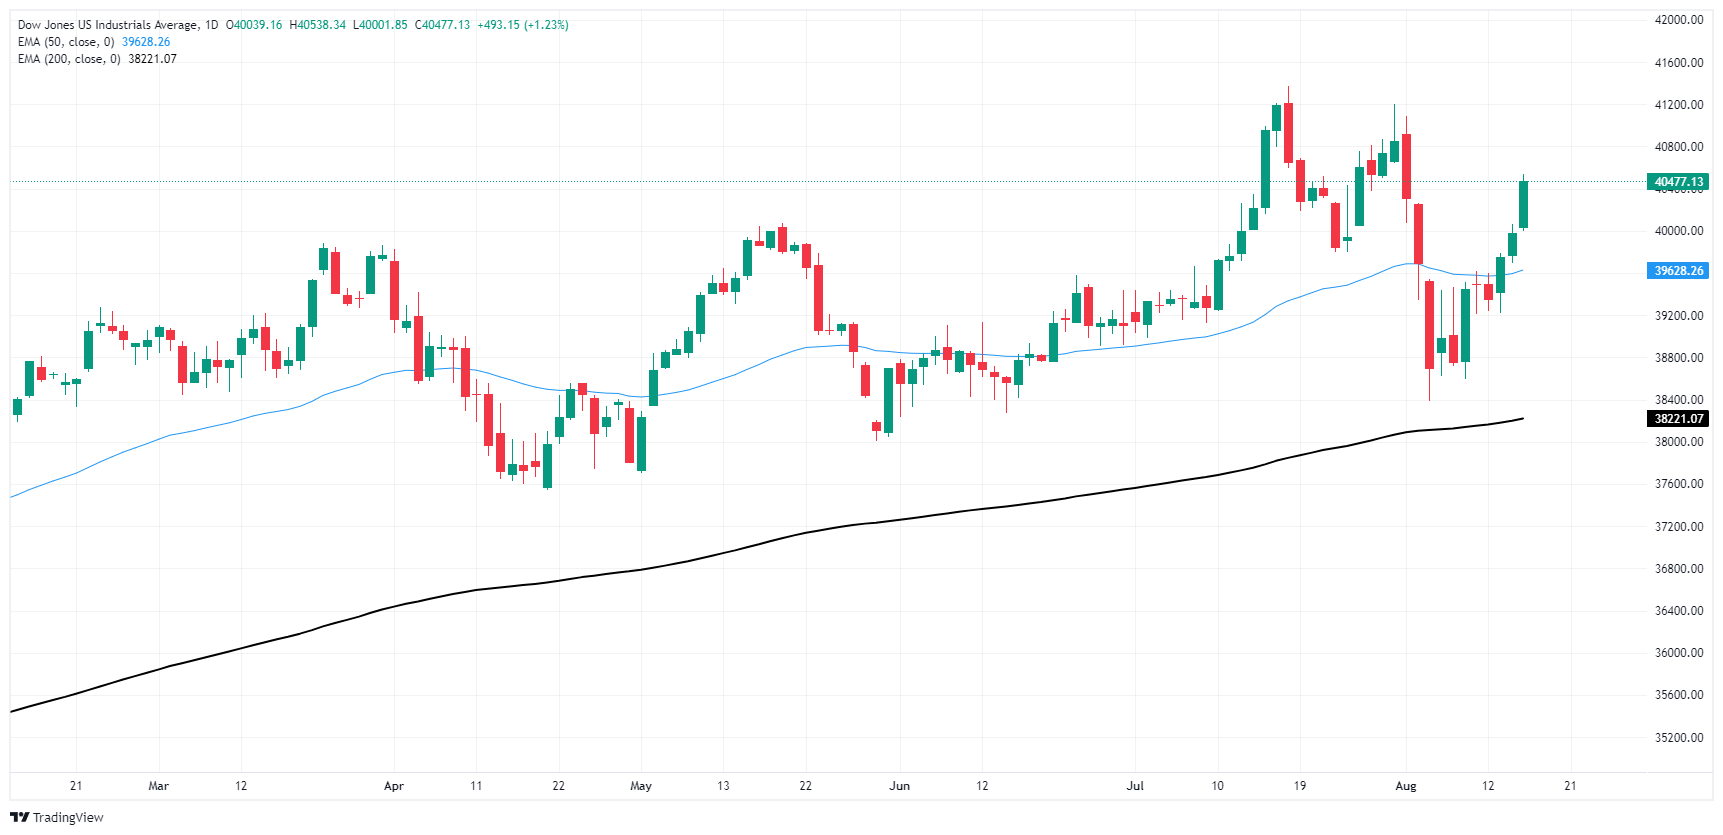
Dow Jones FAQs
The Dow Jones Industrial Average, one of the oldest stock market indices in the world, is compiled of the 30 most traded stocks in the US. The index is price-weighted rather than weighted by capitalization. It is calculated by summing the prices of the constituent stocks and dividing them by a factor, currently 0.152. The index was founded by Charles Dow, who also founded the Wall Street Journal. In later years it has been criticized for not being broadly representative enough because it only tracks 30 conglomerates, unlike broader indices such as the S&P 500.
Many different factors drive the Dow Jones Industrial Average (DJIA). The aggregate performance of the component companies revealed in quarterly company earnings reports is the main one. US and global macroeconomic data also contributes as it impacts on investor sentiment. The level of interest rates, set by the Federal Reserve (Fed), also influences the DJIA as it affects the cost of credit, on which many corporations are heavily reliant. Therefore, inflation can be a major driver as well as other metrics which impact the Fed decisions.
Dow Theory is a method for identifying the primary trend of the stock market developed by Charles Dow. A key step is to compare the direction of the Dow Jones Industrial Average (DJIA) and the Dow Jones Transportation Average (DJTA) and only follow trends where both are moving in the same direction. Volume is a confirmatory criteria. The theory uses elements of peak and trough analysis. Dow’s theory posits three trend phases: accumulation, when smart money starts buying or selling; public participation, when the wider public joins in; and distribution, when the smart money exits.
There are a number of ways to trade the DJIA. One is to use ETFs which allow investors to trade the DJIA as a single security, rather than having to buy shares in all 30 constituent companies. A leading example is the SPDR Dow Jones Industrial Average ETF (DIA). DJIA futures contracts enable traders to speculate on the future value of the index and Options provide the right, but not the obligation, to buy or sell the index at a predetermined price in the future. Mutual funds enable investors to buy a share of a diversified portfolio of DJIA stocks thus providing exposure to the overall index.
- The Mexican Peso reclaimed higher ground against the US Dollar on Thursday.
- The Greenback sold off after Retail Sales surged in the US.
- Markets still see a September Fed rate cut, but strong Retail Sales shed slowdown fears.
The Mexican Peso (MXN) climbed three-quarters of a percent against the US Dollar (USD) on Thursday after the Greenback broadly softened. US Retail Sales firmly eclipsed forecasts, causing investors to shrug off recent economic slowdown concerns. Rate markets pulled back on their bets of a double cut from the Federal Reserve (Fed) in September.
Mexico’s central bank (Banxico) is holding firm in its recent decision to cut interest rates from 11% to 10.75%, even as headline inflation figures rose to 5.57% in July. Citing a long-run slide in core inflation metrics and a broader slowdown looming over Mexico’s domestic economy, Banxico Deputy Governor Omar Mejia noted during an interview on Thursday that:
... a cut with a degree of restriction wasn’t just adequate, but opportune and efficient; to consider just one data point on the margin would mean renouncing a fair amount of information that... we must incorporate into our decisions.
Banxico’s measure of core inflation slowed to 4.05% in July, down from the previous month’s 4.13%. The Mexican central bank expects core inflation to reach its 3% target sometime in Q4 2025.
Daily digest market movers: Peso bolstered by risk-on sentiment crowding the bracket
- US Retail Sales surged to 1.0% in July, the indicator’s highest print since February of 2023.
- The jump in US Retail Sales, a firm indication of good economic health, prompted a broad recovery in risk appetite, sending the Greenback lower.
- Not all is rosy: markets are shrugging off a -0.6% contraction in US Industrial Production in July, the indicator’s worst print since November of 2023.
- Rate markets have pared back bets of a 50 bps double cut from the Fed in September to less than 25%, but they still see 76% odds of at least a quarter-point rate trim.
- Friday’s University of Michigan Consumer Sentiment Index will give one last data point for investors trying to nail down rate cut bets. The index of survey responses is expected to tick higher to 66.9 from 66.4.
Mexican Peso price forecast: Easing Greenback gives Peso room to move
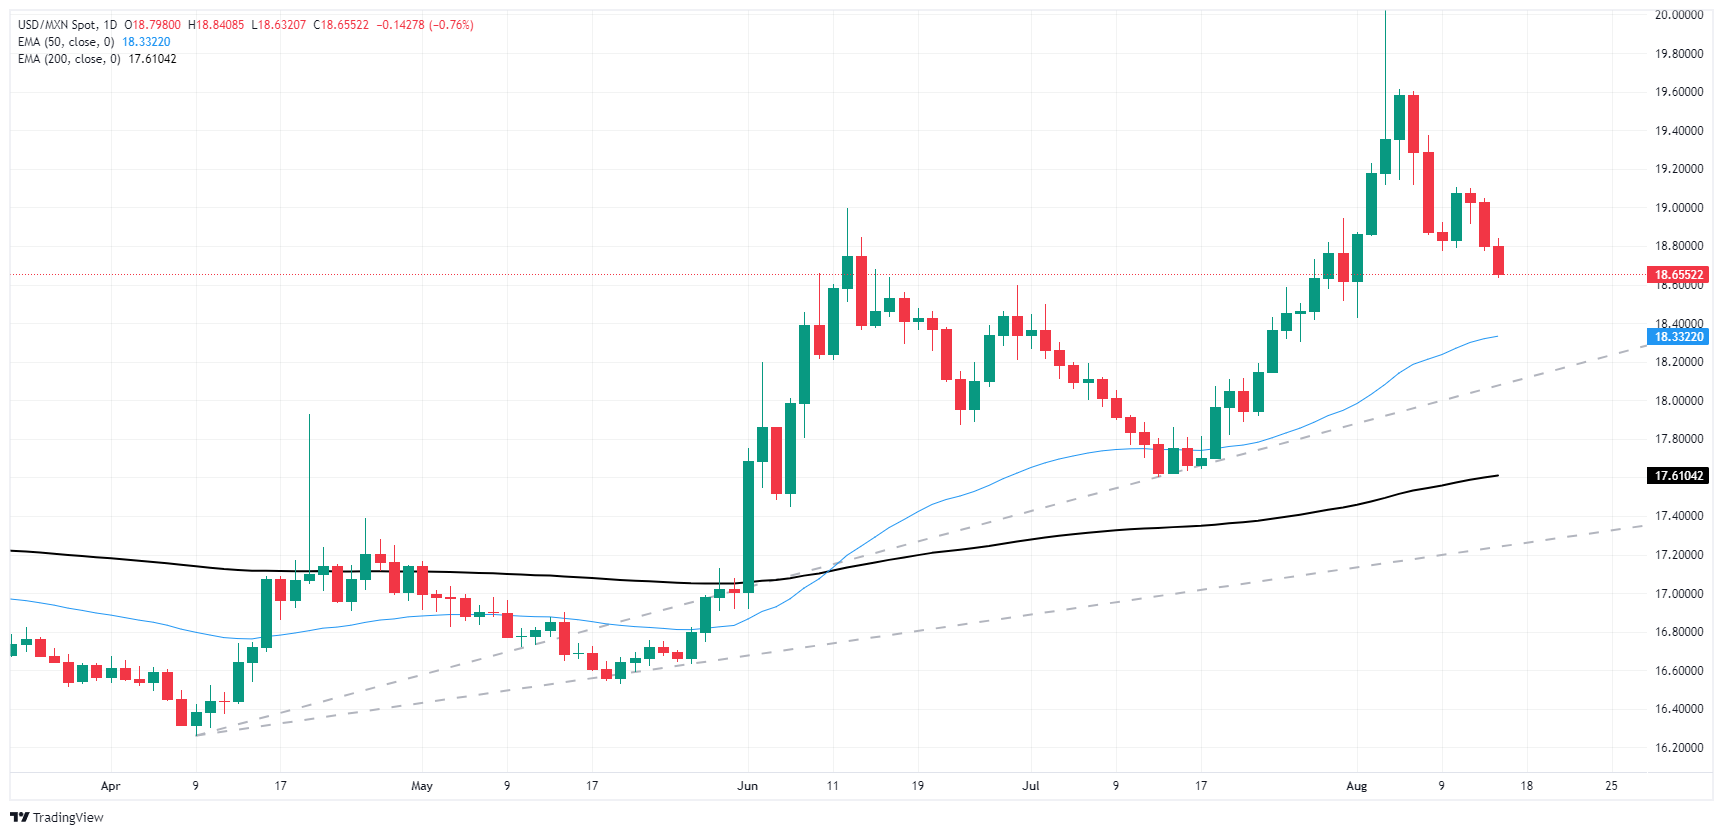
The Mexican Peso chalked in a third straight gain on Thursday as the US Dollar moved out of the way to allow a Peso recovery. USD/MXN has eased below 18.80 for the first time since the beginning of August and is headed toward the 50-day Exponential Moving Average (EMA) near 18.33 as long as current trends hold.
The MXN is on pace to gain ground against the Greenback for all but one of the last seven consecutive trading days. However, USD/MXN is easing down from a very high perch after the pair ran up the charts over 23% from 2024’s lows to tap a 22-month high above 20.00 in early August.
USD/MXN daily chart
Mexican Peso FAQs
The Mexican Peso (MXN) is the most traded currency among its Latin American peers. Its value is broadly determined by the performance of the Mexican economy, the country’s central bank’s policy, the amount of foreign investment in the country and even the levels of remittances sent by Mexicans who live abroad, particularly in the United States. Geopolitical trends can also move MXN: for example, the process of nearshoring – or the decision by some firms to relocate manufacturing capacity and supply chains closer to their home countries – is also seen as a catalyst for the Mexican currency as the country is considered a key manufacturing hub in the American continent. Another catalyst for MXN is Oil prices as Mexico is a key exporter of the commodity.
The main objective of Mexico’s central bank, also known as Banxico, is to maintain inflation at low and stable levels (at or close to its target of 3%, the midpoint in a tolerance band of between 2% and 4%). To this end, the bank sets an appropriate level of interest rates. When inflation is too high, Banxico will attempt to tame it by raising interest rates, making it more expensive for households and businesses to borrow money, thus cooling demand and the overall economy. Higher interest rates are generally positive for the Mexican Peso (MXN) as they lead to higher yields, making the country a more attractive place for investors. On the contrary, lower interest rates tend to weaken MXN.
Macroeconomic data releases are key to assess the state of the economy and can have an impact on the Mexican Peso (MXN) valuation. A strong Mexican economy, based on high economic growth, low unemployment and high confidence is good for MXN. Not only does it attract more foreign investment but it may encourage the Bank of Mexico (Banxico) to increase interest rates, particularly if this strength comes together with elevated inflation. However, if economic data is weak, MXN is likely to depreciate.
As an emerging-market currency, the Mexican Peso (MXN) tends to strive during risk-on periods, or when investors perceive that broader market risks are low and thus are eager to engage with investments that carry a higher risk. Conversely, MXN tends to weaken at times of market turbulence or economic uncertainty as investors tend to sell higher-risk assets and flee to the more-stable safe havens.
- EUR/GBP fell to 0.8540, testing a key support level.
- The pair declined despite mixed UK GDP reported during the European sessions.
- The softish economic outlook favors additional cuts from the BoE.
Thursday saw the EUR/GBP pair fall to 0.8540, after mixed Gross Domestic Product (GDP) data from the UK. This comes after Wednesday's movements when the strength of the Pound was suppressed by disappointing UK inflation data.
The UK reported its Q2 Gross Domestic Product (GDP) data, showing a quarterly growth rate of 0.6%, down from 0.7% in Q1. The annual growth rate was 0.9%, an increase from 0.3% in Q1, as expected. Private consumption grew by a weaker-than-anticipated 0.2% quarter-on-quarter, but this was partially balanced by stronger government spending, which increased by 1.4% quarter-on-quarter.
Business investment and net exports negatively impacted growth. Monthly data for June, released simultaneously, indicated a slowdown as the quarter ended: GDP remained unchanged month-on-month, industrial production rose by 0.8%, services decreased by 0.1%, and construction increased by 0.5%. Overall, current data suggests the Bank of England will likely continue cutting rates to support the economy.
EUR/GBP technical analysis
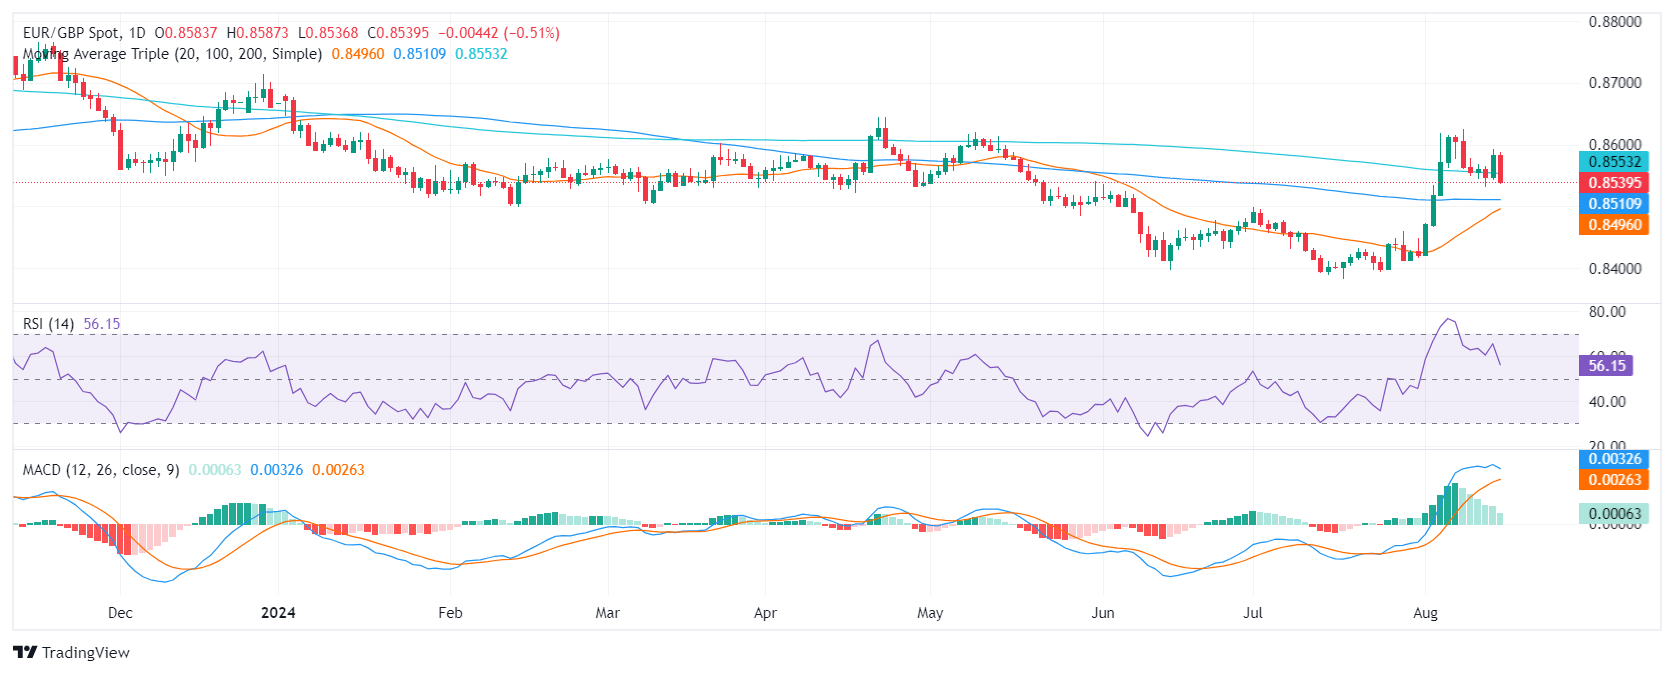
The EUR/GBP shows a mixed trend in recent sessions, with the Relative Strength Index (RSI) moving from mid to high 50s. This suggests a generally bullish or neutral sentiment among traders but with the index now pointing down, it may hint that the sellers are coming. This is backed by the Moving Average Convergence Divergence (MACD) which is showing decreasing red bars, signaling a possible shift towards a bearish sentiment. The volume over the past week has been stable, pointing towards decent liquidity in the pair.
Traders should monitor the 0.8540-0.8590 range as a breakout might fuel sharp movements.
EUR/GBP daily chart
Markets expect CTAs to continue covering shorts in Platinum markets this session, but the balance of risks for CTA positioning has now notably shifted to the downside, TDS senior commodity strategist Daniel Ghali notes.
Balance of risks for CTA positioning turns to the downside
“Barring continued strength in prices, we expect CTAs to return to the offer with large-scale selling activity expected over the coming week, even in a flat tape. And, a big downtape could spark massive CTA selling activity totaling up to -50% of the algos' max size.”
“While there are still some scenarios for the coming week that could result in continued buying activity from algorithmic trend followers, the set-up for flows is already pointing to extreme downside asymmetry.”
We expect notable CTA buying activity in Copper markets this session to set the stage for subsequent buying exhaustion, TDS senior commodity strategist Daniel Ghali notes.
CTA buying activity in Copper to slow down
“CTA trend followers will now be tapped out without a substantial rally propelling Copper prices back towards the $9,800/t mark. The set-up for flows is already asymmetrically tilted to the downside, but we estimate that only a big downtape could spark large-scale selling activity over the coming week.”
“The set-up in Aluminium markets remains more favorable should the complex continue to rally, with continued CTA buying activity expected in an uptape. That being said, the set-up for algo flows in aluminium is now symmetric.”
The Turkish lira (TRY) was hardly changed yesterday despite headlines that the central bank (CBT) had added to its liquidity management toolset by buying up liras at one of the locally operated money markets. This was CBT’s first purchase at this specific money market. The effort to sterilise excess liquidity is consistent with MPC guidance that CBT would seek additional liquidity sterilisation steps when appropriate, with the presumed aim of supporting the currency and ensuring pass-through of monetary tightening to bank lending rates, Commerzbank’s FX strategist Tatha Ghose notes.
Policymakers may be forced into harder measures
“The non-response of the lira exchange rate to liquidity tightening measures in recent months must mean that: either such factors are secondary and ineffective because the exchange rate is currently stronger than its fundamental fair-value, and is gradually finding its way to such value; or that other currency-negative factors are popping up around the same time, which is neutralising the liquidity tightening.”
“If we exclude the abrupt weakening following last year’s election, and calculate only over the subsequent, relatively-stable period, the pace of depreciation still works out to an annualised 26%. If this pace were to continue, then in a year’s time, USD/TRY could trade at 45.30. We assume that policymakers would, by then, be forced into harder measures, paradigm shifts, reforms, or more monetary tightening.”
“The latest SONAR survey reportedly shows that an increasing fraction of the electorate wants early elections. And they want this because of dissatisfaction with the economy. While respondents cite a weak economy and high inflation as urgent problems, the reality is that the economy would have to get a lot worse if inflation were to be truly controlled. There has been some base-effect driven superficial disinflation so far, but not much more.”
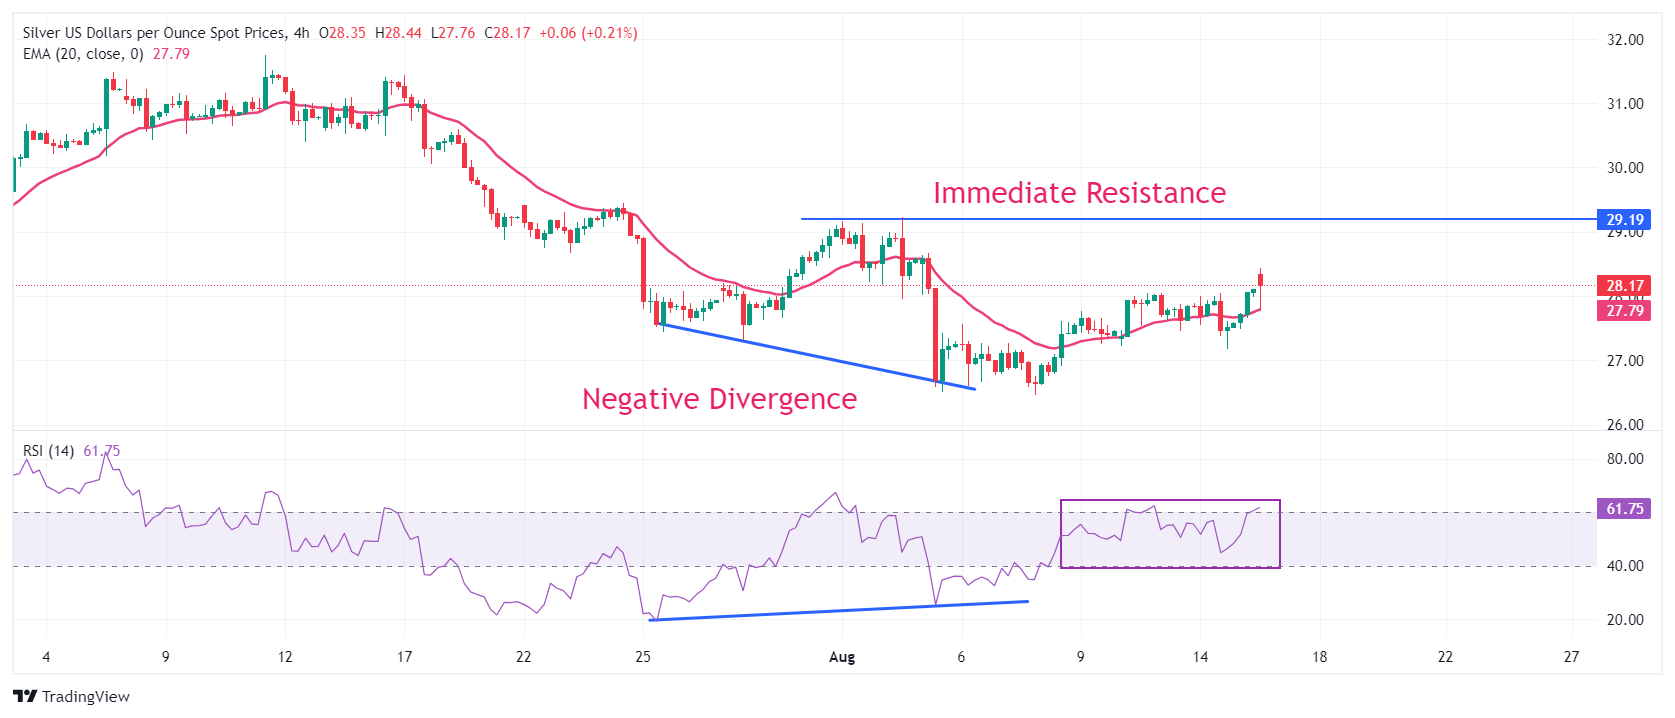
- Silver price drops from intraday high of $28.44 after resilient US Retail Sales data for July.
- Back-to-back decline in US jobless claims suggest that labor market conditions are not as worse as it was anticipated.
- Strong US Retail Sales have prompted a strong recovery in the US Dollar and bond yields.
Silver price (XAG/USD) gives up some of its intraday gains in Thursday’s New York session after the release of the resilient United States (US) Retail Sales data for July and lower-than-expected number of individuals claiming jobless benefits for the first time in the week ending August 9.
The white metal struggles to hold the crucial support of $28.00 as upbeat US data has boosted the US Dollar (USD) and bond yields. The US Dollar Index (DXY), which tracks the Greenback’s value against six major currencies, bounces back above 103.00. 10-year US Treasury yields soar to near 3.96%. Higher yields on interest-bearing assets weigh on non-yielding assets, such as Silver, by increasing the opportunity cost of holding investment in them.
The Retail Sales, a key measure of consumer spending, returned to expansion and rose at a robust pace of 1% from the estimates of 0.3%. Meanwhile, Initial Jobless Claims came in in lower at 227K than estimates of 235K and the prior release of 234K, upwardly revised from 233K. This is the second consecutive time when number of jobless claims have come in lower than expectations, suggesting that labor market conditions are not as bad as they were indicated by the Nonfarm Payrolls (NFP) data for July.
Meanwhile, the near-term outlook of the Silver price remains firm as investors remain confident that the Federal Reserve (Fed) will begin reducing interest rates from the September meeting. However, upbeat data have dashed hopes the Fed will adopt an aggressive policy-easing stance.
Silver technical analysis
Silver price bounced back after a negative divergence formation on a four-hour timeframe, which shapes when the momentum oscillator refuses to make lower lows, while the asset continues that formation. The 14-period Relative Strength Index (RSI) rebounded from 24.00 without hitting downside below previous low of 20.00.
However, the above-mentioned formation would trigger if the white metal breaks above the immediate swing high plotted from the August 2 high of $29.23.
The asset stays above the 20-period Exponential Moving Average (EMA) near $27.80, suggesting that the near-term trend has leaned on the upside.
The 14-period RSI has bounced back to near 60.00 and a decisive break above the same will trigger the upside momentum.
Silver four-hour chart
Silver FAQs
Silver is a precious metal highly traded among investors. It has been historically used as a store of value and a medium of exchange. Although less popular than Gold, traders may turn to Silver to diversify their investment portfolio, for its intrinsic value or as a potential hedge during high-inflation periods. Investors can buy physical Silver, in coins or in bars, or trade it through vehicles such as Exchange Traded Funds, which track its price on international markets.
Silver prices can move due to a wide range of factors. Geopolitical instability or fears of a deep recession can make Silver price escalate due to its safe-haven status, although to a lesser extent than Gold's. As a yieldless asset, Silver tends to rise with lower interest rates. Its moves also depend on how the US Dollar (USD) behaves as the asset is priced in dollars (XAG/USD). A strong Dollar tends to keep the price of Silver at bay, whereas a weaker Dollar is likely to propel prices up. Other factors such as investment demand, mining supply – Silver is much more abundant than Gold – and recycling rates can also affect prices.
Silver is widely used in industry, particularly in sectors such as electronics or solar energy, as it has one of the highest electric conductivity of all metals – more than Copper and Gold. A surge in demand can increase prices, while a decline tends to lower them. Dynamics in the US, Chinese and Indian economies can also contribute to price swings: for the US and particularly China, their big industrial sectors use Silver in various processes; in India, consumers’ demand for the precious metal for jewellery also plays a key role in setting prices.
Silver prices tend to follow Gold's moves. When Gold prices rise, Silver typically follows suit, as their status as safe-haven assets is similar. The Gold/Silver ratio, which shows the number of ounces of Silver needed to equal the value of one ounce of Gold, may help to determine the relative valuation between both metals. Some investors may consider a high ratio as an indicator that Silver is undervalued, or Gold is overvalued. On the contrary, a low ratio might suggest that Gold is undervalued relative to Silver.
The Pound Sterling (GBP) is a marginally better performer among the core majors so far today, with gains supported by further signs of a growth renaissance in the economy.
GBP set to rise towards 1.2900/50
“June GDP was unchanged in the month, as expected, while UK Q2 GDP rose 0.6% q/q, also in line with expectations. June Industrial Production rose a stronger than forecast 0.8% m/m. Manufacturing jumped 1.1%, well ahead of calls for a 0.2% gain. Firm growth trends will not stop the BoE from easing rates again in the next few months but the data tilt risks a little further against a September move.”
“Sterling’s rebound from the upper 1.26s has paused over the past couple of sessions but price patterns are still leaning bullish for the pound as spot consolidates gains. A bullish flag/wedge pattern may be developing on the intraday chart. Gains through 1.2865/75 in the next day or so should be the cue for the GBP rise to resume towards 1.2900/50.”
- USD/CAD rises to near 1.3740 as the US Dollar bounces back after upbeat US data.
- US Retail Sales rose strongly by 1% and Initial Jobless Claims came in lower than expectations.
- A sharp recovery in the Oil price continues to boost the Canadian Dollar.
The USD/CAD pair delivers a vertical upside move to near 1.3740 in Thursday’s New York session as the US Dollar (USD) recovers strongly. The US Dollar bounces back after the release of the stronger-than-expected United States (US) Retail Sales data for July and lower Initial Jobless Claims for the week ending August 9.
The US Dollar Index (DXY), which tracks the Greenback’s value against six major currencies, jumps above 103.00. The US Retail Sales report showed that sales at retail stores rose at a robust pace of 1% due to strong demand for automobiles from the estimates of 0.3%. In June, Retail Sales contracted by 0.2%, downwardly revised from a flat performance.
US Dollar PRICE Today
The table below shows the percentage change of US Dollar (USD) against listed major currencies today. US Dollar was the strongest against the Japanese Yen.
| USD | EUR | GBP | JPY | CAD | AUD | NZD | CHF | |
|---|---|---|---|---|---|---|---|---|
| USD | 0.44% | 0.03% | 1.21% | -0.01% | -0.20% | 0.28% | 0.80% | |
| EUR | -0.44% | -0.41% | 0.74% | -0.44% | -0.72% | -0.32% | 0.35% | |
| GBP | -0.03% | 0.41% | 1.17% | -0.03% | -0.31% | 0.10% | 0.85% | |
| JPY | -1.21% | -0.74% | -1.17% | -1.21% | -1.41% | -1.05% | -0.32% | |
| CAD | 0.00% | 0.44% | 0.03% | 1.21% | -0.20% | 0.13% | 0.88% | |
| AUD | 0.20% | 0.72% | 0.31% | 1.41% | 0.20% | 0.39% | 1.15% | |
| NZD | -0.28% | 0.32% | -0.10% | 1.05% | -0.13% | -0.39% | 0.75% | |
| CHF | -0.80% | -0.35% | -0.85% | 0.32% | -0.88% | -1.15% | -0.75% |
The heat map shows percentage changes of major currencies against each other. The base currency is picked from the left column, while the quote currency is picked from the top row. For example, if you pick the US Dollar from the left column and move along the horizontal line to the Japanese Yen, the percentage change displayed in the box will represent USD (base)/JPY (quote).
Retail Sales are a key measure of households’ spending that eventually propels consumer inflation. Higher value and volume of sales receipts at retail stores exhibits robust spending by individuals. Upbeat Retail Sales have dampened market speculation for the Federal Reserve (Fed) to deliver a 50-basis point (bps) interest-rate reduction in the September. However, firm market expectations for the Fed pivoting to policy-normalization in September remain intact.
Meanwhile, Individuals claiming jobless benefits for the first time came in lower at 227K than estimates of 235K and the prior release of 234K, upwardly revised from 233K.
On the Canadian Dollar (CAD) front, upbeat Oil prices continue to act as major cushion for the Lonnie. The Oil prices have recovered strongly after a two-day correction on expectations that rate cuts from the Fed will boost fuel consumption. It is worth noting that Canada is the leading exporter of Oil to the United States and higher Oil prices result in significant foreign inflows to the former.
Canadian Dollar FAQs
The key factors driving the Canadian Dollar (CAD) are the level of interest rates set by the Bank of Canada (BoC), the price of Oil, Canada’s largest export, the health of its economy, inflation and the Trade Balance, which is the difference between the value of Canada’s exports versus its imports. Other factors include market sentiment – whether investors are taking on more risky assets (risk-on) or seeking safe-havens (risk-off) – with risk-on being CAD-positive. As its largest trading partner, the health of the US economy is also a key factor influencing the Canadian Dollar.
The Bank of Canada (BoC) has a significant influence on the Canadian Dollar by setting the level of interest rates that banks can lend to one another. This influences the level of interest rates for everyone. The main goal of the BoC is to maintain inflation at 1-3% by adjusting interest rates up or down. Relatively higher interest rates tend to be positive for the CAD. The Bank of Canada can also use quantitative easing and tightening to influence credit conditions, with the former CAD-negative and the latter CAD-positive.
The price of Oil is a key factor impacting the value of the Canadian Dollar. Petroleum is Canada’s biggest export, so Oil price tends to have an immediate impact on the CAD value. Generally, if Oil price rises CAD also goes up, as aggregate demand for the currency increases. The opposite is the case if the price of Oil falls. Higher Oil prices also tend to result in a greater likelihood of a positive Trade Balance, which is also supportive of the CAD.
While inflation had always traditionally been thought of as a negative factor for a currency since it lowers the value of money, the opposite has actually been the case in modern times with the relaxation of cross-border capital controls. Higher inflation tends to lead central banks to put up interest rates which attracts more capital inflows from global investors seeking a lucrative place to keep their money. This increases demand for the local currency, which in Canada’s case is the Canadian Dollar.
Macroeconomic data releases gauge the health of the economy and can have an impact on the Canadian Dollar. Indicators such as GDP, Manufacturing and Services PMIs, employment, and consumer sentiment surveys can all influence the direction of the CAD. A strong economy is good for the Canadian Dollar. Not only does it attract more foreign investment but it may encourage the Bank of Canada to put up interest rates, leading to a stronger currency. If economic data is weak, however, the CAD is likely to fall.
Gold (XAU/USD) prices remain near all-time highs, but the associated narratives are stale, TDS senior commodity strategist Daniel Ghali notes.
Risk of a positioning washout is the highest of the year
“Macro fund positioning is statistically consistent with the aggressive 200bps of Fed cuts priced into rates markets over the coming twelve months. CTAs are sitting on their 'max long' position size, whereas the threshold for a deterioration in uptrend signals inches closer by the day.”
“Asian flows have notably deteriorated, following a short pause to the buyer's strike tied to a brief wave of buying activity associated with the change in Indian duties. Shanghai trader positioning remains near record levels, but is increasingly under pressure.”
“Several of the major cohorts in Gold markets are now facing buying exhaustion, whereas the narrative that propelled prices to these all-time highs now appears stale. The risk of a positioning washout is at its highest levels of the year.”
"It now appears the balance of risks on inflation and unemployment have shifted," St. Louis Federal Reserve President Alberto Musalem said on Thursday and added: "The time may be nearing when an adjustment to moderately restrictive policy may be appropriate."
Key takeaways
"Monetary policy is moderately restrictive."
"Absent further shocks, inflation seems to have returned back to path consistent with 2% over time."
"Services and shelter inflation remain a little sticky."
"More disinflation work to do."
"Labor market is no longer overheated."
"Signs of labor market cooling, but layoffs remain low."
"Recent data have bolstered my confidence on inflation."
"Risks to both sides seem more balanced."
Market reaction
The US Dollar preserves its strength following these comments. At the time of press, the USD Index was up 0.5% on the day at 103.06.
This morning, China's National Bureau of Statistics released its monthly data report, which was generally uninspiring, Commerzbank’s FX Analyst Volkmar Baur notes.
China's weak economy argues for lower interest rates
“Although retail sales were slightly positive, the other data points remained weak. Investment in particular was much lower than most analysts had expected according to Bloomberg. In addition to the housing market, infrastructure investment seems to increasingly weigh on growth.”
“So, all in all it was not a good start for the Chinese economy in the third quarter. We expect an improvement in the interest rate differential between China and the US as a result of the interest rate cut cycle in the US to boost the CNY in the coming months.”
“However, the potential remains limited as China's weak economy also argues for lower interest rates.”
- AUD/USD lost its traction and declined toward 0.6600 on Thursday.
- Earlier in the day, the pair gathered bullish momentum on upbeat jobs data from Australia.
- Renewed US Dollar strength doesn't allow the pair to push higher.
After rising to a daily high above 0.6630 during the European trading hours on Thursday, AUD/USD reversed its direction and declined toward 0.6600, erasing its daily gains in the process.
US Dollar PRICE Today
The table below shows the percentage change of US Dollar (USD) against listed major currencies today. US Dollar was the strongest against the Japanese Yen.
| USD | EUR | GBP | JPY | CAD | AUD | NZD | CHF | |
|---|---|---|---|---|---|---|---|---|
| USD | 0.48% | 0.08% | 1.15% | 0.09% | -0.09% | 0.40% | 0.82% | |
| EUR | -0.48% | -0.42% | 0.64% | -0.39% | -0.66% | -0.25% | 0.33% | |
| GBP | -0.08% | 0.42% | 1.07% | 0.02% | -0.23% | 0.18% | 0.84% | |
| JPY | -1.15% | -0.64% | -1.07% | -1.07% | -1.25% | -0.88% | -0.24% | |
| CAD | -0.09% | 0.39% | -0.02% | 1.07% | -0.18% | 0.15% | 0.82% | |
| AUD | 0.09% | 0.66% | 0.23% | 1.25% | 0.18% | 0.40% | 1.07% | |
| NZD | -0.40% | 0.25% | -0.18% | 0.88% | -0.15% | -0.40% | 0.67% | |
| CHF | -0.82% | -0.33% | -0.84% | 0.24% | -0.82% | -1.07% | -0.67% |
The heat map shows percentage changes of major currencies against each other. The base currency is picked from the left column, while the quote currency is picked from the top row. For example, if you pick the US Dollar from the left column and move along the horizontal line to the Japanese Yen, the percentage change displayed in the box will represent USD (base)/JPY (quote).
During the Asian trading hours, the data from Australia showed that the Unemployment Rate ticked up to 4.2% in July from 4.1% in June. On a positive note, Employment Change in the same period came in at +58.2K, surpassing the market expectation of 20K by a wide margin. Additionally, the National Bureau of Statistics of China reported that Retail Sales grew by 2.7% on a yearly basis in July, up from the 2% increase recorded in June.
AUD/USD gathered bullish momentum following these data releases and continued to stretch higher in the first half of the day.
In the American session, upbeat macroeconomic data releases from the US provided a boost to the USD and forced AUD/USD to turn south.
The weekly Initial Jobless Claims in the US declined by 7,000 to 227,000 in the week ending August 10. Furthermore, Retail Sales rose by 1% to $709.7 billion in July. Both of those prints came in better than analysts' estimates.
Australian Dollar FAQs
One of the most significant factors for the Australian Dollar (AUD) is the level of interest rates set by the Reserve Bank of Australia (RBA). Because Australia is a resource-rich country another key driver is the price of its biggest export, Iron Ore. The health of the Chinese economy, its largest trading partner, is a factor, as well as inflation in Australia, its growth rate and Trade Balance. Market sentiment – whether investors are taking on more risky assets (risk-on) or seeking safe-havens (risk-off) – is also a factor, with risk-on positive for AUD.
The Reserve Bank of Australia (RBA) influences the Australian Dollar (AUD) by setting the level of interest rates that Australian banks can lend to each other. This influences the level of interest rates in the economy as a whole. The main goal of the RBA is to maintain a stable inflation rate of 2-3% by adjusting interest rates up or down. Relatively high interest rates compared to other major central banks support the AUD, and the opposite for relatively low. The RBA can also use quantitative easing and tightening to influence credit conditions, with the former AUD-negative and the latter AUD-positive.
China is Australia’s largest trading partner so the health of the Chinese economy is a major influence on the value of the Australian Dollar (AUD). When the Chinese economy is doing well it purchases more raw materials, goods and services from Australia, lifting demand for the AUD, and pushing up its value. The opposite is the case when the Chinese economy is not growing as fast as expected. Positive or negative surprises in Chinese growth data, therefore, often have a direct impact on the Australian Dollar and its pairs.
Iron Ore is Australia’s largest export, accounting for $118 billion a year according to data from 2021, with China as its primary destination. The price of Iron Ore, therefore, can be a driver of the Australian Dollar. Generally, if the price of Iron Ore rises, AUD also goes up, as aggregate demand for the currency increases. The opposite is the case if the price of Iron Ore falls. Higher Iron Ore prices also tend to result in a greater likelihood of a positive Trade Balance for Australia, which is also positive of the AUD.
The Trade Balance, which is the difference between what a country earns from its exports versus what it pays for its imports, is another factor that can influence the value of the Australian Dollar. If Australia produces highly sought after exports, then its currency will gain in value purely from the surplus demand created from foreign buyers seeking to purchase its exports versus what it spends to purchase imports. Therefore, a positive net Trade Balance strengthens the AUD, with the opposite effect if the Trade Balance is negative.
- EUR/USD turned south and broke below 1.1000 in the American session.
- The US Dollar outperforms its rivals on easing concerns over an economic slowdown.
- Investors see a diminishing probability of a large Fed rate cut in September.
After touching its highest level in 2024 near 1.1050 on Wednesday, EUR/USD went into a consolidation phase during the European trading hours on Thursday. With the latest macroeconomic data releases from the US providing a boost to the USD, however, the pair lost its footing and slumped below 1.1000. At the time of press, the pair was down 0.55% on the day at 1.0955.
US Dollar PRICE Today
The table below shows the percentage change of US Dollar (USD) against listed major currencies today. US Dollar was the strongest against the Japanese Yen.
| USD | EUR | GBP | JPY | CAD | AUD | NZD | CHF | |
|---|---|---|---|---|---|---|---|---|
| USD | 0.54% | 0.19% | 1.22% | 0.12% | -0.01% | 0.46% | 0.98% | |
| EUR | -0.54% | -0.36% | 0.67% | -0.41% | -0.64% | -0.25% | 0.44% | |
| GBP | -0.19% | 0.36% | 1.05% | -0.05% | -0.27% | 0.12% | 0.90% | |
| JPY | -1.22% | -0.67% | -1.05% | -1.10% | -1.25% | -0.91% | -0.14% | |
| CAD | -0.12% | 0.41% | 0.05% | 1.10% | -0.14% | 0.17% | 0.96% | |
| AUD | 0.00% | 0.64% | 0.27% | 1.25% | 0.14% | 0.37% | 1.16% | |
| NZD | -0.46% | 0.25% | -0.12% | 0.91% | -0.17% | -0.37% | 0.78% | |
| CHF | -0.98% | -0.44% | -0.90% | 0.14% | -0.96% | -1.16% | -0.78% |
The heat map shows percentage changes of major currencies against each other. The base currency is picked from the left column, while the quote currency is picked from the top row. For example, if you pick the US Dollar from the left column and move along the horizontal line to the Japanese Yen, the percentage change displayed in the box will represent USD (base)/JPY (quote).
The US Census Bureau reported on Thursday that Retail Sales rose by 1% to $709.7 billion in July. This print came in better than the market expectation for an increase of 0.3%.
Additionally, the number of first-time applications for unemployment benefits in the US declined by 7,000 to 227,000 in the week ending August 10, the US Department of Labor announced.
With the immediate market reaction, investors started to lean toward a 25 basis points Federal Rate (Fed) cut in September and US Treasury bond yields surged higher. As of writing, the benchmark 10-year US T-bond yield was up nearly 3% on the day at 3.95%. According to the CME FedWatch Tool, the probability of the Fed opting for a 50 bps rate reduction at the next meeting now sits around 20%, down from about 50% seen earlier in the week.
The US economic calendar will not feature any other high-impact data releases on Thursday. Nevertheless, investors will pay close attention to comments from Fed policymakers later in the American session.
Euro FAQs
The Euro is the currency for the 20 European Union countries that belong to the Eurozone. It is the second most heavily traded currency in the world behind the US Dollar. In 2022, it accounted for 31% of all foreign exchange transactions, with an average daily turnover of over $2.2 trillion a day. EUR/USD is the most heavily traded currency pair in the world, accounting for an estimated 30% off all transactions, followed by EUR/JPY (4%), EUR/GBP (3%) and EUR/AUD (2%).
The European Central Bank (ECB) in Frankfurt, Germany, is the reserve bank for the Eurozone. The ECB sets interest rates and manages monetary policy. The ECB’s primary mandate is to maintain price stability, which means either controlling inflation or stimulating growth. Its primary tool is the raising or lowering of interest rates. Relatively high interest rates – or the expectation of higher rates – will usually benefit the Euro and vice versa. The ECB Governing Council makes monetary policy decisions at meetings held eight times a year. Decisions are made by heads of the Eurozone national banks and six permanent members, including the President of the ECB, Christine Lagarde.
Eurozone inflation data, measured by the Harmonized Index of Consumer Prices (HICP), is an important econometric for the Euro. If inflation rises more than expected, especially if above the ECB’s 2% target, it obliges the ECB to raise interest rates to bring it back under control. Relatively high interest rates compared to its counterparts will usually benefit the Euro, as it makes the region more attractive as a place for global investors to park their money.
Data releases gauge the health of the economy and can impact on the Euro. Indicators such as GDP, Manufacturing and Services PMIs, employment, and consumer sentiment surveys can all influence the direction of the single currency. A strong economy is good for the Euro. Not only does it attract more foreign investment but it may encourage the ECB to put up interest rates, which will directly strengthen the Euro. Otherwise, if economic data is weak, the Euro is likely to fall. Economic data for the four largest economies in the euro area (Germany, France, Italy and Spain) are especially significant, as they account for 75% of the Eurozone’s economy.
Another significant data release for the Euro is the Trade Balance. This indicator measures the difference between what a country earns from its exports and what it spends on imports over a given period. If a country produces highly sought after exports then its currency will gain in value purely from the extra demand created from foreign buyers seeking to purchase these goods. Therefore, a positive net Trade Balance strengthens a currency and vice versa for a negative balance.
- USD/JPY gathered bullish momentum and climbed above 149.00.
- Upbeat Retail Sales and Jobless Claims data from the US provide a boost to the USD.
- The US Dollar Index rises more than 0.5% on the day above 103.00.
USD/JPY gathered bullish momentum and broke out of its one-week-old range in the American session on Thursday. At the time of press, the pair was trading a few pips above 149.00, rising 1.1% on a daily basis.
US Dollar benefits from upbeat data
The renewed US Dollar (USD) strength triggered an upsurge in the second half of the day on Thursday. The data from the US showed that weekly Initial Jobless Claims declined to 227,000 from 234,000 and Retail Sales rose 1%, surpassing the market expectation for an increase of 0.3%. With these reading easing fears over an economic downturn in the US, the USD started to outperform its rivals. As of writing, the USD Index was up 0.55% on the day at 103.15.
Later in the session, investors will pay close attention to comments from Federal Reserve (Fed) officials. According to the CME FedWatch Tool, markets are currently pricing in a 23.5% probably of the Fed lowering the policy rate by 50 basis points (bps), down from nearly 50% at the beginning of the week.
US Dollar PRICE Today
The table below shows the percentage change of US Dollar (USD) against listed major currencies today. US Dollar was the strongest against the Japanese Yen.
| USD | EUR | GBP | JPY | CAD | AUD | NZD | CHF | |
|---|---|---|---|---|---|---|---|---|
| USD | 0.51% | 0.10% | 1.13% | 0.09% | -0.08% | 0.35% | 0.87% | |
| EUR | -0.51% | -0.42% | 0.59% | -0.43% | -0.67% | -0.34% | 0.35% | |
| GBP | -0.10% | 0.42% | 1.01% | -0.01% | -0.25% | 0.09% | 0.87% | |
| JPY | -1.13% | -0.59% | -1.01% | -1.03% | -1.22% | -0.90% | -0.14% | |
| CAD | -0.09% | 0.43% | 0.00% | 1.03% | -0.18% | 0.10% | 0.88% | |
| AUD | 0.08% | 0.67% | 0.25% | 1.22% | 0.18% | 0.33% | 1.12% | |
| NZD | -0.35% | 0.34% | -0.09% | 0.90% | -0.10% | -0.33% | 0.78% | |
| CHF | -0.87% | -0.35% | -0.87% | 0.14% | -0.88% | -1.12% | -0.78% |
The heat map shows percentage changes of major currencies against each other. The base currency is picked from the left column, while the quote currency is picked from the top row. For example, if you pick the US Dollar from the left column and move along the horizontal line to the Japanese Yen, the percentage change displayed in the box will represent USD (base)/JPY (quote).
Japanese Yen FAQs
The Japanese Yen (JPY) is one of the world’s most traded currencies. Its value is broadly determined by the performance of the Japanese economy, but more specifically by the Bank of Japan’s policy, the differential between Japanese and US bond yields, or risk sentiment among traders, among other factors.
One of the Bank of Japan’s mandates is currency control, so its moves are key for the Yen. The BoJ has directly intervened in currency markets sometimes, generally to lower the value of the Yen, although it refrains from doing it often due to political concerns of its main trading partners. The current BoJ ultra-loose monetary policy, based on massive stimulus to the economy, has caused the Yen to depreciate against its main currency peers. This process has exacerbated more recently due to an increasing policy divergence between the Bank of Japan and other main central banks, which have opted to increase interest rates sharply to fight decades-high levels of inflation.
The BoJ’s stance of sticking to ultra-loose monetary policy has led to a widening policy divergence with other central banks, particularly with the US Federal Reserve. This supports a widening of the differential between the 10-year US and Japanese bonds, which favors the US Dollar against the Japanese Yen.
The Japanese Yen is often seen as a safe-haven investment. This means that in times of market stress, investors are more likely to put their money in the Japanese currency due to its supposed reliability and stability. Turbulent times are likely to strengthen the Yen’s value against other currencies seen as more risky to invest in.
The Euro (EUR) is steady on the session and looks quite comfortable trading on a 1.10 handle.
Minor dips to the low/mid 1.09s possible for EUR
“There were no Eurozone data reports this morning and spot has mostly flatlined after drifting back from yesterday’s intraday high. Real and nominal EZ/US rate spreads are EUR-supportive and the EUR appears fundamentally underpinned by the compression in (still negative) yield spreads in recent weeks (well enough for gains to stretch to the mid/upper 1.10s).”
“Spot gains are consolidating in the short run. EUR losses from the intraday high yesterday are not enough at this point to suggest that a deeper correction is likely. Underlying trends remain EUR-bullish, with spot gains supported by an alignment of bullish trend oscillators on the intraday, daily and weekly DMIs.”
“This should also imply firm support for the EUR on minor dips to the low/mid 1.09s.”
- Retail Sales in the US increased more than expected in July.
- The US Dollar Index stays in positive territory above 103.00.
Retail Sales in the US rose 1% to $709.7 billion in July, the US Census Bureau reported on Thursday. This reading followed the 0.2% decrease (revised from 0%) recorded in June and came in better than the market expectation for an increase of 0.3%.
In the same period, Retail Sales ex Autos grew 0.4%, surpassing analysts' estimate of 0.1%.
"Total sales for the May 2024 through July 2024 period were up 2.4% from the same period a year ago," the publication read. "Retail trade sales were up 1.1% from June 2024, and up 2.6% from last year."
Market reaction
The US Dollar gathers strength against its rivals following this upbeat data. At the time of press, the US Dollar Index was up 0.5% on the day at 103.06.
The Australian Dollar (AUD) is up slightly this morning in response to another strong employment report out of Australia, Commerzbank’s FX Analyst Volkmar Baur notes.
Australia's economic problems to set a stage for a weaker Aussie
“After seemingly cooling off at the end of last year, the labor market has been adding jobs at a much faster rate in recent months. In July, another 58.2 thousand new jobs were created, almost three times the average for 2015-2019.”
“The unemployment rate rose slightly, from 4.1% to 4.2%, but this appears to be entirely due to a higher participation rate. A separate survey also showed that consumers' inflation expectations rose again in August to 4.5%, further away from the central bank's target.”
“None of this points to an imminent rate cut by the central bank, which should support the AUD this year. Next year, we expect Australia's economic problems to dominate and hence a weaker Aussie.”
- Initial Jobless Claims in the US declined by 7,000 in the week ending August 10.
- US Dollar Index rebounds toward 103.00 after the data.
There were 227,000 initial jobless claims in the week ending August 10, the weekly data published by the US Department of Labor (DOL) showed on Thursday. This print followed the previous week's print of 234,000 (revised from 233,000) and came in better than the market expectation of 235,000.
Further details of the publication revealed that the advance seasonally adjusted insured unemployment rate was 1.2% and the 4-week moving average stood at 236,500, a decrease of 4,500 from the previous week's unrevised average.
"The advance number for seasonally adjusted insured unemployment during the week ending August 3 was 1,864,000, a decrease of 7,000 from the previous week's revised level," the DOL further noted in its publication.
Market reaction
The US Dollar gathered strength against its rivals with the immediate reaction. At the time of press, the US Dollar Index was up 0.4% on the day at 102.97.
The Canadian Dollar (CAD) is little changed on the session but is holding its minor improvement against the US Dollar (USD) around the 1.37 point. Improved risk appetite and firmer stock market trends are helpful for the CAD but the setback in crude prices over the past couple of sessions implies a slight downturn in the recent improvement in Canadian terms of trade and may help check CAD gains in the near-term, Scotiabank’s chief FX strategist Shaun Osborne notes.
CAD may push above 1.3725
“In the context of a generally softer USD, however, scope for CAD losses should remain limited and the potential for a further nudge up in the CAD (to the mid/upper 1.36s) remains. Wholesale Sales today are expected to drop 0.6% in June, following the weak May report (-0.8%). Estimates are in line with the preliminary data provided with the last report.”
“The CAD is making marginal technical headway against the USD after securing a clear push under USD support at 1.3725 this week. The break under retracement support (61.8% of the June/July move up) targets additional losses to at least 1.3675, possibly 1.36.”
“The USD’s push under the 40-day MA (also around 1.3725) implies a broader shift in tone may be developing for USD/CAD. Resistance remains 1.3725, ahead of 1.3765/75.”
The Japanese Yen (JPY) was unimpressed by this morning's slightly better than expected GDP growth figures for the second quarter. There are likely several reasons for this. First, the Japanese GDP time series is quite volatile, so any single data point should always be taken with a grain of salt. In addition, the previous quarter was revised down slightly, which basically halves the upside surprise, Commerzbank’s FX Analyst Volkmar Baur notes.
USD/JPY seems to be quite comfortable at around 147
“On the positive side, private consumption was much better than expected. And the previous quarter was also revised slightly higher. This is particularly important for the JPY, as private demand is expected to ultimately drive inflation in Japan going forward. However, it should also be noted that private consumption has still not returned to the level of 1Q2023 and is still also below the level of 3Q2019, i.e. before the pandemic.”
“All of this however was overshadowed by reports that BoJ Governor Ueda was invited by the Diet to justify market movements following the rate hike. The governor is likely to strike a dovish tone again to reassure the parliamentarians, which is why I think it is unlikely that the BoJ will raise rates again in the very near future.”
“For now, USD/JPY seems to be quite comfortable at around 147. However, it may not take much to push it out of this fragile equilibrium.”
Thursday’s UK inflation figures were generally a little lower than expected due to a sharper fall in services inflation. However, those expecting the next rate cut in September should be cautious. Most of the surprise came from volatile components. The seasonally adjusted change in the core rate was also only slightly below the average of the last 14 months and therefore still far too high. The all-clear is still not yet given, Commerzbank’s FX Michael Pfister notes.
Growth is unlikely to stop the BoE from cutting interest rates
“If inflation does not (yet) pave the way for further rate cuts, growth could. Bank of England (BoE) Governor Andrew Bailey stressed several times at the post-meeting press conference a fortnight ago that the first-quarter growth figures had overstated the underlying trend. These comments have stuck with me ever since. After all, weaker growth would be bad news for the pound. However, Bailey did not give any real concrete reasons at the press conference.”
“The most concrete argument was that household consumption has hardly grown at all. The BoE is not wrong here, and gives an indication of where the doubts about growth are coming from. After all, most of the surprisingly strong growth in the first quarter was due to net exports. In practice, imports have fallen more sharply than exports, which is not necessarily a sign of strength in the UK economy. The underlying growth trend is therefore likely to be lower.”
“If today's first estimate of second quarter growth does not suggest that growth is on a somewhat broader footing, i.e. that investment and consumer spending are not picking up more strongly, it would be a clear warning sign that sterling's strength is unlikely to last forever. Finally, growth fuelled by falling imports is unlikely to stop the BoE from cutting interest rates. So this is something to watch out for today.”
- Silver price gathers strength to break above $28.00 on firm Fed rate-cut prospects.
- US inflation grew moderately in July.
- Investors await the US monthly Retail Sales data for July.
Silver price (XAG/USD) jumps to near crucial resistance of $28.00 in Thursday’s European session. The white metal aims to deliver more upside as investors expect that the Federal Reserve (Fed) looks set to start reducing interest rates from the September meeting.
According to the CME FedWatch tool, 30-day Federal Finds Futures pricing data shows that the Fed is certain to cut its key borrowing rates in September but traders are split over the size of interest-rate cuts.
Firm speculation for Fed rate cuts has been further boosted by the moderate increase in the United States (US) Consumer Price Index (CPI) data in July, which confirmed that progress in the disinflation process towards bank’s target of 2% continues. Annual headline and core CPI, which excludes volatile food and energy prices, decelerated to 2.9% and 3.2%, respectively.
Growing expectations for Fed rate cuts have weighed on the US Dollar (USD) and bond yields. The US Dollar Index (DXY), which tracks the Greenback’s value against six major currencies, exhibits a subdued performance slightly above a more than seven-month low of 102.16. 10-year US Treasury yields jump to near 8.45% but are still close to weekly lows.
Meanwhile, investors await the US monthly Retail Sales data for July, which will be published at 12:30 GMT. The economic data is expected to show that Retail Sales rose by 0.3% after remaining flat in June.
Silver technical analysis
Silver price rebounds after a negative divergence formation on a four-hour timeframe, which shapes when the momentum oscillator refuses to make lower lows, while the asset continues. The 14-period Relative Strength Index (RSI) rebounded from 24.00 without hitting downside below previous low of 20.00.
However, the above-mentioned formation would trigger if the white metal breaks above the immediate swing high plotted from the August 2 high of $29.23.
The asset climbs above the 50-period Exponential Moving Average (EMA) near $27.70, suggesting that the near-term trend is upbeat.
The 14-period RSI has bounced back to near 60.00 and a decisive break above the same will trigger the upside momentum.
Silver four-hour chart
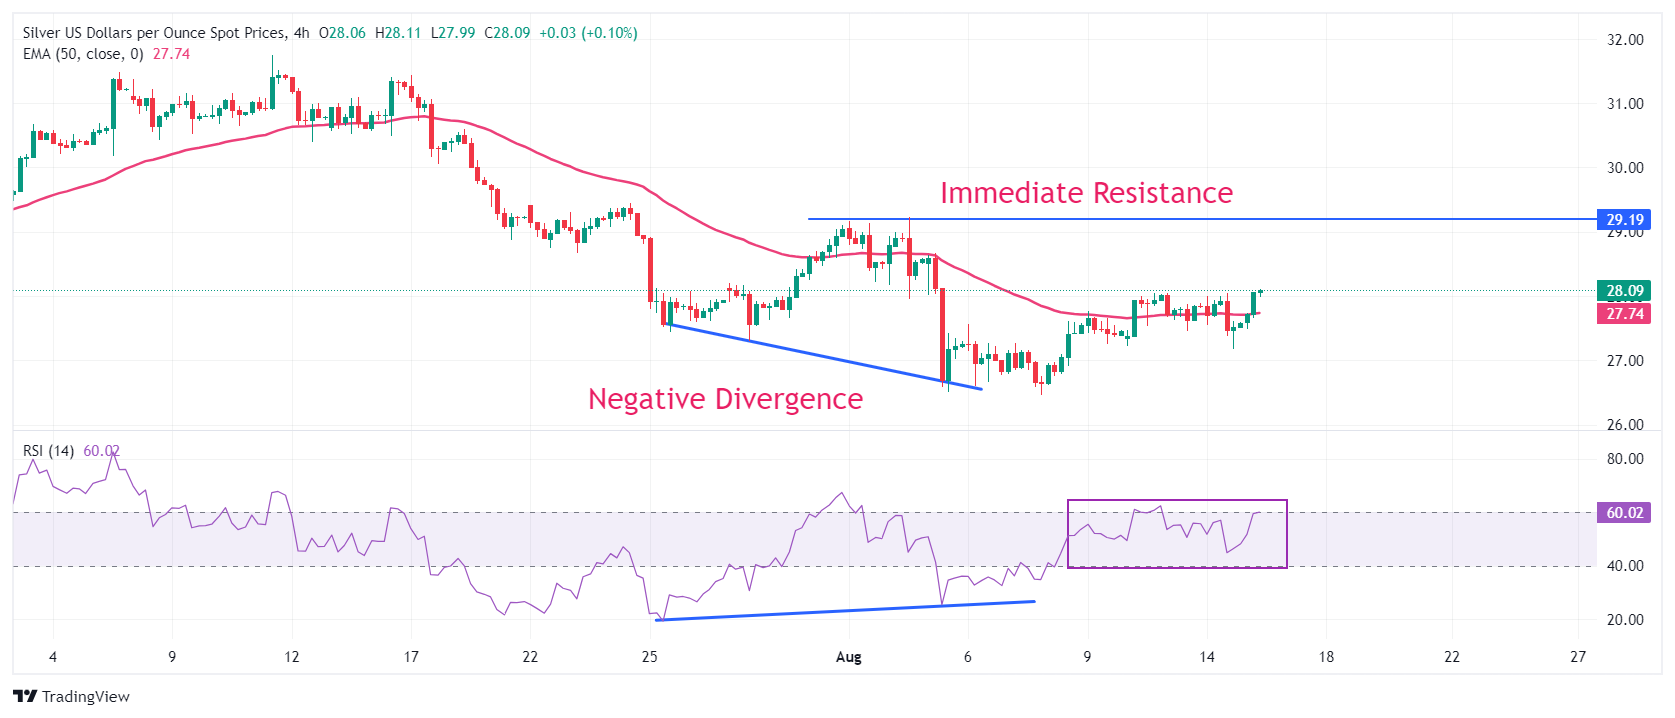
Silver FAQs
Silver is a precious metal highly traded among investors. It has been historically used as a store of value and a medium of exchange. Although less popular than Gold, traders may turn to Silver to diversify their investment portfolio, for its intrinsic value or as a potential hedge during high-inflation periods. Investors can buy physical Silver, in coins or in bars, or trade it through vehicles such as Exchange Traded Funds, which track its price on international markets.
Silver prices can move due to a wide range of factors. Geopolitical instability or fears of a deep recession can make Silver price escalate due to its safe-haven status, although to a lesser extent than Gold's. As a yieldless asset, Silver tends to rise with lower interest rates. Its moves also depend on how the US Dollar (USD) behaves as the asset is priced in dollars (XAG/USD). A strong Dollar tends to keep the price of Silver at bay, whereas a weaker Dollar is likely to propel prices up. Other factors such as investment demand, mining supply – Silver is much more abundant than Gold – and recycling rates can also affect prices.
Silver is widely used in industry, particularly in sectors such as electronics or solar energy, as it has one of the highest electric conductivity of all metals – more than Copper and Gold. A surge in demand can increase prices, while a decline tends to lower them. Dynamics in the US, Chinese and Indian economies can also contribute to price swings: for the US and particularly China, their big industrial sectors use Silver in various processes; in India, consumers’ demand for the precious metal for jewellery also plays a key role in setting prices.
Silver prices tend to follow Gold's moves. When Gold prices rise, Silver typically follows suit, as their status as safe-haven assets is similar. The Gold/Silver ratio, which shows the number of ounces of Silver needed to equal the value of one ounce of Gold, may help to determine the relative valuation between both metals. Some investors may consider a high ratio as an indicator that Silver is undervalued, or Gold is overvalued. On the contrary, a low ratio might suggest that Gold is undervalued relative to Silver.
After the last labor market report, the Fed is once again focusing more on the second mandate of the two that it intends to fulfill. After all, it has recently emphasized that the balance between the two mandates, full employment and inflation, is now more balanced. After months of focusing on inflation, the data series par excellence, the FOMC members are now focusing more on the labor market, Commerzbank’s FX Analyst Antje Praefcke notes.
Rapid cuts at every meeting until the end of the year
“However, the fact that price data continues to be a strong market mover was impressively demonstrated yesterday afternoon when the US inflation data for July came in slightly below market expectations. The market felt vindicated and reacted immediately and unequivocally: the dollar fell and interest rate expectations were maintained at 100 basis points until the end of the year.”
“These figures lay the foundation for the start of the Fed's rate-cutting cycle in September. Analysis shows that the monthly rate of change in the consumer price index excluding food and energy was below 0.2% for the third time in a row. A monthly increase in the consumer price index of 0.2% is roughly consistent with the Fed's target of an annual inflation rate of 2% based on its preferred price index, the PCE deflator.”
“The Fed will not be in crisis mode and just because inflation is moving permanently and definitively towards the target, pull down the key interest rate by 50 basis points in September. I rather believe in rapid cuts, possibly at every meeting until the end of the year. For this to happen, the August labor market report would have to disappoint massively and literally show a slump in employment. Then, could beads of sweat develop on FOMC members' foreheads.”
Silver prices (XAG/USD) rose on Thursday, according to FXStreet data. Silver trades at $28.06 per troy ounce, up 1.82% from the $27.56 it cost on Wednesday.
Silver prices have increased by 17.94% since the beginning of the year.
| Unit measure | Silver Price Today in USD |
|---|---|
| Troy Ounce | 28.06 |
| 1 Gram | 0.90 |
The Gold/Silver ratio, which shows the number of ounces of Silver needed to equal the value of one ounce of Gold, stood at 87.60 on Thursday, down from 88.81 on Wednesday.
Silver FAQs
Silver is a precious metal highly traded among investors. It has been historically used as a store of value and a medium of exchange. Although less popular than Gold, traders may turn to Silver to diversify their investment portfolio, for its intrinsic value or as a potential hedge during high-inflation periods. Investors can buy physical Silver, in coins or in bars, or trade it through vehicles such as Exchange Traded Funds, which track its price on international markets.
Silver prices can move due to a wide range of factors. Geopolitical instability or fears of a deep recession can make Silver price escalate due to its safe-haven status, although to a lesser extent than Gold's. As a yieldless asset, Silver tends to rise with lower interest rates. Its moves also depend on how the US Dollar (USD) behaves as the asset is priced in dollars (XAG/USD). A strong Dollar tends to keep the price of Silver at bay, whereas a weaker Dollar is likely to propel prices up. Other factors such as investment demand, mining supply – Silver is much more abundant than Gold – and recycling rates can also affect prices.
Silver is widely used in industry, particularly in sectors such as electronics or solar energy, as it has one of the highest electric conductivity of all metals – more than Copper and Gold. A surge in demand can increase prices, while a decline tends to lower them. Dynamics in the US, Chinese and Indian economies can also contribute to price swings: for the US and particularly China, their big industrial sectors use Silver in various processes; in India, consumers’ demand for the precious metal for jewellery also plays a key role in setting prices.
Silver prices tend to follow Gold's moves. When Gold prices rise, Silver typically follows suit, as their status as safe-haven assets is similar. The Gold/Silver ratio, which shows the number of ounces of Silver needed to equal the value of one ounce of Gold, may help to determine the relative valuation between both metals. Some investors may consider a high ratio as an indicator that Silver is undervalued, or Gold is overvalued. On the contrary, a low ratio might suggest that Gold is undervalued relative to Silver.
(An automation tool was used in creating this post.)
In Jul, China’s industrial production and retail sales were broadly in line with consensus forecasts, but fixed asset investment unexpectedly slowed as property investment contraction worsened, UOB Group economist Ho Woei Chen notes.
Uneven growth in Jul with weak retail sales
“China’s industrial production and retail sales were broadly in line with consensus forecasts, but fixed asset investment unexpectedly slowed, and the surveyed jobless rates jumped higher in Jul. The housing market remained in a downtrend with prices, residential property sales value and real estate investment continuing to fall.”
“Although loans demand tends to be seasonally weaker in Jul, the sub-par data has further heightened concerns over a balance sheet recession in China where monetary policy easing loses its effectiveness to boost demand due to the weak sentiment.”
“There is room for the LPRs to be further lowered next week (20 Aug) to reflect the larger than usual 20 bps cut to the 1Y MLF on 25 Jul. In the near-term, there is also the possibility of a 50 bps cut to the reserve requirement ratio (RRR). The weak data also calls for stronger fiscal measures to boost private consumption. With the overall picture remaining mixed, we expect China’s growth to moderate from 5.0% in 1H24 to 4.8% in 2H24 with full-year GDP growth likely at 4.9%.”
Outflows of direct investment by foreign investors exceeded inflows in 2Q24 by a record USD 14.80 bn, the second time of such net outflows since data started in 1998, UOB Group economist Ho Woei Chen notes.
Net direct investment outflows in 2Q24
“China’s FDI inflows have weakened further in 2Q24. The net direct investment liabilities on the balance of payments (BOP) showed a record outflow. FDI reported by MOFCOM which only includes new FDI inflows also fell to its lowest since 3Q17.”
“China has remained the largest recipient of global FDI in 2023, after the US and ASEAN. The recent data from SAFE and MOFCOM suggests that China faces the prospects of a sharper slowdown in FDI inflows this year due to the ongoing trade tensions and its growth moderation.”
“The scaling down of FDI and the shift of some manufacturing operations overseas will inevitably weigh on the domestic job creation and growth prospects over the medium to long term. Thus, more efforts will be needed to promote private consumption as another growth driver.”
Decline in the US Dollar (USD) seems to have stabilised; it is likely to trade in a 7.1350/7.1630 range today. While downward momentum has been boosted, it is unclear at this time if it is sufficiently enough for USD to break below 7.0635, UOB Group FX analysts Quek Ser Leang and Lee Sue Ann note.
Bulls push towards 7.1630
24-HOUR VIEW: “While we expected USD to continue to decline yesterday, we indicated that ‘the support at 7.1300 is likely out of reach.’ During NY trading, USD briefly fell sharply to 7.1317 before rebounding strongly to close nearly unchanged at 7.1475 (-0.02%). The decline seems to have stabilised. Today, USD is likely to trade in a 7.1350/7.1630 range.”
1-3 WEEKS VIEW: “After USD fell two days ago, we indicated yesterday (14 Aug, spot at 7.1500) that ‘while downward momentum has been boosted, it is unclear at this time if it is sufficiently enough for USD to break below 7.0635.’ Our view remains unchanged. Overall, the bias remains on the downside as long as 7.1850 (no change in ‘strong resistance’ level) is not breached.”
The strong Australian July employment data may prove something of a headache for the Reserve Bank of Australia. Strong gains in full-time employment look likely to delay the RBA from tumbling into full easing mood as already seen in New Zealand and will probably be seen by the Fed in September, ING’s FX strategist Chris Turner notes.
One-month target is at 0.68 for AUD/USD
“This should imply that the Australian Dollar (AUD) does well on the crosses. The early August tumble in AUD/NZD suggests that investors had liked this cross to trade higher, but yen-triggered deleveraging forced the unwind. We can now see this cross retesting the 1.1150 highs from mid-July.”
“Equally, if the Fed is to cut in September and the US yield curve to steepen further, EUR/AUD should come lower. But it may well be that macro weakness in China is holding the AUD back here. Overall, a one-month target is at 0.68 for AUD/USD.”
- The Oil price finds an interim cushion near $76.00 after correcting from a fresh three-week high near $78.80.
- Firm Fed interest-rate cut prospects have supported the downside in the Oil price.
- Weak demand for stimulus in China has prompted fears of global demand concerns.
West Texas Intermediate (WTI), futures on NYMEX, discover support near $75.70 in Thursday’s European session after correcting from a fresh three-week high of $78.78 in last two trading sessions. The Oil price is expected to remain sideways as the downside is being supported by the uncertainty over Middle East conflicts and overwhelmed expectations of market participants that the Federal Reserve (Fed) will start reducing interest rates from the September meeting. While growing uncertainty of global Oil demand has sealed the upside.
Investors have been anxious as Iran continues to prepare to retaliate for the assassination of the Hamas leader by an Israeli air strike in Tehran.
Meanwhile, investors see Fed’s interest-rate cut in September as certain as price pressures remain on path that leads to Fed’s target of 2%. However, traders are split about the size with which the Fed will reduce its key borrowing rates. Lower interest rates by the Fed bode well for the Oil price as higher liquidity outflow results in an improvement in economic activity and fuel consumption.
Investors’ confidence that the Fed will cut interest rates from September was prompted by moderate growth in the United States (US) Consumer Price Index (CPI) data for July, released on Wednesday. The CPI report showed that annual core inflation, which excludes volatile food and energy prices, decelerated expectedly to 3.2%. The headline inflation surprisingly slowed to 2.9%, the lowest level seen in more than three years.
In the Asian region, deepening concerns over China’s recovery has prompted uncertainty over global demand. The data on Tuesday from the People’s Bank of China (PBoC) showed that July new bank loans plunged to a 15-year low, suggested weak demand in the domestic market. It is worth noting that China is the largest importer of Oil in the world and poor demand conditions in the economy weigh heavily on the Oil price.
Brent Crude Oil FAQs
Brent Crude Oil is a type of Crude Oil found in the North Sea that is used as a benchmark for international Oil prices. It is considered ‘light’ and ‘sweet’ because of its high gravity and low sulfur content, making it easier to refine into gasoline and other high-value products. Brent Crude Oil serves as a reference price for approximately two-thirds of the world's internationally traded Oil supplies. Its popularity rests on its availability and stability: the North Sea region has well-established infrastructure for Oil production and transportation, ensuring a reliable and consistent supply.
Like all assets supply and demand are the key drivers of Brent Crude Oil price. As such, global growth can be a driver of increased demand and vice versa for weak global growth. Political instability, wars, and sanctions can disrupt supply and impact prices. The decisions of OPEC, a group of major Oil-producing countries, is another key driver of price. The value of the US Dollar influences the price of Brent Crude Oil, since Oil is predominantly traded in US Dollars, thus a weaker US Dollar can make Oil more affordable and vice versa.
The weekly Oil inventory reports published by the American Petroleum Institute (API) and the Energy Information Agency (EIA) impact the price of Brent Crude Oil. Changes in inventories reflect fluctuating supply and demand. If the data shows a drop in inventories it can indicate increased demand, pushing up Oil price. Higher inventories can reflect increased supply, pushing down prices. API’s report is published every Tuesday and EIA’s the day after. Their results are usually similar, falling within 1% of each other 75% of the time. The EIA data is considered more reliable, since it is a government agency.
OPEC (Organization of the Petroleum Exporting Countries) is a group of 13 Oil producing nations who collectively decide production quotas for member countries at twice-yearly meetings. Their decisions often impact Brent Crude Oil prices. When OPEC decides to lower quotas, it can tighten supply, pushing up Oil prices. When OPEC increases production, it has the opposite effect. OPEC+ refers to an expanded group that includes ten extra non-OPEC members, the most notable of which is Russia.
The eurozone economy does not have a lot to shout about at the moment. And a rebound in the Chinese economy remains elusive, ING’s FX strategist Chris Turner notes.
Range breakouts should be respected
“Yet the prospect of the US economy and interest rates converging on the lower levels in the rest of the world is proving supportive for EUR/USD. This can be seen in the FX options market, where in the one-month tenor, the price of a euro call option over a euro put option has turned positive for the first time since February 2022.”
“In our recent FX talking publication, we felt EUR/USD had the legs to move to 1.12. We would like to keep this bias for the time being even though the prospect of European fiscal consolidation and potentially wider sovereign spreads may reappear in September.”
“We see EUR/USD support at 1.0985/1000 and any softer US activity data could drag it up towards 1.11. While it is tempting to say that EUR/USD will remain in a 1.05-1.11 range for evermore, we would caution that realised EUR/USD volatility has been exceptionally low over the last couple of years and that range breakouts should be respected.”
The US Dollar (USD) is expected to trade in a range, probably between 146.50 and 147.80. Downward momentum is beginning to wane; a breach of 148.30 would mean the weakness in USD has stabilised, UOB Group FX analysts Quek Ser Leang and Lee Sue Ann note.
Markets may push upwards to test 147.80
24-HOUR VIEW: “Yesterday, we detected “a slight increase in downward momentum.” We expected USD to edge lower, but we highlighted that “given that momentum is not strong, any decline is unlikely to break below 146.00.” Our view was not wrong, as USD dropped briefly to 146.07, rebounding quickly to close at 147.31 (+0.33%). There has been no increase in either downward or upward momentum. Today, USD is expected to trade in a range, probably between 146.50 and 147.80.”
1-3 WEEKS VIEW: “Our update from three days ago (12 Aug, spot at 146.90) remains valid. As highlighted, downward momentum is beginning to wane, and a breach of 148.30 (no change in ‘strong resistance’ level) would mean that the recent weakness in USD has stabilised.”
- EUR/USD holds its key support of 1.1000 as the Fed looks set to cut interest rates in September.
- Moderate growth in the US CPI in July boosted confidence that inflation remains on track to reach the bank’s target of 2%.
- The ECB is expected to avoid cutting interest rates aggressively.
The EUR/USD pair trades in a tight range above the psychological support of 1.1000 in Thursday’s European session. The major currency pair faces slight profit-booking after posting a fresh more than seven-month high at 1.1050.
However, the near-term outlook of the major remains firm as the Federal Reserve (Fed) is widely anticipated to rollback its restrictive monetary policy stance in September, which it has been maintaining since March 2022.
The United States (US) Consumer Price Index (CPI) data for July, released on Wednesday, boosted the confidence of investors that the Fed will cut interest rates in September as it showed that price pressures are on track to return to the desired rate of 2%. Annual core CPI, which excludes volatile food and energy prices and is one of the most tracked inflation measures by Fed policymakers, rose expectedly by 3.2% against the prior release of 3.3%. In the same period, the headline CPI decelerated to 2.9%, from the estimates and the prior release of 3%.
As Fed rate cuts have taken the central stage, market sentiment has become favorable for risky assets. S&P 500 futures have posted decent gains in the European session. The US Dollar Index (DXY), which tracks the Greenback’s value against six major currencies, hovers above THE weekly low of 102.27.
Meanwhile, investors await the US Retail Sales data for July, which will be published at 12:30 GMT. The Retail Sales data, a key measure of consumer spending, is estimated to have grown by 0.3% after remaining flat in June.
On the Eurozone front, the Euro (EUR) remains broadly firm as investors expect that the European Central Bank (ECB) will extend the policy-easing cycle with a calibrated approach. ECB policymakers have been refraining from committing a pre-defined interest-rate cut path to avoid risks of reacceleration in price pressures.
US Dollar FAQs
The US Dollar (USD) is the official currency of the United States of America, and the ‘de facto’ currency of a significant number of other countries where it is found in circulation alongside local notes. It is the most heavily traded currency in the world, accounting for over 88% of all global foreign exchange turnover, or an average of $6.6 trillion in transactions per day, according to data from 2022. Following the second world war, the USD took over from the British Pound as the world’s reserve currency. For most of its history, the US Dollar was backed by Gold, until the Bretton Woods Agreement in 1971 when the Gold Standard went away.
The most important single factor impacting on the value of the US Dollar is monetary policy, which is shaped by the Federal Reserve (Fed). The Fed has two mandates: to achieve price stability (control inflation) and foster full employment. Its primary tool to achieve these two goals is by adjusting interest rates. When prices are rising too quickly and inflation is above the Fed’s 2% target, the Fed will raise rates, which helps the USD value. When inflation falls below 2% or the Unemployment Rate is too high, the Fed may lower interest rates, which weighs on the Greenback.
In extreme situations, the Federal Reserve can also print more Dollars and enact quantitative easing (QE). QE is the process by which the Fed substantially increases the flow of credit in a stuck financial system. It is a non-standard policy measure used when credit has dried up because banks will not lend to each other (out of the fear of counterparty default). It is a last resort when simply lowering interest rates is unlikely to achieve the necessary result. It was the Fed’s weapon of choice to combat the credit crunch that occurred during the Great Financial Crisis in 2008. It involves the Fed printing more Dollars and using them to buy US government bonds predominantly from financial institutions. QE usually leads to a weaker US Dollar.
Quantitative tightening (QT) is the reverse process whereby the Federal Reserve stops buying bonds from financial institutions and does not reinvest the principal from the bonds it holds maturing in new purchases. It is usually positive for the US Dollar.
The softer trend in inflation will be music to the ears of the Federal Reserve, ING’s FX strategist Chris Turner notes.
More data for the market to grind
“Core inflation is running at a 1.6% three-month annualised rate. Most of the components of this week's PPI and CPI releases point to an on-target 0.2% month-on-month release of the July core PCE inflation data on 30 August. Markets should now be expecting some dovish commentary coming through from the Fed. And of course, next week's Fed's Jackson Hole Economic Symposium presents an opportunity.”
“Attention squarely shifts to the speed of Fed rate cuts. Yesterday, the Reserve Bank of New Zealand sounded in a hurry to get the 5.50% policy rate down to the neutral 3.00% rate. It only cut by 25bp yesterday but had discussed a 50bp cut. True, New Zealand's economy (small, open) is very different from the US (large, closed), but the RBNZ does show an example that central banks can shift narratives pretty quickly.”
“Activity data will now determine whether the Fed cuts by 25bp or 50bp in September. The August jobs data on 6 September will have a major say here. In advance of that, today sees retail sales for July. The bounce back in auto sales is expected to support the headline number, but the market will focus on the retail sales control group. The market will also be paying close attention to the weekly initial claims.”
Room for the New Zealand Dollar (NZD) to decline to 0.5975 before stabilisation is likely. And, overall, it is likely to trade between 0.5935 and 0.6080 for the time being, UOB Group FX analysts Quek Ser Leang and Lee Sue Ann note.
NZD may fall towards 0.5975
24-HOUR VIEW: “Our view for NZD to strengthen further yesterday was incorrect, as it plunged to a low of 0.5995, closing sharply lower by 1.33% (0.5996). While oversold, there is room for NZD to decline to 0.5975 before stabilisation is likely. The next support at 0.5935 is not expected to come into view. On the upside, any recovery is likely to remain below 0.6040, with minor resistance at 0.6020.”
1-3 WEEKS VIEW: “We turned positive in NZD early this month (as annotated in the chart below). As we tracked the advance, in our update yesterday (14 Aug, spot at 0.6070), we expected further NZD strength, but we pointed out that there is a significant resistance level at 0.6120. NZD subsequently rose to 0.6084 and then sold off sharply to break below our ‘strong support’ level at 0.6005. The price action indicates that the NZD strength has come to an end. For the time being, NZD is likely to trade in a range, probably between 0.5935 and 0.6080.”
European gas futures declined for a third consecutive day as healthy inventories offset supply fears, ANZ analysts Brian Martin and Daniel Hynes note.
Geopolitical risks continue to hang over the market
“Europe is heading towards the heating season with ample inventories. Storage facilities are currently 88.24% full, well above normal seasonal levels. At the same time, industrial demand remains lacklustre and temperatures in northwest Europe have not been as hot as in the south, curbing cooling demand.”
“However, geopolitical risks continue to hang over the market. Ukraine said it has made inroads into Russian territory. With a key gas transit point nearby, risks of disruption to gas that still supplies a sizeable part of Europe’s needs remains high. North Asian LNG prices rose to a two-month high as summer heat maintains high demand.”
“Power demand from air conditioning in South Korea and neighbouring importers has been strong, resulting in increased activity from buyers from the region. Brazil has emerged as an aggressive buyer of LNG. Dry weather is impacting its hydropower generation, forcing the country to utilise more gas-fired power.”
- AUD/USD price may further appreciate as daily chart analysis indicates a bullish bias.
- The 50-day EMA at 0.6613 and the lower boundary around 0.6590 appear to be immediate support levels for the pair.
- A crossover of the 9-day EMA above the 50-day EMA could provide a buying opportunity.
The AUD/USD pair retraces its recent losses from the previous session, trading around 0.6620 during the European hours on Thursday. The daily chart analysis indicates that the AUD/USD pair is positioned within an ascending channel, which suggests a bullish bias.
Additionally, the 14-day Relative Strength Index (RSI) is positioned slightly above the 50 level, confirming the reinforcement of a bullish momentum.
In terms of support, the 50-day Exponential Moving Average (EMA) at 0.6613 level appears as an immediate support level for the AUD/USD pair, followed by the lower boundary of the ascending channel around the 0.6590 level, aligned with the nine-day EMA at 0.6587 level.
A breach below the ascending channel could signal a bearish bias, potentially leading the AUD/USD pair to test the throwback level at 0.6575. If the pair falls below this support level, it could strengthen the bearish outlook and drive it toward the next throwback level at 0.6470.
The daily chart analysis indicates that the 9-day EMA might cross above the 50-day EMA. This potential crossover would suggest that price momentum is outpacing the longer-term trend, which could signal an opportunity to buy the AUD/USD pair.
On the upside, the AUD/USD pair may approach the upper boundary of the ascending channel near the 0.6700 level. A breakout above this level could drive the pair towards its six-month high of 0.6798, achieved on July 11.
AUD/USD: Daily Chart
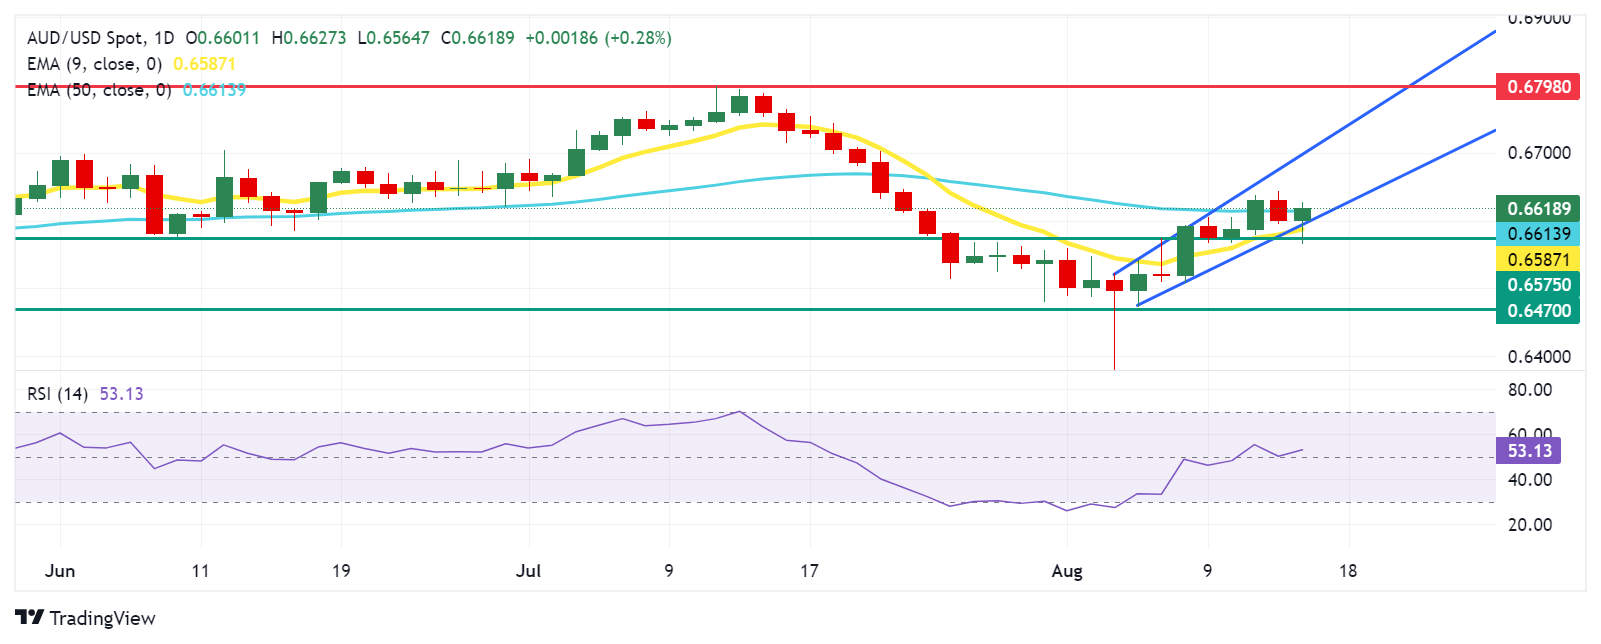
Australian Dollar PRICE Today
The table below shows the percentage change of Australian Dollar (AUD) against listed major currencies today. Australian Dollar was the strongest against the Swiss Franc.
| USD | EUR | GBP | JPY | CAD | AUD | NZD | CHF | |
|---|---|---|---|---|---|---|---|---|
| USD | 0.05% | -0.12% | -0.04% | -0.06% | -0.27% | 0.08% | 0.01% | |
| EUR | -0.05% | -0.18% | -0.11% | -0.10% | -0.41% | -0.14% | -0.04% | |
| GBP | 0.12% | 0.18% | 0.09% | 0.07% | -0.23% | 0.04% | 0.24% | |
| JPY | 0.04% | 0.11% | -0.09% | -0.03% | -0.26% | -0.03% | 0.14% | |
| CAD | 0.06% | 0.10% | -0.07% | 0.03% | -0.22% | -0.03% | 0.16% | |
| AUD | 0.27% | 0.41% | 0.23% | 0.26% | 0.22% | 0.26% | 0.45% | |
| NZD | -0.08% | 0.14% | -0.04% | 0.03% | 0.03% | -0.26% | 0.19% | |
| CHF | -0.01% | 0.04% | -0.24% | -0.14% | -0.16% | -0.45% | -0.19% |
The heat map shows percentage changes of major currencies against each other. The base currency is picked from the left column, while the quote currency is picked from the top row. For example, if you pick the Australian Dollar from the left column and move along the horizontal line to the US Dollar, the percentage change displayed in the box will represent AUD (base)/USD (quote).
The Australian Dollar (AUD) is unlikely to weaken much further; it is likely to trade in a 0.6580/0.6625 range. If AUD breaks below 0.6580, it would suggest that it is not ready to head higher to 0.6660, UOB Group FX analysts Quek Ser Leang and Lee Sue Ann note.
A test of 0.6625 is around the corner
24-HOUR VIEW: “While we expected AUD to strengthen yesterday, we indicated that ‘it remains to be seen if it can break above 0.6660.’ We also indicated that ‘support is at 0.6615, and a breach of 0.6600 would indicate that AUD is not strengthening further.’ AUD subsequently rose less than expected to 0.6643, pulling back sharply to a low of 0.6595. The sharp pullback seems a tad overdone, and AUD is unlikely to weaken much further. Today, we expect AUD to trade in a 0.6580/0.6625 range.”
1-3 WEEKS VIEW: “After AUD rose two days ago, we indicated yesterday (14 Aug, spot at 0.6630), that ‘upward momentum has increased further.’ We noted the next level to focus on is 0.6660. AUD subsequently rose to 0.6643 before staging a surprisingly sharp pullback. The buildup in momentum is beginning to ease. From here, if AUD breaks below 0.6580 (no change in ‘strong support’ level), it would suggest that it is not ready to head higher to 0.6660.”
- NZD/USD attracts some dip-buyers following the previous day’s post-RBNZ downfall.
- Dovish Fed expectations and a positive risk tone undermine the USD, lending support.
- Traders now look to the US macro data and Fed speak for short-term opportunities.
The NZD/USD pair stages a modest recovery after touching a fresh weekly low earlier this Thursday and retakes the 0.6000 psychological mark during the first half of the European session. Spot prices, for now, seem to have stalled the previous day's dovish Reserve Bank of New Zealand (RBNZ)-inspired retracement slide from the 0.6085 region, or a four-week peak, and draw support from subdued US Dollar (USD) price action.
The US Consumer Price Index (CPI) report released on Wednesday provided further evidence of cooling inflationary pressures and reaffirmed market bets for an imminent start of the Federal Reserve's (Fed) rate-cutting cycle. This, in turn, keeps the USD bulls on the defensive and lends some support to the NZD/USD pair amid a generally positive tone around the equity markets, which tends to underpin demand for the risk-sensitive Kiwi. That said, any meaningful appreciating move seems elusive in the wake of the RBNZ's dovish tilt.
The central bank cited the recent progress towards meeting the annual inflation target and weak domestic economic growth behind the surprise decision to cut the Official Cash Rate (OCR) for the first time since March 2020. The RBNZ also indicated more cuts over the coming months, which, along with concerns about an economic downturn in China, could undermine antipodean currencies, including the New Zealand Dollar (NZD). This, in turn, warrants some caution before placing fresh bullish bets around the NZD/USD pair.
Moving ahead, investors now look forward to the US economic docket – featuring the release of monthly Retail Sales figures, the usual Weekly Initial Jobless Claims, the Empire State Manufacturing Index and the Philly Fed Manufacturing Index. This, along with speeches by influential FOMC members, will play a key role in driving the USD demand and provide a fresh impetus to the NZD/USD pair later during the early North American session. Apart from this, the broader risk sentiment should contribute to producing short-term trading opportunities.
US Dollar PRICE Today
The table below shows the percentage change of US Dollar (USD) against listed major currencies today. US Dollar was the strongest against the New Zealand Dollar.
| USD | EUR | GBP | JPY | CAD | AUD | NZD | CHF | |
|---|---|---|---|---|---|---|---|---|
| USD | 0.06% | -0.13% | -0.01% | -0.05% | -0.26% | 0.11% | -0.00% | |
| EUR | -0.06% | -0.19% | -0.10% | -0.10% | -0.43% | -0.12% | -0.06% | |
| GBP | 0.13% | 0.19% | 0.13% | 0.09% | -0.21% | 0.08% | 0.23% | |
| JPY | 0.01% | 0.10% | -0.13% | -0.04% | -0.27% | -0.03% | 0.10% | |
| CAD | 0.05% | 0.10% | -0.09% | 0.04% | -0.22% | -0.01% | 0.13% | |
| AUD | 0.26% | 0.43% | 0.21% | 0.27% | 0.22% | 0.28% | 0.43% | |
| NZD | -0.11% | 0.12% | -0.08% | 0.03% | 0.01% | -0.28% | 0.15% | |
| CHF | 0.00% | 0.06% | -0.23% | -0.10% | -0.13% | -0.43% | -0.15% |
The heat map shows percentage changes of major currencies against each other. The base currency is picked from the left column, while the quote currency is picked from the top row. For example, if you pick the US Dollar from the left column and move along the horizontal line to the Japanese Yen, the percentage change displayed in the box will represent USD (base)/JPY (quote).
Crude oil erased this week’s gains after US inventories unexpectedly rose, ANZ analysts Brian Martin & Daniel Hynes note.
Oil prices go down due to a rise in US oil inventories
“The Energy Information Administration’s weekly inventory report showed stockpiles of crude oil rose 1.36mbbl last week, snapping a six-week streak of declines.”
“This was against the API’s estimate of a 5.2mbbl decline. Even so, gasoline and distillate inventories fell 2,894kbbl and 1,673kbbl respectively.”
“The drawdown in gasoline stockpiles helped push implied demand back above 9mb/d. Traders are on edge, as geopolitical tensions remain high.”
The Pound Sterling (GBP) is expected to trade sideways between 1.2780 and 1.2855. Instead of trading in a range, GBP is likely to rebound further, potentially to 1.2950, UOB Group FX analysts Quek Ser Leang and Lee Sue Ann note.
Bulls to test the 1.2855 resistance
24-HOUR VIEW: “Our expectation for GBP to break above 1.2900 did not turn out, as it traded between 1.2812 and 1.2868, closing lower by 0.27% (1.2827). The current price movements are likely part of a sideways trading phase. Today, GBP is expected to trade between 1.2780 and 1.2855.”
1-3 WEEKS VIEW: “We continue to hold the same view as yesterday (14 Aug, spot at 1.2865). As indicated, instead of trading in a range, GBP is likely to rebound further, potentially to 1.2950. However, note that there is another resistance level at 1.2900. Should GBP break below 1.2780 (no change in ‘strong support’ level), it would indicate that GBP is still trading in a range.”
- Gold price gains above $2,450 as traders widely anticipated the Fed will begin reducing interest rates from September.
- The US CPI data for July boosted confidence that price pressures will return to the desired rate of 2%.
- Investors await the US monthly Retail Sales data for July.
Gold price (XAU/USD) rises above $2,450 in Thursday’s European session. The precious metal gains ground as investors seem to be increasingly confident that the restrictive monetary policy stance by the Federal Reserve (Fed), maintained for more than two years, will start to be unwound in September.
The United States (US) Consumer Price Index (CPI) report for July, released on Wednesday, added to evidence that price growth is on track to return to the desired rate of 2%. Annual headline inflation decelerated to 2.9% from expectations and June’s reading of 3%. In the same period, the core CPI, which excludes volatile food and energy prices, grew by 3.2% as expected, down from the prior release of 3.3%.
Firm speculation for Fed interest-rate cuts in September has limited the upside for both the US Dollar (USD) and bond yields. The US Dollar Index (DXY), which tracks the Greenback’s value against six major currencies, exhibits a subdued performance and trades slightly above a seven-month low of 102.16. 10-year US Treasury yields move higher to near 3.84% but remain close to weekly lows.
Usually, lower yields on interest-bearing assets bode well for non-yielding assets such as Gold, given that they reduce the opportunity cost of holding an investment in them.
Daily digest market movers: Gold's next move could be driven by US Retail Sales
- Gold price climbs above $2,450 in Thursday’s European trading hours but struggles to break above all-time highs of $2,483.70. The upside in the Gold price appears to be limited as traders are scaling back bets that the Fed will reduce interest rates aggressively in September.
- According to the CME FedWatch tool, 30-day Federal Funds Futures pricing data shows that traders see a 37.5% chance that interest rates will be reduced by 50 basis points (bps) in September, down significantly from the 55% recorded a week ago.
- Though the CPI report showed that price pressures eased on year, month-on-month headline and core inflation rose by 0.2% as expected. The rise, which was driven mainly by higher rentals and prices of transportation services, dampened speculation for Fed big rate cuts ahead.
- However, Atlanta Fed Bank President Raphael Bostic appeared comfortable with a 50 bps interest-rate reduction if the labor market weakens further, he said in an interview with the Financial Times (FT) on Wednesday. Bostic added that he is open to interest rate cuts in September and warned that the Fed can't "afford to be late" to ease monetary policy, Reuters reported.
- Going forward, the next trigger for the FX domain will be the US monthly Retail Sales data for July, which will be published at 12:30 GMT. Retail Sales are expected to have grown by 0.3% after remaining flat in June.
Technical Forecast: Gold price oscillates inside channel formation
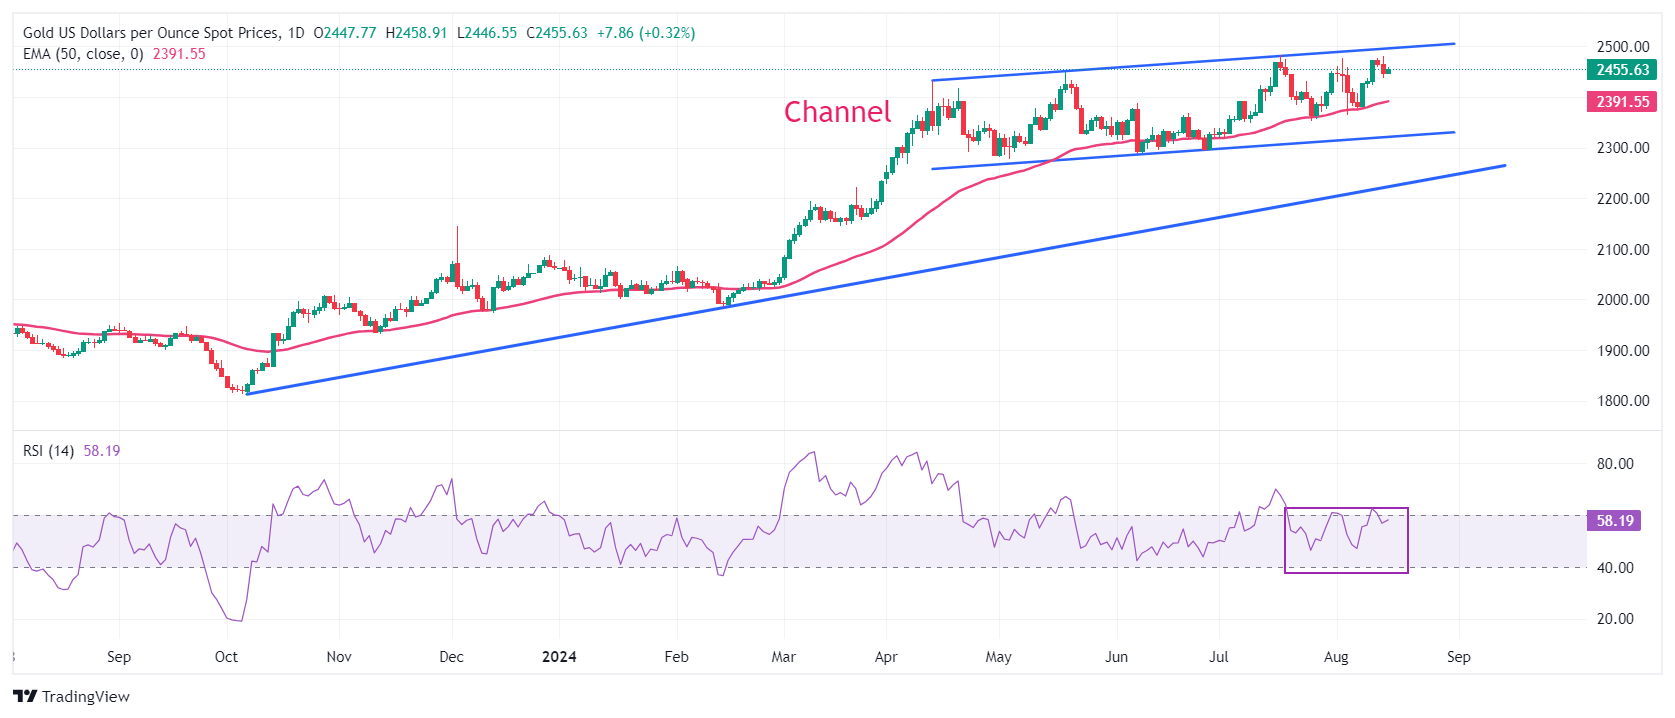
Gold price trades in a channel formation on a daily time frame, which is slightly rising but has been broadly moving sideways for more than three months. The 50-day Exponential Moving Average (EMA) near $2,390 continues to provide support to the Gold price bulls.
The 14-day Relative Strength Index (RSI) oscillates inside the 40.00-60.00 range, suggesting indecisiveness among market participants.
A fresh upside move would appear if the Gold price breaks above its all-time high of $2,483.75, sending it into unchartered territory.
On the downside, the upward-sloping trendline at $2,225, plotted from the October 6, 2023, low near $1,810.50, will be a major support in the longer term.
Gold FAQs
Gold has played a key role in human’s history as it has been widely used as a store of value and medium of exchange. Currently, apart from its shine and usage for jewelry, the precious metal is widely seen as a safe-haven asset, meaning that it is considered a good investment during turbulent times. Gold is also widely seen as a hedge against inflation and against depreciating currencies as it doesn’t rely on any specific issuer or government.
Central banks are the biggest Gold holders. In their aim to support their currencies in turbulent times, central banks tend to diversify their reserves and buy Gold to improve the perceived strength of the economy and the currency. High Gold reserves can be a source of trust for a country’s solvency. Central banks added 1,136 tonnes of Gold worth around $70 billion to their reserves in 2022, according to data from the World Gold Council. This is the highest yearly purchase since records began. Central banks from emerging economies such as China, India and Turkey are quickly increasing their Gold reserves.
Gold has an inverse correlation with the US Dollar and US Treasuries, which are both major reserve and safe-haven assets. When the Dollar depreciates, Gold tends to rise, enabling investors and central banks to diversify their assets in turbulent times. Gold is also inversely correlated with risk assets. A rally in the stock market tends to weaken Gold price, while sell-offs in riskier markets tend to favor the precious metal.
The price can move due to a wide range of factors. Geopolitical instability or fears of a deep recession can quickly make Gold price escalate due to its safe-haven status. As a yield-less asset, Gold tends to rise with lower interest rates, while higher cost of money usually weighs down on the yellow metal. Still, most moves depend on how the US Dollar (USD) behaves as the asset is priced in dollars (XAU/USD). A strong Dollar tends to keep the price of Gold controlled, whereas a weaker Dollar is likely to push Gold prices up.
The Euro (EUR) is likely to trade in a sideways range of 1.0985/1.1045. Upward momentum has been rejuvenated. The next level to watch is 1.1070, UOB Group FX analysts Quek Ser Leang and Lee Sue Ann note.
The closest support is at 1.1000
24-HOUR VIEW: “We highlighted yesterday that EUR ‘could move higher and break above last week’s high near 1.1010.’ We also highlighted that ‘the next resistance at 1.1050 is likely out of reach.’ Our view was correct, as EUR rose to 1.1047, pulling back to close at 1.1012 (+0.18%). The pullback in overbought conditions suggests EUR is unlikely to rise further. Today, EUR is more likely to trade in a sideways range of 1.0985/1.1045.”
1-3 WEEKS VIEW: “After EUR soared two days ago, we indicated yesterday (14 Aug, spot at 1.0990) that ‘upward momentum has been rejuvenated.’ We added, ‘the outlook for EUR is still positive and the next level to watch is 1.1070.’ EUR subsequently rose to 1.1047, closing at its highest level this year (1.1012, +0.18%). There is no change in our view. Overall, only a breach of 1.0955 (‘strong support’ was at 1.0925 yesterday) would mean that the EUR strength that started early last week has come to an end. Looking ahead, the next resistance above 1.1070 is at 1.1100.”
- USD/MXN continues to lose ground due to the dovish mood surrounding the Fed.
- The downside of the US Dollar is retrained due to improved Treasury yields.
- The Mexican Peso may struggle as traders expect Banxico to adopt a dovish stance regarding its policy outlook.
USD/MXN extends its losses from the previous session, trading around 18.80 during Thursday’s European hours. This decline of the USD/MXN could be attributed to the increasing expectations of at least a 25 basis point rate cut by the US Federal Reserve (Fed) in September.
The US Dollar (USD) remains tepid ahead of the release of US Initial Jobless Claims and Retail Sales data scheduled for Thursday. The US Dollar Index (DXY), which measures the value of the US Dollar (USD) against other six major peers, received support from the improved Treasury yields. The DXY trades around 102.60 with 2-year and 10-year yields on US Treasury bonds standing at 3.95% and 3.82%, respectively, at the time of writing.
The moderate increase in the annual US Consumer Price Index (CPI) has sparked debate about the extent of the Fed’s potential rate cut in September. Traders are favoring a more modest 25 basis point reduction, with a 60% probability, while a 50 basis point cut is still on the table. According to CME FedWatch, there is a 36% chance of the larger cut occurring in September.
In Mexico, last week’s data showed that the INEGI Consumer Confidence index fell to 46.9 in July, down from 47.5 in June, which has contributed to a dovish outlook from the Bank of Mexico (Banxico). Additionally, Banxico Governor Victoria Rodríguez Ceja endorsed the recent interest rate cut to 10.75%. Although headline inflation is at 5.57%, she defended the rate reduction by highlighting the decline in core prices over the past 18 months.
Traders are expected to closely monitor the Retail Sales data for June, which will be released on Tuesday. Later in the week, attention will turn to the first-half-month Inflation data and the Banxico Monetary Policy Meeting Minutes, both scheduled for release on Thursday.
Mexican Peso FAQs
The Mexican Peso (MXN) is the most traded currency among its Latin American peers. Its value is broadly determined by the performance of the Mexican economy, the country’s central bank’s policy, the amount of foreign investment in the country and even the levels of remittances sent by Mexicans who live abroad, particularly in the United States. Geopolitical trends can also move MXN: for example, the process of nearshoring – or the decision by some firms to relocate manufacturing capacity and supply chains closer to their home countries – is also seen as a catalyst for the Mexican currency as the country is considered a key manufacturing hub in the American continent. Another catalyst for MXN is Oil prices as Mexico is a key exporter of the commodity.
The main objective of Mexico’s central bank, also known as Banxico, is to maintain inflation at low and stable levels (at or close to its target of 3%, the midpoint in a tolerance band of between 2% and 4%). To this end, the bank sets an appropriate level of interest rates. When inflation is too high, Banxico will attempt to tame it by raising interest rates, making it more expensive for households and businesses to borrow money, thus cooling demand and the overall economy. Higher interest rates are generally positive for the Mexican Peso (MXN) as they lead to higher yields, making the country a more attractive place for investors. On the contrary, lower interest rates tend to weaken MXN.
Macroeconomic data releases are key to assess the state of the economy and can have an impact on the Mexican Peso (MXN) valuation. A strong Mexican economy, based on high economic growth, low unemployment and high confidence is good for MXN. Not only does it attract more foreign investment but it may encourage the Bank of Mexico (Banxico) to increase interest rates, particularly if this strength comes together with elevated inflation. However, if economic data is weak, MXN is likely to depreciate.
As an emerging-market currency, the Mexican Peso (MXN) tends to strive during risk-on periods, or when investors perceive that broader market risks are low and thus are eager to engage with investments that carry a higher risk. Conversely, MXN tends to weaken at times of market turbulence or economic uncertainty as investors tend to sell higher-risk assets and flee to the more-stable safe havens.
- USD/CAD struggles to capitalize on the previous day’s modest bounce from a multi-week low.
- Dovish Fed expectations and a positive risk tone weigh on the USD, capping gains for the pair.
- An uptick in Crude Oil prices underpins the Loonie and contributes to the modest downtick.
The USD/CAD pair struggles to capitalize on the previous day's late bounce from a four-week low and attracts some intraday sellers near the 1.3725 region on Thursday. Spot prices, however, manage to defend the 1.3700 mark through the early part of the European session as traders now look to the US macro data for a fresh impetus.
The US monthly Retail Sales, along with the usual Weekly Initial Jobless Claims, followed by the Empire State Manufacturing Index and the Philly Fed Manufacturing Index will be published later during the early North American session. This, along with speeches by influential FOM members, will play a key role in driving demand for the US Dollar (USD) and produce short-term trading opportunities around the USD/CAD pair.
In the meantime, expectations for an imminent start of the Federal Reserve's (Fed) rate-cutting cycle, bolstered by signs of cooling inflationary pressures, keep the USD bulls on the defensive. Furthermore, a generally positive tone around the equity markets further undermines the safe-haven buck. Apart from this, an uptick in Crude Oil prices lends support to the commodity-linked Loonie and exerts some pressure on the USD/CAD pair.
Against the backdrop of worries about a wider Middle East conflict, hopes that rate cuts in the US will boost economic activity, and fuel consumption act as a tailwind for the black liquid. That said, concerns about slower global demand might curb gains for the commodity. Apart from this, bets for another 25-bps rate cut by the Bank of Canada (BoC) in September might cap the Canadian Dollar (CAD) and limit losses for the USD/CAD pair.
From a technical perspective, this week's breakdown through the 50-day Simple Moving Average (SMA) suggests that the path of least resistance for spot prices is to the downside. Sustained weakness and acceptance below the 1.3700 mark will reaffirm the negative bias, which should pave the way for an extension of the USD/CAD pair's sharp pullback from the 1.3945 area, or the highest level since October 2022 touched earlier this month.
Canadian Dollar FAQs
The key factors driving the Canadian Dollar (CAD) are the level of interest rates set by the Bank of Canada (BoC), the price of Oil, Canada’s largest export, the health of its economy, inflation and the Trade Balance, which is the difference between the value of Canada’s exports versus its imports. Other factors include market sentiment – whether investors are taking on more risky assets (risk-on) or seeking safe-havens (risk-off) – with risk-on being CAD-positive. As its largest trading partner, the health of the US economy is also a key factor influencing the Canadian Dollar.
The Bank of Canada (BoC) has a significant influence on the Canadian Dollar by setting the level of interest rates that banks can lend to one another. This influences the level of interest rates for everyone. The main goal of the BoC is to maintain inflation at 1-3% by adjusting interest rates up or down. Relatively higher interest rates tend to be positive for the CAD. The Bank of Canada can also use quantitative easing and tightening to influence credit conditions, with the former CAD-negative and the latter CAD-positive.
The price of Oil is a key factor impacting the value of the Canadian Dollar. Petroleum is Canada’s biggest export, so Oil price tends to have an immediate impact on the CAD value. Generally, if Oil price rises CAD also goes up, as aggregate demand for the currency increases. The opposite is the case if the price of Oil falls. Higher Oil prices also tend to result in a greater likelihood of a positive Trade Balance, which is also supportive of the CAD.
While inflation had always traditionally been thought of as a negative factor for a currency since it lowers the value of money, the opposite has actually been the case in modern times with the relaxation of cross-border capital controls. Higher inflation tends to lead central banks to put up interest rates which attracts more capital inflows from global investors seeking a lucrative place to keep their money. This increases demand for the local currency, which in Canada’s case is the Canadian Dollar.
Macroeconomic data releases gauge the health of the economy and can have an impact on the Canadian Dollar. Indicators such as GDP, Manufacturing and Services PMIs, employment, and consumer sentiment surveys can all influence the direction of the CAD. A strong economy is good for the Canadian Dollar. Not only does it attract more foreign investment but it may encourage the Bank of Canada to put up interest rates, leading to a stronger currency. If economic data is weak, however, the CAD is likely to fall.
- GBP/JPY extends its winning streak after the economic data release from the United Kingdom.
- The UK Gross Domestic Product expanded by 0.6% QoQ in Q2, as expected, against 0.7% growth in Q1.
- The upside of the pair could be restrained as the JPY receives support from a hawkish mood surrounding the BoJ.
GBP/JPY continues to gain ground for the fourth consecutive session, trading around 189.30 during the early European hours on Thursday. The upside of the GBP/JPY cross could be attributed to positive key economic data, including Gross Domestic Product (GDP) data, from the United Kingdom (UK).
The British economy expanded 0.6% quarter-on-quarter in the second quarter, as expected. There was a 0.7% growth in the first quarter. Meanwhile, the GDP rose 0.9% YoY in Q2 vs. 0.9% expected and 0.3% booked in Q1. The GDP posted a 0% MoM in June, as expected, against a 0.4% increase reported in May.
On the production side, UK Industrial Production grew by 0.8% month-over-month in June, comfortably surpassing market forecasts of a 0.1% increase and accelerating from the 0.3% gain recorded in the previous month. Meanwhile, Manufacturing Production rose 1.1% MoM, surpassing the expected 0.1% increase. This marked the strongest expansion since February.
Finance Minister Rachel Reeves has set a formal target for Britain to achieve the fastest per capita growth in GDP among the Group of Seven (G7) advanced economies for two consecutive years. However, Thursday's figures showed that output per head in the second quarter was 0.1% lower than a year earlier and 0.8% below pre-pandemic levels.
Minister Reeves highlighted that the latest data underscores the challenges facing the new government and reiterated her stance that difficult decisions will be necessary to improve economic fundamentals, according to Reuters.
The upside of the GBP/JPY cross could be restrained as the Japanese Yen (JPY) receives support as Japan’s GDP growth surpassed expectations in the second quarter. This supports the argument for a potential near-term interest rate hike by the Bank of Japan (BoJ).
Japanese Economy Minister Yoshitaka Shindo stated that the economy is expected to recover gradually as wages and income improve. He also mentioned that the government will work closely with the Bank of Japan to implement flexible macroeconomic policies.
GDP FAQs
A country’s Gross Domestic Product (GDP) measures the rate of growth of its economy over a given period of time, usually a quarter. The most reliable figures are those that compare GDP to the previous quarter e.g Q2 of 2023 vs Q1 of 2023, or to the same period in the previous year, e.g Q2 of 2023 vs Q2 of 2022. Annualized quarterly GDP figures extrapolate the growth rate of the quarter as if it were constant for the rest of the year. These can be misleading, however, if temporary shocks impact growth in one quarter but are unlikely to last all year – such as happened in the first quarter of 2020 at the outbreak of the covid pandemic, when growth plummeted.
A higher GDP result is generally positive for a nation’s currency as it reflects a growing economy, which is more likely to produce goods and services that can be exported, as well as attracting higher foreign investment. By the same token, when GDP falls it is usually negative for the currency. When an economy grows people tend to spend more, which leads to inflation. The country’s central bank then has to put up interest rates to combat the inflation with the side effect of attracting more capital inflows from global investors, thus helping the local currency appreciate.
When an economy grows and GDP is rising, people tend to spend more which leads to inflation. The country’s central bank then has to put up interest rates to combat the inflation. Higher interest rates are negative for Gold because they increase the opportunity-cost of holding Gold versus placing the money in a cash deposit account. Therefore, a higher GDP growth rate is usually a bearish factor for Gold price.
Here is what you need to know on Thursday, August 15:
The US Dollar (USD) consolidates its weekly losses against its major rivals early Thursday. In the second half of the day, the US economic docket will feature weekly Initial Jobless Claims data, Retail Sales and Industrial Production figures for July. Manufacturing surveys from regional Federal Reserve (Fed) banks and comments from Fed policymakers will also be watched closely by market participants.
The USD failed to attract buyers on Wednesday after the data published by the US Bureau of Labor Statistics showed that the Consumer Price Index (CPI) and the core CPI both rose 0.2% on a monthly basis in July, as expected. The USD Index closed the fourth consecutive trading day in the red on Wednesday and the benchmark 10-year US Treasury bond yield declined toward 3.8%. Early Thursday, the USD Index holds steady at around 102.50 and the 10-year yield moves sideways slightly above 3.8%. Meanwhile, US stock index futures trade marginally higher after Wall Street's main indexes registered modest gains.
US Dollar PRICE This week
The table below shows the percentage change of US Dollar (USD) against listed major currencies this week. US Dollar was the weakest against the Euro.
| USD | EUR | GBP | JPY | CAD | AUD | NZD | CHF | |
|---|---|---|---|---|---|---|---|---|
| USD | -0.88% | -0.73% | 0.43% | -0.23% | -0.69% | -0.06% | 0.06% | |
| EUR | 0.88% | 0.18% | 1.30% | 0.66% | 0.08% | 0.83% | 0.97% | |
| GBP | 0.73% | -0.18% | 1.36% | 0.48% | -0.11% | 0.64% | 0.79% | |
| JPY | -0.43% | -1.30% | -1.36% | -0.63% | -1.18% | -0.48% | -0.38% | |
| CAD | 0.23% | -0.66% | -0.48% | 0.63% | -0.52% | 0.17% | 0.32% | |
| AUD | 0.69% | -0.08% | 0.11% | 1.18% | 0.52% | 0.75% | 0.89% | |
| NZD | 0.06% | -0.83% | -0.64% | 0.48% | -0.17% | -0.75% | 0.14% | |
| CHF | -0.06% | -0.97% | -0.79% | 0.38% | -0.32% | -0.89% | -0.14% |
The heat map shows percentage changes of major currencies against each other. The base currency is picked from the left column, while the quote currency is picked from the top row. For example, if you pick the US Dollar from the left column and move along the horizontal line to the Japanese Yen, the percentage change displayed in the box will represent USD (base)/JPY (quote).
The UK's Office for National Statistics reported in the European morning that the UK's Gross Domestic Product (GDP) expanded at an annual rate of 0.9% in the second quarter. This reading followed the 0.3% growth recorded in the first quarter and came in line with the market expectation. Other data from the UK showed that Manufacturing Production and Industrial Production increased by 1.1% and 0.8%, respectively, on a monthly basis in June. GBP/USD edged higher following these data and was last seen trading at around 1.2850.
During the Asian trading hours, the data from Australia showed that the Unemployment Rate ticked up to 4.2% in July from 4.1% in June. Employment Change in the same period came in at +58.2K, surpassing the market expectation of 20K. After closing in negative territory on Wednesday, AUD/USD gained traction and climbed above 0.6600. In the meantime, the National Bureau of Statistics of China announced that Retail Sales grew by 2.7% on a yearly basis in July, up from the 2% increase recorded in June.
Japan’s Cabinet Office reported in the early Asian session that the GDP grew at an annual rate of 3.1% in the second quarter following the 2.3% contraction recorded in the previous quarter. USD/JPY failed to make a decisive move in either direction after this data and was last seen moving sideways in its weekly range slightly above 147.00.
EUR/USD gathered bullish momentum and reached its highest level of 2024 near 1.1050 on Wednesday. The pair stages a technical correction in the European morning on Thursday but manages to hold above 1.1000.
Gold struggled to attract buyers on Wednesday and lost more than 0.5% on the day. XAU/USD holds its ground in the European session and trades in positive territory above $2,450.
GDP FAQs
A country’s Gross Domestic Product (GDP) measures the rate of growth of its economy over a given period of time, usually a quarter. The most reliable figures are those that compare GDP to the previous quarter e.g Q2 of 2023 vs Q1 of 2023, or to the same period in the previous year, e.g Q2 of 2023 vs Q2 of 2022. Annualized quarterly GDP figures extrapolate the growth rate of the quarter as if it were constant for the rest of the year. These can be misleading, however, if temporary shocks impact growth in one quarter but are unlikely to last all year – such as happened in the first quarter of 2020 at the outbreak of the covid pandemic, when growth plummeted.
A higher GDP result is generally positive for a nation’s currency as it reflects a growing economy, which is more likely to produce goods and services that can be exported, as well as attracting higher foreign investment. By the same token, when GDP falls it is usually negative for the currency. When an economy grows people tend to spend more, which leads to inflation. The country’s central bank then has to put up interest rates to combat the inflation with the side effect of attracting more capital inflows from global investors, thus helping the local currency appreciate.
When an economy grows and GDP is rising, people tend to spend more which leads to inflation. The country’s central bank then has to put up interest rates to combat the inflation. Higher interest rates are negative for Gold because they increase the opportunity-cost of holding Gold versus placing the money in a cash deposit account. Therefore, a higher GDP growth rate is usually a bearish factor for Gold price.
- USD/CHF trades flat around 0.8655 in Thursday’s early European session.
- The US CPI inflation eased to 2.9% in July, the smallest increase since March 2021.
- The rising Middle East geopolitical tensions might boost the safe-haven flows, benefiting the CHF.
The USD/CHF pair trades on a flat note near 0.8655 during the early European session on Thursday. Traders might prefer to wait on the sidelines ahead of the top-tier US economic data on Thursday. Meanwhile, the USD Index (DXY), a measure of the value of the US Dollar relative to a basket of foreign currencies, currently trades around 102.55, losing 0.05% on the day.
The US Consumer Price Index (CPI) inflation report indicated that price pressures are on track to return to the Federal Reserve (Fed) 2% target. However, the expectation of a deeper rate cut from the Fed has eased. According to the CME FedWatch Tool, financial markets are now pricing in nearly 41% odds of a 50 basis points (bps) rate cut by the Fed in September, down from 50% prior to the release of US CPI data.
Atlanta Fed President Raphael Bostic said on Tuesday he wanted to see more evidence before supporting lower interest rates. Meanwhile, Chicago Fed President Austan Goolsbee noted on Wednesday that he becomes more worried about the labor market than inflation due to the recent progress on price pressures and weak employment data.
Investors will keep an eye on the US Retail Sales and weekly Initial Jobless Claims on Thursday for fresh impetus. The Retail Sales are expected to rise 0.3% MoM in July, while the Initial Jobless Claims for the week ending August 10 are estimated to rise by 235K, compared to 233K in the previous week. Also, the Fed’s Alberto Musalem and Patrick Harker are set to speak later in the day.
On the Swiss front, the escalating geopolitical tensions in the Middle East could boost the safe-haven currency like the Swiss Franc (CHF) and create a headwind for USD/CHF. The local news agency Aljazeera reported that Israeli military aircraft struck Hamad City as artillery blasted residential buildings in Khan Younis in the southern Gaza Strip after dozens were killed in attacks across the Palestinian territory on Wednesday. The development surrounding geopolitical risks will be in focus by market players and it might influence the pair for the time being.
Swiss Franc FAQs
The Swiss Franc (CHF) is Switzerland’s official currency. It is among the top ten most traded currencies globally, reaching volumes that well exceed the size of the Swiss economy. Its value is determined by the broad market sentiment, the country’s economic health or action taken by the Swiss National Bank (SNB), among other factors. Between 2011 and 2015, the Swiss Franc was pegged to the Euro (EUR). The peg was abruptly removed, resulting in a more than 20% increase in the Franc’s value, causing a turmoil in markets. Even though the peg isn’t in force anymore, CHF fortunes tend to be highly correlated with the Euro ones due to the high dependency of the Swiss economy on the neighboring Eurozone.
The Swiss Franc (CHF) is considered a safe-haven asset, or a currency that investors tend to buy in times of market stress. This is due to the perceived status of Switzerland in the world: a stable economy, a strong export sector, big central bank reserves or a longstanding political stance towards neutrality in global conflicts make the country’s currency a good choice for investors fleeing from risks. Turbulent times are likely to strengthen CHF value against other currencies that are seen as more risky to invest in.
The Swiss National Bank (SNB) meets four times a year – once every quarter, less than other major central banks – to decide on monetary policy. The bank aims for an annual inflation rate of less than 2%. When inflation is above target or forecasted to be above target in the foreseeable future, the bank will attempt to tame price growth by raising its policy rate. Higher interest rates are generally positive for the Swiss Franc (CHF) as they lead to higher yields, making the country a more attractive place for investors. On the contrary, lower interest rates tend to weaken CHF.
Macroeconomic data releases in Switzerland are key to assessing the state of the economy and can impact the Swiss Franc’s (CHF) valuation. The Swiss economy is broadly stable, but any sudden change in economic growth, inflation, current account or the central bank’s currency reserves have the potential to trigger moves in CHF. Generally, high economic growth, low unemployment and high confidence are good for CHF. Conversely, if economic data points to weakening momentum, CHF is likely to depreciate.
As a small and open economy, Switzerland is heavily dependent on the health of the neighboring Eurozone economies. The broader European Union is Switzerland’s main economic partner and a key political ally, so macroeconomic and monetary policy stability in the Eurozone is essential for Switzerland and, thus, for the Swiss Franc (CHF). With such dependency, some models suggest that the correlation between the fortunes of the Euro (EUR) and the CHF is more than 90%, or close to perfect.
- The Pound Sterling moves higher as the UK's GDP growth for the second quarter was in line with estimates.
- Easing UK service inflation has resulted in a big relief for BoE policymakers.
- A moderate increase in US inflation has set the stage for a Fed rate cut in September.
The Pound Sterling (GBP) exhibits a strong performance against its major peers, except the Australian Dollar (AUD), in Thursday’s London session. The British currency gains further as the United Kingdom (UK) Office for National Statistics (ONS) has reported that the economy expanded in line with expectations in the second quarter of this year.
The flash Gross Domestic Product (GDP) report showed that the UK economy grew by 0.6% and 0.9% on a quarterly and an annual basis, respectively. The pace at which the economy grew in the second quarter was somewhat slower than the growth rate recorded in the January-March period, but still robust. The UK economy flatlined in June compared with the previous month, as expected.
A decent growth rate and ebbing price pressures are a big relief for Bank of England (BoE) policymakers, who were worried that maintaining higher interest rates for a longer period due to stubborn inflation could escalate the burden on households and the broad economy.
On Wednesday, the Consumer Price Index (CPI) report for July showed that the core CPI – which excludes volatile items such as food, energy, alcohol and tobacco – decelerated at a faster-than-expected pace to 3.3% from the estimates of 3.4% and June’s figure of 3.5%. This decline in the core inflation was driven a sharp drop in price pressures in the service sector as wage growth slowed.
This fall in inflation has prompted expectations of a sequential interest-rate cut by the BoE in September. Markets priced in a 44% chance of a quarter-point BoE rate cut, up from the 36% registered before the data was released, Reuters reported.
Apart from the monthly and Q2 GDP, the ONS has also reported factory data for June. The report showed that monthly Industrial and Manufacturing Production grew at a robust pace of 1.1% and 0.8%, respectively, while investors forecasted only marginal growth. On year, Industrial and Manufacturing Production contracted at a slower pace of 1.4% and 1.5%, respectively.
Daily digest market movers: Pound Sterling outperforms major peers
- The Pound Sterling strengthens against the US Dollar (USD) in Thursday’s European trading hours. The GBP/USD pair capitalizes on US Dollar’s subdued performance as Federal Reserve (Fed) interest-rate cuts in September take center stage after the United States (US) CPI report for July showed that price pressures are on track to return to the desired rate of 2%.
- The US Dollar Index (DXY), which tracks the Greenback’s value against six major currencies, pulls back slightly after posting a fresh weekly low at 102.20. The CPI report on Wednesday showed that inflationary pressures grew moderately, as expected. This has boosted confidence that the Fed will deliver a dovish decision and go for its first interest-rate cut in more than four years. However, traders remain split over the size at which borrowing rates will be reduced.
- The confidence over the Fed reducing interest rates in September was further boosted by dovish interest rate guidance from Atlanta Fed Bank President Raphael Bostic after the release of the inflation data. Bostic told in an interview with the Financial Times (FT) that he is comfortable with rate cuts in September. When asked about the rate-cut size, Bostic said that he is open for half a point if the labor market deteriorates further.
- In Thursday’s session, investors will focus on the US monthly Retail Sales data for July, which will be published at 12:30 GMT. Economists have estimated that sales at retail stores rose by 0.3% after remaining flat in June. The Retail Sales data, a key measure of consumer spending, will be keenly watched by investors as it will provide fresh cues on the inflation outlook and the state of the US economy.
Technical Analysis: Pound Sterling aims to revisit a two-week high of 1.2870
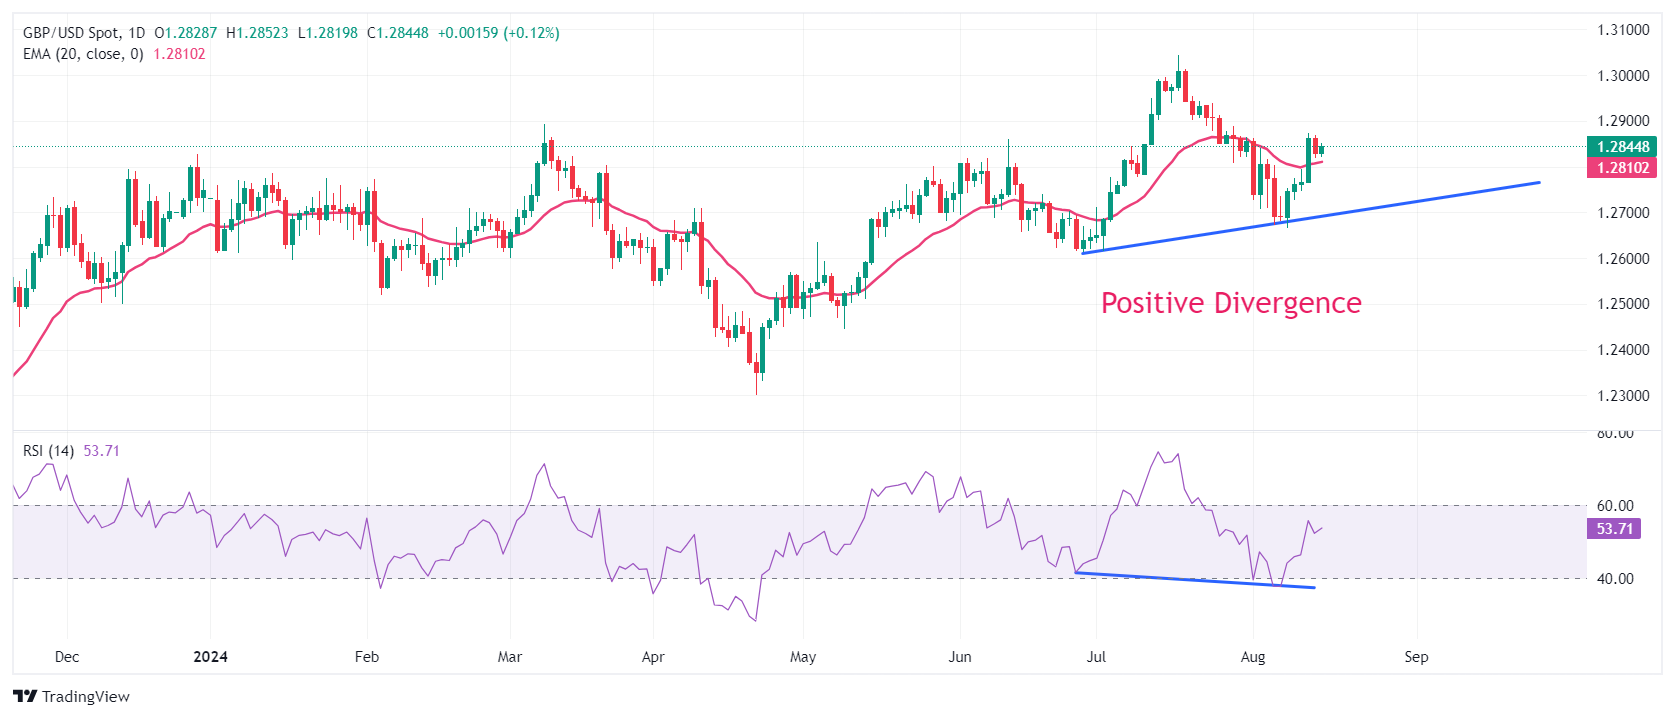
The Pound Sterling moves higher to recapture a two-week high of 1.2870 against the US Dollar. The near-term appeal of the GBP/USD pair is still firm as it holds the 20-day Exponential Moving Average (EMA), which trades around 1.2800.
Earlier, the Cable showed a sharp recovery from a six-week low of 1.2665 after a positive divergence formation on a daily time frame, in which the pair continues to post higher lows while the momentum oscillator makes lower lows. This generally results in a resumption of the uptrend, but it should be confirmed with more indicators.
The 14-day Relative Strength Index (RSI) recovers after finding a cushion near 40.00, exhibiting signs of buying interest at lower levels.
On the upside, the round-level resistance of 1.2900 and the psychological figure of 1.3000 will act as major resistances for the Pound Sterling. Alternatively, the recovery move could falter if the asset breaks below the August 8 low at 1.2665. This would expose the asset to the June 27 low at 1.2613, followed by the April 29 high at 1.2570.
Pound Sterling FAQs
The Pound Sterling (GBP) is the oldest currency in the world (886 AD) and the official currency of the United Kingdom. It is the fourth most traded unit for foreign exchange (FX) in the world, accounting for 12% of all transactions, averaging $630 billion a day, according to 2022 data. Its key trading pairs are GBP/USD, aka ‘Cable’, which accounts for 11% of FX, GBP/JPY, or the ‘Dragon’ as it is known by traders (3%), and EUR/GBP (2%). The Pound Sterling is issued by the Bank of England (BoE).
The single most important factor influencing the value of the Pound Sterling is monetary policy decided by the Bank of England. The BoE bases its decisions on whether it has achieved its primary goal of “price stability” – a steady inflation rate of around 2%. Its primary tool for achieving this is the adjustment of interest rates. When inflation is too high, the BoE will try to rein it in by raising interest rates, making it more expensive for people and businesses to access credit. This is generally positive for GBP, as higher interest rates make the UK a more attractive place for global investors to park their money. When inflation falls too low it is a sign economic growth is slowing. In this scenario, the BoE will consider lowering interest rates to cheapen credit so businesses will borrow more to invest in growth-generating projects.
Data releases gauge the health of the economy and can impact the value of the Pound Sterling. Indicators such as GDP, Manufacturing and Services PMIs, and employment can all influence the direction of the GBP. A strong economy is good for Sterling. Not only does it attract more foreign investment but it may encourage the BoE to put up interest rates, which will directly strengthen GBP. Otherwise, if economic data is weak, the Pound Sterling is likely to fall.
Another significant data release for the Pound Sterling is the Trade Balance. This indicator measures the difference between what a country earns from its exports and what it spends on imports over a given period. If a country produces highly sought-after exports, its currency will benefit purely from the extra demand created from foreign buyers seeking to purchase these goods. Therefore, a positive net Trade Balance strengthens a currency and vice versa for a negative balance.
- EUR/GBP edges lower to around 0.8565 in Thursday’s early European session.
- UK preliminary GDP expanded 0.6% QoQ in Q2 vs. 0.6% expected.
- The ECB is anticipated to cut more through the end of next year.
The EUR/GBP cross weakens near 0.8565 on Thursday during the early European session on Thursday. The UK GDP growth figures were in line with the consensus, which has boosted the Pound Sterling (GBP) against the Euro (EUR). The attention will shift to the UK Retail Sales report on Friday, which is projected to increase by 0.5% MoM in July.
The UK economy grew as expected in the second quarter of the year, National Statistics (ONS) showed Thursday. The country’s GDP grew by 0.6% QoQ in Q2, compared to 0.7% growth in the previous reading. The market consensus was at 0.6%. Furthermore, UK GDP expanded at an annual pace of 0.9% YoY in Q2 from a 0.3% expansion in Q1, matching the estimation of 0.9% growth. In response to the upbeat data, the Pound Sterling (GBP) attracts some buyers and creates a headwind for the EUR/GBP cross.
On the Euro front, the European Central Bank (ECB) is expected to cut its deposit rate again through the end of next year. A Bloomberg survey showed that the benchmark would hit 2.25% in December 2025 following six consecutive quarter-point reductions.
The second estimate for the quarterly Eurozone Gross Domestic Product (GDP) growth rate for the second quarter (Q2) came in at 0.3%. The figure was the same as the previous quarter and in line with forecasts, Eurostat reported on Wednesday. The Eurozone Industrial Production was worse than expectations, arriving at -0.1% MoM in June versus -0.9 prior, but below the 0.5% estimated.
GDP FAQs
A country’s Gross Domestic Product (GDP) measures the rate of growth of its economy over a given period of time, usually a quarter. The most reliable figures are those that compare GDP to the previous quarter e.g Q2 of 2023 vs Q1 of 2023, or to the same period in the previous year, e.g Q2 of 2023 vs Q2 of 2022. Annualized quarterly GDP figures extrapolate the growth rate of the quarter as if it were constant for the rest of the year. These can be misleading, however, if temporary shocks impact growth in one quarter but are unlikely to last all year – such as happened in the first quarter of 2020 at the outbreak of the covid pandemic, when growth plummeted.
A higher GDP result is generally positive for a nation’s currency as it reflects a growing economy, which is more likely to produce goods and services that can be exported, as well as attracting higher foreign investment. By the same token, when GDP falls it is usually negative for the currency. When an economy grows people tend to spend more, which leads to inflation. The country’s central bank then has to put up interest rates to combat the inflation with the side effect of attracting more capital inflows from global investors, thus helping the local currency appreciate.
When an economy grows and GDP is rising, people tend to spend more which leads to inflation. The country’s central bank then has to put up interest rates to combat the inflation. Higher interest rates are negative for Gold because they increase the opportunity-cost of holding Gold versus placing the money in a cash deposit account. Therefore, a higher GDP growth rate is usually a bearish factor for Gold price.
- Quarterly GDP for the UK expanded 0.6% in Q2 vs. 0.6% forecast.
- UK GDP arrived at 0% MoM in June vs. 0% estimate.
- GBP/USD keeps gains above 1.2800 on the UK GDP data.
The UK economy expanded 0.6% QoQ in the three months to June, having reported a 0.7% growth in the first quarter of 2024. The market consensus was for +0.6% in the reported period.
The UK GDP rose 0.9% YoY in Q2 vs. 0.9% expected and 0.3% booked in Q1.
The UK GDP came in at 0.% MoM in June, as against a 0.4% increase reported in May, matching the estimated 0% print.
Meanwhile, the Index of services (December) arrived at 0.8% 3M/3M vs. 1.1% prior.
Other data from the UK showed that Industrial Production and Manufacturing Production increased by 0.8% and 1.1%, respectively, on a monthly basis in June. Both indicators outpaced estimates.
Separately, Total Business Investment declined 0.1% on a quarterly basis in the second quarter of 2024.
Following the UK GDP data releases, the country’s Finance Minister Rachel Reeves said, “the new government is under no illusion as to scale of the challenge we have inherited.”
Market reaction to the UK data
UK GDP and industrial figures failed to move the needle around the Pound Sterling market. At the time of press, GBP/USD is trading 0.17% higher on the day at 1.2845.
British Pound PRICE Today
The table below shows the percentage change of British Pound (GBP) against listed major currencies today. British Pound was the strongest against the Swiss Franc.
| USD | EUR | GBP | JPY | CAD | AUD | NZD | CHF | |
|---|---|---|---|---|---|---|---|---|
| USD | 0.00% | -0.14% | -0.10% | -0.03% | -0.28% | 0.02% | -0.05% | |
| EUR | -0.01% | -0.16% | -0.13% | -0.04% | -0.37% | -0.16% | -0.05% | |
| GBP | 0.14% | 0.16% | 0.04% | 0.12% | -0.21% | 0.00% | 0.20% | |
| JPY | 0.10% | 0.13% | -0.04% | 0.06% | -0.19% | -0.01% | 0.16% | |
| CAD | 0.03% | 0.04% | -0.12% | -0.06% | -0.25% | -0.11% | 0.08% | |
| AUD | 0.28% | 0.37% | 0.21% | 0.19% | 0.25% | 0.20% | 0.40% | |
| NZD | -0.02% | 0.16% | -0.01% | 0.01% | 0.11% | -0.20% | 0.20% | |
| CHF | 0.05% | 0.05% | -0.20% | -0.16% | -0.08% | -0.40% | -0.20% |
The heat map shows percentage changes of major currencies against each other. The base currency is picked from the left column, while the quote currency is picked from the top row. For example, if you pick the British Pound from the left column and move along the horizontal line to the US Dollar, the percentage change displayed in the box will represent GBP (base)/USD (quote).
FX option expiries for Aug 15 NY cut at 10:00 Eastern Time, via DTCC, can be found below.
EUR/USD: EUR amounts
- 1.0800 2b
- 1.0890 1.4b
- 1.0915 2.2b
- 1.0950 1.7b
- 1.1000 1.6b
- 1.1030 853m
- 1.1050 1.2b
GBP/USD: GBP amounts
- 1.2500 400m
- 1.2550 520m
USD/JPY: USD amounts
- 145.00 696m
- 147.50 1.3b
- 149.00 746m
- 149.20 801m
- 150.00 705m
- 150.05 1b
USD/CHF: USD amounts
- 0.8700 649m
- 0.8740 1.3b
AUD/USD: AUD amounts
- 0.6500 1b
- 0.6740 455m
NZD/USD: NZD amounts
- 0.6020 465m
EUR/GBP: EUR amounts
- 0.8525 882m
Gold prices rose in India on Thursday, according to data compiled by FXStreet.
The price for Gold stood at 6,620.45 Indian Rupees (INR) per gram, up compared with the INR 6,608.11 it cost on Wednesday.
The price for Gold increased to INR 77,220.84 per tola from INR 77,075.70 per tola a day earlier.
| Unit measure | Gold Price in INR |
|---|---|
| 1 Gram | 6,620.45 |
| 10 Grams | 66,207.71 |
| Tola | 77,220.84 |
| Troy Ounce | 205,924.10 |
FXStreet calculates Gold prices in India by adapting international prices (USD/INR) to the local currency and measurement units. Prices are updated daily based on the market rates taken at the time of publication. Prices are just for reference and local rates could diverge slightly.
Gold FAQs
Gold has played a key role in human’s history as it has been widely used as a store of value and medium of exchange. Currently, apart from its shine and usage for jewelry, the precious metal is widely seen as a safe-haven asset, meaning that it is considered a good investment during turbulent times. Gold is also widely seen as a hedge against inflation and against depreciating currencies as it doesn’t rely on any specific issuer or government.
Central banks are the biggest Gold holders. In their aim to support their currencies in turbulent times, central banks tend to diversify their reserves and buy Gold to improve the perceived strength of the economy and the currency. High Gold reserves can be a source of trust for a country’s solvency. Central banks added 1,136 tonnes of Gold worth around $70 billion to their reserves in 2022, according to data from the World Gold Council. This is the highest yearly purchase since records began. Central banks from emerging economies such as China, India and Turkey are quickly increasing their Gold reserves.
Gold has an inverse correlation with the US Dollar and US Treasuries, which are both major reserve and safe-haven assets. When the Dollar depreciates, Gold tends to rise, enabling investors and central banks to diversify their assets in turbulent times. Gold is also inversely correlated with risk assets. A rally in the stock market tends to weaken Gold price, while sell-offs in riskier markets tend to favor the precious metal.
The price can move due to a wide range of factors. Geopolitical instability or fears of a deep recession can quickly make Gold price escalate due to its safe-haven status. As a yield-less asset, Gold tends to rise with lower interest rates, while higher cost of money usually weighs down on the yellow metal. Still, most moves depend on how the US Dollar (USD) behaves as the asset is priced in dollars (XAU/USD). A strong Dollar tends to keep the price of Gold controlled, whereas a weaker Dollar is likely to push Gold prices up.
(An automation tool was used in creating this post.)
- EUR/USD hovers around 1.1010 in Thursday’s Asian session.
- Eurozone GDP climbed 0.3% in the three months to June, matching the estimate.
- US CPI inflation was in line with market consensus.
The EUR/USD pair consolidates its gains near 1.1010 after retracing from the fresh seven-month top during the Asian session on Thursday. The Eurozone Gross Domestic Product (GDP) growth figure for the second quarter (Q2) printed exactly as expected, which lifted the Euro (EUR) against the Greenback.
Data released by Eurostat on Wednesday revealed that the Eurozone economy grew 0.3% QoQ in Q2 compared with the first three months of this year. On an annual basis, the economy expanded 0.6%. Both figures came in with the market consensus and might boost the shared currency in the near term.
However, the upside to GDP growth might be limited. ING economist Bert Colijn said, “With recent numbers casting doubt about service sector strength, expectations for GDP growth in the rest of the year have weakened.” The markets expect the European Central Bank (ECB) to cut rates again in September as the economic outlook remains fragile after it left its key interest rates unchanged at its July meeting.
Across the pond, more signs that inflation in the US is cooling down weigh on the USD and create a tailwind for EUR/USD. The US headline CPI inflation dropped to 2.9% YoY in July from 3% in June. This figure was softer than the estimation, the Labor Department showed on Wednesday. The Core CPI, excluding food and energy, rose 3.2% YoY, compared to a rise of 3.3% seen in July, in line with the market consensus.
Traders await the release of US economic data on Thursday for fresh impetus, including US Retail Sales, weekly Initial Jobless Claims, the Philly Fed Manufacturing Index and Industrial Production. The stronger-than-expected readings could support the Greenback and cap the pair’s upside.
Euro FAQs
The Euro is the currency for the 20 European Union countries that belong to the Eurozone. It is the second most heavily traded currency in the world behind the US Dollar. In 2022, it accounted for 31% of all foreign exchange transactions, with an average daily turnover of over $2.2 trillion a day. EUR/USD is the most heavily traded currency pair in the world, accounting for an estimated 30% off all transactions, followed by EUR/JPY (4%), EUR/GBP (3%) and EUR/AUD (2%).
The European Central Bank (ECB) in Frankfurt, Germany, is the reserve bank for the Eurozone. The ECB sets interest rates and manages monetary policy. The ECB’s primary mandate is to maintain price stability, which means either controlling inflation or stimulating growth. Its primary tool is the raising or lowering of interest rates. Relatively high interest rates – or the expectation of higher rates – will usually benefit the Euro and vice versa. The ECB Governing Council makes monetary policy decisions at meetings held eight times a year. Decisions are made by heads of the Eurozone national banks and six permanent members, including the President of the ECB, Christine Lagarde.
Eurozone inflation data, measured by the Harmonized Index of Consumer Prices (HICP), is an important econometric for the Euro. If inflation rises more than expected, especially if above the ECB’s 2% target, it obliges the ECB to raise interest rates to bring it back under control. Relatively high interest rates compared to its counterparts will usually benefit the Euro, as it makes the region more attractive as a place for global investors to park their money.
Data releases gauge the health of the economy and can impact on the Euro. Indicators such as GDP, Manufacturing and Services PMIs, employment, and consumer sentiment surveys can all influence the direction of the single currency. A strong economy is good for the Euro. Not only does it attract more foreign investment but it may encourage the ECB to put up interest rates, which will directly strengthen the Euro. Otherwise, if economic data is weak, the Euro is likely to fall. Economic data for the four largest economies in the euro area (Germany, France, Italy and Spain) are especially significant, as they account for 75% of the Eurozone’s economy.
Another significant data release for the Euro is the Trade Balance. This indicator measures the difference between what a country earns from its exports and what it spends on imports over a given period. If a country produces highly sought after exports then its currency will gain in value purely from the extra demand created from foreign buyers seeking to purchase these goods. Therefore, a positive net Trade Balance strengthens a currency and vice versa for a negative balance.
- The US Dollar continues to lose ground following the mixed CPI data.
- US Consumer Price Index rose 2.9% YoY in July, against a 3% rise in June.
- A moderate increase in US inflation has sparked a debate on the extent of the Fed’s rate cuts in September.
The US Dollar Index (DXY), which measures the value of the US Dollar (USD) against other six major peers, extends its losing streak for the fifth successive session. The DXY trades around 102.60 during the Asian session on Thursday. The Greenback faces challenges following Wednesday's Consumer Price Index (CPI) data, which showed a moderate increase in July's annual US inflation rate. This has raised expectations for at least a 25 basis point rate cut by the Federal Reserve (Fed) in September.
US headline Consumer Price Index (CPI) rose 2.9% year-over-year in July, slightly down from the 3% increase in June and below market expectations. The Core CPI, which excludes food and energy, climbed 3.2% year-over-year, a slight decrease from the 3.3% rise in June but aligned with market forecasts.
Investors are likely debating how much the Federal Reserve (Fed) will cut rates in September. While traders are leaning toward a more modest 25 basis point reduction, with a 60% probability, a 50 basis point cut remains a possibility. According to CME FedWatch, there is a 36% chance of the larger cut occurring in September.
However, the US Dollar received support from improved Treasury yields. 2-year and 10-year yields on US Treasury bonds stand at 3.95% and 3.83%, respectively, at the time of writing. Traders are likely awaiting US Initial Jobless Claims and Retail Sales data scheduled for release on Thursday.
On Wednesday, Reuters reported that US President Joe Biden suggested Iran might refrain from attacking Israel if a cease-fire is achieved in Gaza. These comments would contribute to strengthening the risk sentiment, which might have put pressure on the US Dollar. New cease-fire talks are scheduled for Thursday in Qatar, though Hamas has stated it will not participate in the negotiations.
US Dollar FAQs
The US Dollar (USD) is the official currency of the United States of America, and the ‘de facto’ currency of a significant number of other countries where it is found in circulation alongside local notes. It is the most heavily traded currency in the world, accounting for over 88% of all global foreign exchange turnover, or an average of $6.6 trillion in transactions per day, according to data from 2022. Following the second world war, the USD took over from the British Pound as the world’s reserve currency. For most of its history, the US Dollar was backed by Gold, until the Bretton Woods Agreement in 1971 when the Gold Standard went away.
The most important single factor impacting on the value of the US Dollar is monetary policy, which is shaped by the Federal Reserve (Fed). The Fed has two mandates: to achieve price stability (control inflation) and foster full employment. Its primary tool to achieve these two goals is by adjusting interest rates. When prices are rising too quickly and inflation is above the Fed’s 2% target, the Fed will raise rates, which helps the USD value. When inflation falls below 2% or the Unemployment Rate is too high, the Fed may lower interest rates, which weighs on the Greenback.
In extreme situations, the Federal Reserve can also print more Dollars and enact quantitative easing (QE). QE is the process by which the Fed substantially increases the flow of credit in a stuck financial system. It is a non-standard policy measure used when credit has dried up because banks will not lend to each other (out of the fear of counterparty default). It is a last resort when simply lowering interest rates is unlikely to achieve the necessary result. It was the Fed’s weapon of choice to combat the credit crunch that occurred during the Great Financial Crisis in 2008. It involves the Fed printing more Dollars and using them to buy US government bonds predominantly from financial institutions. QE usually leads to a weaker US Dollar.
Quantitative tightening (QT) is the reverse process whereby the Federal Reserve stops buying bonds from financial institutions and does not reinvest the principal from the bonds it holds maturing in new purchases. It is usually positive for the US Dollar.
- GBP/USD regains positive traction following the previous day’s post-US CPI decline.
- Dovish Fed expectations and a positive risk tone weigh on the USD and lend support.
- Traders now look to the UK GDP print for some impetus ahead of the US macro data.
The GBP/USD pair attracts some dip-buying during the Asian session on Thursday and reverses a part of the previous day's post-US CPI retracement slide from the vicinity of the monthly peak. Spot prices currently trade around the 1.2735-1.2740 region, up less than 0.10% for the day as traders now look to the release of the preliminary UK Q3 GDP print for a fresh impetus.
The consensus estimates suggest that the British economy expanded by 0.6% during the April-June period, slightly less than the 0.7% rise recorded in the previous quarter. Meanwhile, the annualized UK GDP growth is expected to come in at 0.9% as compared to 0.3% in the first quarter. Against the backdrop of a surprise dip in the UK unemployment rate, even a stronger GDP print will signal a strengthening economy. This might complicate the Bank of England’s (BoE) plans to lower interest rates and provide a goodish lift to the British Pound (GBP).
Apart from this, investors on Thursday will take cues from the US macro data – monthly Retail Sales, the usual Weekly Initial Jobless Claims, the Empire State Manufacturing Index and the Philly Fed Manufacturing Index. The data might influence the USD price dynamics and provide some meaningful impetus to the GBP/USD pair. Ahead of the key data, bets for an imminent start of the Federal Reserve's (Fed) rate-cutting cycle, bolstered by data indicating that inflation is on a downward trend, weigh on the USD and lend support to the currency pair.
The US Bureau of Labor Statistics (BLS) reported on Wednesday that the headline US CPI rose moderately, by 0.2% in July after falling 0.1% in the previous month. Meanwhile, the annual increase in the CPI slowed a bit and fell below 3% for the first time in nearly three-and-half years, suggesting continued progress towards the Fed's inflation goals. Investors, however, scaled back expectations for more aggressive policy easing by the Fed, which, along with geopolitical risks, could help limit the downside for the buck and keep a lid on the GBP/USD pair.
Economic Indicator
Gross Domestic Product (QoQ)
The Gross Domestic Product (GDP), released by the Office for National Statistics on a monthly and quarterly basis, is a measure of the total value of all goods and services produced in the UK during a given period. The GDP is considered as the main measure of UK economic activity. The QoQ reading compares economic activity in the reference quarter to the previous quarter. Generally, a rise in this indicator is bullish for the Pound Sterling (GBP), while a low reading is seen as bearish.
Read more.Next release: Thu Aug 15, 2024 06:00 (Prel)
Frequency: Quarterly
Consensus: 0.6%
Previous: 0.7%
Source: Office for National Statistics
- The Japanese Yen edges higher due to rising odds of the BoJ adopting a hawkish stance amid upbeat GDP data.
- Japan's Gross Domestic Product increased by 0.8% in Q2, marking the strongest quarterly growth since Q1 of 2023.
- The US Dollar appreciates due to improved Treasury yields despite rising expectations of the Fed’s rate cut in September.
The Japanese Yen (JPY) gains ground against the US Dollar (USD) on Thursday. This upside occurred as Japan’s Gross Domestic Product (GDP) growth for the second quarter surpassed expectations, supporting the argument for a potential near-term interest rate hike by the Bank of Japan (BoJ).
Japanese Economy Minister Yoshitaka Shindo stated that the economy is anticipated to recover gradually as wages and income improve. Shindo also added that the government will collaborate closely with the Bank of Japan to implement flexible macroeconomic policies.
However, the USD/JPY pair received support from the improved US Dollar amid higher Treasury yields. However, the potential for further gains in the Greenback may be constrained by increasing expectations of at least a 25 basis point rate cut by the US Federal Reserve (Fed) in September.
The moderate US Consumer Price Index (CPI) data has sparked debate about the extent of the Fed’s potential rate cut in September. Traders are favoring a more modest 25 basis point reduction, with a 60% probability, while a 50 basis point cut is still on the table. According to CME FedWatch, there is a 36% chance of the larger cut occurring in September.
Daily Digest Market Movers: Japanese Yen declines despite upbeat GDP data
- Japan's Gross Domestic Product (GDP) grew by 0.8% quarter-on-quarter in Q2, surpassing market forecasts of 0.5% and rebounding from a 0.6% decline in Q1. This marked the strongest quarterly growth since Q1 of 2023. Meanwhile, the annualized GDP growth reached 3.1%, exceeding the market consensus of 2.1% and reversing a 2.3% contraction in Q1. This was the strongest yearly expansion since Q2 of 2023.
- Federal Reserve Bank of Chicago President Austan Goolsbee expressed growing concern on Wednesday about the labor market rather than inflation, noting recent improvements in price pressures alongside weak jobs data. Goolsbee added that the extent of rate cuts will be determined by the prevailing economic conditions, per Bloomberg.
- US headline Consumer Price Index (CPI) rose 2.9% year-over-year in July, slightly down from the 3% increase in June and below market expectations. The Core CPI, which excludes food and energy, climbed 3.2% year-over-year, a slight decrease from the 3.3% rise in June but aligned with market forecasts.
- Japanese Prime Minister Fumio Kishida announced at a press conference on Wednesday that he will not seek re-election as the leader of the Liberal Democratic Party (LDP) in September. Kishida emphasized the need to combat Japan's deflation-prone economy by promoting wage and investment growth and achieving the goal of expanding Japan's GDP to ¥600 trillion.
- Rabobank's senior FX strategist, Jane Foley, observes that this week's series of US data releases, along with next week's Jackson Hole event, should provide the market with clearer insights into the potential responses of US policymakers. However, their main expectation is that the Fed will reduce rates by 25 basis points in September and likely cut them again before the end of the year.
- On Tuesday, Atlanta Fed President Raphael Bostic stated that recent economic data has increased his confidence that the Fed can achieve its 2% inflation target. However, Bostic indicated that additional evidence is required before he would support a reduction in interest rates, according to Reuters.
- Japan's parliament is scheduled to hold a special session on August 23 to discuss the Bank of Japan's (BoJ) decision to raise interest rates last month. BoJ Governor Kazuo Ueda is expected to attend the session, according to government sources cited by Reuters.
- The Bank of Japan’s Summary of Opinions from the Monetary Policy Meeting on July 30 and 31 indicated that several members believe economic activity and prices are evolving as expected by the BoJ. They are aiming for a neutral rate of "at least around 1%" as a medium-term target.
Technical Analysis: USD/JPY holds ground near 147.50 with testing the nine-day EMA barrier
USD/JPY trades around 147.40 on Thursday. The daily chart analysis shows that the pair is positioned slightly below the nine-day Exponential Moving Average (EMA), suggesting a short-term bearish trend. Additionally, the 14-day Relative Strength Index (RSI) is positioned slightly above the 30 level, suggesting a potential for a correction.
In terms of support levels, the USD/JPY pair may navigate the region around a seven-month low of 141.69, reached on August 5. Further downside could see the pair approaching a secondary support level at 140.25.
On the upside, the USD/JPY pair may encounter immediate resistance at the nine-day Exponential Moving Average (EMA) around the 147.53 level, followed by the 50-day EMA at 153.40 level, with the potential to test the resistance level at 154.50, where previous support has now turned into resistance.
USD/JPY: Daily Chart
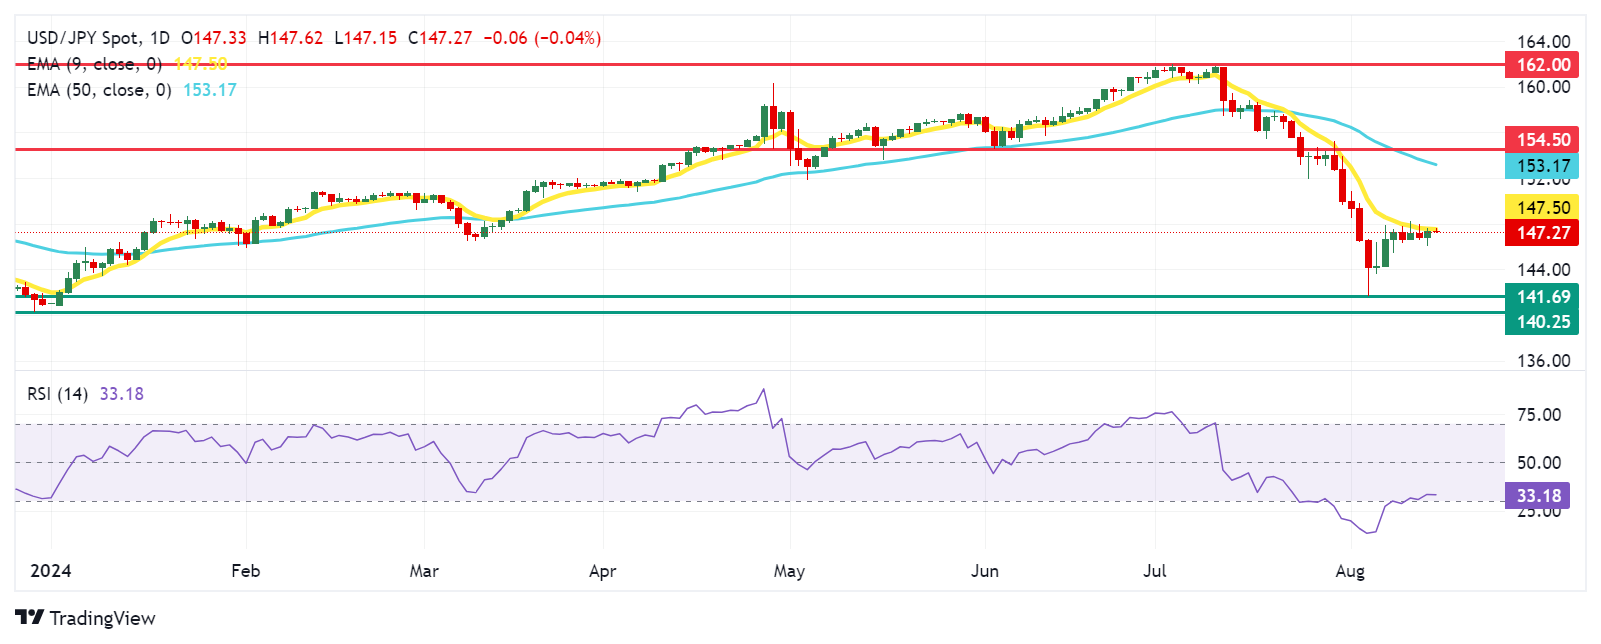
Japanese Yen PRICE Today
The table below shows the percentage change of Japanese Yen (JPY) against listed major currencies today. Japanese Yen was the strongest against the Swiss Franc.
| USD | EUR | GBP | JPY | CAD | AUD | NZD | CHF | |
|---|---|---|---|---|---|---|---|---|
| USD | 0.03% | -0.06% | -0.03% | -0.03% | -0.33% | 0.03% | -0.03% | |
| EUR | -0.03% | -0.10% | -0.08% | -0.05% | -0.44% | -0.17% | -0.06% | |
| GBP | 0.06% | 0.10% | 0.06% | 0.05% | -0.34% | -0.07% | 0.14% | |
| JPY | 0.03% | 0.08% | -0.06% | -0.00% | -0.33% | -0.09% | 0.09% | |
| CAD | 0.03% | 0.05% | -0.05% | 0.00% | -0.31% | -0.12% | 0.09% | |
| AUD | 0.33% | 0.44% | 0.34% | 0.33% | 0.31% | 0.26% | 0.46% | |
| NZD | -0.03% | 0.17% | 0.07% | 0.09% | 0.12% | -0.26% | 0.20% | |
| CHF | 0.03% | 0.06% | -0.14% | -0.09% | -0.09% | -0.46% | -0.20% |
The heat map shows percentage changes of major currencies against each other. The base currency is picked from the left column, while the quote currency is picked from the top row. For example, if you pick the Japanese Yen from the left column and move along the horizontal line to the US Dollar, the percentage change displayed in the box will represent JPY (base)/USD (quote).
Bank of Japan FAQs
The Bank of Japan (BoJ) is the Japanese central bank, which sets monetary policy in the country. Its mandate is to issue banknotes and carry out currency and monetary control to ensure price stability, which means an inflation target of around 2%.
The Bank of Japan has embarked in an ultra-loose monetary policy since 2013 in order to stimulate the economy and fuel inflation amid a low-inflationary environment. The bank’s policy is based on Quantitative and Qualitative Easing (QQE), or printing notes to buy assets such as government or corporate bonds to provide liquidity. In 2016, the bank doubled down on its strategy and further loosened policy by first introducing negative interest rates and then directly controlling the yield of its 10-year government bonds.
The Bank’s massive stimulus has caused the Yen to depreciate against its main currency peers. This process has exacerbated more recently due to an increasing policy divergence between the Bank of Japan and other main central banks, which have opted to increase interest rates sharply to fight decades-high levels of inflation. The BoJ’s policy of holding down rates has led to a widening differential with other currencies, dragging down the value of the Yen.
A weaker Yen and the spike in global energy prices have led to an increase in Japanese inflation, which has exceeded the BoJ’s 2% target. With wage inflation becoming a cause of concern, the BoJ looks to move away from ultra loose policy, while trying to avoid slowing the activity too much.
Speaking in an interview with the Financial Times (FT) early Thursday, Atlanta Federal Reserve (Fed) President Raphael Bostic said that he is “open to September rate cut as inflation cools.”
Additional quotes
Price pressures eased officials also needed to be conscious of their mandate of maintaining full employment.
The labor market is weakening but not weak.
Market reaction
These above dovish comments fail to move the needle around the US Dollar Index, as it holds the overnight recovery above 102.60, as of writing.
Fed FAQs
Monetary policy in the US is shaped by the Federal Reserve (Fed). The Fed has two mandates: to achieve price stability and foster full employment. Its primary tool to achieve these goals is by adjusting interest rates. When prices are rising too quickly and inflation is above the Fed’s 2% target, it raises interest rates, increasing borrowing costs throughout the economy. This results in a stronger US Dollar (USD) as it makes the US a more attractive place for international investors to park their money. When inflation falls below 2% or the Unemployment Rate is too high, the Fed may lower interest rates to encourage borrowing, which weighs on the Greenback.
The Federal Reserve (Fed) holds eight policy meetings a year, where the Federal Open Market Committee (FOMC) assesses economic conditions and makes monetary policy decisions. The FOMC is attended by twelve Fed officials – the seven members of the Board of Governors, the president of the Federal Reserve Bank of New York, and four of the remaining eleven regional Reserve Bank presidents, who serve one-year terms on a rotating basis.
In extreme situations, the Federal Reserve may resort to a policy named Quantitative Easing (QE). QE is the process by which the Fed substantially increases the flow of credit in a stuck financial system. It is a non-standard policy measure used during crises or when inflation is extremely low. It was the Fed’s weapon of choice during the Great Financial Crisis in 2008. It involves the Fed printing more Dollars and using them to buy high grade bonds from financial institutions. QE usually weakens the US Dollar.
Quantitative tightening (QT) is the reverse process of QE, whereby the Federal Reserve stops buying bonds from financial institutions and does not reinvest the principal from the bonds it holds maturing, to purchase new bonds. It is usually positive for the value of the US Dollar.
- USD/CNH attracts some buyers on Thursday and moves away from over a one-week low.
- The technical setup supports prospects for the emergence of fresh selling at higher levels.
- A sustained strength beyond 50% Fibo. level is needed to negate the negative outlook.
The USD/CNH pair builds on the previous day's bounce from the 7.1305-7.1300 area, or over a one-week low and gains some follow-through positive traction during the Asian session on Thursday. Spot prices stick to modest intraday gains near the 7.1560 area, though the mixed technical set-up warrants some caution before positioning for any further appreciating move.
The USD/CNH pair, so far, has been showing some resilience below the 23.6% Fibonacci retracement level of the July-August fall and the subsequent move up favors bullish traders. That said, oscillators on the daily chart are holding deep in negative territory and are still away from being in the oversold zone. Hence, any further positive move is more likely to attract fresh sellers near the 7.1845-7.1850 region and remain capped near the 7.1895-7.1900 area.
The latter is followed by the 50% Fibo. level, around the 7.1975-7.1980 zone, which should now act as a key pivotal point. A sustained strength beyond the said barrier will suggest that the USD/CNH pair has bottomed out near the 7.0835 region, or the lowest level since June 2023 touched last week and pave the way for some meaningful appreciating move.
On the flip side, the 7.1500 level is likely to protect the immediate downside, below which the USD/CNH pair could accelerate the fall back towards challenging the multi-month low, around the 7.0835 region. Some follow-through selling will be seen as a fresh trigger for bearish traders and set the stage for an extension of the recent sharp pullback from the YTD peak touched in July.
USD/CNH daily chart
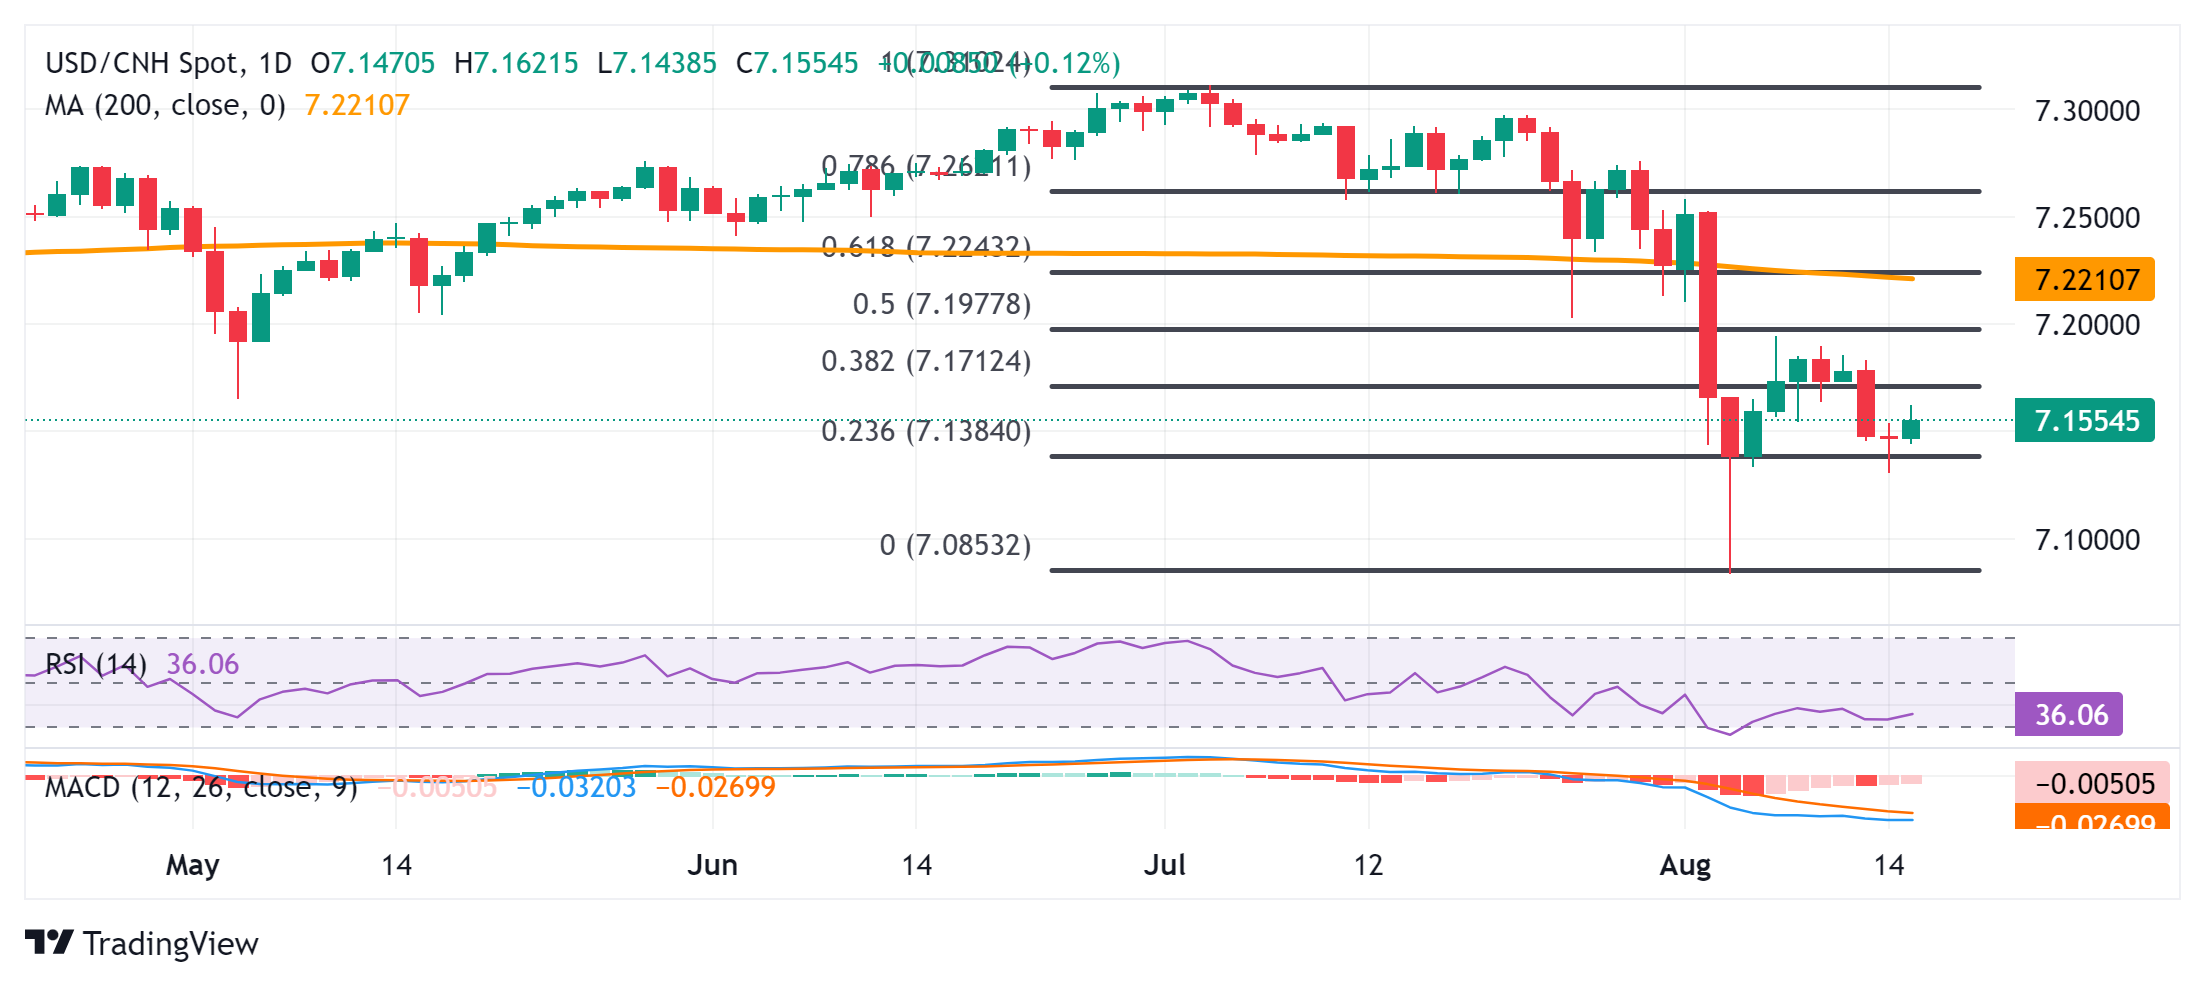
US Dollar PRICE Today
The table below shows the percentage change of US Dollar (USD) against listed major currencies today. US Dollar was the strongest against the Euro.
| USD | EUR | GBP | JPY | CAD | AUD | NZD | CHF | |
|---|---|---|---|---|---|---|---|---|
| USD | 0.04% | -0.05% | 0.01% | -0.02% | -0.31% | 0.03% | -0.01% | |
| EUR | -0.04% | -0.10% | -0.03% | -0.06% | -0.45% | -0.18% | -0.03% | |
| GBP | 0.05% | 0.10% | 0.09% | 0.07% | -0.33% | -0.07% | 0.14% | |
| JPY | -0.01% | 0.03% | -0.09% | -0.05% | -0.36% | -0.14% | 0.05% | |
| CAD | 0.02% | 0.06% | -0.07% | 0.05% | -0.30% | -0.11% | 0.10% | |
| AUD | 0.31% | 0.45% | 0.33% | 0.36% | 0.30% | 0.25% | 0.46% | |
| NZD | -0.03% | 0.18% | 0.07% | 0.14% | 0.11% | -0.25% | 0.21% | |
| CHF | 0.00% | 0.03% | -0.14% | -0.05% | -0.10% | -0.46% | -0.21% |
The heat map shows percentage changes of major currencies against each other. The base currency is picked from the left column, while the quote currency is picked from the top row. For example, if you pick the US Dollar from the left column and move along the horizontal line to the Japanese Yen, the percentage change displayed in the box will represent USD (base)/JPY (quote).
- Silver attracts some buying on Thursday and recovers further from the weekly low.
- The technical setup warrants caution before positioning for any further move up.
- A sustained move beyond the $28.00 mark is needed to negate the negative bias.
Silver (XAG/USD) gains some positive traction during the Asian session on Thursday and builds on the overnight bounce from the $27.20-$27.15 region, or the weekly low. The white metal currently trades around the $27.70 area, up 0.40% for the day, and for now, seems to have snapped a two-day losing streak.
From a technical perspective, this week's repeated failures near the 100-period Simple Moving Average (SMA) hurdle on the 4-hour chart, currently pegged near the $28.00 mark, warrant some caution for bullish traders. Furthermore, neutral oscillators on the said chart make it prudent to wait for strong follow-through buying before positioning for an extension of the recent bounce from the $26.45 area, or over a three-month low touched last week.
The XAG/USD might then climb to 38.2% Fibo. level, around the $28.45 region, before aiming to reclaim the $29.00 mark. The latter coincides with the 50% Fibo. level and is followed by the monthly swing high, around the $29.20 area, which if cleared decisively will be seen as a fresh trigger for bullish traders. The subsequent move up could lift the white metal further towards the $29.70 resistance en route to the $30.00 psychological mark.
On the flip side, the overnight swing low, around the $27.20-$27.15 region, now seems to protect the immediate downside ahead of the $27.00 round figure. Some follow-through selling might expose the multi-month low, around the $26.45 area, below which the XAG/USD could slide to the $26.00 mark. The downward trajectory could extend further towards the next relevant support near the $25.60 horizontal zone en route to the $25.00 psychological mark.
Silver 4-hour chart
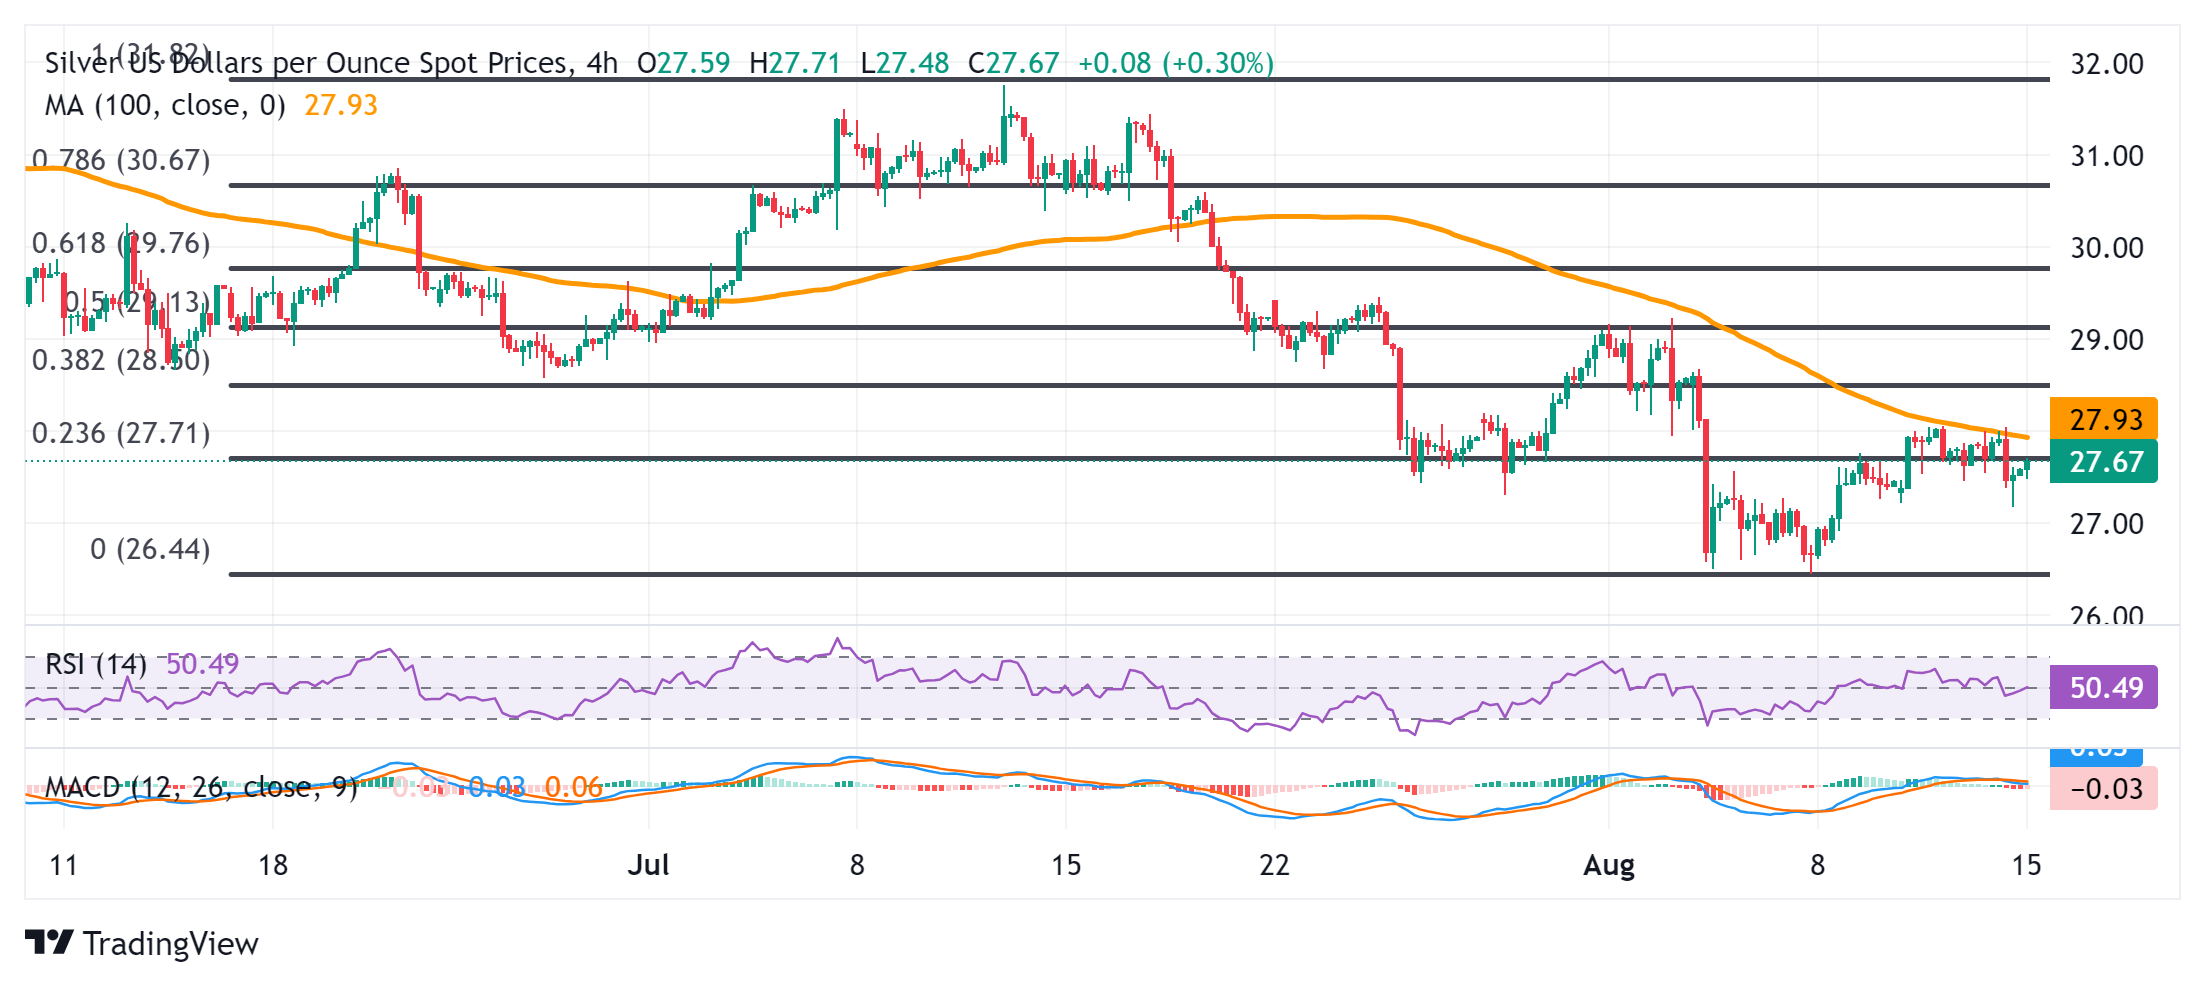
Silver FAQs
Silver is a precious metal highly traded among investors. It has been historically used as a store of value and a medium of exchange. Although less popular than Gold, traders may turn to Silver to diversify their investment portfolio, for its intrinsic value or as a potential hedge during high-inflation periods. Investors can buy physical Silver, in coins or in bars, or trade it through vehicles such as Exchange Traded Funds, which track its price on international markets.
Silver prices can move due to a wide range of factors. Geopolitical instability or fears of a deep recession can make Silver price escalate due to its safe-haven status, although to a lesser extent than Gold's. As a yieldless asset, Silver tends to rise with lower interest rates. Its moves also depend on how the US Dollar (USD) behaves as the asset is priced in dollars (XAG/USD). A strong Dollar tends to keep the price of Silver at bay, whereas a weaker Dollar is likely to propel prices up. Other factors such as investment demand, mining supply – Silver is much more abundant than Gold – and recycling rates can also affect prices.
Silver is widely used in industry, particularly in sectors such as electronics or solar energy, as it has one of the highest electric conductivity of all metals – more than Copper and Gold. A surge in demand can increase prices, while a decline tends to lower them. Dynamics in the US, Chinese and Indian economies can also contribute to price swings: for the US and particularly China, their big industrial sectors use Silver in various processes; in India, consumers’ demand for the precious metal for jewellery also plays a key role in setting prices.
Silver prices tend to follow Gold's moves. When Gold prices rise, Silver typically follows suit, as their status as safe-haven assets is similar. The Gold/Silver ratio, which shows the number of ounces of Silver needed to equal the value of one ounce of Gold, may help to determine the relative valuation between both metals. Some investors may consider a high ratio as an indicator that Silver is undervalued, or Gold is overvalued. On the contrary, a low ratio might suggest that Gold is undervalued relative to Silver.
- AUD/JPY gains momentum near 97.55 in Thursday’s Asian session, up 0.36% on the day.
- The improved Chinese July Retail Sales boost the Aussie.
- The BoJ rate hike uncertainty might weigh on the Japanese Yen.
The AUD/JPY cross attracts some buyers around 97.55 during the Asian trading hours on Thursday. The upbeat Chinese July Retail Sales data provides some support to the Australian Dollar (AUD). Investors await Reserve Bank of Australia (RBA) Governor Michele Bullock's speech on Friday for fresh catalysts.
Data released by the National Bureau of Statistics of China on Thursday showed that China’s Retail Sales rose by 2.7% YoY in July, compared to 2.0% seen in the previous month. This figure was better than the market expectations. Meanwhile, Chinese Industrial Production arrived at 5.1% YoY in July from 5.3% in June, below the market consensus of 5.2%. The Aussie edges higher in response to the reports. However, the Chinese economy remained fragile, with recent government measures providing only a minor boost to private spending. This is likely to weigh on the AUD in the near term as China is Australia's major trading partner.
Elsewhere, Australia’s Unemployment Rate rose to 4.2% in July from 4.1% in June, the Australian Bureau of Statistics (ABS) revealed on Thursday. Economists had expected the rate to remain unchanged at 4.1%. Markets are now fully pricing in the chance of a 25 basis points (bps) rate cut by the RBA final meeting of the year in December, according to the ASX rates tracker.
On the JPY’s front, the uncertainty over the timeline of the Bank of Japan (BoJ) rate hike weighs on the Japanese Yen (JPY). On Thursday, Japanese Economy Minister Yoshitaka Shindo said that the government will work closely with the BoJ to carry out flexible macroeconomic policy management. BoJ Governor Kazuo Ueda stated that the Japanese central bank will keep raising rates, and adjust the degree of easing if the current economic and price outlook is realized.
Australian Dollar FAQs
One of the most significant factors for the Australian Dollar (AUD) is the level of interest rates set by the Reserve Bank of Australia (RBA). Because Australia is a resource-rich country another key driver is the price of its biggest export, Iron Ore. The health of the Chinese economy, its largest trading partner, is a factor, as well as inflation in Australia, its growth rate and Trade Balance. Market sentiment – whether investors are taking on more risky assets (risk-on) or seeking safe-havens (risk-off) – is also a factor, with risk-on positive for AUD.
The Reserve Bank of Australia (RBA) influences the Australian Dollar (AUD) by setting the level of interest rates that Australian banks can lend to each other. This influences the level of interest rates in the economy as a whole. The main goal of the RBA is to maintain a stable inflation rate of 2-3% by adjusting interest rates up or down. Relatively high interest rates compared to other major central banks support the AUD, and the opposite for relatively low. The RBA can also use quantitative easing and tightening to influence credit conditions, with the former AUD-negative and the latter AUD-positive.
China is Australia’s largest trading partner so the health of the Chinese economy is a major influence on the value of the Australian Dollar (AUD). When the Chinese economy is doing well it purchases more raw materials, goods and services from Australia, lifting demand for the AUD, and pushing up its value. The opposite is the case when the Chinese economy is not growing as fast as expected. Positive or negative surprises in Chinese growth data, therefore, often have a direct impact on the Australian Dollar and its pairs.
Iron Ore is Australia’s largest export, accounting for $118 billion a year according to data from 2021, with China as its primary destination. The price of Iron Ore, therefore, can be a driver of the Australian Dollar. Generally, if the price of Iron Ore rises, AUD also goes up, as aggregate demand for the currency increases. The opposite is the case if the price of Iron Ore falls. Higher Iron Ore prices also tend to result in a greater likelihood of a positive Trade Balance for Australia, which is also positive of the AUD.
The Trade Balance, which is the difference between what a country earns from its exports versus what it pays for its imports, is another factor that can influence the value of the Australian Dollar. If Australia produces highly sought after exports, then its currency will gain in value purely from the surplus demand created from foreign buyers seeking to purchase its exports versus what it spends to purchase imports. Therefore, a positive net Trade Balance strengthens the AUD, with the opposite effect if the Trade Balance is negative.
- Gold price regains some positive traction following the overnight post-US CPI decline.
- Persistent geopolitical risks and Fed rate cut bets continue to offer support to the metal.
- A modest USD uptick and a positive risk tone could act as a headwind for the XAU/USD.
Gold price (XAU/USD) witnessed an intraday turnaround from the vicinity of the record peak and dropped over 1.5% intraday following the release of the US consumer inflation figures on Wednesday. The closely-watched US CPI indicated that inflation is on a downward trend and reaffirmed bets for an imminent start of the Federal Reserve's (Fed) rate-cutting cycle in September. Investors, however, scaled back their expectations for more aggressive policy easing, which led to a modest US Dollar (USD) rebound from the vicinity of a multi-month low touched last week and weighed on the non-yielding yellow metal.
That said, the risk of a broadening conflict in the Middle East helped limit the downside for the safe-haven Gold price and find some support near the $2,438 area. The precious metal recovered around $10 from the daily low and gained some follow-through traction during the Asian session on Thursday, though a further USD buying keeps a lid on any meaningful appreciating move. Nevertheless, the XAU/USD, for now, seems to have snapped a two-day losing streak as traders now look to the US Retail Sales figures and other important US macro releases for a fresh impetus later during the North American session on Thursday.
Daily Digest Market Movers: Gold price attracts some haven flows amid dovish Fed expectations
- Data published on Wednesday showed that US consumer prices rebounded as anticipated in July and dashed hopes for a bigger interest rate cut by the Federal Reserve in September.
- In fact, the US Labor Department's Bureau of Labor Statistics (BLS) reported that the headline US CPI rose moderately, by 0.2% in July after falling 0.1% in the previous month.
- The annual increase in the CPI, however, slowed a bit and fell below 3% for the first time in nearly 3-1/2 years, suggesting continued progress towards the Fed's inflation goals.
- The core CPI, which excludes volatile food and energy prices, increased by 0.2% during the reported month and eased to 3.2% in the 12 months through July from 3.3% in June.
- According to the CME Group's FedWatch Tool, investors now see a 36% chance of a 50-basis point rate cut at the next FOMC meeting versus the 50% prior to the US CPI data.
- This triggered a late recovery in the US Treasury bond yields, which assisted the US Dollar in attracting some buyers at lower levels and weighed on the non-yielding yellow metal.
- The USD Index (DXY) gains some follow-through traction on Thursday and acts as a headwind for the commodity, though elevated geopolitical tensions continue to offer some support.
- Mediators are hoping to kick-start ceasefire negotiations between Israel and Hamas on Thursday amid the risk of an imminent Iranian attack on Israel within the next few days.
- Traders now look to the US economic docket – featuring Retail Sales, Weekly Initial Jobless Claims and regional manufacturing indices – for short-term opportunities.
Technical Outlook: Gold price bulls have the upper hand while above the weekly low around $2,424
From a technical perspective, the overnight swing low, around the $2,438 region, now seems to protect the immediate downside ahead of the $2,424 area, or the weekly trough touched on Monday. Some follow-through selling could make the Gold price vulnerable to weaken further below the $2,400 mark and test the 50-day Simple Moving Average (SMA) pivotal support, currently pegged near the $2,380 zone. A convincing break below the latter might expose the 100-day SMA, near the $2,360 region, which if broken decisively will be seen as a fresh trigger for bearish traders and pave the way for deeper losses.
Meanwhile, oscillators on the daily chart are holding in positive territory and support prospects for additional near-term gains. That said, any further move up is more likely to confront some resistance near the $2,471-2,472 region ahead of the $2,483-$2,484 area or the all-time peak touched in July. A subsequent rise beyond the $2,500 psychological mark will confirm a breakout through a one-month-old broader trading range and set the stage for a further near-term appreciating move.
Gold FAQs
Gold has played a key role in human’s history as it has been widely used as a store of value and medium of exchange. Currently, apart from its shine and usage for jewelry, the precious metal is widely seen as a safe-haven asset, meaning that it is considered a good investment during turbulent times. Gold is also widely seen as a hedge against inflation and against depreciating currencies as it doesn’t rely on any specific issuer or government.
Central banks are the biggest Gold holders. In their aim to support their currencies in turbulent times, central banks tend to diversify their reserves and buy Gold to improve the perceived strength of the economy and the currency. High Gold reserves can be a source of trust for a country’s solvency. Central banks added 1,136 tonnes of Gold worth around $70 billion to their reserves in 2022, according to data from the World Gold Council. This is the highest yearly purchase since records began. Central banks from emerging economies such as China, India and Turkey are quickly increasing their Gold reserves.
Gold has an inverse correlation with the US Dollar and US Treasuries, which are both major reserve and safe-haven assets. When the Dollar depreciates, Gold tends to rise, enabling investors and central banks to diversify their assets in turbulent times. Gold is also inversely correlated with risk assets. A rally in the stock market tends to weaken Gold price, while sell-offs in riskier markets tend to favor the precious metal.
The price can move due to a wide range of factors. Geopolitical instability or fears of a deep recession can quickly make Gold price escalate due to its safe-haven status. As a yield-less asset, Gold tends to rise with lower interest rates, while higher cost of money usually weighs down on the yellow metal. Still, most moves depend on how the US Dollar (USD) behaves as the asset is priced in dollars (XAU/USD). A strong Dollar tends to keep the price of Gold controlled, whereas a weaker Dollar is likely to push Gold prices up.
- WTI price faces challenges due to easing supply fears over Middle East tensions.
- US President Joe Biden suggested that Iran might refrain from attacking Israel if a cease-fire in Gaza is achieved.
- EIA Crude Oil Stocks Change increased by 1.357 million barrels for the previous week, ending a six-week decline.
West Texas Intermediate (WTI) Oil price extends losses for the third successive session, trading around $75.90 during the Asian session on Thursday. Crude Oil prices depreciate following the easing supply fears over geopolitical tensions in the Middle East.
On Wednesday, Reuters reported that US President Joe Biden suggested Iran might refrain from attacking Israel if a cease-fire is achieved in Gaza. New cease-fire talks are scheduled to begin on Thursday in Qatar, though Hamas has stated it will not participate in the negotiations.
The EIA Crude Oil Stocks Change also reported an unexpected increase in US Oil inventories, which rose by 1.357 million barrels for the week ending August 9. This marked the end of a six-week decline and defied expectations of a 2.0 million-barrel drop. The previous week's decline was 3.728 million barrels.
However, the downside of the Oil prices could be restrained as expectations of a rate cut by the US Federal Reserve (Fed) in September. Lower interest rates may boost economic activity in the United States (US) and fuel Oil demand.
Wednesday's Consumer Price Index (CPI) data showed a moderate increase in July's annual US inflation rate sparking debate on how much the Federal Reserve (Fed) will cut rates in September. While traders are leaning toward a more modest 25 basis point reduction, with a 60% probability, a 50 basis point cut remains a possibility. According to CME FedWatch, there is a 36% chance of the larger cut occurring in September.
However, crude Oil prices are expected to remain under pressure due to ongoing concerns about sluggish global demand, particularly from China. Additionally, jet fuel demand is likely to soften as reduced consumer spending impacts travel budgets, which could further weigh on Oil prices in the coming months, per Reuters.
WTI Oil FAQs
WTI Oil is a type of Crude Oil sold on international markets. The WTI stands for West Texas Intermediate, one of three major types including Brent and Dubai Crude. WTI is also referred to as “light” and “sweet” because of its relatively low gravity and sulfur content respectively. It is considered a high quality Oil that is easily refined. It is sourced in the United States and distributed via the Cushing hub, which is considered “The Pipeline Crossroads of the World”. It is a benchmark for the Oil market and WTI price is frequently quoted in the media.
Like all assets, supply and demand are the key drivers of WTI Oil price. As such, global growth can be a driver of increased demand and vice versa for weak global growth. Political instability, wars, and sanctions can disrupt supply and impact prices. The decisions of OPEC, a group of major Oil-producing countries, is another key driver of price. The value of the US Dollar influences the price of WTI Crude Oil, since Oil is predominantly traded in US Dollars, thus a weaker US Dollar can make Oil more affordable and vice versa.
The weekly Oil inventory reports published by the American Petroleum Institute (API) and the Energy Information Agency (EIA) impact the price of WTI Oil. Changes in inventories reflect fluctuating supply and demand. If the data shows a drop in inventories it can indicate increased demand, pushing up Oil price. Higher inventories can reflect increased supply, pushing down prices. API’s report is published every Tuesday and EIA’s the day after. Their results are usually similar, falling within 1% of each other 75% of the time. The EIA data is considered more reliable, since it is a government agency.
OPEC (Organization of the Petroleum Exporting Countries) is a group of 13 Oil-producing nations who collectively decide production quotas for member countries at twice-yearly meetings. Their decisions often impact WTI Oil prices. When OPEC decides to lower quotas, it can tighten supply, pushing up Oil prices. When OPEC increases production, it has the opposite effect. OPEC+ refers to an expanded group that includes ten extra non-OPEC members, the most notable of which is Russia.
| Raw materials | Closed | Change, % |
|---|---|---|
| Silver | 27.557 | -1.06 |
| Gold | 244.766 | -0.75 |
| Palladium | 930.69 | -0.88 |
Following the publication of the high-impact China’s growth and activity data for May, the National Bureau of Statistics (NBS) expressed its outlook on the economy during its press conference on Thursday.
Key quotes (via Reuters)
China's economic operation is generally stable in July.
Rising negative impact from changes to China's external environment.
Economic recovery trend needs to be consolidated.
developing story ....
Commenting on the second-quarter Gross Domestic Product (GDP) data released on Thursday, Japanese Economy Minister Yoshitaka Shindo said that the “economy expected to gradually recover as wages and income improve.”
Additional quotes
Government (govt) will work closely with the Bank of Japan (BoJ) to carry out flexible macroeconomic policy management.
Govt will closely monitor, economic, price situations and financial markets.
Need to be mindful of downside risks in overseas economy, market movements.
China’s July Retail Sales, increased 2.7% YoY vs. 2.6% expected and 2.0% in June while the country’s Industrial Production rose 5.1% YoY in the same period vs. 5.2% forecast and 5.3% booked previously. The National Bureau of Statistics (NBS) released the official data on Thursday.
Meanwhile, the Fixed Asset Investment rose 3.6% YTD YoY in July, as against the expected 3.9% figure and June’s 3.9% print.
Additional takeaways
China July nationwide survey-based jobless rate at 5.2%.
ChinaJjuly survey-based jobless rate in 31 major cities at 5.3%.
AUD/USD reaction to Chinese data
The mixed Chinese data dump stalls the renewed upside in the Australian Dollar, with AUD/USD off highs still defending 0.6600. The pair is up 0.14% on the day, as of writing.
Australian Dollar FAQs
One of the most significant factors for the Australian Dollar (AUD) is the level of interest rates set by the Reserve Bank of Australia (RBA). Because Australia is a resource-rich country another key driver is the price of its biggest export, Iron Ore. The health of the Chinese economy, its largest trading partner, is a factor, as well as inflation in Australia, its growth rate and Trade Balance. Market sentiment – whether investors are taking on more risky assets (risk-on) or seeking safe-havens (risk-off) – is also a factor, with risk-on positive for AUD.
The Reserve Bank of Australia (RBA) influences the Australian Dollar (AUD) by setting the level of interest rates that Australian banks can lend to each other. This influences the level of interest rates in the economy as a whole. The main goal of the RBA is to maintain a stable inflation rate of 2-3% by adjusting interest rates up or down. Relatively high interest rates compared to other major central banks support the AUD, and the opposite for relatively low. The RBA can also use quantitative easing and tightening to influence credit conditions, with the former AUD-negative and the latter AUD-positive.
China is Australia’s largest trading partner so the health of the Chinese economy is a major influence on the value of the Australian Dollar (AUD). When the Chinese economy is doing well it purchases more raw materials, goods and services from Australia, lifting demand for the AUD, and pushing up its value. The opposite is the case when the Chinese economy is not growing as fast as expected. Positive or negative surprises in Chinese growth data, therefore, often have a direct impact on the Australian Dollar and its pairs.
Iron Ore is Australia’s largest export, accounting for $118 billion a year according to data from 2021, with China as its primary destination. The price of Iron Ore, therefore, can be a driver of the Australian Dollar. Generally, if the price of Iron Ore rises, AUD also goes up, as aggregate demand for the currency increases. The opposite is the case if the price of Iron Ore falls. Higher Iron Ore prices also tend to result in a greater likelihood of a positive Trade Balance for Australia, which is also positive of the AUD.
The Trade Balance, which is the difference between what a country earns from its exports versus what it pays for its imports, is another factor that can influence the value of the Australian Dollar. If Australia produces highly sought after exports, then its currency will gain in value purely from the surplus demand created from foreign buyers seeking to purchase its exports versus what it spends to purchase imports. Therefore, a positive net Trade Balance strengthens the AUD, with the opposite effect if the Trade Balance is negative.
- USD/CAD extends recovery 1.3715 in Thursday’s Asian session.
- The US CPI inflation dropped to 2.9% YoY in July from 3% in June, softer than expected.
- Lower crude oil prices weigh on the commodity-linked Canadian Dollar.
The USD/CAD pair trades on a stronger note near 1.3715 on Thursday during the Asian trading hours. The decline in crude oil prices drags the commodity-linked Canadian Dollar (CAD) lower and lifts USD/CAD. Amid the lack of top-tier economic data from Canada, the pair remains at the mercy of USD price dynamics. The US Retail Sales will be the highlight on Thursday.
The US Consumer Price Index (CPI) inflation report indicated that price pressures are on track to return to the Federal Reserve (Fed) 2% target. Nonetheless, the speculation of a deeper rate cut from the Fed has eased. According to the CME FedWatch Tool, traders have priced in nearly a 41% possibility of a 50 basis points (bps) rate cut by the Fed in September, down from 50% before the US CPI data. This, in turn, provides modest support to the Greenback.
Data released by the Labor Department on Wednesday revealed that the US headline CPI inflation eased to 2.9% YoY in July from 3% in June. This figure was below the market consensus. The Core CPI, excluding food and energy, climbed 3.2% YoY following a rise of 3.3% seen in July, in line with the market forecast.
On the CAD’s front, many economists see the Bank of Canada (BoC) cut more interest rates at each of the three policy-setting meetings it has left in 2024, starting in the September meeting. This could weigh on the Loonie in the near term. Additionally, lower crude oil prices are likely to undermine the CAD for the time being, as Canada is the leading exporter of Oil to the United States.
Canadian Dollar FAQs
The key factors driving the Canadian Dollar (CAD) are the level of interest rates set by the Bank of Canada (BoC), the price of Oil, Canada’s largest export, the health of its economy, inflation and the Trade Balance, which is the difference between the value of Canada’s exports versus its imports. Other factors include market sentiment – whether investors are taking on more risky assets (risk-on) or seeking safe-havens (risk-off) – with risk-on being CAD-positive. As its largest trading partner, the health of the US economy is also a key factor influencing the Canadian Dollar.
The Bank of Canada (BoC) has a significant influence on the Canadian Dollar by setting the level of interest rates that banks can lend to one another. This influences the level of interest rates for everyone. The main goal of the BoC is to maintain inflation at 1-3% by adjusting interest rates up or down. Relatively higher interest rates tend to be positive for the CAD. The Bank of Canada can also use quantitative easing and tightening to influence credit conditions, with the former CAD-negative and the latter CAD-positive.
The price of Oil is a key factor impacting the value of the Canadian Dollar. Petroleum is Canada’s biggest export, so Oil price tends to have an immediate impact on the CAD value. Generally, if Oil price rises CAD also goes up, as aggregate demand for the currency increases. The opposite is the case if the price of Oil falls. Higher Oil prices also tend to result in a greater likelihood of a positive Trade Balance, which is also supportive of the CAD.
While inflation had always traditionally been thought of as a negative factor for a currency since it lowers the value of money, the opposite has actually been the case in modern times with the relaxation of cross-border capital controls. Higher inflation tends to lead central banks to put up interest rates which attracts more capital inflows from global investors seeking a lucrative place to keep their money. This increases demand for the local currency, which in Canada’s case is the Canadian Dollar.
Macroeconomic data releases gauge the health of the economy and can have an impact on the Canadian Dollar. Indicators such as GDP, Manufacturing and Services PMIs, employment, and consumer sentiment surveys can all influence the direction of the CAD. A strong economy is good for the Canadian Dollar. Not only does it attract more foreign investment but it may encourage the Bank of Canada to put up interest rates, leading to a stronger currency. If economic data is weak, however, the CAD is likely to fall.
- The Australian Dollar recovers daily losses after the release of the moderate jobs data.
- The commodity-linked AUD faced challenges as reduced demand and a surplus of commodities put pressure on market prices.
- The US Dollar experienced losses following a moderate Consumer Price Index data released on Wednesday.
The Australian Dollar (AUD) recovers its intraday losses following the moderate employment data release on Thursday. However, the Aussie Dollar faced challenges against the US Dollar (USD) due to declining copper and iron ore prices. The drop is exacerbated by worsening credit data from China, which, combined with reduced demand and a surplus of commodities, has put further pressure on the markets. However,
The AUD/USD pair is under downward pressure as investors evaluate the Reserve Bank of Australia's (RBA) monetary policy stance. Despite elevated wage growth in the second quarter, which has kept the RBA's outlook hawkish, RBA Governor Michele Bullock has dismissed any possibility of rate cuts in the next six months. Bullock stressed that the Australian central bank remains vigilant about inflation risks and is prepared to increase rates further if needed.
The US Dollar faces challenges after Wednesday's Consumer Price Index (CPI) data showed a moderate increase in July's annual US inflation rate. Investors are likely debating how much the Federal Reserve (Fed) will cut rates in September. While traders are leaning towards a more modest 25 basis point reduction, with a 60% probability, a 50 basis point cut remains a possibility. According to CME FedWatch, there is a 36% chance of the larger cut occurring in September.
Daily Digest Market Movers: Australian Dollar edges higher after jobs data
- Australian Employment Change is reported at 58.2K for July, surpassing the expected 20.0K and the previous reading of 52.3K. However, the Unemployment Rate increased to 4.2%, exceeding the market expectation of remaining steady at 4.1%. Additionally, Consumer Inflation Expectations for August rose to 4.5%, up from the prior reading of 4.3%.
- Federal Reserve Bank of Chicago President Austan Goolsbee expressed growing concern on Wednesday about the labor market rather than inflation, noting recent improvements in price pressures alongside weak jobs data. Goolsbee added that the extent of rate cuts will be determined by the prevailing economic conditions, per Bloomberg.
- US headline Consumer Price Index (CPI) rose 2.9% year-over-year in July, slightly down from the 3% increase in June and below market expectations. The Core CPI, which excludes food and energy, climbed 3.2% year-over-year, a slight decrease from the 3.3% rise in June but aligned with market forecasts.
- On Tuesday, Atlanta Fed President Raphael Bostic stated that recent economic data has increased his confidence that the Fed can achieve its 2% inflation target. However, Bostic indicated that additional evidence is required before he would support a reduction in interest rates, according to Reuters.
- The US Producer Price Index (PPI) rose 2.2% YoY in July from 2.7% in June, falling short of the market expectation of 2.3%. Meanwhile, the Core PPI rose by 2.4% year-on-year in July, against the previous reading of 3.0%. The index fell short of an estimate of 2.7%. The Core PPI remained unchanged.
- Australia's Westpac Consumer Confidence rose by 2.8% in August, swinging from a 1.1% fall in July. Meanwhile, the Wage Price Index remained steady with a 0.8% rise in the second quarter, slightly below the market expectation of a 0.9% increase.
- On Monday, Reserve Bank of Australia (RBA) Deputy Governor Andrew Hauser attributed persistent inflation to weaker supply and a tight labor market. Hauser also noted that economic forecasts are surrounded by significant uncertainty.
- On Sunday, Federal Reserve Governor Michelle Bowman stated that she continues to see upside risks for inflation and ongoing strength in the labor market. This suggests that the Fed may not be prepared to cut rates at their next meeting in September, according to Bloomberg.
Technical Analysis: Australian Dollar falls to near 0.6600
The Australian Dollar trades around 0.6590 on Thursday. The daily chart analysis indicates that the AUD/USD pair tests the lower boundary of an ascending channel, which suggests a weakening bullish bias. Additionally, the 14-day Relative Strength Index (RSI) is positioned slightly below the 50 level, confirming the reinforcement of a bearish momentum.
In terms of support, the lower boundary of the ascending channel around 0.6590 serves as an immediate support level for the AUD/USD pair. A break below this level could lead to testing the nine-day Exponential Moving Average (EMA) at 0.6580, followed by the throwback level at 0.6575. If the pair falls below this support region, it could reinforce a bearish outlook, potentially driving it toward the throwback level at 0.6470.
On the upside, the AUD/USD pair might explore the area around the upper boundary of the ascending channel at the 0.6690 level. A breakout above this level could push the pair toward its six-month high of 0.6798, reached on July 11.
AUD/USD: Daily Chart
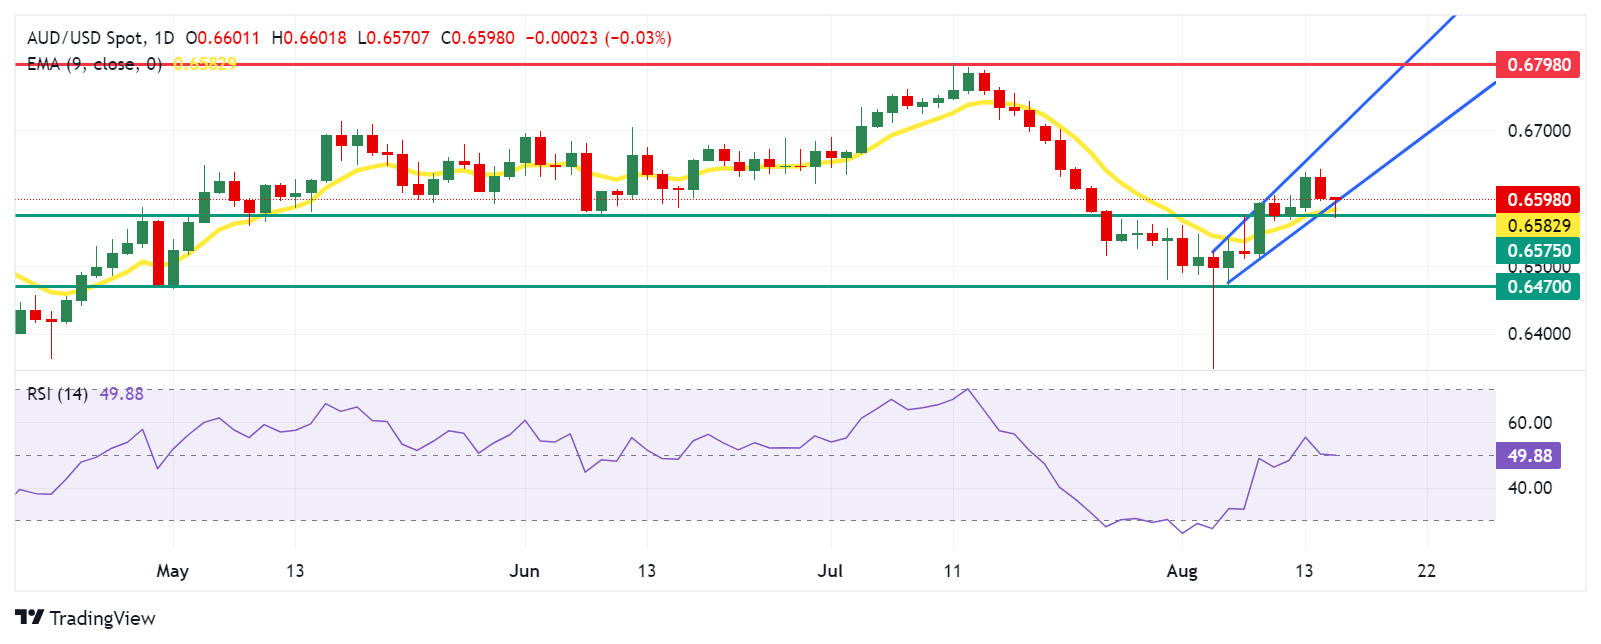
Australian Dollar PRICE Today
The table below shows the percentage change of Australian Dollar (AUD) against listed major currencies today. Australian Dollar was the strongest against the Swiss Franc.
| USD | EUR | GBP | JPY | CAD | AUD | NZD | CHF | |
|---|---|---|---|---|---|---|---|---|
| USD | 0.06% | 0.02% | 0.12% | 0.02% | -0.11% | 0.23% | 0.03% | |
| EUR | -0.06% | -0.05% | 0.05% | -0.04% | -0.26% | -0.01% | -0.03% | |
| GBP | -0.02% | 0.05% | 0.11% | 0.01% | -0.20% | 0.05% | 0.12% | |
| JPY | -0.12% | -0.05% | -0.11% | -0.12% | -0.27% | -0.05% | -0.00% | |
| CAD | -0.02% | 0.04% | -0.01% | 0.12% | -0.14% | 0.04% | 0.11% | |
| AUD | 0.11% | 0.26% | 0.20% | 0.27% | 0.14% | 0.24% | 0.31% | |
| NZD | -0.23% | 0.01% | -0.05% | 0.05% | -0.04% | -0.24% | 0.07% | |
| CHF | -0.03% | 0.03% | -0.12% | 0.00% | -0.11% | -0.31% | -0.07% |
The heat map shows percentage changes of major currencies against each other. The base currency is picked from the left column, while the quote currency is picked from the top row. For example, if you pick the Australian Dollar from the left column and move along the horizontal line to the US Dollar, the percentage change displayed in the box will represent AUD (base)/USD (quote).
RBA FAQs
The Reserve Bank of Australia (RBA) sets interest rates and manages monetary policy for Australia. Decisions are made by a board of governors at 11 meetings a year and ad hoc emergency meetings as required. The RBA’s primary mandate is to maintain price stability, which means an inflation rate of 2-3%, but also “..to contribute to the stability of the currency, full employment, and the economic prosperity and welfare of the Australian people.” Its main tool for achieving this is by raising or lowering interest rates. Relatively high interest rates will strengthen the Australian Dollar (AUD) and vice versa. Other RBA tools include quantitative easing and tightening.
While inflation had always traditionally been thought of as a negative factor for currencies since it lowers the value of money in general, the opposite has actually been the case in modern times with the relaxation of cross-border capital controls. Moderately higher inflation now tends to lead central banks to put up their interest rates, which in turn has the effect of attracting more capital inflows from global investors seeking a lucrative place to keep their money. This increases demand for the local currency, which in the case of Australia is the Aussie Dollar.
Macroeconomic data gauges the health of an economy and can have an impact on the value of its currency. Investors prefer to invest their capital in economies that are safe and growing rather than precarious and shrinking. Greater capital inflows increase the aggregate demand and value of the domestic currency. Classic indicators, such as GDP, Manufacturing and Services PMIs, employment, and consumer sentiment surveys can influence AUD. A strong economy may encourage the Reserve Bank of Australia to put up interest rates, also supporting AUD.
Quantitative Easing (QE) is a tool used in extreme situations when lowering interest rates is not enough to restore the flow of credit in the economy. QE is the process by which the Reserve Bank of Australia (RBA) prints Australian Dollars (AUD) for the purpose of buying assets – usually government or corporate bonds – from financial institutions, thereby providing them with much-needed liquidity. QE usually results in a weaker AUD.
Quantitative tightening (QT) is the reverse of QE. It is undertaken after QE when an economic recovery is underway and inflation starts rising. Whilst in QE the Reserve Bank of Australia (RBA) purchases government and corporate bonds from financial institutions to provide them with liquidity, in QT the RBA stops buying more assets, and stops reinvesting the principal maturing on the bonds it already holds. It would be positive (or bullish) for the Australian Dollar.
Australia’s Unemployment Rate rose to 4.2% in July, compared with the expectations and the previous figure of 4.1%, according to the official data released by the Australian Bureau of Statistics (ABS) on Thursday.
Furthermore, the Australian Employment Change arrived at 58.2K in July from 50.2K in June, compared with the consensus forecast of 20.0K.
The participation rate in Australia increased to 67.1% in July, compared to 66.9% in June. Meanwhile, Full-Time Employment increased by 60.5K in the same period from 43.3K in the previous reading. The Part-Time Employment decreased by 2.3K in July versus 6.8K prior.
AUD/USD reaction to the Australia Employment report
The Australian Dollar edges higher in an immediate reaction to the mixed Australia Employment report. The AUD/USD pair is trading at 0.6595, down 0.06% on the day.
Employment FAQs
Labor market conditions are a key element in assessing the health of an economy and thus a key driver for currency valuation. High employment, or low unemployment, has positive implications for consumer spending and economic growth, boosting the value of the local currency. Moreover, a very tight labor market – a situation in which there is a shortage of workers to fill open positions – can also have implications on inflation levels because low labor supply and high demand leads to higher wages.
The pace at which salaries are growing in an economy is key for policymakers. High wage growth means that households have more money to spend, usually leading to price increases in consumer goods. In contrast to more volatile sources of inflation such as energy prices, wage growth is seen as a key component of underlying and persisting inflation as salary increases are unlikely to be undone. Central banks around the world pay close attention to wage growth data when deciding on monetary policy.
The weight that each central bank assigns to labor market conditions depends on its objectives. Some central banks explicitly have mandates related to the labor market beyond controlling inflation levels. The US Federal Reserve (Fed), for example, has the dual mandate of promoting maximum employment and stable prices. Meanwhile, the European Central Bank’s (ECB) sole mandate is to keep inflation under control. Still, and despite whatever mandates they have, labor market conditions are an important factor for policymakers given their significance as a gauge of the health of the economy and their direct relationship to inflation.
The People’s Bank of China (PBOC) set the USD/CNY central rate for the trading session ahead on Thursday at 7.1399, as against the previous day's fix of 7.1415 and 7.1461 Reuters estimates.
- USD/JPY extends its sideways consolidative price move in a one-week-old trading range.
- The BoJ rate-hike uncertainty and a positive risk tone undermine the JPY, lending support.
- Bets for bigger Fed rate cuts keep the USD bulls on the defensive and act as a headwind.
The USD/JPY pair struggles to capitalize on the previous day's goodish rebound from the 146.00 round figure, or the weekly low and oscillates in a narrow trading band during the Asian session on Thursday. Spot prices, however, hold comfortably above the 147.00 mark and remain confined in a one-week-old range as traders await fresh catalysts before positioning for a firm near-term direction.
The uncertainty over the likely timing of when the Bank of Japan (BoJ) will hike interest rates again is holding traders back from placing aggressive bets and leading to the USD/JPY pair's range-bound price action. In fact, the Japanese central bank lifted the key interest rate to around 0.25%, or the highest since 2008, at the end of the July policy meeting and outlined a plan to taper its bond-buying program.
Adding to this, BoJ Governor Kazuo Ueda said that the central bank will keep raising rates, and adjust the degree of easing if the current economic and price outlook is realized. The view was echoed by the summary of opinions from the July BoJ policy meeting. That said, BoJ Deputy Governor Shinichi Uchida played down the chances of a near-term rate hike amid the recent volatility in the financial markets.
Apart from this, a generally positive risk tone undermines demand for the safe-haven JPY and continues to offer some support to the USD/JPY pair. The upside, however, remains capped in the wake of bets for bigger interest rate cuts by the Federal Reserve (Fed), bolstered by signs of cooling inflationary pressures in the US, which keeps the USD bulls on the defensive and acts as a headwind.
Moving ahead, investors now look forward to the US economic docket – featuring the release of monthly Retail Sales figures, the usual Weekly Initial Jobless Claims, the Empire State Manufacturing Index and the Philly Fed Manufacturing Index. Apart from this, the US bond yields will drive the USD, which, along with the broader risk sentiment, should provide some impetus to the USD/JPY pair.
Bank of Japan FAQs
The Bank of Japan (BoJ) is the Japanese central bank, which sets monetary policy in the country. Its mandate is to issue banknotes and carry out currency and monetary control to ensure price stability, which means an inflation target of around 2%.
The Bank of Japan has embarked in an ultra-loose monetary policy since 2013 in order to stimulate the economy and fuel inflation amid a low-inflationary environment. The bank’s policy is based on Quantitative and Qualitative Easing (QQE), or printing notes to buy assets such as government or corporate bonds to provide liquidity. In 2016, the bank doubled down on its strategy and further loosened policy by first introducing negative interest rates and then directly controlling the yield of its 10-year government bonds.
The Bank’s massive stimulus has caused the Yen to depreciate against its main currency peers. This process has exacerbated more recently due to an increasing policy divergence between the Bank of Japan and other main central banks, which have opted to increase interest rates sharply to fight decades-high levels of inflation. The BoJ’s policy of holding down rates has led to a widening differential with other currencies, dragging down the value of the Yen.
A weaker Yen and the spike in global energy prices have led to an increase in Japanese inflation, which has exceeded the BoJ’s 2% target. With wage inflation becoming a cause of concern, the BoJ looks to move away from ultra loose policy, while trying to avoid slowing the activity too much.
- Gold price posts modest gains around $2,450 in Thursday’s early Asian session.
- The US CPI inflation rose as expected in July.
- Any signs of rising geopolitical tensions might lift safe-haven assets like Gold.
Gold price (XAU/USD) edges higher to nearly $2,450, snapping the two-day losing streak during the early Asian session on Thursday. The weaker US Dollar (USD) provides some support for the precious metal on the day. Investors will take more cues from US Retail Sales, weekly Initial Jobless Claims, the Philly Fed Manufacturing Index and Industrial Production, which are due later on Thursday.
Data released by the Labor Department on Wednesday showed that inflation in the US rose as expected in July. The headline Consumer Price Index (CPI) increased 0.2% MoM in July, putting an annual inflation rate at 2.9%. Meanwhile, the core CPI, excluding food and energy, came in at a 0.2% MoM in July and a 3.2% annual rate, which is in line with the consensus.
“Expectations now have shifted back in favour of just a 25 basis point cut, so that could be taking some of the momentum away from the gold market,” said Phillip Streible, chief market strategist at Blue Line Futures. The markets are now pricing in nearly a 41% chance of a 50 basis points (bps) rate cut by the Fed in September, down from 50% prior to the release of US CPI data, according to the CME FedWatch Tool.
The Federal Reserve (Fed) officials indicated a willingness to ease the policy, though they’ve been careful not to commit to a specific timetable and the pace of rate cuts. Atlanta Fed President Raphael Bostic said on Tuesday he wanted to see more evidence before supporting lower interest rates.
On the other hand, the ongoing geopolitical tensions and economic uncertainty might boost the safe-haven flows, benefiting the yellow metal. Iran dismissed calls from the United Kingdom and other Western nations to refrain from retaliating against Israel after the assassination of Hamas leader Ismail Haniyeh in Tehran last month, according to the BBC.
Gold FAQs
Gold has played a key role in human’s history as it has been widely used as a store of value and medium of exchange. Currently, apart from its shine and usage for jewelry, the precious metal is widely seen as a safe-haven asset, meaning that it is considered a good investment during turbulent times. Gold is also widely seen as a hedge against inflation and against depreciating currencies as it doesn’t rely on any specific issuer or government.
Central banks are the biggest Gold holders. In their aim to support their currencies in turbulent times, central banks tend to diversify their reserves and buy Gold to improve the perceived strength of the economy and the currency. High Gold reserves can be a source of trust for a country’s solvency. Central banks added 1,136 tonnes of Gold worth around $70 billion to their reserves in 2022, according to data from the World Gold Council. This is the highest yearly purchase since records began. Central banks from emerging economies such as China, India and Turkey are quickly increasing their Gold reserves.
Gold has an inverse correlation with the US Dollar and US Treasuries, which are both major reserve and safe-haven assets. When the Dollar depreciates, Gold tends to rise, enabling investors and central banks to diversify their assets in turbulent times. Gold is also inversely correlated with risk assets. A rally in the stock market tends to weaken Gold price, while sell-offs in riskier markets tend to favor the precious metal.
The price can move due to a wide range of factors. Geopolitical instability or fears of a deep recession can quickly make Gold price escalate due to its safe-haven status. As a yield-less asset, Gold tends to rise with lower interest rates, while higher cost of money usually weighs down on the yellow metal. Still, most moves depend on how the US Dollar (USD) behaves as the asset is priced in dollars (XAU/USD). A strong Dollar tends to keep the price of Gold controlled, whereas a weaker Dollar is likely to push Gold prices up.
| Index | Change, points | Closed | Change, % |
|---|---|---|---|
| NIKKEI 225 | 209.92 | 36442.43 | 0.58 |
| Hang Seng | -60.7 | 17113.36 | -0.35 |
| KOSPI | 23 | 2644.5 | 0.88 |
| ASX 200 | 23.9 | 7850.7 | 0.31 |
| DAX | 73.55 | 17885.6 | 0.41 |
| CAC 40 | 57.49 | 7333.36 | 0.79 |
| Dow Jones | 242.75 | 40008.39 | 0.61 |
| S&P 500 | 20.78 | 5455.21 | 0.38 |
| NASDAQ Composite | 4.99 | 17192.6 | 0.03 |
| Pare | Closed | Change, % |
|---|---|---|
| AUDUSD | 0.65956 | -0.57 |
| EURJPY | 162.108 | 0.41 |
| EURUSD | 1.10097 | 0.14 |
| GBPJPY | 188.868 | -0.01 |
| GBPUSD | 1.28277 | -0.28 |
| NZDUSD | 0.59982 | -1.25 |
| USDCAD | 1.37133 | 0.06 |
| USDCHF | 0.86512 | 0.07 |
| USDJPY | 147.223 | 0.26 |


© 2000-2024. Sva prava zaštićena.
Sajt je vlasništvo kompanije Teletrade D.J. LLC 2351 LLC 2022 (Euro House, Richmond Hill Road, Kingstown, VC0100, St. Vincent and the Grenadines).
Svi podaci koji se nalaze na sajtu ne predstavljaju osnovu za donošenje investicionih odluka, već su informativnog karaktera.
The company does not serve or provide services to customers who are residents of the US, Canada, Iran, The Democratic People's Republic of Korea, Yemen and FATF blacklisted countries.
Izvršenje trgovinskih operacija sa finansijskim instrumentima upotrebom marginalne trgovine pruža velike mogućnosti i omogućava investitorima ostvarivanje visokih prihoda. Međutim, takav vid trgovine povezan je sa potencijalno visokim nivoom rizika od gubitka sredstava. Проведение торговых операций на финанcовых рынках c маржинальными финанcовыми инcтрументами открывает широкие возможноcти, и позволяет инвеcторам, готовым пойти на риcк, получать выcокую прибыль, но при этом неcет в cебе потенциально выcокий уровень риcка получения убытков. Iz tog razloga je pre započinjanja trgovine potrebno odlučiti o izboru odgovarajuće investicione strategije, uzimajući u obzir raspoložive resurse.
Upotreba informacija: U slučaju potpunog ili delimičnog preuzimanja i daljeg korišćenja materijala koji se nalazi na sajtu, potrebno je navesti link odgovarajuće stranice na sajtu kompanije TeleTrade-a kao izvora informacija. Upotreba materijala na internetu mora biti praćena hiper linkom do web stranice teletrade.org. Automatski uvoz materijala i informacija sa stranice je zabranjen.
Ako imate bilo kakvih pitanja, obratite nam se pr@teletrade.global.
транcфери