- Analiza
- Novosti i instrumenti
- Vesti sa tržišta
Forex-novosti i prognoze od 15-08-2019
| Time | Country | Event | Period | Previous value | Forecast |
|---|---|---|---|---|---|
| 09:00 | Eurozone | Trade balance unadjusted | June | 23 | 16.3 |
| 12:30 | Canada | Foreign Securities Purchases | June | 10.2 | |
| 12:30 | U.S. | Building Permits | July | 1.22 | 1.27 |
| 12:30 | U.S. | Housing Starts | July | 1.253 | 1.257 |
| 14:00 | U.S. | Reuters/Michigan Consumer Sentiment Index | August | 98.4 | 97.2 |
| 17:00 | U.S. | Baker Hughes Oil Rig Count | August | 764 |
Major US stocks rose predominantly as strong retail sales data and Walmart's above-quarter results eased concerns about the recession, but China's mixed statements and Cisco's disappointing outlook kept investors in suspense.
The Commerce Department said retail sales rose 0.7% last month after rising 0.3% in June as consumers bought a range of products, even though they cut back on car purchases. Economists had forecast sales to rise 0.3% in July. Compared to July last year, retail sales grew by 3.4%.
China's Treasury Department said it would respond to US $ 300 billion worth of recent Chinese tariffs for China. However, a Chinese Foreign Ministry spokeswoman said Beijing “hopes that the US will meet China and enforce the compromise reached between the two leaders at their meeting in Osaka. ”
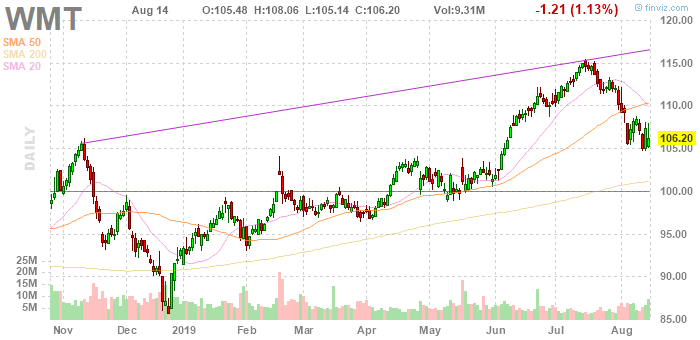
Shares of Walmart Inc (WMT) jumped 6.29% after posting a quarterly report in which the company announced that it received adjusted quarterly earnings of $ 1.27 per share, which was $ 0.05 per share higher than analysts forecast. The retailer’s revenue also slightly exceeded Wall Street’s expectations. Comparable company sales in the US grew by 2.8% against the consensus forecast of analysts surveyed by Refinitiv, at + 2.4%. Walmart also raised its forecast for sales and profit for the whole year.
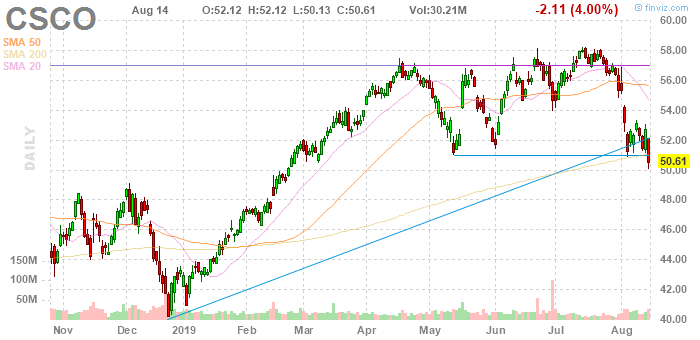
At the same time, shares of Cisco Systems Inc (CSCO) fell 8.64%, having a negative impact on all three major indexes after the publication of the forecast for the next quarter. The company said that in the first quarter of 2020, FG expect to earn $ 0.80-0.82 per share (against the average forecast of analysts at $ 0.83) with a revenue of $ 12.68-12.93 billion (against the average forecast of analysts at $ 13.41 billion).
Most DOW components completed trading in positive territory (19 out of 30). The biggest gainers were Walmart Inc. (WMT, + 6.29%). Outsiders were shares of Cisco Systems, Inc. (CSCO, -8.64%).
Most S&P sectors recorded an increase. The utilities sector grew the most (+ 0.9%). The conglomerate sector showed the largest decrease (-0.8%).
At the time of closing:
Dow 25,578.98 +99.56 +0.39%
S&P 500 2,847.59 +6.99 +0.25%
Nasdaq 100 7,766.62 -7.32 -0.09%
| Time | Country | Event | Period | Previous value | Forecast |
|---|---|---|---|---|---|
| 09:00 | Eurozone | Trade balance unadjusted | June | 23 | 16.3 |
| 12:30 | Canada | Foreign Securities Purchases | June | 10.2 | |
| 12:30 | U.S. | Building Permits | July | 1.22 | 1.27 |
| 12:30 | U.S. | Housing Starts | July | 1.253 | 1.257 |
| 14:00 | U.S. | Reuters/Michigan Consumer Sentiment Index | August | 98.4 | 97.2 |
| 17:00 | U.S. | Baker Hughes Oil Rig Count | August | 764 |
Expansion in
Philadelphia-area manufacturing activity slows in August
The
Manufacturing Business Outlook Survey, released by the Federal Reserve Bank of
Philadelphia on Thursday, revealed the expansion in the region's manufacturing
activity slowed in August.
According to
the survey, the diffusion index for current general activity fell from 16.8 in
July to 21.8 this month.
Economists had
forecast the index to decrease to 10.0 last month.
A reading above
0 signals expansion, while a reading below 0 indicates contraction.
The August decline
in the headline index was due to decreases in the employment index (-26.4
points to 3.6 in August, its lowest reading since November 2016), the shipments
index (-5.9 points to 19) and delivery times index (-5.7 points to 9.3). Meanwhile,
the new orders (+6.9 points to 25.8), the unfilled orders (+5.4 points to 9.1) and
the inventories (+0.6 points to 8.7) indexes posted gains.
On the price
front, the prices paid index rose this month, while prices received index fell.
Manufacturing
activity in the New York region improves modestly in August
The report from
the New York Federal Reserve showed on Thursday that manufacturing activity in
the New York region improved modestly in August.
According to
the survey, NY Fed Empire State manufacturing index came in at 4.80 this month
compared to an unrevised 4.30 in July, pointing to two months of modest growth
after a brief decline in activity in June.
Economists had
expected the index to come in at 3.0.
Anything below
zero signals contraction.
According to
the report, the new orders index came in at +6.7, returning into positive territory
after declining for the prior two months, while the shipments index rose slightly
to 9.3, pointing to an increase in shipments. Meanwhile, unfilled orders
dropped for a third consecutive month, delivery times were steady, and
inventories increased for the first time since April. The index for number of
employees was slightly below zero at -1.6, pointing to ongoing sluggishness in employment
levels. On the price front, input prices rose at a slightly slower pace than last
month, and selling price increases were little changed.
- Says the slowing global economy will see the ECB roll out fresh stimulus measures that should include “substantial and sufficient” bond purchases as well as cuts to the bank’s key interest rate
- It’s important that we come up with a significant and impactful policy package in September
- When you’re working with financial markets, it’s often better to overshoot than undershoot, and better to have a very strong package of policy measures than to tinker
The Commerce
Department announced on Thursday that business inventories remained unchanged
m-o-m in June, following an unrevised 0.3 percent m-o-m increase in May.
That was below
economists’ forecast of a 0.1 percent m-o-m uptick.
According to
the report, retail inventories declined 0.3 percent m-o-m in June, while wholesale
inventories were flat m-o-m and stocks at manufacturers rose 0.2 percent m-o-m.
Retail
inventories excluding autos, which go into the calculation of GDP, edged down
0.1 percent m-o-m, the same pace as in the prior month.
In y-o-y terms,
business inventories climbed 5.2 percent in June.
The National
Association of Homebuilders (NAHB) announced on Thursday its housing market
index (HMI) rose one point to 66 in August.
Economists had
forecast the HMI to stay at 65.
A reading over
50 indicates more builders view conditions as good than poor.
Two out of the
three HMI components were higher this month. The indicator gauging current
sales conditions increased two points to 72 and the component measuring traffic
of prospective buyers moved up two points to 50. Meanwhile, the measure
charting sales expectations in the next six months dropped one point to 70.
NAHB Chairman
Greg Ugalde said: “Even as builders report a firm demand for single-family
homes, they continue to struggle with rising construction costs stemming from
excessive regulations, a chronic shortage of workers and a lack of buildable
lots.”
Meanwhile, NAHB
Chief Economist Robert Dietz noted: “While 30-year mortgage rates have dropped
from 4.1% down to 3.6% during the past four months, we have not seen an
equivalent higher pace of building activity because the rate declines occurred
due to economic uncertainty stemming largely from growing trade concerns. Although
affordability headwinds remain a challenge, demand is good and growing at lower
price points and for smaller homes.”
The preliminary
data from the U.S. Labour Department showed on Thursday that nonfarm business
sector labor productivity in the United States increased 2.3 percent q-o-q in
the second quarter of 2019, as output advanced 1.9 percent q-o-q and hours
worked fell 0.4 percent q-o-q (seasonally adjusted).
That was above
economists’ forecast for a 1.5 percent q-o-q gain after a revised 3.5 percent
q-o-q increase in the first quarter (originally a 3.4 percent q-o-q surge).
In y-o-y terms,
the labor productivity rose 1.8 percent in the second quarter, reflecting a 2.6-percent
jump in output and a 0.8-percent advance in hours worked.
Meanwhile, unit
labor costs in the nonfarm business sector in the second quarter rose 2.4 percent
q-o-q compared to a revised 5.5 percent q-o-q surge in the prior quarter (originally
a 1.6 percent q-o-q drop).
Economists had
forecast a 1.7 percent gain in second-quarter unit labor costs.
Unit labor
costs quarterly increase reflected primarily a 4.8-percent climb in hourly
compensation and a 2.3-percent advance in labor productivity.
Compared to the
corresponding period of 2018, unit labor costs rose 2.5 percent.
The Federal
Reserve reported on Thursday that the U.S. industrial production fell 0.2 m-o-m
in July, following a revised 0.2 percent m-o-m gain in June (originally flat
m-o-m).
Economists had
forecast industrial production would increase 0.1 percent m-o-m in July.
According to
the report, the mining output fell 1.8 percent m-o-m in July, as Hurricane
Barry caused a sharp but temporary decline in oil extraction in the Gulf of
Mexico. Meanwhile, the output of utilities rose 3.1 percent m-o-m, while the manufacturing
production slid 0.4 percent m-o-m.
Capacity
utilization for the industrial sector decreased 0.3 percentage point m-o-m in July
to 77.5 percent. That was 0.3 percentage point below economists’ forecast and 2.3
percentage points below its long-run (1972-2018) average.
In y-o-y terms,
the industrial output rose 0.5 percent in July, following a revised 1.1 percent
advance in the prior month (originally a gain of 1.3 percent).
U.S. stock-index futures rose on Thursday following upbeat data on U.S. retail sales and indications that Chinese negotiators may be willing to compromise with the U.S. on trade issues.
Global Stocks:
Index/commodity | Last | Today's Change, points | Today's Change, % |
Nikkei | 20,405.65 | -249.48 | -1.21% |
Hang Seng | 25,495.46 | +193.18 | +0.76% |
Shanghai | 2,815.80 | +6.88 | +0.25% |
S&P/ASX | 6,408.10 | -187.80 | -2.85% |
FTSE | 7,082.46 | -65.42 | -0.92% |
CAC | 5,246.69 | -4.61 | -0.09% |
DAX | 11,430.90 | -61.76 | -0.54% |
Crude oil | $54.89 | -0.62% | |
Gold | $1,524.20 | -0.24% |
(company / ticker / price / change ($/%) / volume)
3M Co | MMM | 162 | -2.88(-1.75%) | 770 |
ALCOA INC. | AA | 18.65 | -0.46(-2.41%) | 12484 |
ALTRIA GROUP INC. | MO | 46.58 | -0.20(-0.43%) | 4711 |
Amazon.com Inc., NASDAQ | AMZN | 1,797.96 | -26.38(-1.45%) | 62354 |
AMERICAN INTERNATIONAL GROUP | AIG | 55.09 | -1.03(-1.84%) | 1663 |
Apple Inc. | AAPL | 204.12 | -4.85(-2.32%) | 500419 |
AT&T Inc | T | 34.68 | -0.18(-0.52%) | 32235 |
Boeing Co | BA | 329.05 | -3.81(-1.14%) | 16737 |
Caterpillar Inc | CAT | 116.35 | -2.66(-2.24%) | 16619 |
Chevron Corp | CVX | 121.1 | -1.29(-1.05%) | 4956 |
Cisco Systems Inc | CSCO | 52.2 | -0.52(-0.99%) | 48274 |
Citigroup Inc., NYSE | C | 62.75 | -2.08(-3.21%) | 132612 |
Deere & Company, NYSE | DE | 145.5 | -1.67(-1.13%) | 1097 |
Exxon Mobil Corp | XOM | 69.4 | -1.09(-1.55%) | 13256 |
Facebook, Inc. | FB | 185.5 | -2.95(-1.57%) | 129337 |
FedEx Corporation, NYSE | FDX | 159 | -1.52(-0.95%) | 1769 |
Ford Motor Co. | F | 9.16 | -0.10(-1.08%) | 113245 |
Freeport-McMoRan Copper & Gold Inc., NYSE | FCX | 9.65 | -0.24(-2.43%) | 98003 |
General Electric Co | GE | 9.23 | -0.12(-1.28%) | 336179 |
General Motors Company, NYSE | GM | 38.25 | -0.76(-1.95%) | 6380 |
Goldman Sachs | GS | 198.75 | -5.36(-2.63%) | 11824 |
Google Inc. | GOOG | 1,178.00 | -19.27(-1.61%) | 2679 |
Home Depot Inc | HD | 205.77 | -2.56(-1.23%) | 7071 |
HONEYWELL INTERNATIONAL INC. | HON | 167.69 | -0.29(-0.17%) | 787 |
Intel Corp | INTC | 46.1 | -0.74(-1.58%) | 51872 |
International Business Machines Co... | IBM | 133.83 | -1.96(-1.44%) | 5192 |
International Paper Company | IP | 39.15 | -0.40(-1.01%) | 2339 |
Johnson & Johnson | JNJ | 132.56 | -0.86(-0.64%) | 2329 |
JPMorgan Chase and Co | JPM | 106.55 | -2.79(-2.55%) | 56928 |
McDonald's Corp | MCD | 218.99 | -0.74(-0.34%) | 6096 |
Merck & Co Inc | MRK | 85.35 | -0.73(-0.85%) | 2346 |
Microsoft Corp | MSFT | 136.4 | -1.74(-1.26%) | 160628 |
Nike | NKE | 81.87 | -1.45(-1.74%) | 4473 |
Pfizer Inc | PFE | 34.97 | -0.23(-0.65%) | 17283 |
Procter & Gamble Co | PG | 116.66 | -0.59(-0.50%) | 4720 |
Starbucks Corporation, NASDAQ | SBUX | 95.75 | -0.88(-0.91%) | 8115 |
Tesla Motors, Inc., NASDAQ | TSLA | 231.7 | -3.30(-1.40%) | 92580 |
The Coca-Cola Co | KO | 53.28 | -0.22(-0.41%) | 3633 |
Twitter, Inc., NYSE | TWTR | 41.15 | -0.66(-1.58%) | 63305 |
United Technologies Corp | UTX | 127.21 | -1.74(-1.35%) | 1256 |
UnitedHealth Group Inc | UNH | 246.75 | -2.47(-0.99%) | 1260 |
Verizon Communications Inc | VZ | 56 | -0.37(-0.66%) | 6237 |
Visa | V | 175.89 | -2.72(-1.52%) | 16748 |
Wal-Mart Stores Inc | WMT | 105.67 | -1.74(-1.62%) | 20482 |
Walt Disney Co | DIS | 135.44 | -1.57(-1.15%) | 17615 |
Yandex N.V., NASDAQ | YNDX | 36.44 | -1.09(-2.90%) | 7017 |
U.S. retail
sales climb more than expected in July
The Commerce
Department announced on Thursday the sales at U.S. retailers rose 0.7 percent
m-o-m in July, following a revised 0.3 percent m-o-m advance in June (originally
a gain of 0.4 percent m-o-m), supported by higher purchases of a range of goods.
Economists had
expected total sales would increase 0.3 percent m-o-m in July.
Excluding auto,
retail sales also increased 1.0 percent m-o-m in July after a revised 0.3
percent m-o-m advance in the previous month (originally an advance of 0.4
percent m-o-m), exceeding economists’ forecast for a 0.4 percent m-o-m gain.
Meanwhile,
closely watched core retail sales, which exclude automobiles, gasoline,
building materials and food services, and are used in GDP calculations, jumped
1.0 percent m-o-m in July after an unrevised 0.7 percent m-o-m rise in June.
In y-o-y terms,
the U.S. retail sales surged 3.4 percent in July, the same pace as in the
previous month.
U.S. weekly
jobless claims rise more than expected
The data from
the Labor Department revealed on Thursday the number of applications for
unemployment benefits rose last week, but the trend continued to point to a strong
labor market conditions despite signs that economic activity was slowing.
According to
the report, the initial claims for unemployment benefits increased by 9,000 to
a seasonally adjusted 220,000 for the week ended August 10.
Economists had
expected 214,000 new claims last week.
Claims for the
prior week were revised upwardly to 211,000 from the initial estimate of 209,000.
Meanwhile, the
four-week moving average of claims went up 1,000 to 213,750 last week.
Cisco Systems (CSCO) reported Q4 FY 2019 earnings of $0.83 per share (versus $0.70 in Q4 FY 2018), beating analysts’ consensus estimate of $0.82.
The company’s quarterly revenues amounted to $13.428 bln (+4.5% y/y), generally in line with analysts’ consensus estimate of $13.392 bln.
The company also issued downside guidance for Q1 FY 2020, projecting EPS of $0.80-0.82 (versus analysts’ consensus estimate of $0.83) and revenues of +0-2% to ~$12.68-12.93 bln (versus analysts’ consensus estimate of $13.41 bln).
CSCO fell to $46.59 (-7.94%) in pre-market trading.
- Hopeful U.S. can meet China halfway on trade negotiations
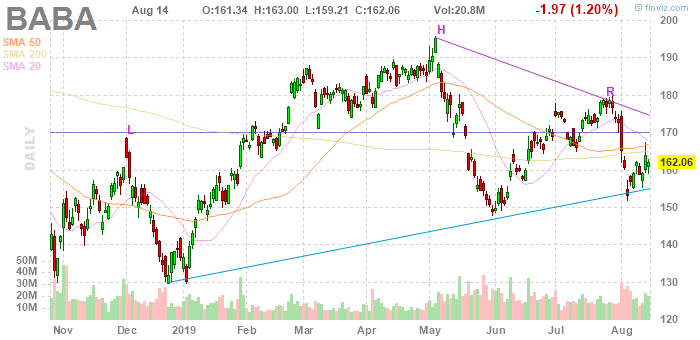
Alibaba (BABA) reported Q1 FY 2020 earnings of RMB 12.55 per share (versus RMB 1.01 in Q1 FY 2019), beating analysts’ consensus estimate of RMB 10.46.
The company’s quarterly revenues amounted to RMB 114.924 bln (+42.0% y/y), beating analysts’ consensus estimate of RMB 111.654 bln.
BABA rose to $167.40 (+3.30%) in pre-market trading.
Wal-Mart (WMT) reported Q2 FY 2020 earnings of $1.27 per share (versus $1.29 in Q2 FY 2019), beating analysts’ consensus estimate of $1.22.
The company’s quarterly revenues amounted to $130.400 bln (+2.6% y/y), generally in line with analysts’ consensus estimate of $129.318 bln.
The company also said FY 2020 adjusted EPS is now expected to range between a slight decrease and a slight increase compared with FY19 adjusted EPS. Prior guidance was down low single digits. Analysts’ consensus calls for EPS decline of 1.4%.
WMT rose to $112.83 (6.24%) in pre-market trading.
According to the report, the German government sees a "high risk" of a no-deal Brexit taking place. However, it adds that preparations for such a scenario are "largely completed".
- We can quell any HK unrest swiftly
- HK protesters' moves show signs of terrorism
FX Strategists at UOB Group believe that upside momentum in USD/JPY could pick some pace in the near term.
- "24-hour view: As we were looking for “resistance at 107.10 may come into focus” on Wed, the sharp pullback overnight was a surprise. The move saw USD give back slightly over half of its 1.4% jump the day earlier. Today, price action is likely to stay volatile but overall, we expect a wide consolidative range between 105.10 and 106.80.
- Next 1-3 weeks: Overnight, USD printed a low of 105.05 before rebounding sharply towards 107.00. The abrupt and sharp move has effectively eased all the downside pressures and upside momentum is gradually building. That said, stiff resistance is still expected at 107.00, having held back buyers for a second time on 13-Aug (last was 6-Aug). The next level above that is 107.50 and only further gains to 108.00 would warrant a ‘positive phase’. On the downside, supports are expected at 105.10 and 104.60”.
Robert Carnell, ING's Chief Economist and Head of Research, suggests that a 41K increase in employment in July does not really tally with thoughts of a near-term further easing from the RBA, or a much weaker AUD.
- "The 41K employment change is even more impressive than it first looks as 34.5K of that total was full-time employment, and only 6.7K part-time. The consensus view was for only a 14K increase (ING f +37K). We were not too surprised by this data, which we find roughly follows a negative serial correlation pattern (in short, it saw-tooths).
- The unemployment rate remained unchanged at 5.2%, but that was also well within expectations and came despite an increase in the participation rate.
- We don't rule out further easing from the RBA before the year-end, but they have done a lot already, and today's strong labour data suggest that the Fed is more likely to be easing before the RBA moves again. "
FX Strategists at UOB Group noted AUD/USD could move higher and test the 0.6800 region and above in the next weeks.
24-hour view: “As cited in yesterday’s report, “momentum has yet to turn positive and further gains may stall at its key resistance at 0.6820.” AUD touched a high of 0.6809 before turning lower. The hesitant price action indicates that AUD is not ready for a bigger move either directions. With that, expect wide consolidation between 0.6725 and 0.6815 for today”.
Next 1-3 weeks: ““Our last narrative was from 31 Jul (spot at 0.6805) was that a ‘sustained push below 0.6800 could shift focus to 0.6715’. Since then, AUD struggled to recover despite oversold conditions and on Wed, AUD tumbled to fresh lows of 0.6678. At the same time, the v-shaped recovery that followed suggested that the last of AUD bulls may have capitulated. Directional indicators though still negative are gradually turning higher. From here, improving upside momentum suggests AUD to grind higher towards its resistance at 0.6800. It has to break the 0.6845 ‘key resistance’ in order to indicate that a mid-term low is in place at 0.6678. On the downside, we expect supports at 0.6715 and 0.6680”.
The growing possibility of a no deal Brexit will present a very difficult shock for Ireland but is one its strongly growing economy is well-placed to respond to, Irish Finance Minister Paschal Donohoe said.
“I believe the possibility of a no deal Brexit taking place is clearly growing. It is a material risk in the way it perhaps wasn’t 12 months ago,” Donohoe told Ireland’s Newstalk radio station.
“It’s really important to emphasize that even in the scenario of a no deal Brexit, while it will pose a very difficult shock for our economy, we have an economy that is well capable of responding back to that, approaching such a challenge with more people working in Ireland than we ever have before.”
Erik Johannes Bruce, analyst at Nordea, notes that Norges Bank chose not to explicitly say that a hike in September is the most likely outcomes.
"Still by saying that 'Overall, new information indicates that the outlook for the policy rate for the period ahead is little changed since the June Report' it indicates that it still sees September as the most likely outcome. It means that the rate path is the best guide for the coming period and the rate path gave an 80% probability for a September hike. With no significant change in the picture, it will be a hike in September. We stick to our view for a September hike."
Says that US is violating the Xi-Trump consensus with latest tariffs decision
US actions deviate from the right way to resolve trade dispute
U.S. President Trump recently claimed Washington’s trade war with China has had little impact on the American economy so far. A widely followed economist said that the president is “dead wrong.”
Trump said in a Wednesday Twitter post that the U.S. is “winning, big, time against China,” adding that “prices to us have not gone up, and in some cases, have come down.”
However, according to Mark Zandi, chief economist at Moody’s Analytics and a frequent critic of the Republican president, the “economic costs are mounting” in the U.S. “To argue that this isn’t doing economic damage is just wrong,” Zandi told.
If Trump were to follow through on his outstanding tariff threats, Zandi said, it would incur a cost of $100 billion for American businesses and consumers in the coming year. “That’s half a percent of (gross domestic product), that’s about half the tax cut that Americans got last year,” the economist said. “That’s very significant.”
At some point, Zandi said, Trump is likely to realize that the hard-line stance on China in the trade war “isn’t working” and so the president will desire a “face-saving way” out of the situation. “The question is, will (Chinese) President Xi (Jinping) give him the way out? ” Zandi asked.
According to the report from Office for National Statistics, the quantity bought in retail sales in July 2019 increased by 0.2% when compared with the previous month, with strong growth of 6.9% in non-store retailing. Economists had expected a 0.2% decrease.
Department stores’ growth increased for the first time this year with a month-on-month growth of 1.6%; this was following six consecutive months of decline.
In July 2019, online retailing accounted for 19.9% of total retailing compared with 18.9% in June 2019, with an overall growth of 12.7% when compared with the same month a year earlier.
In the three months to July 2019, the quantity bought in retail sales increased by 0.5% when compared with the previous three months, with food stores and fuel stores seeing a decline.
Year-on-year growth in the quantity bought increased by 3.3% in July 2019, with food stores being the only main sector reporting a fall at negative 0.5%. Economists had expected a 2.6% increase.
The recession alarm bell ringing in U.S. government bond markets sent investors rushing once more to haven assets, pushing the world’s stockpile of negative-yielding bonds to another record.
The market value of the Bloomberg Barclays Global Negative Yielding Debt Index closed at $16 trillion Wednesday after the key U.S. 2-year and 10-year yield curve inverted for the first time 2007 -- a move often considered a harbinger of an economic downturn.
Global bonds surged on the bearish signal as investors sought the safety of government debt. The benchmark 10-year Treasury yield dropped below 1.6% and the 30-year equivalent fell to its lowest on record.
Strategists are increasingly speculating Treasury yields could join the below-zero club, something former Federal Reserve Chairman Alan Greenspan said wouldn’t be that big of a deal.
In light of the recent price action, the Aussie Dollar could attempt some consolidation/correction in the short term, according to Karen Jones, Team Head FICC Technical Analysis at Commerzbank.
“AUD/USD remains on the defensive near term, it has not overcome any resistance of note and continues to weigh on the downside. The market has recently eroded the .6738 January 2019 low and .6720, the 2016- 2019 support line (connects the lows) BUT did not CLOSE below here. This move however looks exhaustive and we would allow for some consolidation/correction near term. Rallies will need to regain the .6832 June low as an absolute minimum in order to alleviate immediate downside pressure. This resistance is reinforced at .6865 (mid May low). Above here lies .6927 55 day ma ahead of very tough band of resistance, namely .7038/63. This is the location of the 200 day ma and the 8 month downtrend. Failure at .6720 on a closing basis will suggest ongoing weakness to the 78.6% retracement at .6124 and the 2008 low at .6020”.
In the view of the analysts at TD Securities (TDS), the UK Retail Sales are expected to extend the rise in July. The data will be published later today at 08:30 GMT.
“We look for retail sales to rise another 0.3% m/m in July (mkt -0.2%), adding to the 0.9% gain in June. While the economy has slowed due to Brexit uncertainty, consumer spending doesn't seem to be the problem with very low unemployment and solid wage growth. Plus the weaker currency should support retail spending by tourists in the summer months. So we think that retail sales should hold up well for now.”
Fears are rising that a recession looms after a closely watched market metric flashed a warning signal, but one strategist told CNBC the supposed indicator “predicts absolutely nothing.”
The yield on the 10-year U.S. Treasury briefly broke below the 2-year rate on Wednesday stateside. That so-called inverted yield curve has historically been regarded as a precursor to an economic recession.
Nevertheless, Viktor Shvets, head of Asian strategy for Macquarie Commodities and Global Markets, brushed off those concerns. “My view has always been that yield curve predicts absolutely nothing,” he told. “What it does tell you (is) that you will have a recession if you don’t do something about it,” Shvets added.
The yield curve inversion, he said, may demonstrate that the global economy is slowing down. That’s because of a lack of liquidity, absence of reflationary momentum and a de-globalization of trade and capital flows, according to Shvets. “If you reverse those elements, then the yield curve will respond very quickly,” the strategist said, adding that, to him, “recession equals policy errors.”
Weighing in on concerns that central banks may not have enough fuel in their tanks to make their policy count, Shvets said that notion was “nonsense.” “It has to be made clear: Central banks never run out of bullets, ever,” he said. “There are so many tools that central banks can bring to bear, (other than) just looking at interest rates. ”
Citi Research discusses the market conditions and flags 7 reasons why investors may look to extend the current risk-aversion trades (long safe havens like CHF, JPY, Gold).
"With risk sentiment continuing to deteriorate by the week, investors may look to extend risk aversion trades into 2020 as: - (1) worsening US – China trade tensions risk a disinflationary impulse from CNY heading towards 7.25 - 50; (2) Possible risk of USD intervention by the US; (3) Rising odds of a “No Deal” Brexit; (4) Re-emergence of Italy political risk; (5) Slowing global growth leading to central bank policy responses and a “race to the bottom” in rates sparking a currency war; (6) Potential damage to US – Japan/ Europe trade relations should Trump impose tariffs on auto imports; (7) 2020 - US presidential election year leaves scope for a more aggressive Trump; (8) tensions in HK, Iran, North Korea, now Argentina and India – Pakistan,"
According to the report from Federal Statistical Office (FSO), the Producer and Import Price Index fell by 0.1% in July 2019 compared with the previous month, reaching 101.6 points (December 2015 = 100). The decline is due in particular to lower prices for scrap as well as petroleum and natural gas. Compared with July 2018, the price level of the whole range of domestic and imported products fell by 1.7%. Economists had expected a 1.5% decrease.
The decline in the producer price index compared with the previous month was mainly due to lower prices for scrap. Cheaper were also watches. On the other hand, rising prices were observed for petroleum products.
Lower prices compared with June 2019 were recorded in the import price index, especially for oil and natural gas. Price declines were also apparent in metals and semi - finished products, as well as in pome and stone fruit. On the other hand, mineral oil products became more expensive.
Karen Jones, Team Head FICC Technical Analysis at Commerzbank, noted that bullish attempt in the pair should meet interim resistance in the 0.9800 neighbourhood.
“USD/CHF saw a key day reversal on Tuesday from .9659 and we have temporarily exited our short positions as we perceive a lack of interest in sustaining a break below the .9716/.9692 key support presently. This is the location of the 25th June low, the January low and Fibo support and below .9659 targets the .9543 September 2018 low”.
“Interim resistance is the .9805 22nd July low. Key resistance remains the 200 day ma at .9964, our bearish bias is entrenched below here. Longer term we target .9211/.9188, the 2018 low”.
Japanese Finance Minister Taro Aso said on Thursday that volatility was high in financial markets and that he hoped markets would calm down.
Various factors are behind market moves including the U.S.-China trade war, Aso told reporters after a cabinet meeting.
Aso also said there was no change to the government's plan to raise the sales tax in October, when asked if recent bond yield moves could affect the plan.
China's new home prices rose in July as the property sector held up as one of the few bright spots in the slowing economy, although momentum flagged in some markets as persistent curbs hit speculative investment.
Average new home prices in China's 70 major cities rose 0.6% in July from the previous month, unchanged from June and marking the 51st straight month of gains, according to the data from National Bureau of Statistics (NBS).
The majority of the 70 cities surveyed by the NBS still reported a monthly price increase for new homes, although the number of cities fell to 60 in July from 63 cities in June.
The property sector directly impacts over 40 industries in China and a fast deterioration would risk adding to pressure the economy.
On a year-on-year basis, home prices rose at their weakest pace this year in July by 9.7%, slowing from a 10.3% gain in June.
Prices in China's four top-tier cities - Beijing, Shanghai, Guangzhou and Shenzhen - rose 0.3% from a month earlier, quickening from a 0.2% gain in June.
Tier-2 cities, which include most of the larger provincial capitals, increased 0.7% in July versus a 0.8% rise in the previous month. And Tier-3 cities rose 0.7% on a monthly basis, in line with June's pace.
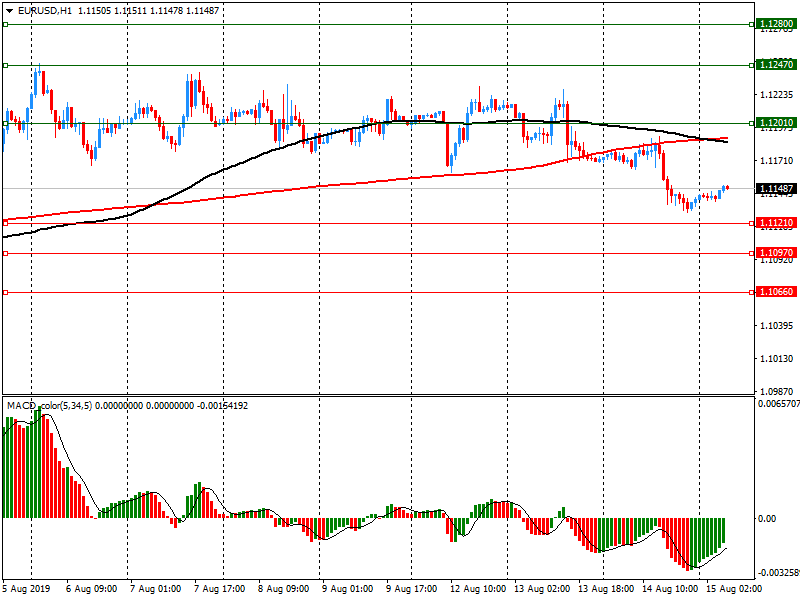
EUR/USD
Resistance levels (open interest**, contracts)
$1.1280 (4356)
$1.1247 (1951)
$1.1201 (753)
Price at time of writing this review: $1.1149
Support levels (open interest**, contracts):
$1.1121 (5973)
$1.1097 (3672)
$1.1066 (4740)
Comments:
- Overall open interest on the CALL options and PUT options with the expiration date September, 6 is 103758 contracts (according to data from August, 14) with the maximum number of contracts with strike price $1,1400 (8834);
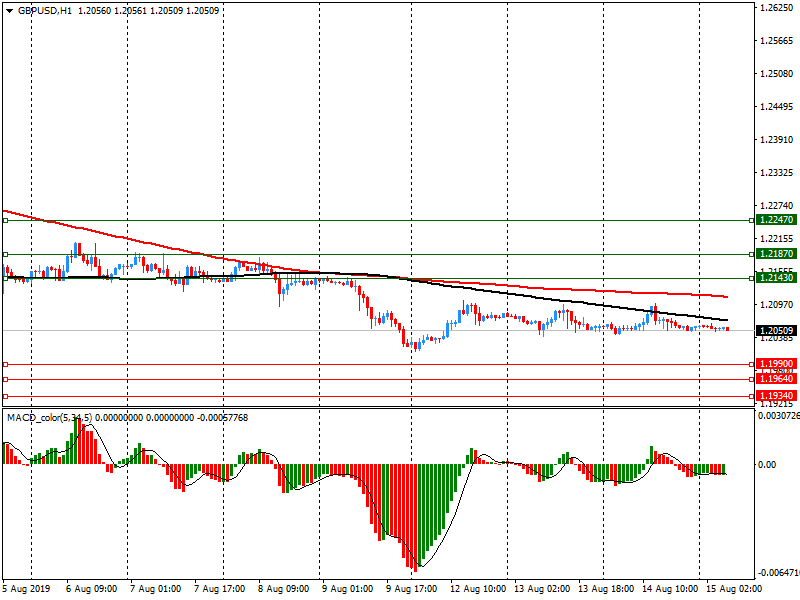
GBP/USD
Resistance levels (open interest**, contracts)
$1.2247 (1155)
$1.2187 (892)
$1.2143 (322)
Price at time of writing this review: $1.2051
Support levels (open interest**, contracts):
$1.1990 (2091)
$1.1964 (1446)
$1.1934 (1551)
Comments:
- Overall open interest on the CALL options with the expiration date September, 6 is 29917 contracts, with the maximum number of contracts with strike price $1,2750 (4128);
- Overall open interest on the PUT options with the expiration date September, 6 is 23557 contracts, with the maximum number of contracts with strike price $1,2100 (2091);
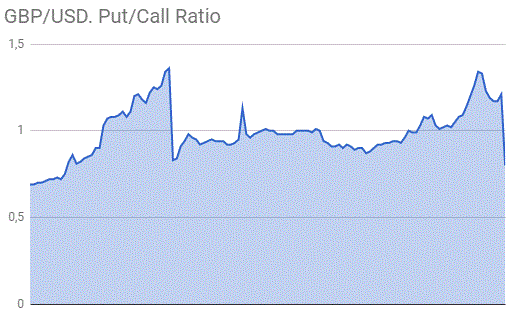
- The ratio of PUT/CALL was 0.79 versus 0.77 from the previous trading day according to data from August, 14
* - The Chicago Mercantile Exchange bulletin (CME) is used for the calculation.
** - Open interest takes into account the total number of option contracts that are open at the moment.
| Raw materials | Closed | Change, % |
|---|---|---|
| Brent | 58.75 | -3.12 |
| WTI | 54.85 | -3.18 |
| Silver | 17.18 | 1.36 |
| Gold | 1515.989 | 0.99 |
| Palladium | 1425.56 | -1.93 |
| Index | Change, points | Closed | Change, % |
|---|---|---|---|
| NIKKEI 225 | 199.69 | 20655.13 | 0.98 |
| Hang Seng | 20.98 | 25302.28 | 0.08 |
| KOSPI | 12.54 | 1938.37 | 0.65 |
| ASX 200 | 27.4 | 6595.9 | 0.42 |
| FTSE 100 | -103.02 | 7147.88 | -1.42 |
| DAX | -257.47 | 11492.66 | -2.19 |
| Dow Jones | -800.49 | 25479.42 | -3.05 |
| S&P 500 | -85.72 | 2840.6 | -2.93 |
| NASDAQ Composite | -242.42 | 7773.94 | -3.02 |
| Pare | Closed | Change, % |
|---|---|---|
| AUDUSD | 0.67466 | -0.76 |
| EURJPY | 117.82 | -1.19 |
| EURUSD | 1.11402 | -0.28 |
| GBPJPY | 127.522 | -0.93 |
| GBPUSD | 1.20582 | -0 |
| NZDUSD | 0.64336 | -0.38 |
| USDCAD | 1.33172 | 0.73 |
| USDCHF | 0.97279 | -0.35 |
| USDJPY | 105.753 | -0.91 |
© 2000-2026. Sva prava zaštićena.
Sajt je vlasništvo kompanije Teletrade D.J. LLC 2351 LLC 2022 (Euro House, Richmond Hill Road, Kingstown, VC0100, St. Vincent and the Grenadines).
Svi podaci koji se nalaze na sajtu ne predstavljaju osnovu za donošenje investicionih odluka, već su informativnog karaktera.
The company does not serve or provide services to customers who are residents of the US, Canada, Iran, The Democratic People's Republic of Korea, Yemen and FATF blacklisted countries.
Izvršenje trgovinskih operacija sa finansijskim instrumentima upotrebom marginalne trgovine pruža velike mogućnosti i omogućava investitorima ostvarivanje visokih prihoda. Međutim, takav vid trgovine povezan je sa potencijalno visokim nivoom rizika od gubitka sredstava. Проведение торговых операций на финанcовых рынках c маржинальными финанcовыми инcтрументами открывает широкие возможноcти, и позволяет инвеcторам, готовым пойти на риcк, получать выcокую прибыль, но при этом неcет в cебе потенциально выcокий уровень риcка получения убытков. Iz tog razloga je pre započinjanja trgovine potrebno odlučiti o izboru odgovarajuće investicione strategije, uzimajući u obzir raspoložive resurse.
Upotreba informacija: U slučaju potpunog ili delimičnog preuzimanja i daljeg korišćenja materijala koji se nalazi na sajtu, potrebno je navesti link odgovarajuće stranice na sajtu kompanije TeleTrade-a kao izvora informacija. Upotreba materijala na internetu mora biti praćena hiper linkom do web stranice teletrade.org. Automatski uvoz materijala i informacija sa stranice je zabranjen.
Ako imate bilo kakvih pitanja, obratite nam se pr@teletrade.global.


