- Analiza
- Novosti i instrumenti
- Vesti sa tržišta
Forex-novosti i prognoze od 15-01-2021
On Monday, at 02:00 GMT, China will report the change in GDP for the 4th quarter, investment in fixed assets, industrial production and retail sales for December. At 04:30 GMT, Japan will report a change in industrial production for November. At 11: 00 GMT in Germany, the Bundesbank's monthly report will be released. At 13:15 GMT, Canada will announce a change in the housing starts for December, and at 13:30 GMT - a change in the foreign securities purchases for November. In addition, at 13:30 GMT, the head of the Bank of England Bailey will make a speech. The Eurogroup will also meet on Monday. At 21:00 GMT, New Zealand will present a business environment sentiment indicator from NZIER for the 4th quarter.
On Tuesday, at 07:00 GMT, Germany will release the consumer price index for December. At 07:30 GMT, Switzerland will publish the producer and import price index for December. At 09:00 GMT, the eurozone will announce a change in the ECB's balance of payments balance for November. At 10:00 GMT, Germany and the eurozone will present the ZEW Institute's business sentiment index for January. At 13:30 GMT, Canada will announce changes in the wholesale trade for November and the manufacturing shipments for November. At 21: 00 GMT, the US will announce changes in the net and total purchases of long-term US securities by foreign investors for November. At 23:30 GMT, Australia will release the Westpac consumer confidence index for January.
On Wednesday, at 07:00 GMT, Germany will release the producer price index for December. Also at 07:00 GMT, Britain will present the consumer price index, the retail price index, the producer purchase price index and the producer selling price index for December. At 10:00 GMT, the eurozone will publish the consumer price index for December. At 13:30 GMT, Canada will release the consumer price index for December. At 15:00 GMT in Canada, Bank of Canada interest rate decision will be announced. In addition, at 15:00 GMT, the US will publish the NAHB housing market index for January. At 21:45 GMT, New Zealand will announce a change in the number of tourists for November. At 23:50 GMT, Japan will report a change in the foreign trade balance for December.
On Thursday, at 00:00 GMT, Australia will announce a change in expectations for consumer price inflation from MI for January. At 00:30 GMT, Australia will report changes in the unemployment rate and the number of people employed for December. At 03:00 GMT, in Japan, the Bank of Japan's interest rate decision will be announced. At 06:30 GMT, the Bank of Japan will hold a press conference. At 07:00 GMT, Switzerland will announce a change in the foreign trade balance for December. At 09:30 GMT, in the UK, a report on credit conditions will be released. At 11:00 GMT, Britain will announce a change in the balance of industrial orders according to the CBI for January. At 12:45 GMT in the eurozone, the ECB interest rate decision will be announced. At 13: 30 GMT, the ECB will hold a press conference. Also at 13:30 GMT, Canada will present the new home price index for December. In addition, at 13:30 GMT, the US will announce changes in construction permits for December, the housing starts for December and the number of initial applications for unemployment benefits, as well as release the Fed-Philadelphia manufacturing index for January. At 15:00 GMT, the eurozone will publish a consumer confidence indicator for January. Also at 15: 00 GMT, the US will present the index of leading indicators for December. At 17:00 GMT, the head of the Bank of England Bailey will make a speech. At 21:30 GMT, New Zealand will release the Business NZ Manufacturing PMI for December, and at 21:45 GMT, the consumer price index for the 4th quarter. At 23:30 GMT, Japan will publish the consumer price index for December.
On Friday, at 00:30 GMT, Japan will present the manufacturing PMI and the service sector PMI for January. Also at 00:30 GMT, Australia will announce a change in retail trade volume for December. At 07:00 GMT, Britain will report changes in retail trade and net public sector borrowing for December. Then the focus will be on the manufacturing and services business activity indices for January: France will report at 08: 15 GMT, Germany at 08: 30 GMT, the eurozone at 09:00 GMT, and Britain at 09:30 GMT. At 13:30 GMT, Canada will report a change in retail sales for November. At 14:45 GMT, the US will publish the index of business activity in the manufacturing sector and the PMI for the services sector for January. At 15:00 GMT, the US will announce a change in the volume of housing sales in the secondary market for December. At 16:00 GMT, the US will report changes in oil reserves according to the Ministry of Energy. At 18:00 GMT, in the US, the Baker Hughes report on the number of active oil drilling rigs will be released.
According to ActionForex, analysts at TD Bank Financial Group note that the U.S. retail sales disappointed again, recording a drop of 0.7% on the month versus an anticipated decline of 0.2%.
- "Retail sales in the “control group,” which exclude more volatile gas, autos, building materials and food service categories, fell by 1.9% m/m. Negative growth in the “control” flashes a warning for personal consumption expenditures – the biggest driver of economic growth."
- "Surprisingly, non-store retailers posted a steep 5.8% m/m decline and the November reading was revised down to -1.6% from +0.2% m/m previously. Despite this setback, the category gained two percentage points in its share of total sales over the course of last year."
- "Among other categories in the red were home furniture & appliances stores (-2.3% m/m), food services & drinking places (-4.5% m/m) as well as food & beverage stores (-1.4% m/m)."
- "It wasn’t all bad news. Sales at gas stations (+6.6% m/m) and clothing and accessory stores (+2.4% m/m) were up. Autos & parts dealers returned to positive growth of 1.9% after declining by 1.5% in November. Building materials retailers reported a second solid month, growing by 0.9% in December, while sales health & personal care stores and miscellaneous retailers grew by 1.1% and 1.7% respectively."
- "With an additional income stimulus on its way, the pullback in retail trade should prove short-lived. The new Coronavirus Response and Relief Supplemental Appropriations (CRRSA) Act provides $600 tax credits per adult and qualifying children and extends supplemental unemployment insurance programs to mid-March."
- "Moreover, yesterday, president-elect Joe Biden proposed a $1.9 trillion package to support American families and prevent further economic disruption. We will find out more about the details of the relief package and how much of it is able to pass Congress in the coming weeks, but another round of economic impact payments, an increase in child tax credit, funds for rent and child care support and an extended foreclosure and evictions moratorium appears to be on the table. This should provide firm ground to households until the pandemic is finally over."
The Commerce
Department announced on Friday that business inventories rose 0.5 percent m-o-m
in November, following a revised 0.8 percent m-o-m advance in October
(originally a 0.7 percent m-o-m gain).
That was in
line with economists’ forecast for a 0.5 percent m-o-m increase.
According to
the report, stocks at retailers and manufacturers both rose by 0.7 percent
m-o-m, while inventories at wholesalers were unchanged m-o-m.
In y-o-y terms,
business inventories declined 3.2 percent in November.
A report from
the University of Michigan revealed on Friday the preliminary reading for the
Reuters/Michigan index of consumer sentiment decreased 1.9 percent m-o-m to 79.2
in early January.
Economists had
expected the index would drop to 80.0 this month from December’s final reading of
80.7.
According to
the report, the index of current U.S. economic conditions fell 2.6 percent
m-o-m to 87.7 in January from 90.0 in the previous month. Meanwhile, the index
of consumer expectations dropped 1.1 percent m-o-m to 73.8 this month from 74.6
in December.
“Consumer
sentiment posted trivial declines in early January despite the horrendous rise
in covid-19 deaths, the insurrection, and the impeachment of Trump”, noted
Surveys of Consumers chief economist, Richard Curtin. Two offsetting shifts
helped narrow the January loss in sentiment: the covid-19 vaccines and a
partisan shift in expectations due to the anticipated impact of Biden's
economic policies,” he added.
The report from
the New York Federal Reserve showed on Friday that manufacturing activity in
the New York region expanded marginally in early January.
According to
the survey, NY Fed Empire State manufacturing index fell from 4.9 in December to
3.5 in January, pointing to a very little growth in activity. This was the
lowest reading since June.
Economists had
expected the index to come in at 6.0.
Anything below
zero signals contraction.
According to
the report, the new orders index rose 3.2 points to 6.6, indicating a slight
advance in orders, and the shipments index fell 4.8 points to 7.3, pointing to
a modest rise in shipments. The employment index decreased 3.0 points to 11.2, pointing
to ongoing gains in employment. Delivery times were somewhat longer (5.5 in
January, up from 4.3 in December), and inventories held steady (-0.7, up from -4.3
in December). On the price front, the prices paid index jumped 8.4 points to 45.5,
its highest level in two years, indicating a pickup in input price gains, while
the prices received index increased 5.2 points to 15.2, its highest level in a
year, pointing to an acceleration in selling prices.
The Federal
Reserve reported on Friday the U.S. industrial production rose 1.6 percent
m-o-m in December, following a revised 0.5 percent m-o-m increase in November
(originally a 0.4 percent m-o-m gain).
Economists had
forecast industrial production would increase 0.5 percent m-o-m in December.
According to
the report, utilities output surged 6.2 percent m-o-m in December, as demand for
heating rebounded after unseasonably warm weather in November. Meanwhile, mining
production climbed 1.6 percent m-o-m and manufacturing output grew 0.9 percent
m-o-m.
Capacity
utilization for the industrial sector increased 1.1 percentage points m-o-m to
74.5 percent in December. That was 0.9 percentage point above economists’
forecast but 5.3 percentage points below its long-run (1972-2019) average.
In y-o-y terms,
the industrial output dropped 3.6 percent in December, following a revised 5.4
percent plunge in the prior month (originally a 5.5 percent decline).
For the fourth
quarter as a whole, total industrial production increased at an annual rate of
8.4 percent.
U.S. stock-index futures were mixed on Friday, as inventors assessed President-elect Joe Biden’s $1.9 trillion COVID-19 relief plan, quarterly reports from several U.S. biggest banks and December retail sales data.
Global Stocks:
Index/commodity | Last | Today's Change, points | Today's Change, % |
Nikkei | 28,519.18 | -179.08 | -0.62% |
Hang Seng | 28,573.86 | +77.00 | +0.27% |
Shanghai | 3,566.38 | +0.47 | +0.01% |
S&P/ASX | 6,715.40 | +0.10 | 0.00% |
FTSE | 6,744.12 | -57.84 | -0.85% |
CAC | 5,620.21 | -60.93 | -1.07% |
DAX | 13,853.02 | -135.68 | -0.97% |
Crude oil | $52.91 | -1.23% | |
Gold | $1,837.90 | -0.73% |
(company / ticker / price / change ($/%) / volume)
3M Co | MMM | 166 | -0.41(-0.25%) | 6394 |
ALCOA INC. | AA | 24.57 | -0.52(-2.07%) | 13784 |
ALTRIA GROUP INC. | MO | 41.03 | -0.08(-0.19%) | 14820 |
Amazon.com Inc., NASDAQ | AMZN | 3,140.01 | 12.54(0.40%) | 26802 |
AMERICAN INTERNATIONAL GROUP | AIG | 41 | -0.30(-0.73%) | 994 |
Apple Inc. | AAPL | 129.08 | 0.17(0.13%) | 623284 |
AT&T Inc | T | 29.12 | -0.17(-0.58%) | 79296 |
Boeing Co | BA | 208.7 | -1.21(-0.58%) | 75754 |
Caterpillar Inc | CAT | 196 | -1.40(-0.71%) | 7154 |
Chevron Corp | CVX | 93.79 | -1.70(-1.78%) | 38161 |
Cisco Systems Inc | CSCO | 44.86 | -0.29(-0.64%) | 27256 |
Citigroup Inc., NYSE | C | 68.05 | -0.96(-1.39%) | 578425 |
Deere & Company, NYSE | DE | 301.01 | -1.84(-0.61%) | 1455 |
E. I. du Pont de Nemours and Co | DD | 81.75 | -0.86(-1.04%) | 557 |
Exxon Mobil Corp | XOM | 48.56 | -1.75(-3.48%) | 771941 |
Facebook, Inc. | FB | 248.02 | 2.38(0.97%) | 305005 |
FedEx Corporation, NYSE | FDX | 255.7 | -0.57(-0.22%) | 4728 |
Ford Motor Co. | F | 10.06 | -0.11(-1.08%) | 301716 |
Freeport-McMoRan Copper & Gold Inc., NYSE | FCX | 31.25 | -0.74(-2.31%) | 138103 |
General Electric Co | GE | 11.59 | -0.07(-0.60%) | 375743 |
General Motors Company, NYSE | GM | 51.38 | -0.15(-0.29%) | 255322 |
Goldman Sachs | GS | 302 | -5.87(-1.91%) | 55976 |
Google Inc. | GOOG | 1,742.10 | 1.92(0.11%) | 4694 |
Hewlett-Packard Co. | HPQ | 25.4 | -0.22(-0.86%) | 2118 |
Home Depot Inc | HD | 267.05 | -1.29(-0.48%) | 7434 |
HONEYWELL INTERNATIONAL INC. | HON | 207 | -1.61(-0.77%) | 1671 |
Intel Corp | INTC | 58.6 | -0.65(-1.10%) | 218223 |
International Business Machines Co... | IBM | 128.75 | -0.22(-0.17%) | 8086 |
Johnson & Johnson | JNJ | 161 | 0.35(0.22%) | 29433 |
JPMorgan Chase and Co | JPM | 137.9 | -3.27(-2.32%) | 1222711 |
McDonald's Corp | MCD | 208.31 | -0.19(-0.09%) | 9043 |
Merck & Co Inc | MRK | 82 | -0.17(-0.21%) | 12507 |
Microsoft Corp | MSFT | 213.65 | 0.63(0.30%) | 128764 |
Nike | NKE | 140.51 | -0.79(-0.56%) | 8332 |
Pfizer Inc | PFE | 36.76 | 0.01(0.03%) | 1375645 |
Procter & Gamble Co | PG | 135.6 | -0.20(-0.15%) | 5209 |
Starbucks Corporation, NASDAQ | SBUX | 101.51 | -0.31(-0.30%) | 11871 |
Tesla Motors, Inc., NASDAQ | TSLA | 853.03 | 8.03(0.95%) | 918122 |
The Coca-Cola Co | KO | 49.15 | -0.08(-0.16%) | 79361 |
Twitter, Inc., NYSE | TWTR | 45.82 | 0.03(0.07%) | 191424 |
UnitedHealth Group Inc | UNH | 348.5 | -2.03(-0.58%) | 2444 |
Verizon Communications Inc | VZ | 56.98 | -0.06(-0.11%) | 15383 |
Visa | V | 202.22 | 0.36(0.18%) | 53349 |
Wal-Mart Stores Inc | WMT | 146.75 | -0.22(-0.15%) | 18418 |
Walt Disney Co | DIS | 173.35 | -0.08(-0.05%) | 31977 |
Yandex N.V., NASDAQ | YNDX | 69.54 | 0.25(0.36%) | 1013 |
Intel (INTC) upgraded to Hold from Sell at DZ Bank; target $62
The Commerce
Department reported on Friday the sales at U.S. retailers fell 0.7 percent
m-o-m in December, following a revised 1.4 percent m-o-m drop in November
(originally a 1.1 percent m-o-m decline).
Economists had
expected total sales would be flat m-o-m in December.
According to
the report, the largest declines in retail sales were recorded in electronics and
appliance stores (-4.9 percent m-o-m), restaurants and bars (-4.5 percent
m-o-m), food and beverage stores (-1.4 percent m-o-m) and general merchandise
stores (-1.2 percent m-o-m), which were impacted by the re-imposition of
restrictions to slow the spread of coronavirus.
Excluding auto,
retail sales decreased 1.4 percent m-o-m in December after a revised 1.3
percent m-o-m drop in the previous month (originally a 0.9 percent m-o-m decline),
being much worse than economists’ forecast of a
0.1 percent m-o-m fall.
Meanwhile,
closely watched core retail sales, which exclude automobiles, gasoline,
building materials and food services, and are used in GDP calculations, plunged
1.9 percent m-o-m in December after a revised 1.1 percent m-o-m drop in November
(originally a 0.5 percent m-o-m decline). Economists had forecast core retail
sales growing 0.1 percent m-o-m in December.
In y-o-y terms,
the U.S. retail sales grew 2.9 percent in December after a revised 3.7 climb in
the previous month (originally a 4.1 percent jump). This was the smallest gain
since July.
The Labor
Department reported on Friday the U.S. producer-price index (PPI) rose 0.3
percent m-o-m in December, following an unrevised 0.1 percent m-o-m gain in November.
For the 12 months through December, the PPI increased 0.8 percent after an unrevised 0.8 percent advance in the previous month.
Economists had
forecast the headline PPI would increase 0.4 percent m-o-m last month and 0.8
percent over the past 12 months.
According to
the report, the December increase in the final demand index can be traced to a 1.1-percent
m-o-m gain in prices for final demand goods. Meanwhile, the index for final
demand services fell 0.1 percent m-o-m.
Excluding
volatile prices for food and energy, the PPI edged up 0.1 percent m-o-m and
jumped 1.2 percent over 12 months. Economists had forecast gains of 0.2 percent
m-o-m and 1.3 percent y-o-y.
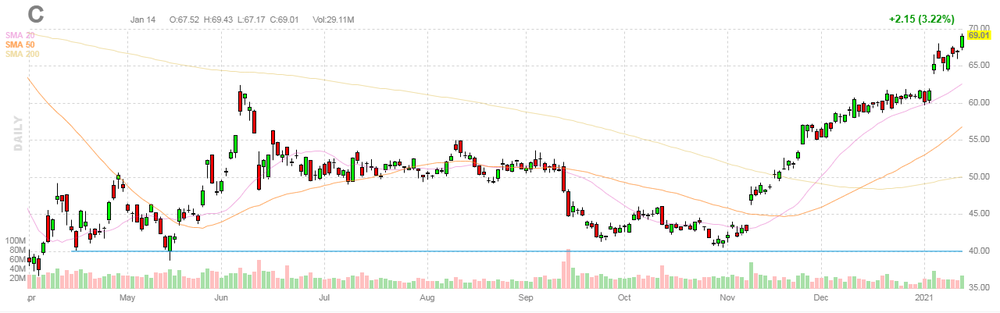
Citigroup (C) reported Q4 FY 2020 earnings of $2.08 per share (versus $1.90 per share in Q4 FY 2019), beating analysts’ consensus estimate of $1.31 per share.
The company’s quarterly revenues amounted to $16.500 bln (-10.2% y/y), missing analysts’ consensus estimate of $16.707 bln.
C fell to $67.82 (-1.72%) in pre-market trading.
FXStreet reports that economists at Credit Suisse note that S&P 500 uptrend is starting to lose momentum and support at 3765 needs to hold to suggest the immediate risk can still lean higher.
“The S&P 500 Index has again been unable to resume its uptrend and although a large bullish ‘outside week’ remains in place we are becoming concerned the risk is growing for a deeper pullback.”
“Support at 3777/65 needs to hold to suggest the immediate risk can still lean higher with resistance seen at 3807 initially, then 3827/23.”
“Above 3827/23 remains needed to ease the threat of a setback to reassert the uptrend with resistance seen next at 3866/68 and eventually the ‘measured triangle objective’ at 3900."
“With a cluster of further Fibonacci projection resistances also seen here and stretching up to 3925/30, we maintain our call to look for a cap here for a fresh and likely we think protracted consolidation phase.”
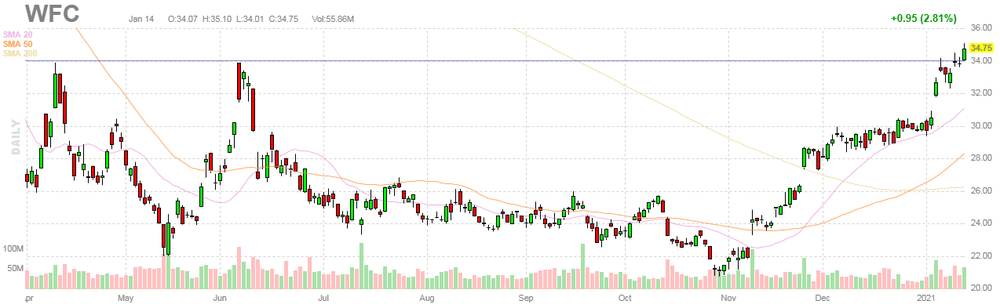
Wells Fargo (WFC) reported Q4 FY 2020 earnings of $0.64 per share (versus $0.93 per share in Q4 FY 2019), slightly beating analysts’ consensus estimate of $0.63 per share.
The company’s quarterly revenues amounted to $17.925 bln (-9.7% y/y), roughly in line with analysts’ consensus estimate of $17.996 bln.
WFC fell to $33.95 (-2.30%) in pre-market trading.
| Time | Country | Event | Period | Previous value | Forecast | Actual |
|---|---|---|---|---|---|---|
| 07:00 | United Kingdom | Manufacturing Production (MoM) | November | 1.6% | 0.9% | 0.7% |
| 07:00 | United Kingdom | Manufacturing Production (YoY) | November | -6.1% | -4.8% | -3.8% |
| 07:00 | United Kingdom | Industrial Production (YoY) | November | -5.8% | -4.2% | -4.7% |
| 07:00 | United Kingdom | Industrial Production (MoM) | November | 1.1% | 0.5% | -0.1% |
| 07:00 | United Kingdom | GDP, y/y | November | -8.2% | -8.9% | |
| 07:00 | United Kingdom | GDP m/m | November | 0.6% | -5.7% | -2.6% |
| 07:00 | United Kingdom | Total Trade Balance | November | -2.3 | -5 | |
| 07:45 | France | CPI, m/m | December | 0.2% | 0.2% | 0.2% |
| 07:45 | France | CPI, y/y | December | 0.2% | 0% | 0% |
| 10:00 | Eurozone | Trade balance unadjusted | November | 29.6 | 26 | 25.8 |
GBP traded mixed against its major counterparts in the European session on Friday after official data showed that the UK's economy contracted less than expected in November despite the introduction of a second national lockdown for England on November 5. The pound rose slightly against AUD, NZD and CAD, but fell against EUR and safe-haven currencies.
The Office for National Statistics (ONS) reported Britain's GDP shrank by 2.6 percent m-o-m in November following six consecutive monthly gains due to the imposition of tougher coronavirus restrictions in England at the beginning of the month to help control the spread of the virus. Economists had forecast a 5.7 percent m-o-m slump. On a y-o-y basis, the UK's economy contracted by 8.9 percent, the most since July. Over the three months to November, the UK's GDP expanded by 4.1 percent y-o-y, the least since the economic recovery started in the June-August period. However, this was better than economists' forecast of a 3.4 percent y-o-y growth.
Meanwhile, investors' risk appetite was dented by concerns for the pace of coronavirus infections around the world and worries that the lockdowns could be extended. According to Johns Hopkins University's data, global COVID-19 cases have exceeded 93.2 million, with the death toll approaching 2 million, 86,163 of which have been registered in the UK.
FXStreet reports that EUR/USD has completed a small “head & shoulders” top to add weight to the Credit Suisse analyst team view for a deeper corrective setback to the December low, 38.2% retracement of the November/January rally and 55-day average, currently at 1.2065/45.
“EUR/USD has seen a break of key near-term price support at 1.2132/22 and although this hasn’t been sustained thus far, with the ‘measured objective’ from its top at 1.2355 achieved and with the USD itself holding major support as expected our bias remains for this to be confirmed. This should then clear the way for further corrective weakness for a deeper setback to 1.2065/59 initially – the December low and 38.2% retracement of the November/January rally. With the 55-day average not far below at 1.2043, we would look for an attempt to find a floor here.”
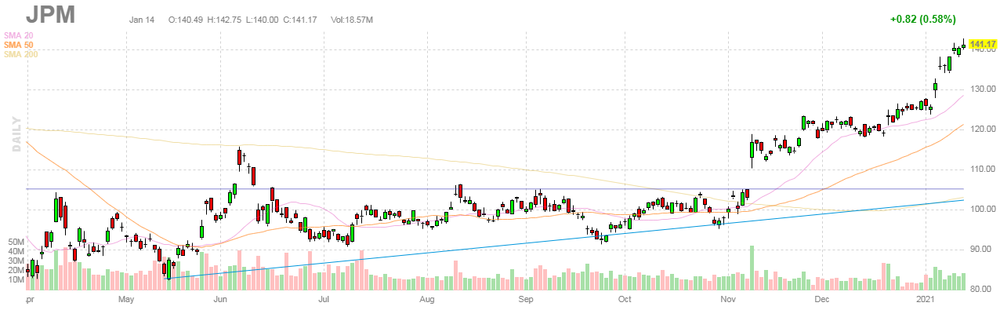
JPMorgan Chase (JPM) reported Q4 FY 2020 earnings of $3.08 per share (versus $2.57 per share in Q4 FY 2019), beating analysts’ consensus estimate of $2.65 per share.
The company’s quarterly revenues amounted to $29.224 bln (+3.3% y/y), beating analysts’ consensus estimate of $28.738 bln.
JPM rose to $141.40 (+0.16%) in pre-market trading.
FXStreet notes that rising yields and inflation can create anxiety for investors but the impact depends on why they’re rising. Much higher rates of inflation or much higher interest rates would be disruptive to how the market sees the present value of a given business. But there are reasons why economists at Morgan Stanley think these developments are more likely to drive a shift in market leadership than a large adjustment overall.
“We think global growth and inflation will exceed expectations this year. As a result, we think interest rates will keep rising.”
“When interest rates and inflation expectations are rising together, equity and credit markets actually tend to do quite well. The reason is pretty straightforward: interest rates and inflation expectations rise together when people are getting more optimistic about the economy. Stocks tend to like that.”
“When inflation is below average but rising, like it is today, historical returns for stocks and high yield bonds tend to be better than average.”
“The last 12 months have seen very low levels of interest rates and unusually large differences in relative performance between segments of the market. As interest rates move higher, those divergences should continue to reverse, as previous laggards become leaders and vice versa. And it could be challenging to bond returns themselves, and bond-like assets that haven't started to adjust in price. We remain underweight government bonds and think investors should favor shorter duration exposures.”
FXStreet notes that President-elect Joe Biden’s fiscal plan, announced in Delaware yesterday, is large at $1.9 trillion and triggered a jump in the UST bond 10-year yield of about 4bps but much of that move has already been reversed. Biden’s fiscal plan is large but the market scepticism is justified, according to eceonomists at MUFG Bank who expect the U.S. dollar to continue the downtrend despite a short-term strength.
- “The reality is that while the Democrats now have increased power having won the run-off elections in Georgia last week, that power still has its limits and the details of the fiscal package suggest the overall size will be whittled down before it gets the support required to get through the Senate.”
- “The drop in the UST bond 10-year yield indicates expectations of a paring back of this plan, which to us looks understandable. However, Biden has a long history of achieving compromise and there are certainly risks of surprise and this fiscal plan could still end up larger than the markets currently assume."
- “While short-term, the US dollar could extend further, the big picture backdrop for the dollar remains negative. Fed rhetoric and even a watered-down Biden fiscal plan underline the negative backdrop that lies ahead.”
USD/CHF: Deeper corrective recovery expected above resistance at 0.8918/20 - Credit Suisse
FXStreet reports that analysts at Credit Suisse note that the USD/CHF pair is still capped below 0.8918/20, however, a break above here would complete a small “head and shoulders” base to trigger a correction to the core bear trend, with the 55-day average then seen at 0.8964.
“USD/CHF remains below 0.8918/20 for now, however, the risk of a base and a deeper setback is growing and we have shifted our base case towards a deeper corrective setback before the core bear trend eventually resumes.”
“A break above the December highs at 0.8918/20 would see a small intraday ‘head and shoulders’ base completed to open up further upside, with the next level at the 55-day average at 0.8964/69, then 0.9027/28.”
“Longer-term, we look for the core bear trend to take over again post a deeper setback or otherwise, in line with the very large top from 2020 that remains in place.”
FXStreet reports that senior Economist at UOB Group Alvin Liew assesses the developments and implications of the second impeachment of President Trump.
“After the riotous attack on the US Capitol last week, the US House of Representatives voted 232 to 197, to impeach US President Trump with the charge of high crimes and misdemeanors for inciting an insurrection at the US Capitol on 6 Jan 2021, making Trump the first sitting president to be impeached twice by the lower chamber of the US Congress. However, there may not be enough time to remove Trump before President-elect Joe Biden’s inauguration on 20 Jan.”
“Even if the impeachment proceedings will likely drag over into Biden’s term (after Trump’s official departure on 20 Jan), there will still be consequences for Trump. The first is that if he is to be impeached by the Senate, then a subsequent measure could be tabled against him to disqualify him from running for the US presidency in 2024. Secondly, Trump may also lose the perks given to former US presidents.”
CNBC reports that according to one hedge fund manager, President-elect Joe Biden’s Covid spending plan could recreate the financial conditions seen in the run-up to the 1929 Wall Street crash, with rising inflation potentially responsible for popping an “epic” stock market bubble.
David Neuhauser, managing director of Livermore Partners, said that Biden’s spending plan appeared to be an attempt to mimic the “roaring 20′s” by getting people back into the workforce quickly.
“But beware, the ’roaring 20’s′ led to the 1929 stock market crash and the Great Depression. So, be careful what you wish for,” he added.
If passed by the new Democratic-controlled Congress, the “American Rescue Plan” includes $1 trillion in direct relief for households, $415 billion to tackle the virus and roughly $440 billion for small businesses.
When asked whether investors should be concerned that the president-elect’s spending plan could lead to an event like the 1929 stock market crash, Neuhauser replied: “I think so.”
In the wake of the stock market crash of Oct. 29, 1929, the S&P 500 fell 86% in less than three years and did not pass its previous peak until 1954.
According to the report from Eurostat, the first estimate for euro area exports of goods to the rest of the world in November 2020 was €196.7 billion. Compared with November 2019 (€198.6 bn), this is a decrease of 1.0% but it nevertheless indicates a return to pre-COVID levels. Imports from the rest of the world stood at €170.9 bn, a fall of 4.2% compared with November 2019 (€178.4 bn). As a result, the euro area recorded a €25.8 bn surplus in trade in goods with the rest of the world in November 2020, compared with +€20.2 bn in November 2019. Intra-euro area trade fell to €165.4 bn in November 2020, down by 1.3% compared with November 2019.
In January to November 2020, euro area exports of goods to the rest of the world stood at €1 941.3 bn (a decrease of 10.2% compared with January-November 2019), while imports amounted to €1 735.8 bn (a decrease of 11.6% compared with January-November 2019). As a result the euro area recorded a surplus of €205.4 bn, compared with +€198.4 bn in January-November 2019. Intra-euro area trade fell to €1647.4 bn in JanuaryNovember 2020, down by 9.7% compared with January-November 2019.
FXStreet reports that FX Strategists at UOB Group noted the upside bias in USD/CNH could extend to the 6.5200 level in the short-term.
Next 1-3 weeks: “On Wednesday, we indicated that the outlook is mixed and we expected USD to ‘trade between 6.4100 and 6.4900’. While there is no change in our view, upward momentum is beginning to improve and a clear break of 6.4900 could lead to USD moving higher towards 6.5200. At this stage, the prospect for USD to advance is not high but it would remain intact unless the ‘strong support’ at 6.4300 is breached.”
Reuters reports that BofA's weekly fund flow stats showed that investors stormed into financial and energy stocks last week, frontloading positions ahead of U.S. president-elect Joe Biden's announcement of a $1.9 trillion stimulus package.
The reflation trade saw stocks bagging $26.8 billion inflows with energy attracting $3.6 billion, the second highest ever. Financials meanwhile saw a "meaty" $2.1 billion flowing in, the U.S. investment bank said citing EPFR data.
FXStreet reports that economists at ANZ Bank forecast Brent Crude Oil to trade around $58 over the next quarter and to reach the $60 level in the second half of the year.
“The move by Saudi Arabia to cut output by 1mb/d has stabilised the oil market amid rising risks of ongoing weakness in demand. We have left our assumptions for demand unchanged. This should see the drawdown on global inventories rise to 1.1mb/d in Q1. As a consequence, we have raised our 0-3 month target to $58/bbl. But we also see further downside risks to demand in the short-term. This is likely to keep any further upside to prices limited over the next few months.”
“We expect global crude oil demand to increase by 4-5mb/d in H2 2021. While OPEC is expected to meet a large portion of this, -will be required to balance the market. We now expect Brent crude to hit$60/bbl in H2 2021 before stabilising at those levels. WTI crude should follow a similar path.”
eFXdata reports that Bank of America Global research discusses the ECB policy trajectory.
"We believe that the ECB is a key theme for the EUR this year. The ECB is facing substantial challenges, with limited policy tools. The Strategy Review in the first half of the year is supposed to come up with a plan, but we don't see easy solutions. It is also not clear which way it will affect the EUR, as ECB monetary policy easing tends to support the periphery spreads and sometimes ends up supporting the EUR. In more detail, the ECB is the furthest away from its inflation target it has ever been. Although the EUR is currently at its long-term equilibrium, the 2020 EURUSD rally is still a problem for the ECB, in our view. The EUR rally last year contributed to the drop of Eurozone inflation and keeping it down," BofA adds.
| Time | Country | Event | Period | Previous value | Forecast | Actual |
|---|---|---|---|---|---|---|
| 04:30 | Japan | Tertiary Industry Index | November | 1% | 0.3% | -0.7% |
| 07:00 | United Kingdom | Manufacturing Production (MoM) | November | 1.6% | 0.9% | 0.7% |
| 07:00 | United Kingdom | Manufacturing Production (YoY) | November | -6.1% | -4.8% | -3.8% |
| 07:00 | United Kingdom | Industrial Production (YoY) | November | -5.8% | -4.2% | -4.7% |
| 07:00 | United Kingdom | Industrial Production (MoM) | November | 1.1% | 0.5% | -0.1% |
| 07:00 | United Kingdom | GDP, y/y | November | -8.2% | -8.9% | |
| 07:00 | United Kingdom | GDP m/m | November | 0.6% | -5.7% | -2.6% |
| 07:00 | United Kingdom | Total Trade Balance | November | -2.3 | -5 | |
| 07:45 | France | CPI, m/m | December | 0.2% | 0.2% | 0.2% |
| 07:45 | France | CPI, y/y | December | 0.2% | 0% | 0% |
During today's Asian trading, the US dollar rose against the euro and was little changed against the yen.
Investors are assessing new measures to support the US economy, proposed on Thursday by President-elect Joe Biden. The $ 1.9 trillion package of measures, among other things, includes direct payments to US residents, surcharges to unemployment benefits, and an increase in the minimum wage.
The ICE index, which tracks the dollar's performance against six currencies (euro, swiss franc, yen, canadian dollar, pound sterling and swedish krona), rose 0.12%.
Federal Reserve Chairman Jerome Powell said yesterday that it is too early to talk about any changes in the monetary policy of the Central Bank, including the reduction of the asset purchase program.
"The Fed will maintain a soft monetary policy for a long time, the dollar's growth should not continue," said MUFG analyst Lee Hardman, quoted by Le Figaro newspaper.
The Chinese yuan rose slightly against the dollar. The People's Bank of China has poured liquidity into the banking system under the medium-term lending program (MLF), while maintaining the level of the rate on one-year loans. As stated in the message of the Central Bank, the regulator today provided 500 billion yuan. The cost of one-year loans remained at 2.95% per annum for the ninth consecutive month.
According to the report from INSEE, in December 2020, the Consumer Price Index (CPI) rose by 0.2% over one month, as in November 2020. The service prices (+0.5% after +0.1%) and those of energy (+1.7% after +0.3%) accelerated significantly. The prices of tobacco were stable after a rebound the previous month (+4.9% in November). The food prices fell back (–0.4% after +0.6%) and those of manufactured goods decreased more than in the previous month (–0.4% after –0.3%)
Seasonally adjusted, consumer prices were stable in December, after +0.4% in November.
Year on year, consumer prices were stable, after +0.2% in the previous month. The food prices were less dynamic than in the previous month (+1.0% after +2.0%) and those of manufactured goods decreased more sharply (–0.9% after –0.3%). The prices of services (+0.7%) and those of tobacco (+12.5%) increased, year on year, at the same rate as in November. The decrease in the energy prices softened (–7.0% after –7.8%).
Year on year, core inflation decreased, in December, to +0.2% after +0.4% in November. The Harmonised Index of Consumer Prices (HICP) rose by 0.2% over a month as in the previous month; year on year, it was stable after +0.2% in November.
EUR/USD
Resistance levels (open interest**, contracts)
$1.2263 (859)
$1.2238 (186)
$1.2218 (591)
Price at time of writing this review: $1.2143
Support levels (open interest**, contracts):
$1.2107 (2302)
$1.2082 (1186)
$1.2052 (1105)
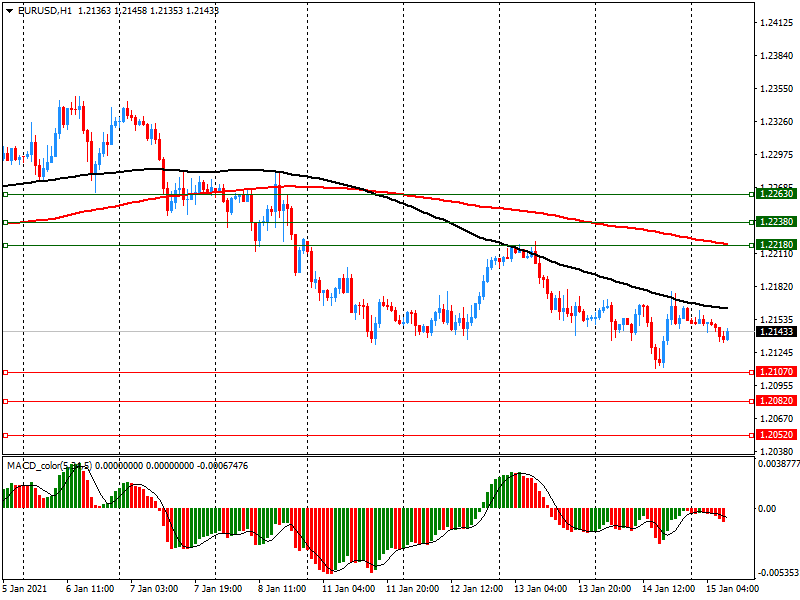
Comments:
- Overall open interest on the CALL options and PUT options with the expiration date February, 5 is 47307 contracts (according to data from January, 14) with the maximum number of contracts with strike price $1,2000 (3404);
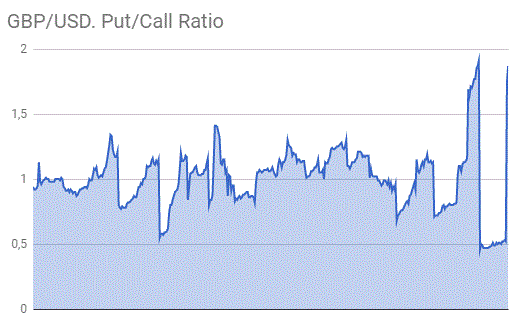
GBP/USD
Resistance levels (open interest**, contracts)
$1.3832 (1367)
$1.3804 (1316)
$1.3760 (1125)
Price at time of writing this review: $1.3662
Support levels (open interest**, contracts):
$1.3527 (777)
$1.3456 (1689)
$1.3417 (1036)
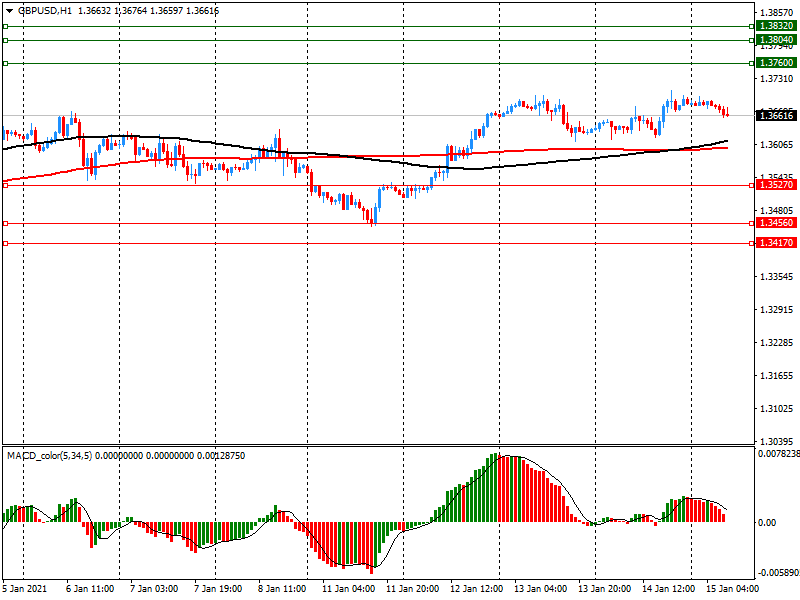
Comments:
- Overall open interest on the CALL options with the expiration date February, 5 is 10801 contracts, with the maximum number of contracts with strike price $1,4000 (1730);
- Overall open interest on the PUT options with the expiration date February, 5 is 19205 contracts, with the maximum number of contracts with strike price $1,2500 (2183);
- The ratio of PUT/CALL was 1.78 versus 1.84 from the previous trading day according to data from January, 14
* - The Chicago Mercantile Exchange bulletin (CME) is used for the calculation.
** - Open interest takes into account the total number of option contracts that are open at the moment.
According to the report from Office for National Statistics, production output fell by 0.1% between October 2020 and November 2020, with falls of 3.4% in mining and quarrying, 2.3% in electricity and gas and 0.4% in water and waste; this was offset by a rise in manufacturing of 0.7%. Economists had expected a 0.5% increase.
In November 2020 production output was 4.7% below February 2020, the previous month of "normal" trading conditions, prior to the coronavirus (COVID-19) pandemic.
The monthly increase of 0.7% in manufacturing output was led by manufacturing of transport equipment; 8 of the 13 subsectors displayed upward contributions.
Total production output increased by 4.7% for the three months to November 2020, compared with the three months to August 2020; this was because of weak output in June 2020.
For the three months to November 2020, compared with the three months to November 2019, production output decreased by 5.6%; this was led by a fall in manufacturing of 5.5%.
According to the report from Office for National Statistics, following six consecutive monthly increases, including an upwardly revised 0.6% increase in October, real gross domestic product (GDP) fell by 2.6% in November 2020. Restrictions were in place to varying degrees across all four nations of the UK during November. Economists had expected a 5.7% decrease. November GDP fell back to 8.5% below the levels seen in February 2020 compared with 6.1% below in October 2020. GDP fell by 8.9% in the 12 months to November 2020, compared with an annual decline of 6.8% to October.
The services sector acted as the main drag on growth in November, falling by 3.4% as restrictions on activity were reintroduced in some parts of the UK in response to the coronavirus (COVID-19) pandemic. The services sector is now 9.9% below the level of February 2020.
The production sector also fell marginally by 0.1% in November 2020, remaining 4.7% below the February 2020 level. Elsewhere the construction sector saw positive growth of 1.9% in November 2020, recovering to 0.6% above the February 2020 level.
There were falls in output in all 14 services sub-sectors between October and November 2020. The largest contributor to this fall was accommodation and food service activities, followed by wholesale and retail trade, other service activities and arts, entertainment and recreation, because of the reintroduction of restrictions in some parts of the UK. These four sectors accounted for nearly 80% of the fall in services.
| Raw materials | Closed | Change, % |
|---|---|---|
| Brent | 56.36 | 0.97 |
| Silver | 25.51 | 1.03 |
| Gold | 1846.336 | -0.05 |
| Palladium | 2405.55 | 0.68 |
| Time | Country | Event | Period | Previous value | Forecast |
|---|---|---|---|---|---|
| 04:30 (GMT) | Japan | Tertiary Industry Index | November | 1% | 0.3% |
| 07:00 (GMT) | United Kingdom | Manufacturing Production (MoM) | November | 1.7% | 0.9% |
| 07:00 (GMT) | United Kingdom | Manufacturing Production (YoY) | November | -7.1% | -4.8% |
| 07:00 (GMT) | United Kingdom | Industrial Production (YoY) | November | -5.5% | -4.2% |
| 07:00 (GMT) | United Kingdom | Industrial Production (MoM) | November | 1.3% | 0.5% |
| 07:00 (GMT) | United Kingdom | GDP, y/y | November | -8.2% | |
| 07:00 (GMT) | United Kingdom | Total Trade Balance | November | -1.7 | |
| 07:00 (GMT) | United Kingdom | GDP m/m | November | 0.4% | -5.7% |
| 07:45 (GMT) | France | CPI, m/m | December | 0.2% | 0.2% |
| 07:45 (GMT) | France | CPI, y/y | December | 0.2% | 0% |
| 10:00 (GMT) | Eurozone | Trade balance unadjusted | November | 30 | 26 |
| 13:30 (GMT) | U.S. | NY Fed Empire State manufacturing index | January | 4.9 | 6 |
| 13:30 (GMT) | U.S. | PPI excluding food and energy, m/m | December | 0.1% | 0.2% |
| 13:30 (GMT) | U.S. | PPI excluding food and energy, Y/Y | December | 1.4% | 1.4% |
| 13:30 (GMT) | U.S. | PPI, y/y | December | 0.8% | 0.8% |
| 13:30 (GMT) | U.S. | PPI, m/m | December | 0.1% | 0.3% |
| 13:30 (GMT) | U.S. | Retail Sales YoY | December | 4.1% | |
| 13:30 (GMT) | U.S. | Retail sales excluding auto | December | -0.9% | -0.1% |
| 13:30 (GMT) | U.S. | Retail sales | December | -1.1% | 0% |
| 14:00 (GMT) | United Kingdom | NIESR GDP Estimate | December | 1.5% | |
| 14:15 (GMT) | U.S. | Capacity Utilization | December | 73.3% | 73.5% |
| 14:15 (GMT) | U.S. | Industrial Production YoY | December | -5.5% | |
| 14:15 (GMT) | U.S. | Industrial Production (MoM) | December | 0.4% | 0.4% |
| 15:00 (GMT) | U.S. | Business inventories | November | 0.7% | 0.5% |
| 15:00 (GMT) | U.S. | Reuters/Michigan Consumer Sentiment Index | January | 80.7 | 80 |
| 18:00 (GMT) | U.S. | Baker Hughes Oil Rig Count | January | 275 |
| Pare | Closed | Change, % |
|---|---|---|
| AUDUSD | 0.77776 | 0.62 |
| EURJPY | 126.133 | -0.09 |
| EURUSD | 1.2153 | 0.01 |
| GBPJPY | 142.015 | 0.29 |
| GBPUSD | 1.36834 | 0.37 |
| NZDUSD | 0.7222 | 0.67 |
| USDCAD | 1.26422 | -0.34 |
| USDCHF | 0.88812 | 0.08 |
| USDJPY | 103.782 | -0.08 |


© 2000-2026. Sva prava zaštićena.
Sajt je vlasništvo kompanije Teletrade D.J. LLC 2351 LLC 2022 (Euro House, Richmond Hill Road, Kingstown, VC0100, St. Vincent and the Grenadines).
Svi podaci koji se nalaze na sajtu ne predstavljaju osnovu za donošenje investicionih odluka, već su informativnog karaktera.
The company does not serve or provide services to customers who are residents of the US, Canada, Iran, The Democratic People's Republic of Korea, Yemen and FATF blacklisted countries.
Izvršenje trgovinskih operacija sa finansijskim instrumentima upotrebom marginalne trgovine pruža velike mogućnosti i omogućava investitorima ostvarivanje visokih prihoda. Međutim, takav vid trgovine povezan je sa potencijalno visokim nivoom rizika od gubitka sredstava. Проведение торговых операций на финанcовых рынках c маржинальными финанcовыми инcтрументами открывает широкие возможноcти, и позволяет инвеcторам, готовым пойти на риcк, получать выcокую прибыль, но при этом неcет в cебе потенциально выcокий уровень риcка получения убытков. Iz tog razloga je pre započinjanja trgovine potrebno odlučiti o izboru odgovarajuće investicione strategije, uzimajući u obzir raspoložive resurse.
Upotreba informacija: U slučaju potpunog ili delimičnog preuzimanja i daljeg korišćenja materijala koji se nalazi na sajtu, potrebno je navesti link odgovarajuće stranice na sajtu kompanije TeleTrade-a kao izvora informacija. Upotreba materijala na internetu mora biti praćena hiper linkom do web stranice teletrade.org. Automatski uvoz materijala i informacija sa stranice je zabranjen.
Ako imate bilo kakvih pitanja, obratite nam se pr@teletrade.global.
транcфери