- Analiza
- Novosti i instrumenti
- Vesti sa tržišta
Forex-novosti i prognoze od 14-11-2019
| Time | Country | Event | Period | Previous value | Forecast |
|---|---|---|---|---|---|
| 02:15 | Australia | RBA Assist Gov Debelle Speaks | |||
| 02:45 | Canada | BOC Gov Stephen Poloz Speaks | |||
| 04:30 | Japan | Industrial Production (YoY) | September | -4.7% | 1.1% |
| 04:30 | Japan | Industrial Production (MoM) | September | -1.2% | 1.4% |
| 08:00 | Eurozone | ECB's Yves Mersch Speaks | |||
| 10:00 | Eurozone | Trade balance unadjusted | September | 14.7 | 17.5 |
| 10:00 | Eurozone | Harmonized CPI | October | 0.2% | 0.2% |
| 10:00 | Eurozone | Harmonized CPI ex EFAT, Y/Y | October | 1% | 1.1% |
| 10:00 | Eurozone | Harmonized CPI, Y/Y | October | 0.8% | 0.7% |
| 13:30 | Canada | Foreign Securities Purchases | September | 4.99 | |
| 13:30 | U.S. | NY Fed Empire State manufacturing index | November | 4 | 5 |
| 13:30 | Canada | Gov Council Member Lane Speaks | |||
| 13:30 | U.S. | Retail sales | October | -0.3% | 0.2% |
| 13:30 | U.S. | Retail sales excluding auto | October | -0.1% | 0.4% |
| 13:30 | U.S. | Retail Sales YoY | October | 4.1% | |
| 13:30 | U.S. | Import Price Index | October | 0.2% | -0.2% |
| 14:15 | U.S. | Capacity Utilization | October | 77.5% | 77.1% |
| 14:15 | U.S. | Industrial Production (MoM) | October | -0.4% | -0.4% |
| 14:15 | U.S. | Industrial Production YoY | October | -0.1% | |
| 15:00 | U.S. | Business inventories | September | 0% | 0.1% |
| 18:00 | U.S. | Baker Hughes Oil Rig Count | November | 684 |
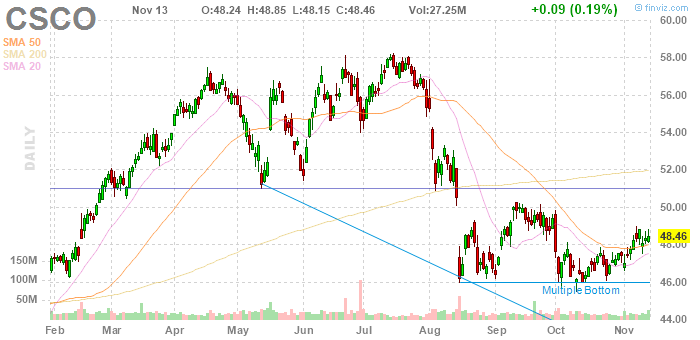
Major US stock indices mainly declined, having come under pressure due to the collapse of shares of Cisco Systems (CSCO).
CSCO shares fell 7.35% after the company said it expects its revenue in the current quarter to fall by 3-5% YoY to ~ $ 11.82-12.07 billion due to lower global costs for its routers and switches, Some of which are made in China.
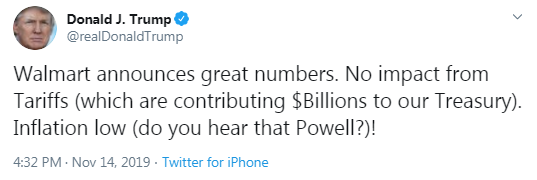
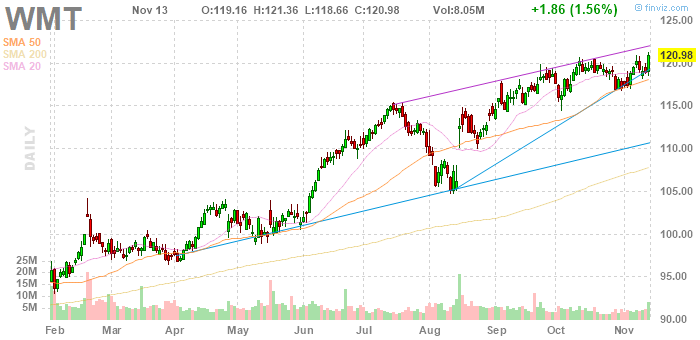
In addition to Cisco, Walmart (WMT) also presented its reporting. The retailer reported exceeded expectations for quarterly earnings and comparable sales in the United States, and also increased its annual profit forecast. However, Walmart's revenue was slightly lower than Wall Street's average forecast. WMT shares fell 0.36%.
Uncertainty around the deal between the US and China also remained a deterrent to the market. China said Thursday that both sides are holding a “detailed” discussion of trade issues, and tariff cancellation is an important condition for a deal.
The market participants also focused on the speech of Fed Chairman Powell and several reports. Powell, he noted that the Fed does not see signs that trade problems affect the entire economy, but added that they exacerbated the recession in production this year. Nevertheless, according to him, the US economy is currently in much better shape than the economies of other countries and the Fed predicts that it will continue to grow moderately.
The Labor Department said US producer prices rose in October in the most in six months. According to the report, the producer price index rose 0.4% last month, which is the largest increase since April after falling 0.3% in September. Over the 12 months to October, the index rose 1.1%, the smallest increase since October 2016, after rising 1.4% in September. The annual inflation of manufacturers declined, as a significant increase in the last year fell out of the calculation. Economists had forecast that the index would rise by 0.3% in October and increase by 0.9% year on year.
Most DOW components recorded a decrease (18 out of 30). Outsiders were shares of Cisco Systems (CSCO; -7.35%). The biggest gainers were The Boeing Co. (BA; + 1.32%).
Most S&P sectors completed trading in the red. The conglomerate sector showed the largest decline (-1.9%). The services sector grew the most (+ 0.3%).
At the time of closing:
Dow 27,781.96 -1.63 -0.01%
S&P 500 3,096.64 +2.60 + 0.08%
Nasdaq 100 8,479.02 -3.08 -0.04%
| Time | Country | Event | Period | Previous value | Forecast |
|---|---|---|---|---|---|
| 02:15 | Australia | RBA Assist Gov Debelle Speaks | |||
| 02:45 | Canada | BOC Gov Stephen Poloz Speaks | |||
| 04:30 | Japan | Industrial Production (YoY) | September | -4.7% | 1.1% |
| 04:30 | Japan | Industrial Production (MoM) | September | -1.2% | 1.4% |
| 08:00 | Eurozone | ECB's Yves Mersch Speaks | |||
| 10:00 | Eurozone | Trade balance unadjusted | September | 14.7 | 17.5 |
| 10:00 | Eurozone | Harmonized CPI | October | 0.2% | 0.2% |
| 10:00 | Eurozone | Harmonized CPI ex EFAT, Y/Y | October | 1% | 1.1% |
| 10:00 | Eurozone | Harmonized CPI, Y/Y | October | 0.8% | 0.7% |
| 13:30 | Canada | Foreign Securities Purchases | September | 4.99 | |
| 13:30 | U.S. | NY Fed Empire State manufacturing index | November | 4 | 5 |
| 13:30 | Canada | Gov Council Member Lane Speaks | |||
| 13:30 | U.S. | Retail sales | October | -0.3% | 0.2% |
| 13:30 | U.S. | Retail sales excluding auto | October | -0.1% | 0.4% |
| 13:30 | U.S. | Retail Sales YoY | October | 4.1% | |
| 13:30 | U.S. | Import Price Index | October | 0.2% | -0.2% |
| 14:15 | U.S. | Capacity Utilization | October | 77.5% | 77.1% |
| 14:15 | U.S. | Industrial Production (MoM) | October | -0.4% | -0.4% |
| 14:15 | U.S. | Industrial Production YoY | October | -0.1% | |
| 15:00 | U.S. | Business inventories | September | 0% | 0.1% |
| 18:00 | U.S. | Baker Hughes Oil Rig Count | November | 684 |
The U.S. Energy
Information Administration (EIA) revealed on Thursday that crude inventories
increased by 2.219 million barrels in the week ended November 8. Economists had
forecast a gain of 1.500 million barrels.
At the same
time, gasoline stocks rose by 1.861 million barrels, while analysts had
expected a drop of 1.250 million barrels. Distillate stocks reduced by 2.477
million barrels, while analysts had forecast a decrease of 0.950 million
barrels.
Meanwhile, oil production in the U.S. climbed by 200,000 barrels a day to 12.800 million barrels a day, which is a record high.
U.S. crude oil imports averaged 5.8 million barrels per day last week, down by 327,000 barrels per day from the previous week.
- U.S. debt growing faster than economy; that is unsustainable
- Labor force participation is a pressing US issue
- Need an economy that is growing faster than the debt
- Ultimately the United States will have to get on a sustainable debt path
- Trade tensions have contribute to manufacturing recession this year
- Risk of spillover from trade tension is something they monitor but is not impacting the broader economy
- Effects of tariffs are not currently that large in context of the whole US economy
- Consumers are driving the U.S. economy
- People at the lower end of the wage scale have gotten the bulk of the benefits
- Well-financed infrastructure can contribute to increasing productivity and U.S. economy
- Investment in infrastructure could be very helpful for U.S. economy
- There is nothing in today's economy that is booming
- The U.S. economy is a sustainable picture
- Generally free and fair trade is a good thing
- Says financial conditions are not currently an impediment to growth or to a rise in inflation
- Policymakers should act with more caution in using unconventional tools subject to more uncertainty, act more forcefully with conventional instruments
- U.S. economy at or close to Fed's twin goals
- Sees no evidence rising wages causing excess inflation
- Inflation close to 2% goal, expectations at low-end
- U.S. inflation expectations reside at low-end of range he considers consistent with Fed's price stability mandate
- No evidence rising wages are putting excessive upward pressure on inflation
- Thinks natural rate of unemployment extends 24% and below and includes current unemployment rate of 3.6%
- Makeup strategies on inflation lead to better than average performance on both legs of dual mandate
- Increase prime age participation a factor in restraining inflationary pressures
U.S. stock-index futures traded lower on Thursday, as investors decided to take a pause in moving to new record highs amid persisting concerns about U.S.-China trade relations.
Global Stocks:
Index/commodity | Last | Today's Change, points | Today's Change, % |
Nikkei | 23,141.55 | -178.32 | -0.76% |
Hang Seng | 26,323.69 | -247.77 | -0.93% |
Shanghai | 2,909.87 | +4.63 | +0.16% |
S&P/ASX | 6,735.10 | +36.70 | +0.55% |
FTSE | 7,315.37 | -35.84 | -0.49% |
CAC | 5,896.85 | -10.24 | -0.17% |
DAX | 13,170.81 | -59.26 | -0.45% |
Crude oil | $57.56 | +0.77% | |
Gold | $1,469.10 | +0.40% |
Statistics
Canada reported on Thursday the New Housing Price Index (NHPI) rose 0.2 percent
m-o-m in September, following a 0.1 percent m-o-m gain in the previous three months.
Economists had
forecast the NHPI to increase 0.1 percent m-o-m in September.
According to the report, Kitchener-Cambridge-Waterloo (+1.5 percent m-o-m) registered the largest price advance in September, as favourable market conditions and more affordable prices relative to Toronto continued to influence demand in the region. The price of new homes surged by 1.0 percent m-o-m in both Ottawa and Trois-Rivières, supported by construction costs and favourable market conditions. Meanwhile, new home prices fell in Vancouver (-0.6 percent m-o-m) and Kelowna (-0.3 percent m-o-m) in September.
In y-o-y terms,
NHPI fell 0.1 in September after dropping 0.3 percent in the previous month.
That marked the fourth consecutive drop.
The data from
the Labor Department revealed on Thursday the number of applications for
unemployment benefits rose more than forecast last week, but this is not seen
as a signal of a shift in labor market conditions as claims for several states
were estimated because of Monday’s holiday.
According to
the report, the initial claims for unemployment benefits increased by 14,000 to
a seasonally adjusted 225,000 for the week ended November 9. That was the highest
reading since June 22.
Economists had
expected 215,000 new claims last week.
Claims for the
prior week were remained unchanged at 211,000.
Meanwhile, the
four-week moving average of claims rose by 1,750 to 217,000 last week.
(company / ticker / price / change ($/%) / volume)
3M Co | MMM | 170.1 | -0.45(-0.26%) | 1040 |
ALCOA INC. | AA | 21.15 | -0.07(-0.33%) | 411 |
ALTRIA GROUP INC. | MO | 46.85 | 0.02(0.04%) | 1675 |
Amazon.com Inc., NASDAQ | AMZN | 1,750.05 | -3.06(-0.17%) | 11280 |
American Express Co | AXP | 120.27 | 0.01(0.01%) | 6002 |
Apple Inc. | AAPL | 262.6 | -1.87(-0.71%) | 373935 |
AT&T Inc | T | 39.01 | -0.15(-0.38%) | 43708 |
Boeing Co | BA | 363.5 | 1.00(0.28%) | 5875 |
Caterpillar Inc | CAT | 143.54 | -0.95(-0.66%) | 12990 |
Chevron Corp | CVX | 122.47 | 0.19(0.16%) | 1697 |
Cisco Systems Inc | CSCO | 45.69 | -2.77(-5.72%) | 459961 |
Citigroup Inc., NYSE | C | 73.35 | -0.56(-0.76%) | 7929 |
Deere & Company, NYSE | DE | 172.75 | -2.92(-1.66%) | 2265 |
Exxon Mobil Corp | XOM | 68.9 | 0.10(0.15%) | 6515 |
Facebook, Inc. | FB | 193 | -0.19(-0.10%) | 21882 |
FedEx Corporation, NYSE | FDX | 155.72 | -0.51(-0.33%) | 2682 |
Ford Motor Co. | F | 8.83 | 0.02(0.23%) | 22455 |
Freeport-McMoRan Copper & Gold Inc., NYSE | FCX | 10.75 | -0.09(-0.83%) | 22221 |
General Electric Co | GE | 11.22 | -0.07(-0.62%) | 71392 |
General Motors Company, NYSE | GM | 37.05 | -0.14(-0.38%) | 5431 |
Goldman Sachs | GS | 217.8 | -1.52(-0.69%) | 2130 |
Hewlett-Packard Co. | HPQ | 19.92 | 0.39(2.00%) | 56960 |
Home Depot Inc | HD | 235 | 0.20(0.09%) | 937 |
HONEYWELL INTERNATIONAL INC. | HON | 180.9 | -0.15(-0.08%) | 1722 |
Intel Corp | INTC | 57.76 | -0.13(-0.22%) | 2202 |
International Business Machines Co... | IBM | 134.42 | -0.06(-0.04%) | 2010 |
International Paper Company | IP | 44.83 | -0.51(-1.12%) | 125 |
Johnson & Johnson | JNJ | 131.35 | 0.08(0.06%) | 1538 |
JPMorgan Chase and Co | JPM | 127.57 | -0.91(-0.71%) | 9068 |
McDonald's Corp | MCD | 195.4 | 0.40(0.21%) | 2457 |
Merck & Co Inc | MRK | 85.02 | 0.20(0.24%) | 2351 |
Microsoft Corp | MSFT | 146.91 | -0.40(-0.27%) | 21971 |
Nike | NKE | 91.33 | 0.04(0.04%) | 1623 |
Pfizer Inc | PFE | 36.51 | -0.09(-0.25%) | 1550 |
Procter & Gamble Co | PG | 121 | 0.35(0.29%) | 3187 |
Tesla Motors, Inc., NASDAQ | TSLA | 346.36 | 0.25(0.07%) | 33079 |
The Coca-Cola Co | KO | 52.55 | 0.14(0.27%) | 3570 |
Twitter, Inc., NYSE | TWTR | 29.05 | -0.03(-0.10%) | 31312 |
United Technologies Corp | UTX | 147.5 | -0.08(-0.05%) | 554 |
Verizon Communications Inc | VZ | 59.3 | -0.11(-0.19%) | 3128 |
Visa | V | 179.08 | -0.03(-0.02%) | 2944 |
Wal-Mart Stores Inc | WMT | 123.35 | 2.37(1.96%) | 1314494 |
Walt Disney Co | DIS | 148 | -0.72(-0.48%) | 314552 |
Yandex N.V., NASDAQ | YNDX | 34.1 | 0.22(0.65%) | 3320 |
Apple (AAPL) downgraded to Sell from Hold at Maxim Group; target $190
Deere (DE) downgraded to Neutral from Buy at BofA/Merrill
AT&T (T) downgraded to Hold from Buy at HSBC Securities; target $42
Verizon (VZ) downgraded to Hold from Buy at HSBC Securities; target $65
The Labor
Department reported on Thursday the U.S. producer-price index (PPI) increased
0.4 percent m-o-m in October, following a decline of 0.3 percent m-o-m September.
For the 12
months through October, the PPI rose 1.1 percent after a 1.4 percent advance in
the previous month. That marked the smallest gain in PPI since October 2016.
Economists had
forecast the headline PPI would increase 0.3 percent m-o-m and 0.9 percent over
the past 12 months.
According to
the report, the October climb in final demand prices reflected a 0.3 percent
m-o-m increase in prices for final demand services and a 0.7 percent m-o-m surge
in prices for final demand goods.
Excluding
volatile prices for food and energy, the PPI advanced 0.3 percent m-o-m and 1.6
percent over 12 months. Economists had forecast gains of 0.2 percent m-o-m and
1.5 percent y-o-y, respectively.
Iris Pang, the economist for Greater China at ING, notes that China's fixed-asset investment grew only 5.2% year-on-year, year-to-date in October, the slowest growth rate since the data started in 1998.
- "The weakness here shows that Chinese business investment has been highly affected by the trade war.
- Investment in the textile industry (-8.5%YoY YTD) and electric equipment (-7.5%YoY YTD) actually contracted. Investment in these areas is only likely to recover when there is substantial progress in the trade negotiations.
- For most of 2019, investment has been supported by transportation infrastructure investment via the issuance of local government special bonds. As the end of the year approaches, investment in these projects has slowed, shrinking 5.9%YoY YTD though we expect a pick up from 1Q20."
FX Strategists at UOB Group note that USD/JPY is now seen within a consolidative fashion.
- "24-hour view: We highlighted yesterday “the underlying tone has weakened and the risk is on the downside”. We added, “USD could move and test the strong 108.65 support”. USD subsequently dropped to 108.64 before recovering slightly. Downward momentum has picked up, albeit not by much. From here, the bias for USD is still to the downside. That said, any weakness is expected to encounter strong support at 108.45. Resistance is at 109.00 but stronger level is at 109.15.
- Next 1-3 weeks: We cautioned on the deteriorating upward momentum yesterday (13 Nov, spot at 109.00) and held the view that “risk of a short-term top has increased”. USD subsequently dipped one pip below our ‘strong support’ level 108.65 (low of 108.64). The price action suggests last week’s 109.48 high is a short-term top (we previously held the view that a break of the solid 109.75 resistance is ‘not ruled out’). The current movement is viewed as the early stages of a consolidation phase. In other words, USD is expected to trade sideways between 108.45 and 109.30 for a period."
Cisco Systems (CSCO) reported Q1 FY 2020 earnings of $0.84 per share (versus $0.75 in Q1 FY 2019), beating analysts’ consensus estimate of $0.81.
The company’s quarterly revenues amounted to $13.159 bln (+0.7% y/y), generally in line with analysts’ consensus estimate of $13.090 bln.
The company also issued downside guidance for Q2 FY 2020, projecting EPS of $0.75-0.77 versus analysts’ consensus estimate of $0.79 and revenue of ~$11.82-12.07 bln (-3-5% y/y) versus analysts’ consensus estimate of $12.77 bln.
CSCO fell to $45.85 (-5.39%) in pre-market trading.
Fed Chair Powell's speech in focus today – TDS
Analysts at TD Securities are expecting the Fed Chair Powell to largely reiterate his Wednesday's remarks in its second day at Congress.
“The Fed Chair is likely to repeat that the economy is in a "good place", although risks remain, and that monetary policy is appropriate but not on a preset course.
Separately, Vice-Chair Clarida could offer additional details about the ongoing Fed Framework Review during his discussion at the Cato Conference; while NY Fed President Williams may provide his views on the economy and monetary policy at his opening remarks at the Asian Economic Policy Conference.”
Walmart (WMT) reported Q3 FY 2020 earnings of $1.16 per share (versus $1.08 in Q3 FY 2019), beating analysts’ consensus estimate of $1.09.
The company’s quarterly revenues amounted to $126.981 bln (+2.5% y/y), generally in line with analysts’ consensus estimate of $128.085 bln.
The company also raised its FY 2020 earnings outlook, projecting adjusted EPS, including Flipkart, to be up slightly compared to its prior guidance of down slightly to up slightly.
WMT rose to $124.90 (+3.24%) in pre-market trading.
Iris Pang, the economist for Greater China at ING, notes that China's headline retail sales grew at 7.2%YoY, lower than the market expectation of 7.8%YoY, and the lowest this year.
- "The growth was supported by spending on necessities (12%).
- Uncertainty about job security is a key reason why consumers are cautious about spending on big-ticket items. Data shows that spending on vehicles fell 3.3%YoY and jewellery was down 4.5%YoY even though there was a long holiday in October.
- People did spend on smartphones (22.9%) as some Chinese brands began selling 5G phones in October. This confirms that 5G is the new growth engine of the economy."
Richard Franulovich, the head of FX strategy at Westpac, thinks that near-term USD bounce can extend further as last-minute jitters set in about phase one trade deal prospects and deepening political unrest in a couple Asian/Latin hotspots.
- “DXY index has retraced about half its steep October losses and can extend to 99.0 near term.
- Encouraging upticks in Eurozone IP, PMIs and ZEW suggest the region is on the verge of a turnaround. But, sustained downside for the USD likely needs to see more compelling EZ recovery greenshoots, beyond stabilisation at depressed levels.
- In any case, forward-looking US data is perking up at the same time, meaning the growth gap in the US’ favour isn’t really closing.
- Consensus US growth expectations have been a handy 1-2ppts above Eurozone for sometime and no real closing of that gap is expected in 2020. So the USD is in good shape. The turn of the year will lift the lid on 2020 US political uncertainty though and could prompt a USD sentiment shift, as markets ponder a Jan Senate impeachment trial and prospects for a progressive Democrat president.”
Iris Pang, the economist for Greater China at ING, notes that China's headline industrial production growth slowed to 4.7%YoY in October from 5.8% in the previous month.
- "Industrial production of two items in particular, vehicles (-11.1%YoY) and smartphones (-7.3%YoY), show how the trade war has affected exports as well as local demand. Vehicles and smartphones share two similar features; they are both expensive and demand for new models from consumers is low without an obvious reason to upgrade. As demand is weak, production shrinks as inventory must be sold.
- It's not all bad though. Production of integrated circuits grew 23.5%YoY in October and we expect this to remain strong due to the production of 5G parts and products."
- Effective immediately
- Euro exchange rate is not a target of monetary policy
- Loosening policy has had positive trade balance effect
- Especially since negative rates were introduced in 2014
- QE measures have had large and persistent effects on the euro
The ECB will need to widen its monetary policy toolkit to ensure it remains effective, the European Central Bank's Vice President Luis De Guindos said.
In his view, the "toolkit will need to be wider" in the sense that the central bank needs to do more than conventional monetary policy, De Guindos said at BNP Paribas banking conference.
The ECB is in the process of reviewing its monetary policy and the tools it uses to keep inflation near 2% and support the euro zone economy.
In September, the bank pushed euro zone interest rates further into negative territory and said it was restarting its mass bond-buying programme having only wound it down at the end of last year.
It came with no end date in an attempt to reverse the slowdown in the euro zone's economy, nearly a decade after the bloc's debt crisis ripped through Greece, Italy, Spain, Portugal and Ireland.
Karen Jones, analyst at Commerzbank, suggests that GBP/USD continues to attempt to recover from the 1.2764/ 23.6% retracement.
“It is currently struggling at the 20 day ma at 1.2674. Only above here will leave the market well placed for another attempt at the psychological resistance at 1.3000. Directly above here we have the 200 week ma at 1.3122 and the 1.3187 May high and these remain our short term targets, but we look for the market to be capped here. Failure at 1.2764 will see a slide to the 200 day ma at 1.2702. This guards 1.2582. Below 1.2582 lies the 1.2382 17th July low and the 1.2403 uptrend. The uptrend guards 1.2196/94. Below the current October low at 1.2194 lies the early and mid-August lows at 1.2091/15 and major support lies at the 1.1958 September low.”
According to a flash estimate published by Eurostat, seasonally adjusted GDP rose by 0.2% in the euro area (EA19) and by 0.3% in the EU28 during the third quarter of 2019. In the second quarter of 2019, GDP had grown by 0.2% in both the euro area and the EU28.
Compared with the same quarter of the previous year, seasonally adjusted GDP rose by 1.2% in the euro area and by 1.3% in the EU28 in the third quarter of 2019, after +1.2% and +1.4% respectively in the previous quarter. Economists had expected a 1.1% increase in the euro area.
The number of employed persons increased by 0.1% in both the euro area and the EU28 in the third quarter of 2019, compared with the previous quarter. In the second quarter of 2019, employment had grown by 0.2% in the euro area and by 0.3% in the EU28. Compared with the same quarter of the previous year, employment increased by 1.0% in the euro area and by 0.9% in the EU28 in the third quarter of 2019, after +1.2% and +1.0% respectively in the second quarter of 2019.
Office for National Statistics said, the quantity bought in October 2019 fell by 0.1% when compared with the previous month, with only fuel and department stores reporting growth. Economists had expected a 0.2% increase.
Year-on-year growth in the quantity bought increased by 3.1% in October 2019, with growth across all sectors except household goods stores. Economists had expected a 3.7% increase
Online sales as a proportion of all retailing increased to 19.2% in October 2019, from the 19.0% reported in September 2019.
In the three months to October 2019, the quantity bought in retail sales increased by 0.2% when compared with the previous three months; this is the lowest growth since April 2018. Food stores were the only main sector to see growth (0.8%) in the three-month on three-month series.
The Chinese yuan could strengthen against the greenback if China and the U.S. sign a so-called phase one trade agreement, according to an economist from Credit Agricole.
“We believe that if this phase one deal is done, including no more tariffs, then there’s room for renminbi to appreciate,” said Dariusz Kowalczyk, chief China economist at the French bank.
“There are of course doubts about this phase one deal. But ultimately we believe there’s an 80% chance that it will be signed in this quarter and if that happens, the renminbi will probably drop to towards 6.90,” he told CNBC.
Chinese currency traded both onshore and offshore have been hovering around 7.0 yuan per dollar for the past month. Onshore and offshore yuan last touched 6.90 against the greenback in August and July, respectively. Movements in the yuan have largely depended on developments in the U.S.-China trade war, now in its second year. The two countries have slapped tariffs on each other’s products worth billions of dollars, which has weighed down the Chinese economy and currency.
But Kowalczyk said weakness in the yuan has “overcompensated” for the economic impact of tariffs. That’s one reason why the currency could appreciate on developments, such as the signing of the “phase one” trade deal, he explained.
Deutsche Bank analysts point out that China’s October economic data released was weaker across the board with industrial production coming in at +4.7% YoY (vs. +5.4% YoY expected), retail sales printing at +7.2% YoY (vs. 7.8% YoY) and the YtD fixed asset ex rural investment sliding to the lowest since at least Feb 1998 (where we have data so likely much longer) to +5.2% yoy (vs. +5.4% yoy).
“The surveyed unemployment rate came in at 5.1% (vs. 5.2% previously). Following the release, China’s National Statistics Bureau spokeswoman Liu Aihua said that China’s overall economic momentum hasn’t changed while the challenges it faces shouldn’t be underestimated before adding that China faces rising cyclical issues and structural conflicts. The NBS also said downside growth pressure has continually intensified and the country should carry out policies to increase economic resilience and meet whole-year economic growth targets. Our strategists think the policy responses will be limited though as China has met their employment target for the year and are still seeing de-leveraging as a policy goal.”
A measure of British house prices edged down in October but there were signs that buyers and sellers were sitting on the sidelines at least until next month's election, a survey published showed.
In the latest sign of weakness in the housing market against a backdrop of Brexit uncertainty, the Royal Institution of Chartered Surveyors (RICS) said its house price index slipped to -5 from -3 in September. That was a touch below the median forecast of -4.
New sales instructions fell for a fourth month but less severely than in September when they tumbled at the fastest pace since Britain voted to leave the EU in a referendum in 2016, and there were signs they would remain weak. New buyer enquiries and agreed sales remained negative too.
But near-term sales expectations improved and sales were expected to be broadly stable over the next three months in most of the country, RICS said.
According to Danske Bank analysts UK retail sales for October could get a boost from Brexit stockpiling.
“In March, hoarding ahead of the original Brexit date similarly contributed to a surge in sales, though the impact will probably not be as pronounced this time. A range of ECB (Chief Economist Lane and Vice President De Guindos) and FOMC speakers (Clarida, Evans, Powell, Williams and Bullard - all voters) will also be scrutinized for any new monetary policy hints, as markets continue to scale back their rate cut expectations. In Scandinavia, markets will keep an eye on the Swedish labour market data for October and the Danish Q3 GDP indicator.”
According to the report from Insee, in October 2019, the Consumer Prices Index (CPI) was stable over a month, after a 0.3% downturn in September. This stability resulted from a little increase in manufactured product prices (+0.3% after +1.5%), offset by a drop in services prices (−0.1% after −1.3%) and in food prices (−0.4% after −0.5%). Energy prices were stable over a month, after a 0.3% rise in the previous month. Finally, tobacco prices were unchanged over a month.
Year on year, consumer prices slowed down for the fourth consecutive month: +0.8% in October after +0.9% in September. This slight fall in inflation came from a downturn in energy prices and a slowdown in food prices, partly offset by a lesser drop in those of manufactured products. Finally, services inflation was stable.
Year on year, core inflation increased in October: +1.0% after +0.9% in the previous month. The Harmonised Index of Consumer Prices (HICP) fell over a month anew (−0.1% after −0.4% in September); year on year, it rose by 0.9%, after +1.1% in the previous month.
According to the report from Federal Statistical Office (Destatis), in the third quarter of 2019, the price-adjusted gross domestic product in Germany increased by 0.1% on the second quarter of 2019, after adjustment for seasonal and calendar variations. Economists had expected a 0.1% decrease. According to the most recent calculations, taking into account newly available statistical information, the GDP was down 0.2% in the second quarter of 2019, which is 0.1 percentage points more than first published. Destatis also reports that the increase in the first quarter of 2019 (0.5%) was by 0.1 percentage points larger than published earlier.
The quarter-on-quarter comparison (price-, seasonally and calendar-adjusted) shows that positive contributions in the third quarter of 2019 mainly came from consumption, according to provisional calculations. Compared with the second quarter of 2019, household final consumption expenditure increased, and so did government final consumption expenditure. Exports rose, while imports remained roughly at the level of the previous quarter. Also, gross fixed capital formation in construction was up on the previous quarter. Gross fixed capital formation in machinery and equipment, however, was lower than in the previous quarter.
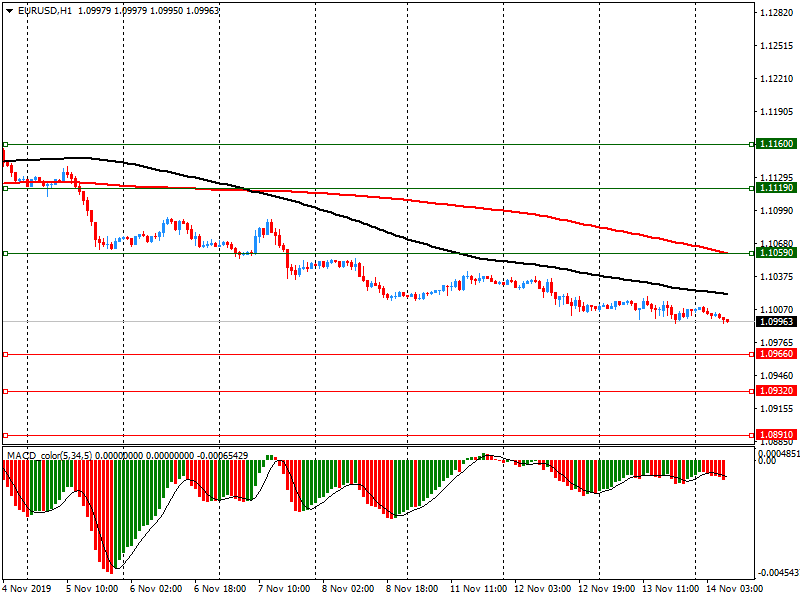
EUR/USD
Resistance levels (open interest**, contracts)
$1.1160 (4729)
$1.1119 (2559)
$1.1059 (1559)
Price at time of writing this review: $1.0996
Support levels (open interest**, contracts):
$1.0966 (3069)
$1.0932 (2913)
$1.0891 (3987)
Comments:
- Overall open interest on the CALL options and PUT options with the expiration date December, 6 is 96816 contracts (according to data from November, 13) with the maximum number of contracts with strike price $1,1200 (5380);
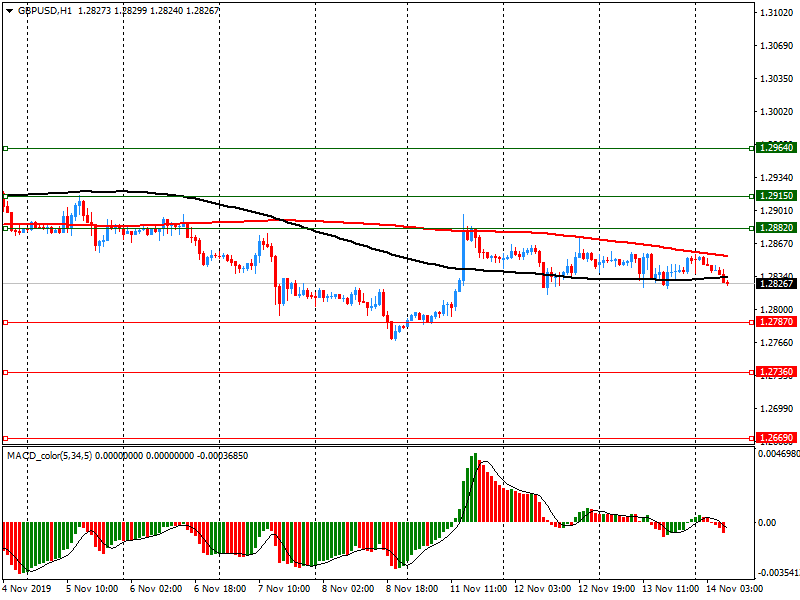
GBP/USD
Resistance levels (open interest**, contracts)
$1.2964 (2573)
$1.2915 (735)
$1.2882 (2117)
Price at time of writing this review: $1.2827
Support levels (open interest**, contracts):
$1.2787 (1651)
$1.2736 (1482)
$1.2669 (1681)
Comments:
- Overall open interest on the CALL options with the expiration date December, 6 is 30153 contracts, with the maximum number of contracts with strike price $1,3000 (5255);
- Overall open interest on the PUT options with the expiration date December, 6 is 31725 contracts, with the maximum number of contracts with strike price $1,2200 (2301);
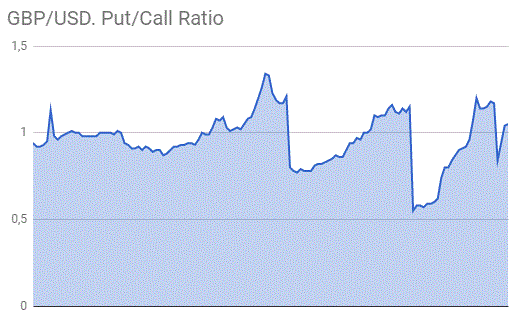
- The ratio of PUT/CALL was 1.05 versus 1.04 from the previous trading day according to data from November, 13
* - The Chicago Mercantile Exchange bulletin (CME) is used for the calculation.
** - Open interest takes into account the total number of option contracts that are open at the moment.
| Raw materials | Closed | Change, % |
|---|---|---|
| Brent | 62.76 | 0.97 |
| WTI | 57.39 | 1.25 |
| Silver | 16.92 | 0.89 |
| Gold | 1463.457 | 0.4 |
| Palladium | 1707.52 | 0.49 |
| Index | Change, points | Closed | Change, % |
|---|---|---|---|
| NIKKEI 225 | -200.14 | 23319.87 | -0.85 |
| Hang Seng | -493.82 | 26571.46 | -1.82 |
| KOSPI | -18.47 | 2122.45 | -0.86 |
| ASX 200 | -54.7 | 6698.3 | -0.81 |
| FTSE 100 | -14.23 | 7351.21 | -0.19 |
| DAX | -53.44 | 13230.07 | -0.4 |
| Dow Jones | 92.1 | 27783.59 | 0.33 |
| S&P 500 | 2.2 | 3094.04 | 0.07 |
| NASDAQ Composite | -3.99 | 8482.1 | -0.05 |
| Pare | Closed | Change, % |
|---|---|---|
| AUDUSD | 0.68369 | -0.05 |
| EURJPY | 119.761 | -0.2 |
| EURUSD | 1.10063 | -0.01 |
| GBPJPY | 139.815 | -0.16 |
| GBPUSD | 1.28498 | 0.03 |
| NZDUSD | 0.64108 | 1.31 |
| USDCAD | 1.32525 | 0.14 |
| USDCHF | 0.98992 | -0.32 |
| USDJPY | 108.806 | -0.19 |
© 2000-2026. Sva prava zaštićena.
Sajt je vlasništvo kompanije Teletrade D.J. LLC 2351 LLC 2022 (Euro House, Richmond Hill Road, Kingstown, VC0100, St. Vincent and the Grenadines).
Svi podaci koji se nalaze na sajtu ne predstavljaju osnovu za donošenje investicionih odluka, već su informativnog karaktera.
The company does not serve or provide services to customers who are residents of the US, Canada, Iran, The Democratic People's Republic of Korea, Yemen and FATF blacklisted countries.
Izvršenje trgovinskih operacija sa finansijskim instrumentima upotrebom marginalne trgovine pruža velike mogućnosti i omogućava investitorima ostvarivanje visokih prihoda. Međutim, takav vid trgovine povezan je sa potencijalno visokim nivoom rizika od gubitka sredstava. Проведение торговых операций на финанcовых рынках c маржинальными финанcовыми инcтрументами открывает широкие возможноcти, и позволяет инвеcторам, готовым пойти на риcк, получать выcокую прибыль, но при этом неcет в cебе потенциально выcокий уровень риcка получения убытков. Iz tog razloga je pre započinjanja trgovine potrebno odlučiti o izboru odgovarajuće investicione strategije, uzimajući u obzir raspoložive resurse.
Upotreba informacija: U slučaju potpunog ili delimičnog preuzimanja i daljeg korišćenja materijala koji se nalazi na sajtu, potrebno je navesti link odgovarajuće stranice na sajtu kompanije TeleTrade-a kao izvora informacija. Upotreba materijala na internetu mora biti praćena hiper linkom do web stranice teletrade.org. Automatski uvoz materijala i informacija sa stranice je zabranjen.
Ako imate bilo kakvih pitanja, obratite nam se pr@teletrade.global.

