- Analiza
- Novosti i instrumenti
- Vesti sa tržišta
Forex-novosti i prognoze od 14-06-2024
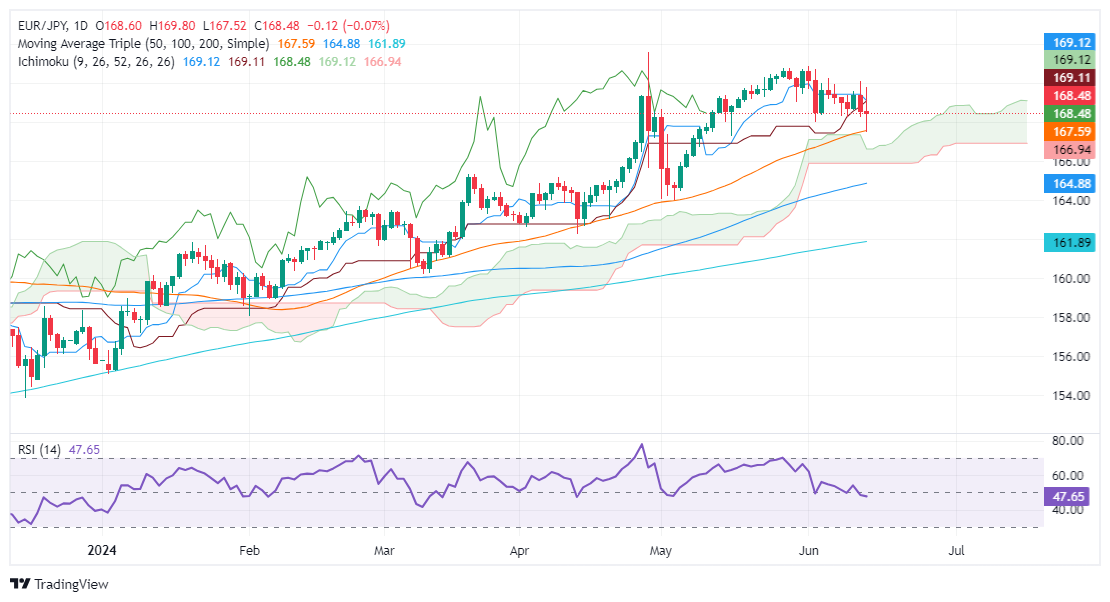
- EUR/JPY trades at 168.43, marking the second consecutive day of losses due to political uncertainty in France.
- Technical outlook: Consolidation below 170.00 with potential further losses if price drops below the 50-DMA at 167.47.
- Key support levels: Kumo bottom at 165.92 and 100-DMA at 164.78, indicating acceleration of the downtrend if breached.
The Euro tumbled for the second straight day against the Japanese Yen due to political uncertainty. France's presidential approvals plunged to their lowest level in five years ahead of the General Elections. The EUR/JPY trades at 168.43, down 0.08%.
EUR/JPY Price Analysis: Technical outlook
After peaking around 170.00, EUR/JPY has consolidated below this level but remains above the Ichimoku Cloud (Kumo), which would accelerate the downtrend if breached.
The Relative Strength Index (RSI) indicates that sellers are gaining momentum as it falls below the 50-line, suggesting that EUR/JPY could face further losses.
If EUR/JPY drops below the 50-day moving average (DMA) of 167.47, it could trigger a decline into the Kumo, signaling an acceleration of the downtrend. The next support would be the bottom of the Kumo at 165.92, followed by the 100-DMA at 164.78.
EUR/JPY Price Action - Daily Chart
- The NZD/USD stabilizes near 20-day SMA as bears intensify their attempts to breach the20-day SMA.
- Despite spirited defenses, both bulls and bears are yet to make significant headway.
- Daily chart indicators underscore continued consolidation with a slight downward momentum.
The NZD/USD dipped to a low of 0.6115 before recovering and stabilizing at the 20-day Simple Moving Average (SMA) of 0.6140. Both bulls and bears seem locked in an intense tussle with attempts to breach the 0.6220 area and the 20-day SMA respectively proving unsuccessful. This is indicative of an ongoing consolidation phase in the aftermath of Mid-May's sharp increase which saw the pair rise by more than 1.30%.
In the daily chart, the Relative Strength Index (RSI) has switched momentum and is now pointing downwards, suggesting a slight decline in buying pressure. This downward shift in the RSI is consistent with the flat red bars in the Moving Average Convergence Divergence (MACD), which further corroborates the consolidation narrative.
NZD/USD daily chart
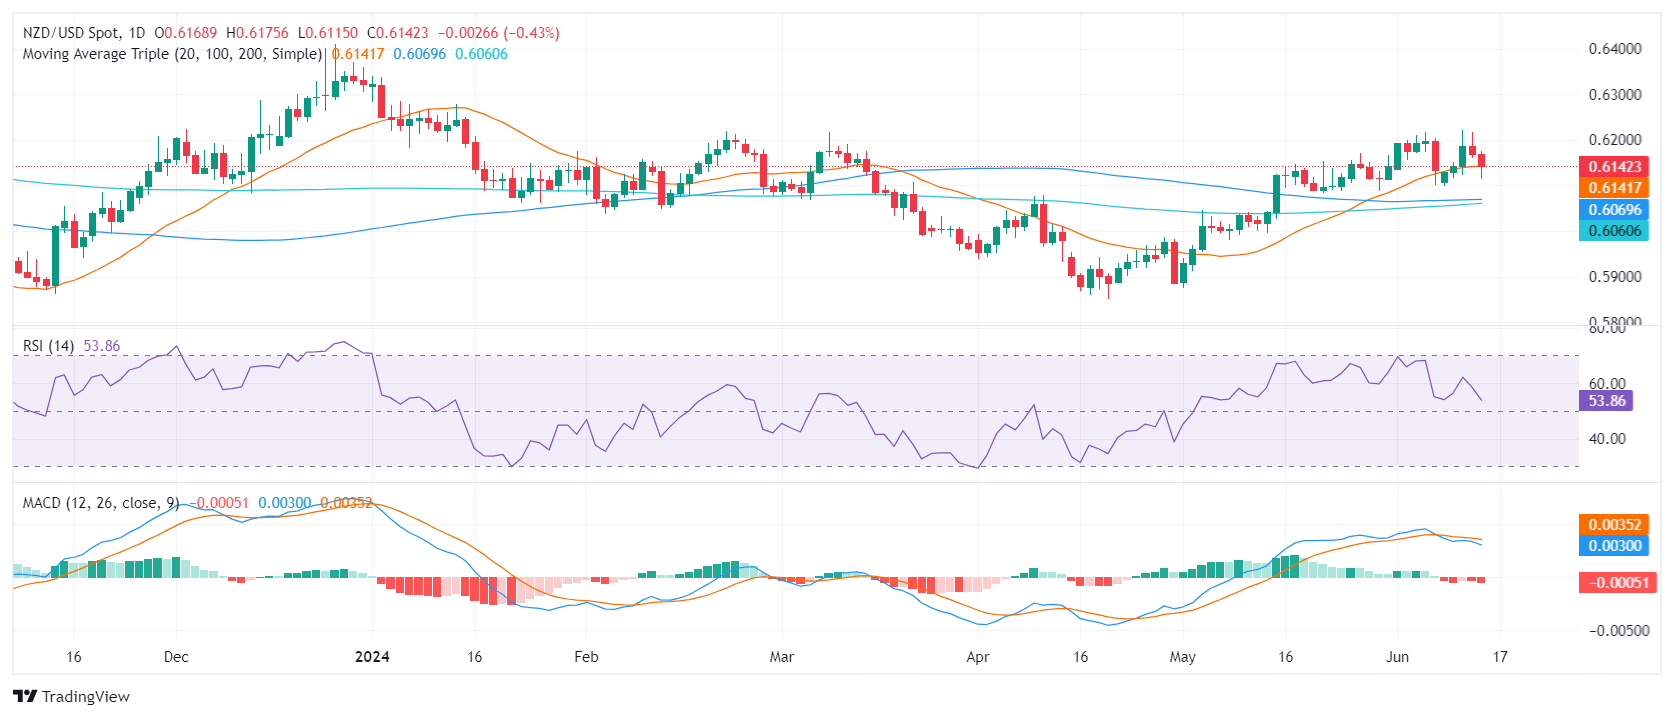
The NZD/USD's immediate support is now at the 20-day SMA of 0.6140, with the 100 and 200-day SMAs converging in the 0.6050-0.6060 region and providing a strong support base for the pair. This could potentially serve as an anchor for correction if bears begin to take control. Any movements below this point of convergence may potentially signal sell conditions.
On the upside, the 0.6200 is the main resistance which in case of being breached, could be considered a buy signal.
- EUR/USD tilted lower on Friday as politicalk upheaval crimps Euro demand.
- US consumer sentiment survey figures dipped in June.
- Markets are grappling with odds of fewer Fed rat cuts than hoped.
EUR/USD slipped further into the low end on Friday, clipping into 1.0670 before recovering to the 1.0700 handle during the US market session. Political pressure is weighing down the Euro after a wide shift in European voter sentiment tilted towards right-of-center political parties in European parliamentary elections recently, sparking a snap election in France. On the US side, steepening negative data is reigniting possible concerns of an economic downturn, fueled by a worse-than-expected print in the University of Michigan’s (UoM) Consumer Sentiment Survey Index.
European Central Bank (ECB) officials have been working to reassure the market as the Euro has performed poorly this week compared to other major currencies. French President Emmanuel Macron has dissolved the French government and called for a snap election in an effort to counter the rise of right-wing contender Marine Le Pen, who achieved a surprising victory in the European parliamentary elections.
With support for President Macron fading due to public discontent with unpopular fiscal policies, Le Pen, who has made several unsuccessful bids for the French Presidency since 2012, is trying for the fourth time. Financial markets are concerned about the political instability in France, as Le Pen's proposed tax cuts and reduced retirement age could lead to economic strain for the European Union.
The UoM Consumer Sentiment Index survey fell to 65.6 in June, missing the expected increase to 72.0 and dropping from the previous 69.1, reaching a six-month low. This decline reflects growing consumer concerns about the US economy. Additionally, 5-year Consumer Inflation Expectations rose to 3.1% from the previous 3.0%, indicating persistent price growth that is affecting consumers' economic outlook.
Market sentiment was negatively impacted this week by the Federal Reserve's latest Summary of Economic Projections (SEP), which showed that the market's expectations for multiple rate cuts are higher than what the Fed anticipates. The Fed's median interest rate expectations, represented in the "dot plot," were revised to only one rate cut in 2024, down from the three projected in March.
Despite the Fed's cautious stance, rate markets still anticipate a rate cut in September. According to the CME's FedWatch Tool, traders are pricing in nearly a 70% chance of at least a quarter-point rate reduction from the Fed at the September 18 meeting.
EUR/USD technical outlook
EUR/USD slid to a six-week low of 1.0676 on Friday before a mild recovery during the US market session, clawing back to the 1.0700 handle to wrap up the trading week. Fiber has declined in near-term choppy trading, descending from 1.0900 through June.
Daily candlesticks have tumbled back below the 200-day Exponential Moving Average (EMA) at 1.0804, and the way is clear for an extended slide to April’s swing low near 1.0600.
EUR/USD hourly chart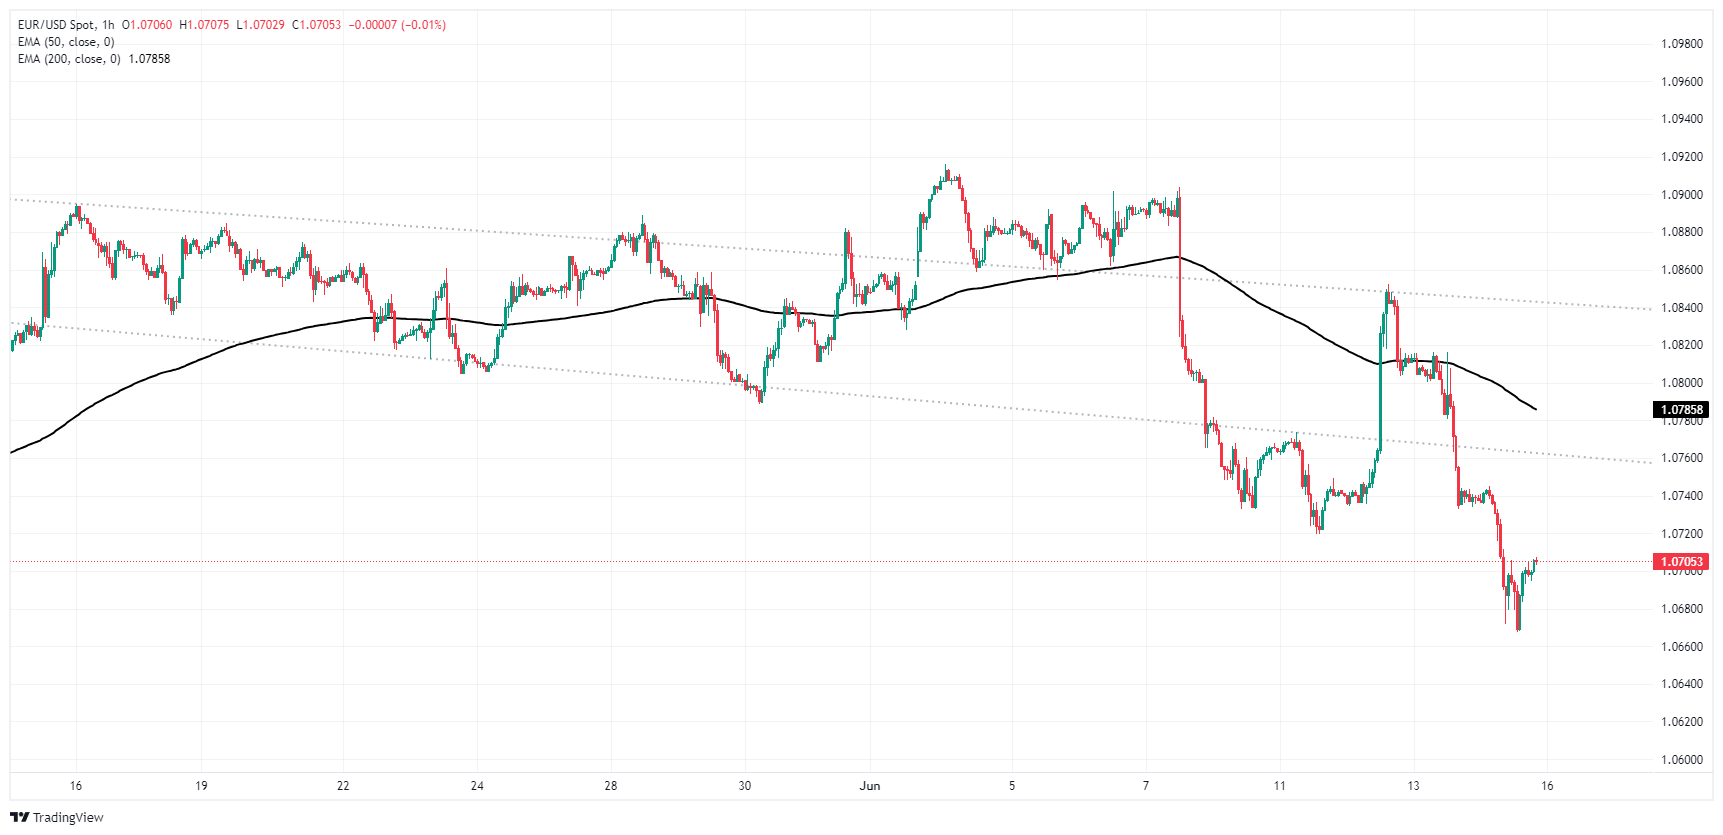
EUR/USD daily chart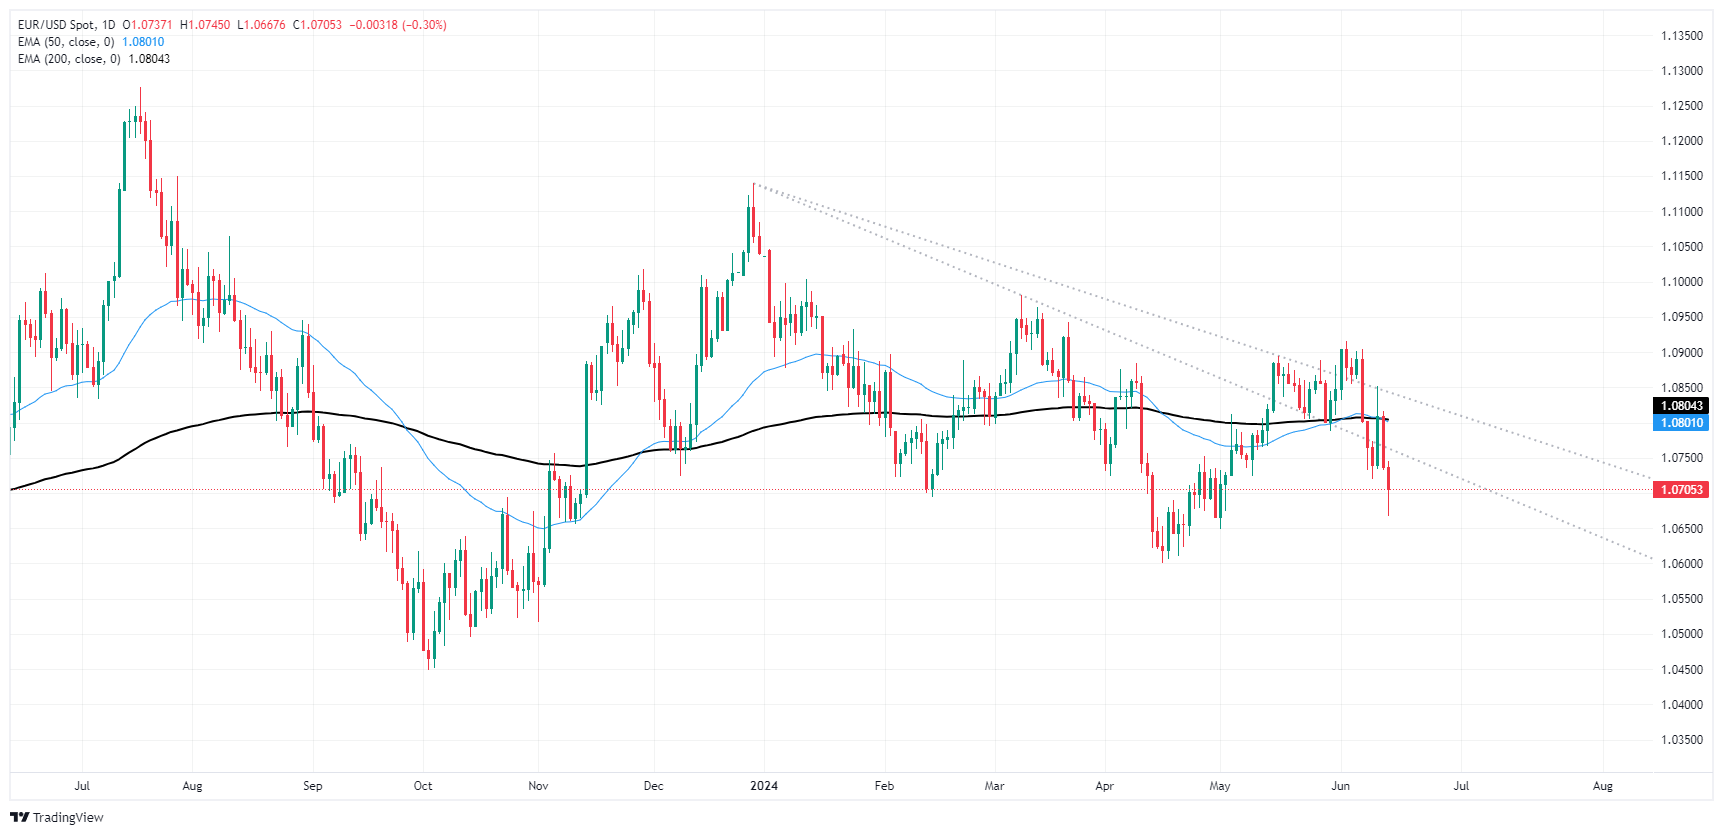
- The AUD/JPY pair witnesses further descent, as the ongoing profit-taking causes it to approach the reinforced 20-day SMA support.
- Should the bulls manage to establish robust support at the 20-day SMA, the next potential target appears to exist within the 104.50-105.00 price range.
In Friday's session, the AUD/JPY pair further descended as buyers continued to realize their profits, which led to the pair falling briefly below the 20-day Simple Moving Average (SMA) at 103.60, only to regain ground above the 104.00 mark. This bounce-back signals that the 20-day SMA has assumed the role of a robust support line. Nevertheless, the ongoing consolidation phase suggests a lack of drive for a significant surge.
On a daily scale, the Relative Strength Index (RSI) now reads 56, a slightly lower figure from Thursday's reading of 57. This indicates a marginal downward trend, signaling a potential easing of the previous upward momentum. Conversely, the Moving Average Convergence Divergence (MACD) continues to print flat red bars, signifying a stable selling momentum.
AUD/JPY daily chart
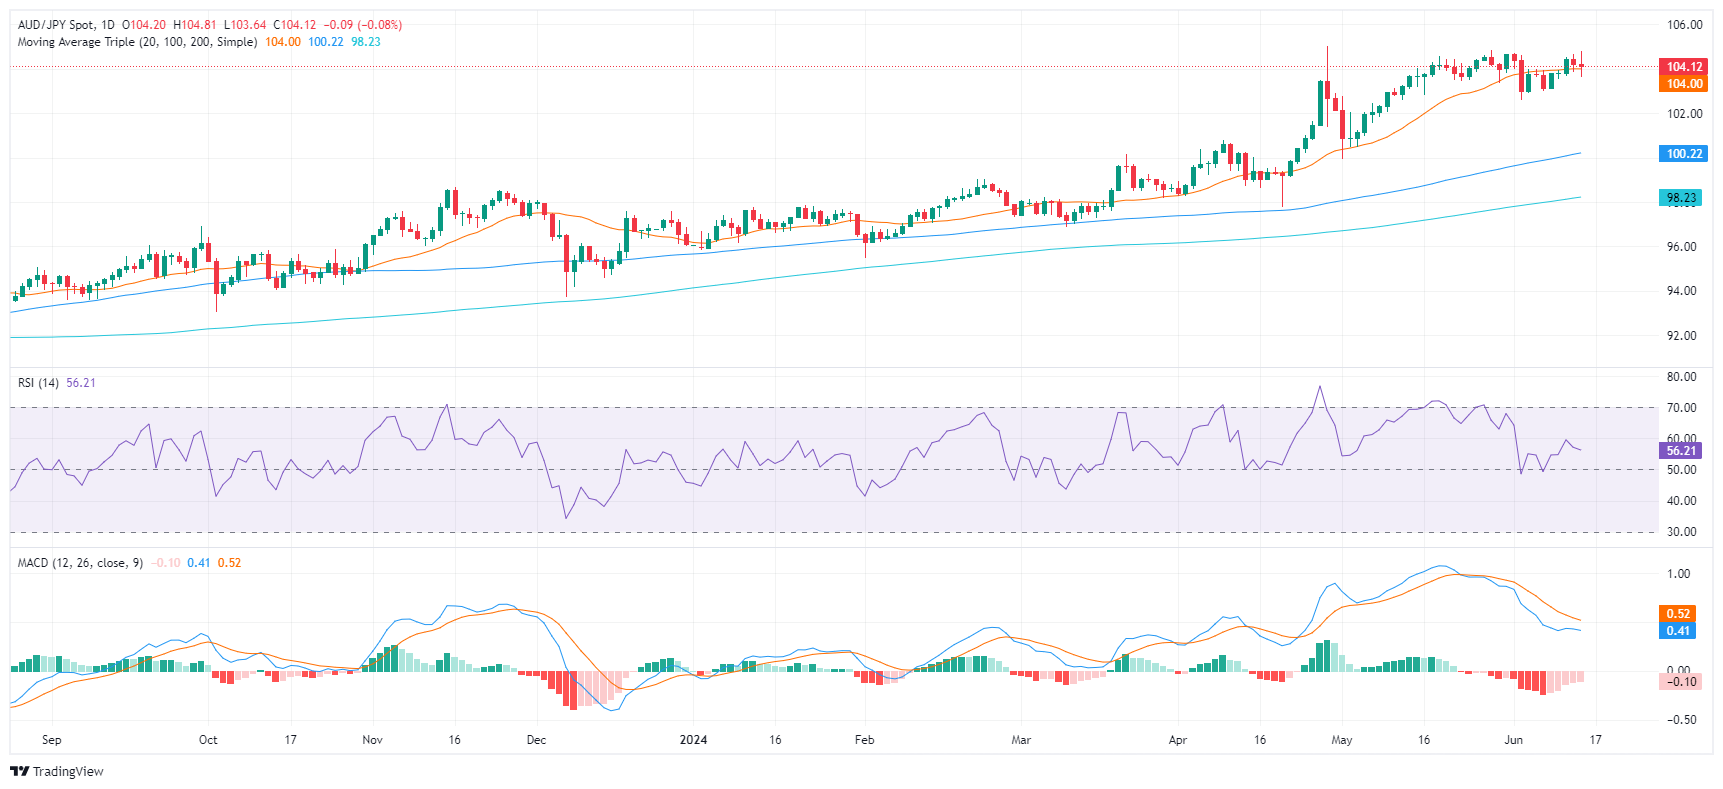
To wrap up, the AUD/JPY pair exhibits signs of ongoing consolidation, despite Friday's further descent, with trading activity concentrated around the 20-day SMA. The range of 102.00-104.00 for the imminent sessions could be indicative of continued side-ways trading as bulls look to consolidate the gains from May's rally that propelled the pair near the 105.00 mark.
Nonetheless, the consolidation could suggest the bulls are preparing for the next upward movement, potentially aiming for the 104.50-105.00 range once again. In contrast, a breach of the 20-day SMA could tempt the bears, with further supports lining up at 102.60, and the long-term 100 and 200-day SMAs, which reside in the 100.00 and 98.00 zone.
- Gold soars above $2,330 as investors bet on Fed rate cuts later this year.
- Risk aversion due to European political turmoil boosts demand for safe-haven assets like gold.
- US Consumer Sentiment dips in June, inflation expectations remain above Fed’s 2% target.
- XAU/USD is underpinned by fall of 10-year US Treasury yield.
Gold's price spiked during the North American session on Friday after inflation data in the United States (US) increased investors' hopes of the Federal Reserve (Fed) cutting interest rates later this year. Additionally, risk aversion, spurred by Europe’s political uncertainty, triggered a flight to safety, bolstering the golden metal.
The XAU/USD trades at $2,333, gaining more than 1.30% after bouncing off daily lows of $2,301. Sentiment remains sour, yet US equities recovered some during the last hour of trading, with the Nasdaq up 0.28%, while the S&P 500 trims its earlier losses, shy of being flat on the day at -0.10%.
On the data front, US Consumer Sentiment deteriorated in June, while inflation expectations for one and five years remained above the Fed’s 2% goal. Meanwhile, US inflation data revealed during the week was cheered by investors, who still bet that the US central bank will slash rates twice instead of just once, as policymakers projected.
Data from the Chicago Board of Trade (CBOT) shows traders expect 39 basis points (bps) of easing during the year via December’s 2024 fed funds rate contract.
The US 10-year Treasury note yield dropped three bps to 4.211%, a tailwind for the non-yielding metal, shrugging off China’s bullion purchasing pause.
News that the People’s Bank of China paused its 18-month bullion buying spree weighed on the precious metal. PBOC holdings held steady at 72.80 million troy ounces of Gold in May.
Daily digest market movers: Gold price strengthens amid strong US Dollar
- US Dollar Index (DXY) increased by 0.28% to 105.53, capping Gold prices.
- University of Michigan Consumer Sentiment Index fell to 65.6 in June from 69.1, missing the consensus estimate of 72. This marks the lowest level of sentiment in seven months.
- Inflation expectations for the next twelve months are projected to remain unchanged at 3.3%; while for the five-year period, inflation expectations are anticipated to decrease to 3.1%, down from the previous 3.3%.
- On Wednesday, Fed Chair Jerome Powell stated that they are less confident about inflation than previously "in order to cut." He added, "If jobs are to weaken unexpectedly, the Fed is ready to respond." When asked about the US CPI report, Powell noted that it is just one report and emphasized the need to see the deflation process evolving toward the Fed’s goal.
- Despite US CPI report showing disinflation process continuing, Fed Chair Jerome Powell commented that they remain “less confident” about the progress on inflation.
- Even though the latest US CPI and PPI reports were weaker than expected, the latest NFIB Small Business Optimism Index survey for May showed that businesses are struggling with higher prices and access to cheap financing.
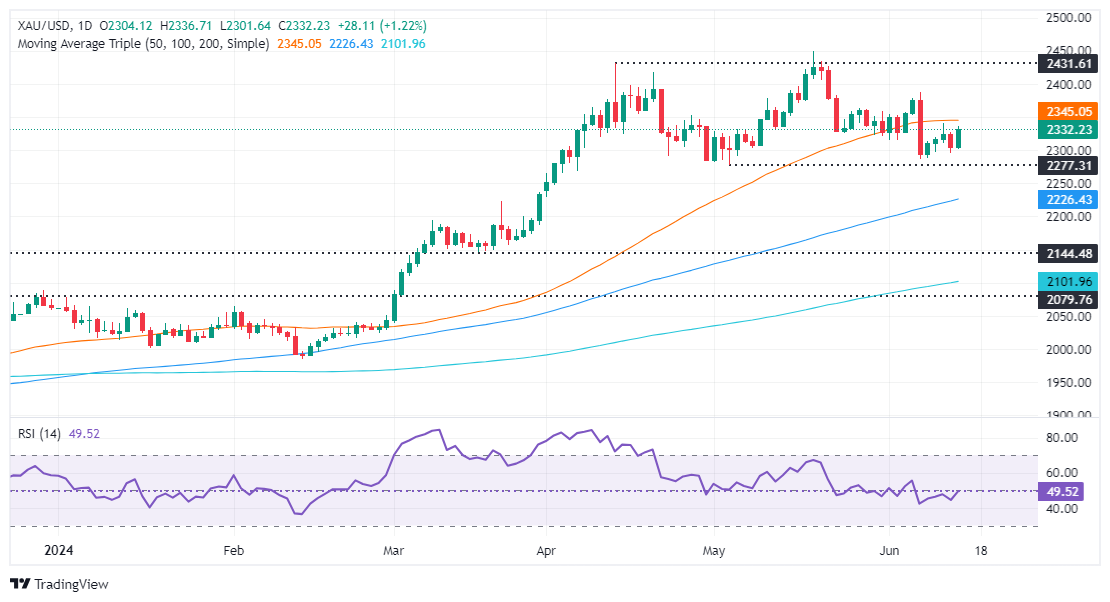
Technical analysis: Gold price sellers regain control as prices are headed toward $2,300
Gold price is neutral to downwardly biased as the Head-and-Shoulders chart pattern remains in place, suggesting the stage is set for further downside. Although momentum shows buyers’ recovery, the Relative Strength Index (RSI) remains bearish, suggesting that the uptrend could be short-lived and open the door for further losses.
If Gold extends its gains past the June 7 cycle high of $2,387, it will be ready to test the $2,400 figure. Conversely, if XAU/USD drops below $2,300, the first support would be the May 3 low of $2,277, followed by the March 21 high of $2,222. Further losses lie beneath, as sellers would eye the Head-and-Shoulders chart pattern objective at around $2,170 to $2,160.
Gold FAQs
Gold has played a key role in human’s history as it has been widely used as a store of value and medium of exchange. Currently, apart from its shine and usage for jewelry, the precious metal is widely seen as a safe-haven asset, meaning that it is considered a good investment during turbulent times. Gold is also widely seen as a hedge against inflation and against depreciating currencies as it doesn’t rely on any specific issuer or government.
Central banks are the biggest Gold holders. In their aim to support their currencies in turbulent times, central banks tend to diversify their reserves and buy Gold to improve the perceived strength of the economy and the currency. High Gold reserves can be a source of trust for a country’s solvency. Central banks added 1,136 tonnes of Gold worth around $70 billion to their reserves in 2022, according to data from the World Gold Council. This is the highest yearly purchase since records began. Central banks from emerging economies such as China, India and Turkey are quickly increasing their Gold reserves.
Gold has an inverse correlation with the US Dollar and US Treasuries, which are both major reserve and safe-haven assets. When the Dollar depreciates, Gold tends to rise, enabling investors and central banks to diversify their assets in turbulent times. Gold is also inversely correlated with risk assets. A rally in the stock market tends to weaken Gold price, while sell-offs in riskier markets tend to favor the precious metal.
The price can move due to a wide range of factors. Geopolitical instability or fears of a deep recession can quickly make Gold price escalate due to its safe-haven status. As a yield-less asset, Gold tends to rise with lower interest rates, while higher cost of money usually weighs down on the yellow metal. Still, most moves depend on how the US Dollar (USD) behaves as the asset is priced in dollars (XAU/USD). A strong Dollar tends to keep the price of Gold controlled, whereas a weaker Dollar is likely to push Gold prices up.
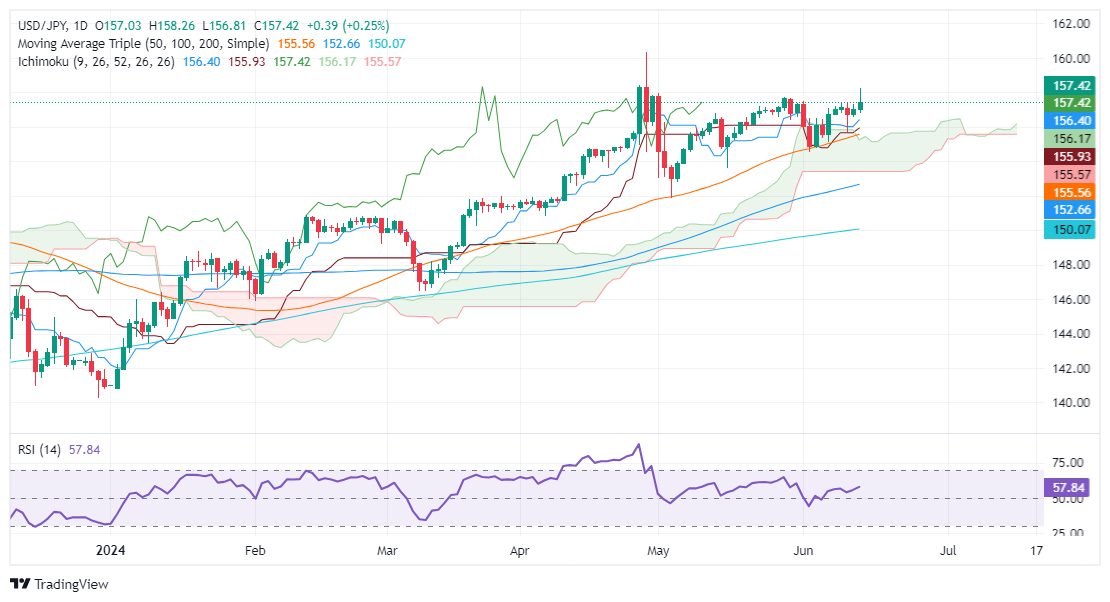
- USD/JPY trades at 157.36, up 0.22%, as BoJ keeps rates unchanged, weakening the JPY.
- Technical outlook: RSI indicates bullish momentum, with key resistance levels at 158.25 and 158.44.
- Support levels include the Tenkan-Sen at 156.00, June 12 low at 155.72, and Ichimoku Cloud low at 153.35/40.
The USD/JPY finishes the week on a higher note, registering gains of 0.22% on Friday after the Bank of Japan (BoJ) decided to hold rates unchanged, weakening the Japanese Yen (JPY). The Greenback strengthened due to risk aversion and the Wednesday Fed's hawkish hold. The pair trades at 157.36 at the time of writing.
USD/JPY Price Analysis: Technical outlook
From a technical standpoint, the USD/JPY climbs steadily, with buyers remaining in charge, as depicted by the Relative Strength Index (RSI). Momentum shows that bulls are losing steam, yet the RSI remains bullish.
The USD/JPY climbed past 157.00, and despite breaching 158.00, buyers failed to hold to its gains above the latter, which could have opened the door for further gains. If they would like to extend their profits, they must clear June’s 14 high of 158.25 before challenging the April 26 high of 158.44, ahead of 159.00. A breach of that level would clear the path to test the year-to-date (YTD) high of 160.32.
Conversely, if USD/JPY slides beneath the Tenkan-Sen at 156.00, the next stop would be June 12 low of 155.72. A breach of the latter and the pair could tumble toward the 154.00 figure, before testing the Ichimoku Cloud (Kumo) low of 153.35/40.
USD/JPY Price Action – Daily Chart
- Kiwi sees further consolidation against the Yen, maintaining support at the 20-day SMA after reaching the highest level since June 2007 on Thursday.
- Daily chart indicators are trending downwards, suggesting potential additional consolidation in the next sessions.
- Attempts to retest the 97.00 level are projected, but a break above this resistance seems improbable.
Friday records an extended consolidation phase for the NZD/JPY pair, maintaining its level after reaching the multi-year highs logged earlier the week. The technical landscape evidences the continuation of the consolidation phase, possibly constricting the pair's upside movements under the psychological resistance level of 97.00.
The daily Relative Strength Index (RSI) for NZD/JPY stands at 57, retracing slightly downwards and hinting at a decrease in the bullish momentum. The Moving Average Convergence Divergence (MACD) persists in printing flat red bars, reinforcing the notion of ongoing consolidation.
NZD/JPY daily chart
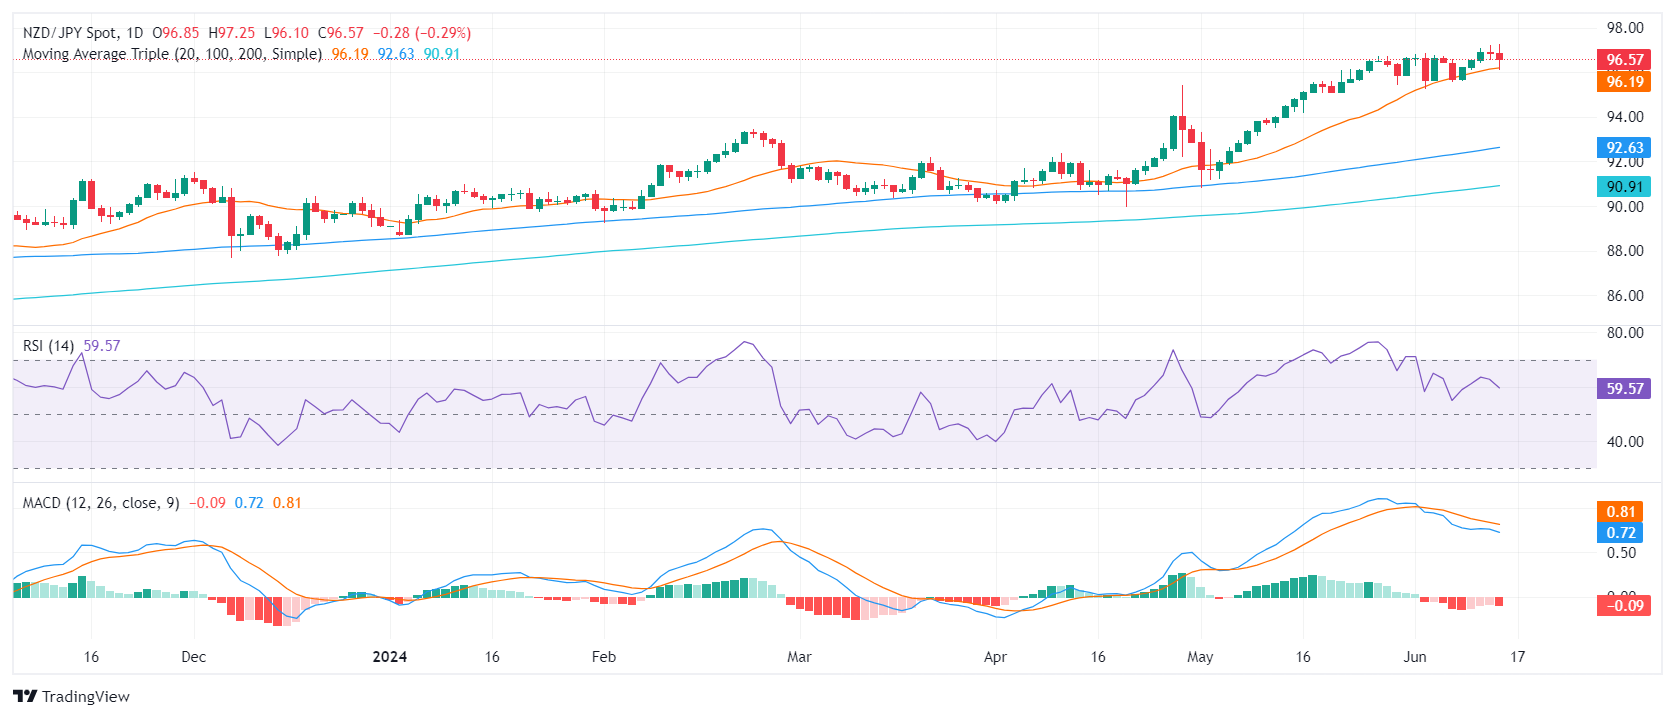
The uninterrupted presence of buyers above the 20-day Simple Moving Average (SMA) implies a concerted effort to uphold the bullish trend. That said, the exhaustion signal observed in the daily technical indicators underscores the market's need for additional consolidation after the significant bounce to 96.00 since May. The forthcoming trading sessions may see the pair oscillate between the support level of 95.00 and the resistance level of 97.00 as the pair ranks among the highest since June 2007.
The longer-term 100-day and 200-day SMAs established around 90.00 - 92.00 continue to safeguard the overall bullish outlook of the pair. Moreover, the 95.30 area also provides notable support against potential losses.
Austan Goolsbee, President of the Federal Reserve (Fed) Bank of Chicago cautioned that he still wants to see further progress on inflation, but sees the possibility of worsening conditions in manufacturing and argiculture. Chicago Fed head Goolsbee was speaking at the Iowa Farm Bureau Economic Summit Ankeny, Iowa.
Key highlights
Manufacturing and agriculture feel closer to the edge of a downturn.
If we keep making progress on inflation, and the rates can come down, we may avoid recession.
As European countries cut rates, that could push up the dollar.
A stronger dollar would affect the export-import balance, and affect US employment and inflation.
If inflation ahead behaves as it did in the first quarter, we would have a hard time cutting rates.
The unemployment rate, quit rate, and the ratio of jobs to opening, looks like the labor market is cooling.
I don't take too much signal from the monthly payrolls data by itself.
- Dow Jones rises intraday, but still on the low side of Thursday’s close.
- UoM”s Consumer Sentiment Index flubs forecasts, declines further.
- Consumer inflation expectations ticked higher in June.
The Dow Jones Industrial Average (DJIA) climbed from an early low on Friday, but sill traded on the low side of Thursday’s closing bids after getting knocked further back during the overnight session. Friday has been a slow grind as markets attempt to recover lost ground, but market confidence remains half-hearted after the University of Michigan’s (UoM) Consumer Sentiment Index declined to a six-month low and missed a forecast recovery, while the UoM’s Consumer Inflation Expectations ticked back into a recent high as spenders continue to remain despondent on future price growth.
The UoM Consumer Sentiment Index survey declined to 65.6 in June, entirely missing the forecast uptick to 72,0 and dropping from the previous 69.1, tumbling to a six-month low as consumers grow increasingly fearful about the state of the US economy. 5-year Consumer Inflation Expectations also ticked back up to a familiar high of 3.1% from the previous 3.0% as price growth continues to weigh on consumers’ economic outlook.
The wind was taken out of market sails this week after the Federal Reserve’s (Fed) latest Summary of Economic Projections (SEP) revealed that market hopes for multiple rate cuts continue to run well ahead of what the Fed expects in the future. The Fed’s “dot plot” of median interest rate expectations shifted lower to only a single rate cut in 2024, down even further from the three projected in March.
Despite the cautious tone from the Fed, rate markets are still pricing in hopes for a September rate cut. According to the CME’s FedWatch Tool, rate traders are pricing in nearly 70% odds of at least a quarter-point rate trim from the Fed at the September 18 rate decision.
Dow Jones news
Two-thirds of the Dow Jones’ constituent securities are in the red on Friday as sentiment tilts lower. Salesforce Inc. (CRM) is recovering from near-term selling pressure, climbing 1.3% to $232.00 per share to lead the scant gainers on the Dow Jones for the day. On the low side, Boeing Co. (BA) has declined -2.06% on Friday, backsliding below $55.00 per share.
Dow Jones technical outlook
Friday’s US session etched in a new weekly low in the Dow Jones, declining to 38,300.00 near the day’s market open before making a meager recovery to chart territory just above 38,500.00. Bullish momentum still has the DJIA trading below Thursday’s closing bids near 38,650.00, but an exhaustion play could easily drag the major equity index back towards the 38,000.00 handle.
The Dow Jones Industrial Average is on pace to close slightly lower for a fourth consecutive day on Friday, and the index has continued waffle down from recent all-time highs above 40,000.00 set in May. The index continues to hold north of the 200-day Exponential Moving Average (EMA) at 37,369.62, and a demand zone is holding in place to catch any short side pushes below the 38,000.00 handle.
Dow Jones five minute chart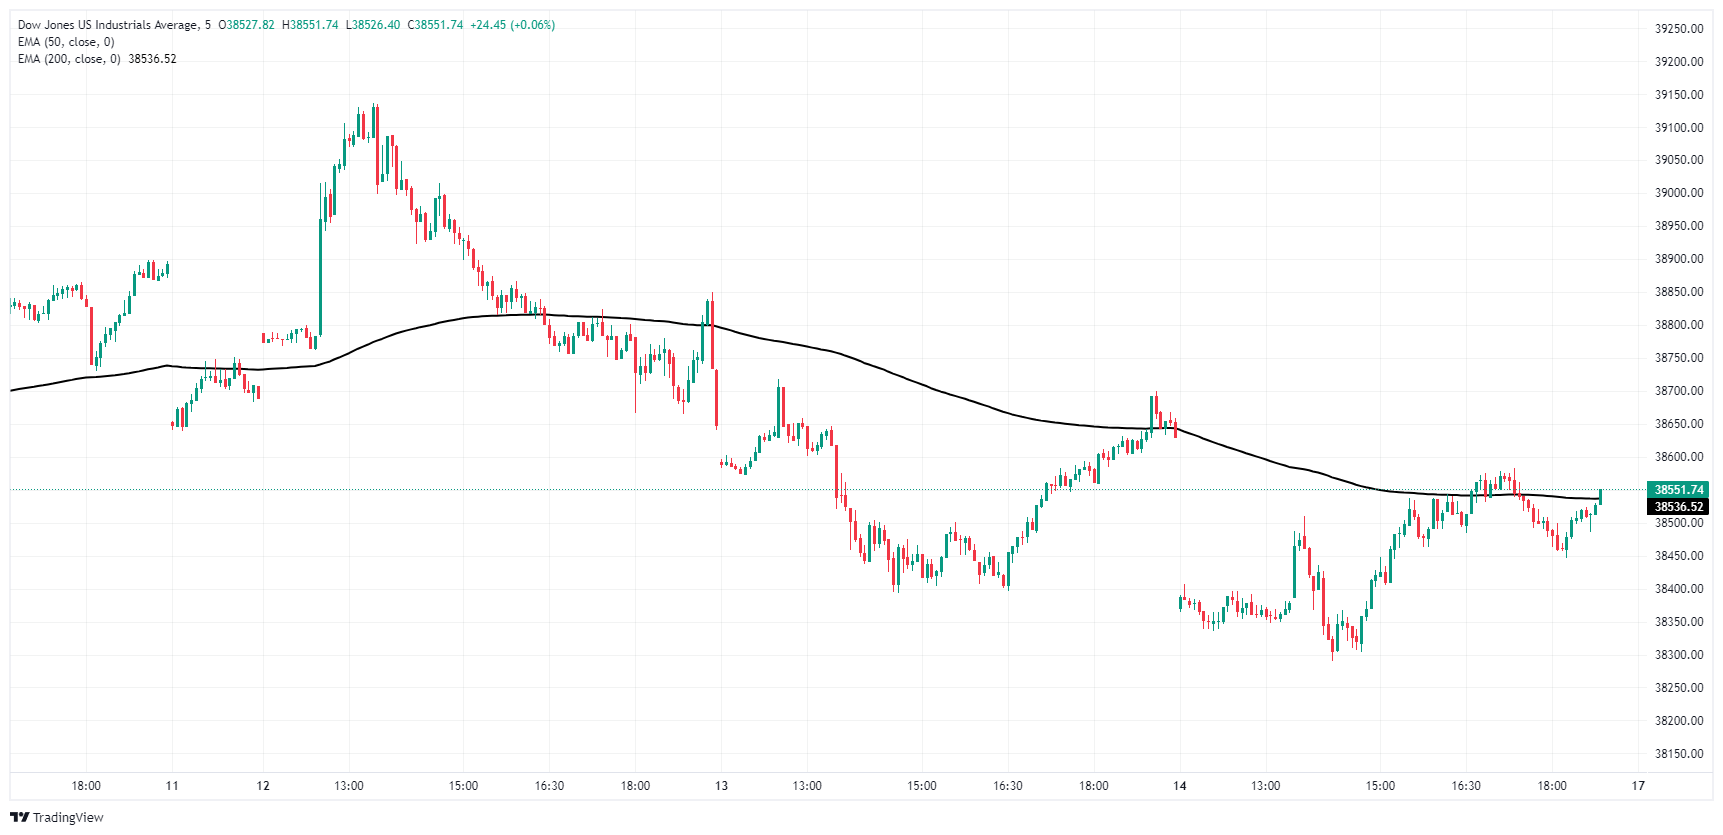
Dow Jones daily chart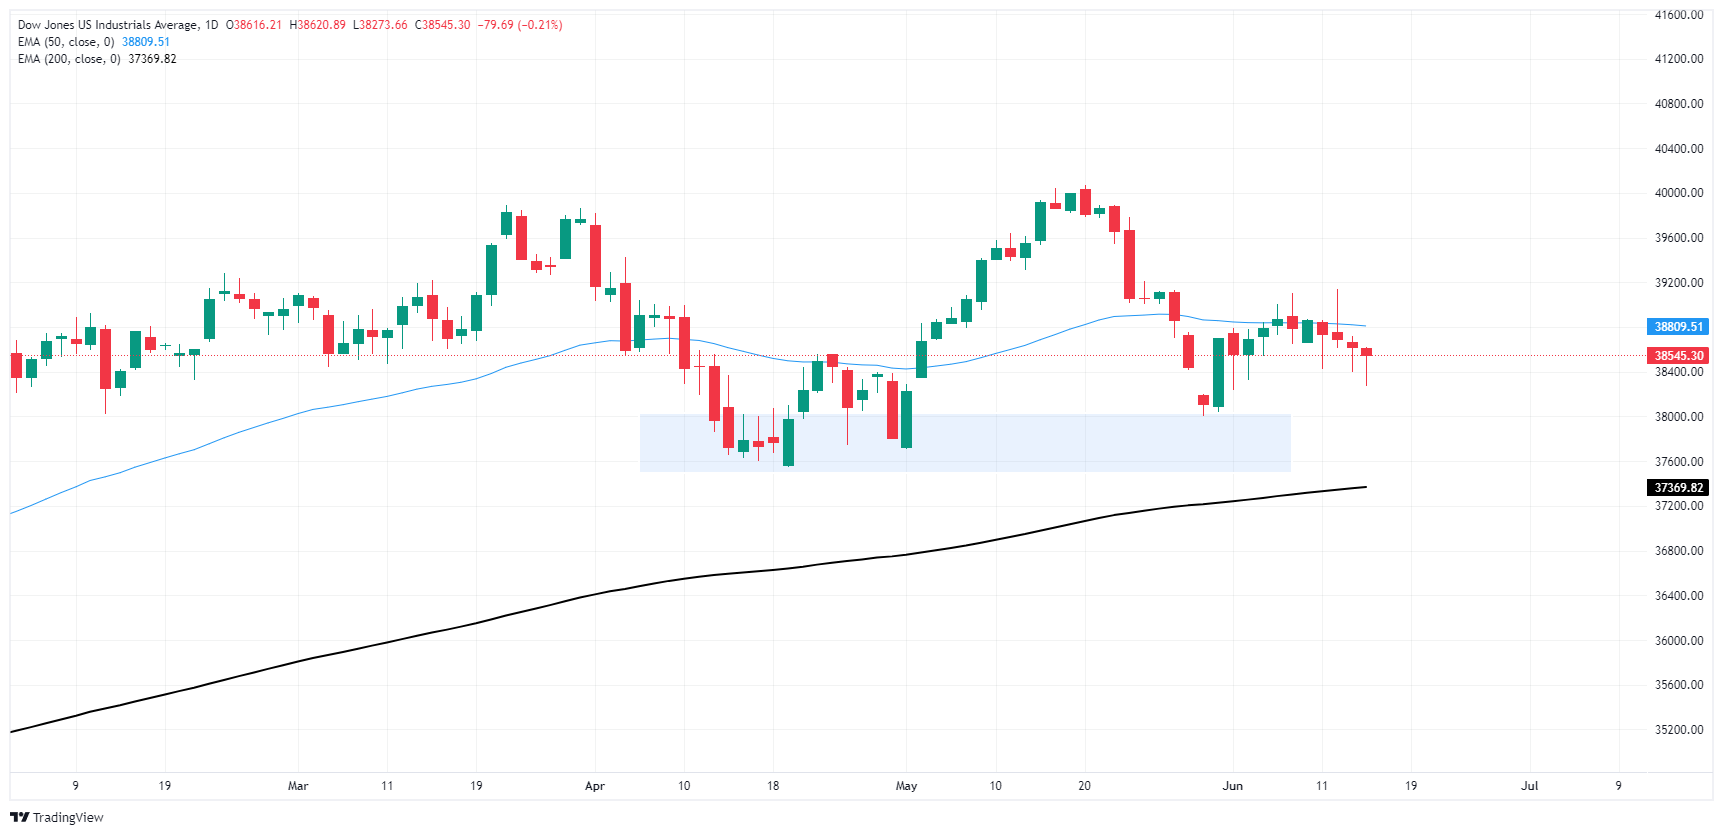
Dow Jones FAQs
The Dow Jones Industrial Average, one of the oldest stock market indices in the world, is compiled of the 30 most traded stocks in the US. The index is price-weighted rather than weighted by capitalization. It is calculated by summing the prices of the constituent stocks and dividing them by a factor, currently 0.152. The index was founded by Charles Dow, who also founded the Wall Street Journal. In later years it has been criticized for not being broadly representative enough because it only tracks 30 conglomerates, unlike broader indices such as the S&P 500.
Many different factors drive the Dow Jones Industrial Average (DJIA). The aggregate performance of the component companies revealed in quarterly company earnings reports is the main one. US and global macroeconomic data also contributes as it impacts on investor sentiment. The level of interest rates, set by the Federal Reserve (Fed), also influences the DJIA as it affects the cost of credit, on which many corporations are heavily reliant. Therefore, inflation can be a major driver as well as other metrics which impact the Fed decisions.
Dow Theory is a method for identifying the primary trend of the stock market developed by Charles Dow. A key step is to compare the direction of the Dow Jones Industrial Average (DJIA) and the Dow Jones Transportation Average (DJTA) and only follow trends where both are moving in the same direction. Volume is a confirmatory criteria. The theory uses elements of peak and trough analysis. Dow’s theory posits three trend phases: accumulation, when smart money starts buying or selling; public participation, when the wider public joins in; and distribution, when the smart money exits.
There are a number of ways to trade the DJIA. One is to use ETFs which allow investors to trade the DJIA as a single security, rather than having to buy shares in all 30 constituent companies. A leading example is the SPDR Dow Jones Industrial Average ETF (DIA). DJIA futures contracts enable traders to speculate on the future value of the index and Options provide the right, but not the obligation, to buy or sell the index at a predetermined price in the future. Mutual funds enable investors to buy a share of a diversified portfolio of DJIA stocks thus providing exposure to the overall index.
- AUD/USD continues its decline as markets gear up for RBA’s decision next week.
- Federal Reserve's projection of higher interest rates continues to bolster USD.
- Australian calendar was empty on Friday, and USD suffers minimal intraday losses on soft UoM figures.
The Australian Dollar (AUD) experienced additional losses against the US Dollar (USD) despite strong labor market data from Australia reported earlier in the week, which prompted for a more hawkish Reserve Bank of Australia (RBA). The demand for the US seems to be growing thanks to interest rate revisions, which saw Federal Reserve (Fed) members forecasting fewer rate cuts this year. Additionally, the Greenback retained its strength despite soft University of Michigan (UoM) figures reported during the European session.
The Australian economy has shown signs of weakness yet the persistent high inflation is prompting the Reserve Bank of Australia (RBA) to delay cuts, which may limit its decline. The RBA meets next Tuesday, and investors will look for further clues. Markets are pricing the first rate cut only for May 2025. Still, risks are skewed toward an earlier start.
Daily digest market movers: Australian Dollar sustains sell-off, markets digest UoM figures from the US
- No significant highlights were detected from the Australian economy on Friday.
- On the US side, Consumer confidence deteriorated with the University of Michigan's Consumer Sentiment Index decreasing to 65.6 from 69.1 in May. This reading came in below market expectations of 72.
- The Current Conditions Index declined to 62.5 from 69.6, and the Consumer Expectations Index fell to 67.6 from 68.8.
- The survey details revealed that the one-year inflation expectation remained stable at 3.3%, while the five-year inflation outlook rose to 3.1% from 3%.
- Earlier in the week, stronger-than-expected Employment data for May bolstered speculation that the Reserve Bank of Australia (RBA) would maintain its Official Cash Rate at its current levels for the year.
- In addition, the Australian Unemployment Rate reduced to 4.0% as projected from 4.1% in April.
- On the Fed’s side, market hopes for rate cuts have persistently clashed with the Fed’s own rate cut expectations through 2024, and according to the CME’s FedWatch Tool, rate markets maintain over 60% odds of at least a 25 basis-point rate trim on September 18.
Technical analysis: AUD/USD sellers persist, outlook turns negative
The Relative Strength Index (RSI) now sits below 50 and points downwards indicating a negative momentum. Meanwhile, the Moving Average Convergence Divergence (MACD) prints steady rising red bars hinting at persistent selling pressure.
The short-term outlook has turned negative as the pair fell below the 20-day Simple Moving Average (SMA) toward 0.6613, indicating a loss in buying steam. If this trend continues, the 100 and 200-day Simple Moving Averages (SMAs) could serve as potential barriers around the 0.6560 area.
Australian Dollar FAQs
One of the most significant factors for the Australian Dollar (AUD) is the level of interest rates set by the Reserve Bank of Australia (RBA). Because Australia is a resource-rich country another key driver is the price of its biggest export, Iron Ore. The health of the Chinese economy, its largest trading partner, is a factor, as well as inflation in Australia, its growth rate and Trade Balance. Market sentiment – whether investors are taking on more risky assets (risk-on) or seeking safe-havens (risk-off) – is also a factor, with risk-on positive for AUD.
The Reserve Bank of Australia (RBA) influences the Australian Dollar (AUD) by setting the level of interest rates that Australian banks can lend to each other. This influences the level of interest rates in the economy as a whole. The main goal of the RBA is to maintain a stable inflation rate of 2-3% by adjusting interest rates up or down. Relatively high interest rates compared to other major central banks support the AUD, and the opposite for relatively low. The RBA can also use quantitative easing and tightening to influence credit conditions, with the former AUD-negative and the latter AUD-positive.
China is Australia’s largest trading partner so the health of the Chinese economy is a major influence on the value of the Australian Dollar (AUD). When the Chinese economy is doing well it purchases more raw materials, goods and services from Australia, lifting demand for the AUD, and pushing up its value. The opposite is the case when the Chinese economy is not growing as fast as expected. Positive or negative surprises in Chinese growth data, therefore, often have a direct impact on the Australian Dollar and its pairs.
Iron Ore is Australia’s largest export, accounting for $118 billion a year according to data from 2021, with China as its primary destination. The price of Iron Ore, therefore, can be a driver of the Australian Dollar. Generally, if the price of Iron Ore rises, AUD also goes up, as aggregate demand for the currency increases. The opposite is the case if the price of Iron Ore falls. Higher Iron Ore prices also tend to result in a greater likelihood of a positive Trade Balance for Australia, which is also positive of the AUD.
The Trade Balance, which is the difference between what a country earns from its exports versus what it pays for its imports, is another factor that can influence the value of the Australian Dollar. If Australia produces highly sought after exports, then its currency will gain in value purely from the surplus demand created from foreign buyers seeking to purchase its exports versus what it spends to purchase imports. Therefore, a positive net Trade Balance strengthens the AUD, with the opposite effect if the Trade Balance is negative.
- Mexican Peso down as judiciary reform fears continue to weigh on investor sentiment.
- Presumptive President Claudia Sheinbaum reassures investors but echoes President AMLO’s proposal for elected judges.
- Banxico ready to act against volatility, while Fed's unchanged rate decision and consumer sentiment data bolster USD/MXN.
The Mexican Peso's downtrend continued Friday, with the emerging market currency depreciating by 0.48% as market participants were still nervous about the judiciary reform. Presumptive President Claudia Sheinbaum reiterated Thursday that the reform is a go, emphasizing that judges should be elected, agreeing with President Andres Manuel Lopez Obrador's proposal. Therefore, the Peso continues to weaken, and the USD/MXN trades at 18.44.
Mexico’s presumptive President Claudia Sheinbaum reassured investors that they shouldn’t be concerned about the reforms. She said, “Mexico’s economy is healthy, strong, and [there is] nothing to worry about.”
Meanwhile, Bank of Mexico (Banxico) Governor Victoria Rodriguez Ceja said on Wednesday that the central bank is attentive to volatility in the Mexican currency exchange rate and could act to restore “order” in markets.
Across the border, the latest Federal Reserve (Fed) decision to keep rates unchanged and projection of just one interest rate cut in 2024 cushioned the Greenback and boosted the USD/MXN to 14-month highs.
A survey by the University of Michigan (UoM) showed that consumer sentiment amongst Americans deteriorated further, blamed on inflation and incomers. Joanne Hsu, the Director of the Consumers Survey, said that “Assessments of personal finances dipped, due to modestly rising concerns over high prices as well as weakening incomes. Overall consumers perceive few changes in the economy from May.”
Daily digest market movers: Mexican Peso trims some of Thursday’s gains
- In February 2024, AMLO put forward several proposals to the Mexican Congress. These include a Supreme Court reform that suggests electing Supreme Court ministers through popular vote; an electoral reform aimed at electing electoral commission councilors by popular vote and reducing multi-member representation; and a reform of autonomous bodies that proposes dissolving the transparency body.
- Mexican Peso depreciation could weigh on Banxico decision to ease policy on June 27 despite last month’s dip in core prices. Therefore, keeping interest rates higher could prompt deceleration in the economy and increase the odds of a possible recession.
- Mexico's economic docket for next week will feature Aggregate Demand, Private Spending, and Retail Sales data. Despite that, the USD/MXN exchange rate continues to be driven by political uncertainty about the changes to the Mexican Constitution that threaten the state of law.
- Morgan Stanley noted that if Mexico’s upcoming government and Congress adopted an unorthodox agenda, it would undermine Mexican institutions and be bearish for the Mexican Peso, which could weaken to 19.20.
- The UoM Consumer Sentiment Index in June fell to 65.6 from 69.1 and missed the consensus of 72. Sentiment dropped to its lowest level in seven months. Inflation expectations for the next twelve months are expected to remain at 3.3%, unchanged, and for a five-year period, they are foreseen at 3.1%, down from 3.3%.
- Latest US inflation report increased the odds of a Fed rate cut in September from 46.7% to 62%, according to CME FedWatch Tool.
- December’s 2024 fed funds futures contract hints that investors expect 39 basis points of rate cuts by the Fed through the end of the year.
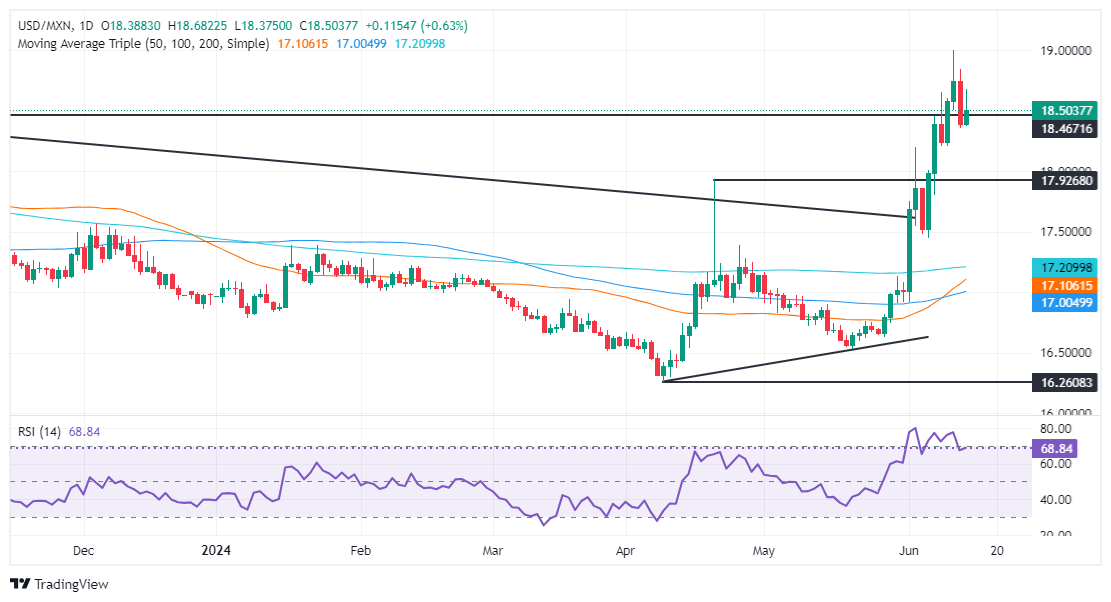
Technical analysis: Mexican Peso prints losses as USD/MXN slides below 18.50
The USD/MXN pair is upwardly biased despite retreating below 18.50. Although momentum is tilted in the seller's favor, according to the Relative Strength Index (RSI), they need to push the USD/MXN exchange rate below the April 19 high of 18.15 if they would like to keep the exotic pair trading within the 18.00-18.15 range.
On the buyer's side, if USD/MXN breaches 18.50, the next resistance level would be the year-to-date high of 18.99, followed by March 20, 2023, high of 19.23. A breach of the latter will sponsor an uptick to 19.50, ahead of the psychological 20.00 mark.
Mexican Peso FAQs
The Mexican Peso (MXN) is the most traded currency among its Latin American peers. Its value is broadly determined by the performance of the Mexican economy, the country’s central bank’s policy, the amount of foreign investment in the country and even the levels of remittances sent by Mexicans who live abroad, particularly in the United States. Geopolitical trends can also move MXN: for example, the process of nearshoring – or the decision by some firms to relocate manufacturing capacity and supply chains closer to their home countries – is also seen as a catalyst for the Mexican currency as the country is considered a key manufacturing hub in the American continent. Another catalyst for MXN is Oil prices as Mexico is a key exporter of the commodity.
The main objective of Mexico’s central bank, also known as Banxico, is to maintain inflation at low and stable levels (at or close to its target of 3%, the midpoint in a tolerance band of between 2% and 4%). To this end, the bank sets an appropriate level of interest rates. When inflation is too high, Banxico will attempt to tame it by raising interest rates, making it more expensive for households and businesses to borrow money, thus cooling demand and the overall economy. Higher interest rates are generally positive for the Mexican Peso (MXN) as they lead to higher yields, making the country a more attractive place for investors. On the contrary, lower interest rates tend to weaken MXN.
Macroeconomic data releases are key to assess the state of the economy and can have an impact on the Mexican Peso (MXN) valuation. A strong Mexican economy, based on high economic growth, low unemployment and high confidence is good for MXN. Not only does it attract more foreign investment but it may encourage the Bank of Mexico (Banxico) to increase interest rates, particularly if this strength comes together with elevated inflation. However, if economic data is weak, MXN is likely to depreciate.
As an emerging-market currency, the Mexican Peso (MXN) tends to strive during risk-on periods, or when investors perceive that broader market risks are low and thus are eager to engage with investments that carry a higher risk. Conversely, MXN tends to weaken at times of market turbulence or economic uncertainty as investors tend to sell higher-risk assets and flee to the more-stable safe havens.
Federal Reserve (Fed) Bank of Cleveland President Loretta Mester noted on Friday that she would like to see a longer run of good-looking inflation data, and noted that the path towards the Fed's 2.0% inflation goal may take longer than expected.
Key highlights
There is still work to do to gain confidence in inflation.
The median SEP projection close to Mester's on the economy.
We probably won't get to 2.0% inflation until 2026.
I want to maintain healthy job market as inflation falls.
Policy is well-positioned for risks on both sides.
Businesses say its harder to raise prices this year.
As inflation comes down, both mandates remain very important.
I didn't revise my SEP forecasts after the CPI data.
I penciled in 3% for longer-term rate in latest forecasts.
Risks to inflation to the upside, dual-sided for the job market.
- Canadian Dollar is broadly higher on Friday but only slightly.
- Canada missed forecasts on manufacturing and wholesale figures.
- US Consumer Sentiment survey dominates news flow in American session.
The Canadian Dollar (CAD) found a thin recovery on Friday, gaining ground against most of its major currency peers and clawing back a scant tenth of a percent against the US Dollar (USD). A missed forecast in Canadian Manufacturing Sales was broadly brushed off, and an unexpected backslide in the University of Michigan’s (UoM) Consumer Sentiment is throwing a cautionary wrench in market sentiment to wrap up the trading week.
Manufacturing and Wholesale Sales in Canada saw a milder recovery from recent contractions than expected, but market sentiment is largely focused elsewhere after the UoM Consumer Sentiment Index fell to a six-month low, and 5-year Consumer Inflation Expectations ticked higher in June.
Daily digest market movers: Canadian Dollar grinds out thin gains despite forecast miss
- Canadian Manufacturing Sales rebounded 1.1% MoM in April, slightly missing the forecast 1.2% and recovering from the previous month’s revised -1.8%.
- Wholesale Sales recovered 2.4% over the same period but missed the expected 2.8%. Wholesale Sales provided a firmer recovery from the previous -1.3%, which was also revised slightly lower from -1.1%.
- UoM Consumer Sentiment Index unexpectedly declined in June, falling to 65.6 after markets expected a climb to 72.0 from the previous 69.1. The backslide represents the key sentiment indicator’s worst print in six months.
- UoM 5-year Consumer Inflation Expectations also rose in June, climbing to 3.1% from the previous 3.0%. According to the UoM’s consumer survey, spender expectations of future inflation have climbed to their second-highest level since the covid pandemic era.
- Coming up next week, Canadian data continues to play second fiddle, restricted to mid-tier releases at best throughout the week. US Retail Sales will be a key print on Tuesday.
Canadian Dollar PRICE Today
The table below shows the percentage change of Canadian Dollar (CAD) against listed major currencies today. Canadian Dollar was the strongest against the British Pound.
| USD | EUR | GBP | JPY | CAD | AUD | NZD | CHF | |
|---|---|---|---|---|---|---|---|---|
| USD | 0.36% | 0.61% | 0.17% | -0.01% | 0.34% | 0.49% | -0.45% | |
| EUR | -0.36% | 0.26% | -0.17% | -0.39% | -0.03% | 0.13% | -0.80% | |
| GBP | -0.61% | -0.26% | -0.42% | -0.63% | -0.27% | -0.13% | -1.05% | |
| JPY | -0.17% | 0.17% | 0.42% | -0.19% | 0.16% | 0.30% | -0.60% | |
| CAD | 0.01% | 0.39% | 0.63% | 0.19% | 0.36% | 0.49% | -0.43% | |
| AUD | -0.34% | 0.03% | 0.27% | -0.16% | -0.36% | 0.14% | -0.80% | |
| NZD | -0.49% | -0.13% | 0.13% | -0.30% | -0.49% | -0.14% | -0.92% | |
| CHF | 0.45% | 0.80% | 1.05% | 0.60% | 0.43% | 0.80% | 0.92% |
The heat map shows percentage changes of major currencies against each other. The base currency is picked from the left column, while the quote currency is picked from the top row. For example, if you pick the Canadian Dollar from the left column and move along the horizontal line to the US Dollar, the percentage change displayed in the box will represent CAD (base)/USD (quote).
Technical analysis: Choppy trading continues to plague Canadian Dollar
The Canadian Dollar (CAD) is broadly higher on Friday, brushing off a half-percent decline against the Swiss Franc (CHF) to rise six-tenths of one percent against the Pound Sterling (GBP) and four-tenths of a percent against the Euro (EUR) and New Zealand Dollar (NZD). The CAD is scrambling to hold onto near-term gains against the US Dollar, trading within a tenth of a percent of Friday’s opening bids.
USD/CAD climbed to the 1.3780 region on Friday before slipping back to familiar territory below 1.3740. The pair continues to trade above the 200-hour Exponential Moving Average (EMA), but volatility remains high. Consolidation continues to weigh on daily candlesticks, though USD/CAD has managed to trade on the north side of the 200-day EMA at 1.3575 since early April.
Near-term momentum leans in favor of the bears as sellers look set to drag USD/CAD back down to the 50-day EMA at 1.3670 unless renewed buying pressure pushes the pair back above June’s peak bids near 1.3790.
USD/CAD hourly chart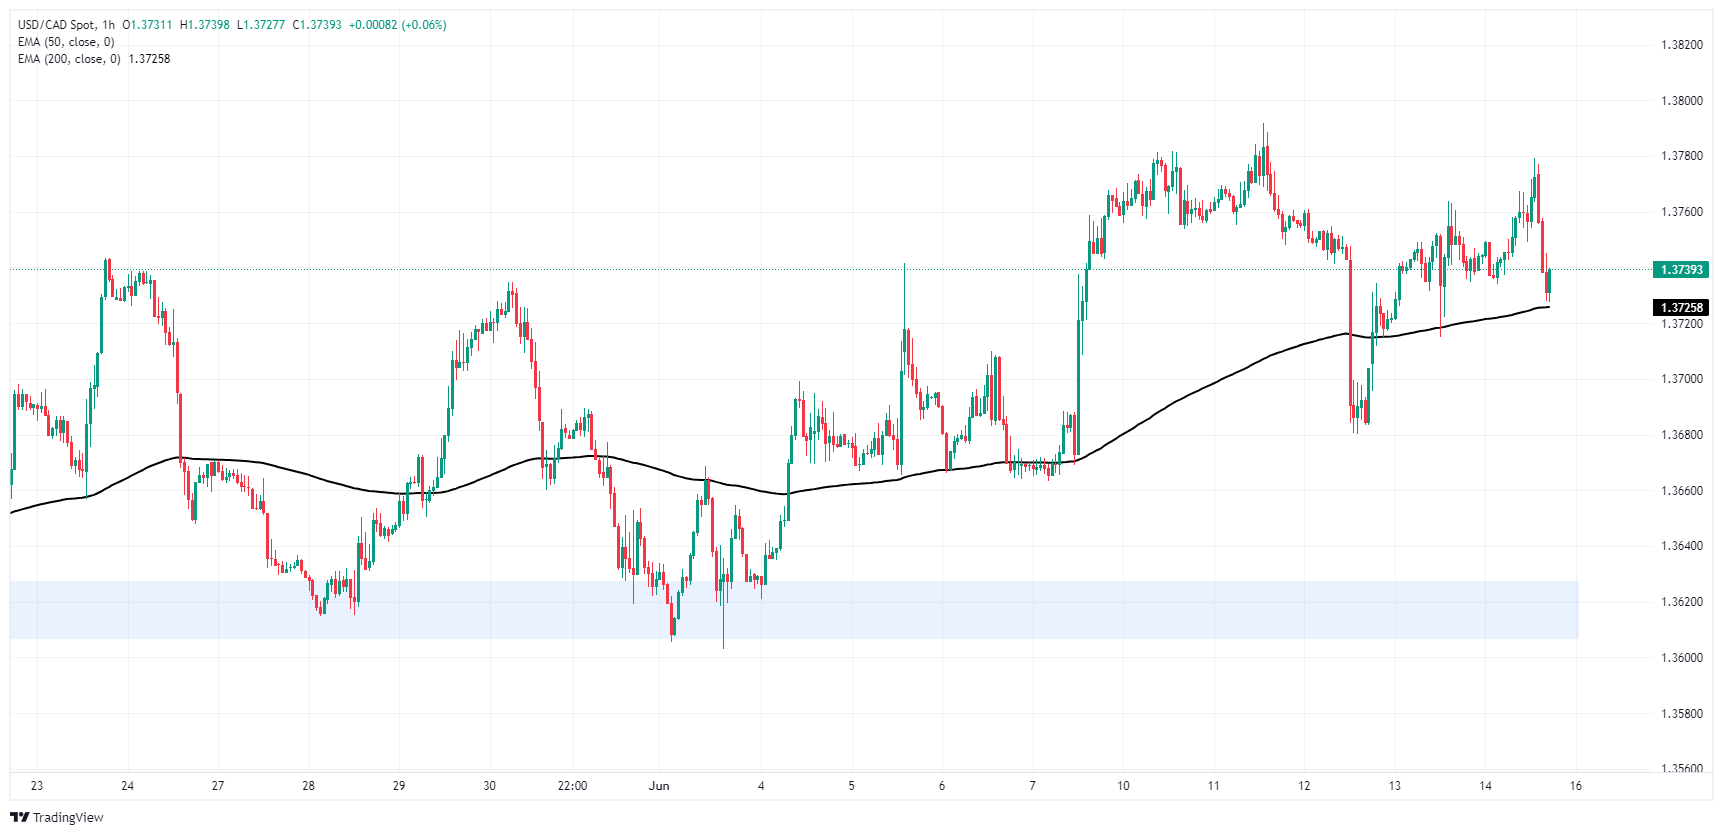
USD/CAD daily chart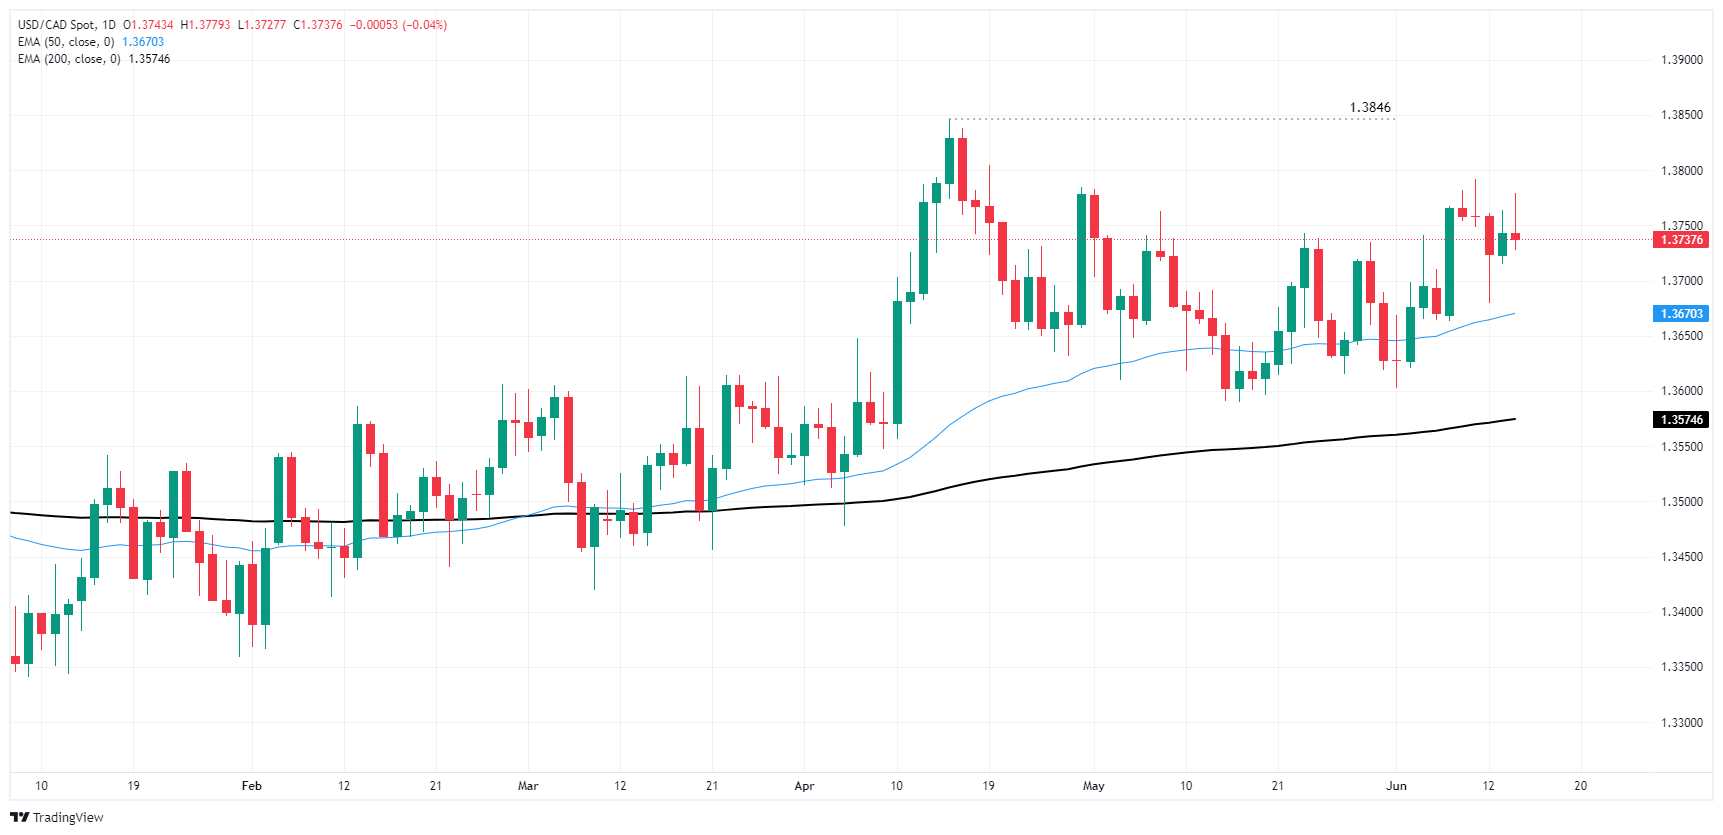
Canadian Dollar FAQs
The key factors driving the Canadian Dollar (CAD) are the level of interest rates set by the Bank of Canada (BoC), the price of Oil, Canada’s largest export, the health of its economy, inflation and the Trade Balance, which is the difference between the value of Canada’s exports versus its imports. Other factors include market sentiment – whether investors are taking on more risky assets (risk-on) or seeking safe-havens (risk-off) – with risk-on being CAD-positive. As its largest trading partner, the health of the US economy is also a key factor influencing the Canadian Dollar.
The Bank of Canada (BoC) has a significant influence on the Canadian Dollar by setting the level of interest rates that banks can lend to one another. This influences the level of interest rates for everyone. The main goal of the BoC is to maintain inflation at 1-3% by adjusting interest rates up or down. Relatively higher interest rates tend to be positive for the CAD. The Bank of Canada can also use quantitative easing and tightening to influence credit conditions, with the former CAD-negative and the latter CAD-positive.
The price of Oil is a key factor impacting the value of the Canadian Dollar. Petroleum is Canada’s biggest export, so Oil price tends to have an immediate impact on the CAD value. Generally, if Oil price rises CAD also goes up, as aggregate demand for the currency increases. The opposite is the case if the price of Oil falls. Higher Oil prices also tend to result in a greater likelihood of a positive Trade Balance, which is also supportive of the CAD.
While inflation had always traditionally been thought of as a negative factor for a currency since it lowers the value of money, the opposite has actually been the case in modern times with the relaxation of cross-border capital controls. Higher inflation tends to lead central banks to put up interest rates which attracts more capital inflows from global investors seeking a lucrative place to keep their money. This increases demand for the local currency, which in Canada’s case is the Canadian Dollar.
Macroeconomic data releases gauge the health of the economy and can have an impact on the Canadian Dollar. Indicators such as GDP, Manufacturing and Services PMIs, employment, and consumer sentiment surveys can all influence the direction of the CAD. A strong economy is good for the Canadian Dollar. Not only does it attract more foreign investment but it may encourage the Bank of Canada to put up interest rates, leading to a stronger currency. If economic data is weak, however, the CAD is likely to fall.
- DXY rally extends into Friday, hitting its highest level since early May.
- Consumer Confidence from the UoM figures come in below expectations, dampening the market mood, but DXY maintains its daily gains.
- US Treasury yields remain low, signaling a risk-off market environment.
On Friday, the US Dollar Index (DXY) shrugged off weak data releases and continued its positive traction. The Index now hovers around its highest level since early May near 105.80 and then retreated to 105.60 but held daily gains.
The economic outlook for the US remains a mixed bag. The Federal Reserve (Fed) continues to hold its economic activity revisions steady but revised its Personal Consumption Expenditures (PCE) estimates higher. Additionally, preliminary analysis suggests softening inflation but a resilient labor market, pushing the Fed to anticipate fewer rate cuts. On Friday,
Consumer Confidence data from the University of Michigan showed poor results that reached a seven-month low. This made the USD trim part of its daily gains as much of the US economy revolves around consumer spending.
Daily digest market movers: DXY holds the line after UoM data, markets adjust to Fed’s decision
- On Wednesday, FOMC dot plot update shows median expectancy of only one rate cut for 2024.
- Markets were previously anticipating between one or two rate cuts in 2024, but this altered after the Fed announced its decision.
- University of Michigan Consumer Confidence Index for the US has fallen from 69.1 in May to 65.6 in early June, which is below the market's expectation of 72. This decline also reflected in the Current Conditions Index, falling from 69.6 to 62.5.
- Consumer expectation index also fell slightly from 68.8 to 67.6. The five-year inflation outlook rose from 3% to 3.1%.
DXY technical analysis: Bulls continue to dominate, holding above SMAs
As of Friday’s session, the technical indicators maintain their positive outlook. The Relative Strength Index (RSI) remains above 50 and the Moving Average Convergence Divergence (MACD) continues to reflect green signaling bars. Furthermore, the index remains standing above its 20, 100 and 200-day Simple Moving Average (SMA). The combination of these factors strengthens the bullish outlook for the DXY.
US Dollar FAQs
The US Dollar (USD) is the official currency of the United States of America, and the ‘de facto’ currency of a significant number of other countries where it is found in circulation alongside local notes. It is the most heavily traded currency in the world, accounting for over 88% of all global foreign exchange turnover, or an average of $6.6 trillion in transactions per day, according to data from 2022. Following the second world war, the USD took over from the British Pound as the world’s reserve currency. For most of its history, the US Dollar was backed by Gold, until the Bretton Woods Agreement in 1971 when the Gold Standard went away.
The most important single factor impacting on the value of the US Dollar is monetary policy, which is shaped by the Federal Reserve (Fed). The Fed has two mandates: to achieve price stability (control inflation) and foster full employment. Its primary tool to achieve these two goals is by adjusting interest rates. When prices are rising too quickly and inflation is above the Fed’s 2% target, the Fed will raise rates, which helps the USD value. When inflation falls below 2% or the Unemployment Rate is too high, the Fed may lower interest rates, which weighs on the Greenback.
In extreme situations, the Federal Reserve can also print more Dollars and enact quantitative easing (QE). QE is the process by which the Fed substantially increases the flow of credit in a stuck financial system. It is a non-standard policy measure used when credit has dried up because banks will not lend to each other (out of the fear of counterparty default). It is a last resort when simply lowering interest rates is unlikely to achieve the necessary result. It was the Fed’s weapon of choice to combat the credit crunch that occurred during the Great Financial Crisis in 2008. It involves the Fed printing more Dollars and using them to buy US government bonds predominantly from financial institutions. QE usually leads to a weaker US Dollar.
Quantitative tightening (QT) is the reverse process whereby the Federal Reserve stops buying bonds from financial institutions and does not reinvest the principal from the bonds it holds maturing in new purchases. It is usually positive for the US Dollar.
- EUR/GBP is climbing on Friday after a dip to the 0.8400 handle.
- ECB soothing talking points are helping to recover sentiment, but only slightly.
- BoE rate call looms ahead next week, but rate moves not expected yet.
EUR/GBP dipped to a fresh 22-month low on Friday, tapping 0.8400 before finding a thin recovery that still leaves the pair battling at the bottom of an accelerating three-month decline from April’s peaks above 0.8600. European political turmoil continues to weigh on the Euro as France heads into a two-round snap election on June 30 and July 7, and Sterling traders are buckling down for the wait to next week’s rate call from the Bank of England (BoE).
Policymakers from the European Central Bank (ECB) have been making the rounds on Friday, attempting to soothe market sentiment as the Euro broadly underperforms as the poorest performer of the major currencies this week. French President Emmanuel Macron has dissolved the French government and sent the country into a snap election in a bid to stop the rise of right-wing contender Marine Le Pen who surged to a stunning victory in European parliamentary elections.
With President Macron’s support evaporating from a populace revolting in the voting booth against unpopular fiscal policies, Le Pen’s platform of steep tax cuts and reduced retirement age has thrust the contender, who has failed three separate bids for the French Presidency since 2012, tries for lucky number four. Financial markets have turned leery on financial stability stemming from political upsets in France, as populist measures meant to buy votes could represent a signficant deficit for the key member of the European Union.
On the Sterling side, GBP traders are settling in for the long wait to next week’s UK Consumer Price Index (CPI) update slated for Wednesday, followed by a fresh rate call from the BoE next Thursday. The BoE’s Monetary Policy Committee (MPC) last voted seven-to-two to keep rate cuts pinned at 5.25%, and although no movement on rates is expected, investors will be keeping an eye out for any further shifts from ‘hold’ to ‘cut’ votes.
EUR/GBP technical outlook
EUR/GBP tumbled to a fresh 22-month low on Friday, testing the 0.8400 handle before finding intraday technical support and rebounding into the 0.8440 region. Market momentum is firmly tilted towards the bearish side with the pair down -1.2% from June’s peak near 0.8540.
The pair is on pace to close in the red for a fifth consecutive week, and weakness has dragged EUR/GBP into a -2.85% peak-to-trough rut in 2024. A bullish recovery to the 200-day Exponential Moving Average (EMA) at 0.8460 will likely turn back into the low side, and sellers will be looking to definitely push the pair back below the 0.8400 handle.
EUR/GBP daily chart
- GBP/USD drops to 1.2683, marking a new four-week low of 1.2656 amidst risk aversion.
- Technical outlook: Bearish momentum as RSI falls below 50; potential support at 1.2643/38, 50-DMA at 1.2611, and 200-DMA at 1.2547.
- Resistance at 1.2700; if breached, expect consolidation in the range of 1.2700-1.2750.
The Pound Sterling dropped sharply below the 1.2700 figure as risk aversion took its toll on most G7 currencies, except for safe-haven peers like the Greenback. Political turmoil in Europe sent the Euro collapsing against the Swiss Franc, while the GBP/USD falls 0.62% and traded at 1.2683 at the time of writing.
GBP/USD Price Analysis: Technical outlook
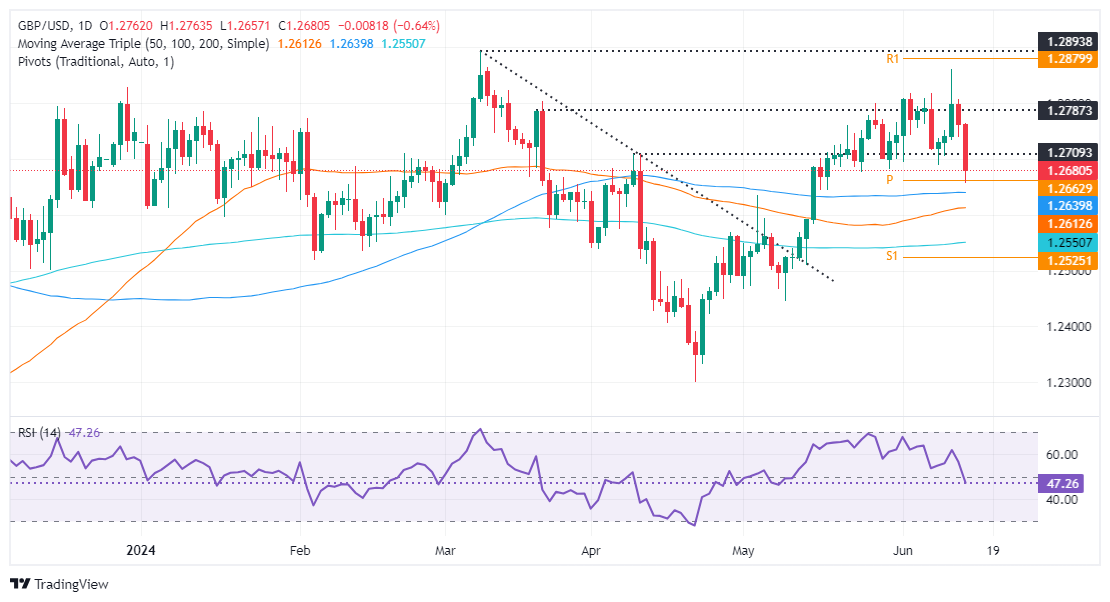
From a technical standpoint, the GBP/USD has shifted neutral to downward biased, with momentum hinting that sellers are gathering traction. The Relative Strength Index (RSI) has fallen below 50, turning bearish, while price action shows the pair printed a new four-week low of 1.2656, opening the door for additional losses.
If GBP/USD pierces the confluence of the 100-day moving average (DMA) and May 3 swing high turned support at around 1.2643/38, that would accelerate the downtrend, exposing the 50-DMA at 1.2611, ahead of 1.2600. Further losses are seen below the figure, with the 200-DMA at 1.2547 up next.
Conversely, if buyers moved in and reclaim 1.2700, the GBP/USD could consolidate at around 1.2700-1.2750, as stir resistance lies ahead.
GBP/USD Price Action – Daily Chart
- EUR/JPY falls as investors fear the outcome of snap French legislative elections.
- The risk looms large of the far-right winning after their success in the European elections.
- The Yen finds support after the BoJ signals plan to end quantitative easing.
The EUR/JPY is trading down over a third of a percent in the 167s on Friday, as French-election jitters weigh on the Euro (EUR) whilst the Japanese Yen (JPY) gains support from the prospect of the Bank of Japan (BoJ) winding down its quantitative easing (QE) programme.
EUR/JPY declines on French election concerns
EUR/JPY pushes lower on Friday due to an across-the-board depreciation in the Euro from the uncertain outcome of French legislative elections scheduled for June 30 and July 7. The French President Emmanuelle Macron called the snap elections after his centrist Renaissance party was defeated by the far-right National Rally (RN) party at the European parliamentary elections.
With Renaissance polling only around 19% of the vote currently, after a series of unpopular reforms, and RN with over 30%, there is a risk the far-right party, founded by famous right-winger Jean-Marie Le Pen could win power, with potentially Europe-wide consequences.
“The two-round electoral process makes it hard to confidently estimate seat numbers, but experts predict RN could almost treble its tally of deputies, though most likely fall short of an outright majority, while Renaissance’s total could halve,” said Jon Henley, Europe Correspondent for The Guardian.
“Such a result would leave Macron facing three years of an even more fractured and hostile parliament, having to cut difficult deals with opposition parties to form a government and pass laws, leading to almost certain legislative deadlock,” Henley added.
BoJ signals end to QE
The Yen, meanwhile, gained a boost after the BoJ meeting during Friday’s Asian session. Although the BoJ did not raise the bank’s policy rates from a comparatively very low 0.0% - 0.1% range, Boj Governor Kazuo Ueda said that the bank was preparing a plan to reduce Japanese Government Bond (JGB) purchases over the next one to two years, which it would present details of at its meeting in July.
The BoJ is the last remaining major central bank to still engage in buying government bonds, a form of QE used to provide liquidity to banks and inflate the economy – with negative effects on the currency.
Ueda’s words could indicate the BoJ will cut its circa ¥6 Trillion of JGB purchases to zero over the next one to two years, according to Jin Kenzaki, Head of Research for Japan at Societe Generale.
“Given the BoJ’s announcement that it will lay out the details of its reduction plan for the next one to two years, there is a possibility that the BoJ will reduce its monthly JGB purchases to zero over the next one to two years," said Kenzaki in a note following Friday’s meeting.
"Until this announcement, we had predicted that the purchase amount would decrease to ¥4T by the end of this year and ¥3T by next spring, but given the pressure from the government to address the weak yen, we now think the most likely scenario will be a reduction starting in August, with purchases declining by ¥1T every three months and reaching zero by November of next year,” he added.
ECB officials more sympathetic to easing after June
The Euro has come under pressure of late after comments from European Central Bank (ECB) officials suggested the interest-rate cut it has promised to make at its June 19 meeting will be a one off event, not the start of a monetary easing cycle.
Comments on Thursday and Friday, however, veered to the more dovish, however, with officials more sympathetic to the view the ECB might follow up its June interest-rate cut with further easing.
“On Thursday, ECB Governing Council member Bostjan Vasle said that more rate cuts are possible if the disinflation process continues. However, Vasle also warned that the process could slow down as wage momentum is relatively strong. In Friday's European session, ECB Governing Council member Mario Centeno said, ‘Disinflation process will resume after August.’” According to Sagar Dua, Editor at FXStreet.
The Canadian Dollar (CAD) is a relative outperformer in Friday's session, says Shaun Osborne, Chief FX Strategist at Scotiabank
USD/CAD short-term trend momentum is weak
“Despite broader US Dollar (USD) strength and weak stocks, the CAD is a relative out-performer on the session. Volatility in Europe is helping support the CAD at the margin, with EUR/CAD easing more than 1% on the week.”
“Minor USD gains through the overnight session are showing signs of stalling out in the mid/upper 1.37 area and Tuesday’s weak close for the USD remains a net negative for USD/CAD at the moment.”
“Short-term trend momentum is weak, suggesting more range trading, with Tuesday’s 1.3790 high likely to help keep USD gains in check. Support is 1.3690/00.”
The Pound Sterling (GBP) falls through the key support at 1.2765 amid further moderation in Bank of England (BoE) and Ipsos inflation expectations, says Shaun Osborne, Chief FX Strategist at Scotiabank.
UK elections, softer inflation expectations drive GBP lower
“Sterling is softer on the session, tracking its peers. The NanBoE/Ipsos inflation expectations survey reflects a further moderation in inflation expectations over the coming year (2.8% in May, down from 3.0%). The result was the lowest since August 2021.”
“The latest polling ahead of the July 4th election shows Reform support overtaking the Conservatives—an event that has looked inevitable due to the Conservative’s terrible campaigning so far and Farage’s participation in the election.”
“Sterling’s losses leave Cable trading close to recent lows in the upper 1.26s where the GBP has found steady and consistent support since late May. Tentative signs of demand emerging just under the figure are emerging again. GBPUSD fell through our key support at 1.2675 within a session. Resistance is at 1.2765.”
Election-related concerns are extending pressure on French assets, and markets are likely to play defensively. This will keep the Euro (EUR) on the back foot, says Shaun Osborne, chief FX strategist at Scotiabank.
Move above 1.0725 to push the Euro higher
“Election concerns are extending pressure on French assets, driving the OAT/Bund 10Y above recent peaks to 73bps. French bank stocks are posting double-digit percentage losses on the week. For now, however, markets are likely to play defensively which will keep the EUR on the back foot.”
“Loss of support around the 1.07 area leaves the EUR looking soft into the end of the week. Short-term patterns reflect some demand emerging around the intraday low and retracement support at 1.0675, however, and the potential formation of a bullish “hammer” signal which may give spot a lift in our session.”
“Gains through 1.0725 may allow the EUR to steady or improve a little in the short run. Otherwise, a retest of 1.06 beckons.”
The Bank of England (BoE) will keep the Bank Rate unchanged at 5.25% and the first 25-basis-point cut isn't expected until August, says Kirstine Kundby-Nielsen, FX analyst at Danske Bank.
BoE expected to cut rate in August
“We expect the BoE to keep the Bank Rate unchanged at 5.25% on 20 June, which is in line with consensus and current market pricing. We expect the vote split to be 7-2, with the majority voting for an unchanged decision and Ramsden and Dhingra voting for a cut.”
“Overall, we expect the MPC to stick to its current communication, priming the markets for a forthcoming start to a cutting cycle. We expect the first 25bp cut in August.”
“We expect a muted market reaction but see the balance of risk skewed to a move higher in EUR/GBP as the BoE tends to err on the dovish side, and we see a downside risk to our EUR/GBP forecast of 0.88 in 6-12 months.”
- Silver price gains ground above $29.00 as soft US price pressures weigh on bond yields.
- Traders price in two rate cuts this year against one signaled by the Fed.
- Silver price trades in a Falling Channel formation.
Silver price (XAG/USD) clings to key support of $29.00 in Friday’s American session. The white metal rebounds as US bond yields come under pressure due to improved speculation that the Federal Reserve (Fed) will start reducing interest rates from the September meeting.
10-year US Treasury yields have dropped to near 4.20%. Lower yields on interest-bearish assets reduce the opportunity cost of holding an investment in non-yielding assets, such as Silver.
The CME FedWatch tool shows that the probability for rate cuts in September has improved to almost 71% from 50.4% recorded a week ago. Market expectations for Fed rate cuts have risen as the United States (US) consumer and produce inflation decline on monthly and an annual basis in May. Major contribution to decline in price pressures came from soft gasoline prices.
The CME FedWatch Tool also shows that there will be two rate cuts this year against one signalled by Fed policymakers in their latest dot plot. Fed officials lowered potential number of rate cuts in the forecast report from three forecasted in March as they were concerned over inflation remaining stubborn due to strong labor market conditions.
Meanwhile, the US Dollar Index (DXY), which tracks the Greenback’s value against six major currencies, jumps to 105.70.
Silver technical analysis
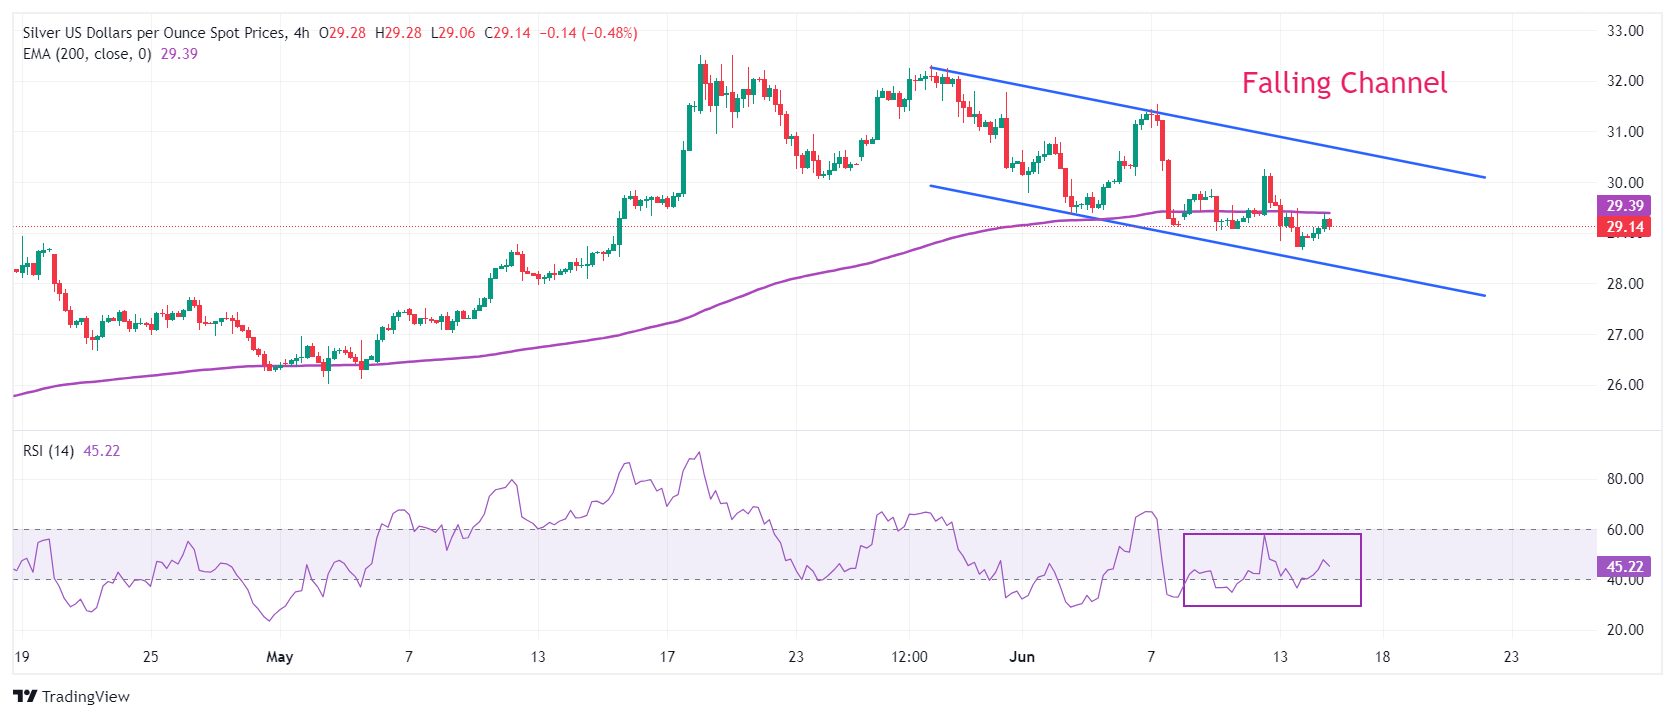
Silver price trades inside Thursday’s trading range. The white metal trades in a Falling Channel chart pattern in which each pullback is considered as selling opportunity by market participants. The asset has dropped below the 200-period Exponential Moving Average (EMA), which trades around $29.40, indicating the overall trend has turned bearish.
The 14-period Relative Strength Index (RSI) oscillates in the 40.00-60.00 range, suggesting a consolidating ahead.
Silver four-hour chart
Commodity Trading Advisors (CTAs) are on the bid with WTI and Brent crude on Friday, analysts at TD Securities note.
WTI, Brent prices look through rising stockpiles
“Crude oil markets have shaken off any concern regarding increasing inventories as CTAs are on the bid in WTI and Brent crude.”
“Trend followers may still add more long positions at prices north of $79.24/bbl and $83.27/bbl respectively.”
“However, with that said, there is still more relative concern about Q4 balances and beyond following the OPEC+ announcement, which should serve as a resistance to major upside, particularly when CTA firepower, which has been fueling the latest rally, fades.”
The industrial metals continue to slide into the end of the week, analysts at TD Securities say.
Market unwinds its long positions on industrial metals
"With few signs of physical tightness, and increasing inventory levels across the globe, Copper remains at risk given macro traders have already built an extremely bloated long position. As traders begin to lose patience with the fundamental narrative, we have seen money managers unwinding their large long positions."
"With that said, Commodity Trading Advisors (CTAs) joined the selling party, liquidating roughly 8% of their historical max position, however the margin of safety before the next round of selling remains large with the level sitting at $9,071/t."
"Additionally, the melting price action could put both Aluminium and Zinc at risk of selling below $2,435/t and $2,722/t respectively."
Gold (XAU/USD) prices are nearly back to the post-CPI highs seen on Wednesday, analysts at TDS note.
Gold is on the rise, Silver faces a leg down
“Back-to-back weaker-than-expected inflation prints, along with the less hawkish details of the Federal Reserve meeting, have seen appetite for the Yellow Metal increase as markets now price in two cuts by end of year.”
“With that said, the back-and-forth price action in the Yellow Metal could see some modest selling if prices fall below $2,330/oz.”
“Elsewhere, the capitulation in Silver (XAG/USD) prices yesterday just nearly avoided Commodity Trading Advisor (CTA) selling levels, but the move has certainly entrenched more downside momentum into the model, seeing the first selling trigger in the crosshairs at $29.14/oz.”
- Consumer confidence in the US weakened in early June.
- UoM survey showed one-year inflation expectation held steady at 3.3%.
Consumer confidence in the US weakened in early June, with the University of Michigan's Consumer Sentiment Index edging lower to 65.6 from 69.1 in May. This reading came in below the market expectation of 72.
The Current Conditions Index declined to 62.5 from 69.6 and the Consumer Expectations Index fell to 67.6 from 68.8.
The details of the survey revealed that the one-year inflation expectation held steady at 3.3%, while the five-year inflation outlook rose to 3.1% from 3%.
Market reaction
The US Dollar preserves its strength after this report. At the time of press, the US Dollar Index was trading at its highest level since early May at 105.75, rising 0.5% on the day.
As expected, the Bank of Japan (BoJ) kept the policy rate unchanged at Friday's meeting. However, it announced that it would start reducing its Japanese Government Bond (JGB) purchases after its July monetary policy meeting and that it would lay out the details of its reduction plan for the next one to two years at that meeting, says Jin Kenzaki, Head of Research for Japan at Societe Generale.
BoJ is set to reduce its monthly JGB purchases to zero in 1-2 years
"Given the BoJ’s announcement that it will lay out the details of its reduction plan for the next one to two years, there is a possibility that the BoJ will reduce its monthly JGB purchases to zero over the next one to two years."
"Until this announcement, we had predicted that the purchase amount would decrease to JPY4tn by the end of this year and JPY3tn by next spring, but given the pressure from the government to address the weak yen, we now think the most likely scenario will be a reduction starting in August, with purchases declining by JPY1tn every three months and reaching zero by November of next year."
"On the other hand, considering that the BoJ will announce a specific policy for reducing its JGB purchases at the July meeting, its potential impact on the market may reduce, in our view, the likelihood of a rate hike at the July meeting. We continue to expect a rate hike at the September meeting."
- Oil is rising up to a cluster of daily major moving averages in the $79.00s.
- These will probably present a tough level of resistance for the commodity.
- The persistence of the short-term uptrend will depend on a decisive break of this resistance barrier.
WTI Oil is trading in the $78.50s during the US session on Friday.
On the 4-hour chart used to assess the short-term trend Oil has decisively broken out a falling channel and reached the conservative target for the breakout at $78.17 (Fibonacci 0.618 extension of the width of the channel extrapolated higher).
Oil 4-Hour Chart
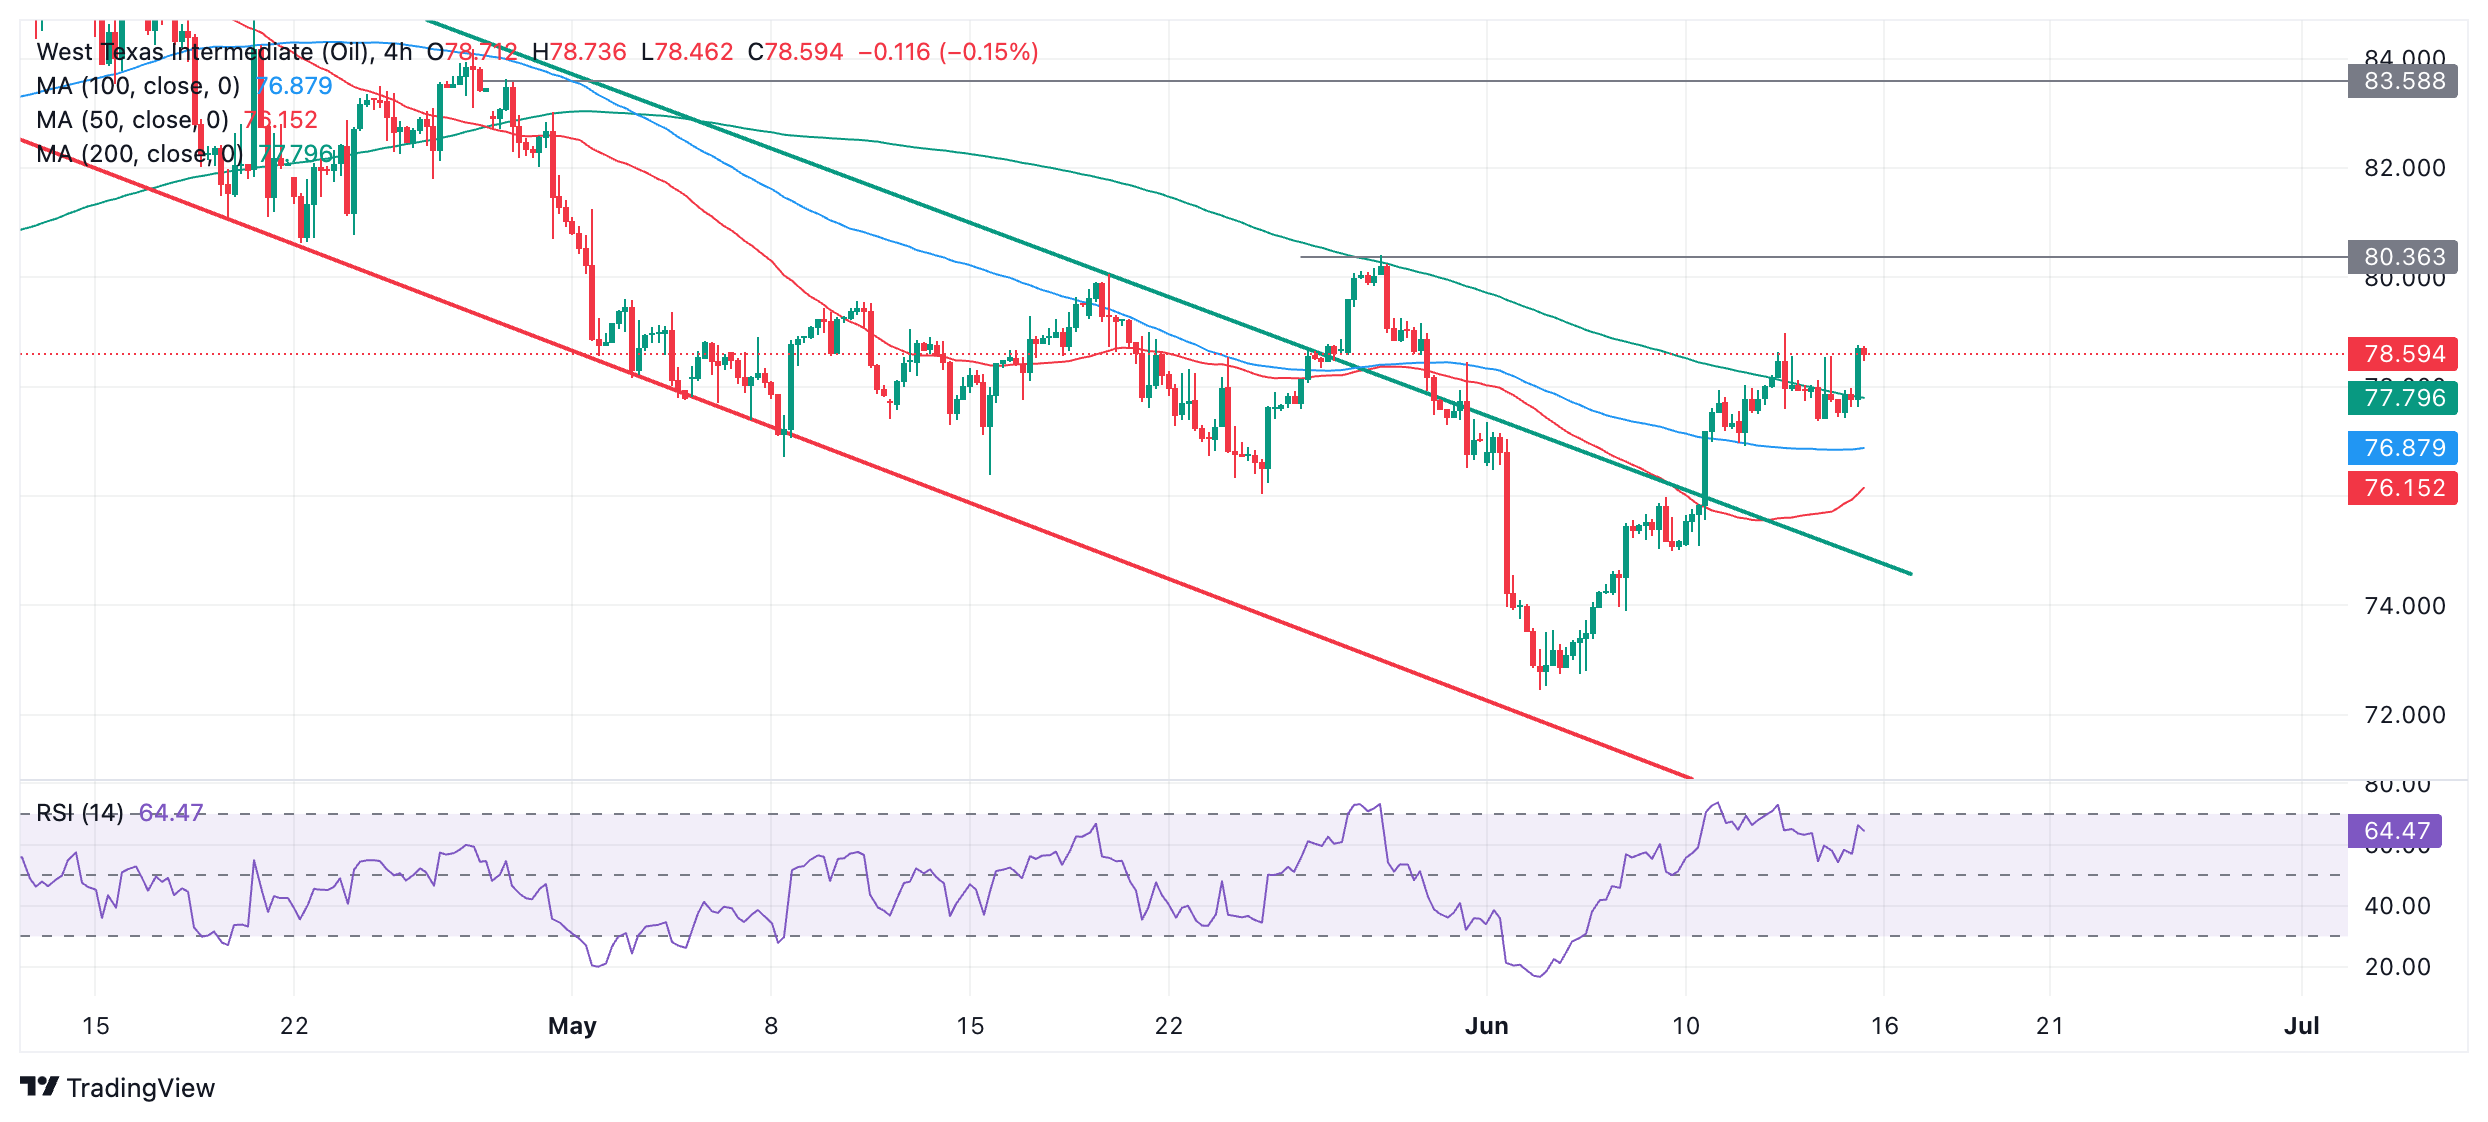
Since breaking out of the channel, Oil is probably now in a short-term uptrend with the odds favoring more upside in the short-term, given “the trend is your friend”. However, it has now reached its initial target so is vulnerable to a pullback.
A breakout above the last lower high of the prior downtrend at $80.36 (May 29 high) would provide added bullish confirmation and extend the uptrend higher. Such a move might be expected to reach the next key target at $83.50 (April 29 high and top of chart gap).
The direction of Oil is less clear on the daily chart used to assess the intermediate term trend.
Oil Daily Chart
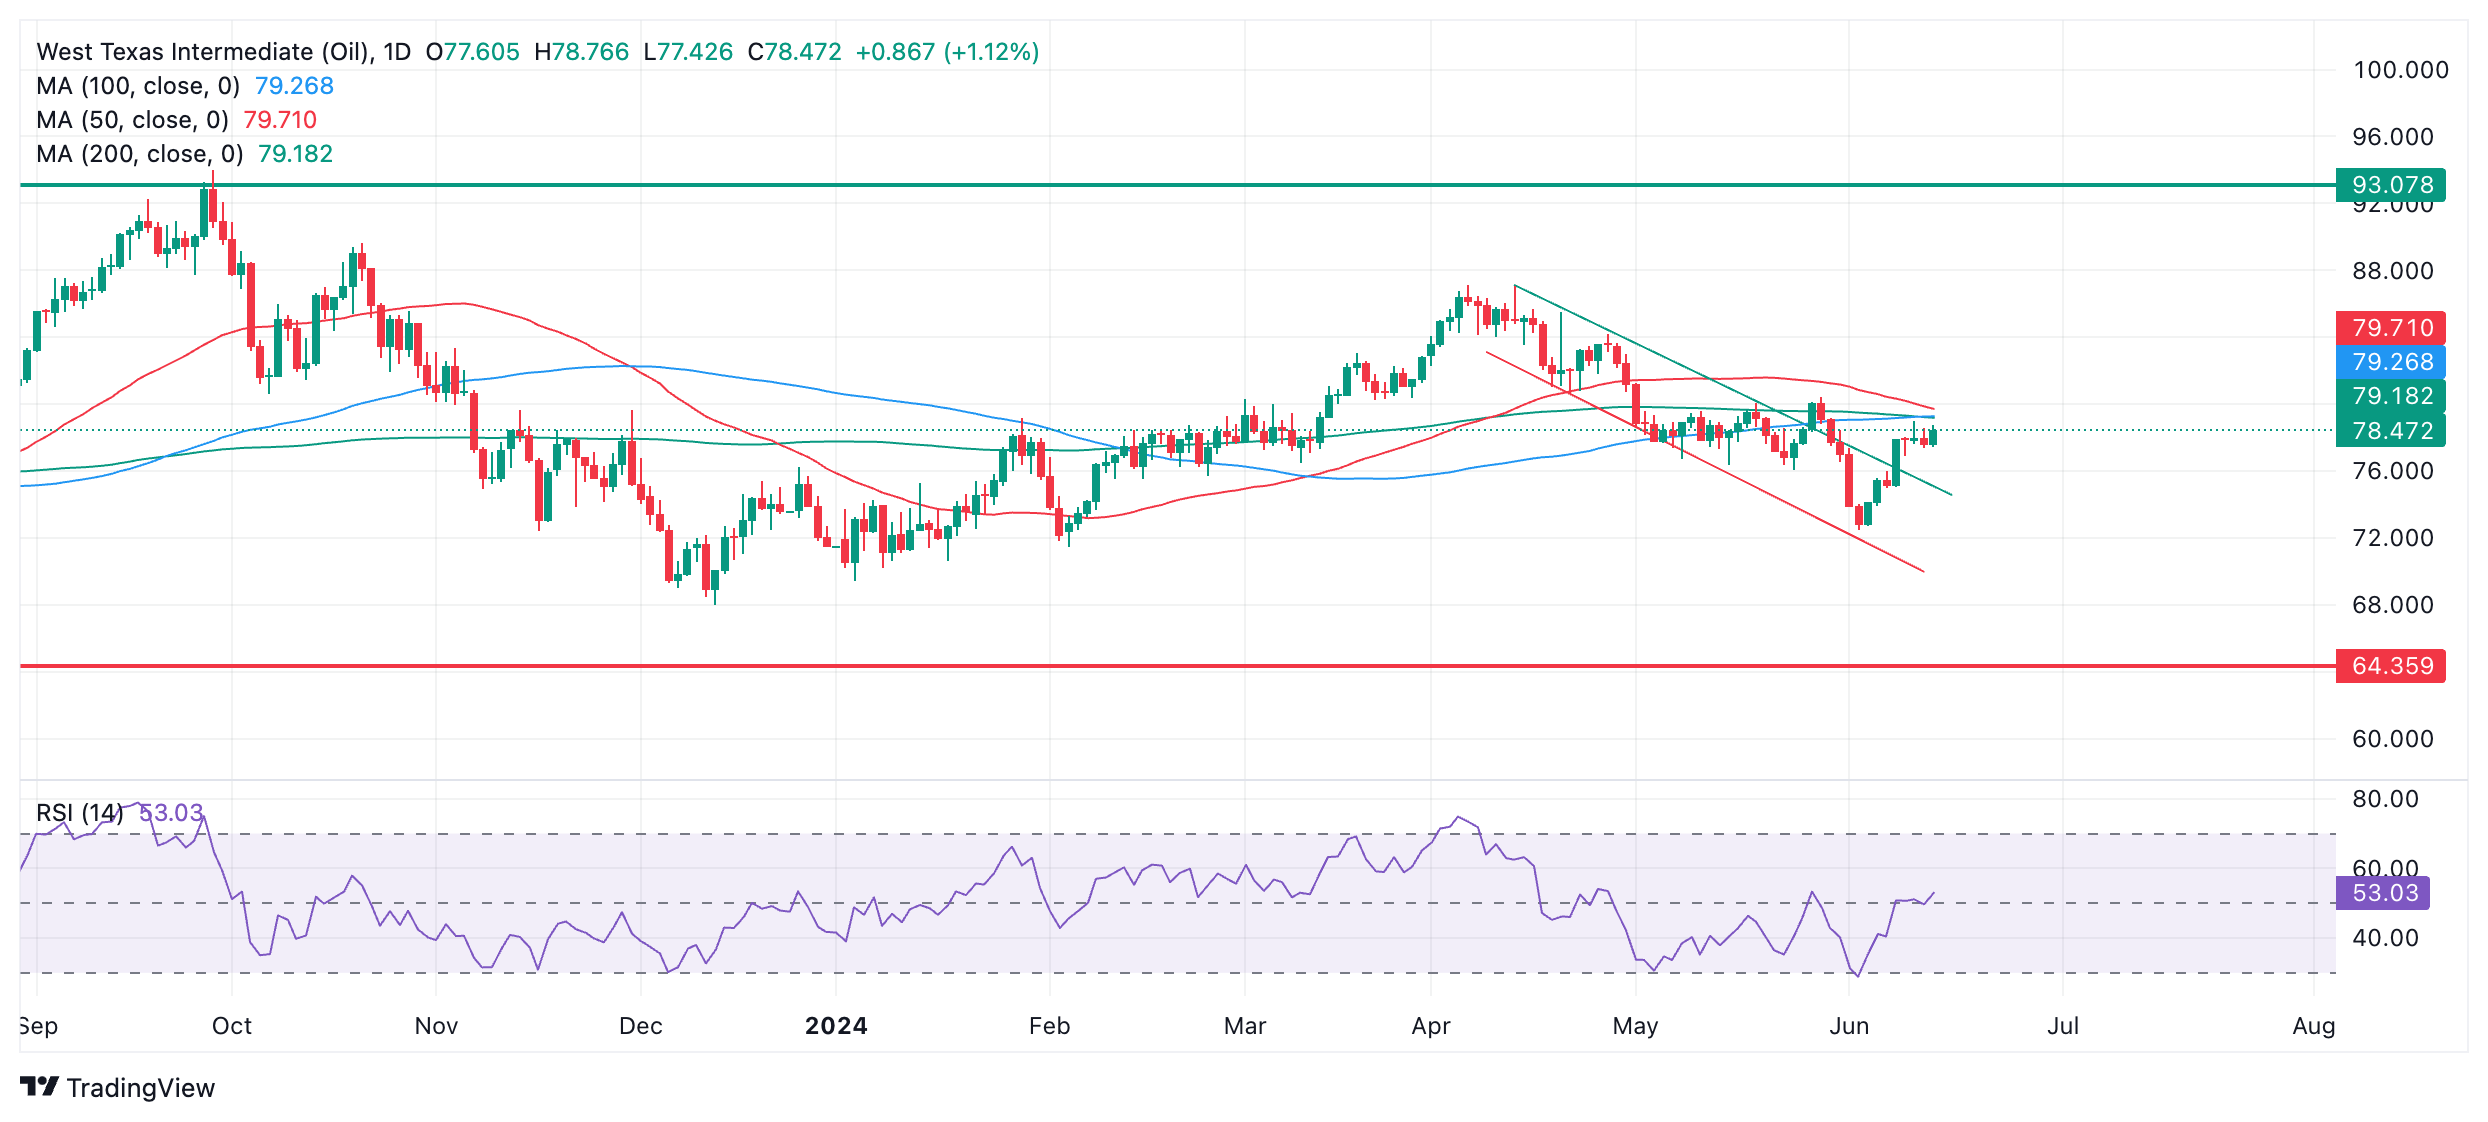
The key feature on the daily chart is the cluster of resistance in the $79s from all three major Simple Moving Averages (SMA) – the 50, 100 and 200-day SMAs. This is likely to present a considerable barrier to more upside and could be an inflection point for Oil price.
It would require a close on a daily basis above $80.36 (May 29 high) to confirm a successful break above resistance from the three SMAs and a continuation up to a target at $83.50.
WTI Oil appears to be trading within a broad long-term range between $64.00 and $93.00 on the weekly chart. This suggests the long-term trend is probably sideways.
Oil Weekly Chart
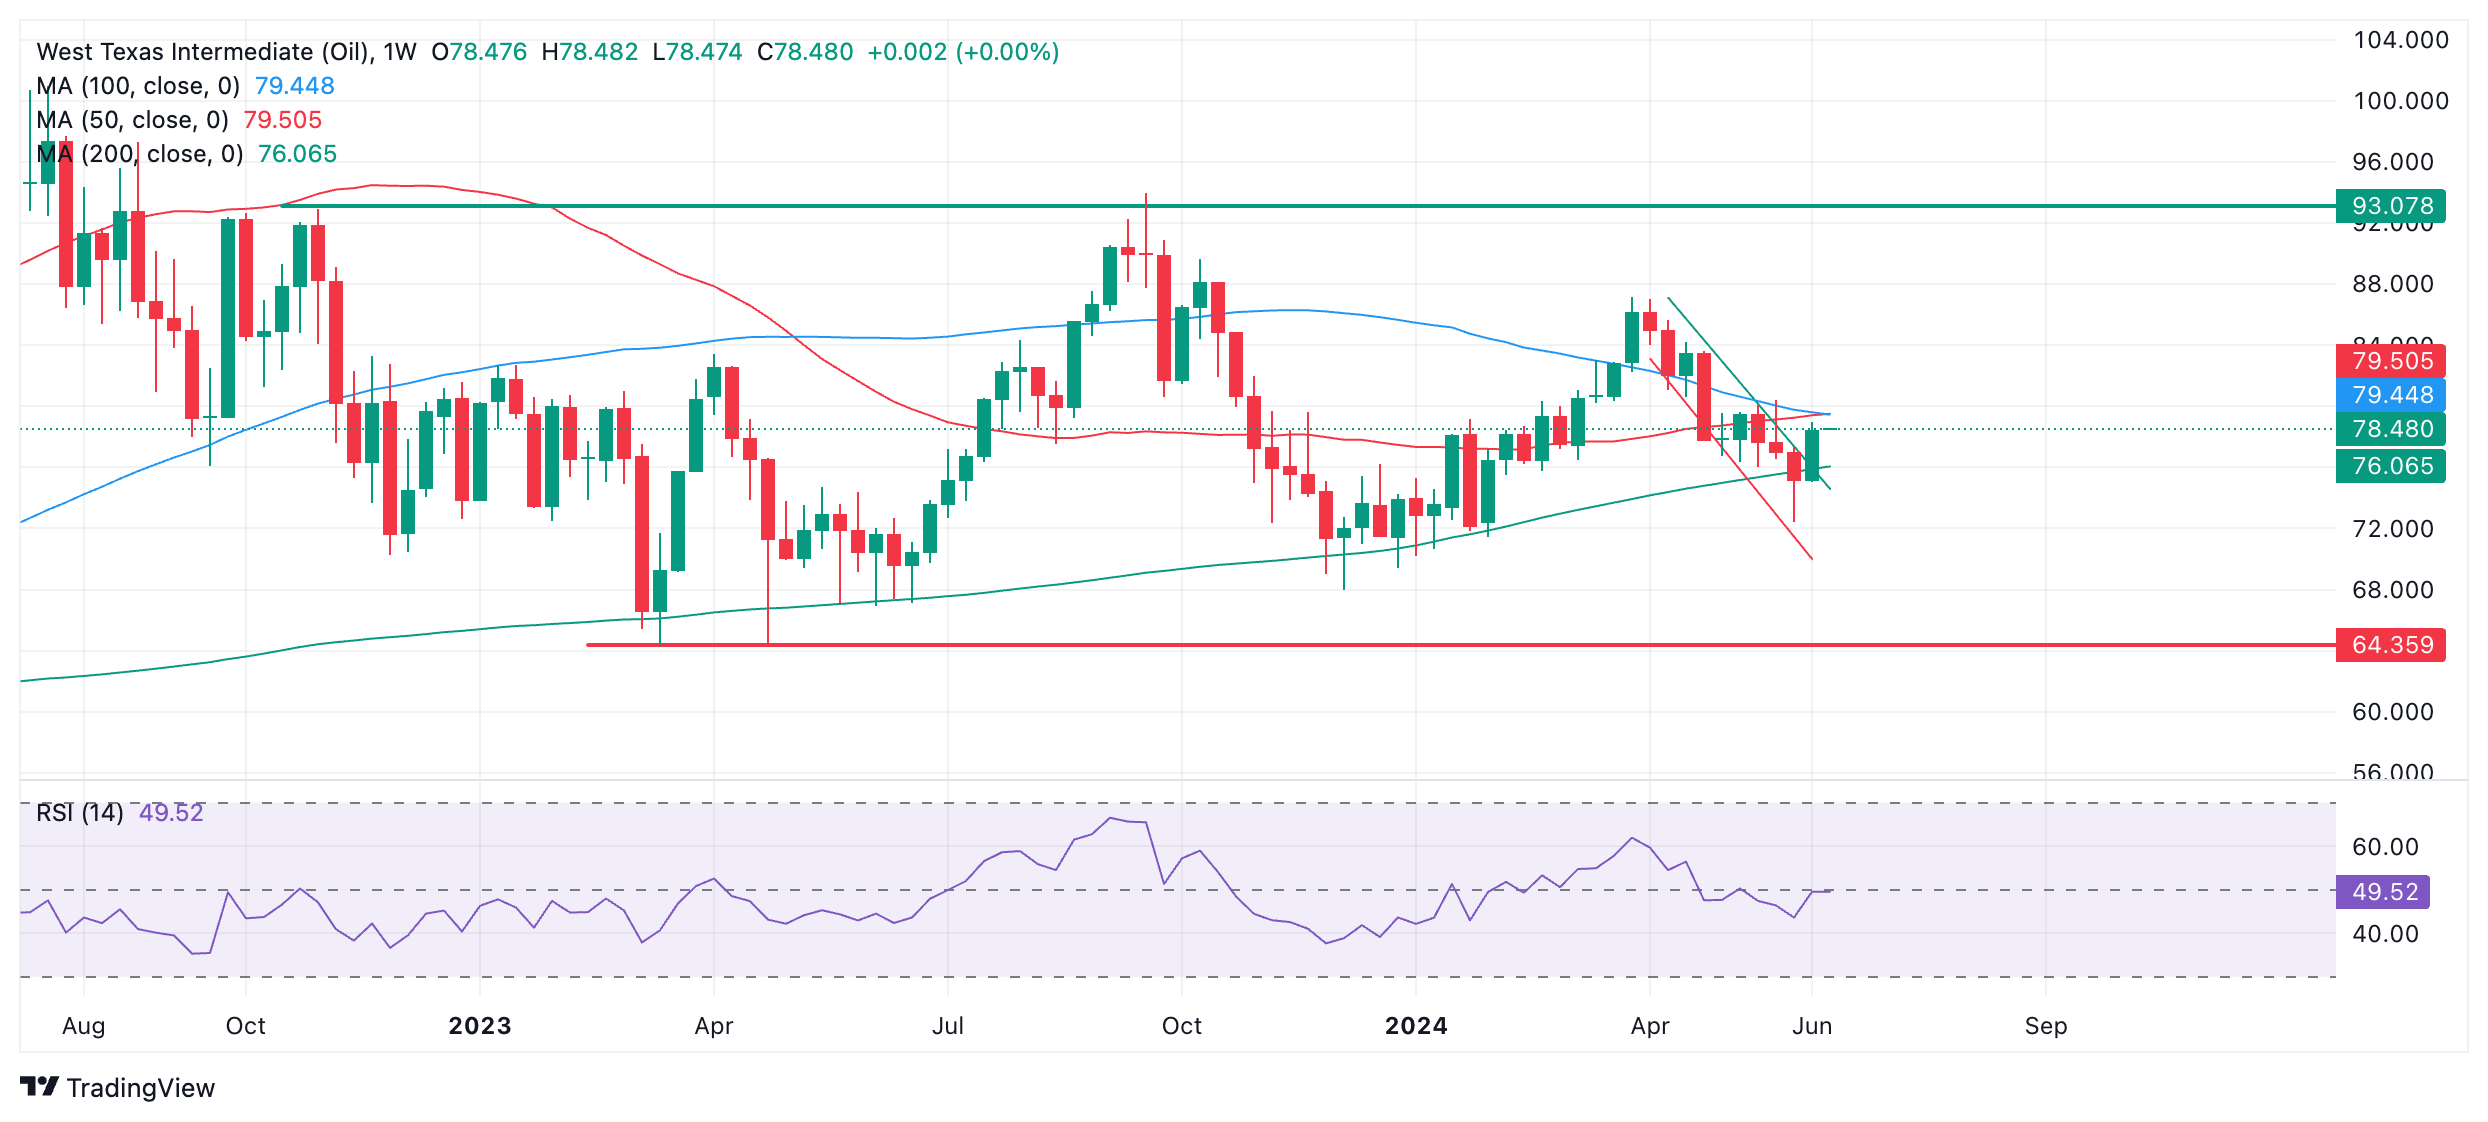
Last week’s red club-shaped candlestick could be a sign the move down has completed and Oil price may be reversing. Similarly-shaped candlesticks often punctuate the end of down moves in asset prices. It is possible Oil price could be about to begin a bullish sequence higher.
The 200-week SMA has acted as reliable support on multiple occasions in 2023-24 and is providing support again at the current week’s lows. The reliability of the 200-week SMA further enhances the case for a bullish reversal.
- USD/CAD rises further to 1.3770 as the Fed’s hawkish policy update dampens market sentiment.
- Fed Mester agreed that the disinflation process has resumed.
- Canada’s Manufacturing Sales grew by 1.1% in April on month, missing estimates of 1.2%.
The USD/CAD pair extends its upside to near 1.3770 in Friday’s American session. The Loonie asset strengthens as the US Dollar (USD) rises further due to a hawkish interest rate update by the Federal Reserve (Fed). Latest interest rate projections from Fed policymakers indicate that there will be only one rate-cut instead of three forecasted in March.
Fed’s hawkish policy has weakened the risk appetite of market participants. Considering bearish overnight futures, the S&P 500 is expected to open on a bearish note. The US Dollar Index (DXY), which tracks the greenback’s value against six major currencies, jumps to 105.70. While 10-year US Treasury yields have declined to 4.22% as financial markets expect that the Fed will deliver two rate cuts.
According to the CME FedWatch tool, 30-day Fed Funds futures pricing data shows that traders see a 65% chance that there will be a rate-cut decision in the September. The probability has significantly improved from 50.5% recorded a week ago.
Market expectations for Fed rate cuts in September increased after the United States (US) consumer and producer inflation data for May turned out softer than expected.
Meanwhile, Cleveland Fed Bank President Loretta Mester appeared in an interview with CNBC after the completion of the blackout period due to the Fed’s monetary policy meeting. Mester acknowledged that the disinflation process has resumed after stalling, however, policymakers want to see price pressures cooling further from their current levels to gain confidence for rate cuts. She also cautioned that the current monetary policy is impacting the economy and it is important not to wait too long to cut interest rates.
On the Canadian Dollar front, Statistics Canada showed that Manufacturing Sales grew at a slightly slower pace of 1.1% than expectations of 1.2% in April. The economic data contracted by 1.8% in March, downwardly revised from 2.1%.
In an interview with CNBC on Friday, Cleveland Federal President Loretta Mester said that it is important not to wait too long to cut interest rates, per Reuters.
Key takeaways
"Latest inflation data has been welcome news."
"We are starting to see inflation move down again after stalling."
"We need to see inflation fall more from current levels."
"It is clear monetary policy is affecting economy."
"Neutral interest rate moves around all the time."
"Want to see a few more months of ebbing inflation data."
"We are in a good position with monetary policy."
The labor market is still very strong."
"FOMC is doing good work understanding, forecasting economy."
"Politics does not come into FOMC debates."
Market reaction
The US Dollar preserves its strength following these comments. At the time of press, the USD Index was up 0.35% on the day at 105.60.
- Natural Gas recovers a touch on Friday after its technical correction on Thursday.
- European Natural Gas futures trade close to a six-month high as supply issues mount. .
- The US Dollar Index trades higher, driven by a weaker Euro and Japanese Yen.
Natural Gas price (XNG/USD) recovers slightly on Friday after breaking below a key support level at $3.08 on Thursday. The risk for more downside comes with the political turmoil in Europe, particularly in France, that is causing distress in the European sovereign bond markets, hurting the growth potential for the bloc. On the other hand, a string of court rulings in favor of several big industrial companies against Russian Gas exporter Gazprom and supply issues in Australia are pushing up European prices close to a six-month high.
Meanwhile, the US Dollar Index (DXY), which tracks the Greenback’s value against six major currencies, is trading in the green with help from its two main contributors accounting for 70% of the DXY: the Euro (EUR) and Japanese Yen (JPY). With a rather slim economic calendar ahead, only the University of Michigan Sentiment could bring some US Dollar weakness. However, the recent decline in the Consumer Price Index numbers (CPI) and Producer Price Index (PPI) numbers makes it more difficult for consumer sentiment to take a significant hit.
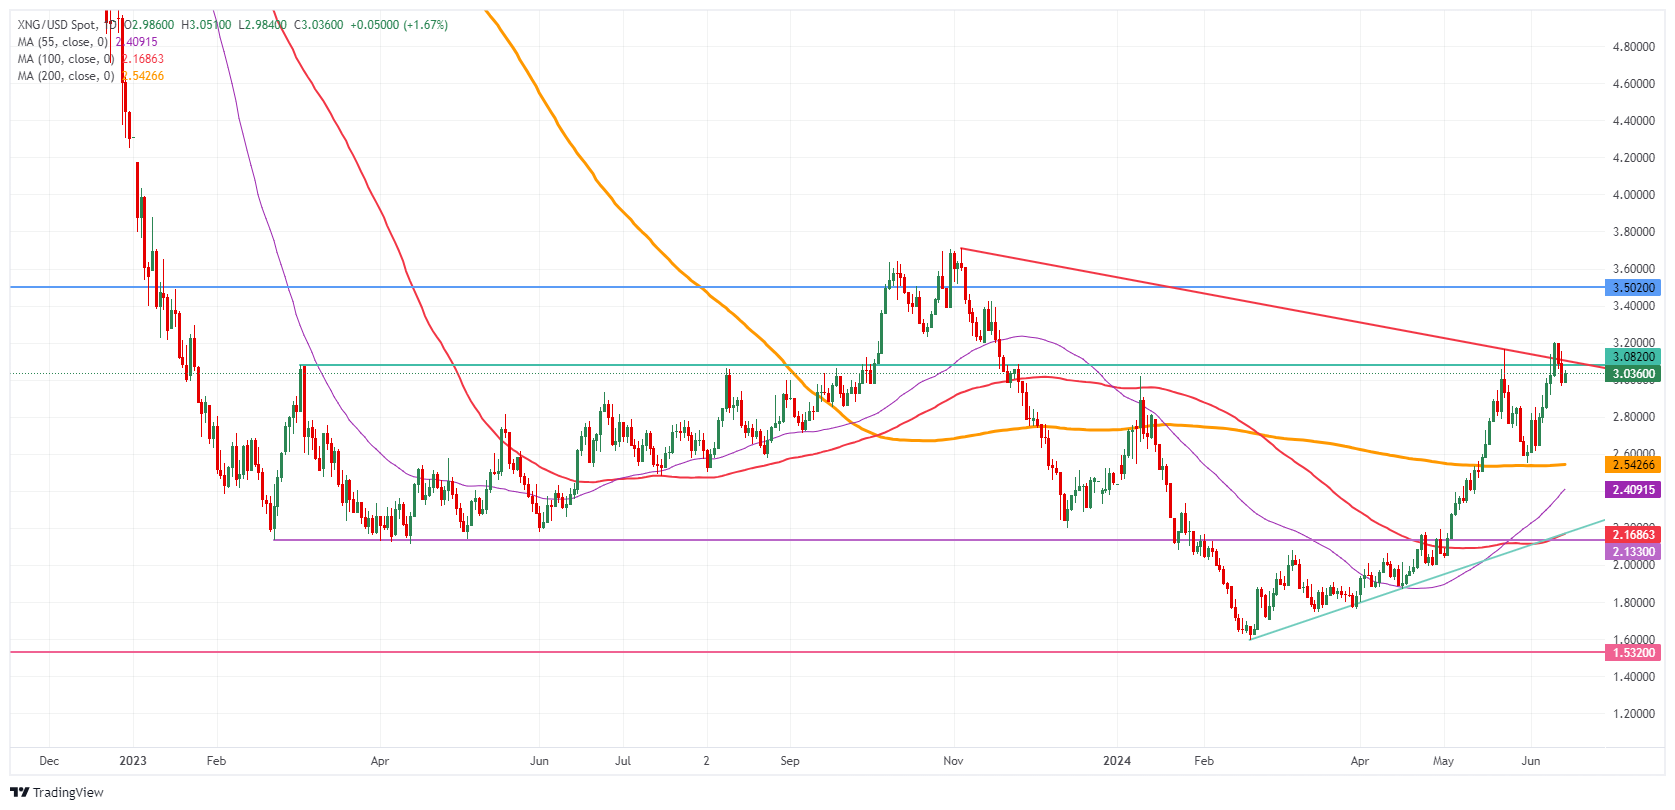
Natural Gas is trading at $3.04 per MMBtu at the time of writing.
Natural Gas news and market movers: Torn again
- Supply issues in Australia persist ahead of the weekend, with the Wheatstone offshore plant from Chevron still fully shut down. Repairs will take longer than expected, Reuters reports.
- European Gas prices saw a similar pattern, where the rally got snapped this week, while traders look to Egypt as the country keeps hoarding Liquified Natural Gas (LNG) in order to meet summer heat season and energy demand.
- The EIA (Energy Information Administration) reported on Thursday that the Natural Gas Storage Change was a build of 74 billion cubic feet of natural gas against 98 billion cubic feet last week.
Natural Gas Technical Analysis: Europe caught
Europe’s performance will be key in terms of demand in the near term. Should Europe’s economy start to underperform due to political and sovereign tensions, the risk for a more sluggish outlook could hurt demand. On the other hand, a pickup in demand is expected should Europe’s economy pick up pace.The pivotal level near $3.07 (the high from March 6, 2023) remains key as prices on Wednesday closed above it by just a few cents. Looking up, the red descending trendline at $3.12 would likely slam down any attempts to jump higher. Further up, the fresh year-to-date high at $3.16 is the level to beat.
On the downside, the 200-day Simple Moving Average (SMA) acts as the first support near $2.53. Should that support area fail to hold, the next target could be the pivotal level near $2.14, with interim support by the 55-day SMA near $2.34. Further down, the biggest support comes at $2.11 with the 100-day SMA.
Natural Gas: Daily Chart
Natural Gas FAQs
Supply and demand dynamics are a key factor influencing Natural Gas prices, and are themselves influenced by global economic growth, industrial activity, population growth, production levels, and inventories. The weather impacts Natural Gas prices because more Gas is used during cold winters and hot summers for heating and cooling. Competition from other energy sources impacts prices as consumers may switch to cheaper sources. Geopolitical events are factors as exemplified by the war in Ukraine. Government policies relating to extraction, transportation, and environmental issues also impact prices.
The main economic release influencing Natural Gas prices is the weekly inventory bulletin from the Energy Information Administration (EIA), a US government agency that produces US gas market data. The EIA Gas bulletin usually comes out on Thursday at 14:30 GMT, a day after the EIA publishes its weekly Oil bulletin. Economic data from large consumers of Natural Gas can impact supply and demand, the largest of which include China, Germany and Japan. Natural Gas is primarily priced and traded in US Dollars, thus economic releases impacting the US Dollar are also factors.
The US Dollar is the world’s reserve currency and most commodities, including Natural Gas are priced and traded on international markets in US Dollars. As such, the value of the US Dollar is a factor in the price of Natural Gas, because if the Dollar strengthens it means less Dollars are required to buy the same volume of Gas (the price falls), and vice versa if USD strengthens.
- GBP/JPY surrenders BoJ-led gains and drops below 200.00.
- The BoJ left interest rates steady and postponed taper tantrum plans.
- Steady UK wage growth remains a key barrier to BoE’s move towards policy-normalization.
The GBP/JPY pair falls back below the psychological support of 200.00 to 199.50 in Friday’s European session after posting a fresh multi-year high of 201.62. The cross weakens even though the Bank of Japan (BoJ) kept overnight rates in the range of 0%-0.1%. The BoJ was already expected to keep interest rates unchanged, however, the postponement of decision on tapering bond-buying to the July meeting was unexpected.
At the conclusion of the policy meeting, BoJ Ueda said the bank would continue buying government bonds. However, earlier this month, BoJ Governor Kazuo Ueda emphasized on reducing bond purchases in a manner to move forward towards their agenda of exiting expansionary policy stance.
This has raised concerns over scope of BoJ’s policy-normalization. Investors are already concerned over the same as price pressures in the Japanese economy are majorly driven by competitive exports due to weak Yen and not from the wage-growth spiral.
In the United Kingdom (UK), uncertainty over Bank of England (BoE) rate cuts has deepened due to steady wage growth that fuels service inflation, and poor economic health and labor demand.
The UK economic recovery appears to have stalled as monthly Gross Domestic Product (GDP) remained stagnant in April. Also, the labor market is facing lay-offs consistently from past four times. This indicates that the economy is struggling to bear the consequences of higher interest rates by the BoE. Currently, financial markets are split between August or September meeting about when the BoE will start reducing interest rates.
- AUD/USD is in a down-leg within a narrow trading range.
- The pair is probably in a sideways trend with the odds favoring an extension of that trend.
- A decisive break above or below the top or bottom of the range would generate follow-through targets.
AUD/USD is trading in a range between 0.6590 and 0.6709. At the moment price is unfolding in a down-leg within that range.
AUD/USD 4-hour Chart
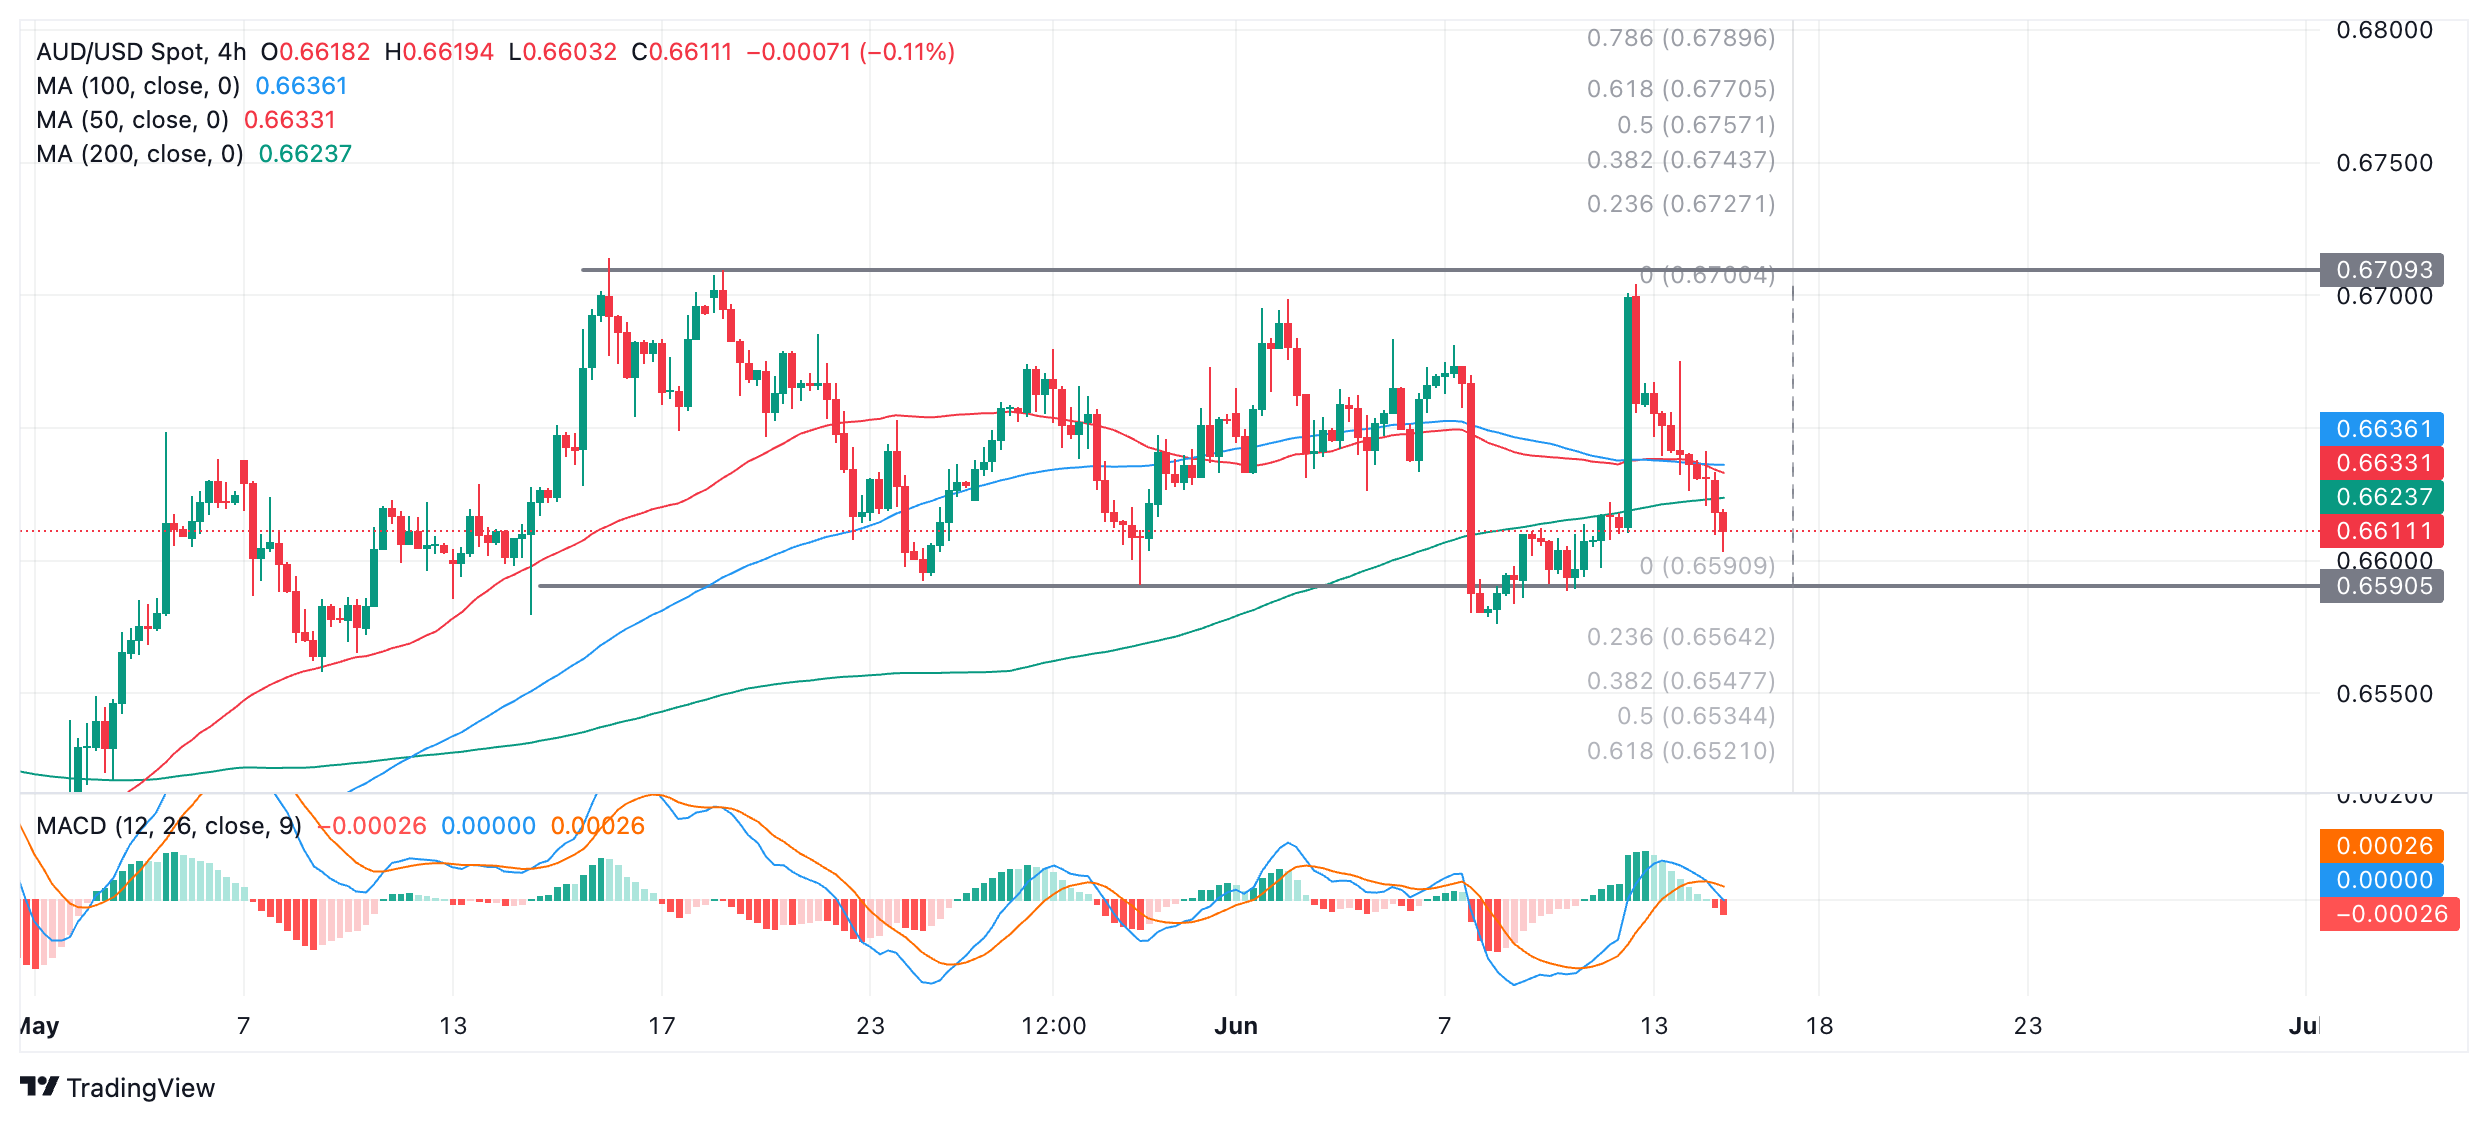
AUD/USD is in a sideways short-term trend, with the odds favoring an extension of the range-bound mode, given “the trend is your friend”.
AUD/USD would need to decisively break out of the range to signal a change to a more directional trend. An upside break is marginally more likely than a downside break because the trend prior to the formation of the range was bullish and so the breakout is slightly more likely to be higher.
A decisive break above the ceiling of the range would indicate an extension higher to a conservative target at 0.6770; a decisive break below the range floor would indicate a follow-through to at least 0.6521.
A decisive break would be one in which a longer-than-average candle broke through the level and closed near its high or low, or three successive candles of the same color broke cleanly through the range top or bottom.
The targets are generated using the technical analysis method of extrapolating the height of the range by a Fibonacci 0.618 ratio higher (for an upside break) or lower (for a downside break). A more generous target would come from extrapolating the full height of the range.
- The US Dollar trades firmly in the green while the Japanese Yen and the Euro weaken.
- The BoJ said it is set to ease its bond-buying program, while European sovereign bond yields increase due to political uncertainty in France..
- The US Dollar index trades above 105.50 and could head towards year-to-date highs.
The US Dollar (USD) rallies on Friday as traders flee out of the Japanese Yen (JPY) and the Euro (EUR). The renewed strength in the Greenback comes as sovereign bond yields in some countries in the Eurozone, particularly France, are spiking on the back of political uncertainty. In Asia, the weaker Japanese Yen is the result of the Bank of Japan (BoJ) monetary policy meeting, which concluded with Governor Kazuo Ueda’s announcement that the bank is set to relax its bond-buying program.
On the economic data front, markets seem to be ignoring the recent soft inflation figures and focusing on a still hawkish Federal Reserve (Fed). On Friday, the calendar offers import-export data price data and the University of Michigan Consumer Sentiment and Inflation Expectations survey. Federal Reserve Bank of Chicago President Austan Goolsbee and Federal Reserve Governor Lisa Cook will drop some comments during the US session.
Daily digest market movers: Gaining without doing anything
- Two non-USD drivers triggered ample US Dollar strength across the board on Friday:the Eurozone bond crunch – with sovereign yields rising in countries like Italy and France – and the outcome of the Bank of Japan monetary policy meeting.
- The USD/JPY pair climbs back to nearly 158.00 after the BoJ announced it will ease its bond-buying program. This might trigger a freefall in bond prices and a rise in yields, triggering further Yen weakness.
- At 12:30 GMT, US Import and Export prices for May will be released. Monthly Import prices are expected to rise 0.1%, down from the 0.9% increase seen in April. Monthly Export prices should stabilize following the 0.5% increase a month earlier.
- At 14:00 GMT, the University of Michigan will release its preliminary report for June:
- Consumer Sentiment is expected to jump back to 72.0 from 69.1.
- The five-year inflation expectations rate stood at 3% at the end of April.
- Near 18:00 GMT, Federal Reserve Bank of Chicago President Austan Goolsbee participates in a fireside chat at the Iowa Farm Bureau Economic Summit.
- At 23:00 GMT, Federal Reserve Governor Lisa Cook delivers a speech at the 50 Years celebration of the American Economic Association Summer Program in Washington D.C.
- Equity markets are painting a similar pattern compared to the last few trading sessions, with European equities in the red and US futures holding onto gains.
- The CME FedWatch Tool shows a 31.5% chance of Fed interest rate remaining at the current level in September. Odds for a 25-basis-points rate cut stand at 60.5%, while a very slim 7.9% chance is priced in for a 50-basis-points rate cut.
- The benchmark 10-year US Treasury Note slides to the lowest level for this month, near 4.22%, flirting with the lows seen in March.
US Dollar Index Technical Analysis: With a little help from my friends
The US Dollar Index (DXY) is getting help from both the Japanese Yen and the Euro this Friday. With both currencies accounting for nearly 70% of the basket forming the US Dollar Index, when both weaken, the Greenback gains without doing anything. With still a few weeks to go before the French elections and the BoJ taking it very slowly, the Greenback could get some further support in the coming weeks.
On the upside, no big changes to the levels traders need to watch out for. The first is 105.52 where the DXY is trading around at this moment, a level that held during most of April. The next level to watch is 105.88, which triggered a rejection at the start of May and will likely play its role as resistance again. Further up, the biggest challenge remains at 106.51, the year-to-date high from April 16.
On the downside, the trifecta of Simple Moving Averages (SMA) is still playing support. First is the 55-day SMA at 105.07. A touch lower, near 104.48, both the 100-day and the 200-day SMA are forming a double layer of protection to support any declines. Should this area be broken, look for 104.00 to salvage the situation.
US Dollar FAQs
The US Dollar (USD) is the official currency of the United States of America, and the ‘de facto’ currency of a significant number of other countries where it is found in circulation alongside local notes. It is the most heavily traded currency in the world, accounting for over 88% of all global foreign exchange turnover, or an average of $6.6 trillion in transactions per day, according to data from 2022. Following the second world war, the USD took over from the British Pound as the world’s reserve currency. For most of its history, the US Dollar was backed by Gold, until the Bretton Woods Agreement in 1971 when the Gold Standard went away.
The most important single factor impacting on the value of the US Dollar is monetary policy, which is shaped by the Federal Reserve (Fed). The Fed has two mandates: to achieve price stability (control inflation) and foster full employment. Its primary tool to achieve these two goals is by adjusting interest rates. When prices are rising too quickly and inflation is above the Fed’s 2% target, the Fed will raise rates, which helps the USD value. When inflation falls below 2% or the Unemployment Rate is too high, the Fed may lower interest rates, which weighs on the Greenback.
In extreme situations, the Federal Reserve can also print more Dollars and enact quantitative easing (QE). QE is the process by which the Fed substantially increases the flow of credit in a stuck financial system. It is a non-standard policy measure used when credit has dried up because banks will not lend to each other (out of the fear of counterparty default). It is a last resort when simply lowering interest rates is unlikely to achieve the necessary result. It was the Fed’s weapon of choice to combat the credit crunch that occurred during the Great Financial Crisis in 2008. It involves the Fed printing more Dollars and using them to buy US government bonds predominantly from financial institutions. QE usually leads to a weaker US Dollar.
Quantitative tightening (QT) is the reverse process whereby the Federal Reserve stops buying bonds from financial institutions and does not reinvest the principal from the bonds it holds maturing in new purchases. It is usually positive for the US Dollar.
European Central Bank (ECB) Governing Council member Mario Centeno said Friday that “the disinflation process will resume after August.”
Additional comments
Some recovery in real wages is inevitable.
We should continue to be data-dependent.
Market reaction
EUR/USD was last seen trading at 1.0685, losing 0.46% on the day.
ECB FAQs
The European Central Bank (ECB) in Frankfurt, Germany, is the reserve bank for the Eurozone. The ECB sets interest rates and manages monetary policy for the region. The ECB primary mandate is to maintain price stability, which means keeping inflation at around 2%. Its primary tool for achieving this is by raising or lowering interest rates. Relatively high interest rates will usually result in a stronger Euro and vice versa. The ECB Governing Council makes monetary policy decisions at meetings held eight times a year. Decisions are made by heads of the Eurozone national banks and six permanent members, including the President of the ECB, Christine Lagarde.
In extreme situations, the European Central Bank can enact a policy tool called Quantitative Easing. QE is the process by which the ECB prints Euros and uses them to buy assets – usually government or corporate bonds – from banks and other financial institutions. QE usually results in a weaker Euro. QE is a last resort when simply lowering interest rates is unlikely to achieve the objective of price stability. The ECB used it during the Great Financial Crisis in 2009-11, in 2015 when inflation remained stubbornly low, as well as during the covid pandemic.
Quantitative tightening (QT) is the reverse of QE. It is undertaken after QE when an economic recovery is underway and inflation starts rising. Whilst in QE the European Central Bank (ECB) purchases government and corporate bonds from financial institutions to provide them with liquidity, in QT the ECB stops buying more bonds, and stops reinvesting the principal maturing on the bonds it already holds. It is usually positive (or bullish) for the Euro.
- NZD/USD slides further to 0.6130 as the Fed’s hawkish outlook dampens the market mood.
- The Fed signaled one rate cut this year amid uncertainty over the inflation outlook.
- NZD/USD fails to deliver an Inverted H&S breakout.
The NZD/USD pair tumbles to near 0.6130 in Friday’s European session. The Kiwi asset faces an intense sell-off as the US Dollar (USD) strengthens due to the Federal Reserve’s (Fed) hawkish interest rate outlook. The US Dollar Index (DXY), which tracks the Greenback’s value against six major currencies, jumps to 105.70, the highest level seen in a month.
The Fed advocated for only one rate cut this year against three projected in March as policymakers remain concerned over progress in disinflation due to strong labor market conditions. Fed’s hawkish narrative has also resulted in a dismal market mood. S&P 500 futures have posted significant losses in the London session, suggesting a sharp decline in investors’ risk appetite.
However, 10-year US Treasury yields fall further to 4.22% as market expectations for Fed rate cuts in September have been improved significantly due to soft United States consumer and producer inflation reports for May in which all components were lower than expectations.
Meanwhile, the New Zealand Dollar weakens after poor Business NZ Purchasing Managers’ Index (PMI) data for May, which showed that factory activity declined to 47.2 from the prior release of 48.8, downwardly revised from 48.9. A figure below the 50.0 threshold is itself considered as contraction.
NZD/USD faces selling pressure above 0.6200 while attempting to deliver a breakout of the Inverted Head and Shoulder (H&S) chart pattern formed on a daily timeframe. The neckline of the above-mentioned chart pattern is marked near 0.6215. The asset has declined slightly below the 20-day Exponential Moving Average (EMA) near 0.6130. A decisive break below the same would weaken its near-term outlook.
The 14-period Relative Strength Index (RSI) falls back into the 40.00-60.00 range, indicating that the upside momentum has faded.
Fresh downside would appear if the asset breaks below April 4 high around 0.6050 This would drag the asset towards the psychological support of 0.6000 and April 25 high at 0.5969.
On the contrary, a reversal move above June 12 high of 0.6222, which will expose the asset January 15 high near 0.6250, followed by January 12 high near 0.6280.
NZD/USD daily chart
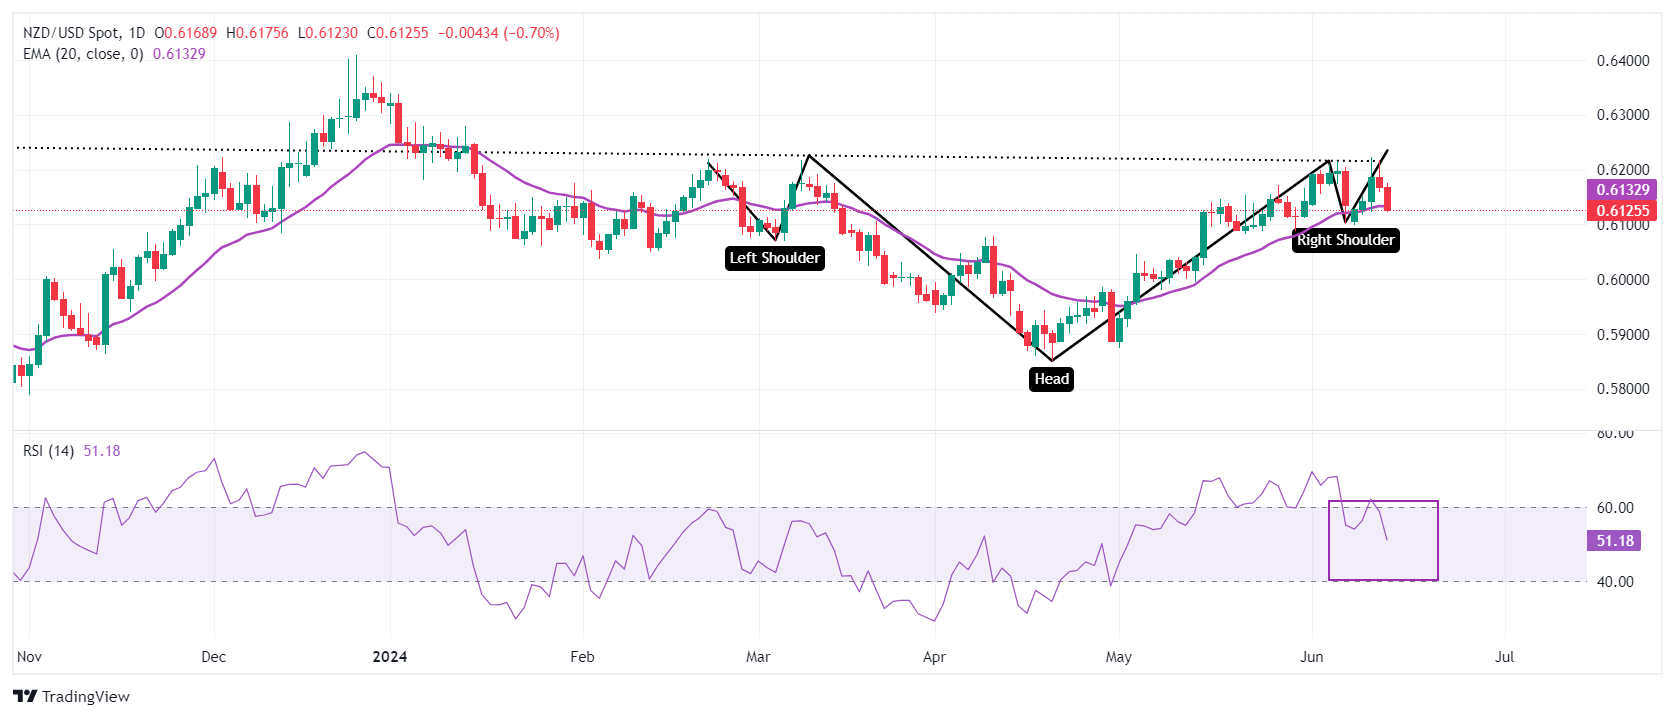
- The Mexican Peso briefly recovered on Thursday after the President of the Banxico warned she will prop up the Peso if volatility persists.
- The recovery falters on Friday, however, as traders continue beating MXN lower following the outcome of the June elections.
- USD/MXN appears to end its correction and resume its bullish trend.
The Mexican Peso (MXN) trades between half a percent and one percent lower in its most traded pairs on Friday as markets continue to fret about the proposed policies of Mexico’s newly elected left-wing government. The Peso is additionally pressured by a squeeze on overweight long positions that have built up after a multi-year period of appreciation for the Mexican currency.
At the time of writing, a single US Dollar (USD) buys 18.56 Mexican Pesos, EUR/MXN is trading at 19.87 and GBP/MXN at 23.63.
Mexican Peso temporarily recovers after intervention, then sinks
The Mexican Peso backs and fills on Friday after the previous day’s steep rally, which came on the back of verbal intervention by the President of the Banco de Mexico (Banxico), Victoria Rodriguez Ceja, who said Banxico would step in to prop up the Peso if volatility became too “extreme”.
On Friday, however, traders continue to apply pressure in line with the downturn since the results of the Mexican elections on June 2. These led to a victory for President-elect Claudia Sheinbaum and her left-wing coalition Sigamos Haciendo Historia (SHH). SHH won a supermajority in the Mexican house of deputies and came two seats away in the senate. This will make it easier for incumbent President Andres Manuel Lopez Obrador (AMLO) to push through radical amendments to the constitution that have set markets on edge.
The raft of 20 proposed amendments and reforms range from rights to higher minimum wages and an increase in state-sector pensions, to the abolition of independent regulators and reforms to the judiciary – particularly the controversial idea of replacing the current system of appointing judges with one that would see them elected by popular vote.
“The main concerns around these amendments is that (i) there will be an erosion of checks and balances and (ii) they would start to take Mexico down the path of wage indexation, which would clearly undermine Banxico’s efforts to get inflation under control,” Jason Tuvey, Deputy Chief Emerging Markets Economist at Capital Economics told FXStreet.
On Wednesday during his daily broadcast to the masses, AMLO hit back at critics of his reforms, saying the current depreciation of the Peso, which has lost 10% of its value since the election, has been driven by “speculators” not “investors” and is part of a conspiracy of the right to “blackmail” the government into ditching the proposed reforms.
He further argued that the current system of appointing judges was too open to corruption by elites, politicians and organized crime, resulting in a judiciary that was compromised. In comparison his reforms “would make the appointment of judges more democratic, improving the rule of law and actually attracting more not less foreign investment,” he said. AMLO also pointed to the fact that under his administration the Peso had appreciated whereas under all five previous Presidents it had depreciated, sometimes considerably. Critics of AMLO say he is punishing the Supreme court for obstructing some of his reforms.
The large decline in the Mexican Peso since the June 2 elections could be seen as an overdue correction from overvalued extremes. The Peso has been in a long-term uptrend since April 2020, partly due to the extraordinarily high interest rates set by the Bank of Mexico (Banxico), which have made the currency attractive to carry traders. Carry traders borrow in currencies with low interest rates like the Japanese Yen (Apr circa 0.0% -0.1%) and invest in currencies like the Mexican Peso that offer higher returns (Apr circa 11.00%), pocketing the difference.
It seems unlikely that the prospect of judicial reforms are primarily to blame for the sudden steep correction in MXN. Rather the elections may have acted as a kind of tinder stick to a bonfire of long positions that had built up in the Peso.
“Before the election, we’d been arguing for some time that the Peso appeared increasingly overvalued and was vulnerable to a sharp fall – the declines over the past couple of weeks have taken it within touching distance of our long-standing year-end forecast of 19.00 (USD/MXN),” said Tuvey.
Technical Analysis: USD/MXN probably resumes short-term uptrend
USD/MXN rebounds after its recent correction on Friday, resuming its short and intermediate term uptrend.
USD/MXN Daily Chart
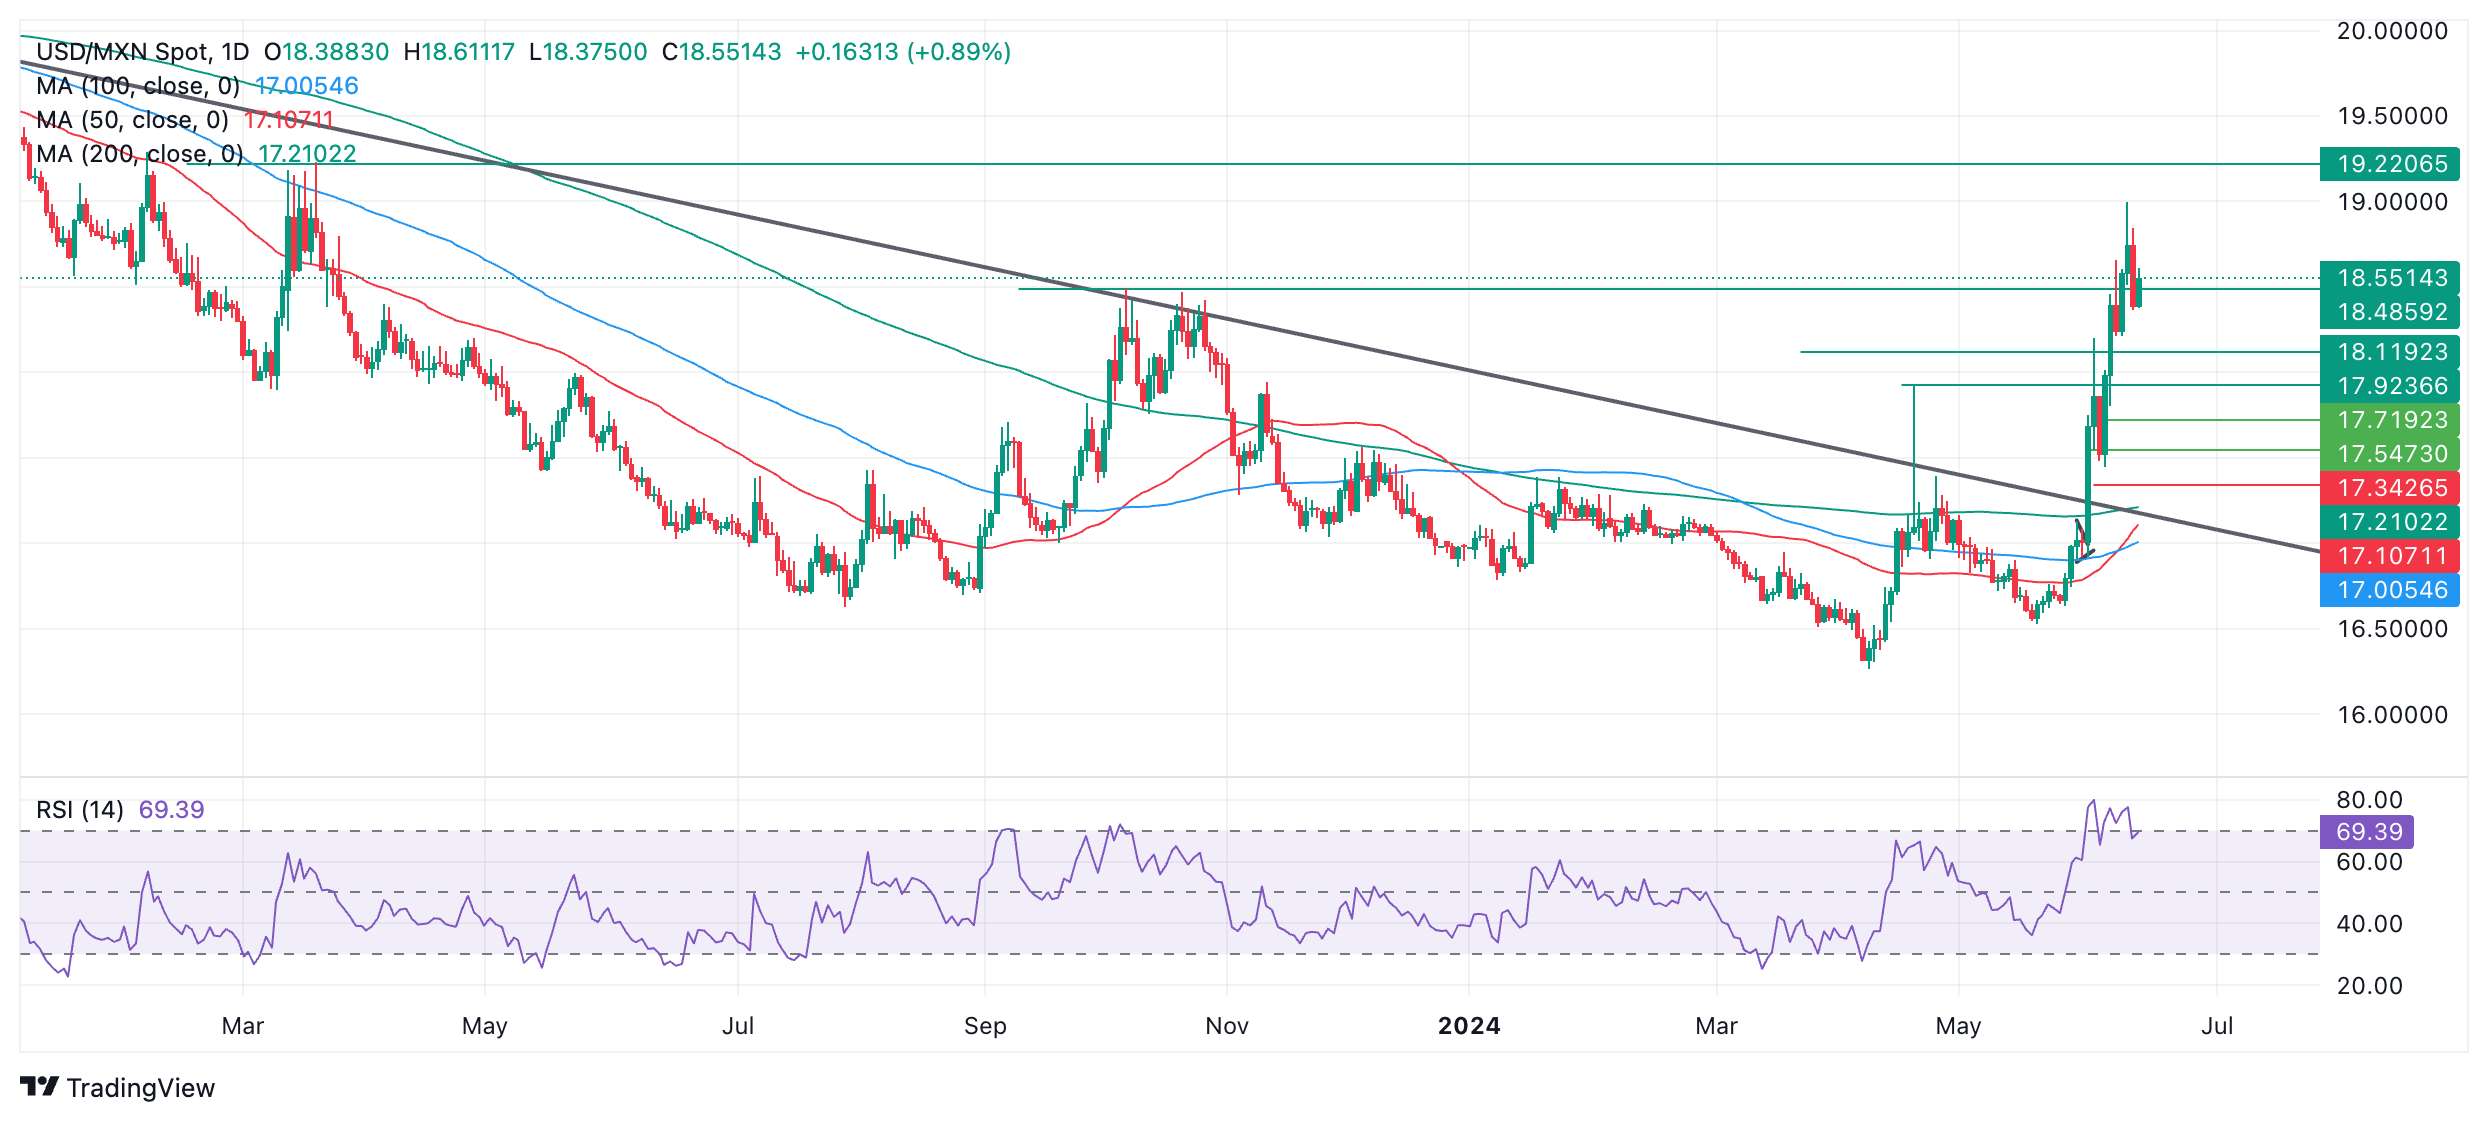
Given “the trend is your friend,” the odds favor a continuation of the uptrend, with the next target potentially situated at 19.22 (March 2023 high).
The Relative Strength Index (RSI) has just exited the overbought zone. However, the correction could still go deeper – although the established uptrend is likely to eventually resume.
The direction of the long-term trend is in doubt after the break above the October 2023 high. Previous to that, it was down.
Mexican Peso FAQs
The Mexican Peso (MXN) is the most traded currency among its Latin American peers. Its value is broadly determined by the performance of the Mexican economy, the country’s central bank’s policy, the amount of foreign investment in the country and even the levels of remittances sent by Mexicans who live abroad, particularly in the United States. Geopolitical trends can also move MXN: for example, the process of nearshoring – or the decision by some firms to relocate manufacturing capacity and supply chains closer to their home countries – is also seen as a catalyst for the Mexican currency as the country is considered a key manufacturing hub in the American continent. Another catalyst for MXN is Oil prices as Mexico is a key exporter of the commodity.
The main objective of Mexico’s central bank, also known as Banxico, is to maintain inflation at low and stable levels (at or close to its target of 3%, the midpoint in a tolerance band of between 2% and 4%). To this end, the bank sets an appropriate level of interest rates. When inflation is too high, Banxico will attempt to tame it by raising interest rates, making it more expensive for households and businesses to borrow money, thus cooling demand and the overall economy. Higher interest rates are generally positive for the Mexican Peso (MXN) as they lead to higher yields, making the country a more attractive place for investors. On the contrary, lower interest rates tend to weaken MXN.
Macroeconomic data releases are key to assess the state of the economy and can have an impact on the Mexican Peso (MXN) valuation. A strong Mexican economy, based on high economic growth, low unemployment and high confidence is good for MXN. Not only does it attract more foreign investment but it may encourage the Bank of Mexico (Banxico) to increase interest rates, particularly if this strength comes together with elevated inflation. However, if economic data is weak, MXN is likely to depreciate.
As an emerging-market currency, the Mexican Peso (MXN) tends to strive during risk-on periods, or when investors perceive that broader market risks are low and thus are eager to engage with investments that carry a higher risk. Conversely, MXN tends to weaken at times of market turbulence or economic uncertainty as investors tend to sell higher-risk assets and flee to the more-stable safe havens.
- EUR/USD declines to 1.0700 as the Euro weakens amid uncertainty over the French elections.
- ECB policymakers see a bumpy inflation path towards the 2% target.
- Fed’s maintenance of a hawkish outlook offsets the impact of soft US inflation data.
EUR/USD extends its downside below the round-level support of 1.0700, touching the lowest level in more than a month during Friday’s European session. The major currency pair weakens as the Euro remains under pressure due to deepening French political uncertainty ahead of the upcoming legislative elections.
The Euro has faced turmoil this week after French President Emmanuel Macron's called for a snap election on Sunday after suffering a defeat from Marine Le Pen's far-right National Rally (RN) in parliamentary elections. There is a slight possibility that the Centralist’s alliance could make a coalition government as the RN party misses an absolute majority, according to recent polls.
On the monetary policy front, European Central Bank (ECB) policymakers continue to push back expectations of subsequent rate cuts as the path towards the 2% inflation target looks bumpy amid concerns over sustained wage growth.
On Thursday, ECB Governing Council member Bostjan Vasle said that more rate cuts are possible if the disinflation process continues. However, Vasle also warned that the process could slow down as wage momentum is relatively strong.
Daily digest market movers: EUR/USD slides further as Fed sees only one rate cut this year
- EUR/USD faces intense selling pressure and declines below the round-level support of 1.0700 as the US Dollar (US) strengthens. The US Dollar Index (DXY), which tracks the Greenback’s value against six major currencies, prints a fresh monthly high at 105.55.
- The US Dollar remains firm as the latest interest rate projections from Federal Reserve (Fed) policymakers indicate that there will be only one rate cut this year against the three cuts forecasted in March. Also, expectations for the core Personal Consumption Expenditure Price Index (PCE) reading, which is the Fed’s preferred inflation measure, were upwardly revised to 2.8% from 2.6%.
- In Wednesday’s press conference, Fed Chair Jerome Powell acknowledged that soft Consumer Price Index (CPI) report for May is encouraging and indicated that inflation is heading in the right direction. However, to build confidence for rate cuts policymakers want to see inflation declining for months.
- Contrary to Fed’s communication of one rate cut for this year, market participants expect that there will be two. Investors’ expectations for the Fed lowering interest rates twice this year have strengthened due to the soft CPI and Producer Price Index (PPI) report for May.
- According to the CME FedWatch tool, 30-day Federal Funds futures pricing data show that the Fed will start reducing interest rates from the September meeting and there will be one more cut in either November or December. The probability of the Fed cutting rates from September has increased to 65% from 50.5% a week ago.
- The US PPI report showed on Thursday that headline producer inflation unexpectedly contracted by 0.2% on month, while the core reading – which strips off volatile food and energy prices – was unchanged. Annually, headline and core PPI decelerated to 2.2% and 2.3%, respectively.
- In Friday’s session, investors will focus on the preliminary Michigan Consumer Sentiment Index, which gauges public sentiment towards personal finances, business conditions and buying conditions. The index is expected to have improved to 72.0 from the prior reading of 69.1.
Technical Analysis: EUR/USD declines toward 1.0636
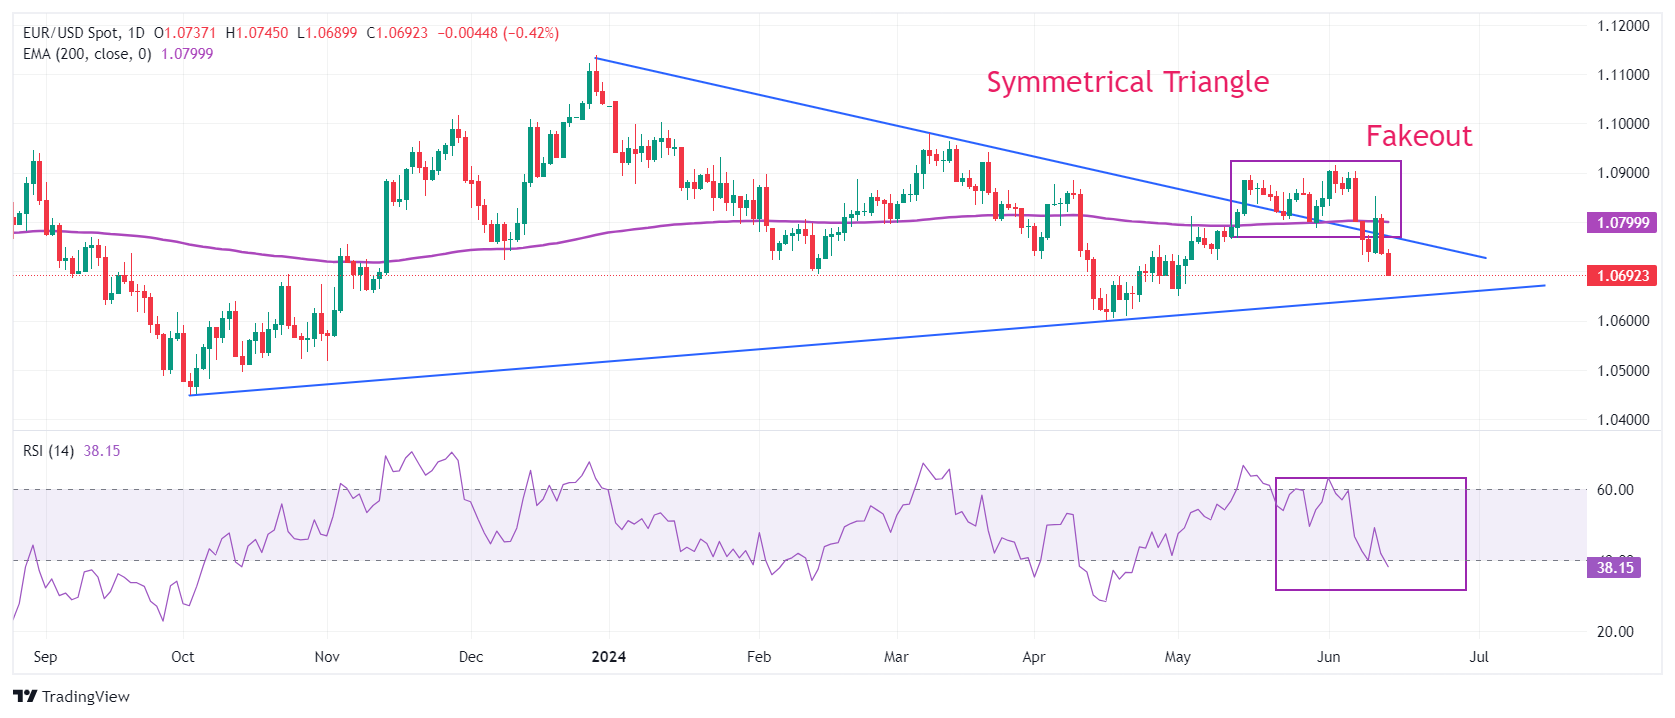
EUR/USD slumps below the round-level support of 1.0700. The major currency pair weakens after failing to hold the Symmetrical Triangle breakout formed on a daily time frame, suggesting that the overall trend has turned bearish. The shared currency pair has now returned inside the triangle formation and is expected to find support at 1.0636, near the upward-sloping order of the chart pattern plotted from 3 October 2023 low at 1.0448.
The long-term outlook of the pair has also turned negative as prices dropped below the 200-day Exponential Moving Average (EMA), which trades around 1.0800.
The 14-day Relative Strength Index (RSI) falls below 40.00. Momentum could turn bearish if the RSI sustains below this level.
Euro FAQs
The Euro is the currency for the 20 European Union countries that belong to the Eurozone. It is the second most heavily traded currency in the world behind the US Dollar. In 2022, it accounted for 31% of all foreign exchange transactions, with an average daily turnover of over $2.2 trillion a day. EUR/USD is the most heavily traded currency pair in the world, accounting for an estimated 30% off all transactions, followed by EUR/JPY (4%), EUR/GBP (3%) and EUR/AUD (2%).
The European Central Bank (ECB) in Frankfurt, Germany, is the reserve bank for the Eurozone. The ECB sets interest rates and manages monetary policy. The ECB’s primary mandate is to maintain price stability, which means either controlling inflation or stimulating growth. Its primary tool is the raising or lowering of interest rates. Relatively high interest rates – or the expectation of higher rates – will usually benefit the Euro and vice versa. The ECB Governing Council makes monetary policy decisions at meetings held eight times a year. Decisions are made by heads of the Eurozone national banks and six permanent members, including the President of the ECB, Christine Lagarde.
Eurozone inflation data, measured by the Harmonized Index of Consumer Prices (HICP), is an important econometric for the Euro. If inflation rises more than expected, especially if above the ECB’s 2% target, it obliges the ECB to raise interest rates to bring it back under control. Relatively high interest rates compared to its counterparts will usually benefit the Euro, as it makes the region more attractive as a place for global investors to park their money.
Data releases gauge the health of the economy and can impact on the Euro. Indicators such as GDP, Manufacturing and Services PMIs, employment, and consumer sentiment surveys can all influence the direction of the single currency. A strong economy is good for the Euro. Not only does it attract more foreign investment but it may encourage the ECB to put up interest rates, which will directly strengthen the Euro. Otherwise, if economic data is weak, the Euro is likely to fall. Economic data for the four largest economies in the euro area (Germany, France, Italy and Spain) are especially significant, as they account for 75% of the Eurozone’s economy.
Another significant data release for the Euro is the Trade Balance. This indicator measures the difference between what a country earns from its exports and what it spends on imports over a given period. If a country produces highly sought after exports then its currency will gain in value purely from the extra demand created from foreign buyers seeking to purchase these goods. Therefore, a positive net Trade Balance strengthens a currency and vice versa for a negative balance.
Silver prices (XAG/USD) rose on Friday, according to FXStreet data. Silver trades at $29.04 per troy ounce, up 0.26% from the $28.97 it cost on Thursday.
Silver prices have increased by 14.02% since the beginning of the year.
| Unit measure | Today Price |
|---|---|
| Silver price per troy ounce | $29.04 |
| Silver price per gram | $0.93 |
The Gold/Silver ratio, which shows the number of troy ounces of Silver needed to equal the value of one troy ounce of Gold, stood at 79.74 on Friday, up from 79.55 on Thursday.
Investors might use this ratio to determine the relative valuation of Gold and Silver. Some may consider a high ratio as an indicator that Silver is undervalued – or Gold is overvalued – and might buy Silver or sell Gold accordingly. Conversely, a low ratio might suggest that Gold is undervalued relative to Silver.
Silver FAQs
Silver is a precious metal highly traded among investors. It has been historically used as a store of value and a medium of exchange. Although less popular than Gold, traders may turn to Silver to diversify their investment portfolio, for its intrinsic value or as a potential hedge during high-inflation periods. Investors can buy physical Silver, in coins or in bars, or trade it through vehicles such as Exchange Traded Funds, which track its price on international markets.
Silver prices can move due to a wide range of factors. Geopolitical instability or fears of a deep recession can make Silver price escalate due to its safe-haven status, although to a lesser extent than Gold's. As a yieldless asset, Silver tends to rise with lower interest rates. Its moves also depend on how the US Dollar (USD) behaves as the asset is priced in dollars (XAG/USD). A strong Dollar tends to keep the price of Silver at bay, whereas a weaker Dollar is likely to propel prices up. Other factors such as investment demand, mining supply – Silver is much more abundant than Gold – and recycling rates can also affect prices.
Silver is widely used in industry, particularly in sectors such as electronics or solar energy, as it has one of the highest electric conductivity of all metals – more than Copper and Gold. A surge in demand can increase prices, while a decline tends to lower them. Dynamics in the US, Chinese and Indian economies can also contribute to price swings: for the US and particularly China, their big industrial sectors use Silver in various processes; in India, consumers’ demand for the precious metal for jewellery also plays a key role in setting prices.
Silver prices tend to follow Gold's moves. When Gold prices rise, Silver typically follows suit, as their status as safe-haven assets is similar. The Gold/Silver ratio, which shows the number of ounces of Silver needed to equal the value of one ounce of Gold, may help to determine the relative valuation between both metals. Some investors may consider a high ratio as an indicator that Silver is undervalued, or Gold is overvalued. On the contrary, a low ratio might suggest that Gold is undervalued relative to Silver.
(An automation tool was used in creating this post.)
UK public inflation expectations for the coming year are seen at 2.8% in May, declining from a 3.0% figure projected in February, the quarterly survey conducted by the Bank of England (BoE) showed on Friday.
Additional findings
UK public inflation expectations for 12 months after that decline from 2.8% to 2.6%.
UK public inflation expectations for five years' time stay unchanged at 3.1%.
42% of UK public think best for economy if rates go down, highest share since nov 2008, up from 41% in February.
Market reaction
At the time of writing, GBP/USD is shedding 0.32% on the day to trade near 1.2720.
British Pound PRICE Today
The table below shows the percentage change of British Pound (GBP) against listed major currencies today. British Pound was the weakest against the Swiss Franc.
| USD | EUR | GBP | JPY | CAD | AUD | NZD | CHF | |
|---|---|---|---|---|---|---|---|---|
| USD | 0.52% | 0.33% | 0.22% | 0.11% | 0.35% | 0.57% | -0.16% | |
| EUR | -0.52% | -0.18% | -0.27% | -0.42% | -0.18% | 0.04% | -0.67% | |
| GBP | -0.33% | 0.18% | -0.12% | -0.23% | 0.02% | 0.22% | -0.50% | |
| JPY | -0.22% | 0.27% | 0.12% | -0.12% | 0.13% | 0.32% | -0.37% | |
| CAD | -0.11% | 0.42% | 0.23% | 0.12% | 0.25% | 0.45% | -0.28% | |
| AUD | -0.35% | 0.18% | -0.02% | -0.13% | -0.25% | 0.20% | -0.51% | |
| NZD | -0.57% | -0.04% | -0.22% | -0.32% | -0.45% | -0.20% | -0.71% | |
| CHF | 0.16% | 0.67% | 0.50% | 0.37% | 0.28% | 0.51% | 0.71% |
The heat map shows percentage changes of major currencies against each other. The base currency is picked from the left column, while the quote currency is picked from the top row. For example, if you pick the British Pound from the left column and move along the horizontal line to the US Dollar, the percentage change displayed in the box will represent GBP (base)/USD (quote).
The European Central Bank (ECB) policymaker Martins Kazaks said on Friday, “market expectations on rates are 'reasonable’.”
Additional quotes
Uncertainty is high but the path is leaning towards lower inflation.
We can remove some restriction but still need to retain some degree of restrictiveness.
Market reaction
EUR/USD remains pressured below 1.0700 on these above comments, down 0.40% so far.
The European Central Bank (ECB) policymaker Bostjan Vasle said on Friday, “rate cutting is likely to be slower than hiking was.”
Additional quotes
Inflation has slowed markedly in recent months.
Risks to the disinflation process remain.
Persistent wage gains coould slow disinflation.
Services costs and political tensions are other risks.
Decisions are to be made meeting by meeting.
Market reaction
As of writing, EUR/USD loses 0.40% on the day to trade near 1.0690, hurt by the French political anxiety.
- EUR/GBP loses ground due to uncertainty surrounding the upcoming European parliamentary elections.
- ECB President Christine Lagarde is expected to speak at the 30th Dubrovnik Economic Conference on Friday.
- UK Consumer Inflation Expectations came in at a 2.8% increase compared to a previous reading of a 3.0% rise.
EUR/GBP continues to depreciate for the second consecutive session, trading around 0.8410 during European hours on Friday. The Euro (EUR) struggles due to uncertainty surrounding the upcoming European parliamentary elections. Investors are awaiting insights from ECB President Christine Lagarde's speech at the 30th Dubrovnik Economic Conference scheduled later in the day.
Political uncertainty in Europe is expected to weigh on the Euro and could further weaken the EUR/GBP cross. The recent European parliamentary elections have highlighted significant divisions within several member states. In France, President Emmanuel Macron's decision to dissolve parliament and call for snap elections follows a defeat by the far-right National Rally, potentially increasing their representation in the country's parliament, as reported by the European Council on Foreign Relations website.
The ECB delivered a 25 basis-point (bps) interest rate cut during its June meeting last week, a move widely expected by market participants. Financial markets have fully priced in one further reduction this year, but economists polled by Reuters last week forecast two more cuts occurring toward the end of 2024.
In the United Kingdom (UK), Consumer Inflation Expectations showed a slight decrease, with expectations for a 2.8% increase over the next 12 months, compared to a previous reading of a 3.0% rise. Traders await the upcoming Bank of England (BoE) monetary policy meeting scheduled for Thursday. It is widely expected that the BoE will maintain interest rates at 5.25%.
Investor attention will primarily be on the number of policymakers likely to support a rate-cut decision. During the May meeting, BoE Deputy Governor Dave Ramsden joined policymaker Swati Dhingra in voting for a 25 basis-point (bps) reduction in interest rates to 5.0%.
EuroNews reported BoE Governor Andrew Bailey acknowledged significant progress in inflation declining to 2%, but emphasized, "We are not yet at a point where we can cut the base rate."
- USD/CAD could test the lower boundary of the rising channel, potentially rebounding to re-enter the rising channel.
- Further movements on the 14-day RSI will provide a clearer directional indication.
- The pair could find key support at the psychological level of 1.3700 and the 50-day EMA of 1.3670 level.
USD/CAD extends its gains for the second day, trading around 1.3750 during early European hours on Friday. Analysis of the daily chart indicates a weakening bullish bias for the USD/CAD pair, as it struggles to re-enter the rising channel pattern. Despite this, the 14-day Relative Strength Index (RSI) remains above the 50 level, suggesting that the bullish momentum is not entirely lost. Further price movements will be needed to provide a clearer directional indication.
Additionally, the momentum indicator Moving Average Convergence Divergence (MACD) suggests an upward trend for the USD/CAD pair, as the MACD line is positioned above the centerline and shows divergence above the signal line. This indicates that the bullish momentum may continue and support the pair to return to the rising channel pattern.
The USD/CAD pair may test the lower boundary of the rising channel around 1.3780, followed by the key barrier at the psychological level of 1.3800. Further support is found at April’s high of 1.3846. A break above this level could lead the USD/CAD pair to approach the upper threshold of the rising channel around 1.3890.
On the downside, the USD/CAD pair could find immediate support at the psychological level of 1.3700, which aligns with the 50-day Exponential Moving Average (EMA) at 1.3670. A break below this level could exert pressure on the pair, pushing it toward the throwback support region around 1.3590.
USD/CAD: Daily Chart
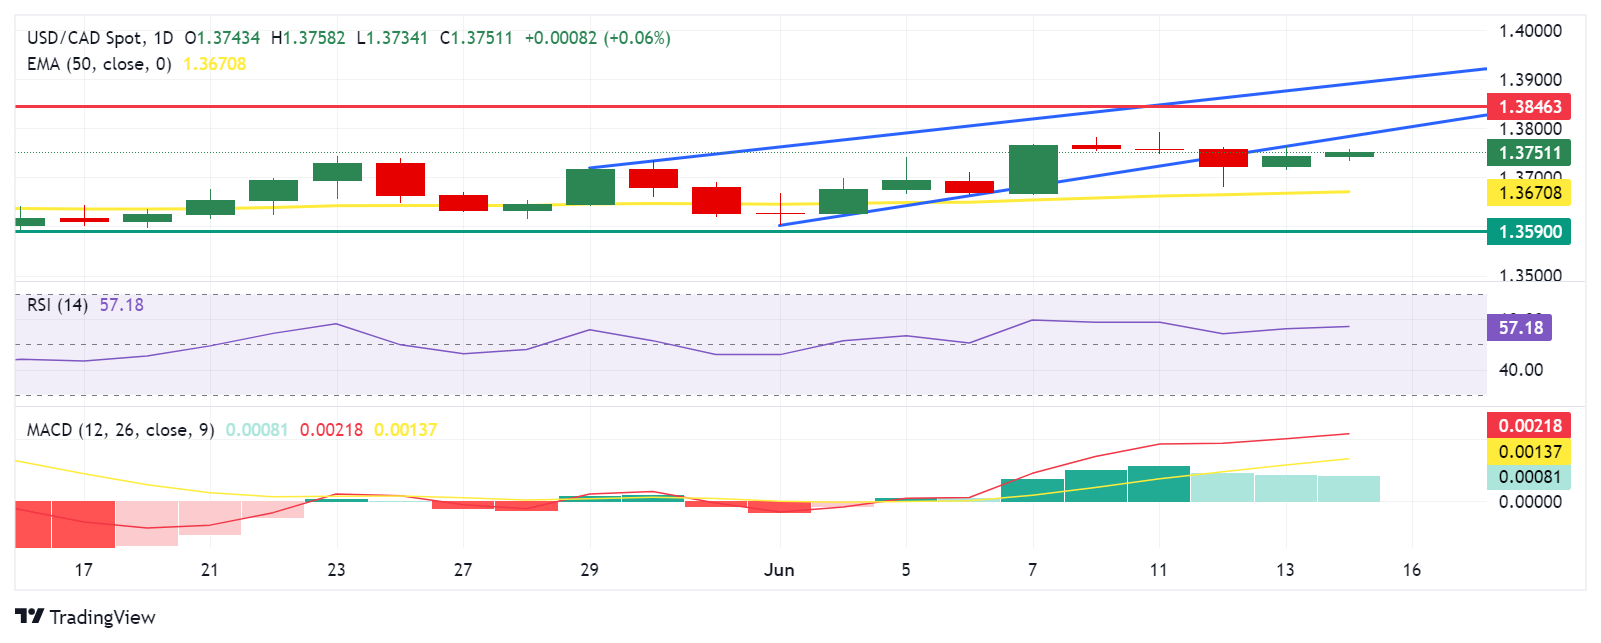
- Gold continues to trade in a range established in spring as traders respond to mixed macroeconomic signals.
- Whilst the data points to a fall in inflation, Fed officials are more cautious.
- XAU/USD has probably formed a bearish Head-and-Shoulders pattern on the daily chart.
Gold (XAU/USD) trades marginally higher on Friday, exchanging hands just above the $2,300 mark during the early European session. Asian bourses lacked directionality overnight and mixed signals from the US regarding the future path of interest rates – a key driver for Gold – are doing little to help establish directionality for the precious metal.
Gold stuck in a range during period of uncertainty
Gold yo-yos in familiar territory as conflicting signals leave traders guessing. This is especially true about the future course of interest rates in the US.
Whilst the country’s economic data points to a disinflationary trend, which would be expected to lead to lower interest rates, the central bankers tasked with making the cuts are acting more cautious. Lower interest rates would be a positive catalyst for Gold as they would reduce the opportunity cost of holding the non-yielding asset. However, it is unclear when and by how much rates will fall.
The release of disinflationary US Producer Price Index (PPI) data on Thursday, the market’s gauge of “factory gate” price growth, provided more evidence of a reduction in inflationary pressures, suggesting the Federal Reserve (Fed) could move to cut interest rates in the near-term.
Yet the data came after the Fed on Wednesday revised down – from three to one – the number of interest-rate cuts it expects to make in 2024 In addition, Fed Chairman Jerome Powell dismissed the importance of the cooler-than-expected Consumer Price Index (CPI) data in May, released only a few hours earlier, saying it was only one data point, and endorsing a data-dependent approach going forward.
Gold price itself rose over half a percent to a peak of $2,342 after the disinflationary CPI release, before backtracking on the Fed’s more cautious stance.
The CPI data balanced out robust US Nonfarm Payrolls (NFP) figures on Friday, which reflected a buoyant labor market and rising wages in the US. These factors would be expected to put upside pressure on inflation, keeping interest rates high.
Gold has also been left reeling after the People’s Bank of China (PBoC) revealed they had stopped buying the precious metal between the end of April and May. It was the first time in 18-months the PBoC had not added to their Gold reserves and suggested a price cap might have been reached. At the same, analysts at Citibank point to continued strong demand from consumers in China, which they say will push Gold higher.
Thus the overall picture remains mixed for Gold traders as they await the next main data release from the US on Friday, the preliminary Michigan Consumer Sentiment Index for June.
Technical Analysis: Gold forms Head-and-Shoulders top
Gold continues to form what looks like a bearish Head-and-Shoulders (H&S) price pattern. H&Ss tend to occur at market tops and signal a change of trend.
XAU/USD Daily Chart
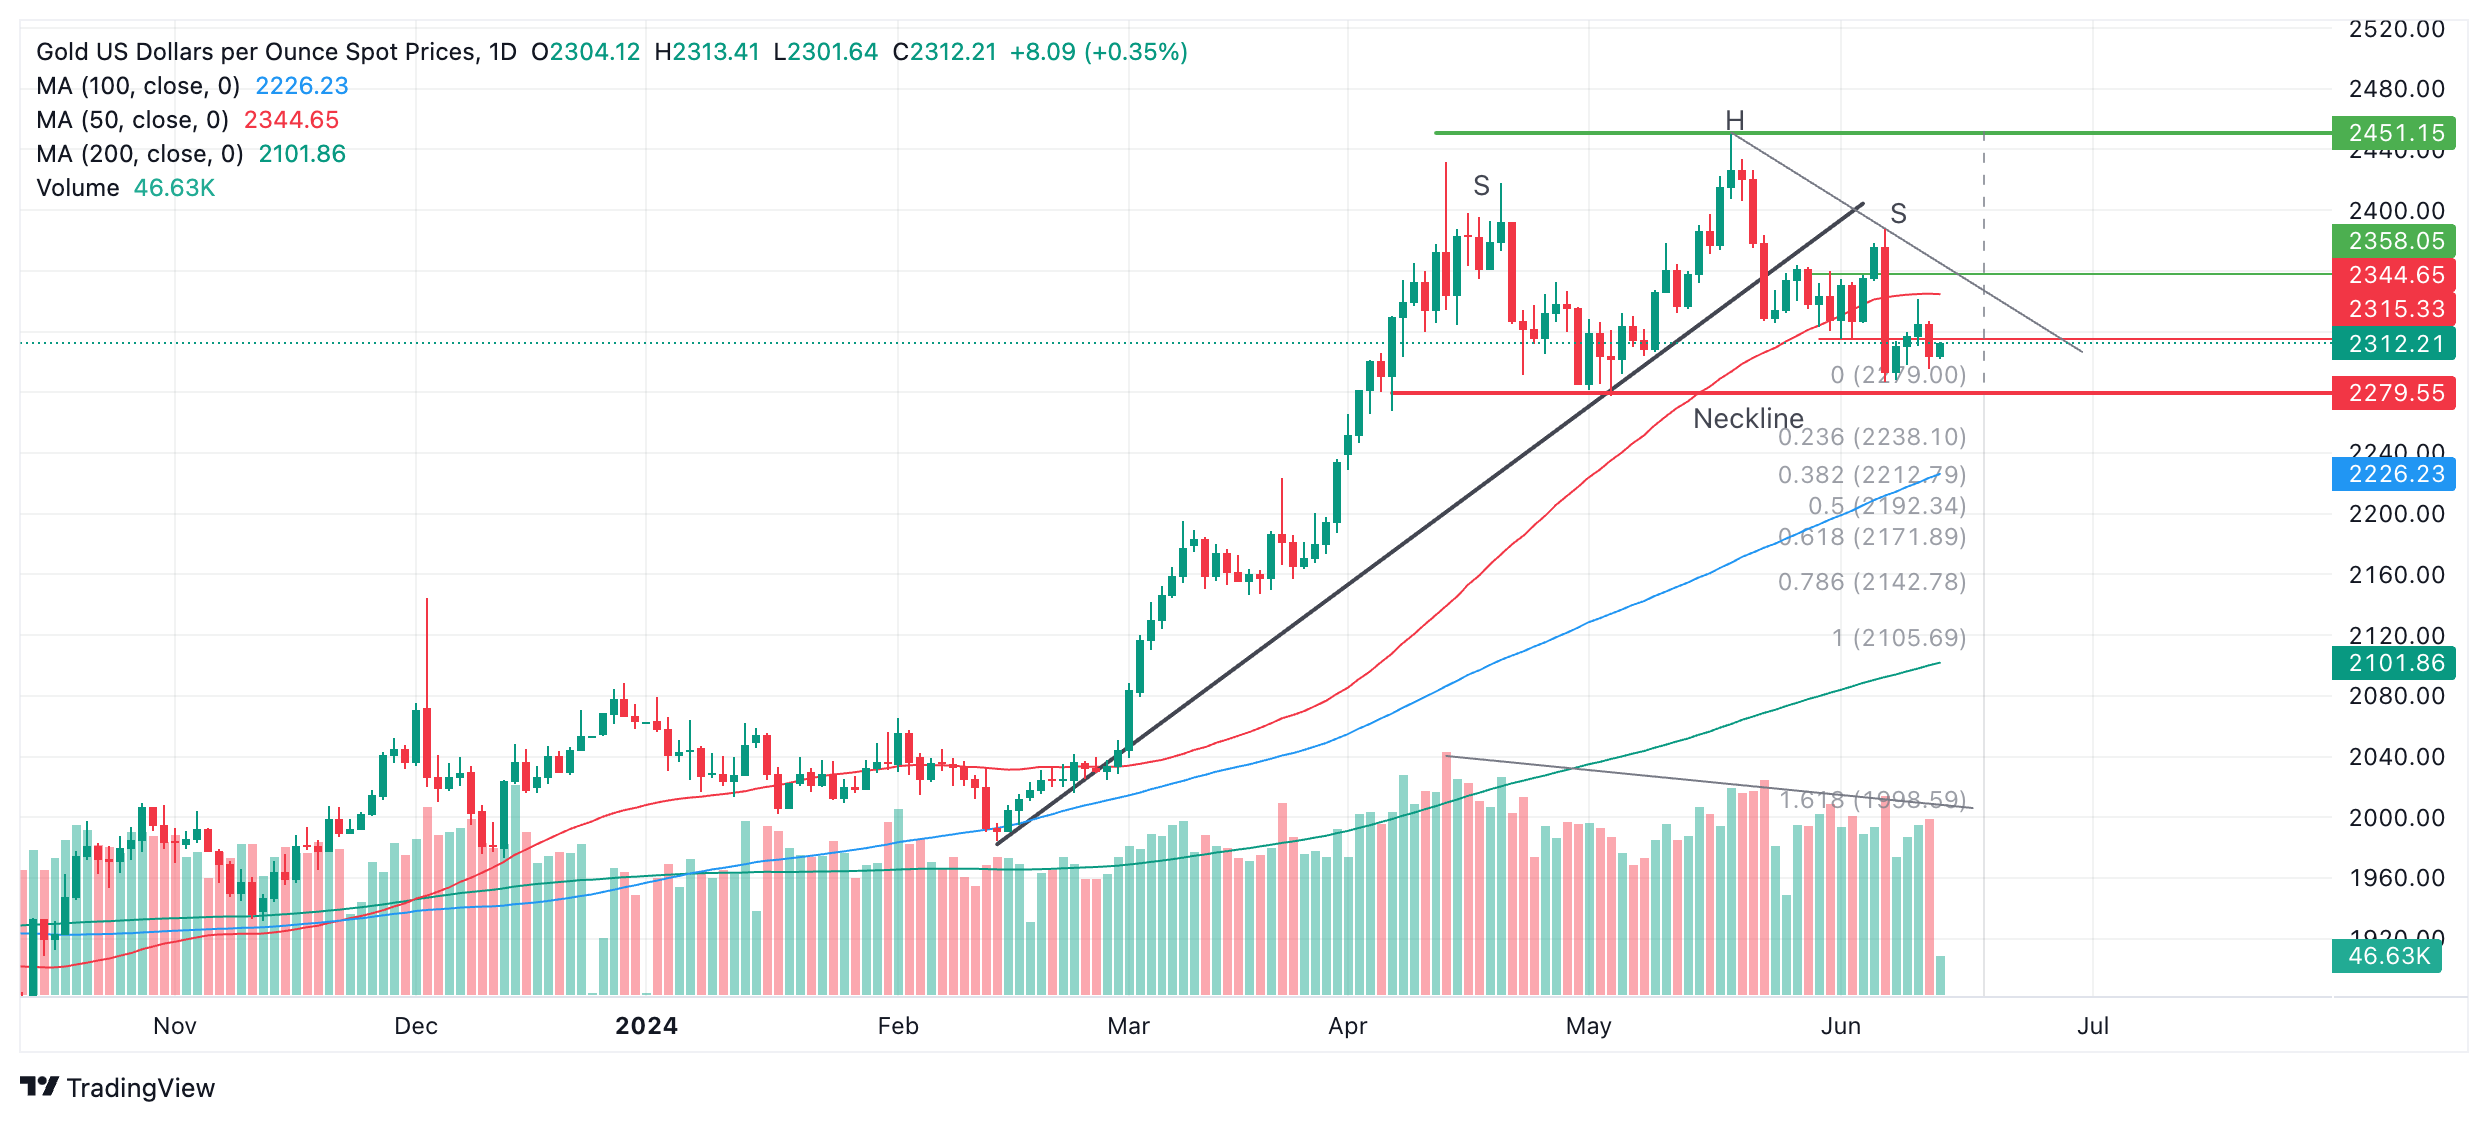
The H&S on Gold has completed a left and right shoulder (labeled “S”) and a “head” (labeled “H”). The so-called “neckline” of the pattern appears to be at the $2,279 support level (red line).
Declining trade volume during its development corroborates the pattern.
A decisive break below the neckline would validate the H&S pattern and activate downside targets. The first, more conservative, target would be $2,171, calculated by taking the 0.618 Fibonacci ratio of the height of the pattern and extrapolating it lower from the neckline. The second target would be at $2,106, the full height of the pattern extrapolated lower.
A break above $2,345, however, would bring the H&S into doubt and could signal a continuation higher, to an initial target at the $2,450 peak.
Economic Indicator
Producer Price Index ex Food & Energy (YoY)
The Producer Price Index ex Food & energy released by the Bureau of Labor statistics, Department of Labor measures the average changes in prices in primary markets of the US by producers of commodities in all states of processing. Those volatile products such as food and energy are excluded in order to capture an accurate calculation. Generally speaking, a high reading is seen as positive (or bullish) for the USD, whereas a low reading is seen as negative (or bearish).
Read more.Last release: Thu Jun 13, 2024 12:30
Frequency: Monthly
Actual: 2.3%
Consensus: 2.4%
Previous: 2.4%
Source: US Bureau of Labor Statistics
Here is what you need to know on Friday, June 14:
The Japanese Yen (JPY)stays under selling pressure on Friday as markets assess the Bank of Japan's (BoJ) monetary policy announcements. The US economic calendar will feature Export Price Index and Import Price Index data for May. Later in the session, the University of Michigan will release the preliminary Consumer Sentiment Index for June.
The BoJ held its policy rate unchanged at 0% for the second straight meeting in June, as widely anticipated. The BoJ did not make any changes to its massive JPY6 trillion ($38.14 billion) monthly Japanese government bonds (JGB) buying programme either. The bank, however, announced that they will hold a meeting with bond market participants and decide on a specific bond buying reduction plan for the next 1-2 years at the next policy meeting in July. In the post-meeting press conference, Governor Kazuo Ueda explained that it is important to reduce JGB purchases in a foreseeable manner, while ensuring flexibility to be mindful of stability in the bond market.
Japanese Yen PRICE Today
The table below shows the percentage change of Japanese Yen (JPY) against listed major currencies today. Japanese Yen was the weakest against the US Dollar.
| USD | EUR | GBP | JPY | CAD | AUD | NZD | CHF | |
|---|---|---|---|---|---|---|---|---|
| USD | 0.18% | 0.28% | 0.68% | 0.05% | 0.29% | 0.51% | 0.06% | |
| EUR | -0.18% | 0.10% | 0.58% | -0.15% | 0.09% | 0.31% | -0.12% | |
| GBP | -0.28% | -0.10% | 0.46% | -0.23% | 0.02% | 0.21% | -0.21% | |
| JPY | -0.68% | -0.58% | -0.46% | -0.65% | -0.41% | -0.22% | -0.62% | |
| CAD | -0.05% | 0.15% | 0.23% | 0.65% | 0.25% | 0.44% | 0.00% | |
| AUD | -0.29% | -0.09% | -0.02% | 0.41% | -0.25% | 0.21% | -0.24% | |
| NZD | -0.51% | -0.31% | -0.21% | 0.22% | -0.44% | -0.21% | -0.42% | |
| CHF | -0.06% | 0.12% | 0.21% | 0.62% | -0.01% | 0.24% | 0.42% |
The heat map shows percentage changes of major currencies against each other. The base currency is picked from the left column, while the quote currency is picked from the top row. For example, if you pick the Japanese Yen from the left column and move along the horizontal line to the US Dollar, the percentage change displayed in the box will represent JPY (base)/USD (quote).
USD/JPY gathered bullish momentum following the BoJ event and was last seen rising 0.6% on the day at around 158.00. Reflecting the broad-based selling pressure surrounding the JPY, EUR/JPY was up 0.4% at 169.30.
Meanwhile, the US Dollar (USD) continues to gather strength against its rivals following the sharp decline seen after soft inflation data on Wednesday. The risk-averse market atmosphere, the sharp decline seen in the JPY and the lack of demand for European currencies amid political jitters, seem to be helping the USD capture capital outflows. At the time of press, the USD Index was trading at its highest level since early March, rising 0.25% on the day near 105.50.
EUR/USD stays under heavy bearish pressure in the European session and declines toward 1.0700.
After snapping a three-day winning streak on Thursday, GBP/USD continues to push lower early Friday and was last seen trading below 1.2750.
Despite the broad-based USD strength, XAU/USD clings to small daily gains at around $2,310. Gold seems to be benefiting from risk aversion ahead of the weekend.
Risk sentiment FAQs
In the world of financial jargon the two widely used terms “risk-on” and “risk off'' refer to the level of risk that investors are willing to stomach during the period referenced. In a “risk-on” market, investors are optimistic about the future and more willing to buy risky assets. In a “risk-off” market investors start to ‘play it safe’ because they are worried about the future, and therefore buy less risky assets that are more certain of bringing a return, even if it is relatively modest.
Typically, during periods of “risk-on”, stock markets will rise, most commodities – except Gold – will also gain in value, since they benefit from a positive growth outlook. The currencies of nations that are heavy commodity exporters strengthen because of increased demand, and Cryptocurrencies rise. In a “risk-off” market, Bonds go up – especially major government Bonds – Gold shines, and safe-haven currencies such as the Japanese Yen, Swiss Franc and US Dollar all benefit.
The Australian Dollar (AUD), the Canadian Dollar (CAD), the New Zealand Dollar (NZD) and minor FX like the Ruble (RUB) and the South African Rand (ZAR), all tend to rise in markets that are “risk-on”. This is because the economies of these currencies are heavily reliant on commodity exports for growth, and commodities tend to rise in price during risk-on periods. This is because investors foresee greater demand for raw materials in the future due to heightened economic activity.
The major currencies that tend to rise during periods of “risk-off” are the US Dollar (USD), the Japanese Yen (JPY) and the Swiss Franc (CHF). The US Dollar, because it is the world’s reserve currency, and because in times of crisis investors buy US government debt, which is seen as safe because the largest economy in the world is unlikely to default. The Yen, from increased demand for Japanese government bonds, because a high proportion are held by domestic investors who are unlikely to dump them – even in a crisis. The Swiss Franc, because strict Swiss banking laws offer investors enhanced capital protection.
- The Pound Sterling declines to 1.2740 against the USD as the Fed signals only one rate cut this year.
- Fed policymakers said they want to see inflation declining for months before considering rate cuts.
- UK’s steady wage growth has raised concerns of persistent inflation in the services sector.
The Pound Sterling (GBP) weakens further to 1.2740 against the US Dollar (USD) in Friday’s trading session as the latter remains firm. The US Dollar Index (DXY), which tracks the Greenback’s value against six major currencies, extends its upside to 105.40. The USD Index rises for a second consecutive day, as the hawkish stance of the Federal Reserve (Fed) on the interest rate outlook has outweighed the impact of the soft United States (US) Consumer Price Index (CPI) and Producer Price Index (PPI) reports for May.
The US PPI report, released on Thursday, showed that the monthly headline PPI declined by 0.2% due to weak gasoline prices, and the core producer inflation, which excludes volatile food and energy prices, was flat.
Cooler consumer and producer inflation reports suggest that the core Personal Consumption Expenditure Price Index (PCE) reading, which is the Fed’s preferred inflation measure, would also exhibit softening inflationary pressures. This has boosted expectations of early rate cuts by the Fed. 30-day Fed Funds futures pricing data shows that traders see a 65% chance that there will be a rate-cut decision in September, according to the CME FedWatch Tool. The probability has significantly increased from the 50.5% recorded a week ago.
On Wednesday, the Fed signaled only one rate cut this year against a prior projection of three after leaving interest rates unchanged in the range of 5.25%-5.50%. Policymakers scaled back a number of rate cuts in the latest projections amid concerns that progress in the disinflation progress has slowed. In the press conference after the interest rate decision, Fed Chair Jerome Powell said the soft inflation report for May is encouraging but also that officials want to see price pressures decline for months to build confidence for rate cuts. Powell added that policymakers would respond quickly to rate cuts if labor market conditions start easing.
Daily digest market movers: Pound Sterling weakens with focus on BoE outcome
- The Pound Sterling exhibits a weak performance against North American and other European currencies but is upbeat against most Asia-pacific peers in Friday’s London session. The near-term outlook of the GBP is expected to remain uncertain as investors shift focus to the Bank of England’s (BoE) monetary policy meeting, which is scheduled for Thursday.
- The BoE is widely anticipated to keep interest rates steady at 5.25%. Therefore, investors will majorly focus on the number of policymakers who will vote in favor of a rate-cut decision. In the May meeting, BoE Deputy Governor Dave Ramsden joined policymaker Swati Dhingra and voted for lowering interest rates by 25 basis points (bps) to 5.0%. In the press conference, BoE Governor Andrew Bailey acknowledged significant progress in inflation declining to 2% but remarked, “We are not yet at a point where we can cut the base rate," EuroNews reported.
- Currently, financial markets are split between August or September meetings regarding when the BoE could start reducing interest rates. Before the BoE outcome, investors will focus on the CPI report for May, which will be published on Wednesday. UK headline inflation appears to be on course to return to the desired rate of 2%. However, service inflation that is driven by wage growth continues to be a major concern for policymakers.
- The latest UK Employment report showed that Average Earnings, which is a wage inflation measure, grew steadily in the three months ending April. The pace at which wages are growing is significantly higher than what is needed to bring inflation down to BoE’s target.
Technical Analysis: Pound Sterling falls below 78.6% Fibo support
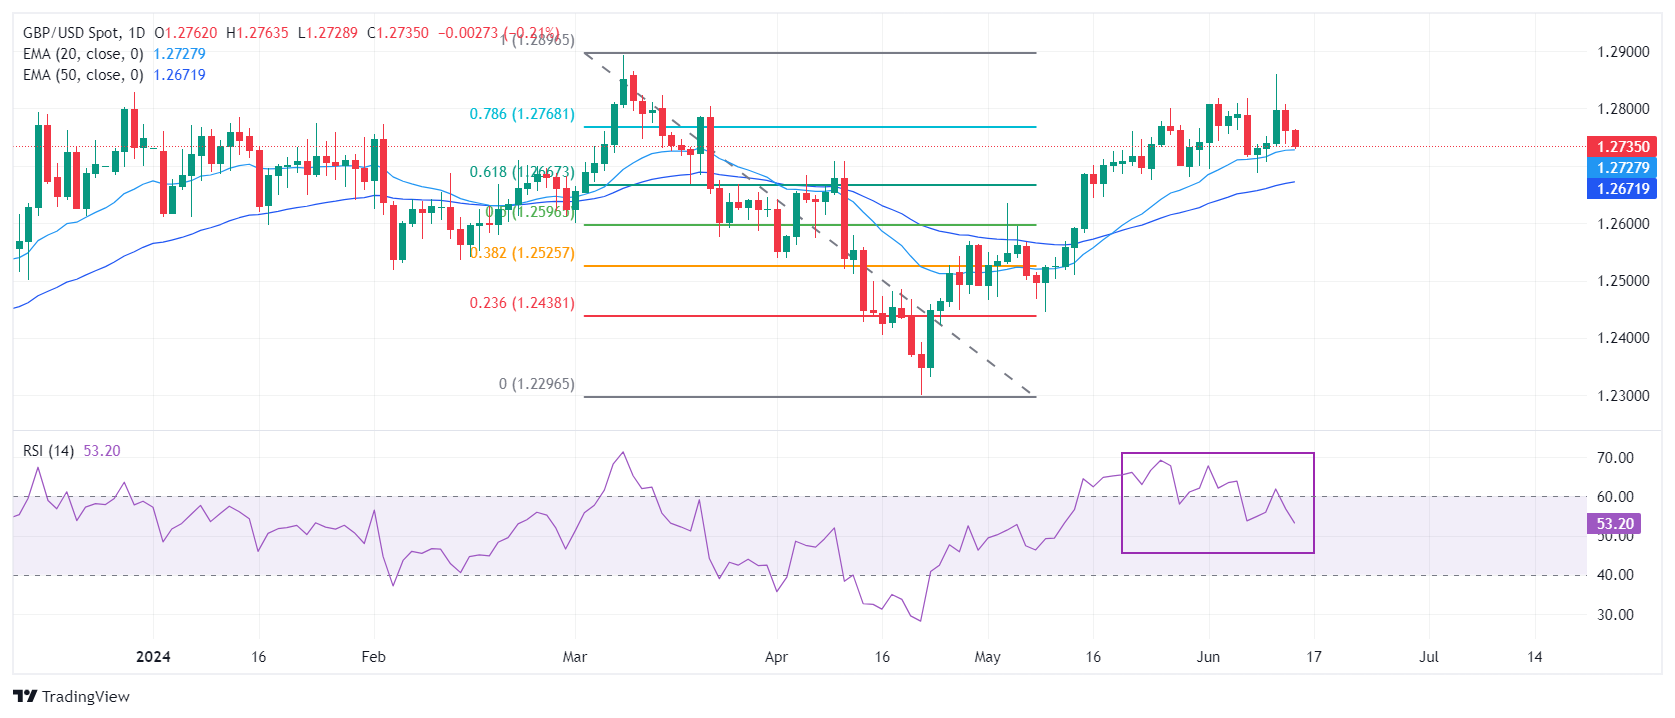
The Pound Sterling falls to a two-day low near 1.2740 against the US Dollar. The GBP/USD pair faces selling pressure while attempting to establish above the 78.6% Fibonacci retracement support (plotted from the March 8 high of 1.2900 to the April 22 low at 1.2300) at 1.2770.
The Cable has declined to near the 20-day Exponential Moving Average (EMA), which trades around 1.2730. Meanwhile, the upward-sloping 50-day EMA near 1.2670 suggests that the near-term trend is still upbeat.
The 14-period Relative Strength Index (RSI) falls back into the 40.00-60.00 range, indicating that the upside momentum has faded.
Pound Sterling FAQs
The Pound Sterling (GBP) is the oldest currency in the world (886 AD) and the official currency of the United Kingdom. It is the fourth most traded unit for foreign exchange (FX) in the world, accounting for 12% of all transactions, averaging $630 billion a day, according to 2022 data. Its key trading pairs are GBP/USD, aka ‘Cable’, which accounts for 11% of FX, GBP/JPY, or the ‘Dragon’ as it is known by traders (3%), and EUR/GBP (2%). The Pound Sterling is issued by the Bank of England (BoE).
The single most important factor influencing the value of the Pound Sterling is monetary policy decided by the Bank of England. The BoE bases its decisions on whether it has achieved its primary goal of “price stability” – a steady inflation rate of around 2%. Its primary tool for achieving this is the adjustment of interest rates. When inflation is too high, the BoE will try to rein it in by raising interest rates, making it more expensive for people and businesses to access credit. This is generally positive for GBP, as higher interest rates make the UK a more attractive place for global investors to park their money. When inflation falls too low it is a sign economic growth is slowing. In this scenario, the BoE will consider lowering interest rates to cheapen credit so businesses will borrow more to invest in growth-generating projects.
Data releases gauge the health of the economy and can impact the value of the Pound Sterling. Indicators such as GDP, Manufacturing and Services PMIs, and employment can all influence the direction of the GBP. A strong economy is good for Sterling. Not only does it attract more foreign investment but it may encourage the BoE to put up interest rates, which will directly strengthen GBP. Otherwise, if economic data is weak, the Pound Sterling is likely to fall.
Another significant data release for the Pound Sterling is the Trade Balance. This indicator measures the difference between what a country earns from its exports and what it spends on imports over a given period. If a country produces highly sought-after exports, its currency will benefit purely from the extra demand created from foreign buyers seeking to purchase these goods. Therefore, a positive net Trade Balance strengthens a currency and vice versa for a negative balance.
Gold prices rose in India on Friday, according to data compiled by FXStreet.
The price for Gold stood at 6,210.30 Indian Rupees (INR) per gram, up compared with the INR 6,188.94 it cost on Thursday.
The price for Gold increased to INR 72,433.20 per tola from INR 72,186.63 per tola a day earlier.
| Unit measure | Gold Price in INR |
|---|---|
| 1 Gram | 6,210.30 |
| 10 Grams | 62,102.18 |
| Tola | 72,433.20 |
| Troy Ounce | 193,172.00 |
FXStreet calculates Gold prices in India by adapting international prices (USD/INR) to the local currency and measurement units. Prices are updated daily based on the market rates taken at the time of publication. Prices are just for reference and local rates could diverge slightly.-
Global Market Movers: Comex Gold price lacks firm intraday direction
- The Federal Reserve projected only one rate cut in 2024 as compared to three cuts estimated at the March meeting, which is seen underpinning the US Dollar and acting as a headwind for the non-yielding Gold price.
- This week’s softer inflation figures, however, suggest that the Fed could lower borrowing costs earlier than expected, with the CME Group’s FedWatch Tool indicating a greater chance of the first rate cut in September.
- The data published by the US Bureau of Labor Statistics on Thursday showed that the Producer Price Index (PPI) for final demand rose by 2.2% on a yearly basis in May, lower than the 2.3% previous and 2.5% expected.
- Adding to this, the annual core PPI rose 2.3% during the reported month, below April's increase and the market expectation of 2.4%. On a monthly basis, the PPI declined 0.2%, while the core PPI remained unchanged.
- This comes on top of Wednesday's softer CPI report, which showed that consumer prices were unchanged in May for the first time since last June and the yearly rate edged down to 3.3% from the 3.4% recorded in April.
- Separately, the US Department of Labor (DoL) reported that the number of Americans who filed for unemployment insurance for the first time increased more than anticipated, to 242K last week from the 229K previous.
- Meanwhile, a snap election call in France sparked wider political concerns and should limit losses for the safe-haven XAU/USD against the backdrop of Russia’s ongoing war in Ukraine and conflict in the Middle East.
- Investors now look to the Preliminary release of the Michigan US Consumer Sentiment Index, which could influence the USD price dynamics and produce short-term trading opportunities on the last day of the week.
Gold FAQs
Gold has played a key role in human’s history as it has been widely used as a store of value and medium of exchange. Currently, apart from its shine and usage for jewelry, the precious metal is widely seen as a safe-haven asset, meaning that it is considered a good investment during turbulent times. Gold is also widely seen as a hedge against inflation and against depreciating currencies as it doesn’t rely on any specific issuer or government.
Central banks are the biggest Gold holders. In their aim to support their currencies in turbulent times, central banks tend to diversify their reserves and buy Gold to improve the perceived strength of the economy and the currency. High Gold reserves can be a source of trust for a country’s solvency. Central banks added 1,136 tonnes of Gold worth around $70 billion to their reserves in 2022, according to data from the World Gold Council. This is the highest yearly purchase since records began. Central banks from emerging economies such as China, India and Turkey are quickly increasing their Gold reserves.
Gold has an inverse correlation with the US Dollar and US Treasuries, which are both major reserve and safe-haven assets. When the Dollar depreciates, Gold tends to rise, enabling investors and central banks to diversify their assets in turbulent times. Gold is also inversely correlated with risk assets. A rally in the stock market tends to weaken Gold price, while sell-offs in riskier markets tend to favor the precious metal.
The price can move due to a wide range of factors. Geopolitical instability or fears of a deep recession can quickly make Gold price escalate due to its safe-haven status. As a yield-less asset, Gold tends to rise with lower interest rates, while higher cost of money usually weighs down on the yellow metal. Still, most moves depend on how the US Dollar (USD) behaves as the asset is priced in dollars (XAU/USD). A strong Dollar tends to keep the price of Gold controlled, whereas a weaker Dollar is likely to push Gold prices up.
(An automation tool was used in creating this post.)
- Silver price recovers to $29.05 in Friday’s early European session.
- The lower bets on the Fed rate cut weigh on the white metal.
- The US Producer Price Index (PPI) rose 2.2% YoY in May, compared to the 2.3% increase in April, below expectations.
The Silver price (XAG/USD) trades in positive territory near $29.05 on Friday during the early European session. The white metal finds some support and bounces off monthly lows around $28.65 despite the extended gains in US Dollar (USD). The upside for XAG/USD is likely to be limited amid the growing speculation that the US Federal Reserve (Fed) might cut its key interest rate just once by year-end.
The markets are now raising their bet that the Fed could begin its easing cycle as soon as September amid signs of cooling inflationary pressures in the United States. The projections that the US Fed will cut rates only once by 25 basis points (bps) this year instead of the two that the consensus previously thought boost the US Dollar (USD) across the board and exert some selling pressure on non-yielding assets like Silver as it makes the white metal more expensive for overseas buyers.
On Thursday, the US Producer Price Index (PPI) was below the forecast, rising 2.2% YoY in May, compared to the 2.3% increase in April. The core PPI figure rose 2.3% YoY in May, below the consensus and April’s reading of 2.4%, the US Bureau of Labor Statistics revealed on Thursday. Furthermore, the number of Americans filing new claims for unemployment benefits last week rose by 242K, above the market consensus of 225K and the previous week's reading of 229K.
Technically, the immediate resistance level for Silver will emerge at the $30.0 psychological mark en route to $31.55, a high of June 7. The initial support level is seen at the $29.00 round mark, followed by $28.40.
Addressing the post-policy meeting press conference on Friday, Bank of Japan (BoJ) Governor Kazuo Ueda said that the Bank “decided to reduce JGB purchases to ensure long-term yields are formed more freely in markets.”
The BoJ kept the interest rate steady at 0% for the second meeting in a row in June.
Additional quotes
Important to reduce JGB purchases in a foreseeable manner, while ensuring flexibility to be mindful of stability in bond market.
Japan's economic, price uncertainties remain high.
Must pay due attention to financial, FX markets, impact on Japan's economy, prices.
Reduction of JGB purchases will be considerable volume.
Specific amount, framework of JGB purchase reduction will be decided while listening to market participants' input.
Will start reduction of JGB purchase immediately after deciding at next policy meeting.
Monetary easing from JGB buying's stock effect will continue to work while we reduce bond holdings.
Conceivable to adjust rates earlier if price outlook is revised up or if upside risks heighten.
Every day we are checking FX moves, sustainability of the moves, impact on domestic prices, wages.
Will adjust rates if underlying inflation rises toward 2%, but cannot comment now when that will become evident.
Don't think we can reach the state of JGB holdings that is desirable in long-term in a year.
Currency swings have larger impact on prices now.
Don't think balance sheet would be in favourable shape in 1-2 years.
Want to show guidance for JGB tapering for 1-2 years to increase visibility.
Decided to put off detailed plan of JGB tapering until next meeting to have considered discussion with markets.
Difficult to say how long bond tapering would last after 1-2 year period.
We will set short-term interest rate at July meeting also considering JGB purchase reduction.
Believe impact of recent auto shipment halt is smaller than earlier halt.
Keep view that Japan's consumption turns stronger as wages gradually rise, inflation subsides.
Govt's JGB issuance plan would follow and take into account boj's bond tapering plan.
We announced JGB purchase reduction today to avoid uncertainties until July meeting as much as possible.
Market reaction
USD/JPY holds gains near six-week highs following these comments. The pair was last seen 0.70% higher on the day at 158.18.
Japanese Yen FAQs
The Japanese Yen (JPY) is one of the world’s most traded currencies. Its value is broadly determined by the performance of the Japanese economy, but more specifically by the Bank of Japan’s policy, the differential between Japanese and US bond yields, or risk sentiment among traders, among other factors.
One of the Bank of Japan’s mandates is currency control, so its moves are key for the Yen. The BoJ has directly intervened in currency markets sometimes, generally to lower the value of the Yen, although it refrains from doing it often due to political concerns of its main trading partners. The current BoJ ultra-loose monetary policy, based on massive stimulus to the economy, has caused the Yen to depreciate against its main currency peers. This process has exacerbated more recently due to an increasing policy divergence between the Bank of Japan and other main central banks, which have opted to increase interest rates sharply to fight decades-high levels of inflation.
The BoJ’s stance of sticking to ultra-loose monetary policy has led to a widening policy divergence with other central banks, particularly with the US Federal Reserve. This supports a widening of the differential between the 10-year US and Japanese bonds, which favors the US Dollar against the Japanese Yen.
The Japanese Yen is often seen as a safe-haven investment. This means that in times of market stress, investors are more likely to put their money in the Japanese currency due to its supposed reliability and stability. Turbulent times are likely to strengthen the Yen’s value against other currencies seen as more risky to invest in.
- The EUR/USD pair could test a level of 1.0700 following the throwback support level of 1.0601.
- Technical analysis of the daily chart suggests a bearish bias for the pair.
- The immediate barrier appears at the lower boundary of the rectangle formation around the 50-day EMA at 1.0802.
EUR/USD extends its losses for the second consecutive day, trading around 1.0730 during the Asian session on Friday. A technical analysis of a daily chart suggests a bearish bias for the pair, as it struggles below the lower threshold of a rectangle formation.
Additionally, the momentum indicator 14-day Relative Strength Index (RSI) is positioned below the 50 level, suggesting a confirmation of a bearish bias for the EUR/USD pair.
The EUR/USD pair could find immediate support at the psychological level of 1.0700. A break below this level could exert downward pressure on the pair to test the throwback support level of 1.0601.
On the upside, the EUR/USD pair could re-test the lower boundary of the rectangle formation around the 50-day Exponential Moving Average (EMA) at 1.0802. A return to the rectangle formation could weaken the bearish bias and reinforce the pair to explore the psychological level of 1.0900, aligned with the upper boundary of the rectangle formation around the level of 1.0905.
A breakthrough above the latter could support the pair to explore the region around March’s high of 1.0981.
EUR/USD: Daily Chart
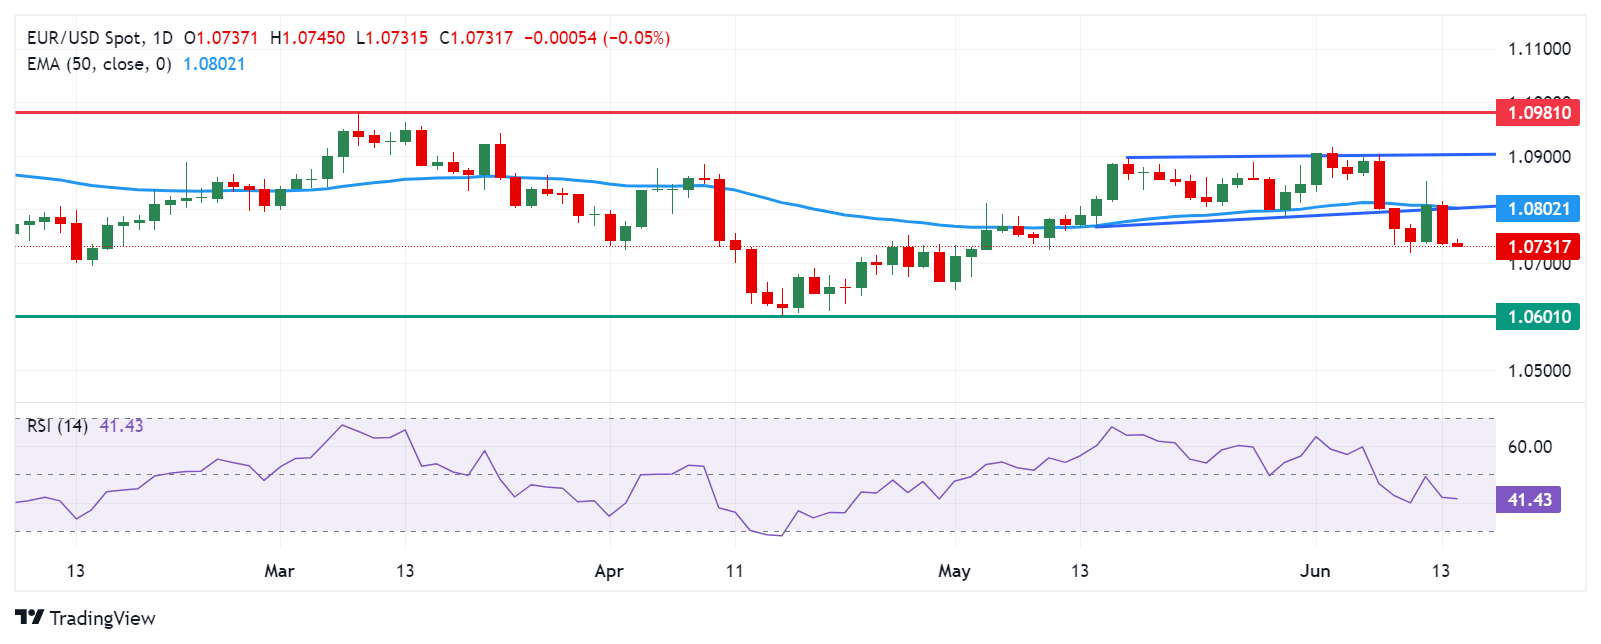
FX option expiries for June 14 NY cut at 10:00 Eastern Time, via DTCC, can be found below
- EUR/USD: EUR amounts
- 1.0660 1.8b
- 1.0700 987m
- 1.0800 1.4b
- 1.0810 1.3b
- 1.0825 728m
- 1.0900 2b
- USD/JPY: USD amounts
- 156.00 834m
- 157.25 689m
- 158.00 744m
- USD/CHF: USD amounts
- 0.9000 1.8b
- AUD/USD: AUD amounts
- 0.6600 556m
- 0.6615 488m
- 0.6620 951m
- USD/CAD: USD amounts
- 1.3750 754m
- 1.3760 1.6b
- 1.3800 705m
- 1.3815 528m
- EUR/GBP: EUR amounts
- 0.8400 1.1b
- USD/CHF rebounds near 0.8940 in Friday’s early European session.
- The US PPI figure was weaker than expected, but the hawkish Fed projection capped the pair’s downside.
- The Swiss Producer and Import Prices dropped 0.3% MoM in May from a 0.6% rise in April, below the consensus.
The USD/CHF pair snaps the two-day losing streak near 0.8940 in Friday’s early European session. The recovery of the pair is bolstered by the stronger Greenback as the hawkish Fed projection suggested only one rate cut is likely in 2024. Investors await the preliminary US Michigan Consumer Sentiment report and the Fed Bank of Chicago President Austan Goolsbee's speech on Friday for fresh impetus.
On Thursday, the US Producer Price Index (PPI) rose 2.2% YoY in May, compared to the 2.3% increase in April (revised from 2.2%), below the market expectation of 2.5%. Meanwhile, the core PPI figure climbed 2.3% YoY in May, below the estimation and previous reading of 2.4%. Despite the weaker US economic data, the hawkish stance of the US Fed provides some support to the Greenback and caps the downside for the pair.
According to the dot plot, the US Fed signaled that it will cut its key interest rate just once by 25 basis points (bps) toward the end of 2024. The new projection emerged after the US central bank decided to hold interest rates at their current 23-year high even as inflation ticked lower.
On the Swiss front, the Federal Statistical Office of Switzerland reported on Thursday that the nation’s Producer and Import Prices dropped 0.3% MoM in May from a 0.6% rise in April, worse than expectations of a 0.5% increase. Apart from this, the markets expect the Swiss National Bank (SNB) to hold interest rates in June, which is likely to lift the Swiss Franc (CHF). Additionally, the uncertainty and ongoing geopolitical tensions in the Middle East might boost safe-haven flows, benefiting the CHF for the time being.
- NZD/USD weakens for the second consecutive day near 0.6155 on Friday.
- The hawkish Fed is likely to lift the Greenback in the near term.
- New Zealand's Business NZ PMI contracted to 47.2 in May vs. 48.9 prior.
The NZD/USD pair extends downside around 0.6155 during the Asian session on Friday. The firmer Greenback and weaker New Zealand PMI data exert some selling pressure on the pair. The preliminary US Michigan Consumer Sentiment report is due later on Friday. Also, the Fed Bank of Chicago President Austan Goolsbee is scheduled to speak.
The US Fed signaled that it will cut its key interest rate just once by 25 basis points (bps) toward the year-end, boosting the US Dollar (USD). Fed Chair Jerome Powell noted that the central bank would need "good inflation readings" before lowering borrowing costs, per the BBC.
About the US data, the US Producer Price Index (PPI) climbed 2.2% YoY in May, compared to the 2.3% rise in April, below the forecast of 2.5%. The core PPI figure rose 2.3% YoY in May, below the consensus and the previous reading of 2.4%, the US Bureau of Labor Statistics revealed on Thursday. Meanwhile, the number of Americans filing new claims for unemployment benefits for the week ending June 6 increased by 242K, the highest in ten months. This figure came above the market consensus of 225K and the previous week's reading of 229K.
On the Kiwi front, New Zealand manufacturing has remained in contraction for 15 consecutive months, which undermines the New Zealand Dollar (NZD). Early Friday, Business NZ showed that the nation’s Performance of Manufacturing Index (PMI) contracted to 47.2 in May from the previous reading of 48.9. ANZ analysts expect the weaker economic data would suggest the Reserve Bank of New Zealand (RBNZ) to cut the Official Cash Rate (OCR) sooner than previously signaled, with expectations for rate cuts starting in February 2025.
- WTI Oil price retraces its recent losses due to optimistic forecasts regarding crude demand for the remainder of 2024.
- Russia surpassed its Oil production quota, which was agreed upon by the OPEC+ in May.
- The higher US Dollar makes crude Oil expensive for buyers with other currencies and dampens its demand.
West Texas Intermediate (WTI) Oil price inches higher to near $77.80 per barrel during the Asian session on Friday. This rise in crude Oil prices is largely attributed to optimistic forecasts regarding crude demand for the remainder of the year.
Reuters reported earlier in the week, the EIA increased its 2024 world Oil demand growth forecast to 1.10 million barrels per day (bpd) from the previous estimate of 900,000 bpd. Additionally, the Organization of the Petroleum Exporting Countries (OPEC) maintained its 2024 forecast for robust growth in global Oil demand, citing expectations for increased travel and tourism in the second half of the year.
Russia's energy ministry announced on Thursday that its Oil production in May surpassed the quotas agreed upon by the OPEC+ alliance. The ministry acknowledged this overproduction in a statement and stated that corrective measures would be implemented in June to achieve the targeted production levels, as per Reuters.
The Federal Open Market Committee (FOMC) kept its benchmark lending rate within the range of 5.25%–5.50% for the seventh consecutive time during its June meeting on Wednesday, as widely anticipated. Higher interest rates could hinder economic growth, which in turn negatively impacts Oil demand.
The US Dollar Index (DXY), which measures the value of the US Dollar (USD) against six major currencies, edges higher to near 105.30 with 2-year and 10-year yields on US Treasury bonds standing at 4.71% and 4.26%, respectively, at the time of writing. The higher US Dollar makes Oil expensive for buyers with other currencies, dampening the Oil demand.
- GBP/USD remains under some selling pressure on Friday, though lacks follow-through.
- The uncertainty over the Fed’s rate-cut path should cap the USD and offer support.
- The mixed technical setup further warrants caution before placing directional bets.
The GBP/USD pair trades with a negative bias for the second straight day on Friday, albeit manages to hold its neck above the previous day's swing low. Spot prices currently hover around the mid-1.2700s and seem poised to register modest weekly gains amid subdued US Dollar (USD) price action.
Against the backdrop of the Federal Reserve's (Fed) hawkish stance, the emergence of fresh selling around the Japanese Yen (JPY), triggered by the Bank of Japan's (BoJ) inaction, lends some support to the USD and weighs on the GBP/USD pair. That said, signs of easing inflationary pressures in the US keep hopes alive for a September Fed rate cut, which should cap the USD and act as a tailwind for the currency pair.
From a technical perspective, the recent repeated failures to find acceptance above the 1.2800 mark and the subsequent downfall warrant caution for the GBP/USD bulls ahead of the UK national election on July 4. Meanwhile, mixed oscillators on the daily chart further make it prudent to wait for strong follow-through selling before confirming that the recent strong rally from the YTD trough touched in April has run its course.
Hence, any further decline is likely to find decent support near the 1.2755-1.2750 horizontal zone, below which the GBP/USD pair could slide to the 1.2715-1.2710 region. The downfall could extend further towards the 1.2690-1.2685 region en route to the 100-day Simple Moving Average (SMA), currently near the 1.2640-1.2635 area. A convincing break below the latter will mark a bearish breakdown and pave the way for deeper losses.
On the flip side, bulls need to wait for sustained strength and acceptance above the 1.2800 mark before positioning for a move back towards the 1.2860 area, or over a three-month high touched on Wednesday. A sustained strength beyond should allow the GBP/USD pair to surpass the YTD peak, around the 1.2900 neighborhood, and the 1.2950 resistance, towards reclaiming the 1.3000 psychological mark for the first time since July 2023.
GBP/USD daily chart
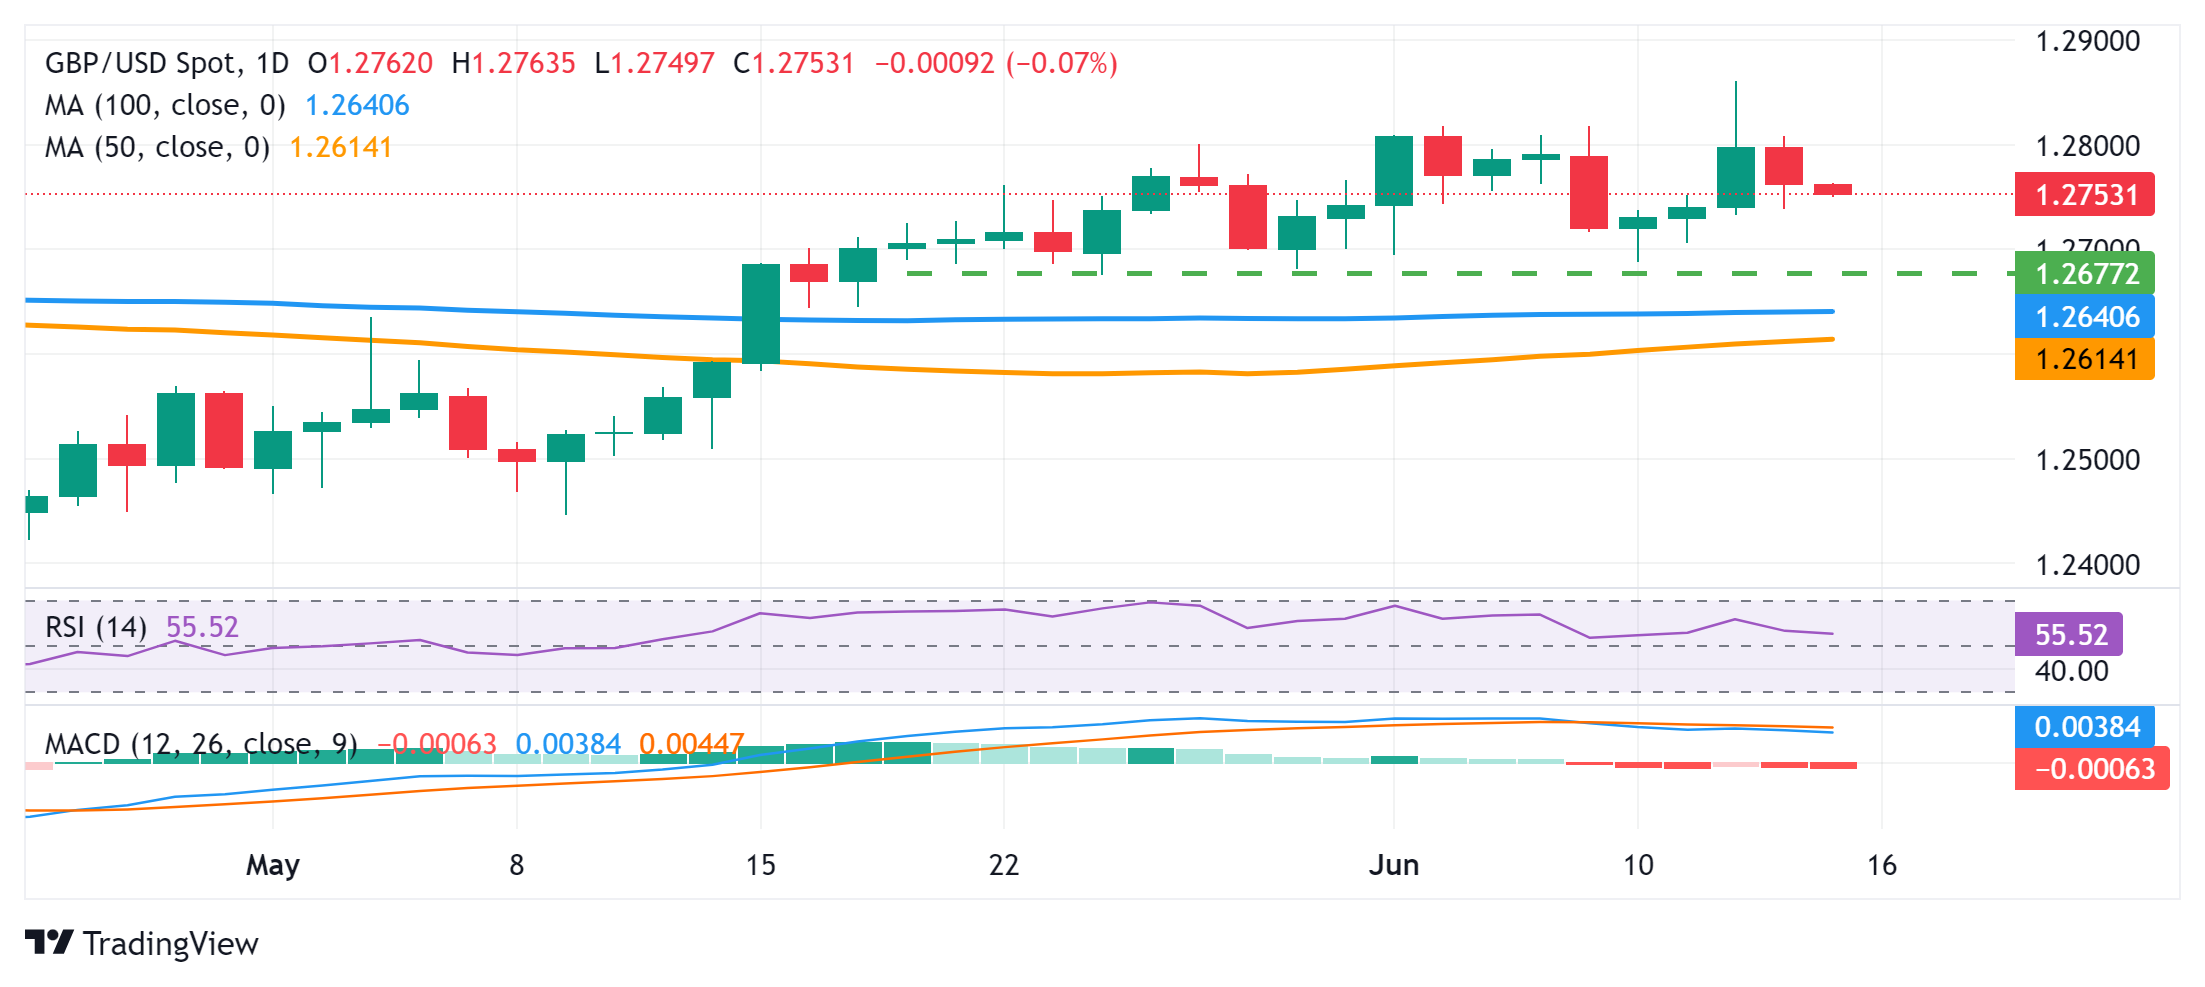
- AUD/JPY gains ground near 104.65 in Friday’s Asian session, up 0.47% on the day.
- The BoJ decided to maintain the key interest rate at 0% on Friday, as expected by the market.
- The RBA is anticipated to keep interest rates unchanged at its June meeting next week.
The AUD/JPY cross gathers strength around 104.65 during the Asian trading hours on Friday. The cross edges higher after the Bank of Japan (BoJ) announced its policy decision. Investors will shift their attention to the Reserve Bank of Australia (RBA) interest rate decision next week.
The Bank of Japan (BoJ) board members decided to keep its policy rate at 0% after concluding its two-day monetary policy review meeting for June. The Japanese central bank held rates for the second straight meeting in June, and the decision matched market expectations. The Japanese Yen (JPY) attracts some sellers after the BoJ decided not to reduce bond purchases. The BoJ policy board member Toyoaki Nakamura dissented to a decision on JGB purchases, saying the central bank should decide to reduce it after reassessing developments in economic activity and prices in the July 2024 outlook report.
On the Aussie front, the expectation that the RBA will maintain current interest rates in June provides some support to the Australian Dollar (AUD). A near 90% majority of analysts predicted interest rates to remain unchanged next quarter, followed by a 25 basis point (bps) cut to 4.10% by year-end, according to Reuters polls. "The risk of a rate hike is very low, but the RBA's response to high inflation data would be to keep current high rates for longer," said Nomura senior economist, Andrew Ticehurst.
- EUR/JPY builds on its intraday positive move after the BoJ manintains the staus quo.
- The BoJ left interest rates unchanged and also decided not to reduce bond purchases.
- Political uncertainty in Europe could undermine the Euro and cap gains for the cross.
The EUR/JPY cross attracts some dip-buying during the Asian session on Friday and reverses a part of the previous day's retracement slide from over a one-week high – levels beyond the 170.00 mark. The intraday positive move picks up pace after the Bank of Japan (BoJ) announced its policy decision, lifting spot prices to mid-169.00s, or a fresh daily peak in the last hour.
As was widely expected, the BoJ decided to leave interest rates unchanged at the conclusion of its June policy meeting and did not offer any cues about the timing of the next rate increase. Furthermore, the central bank might have disappointed some market participants anticipating an announcement regarding a potential reduction in the monthly bond purchases. This, along with a generally positive risk tone, undermines the safe-haven Japanese Yen (JPY) and provides a goodish lift to the EUR/JPY cross.
Meanwhile, a snap election call in France has sparked wider political concerns in the Eurozone. This might continue to act as a headwind for the shared currency and keep a lid on any meaningful appreciating move for the EUR/JPY cross. Hence, it will be prudent to wait for strong follow-through buying and sustained breakout through a short-term trading range held over the past two weeks or so before placing fresh bullish bets. Traders now look to comments by BoJ Governor Ueda Kazuo for a fresh impetus.
- USD/CAD oscillates in a range and is influenced by a combination of diverging forces.
- The recent strong rally in Oil prices underpins the Loonie and caps gains for the major.
- Fed rate cut expectations keep the USD bulls on the defensive and act as a headwind.
The USD/CAD pair struggles to capitalize on the previous day's positive move and seesaws between tepid gains/minor losses, below mid-1.3700s during the Asian session on Friday.
Crude Oil prices attract some dip-buying and remain on track to register strong weekly gains on the back of OPEC+ assurance to keep production low to support prices, which helped ease concerns about higher supplies. OPEC+ further clarified that any increase in production would be largely dependent on Oil prices and also maintained its annual demand growth forecast, citing improved prospects in the wake of eventual lowering in global interest rates. This, in turn, continues to lend support to the black liquid, which underpins the commodity-linked Loonie and acts as a headwind for the USD/CAD pair.
The US Dollar (USD), on the other hand, stalls its goodish rebound from the weekly low touched on Wednesday in the wake of expectations that the Federal Reserve (Fed) could start cutting interest rates as soon as September. The bets were lifted by this week's softer inflation figures, which dragged the US Treasury bond yields to their lowest level since April. This, in turn, keeps the USD bulls on the defensive and turns out to be another factor that contributes to capping gains for the USD/CAD pair.
Meanwhile, the Fed adopted a more hawkish tone at the conclusion of the June policy meeting on Wednesday and now sees only one interest rate cut in 2024. This could help limit the downside for the US bond yields and the Greenback, which is seen holding back traders from placing aggressive bearish bets around the USD/CAD pair. Traders now look to the release of the Preliminary Michigan US Consumer Sentiment Index, which, along with Oil price dynamics, should provide a fresh impetus.
- The Australian Dollar has recovered its daily losses after a Reuters poll indicated no change in the June meeting.
- 90% of economists anticipate stable rates in Q3, with a potential 25 basis-point reduction by the end of 2024.
- The US Dollar (USD) remains stable due to the hawkish stance of the Fed.
The Australian Dollar (AUD) has recovered from Friday's losses, possibly driven by improved risk appetite. This optimism stems from a Reuters poll of 43 economists, unanimously predicting that the Reserve Bank of Australia (RBA) will maintain current interest rates in June.
A significant 90% of economists anticipate stable interest rates in the next quarter, with a potential 25 basis-point reduction to 4.10% projected by the end of 2024. Furthermore, 63% of economists foresee interest rates declining to 4.10% or below by year-end, while a minority (35%) expect no change.
The US Dollar (USD) has maintained stability following gains from the previous session despite the release of economic data showing a softer US Producer Price Index (PPI) and higher-than-expected Initial Jobless Claims.
The US Dollar’s resilience is largely credited to the hawkish stance of the US Federal Reserve (Fed). At its June meeting on Wednesday, the Federal Open Market Committee (FOMC) kept its benchmark lending rate unchanged within the range of 5.25%–5.50%, marking the seventh consecutive meeting without a rate change, as widely anticipated.
Federal Open Market Committee (FOMC) policymakers have revised their outlook, now anticipating only one rate cut for the year, down from the three cuts forecasted in March. This adjustment is bolstering the US Dollar's (USD) resilience and exerting pressure on the AUD/USD pair.
Investors are awaiting the release of the preliminary US Michigan Consumer Sentiment index on Friday. This key indicator will offer additional insights into consumer confidence and the broader economic outlook.
Daily Digest Market Movers: Australian Dollar limits its downside due to hawkish RBA
- US Initial Jobless Claims for the week ending June 7 showed a significant increase, with the number of claims rising by 13,000 to 242,000. This figure surpassed market expectations, which were set at 225,000, marking the highest level of jobless claims since August 2023.
- US Producer Price Index (PPI) came in weaker than expected, increasing 2.2% YoY in May, compared to the 2.3% rise in April (revised from 2.2%). Meanwhile, the core PPI figure rose 2.3% YoY in May, below the consensus and April’s reading of 2.4%.
- Australia’s Employment Change showed on Thursday that the number of employed people increased by 39.7K in May, exceeding the expected 30.0K increase and the previous 38.5K rise. Meanwhile, the Unemployment Rate came in at 4.0%, below April’s 4.1% rate as expected.
- In a press conference post Fed decision, Fed Chair Jerome Powell noted that the restrictive stance on monetary policy is having the effect on inflation that the central bank had expected. Additionally, FOMC policymakers expect just one rate cut this year, down from three in March.
- On Tuesday, National Australia Bank (NAB) Chief Economist Alan Oster commented, “There are warning signs on the outlook for growth but at the same time reasons to be very wary about the inflation outlook, and they expect the RBA to keep rates on hold for some time yet as they navigate through these contrasting risks,” as per the official transcript.
- Last week, RBA Governor Michele Bullock indicated that the central bank is prepared to increase interest rates if the Consumer Price Index (CPI) does not return to the target range of 1%-3%, according to NCA NewsWire.
Technical Analysis: Australian Dollar moves below 0.6650
The Australian Dollar trades around 0.6630 on Friday. Analysis of the daily chart reveals a neutral bias for the AUD/USD pair as it consolidates within a rectangle formation. The 14-day Relative Strength Index (RSI) has recently crossed above the 50 level, indicating a potential bullish bias emerging.
In terms of immediate levels, the AUD/USD pair finds support around the 50-day Exponential Moving Average (EMA) at 0.6605, with further support at the lower boundary of the rectangle formation near 0.6585.
Looking upwards, the AUD/USD pair could test resistance near the upper boundary of the rectangle formation around 0.6700, followed by the high from May at 0.6714.
AUD/USD: Daily Chart
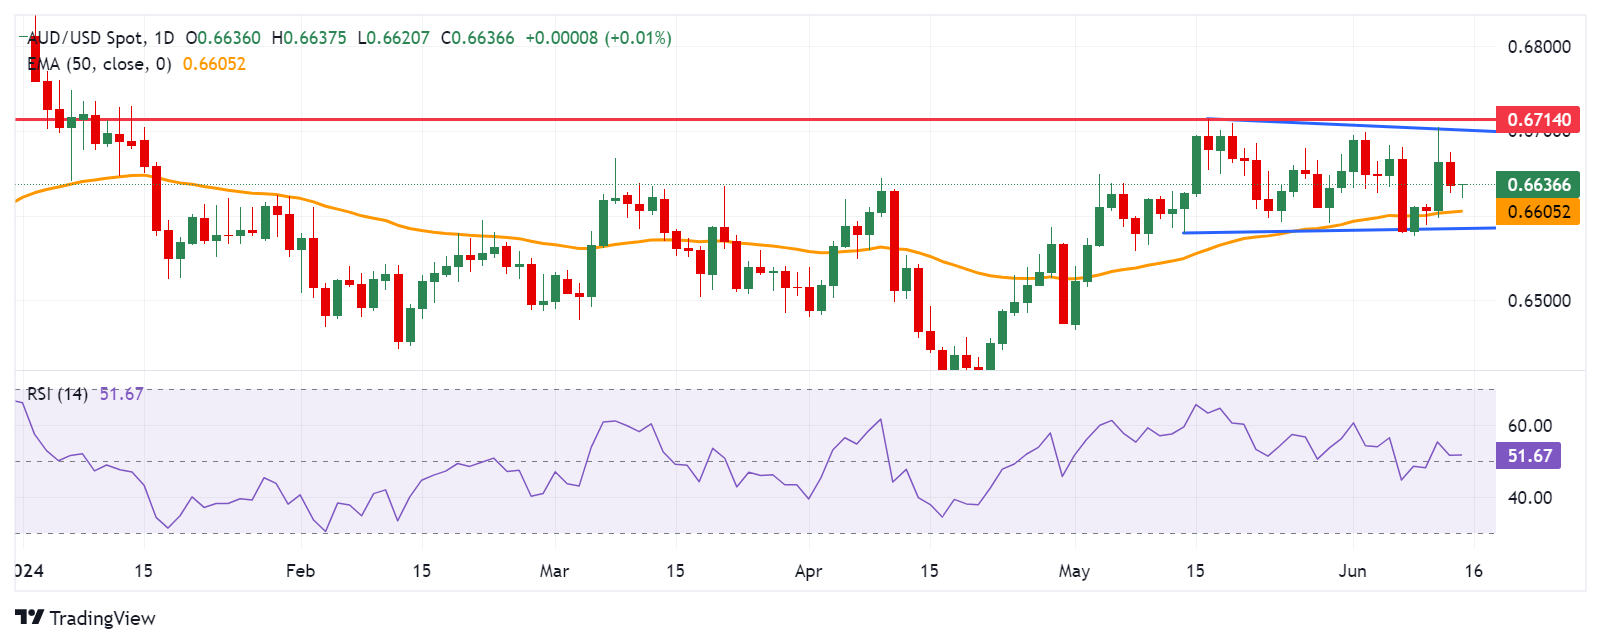
Australian Dollar price today
The table below shows the percentage change of the Australian Dollar (AUD) against listed major currencies today. The Australian Dollar was the weakest against the Canadian Dollar.
| USD | EUR | GBP | CAD | AUD | JPY | NZD | CHF | |
| USD | -0.05% | -0.05% | -0.05% | -0.06% | 0.09% | 0.04% | -0.04% | |
| EUR | 0.05% | 0.00% | -0.01% | -0.02% | 0.12% | 0.09% | 0.00% | |
| GBP | 0.05% | 0.00% | -0.01% | -0.02% | 0.13% | 0.09% | -0.01% | |
| CAD | 0.05% | 0.01% | 0.01% | -0.01% | 0.13% | 0.09% | 0.00% | |
| AUD | 0.06% | 0.02% | 0.02% | 0.01% | 0.15% | 0.11% | 0.01% | |
| JPY | -0.09% | -0.12% | -0.12% | -0.14% | -0.15% | -0.04% | -0.13% | |
| NZD | -0.02% | -0.09% | -0.09% | -0.10% | -0.11% | 0.04% | -0.10% | |
| CHF | 0.04% | 0.00% | 0.00% | -0.01% | -0.02% | 0.13% | 0.09% |
The heat map shows percentage changes of major currencies against each other. The base currency is picked from the left column, while the quote currency is picked from the top row. For example, if you pick the Euro from the left column and move along the horizontal line to the Japanese Yen, the percentage change displayed in the box will represent EUR (base)/JPY (quote).
Australian Dollar FAQs
One of the most significant factors for the Australian Dollar (AUD) is the level of interest rates set by the Reserve Bank of Australia (RBA). Because Australia is a resource-rich country another key driver is the price of its biggest export, Iron Ore. The health of the Chinese economy, its largest trading partner, is a factor, as well as inflation in Australia, its growth rate and Trade Balance. Market sentiment – whether investors are taking on more risky assets (risk-on) or seeking safe-havens (risk-off) – is also a factor, with risk-on positive for AUD.
The Reserve Bank of Australia (RBA) influences the Australian Dollar (AUD) by setting the level of interest rates that Australian banks can lend to each other. This influences the level of interest rates in the economy as a whole. The main goal of the RBA is to maintain a stable inflation rate of 2-3% by adjusting interest rates up or down. Relatively high interest rates compared to other major central banks support the AUD, and the opposite for relatively low. The RBA can also use quantitative easing and tightening to influence credit conditions, with the former AUD-negative and the latter AUD-positive.
China is Australia’s largest trading partner so the health of the Chinese economy is a major influence on the value of the Australian Dollar (AUD). When the Chinese economy is doing well it purchases more raw materials, goods and services from Australia, lifting demand for the AUD, and pushing up its value. The opposite is the case when the Chinese economy is not growing as fast as expected. Positive or negative surprises in Chinese growth data, therefore, often have a direct impact on the Australian Dollar and its pairs.
Iron Ore is Australia’s largest export, accounting for $118 billion a year according to data from 2021, with China as its primary destination. The price of Iron Ore, therefore, can be a driver of the Australian Dollar. Generally, if the price of Iron Ore rises, AUD also goes up, as aggregate demand for the currency increases. The opposite is the case if the price of Iron Ore falls. Higher Iron Ore prices also tend to result in a greater likelihood of a positive Trade Balance for Australia, which is also positive of the AUD.
The Trade Balance, which is the difference between what a country earns from its exports versus what it pays for its imports, is another factor that can influence the value of the Australian Dollar. If Australia produces highly sought after exports, then its currency will gain in value purely from the surplus demand created from foreign buyers seeking to purchase its exports versus what it spends to purchase imports. Therefore, a positive net Trade Balance strengthens the AUD, with the opposite effect if the Trade Balance is negative.
- Gold price consolidates above $2,300 and is influenced by a combination of diverging forces.
- A hawkish shift in the Fed’s interest rate projections acts as a headwind for the yellow metal.
- Signs of easing inflation keep hopes alive for a September rate cut and offer some support.
Gold price (XAU/USD) ended in the red on Thursday for the first time in four days, although it showed some resilience below the $2,300 round-figure mark and held steady above the said handle during the Asian session on Friday. Any meaningful upside, however, seems elusive on the back of the Federal Reserve's (Fed) hawkish surprise on Wednesday. In fact, policymakers, in the so-called "dot plot", indicated only one interest rate cut in 2024. This remains supportive of some follow-through US Dollar (USD) buying and should cap gains for the non-yielding yellow metal.
Apart from this, the underlying bullish sentiment across the global equity markets should act as a headwind for the safe-haven Gold price. That said, persistent geopolitical tensions in the Middle East and renewed political uncertainty in Europe keep a lid on the optimism, lending some support to the precious metal. Furthermore, market participants are still pricing in a greater chance that the Fed could implement its first rate cut as soon as September in the wake of signs of cooling inflationary pressures. This should further contribute to limiting the downside for the XAU/USD.
Daily Digest Market Movers: Gold price bulls seem non-committed amid the post-Fed USD strength
- The Federal Reserve projected only one rate cut in 2024 as compared to three cuts estimated at the March meeting, which is seen underpinning the US Dollar and acting as a headwind for the non-yielding Gold price.
- This week’s softer inflation figures, however, suggest that the Fed could lower borrowing costs earlier than expected, with the CME Group’s FedWatch Tool indicating a greater chance of the first rate cut in September.
- The data published by the US Bureau of Labor Statistics on Thursday showed that the Producer Price Index (PPI) for final demand rose by 2.2% on a yearly basis in May, lower than the 2.3% previous and 2.5% expected.
- Adding to this, the annual core PPI rose 2.3% during the reported month, below April's increase and the market expectation of 2.4%. On a monthly basis, the PPI declined 0.2%, while the core PPI remained unchanged.
- This comes on top of Wednesday's softer CPI report, which showed that consumer prices were unchanged in May for the first time since last June and the yearly rate edged down to 3.3% from the 3.4% recorded in April.
- Separately, the US Department of Labor (DoL) reported that the number of Americans who filed for unemployment insurance for the first time increased more than anticipated, to 242K last week from the 229K previous.
- Meanwhile, a snap election call in France sparked wider political concerns and should limit losses for the safe-haven XAU/USD against the backdrop of Russia’s ongoing war in Ukraine and conflict in the Middle East.
- Investors now look to the Preliminary release of the Michigan US Consumer Sentiment Index, which could influence the USD price dynamics and produce short-term trading opportunities on the last day of the week.
Technical Analysis: Gold price needs to break below $2,285 support for bears to seize near-term control
From a technical perspective, the post-FOMC rejection near the 50-day Simple Moving Average (SMA) and negative oscillators on the daily chart favor bearish traders. That said, failure to find acceptance below the $2,300 mark warrants some caution. Hence, it will be prudent to wait for some follow-through selling below the $2,285 horizontal support before positioning for any further losses. The Gold price might then accelerate the fall towards the next relevant support near the $2,254-2,253 region. The downward trajectory could extend further towards the $2,225-2,220 area en route to the $2,200 round figure.
On the flip side, any meaningful recovery is likely to confront resistance near the $2,325 area. This is followed by the 50-day SMA support-turned-resistance, currently pegged near the $2,345 region and the $2,360-2,362 supply zone. A sustained strength beyond the latter should allow the Gold price to retest last week’s swing high, around the $2,387-2,388 area, and aim to reclaim the $2,400 mark. Some follow-through will negate any near-term negative bias and allow the XAU/USD to challenge the all-time peak, around the $2,450 region touched in May.
Gold FAQs
Gold has played a key role in human’s history as it has been widely used as a store of value and medium of exchange. Currently, apart from its shine and usage for jewelry, the precious metal is widely seen as a safe-haven asset, meaning that it is considered a good investment during turbulent times. Gold is also widely seen as a hedge against inflation and against depreciating currencies as it doesn’t rely on any specific issuer or government.
Central banks are the biggest Gold holders. In their aim to support their currencies in turbulent times, central banks tend to diversify their reserves and buy Gold to improve the perceived strength of the economy and the currency. High Gold reserves can be a source of trust for a country’s solvency. Central banks added 1,136 tonnes of Gold worth around $70 billion to their reserves in 2022, according to data from the World Gold Council. This is the highest yearly purchase since records began. Central banks from emerging economies such as China, India and Turkey are quickly increasing their Gold reserves.
Gold has an inverse correlation with the US Dollar and US Treasuries, which are both major reserve and safe-haven assets. When the Dollar depreciates, Gold tends to rise, enabling investors and central banks to diversify their assets in turbulent times. Gold is also inversely correlated with risk assets. A rally in the stock market tends to weaken Gold price, while sell-offs in riskier markets tend to favor the precious metal.
The price can move due to a wide range of factors. Geopolitical instability or fears of a deep recession can quickly make Gold price escalate due to its safe-haven status. As a yield-less asset, Gold tends to rise with lower interest rates, while higher cost of money usually weighs down on the yellow metal. Still, most moves depend on how the US Dollar (USD) behaves as the asset is priced in dollars (XAU/USD). A strong Dollar tends to keep the price of Gold controlled, whereas a weaker Dollar is likely to push Gold prices up.
| Raw materials | Closed | Change, % |
|---|---|---|
| Silver | 28.942 | -2.56 |
| Gold | 2303.96 | -0.88 |
| Palladium | 887.07 | -1.75 |
- Indian Rupee trades in negative territory on Friday amid the stronger US Dollar.
- The hawkish Fed projection suggested only one rate cut is likely in 2024, weighing the INR.
- Investors await India’s May WPI Inflation data and preliminary US Michigan Consumer Sentiment report, which are due on Friday.
Indian Rupee (INR) weakens on Friday on the extended gains of US Dollar (USD). The projections that the US Federal Reserve (Fed) will cut rates only once by 25 basis points (bps) this year instead of the two that the consensus had expected weighs on the INR. Additionally, the higher crude oil prices could further cap the upside for the local currency as India is the third largest consumer of oil behind the US and China.
Nonetheless, the Reserve Bank of India’s (RBI) intervention will be crucial in stabilizing the INR and preventing it from significant depreciation. Investors will keep an eye on India’s Wholesale Price Index (WPI) Inflation data for May, which is expected to rise to 2.50% on a yearly basis from 1.26% in the previous reading. The hotter-than-expected consumer inflation might lift the Indian Rupee and cap the upside for the pair in the near term. On the US docket, the preliminary Michigan Consumer Sentiment report and the speech by the Fed Bank of Chicago President Austan Goolsbee will be released.
Daily Digest Market Movers: Indian Rupee edges lower amid the Fed’s hawkish stance
- State-run banks were spotted offering USD through the day's session, likely on behalf of the RBI, but they "were holding the level" instead of pushing the INR towards appreciation, a foreign exchange trader at a private bank said.
- The benchmark S&P BSE Sensex ended the session up 204.33 points, or 0.27%, at 76,810.90, while the NSE Nifty index closed at 23,398.90, up 75.95 points, or 0.33% from its previous close.
- The US Producer Price Index (PPI) rose 2.2% YoY in May, compared to the 2.3% increase in April (revised from 2.2%), below the market expectation of 2.5%. The core PPI figure climbed 2.3% YoY in May, below the estimation and previous reading of 2.4%.
- On a monthly basis, the US PPI declined 0.2% in May, while the core PPI remained unchanged at 0%.
- The US weekly Initial Jobless Claims for the week ending June 6 increased by 242K from the previous week's reading of 229K. This figure came in above the market consensus of 225K.
- Fed Chair Jerome Powell said that only "modest" progress had been achieved towards meeting the target and that the US central bank would need "good inflation readings" before cutting interest rates, per the BBC.
Technical analysis: USD/INR maintains its uptrend in the longer term
The Indian Rupee trades on a softer note on the day. The USD/INR pair has been making higher highs and higher lows since the start of June while holding above the key 100-day Exponential Moving Average (EMA) and descending trend channel upper boundary on the daily timeframe. This indicates that the path of least resistance is to the upside. The 14-day Relative Strength Index (RSI) remains in the bullish zone around 55.50, supporting the buyers for the time being.
If the pair continues to see bullish demand, the first upside barrier will emerge at 83.60, a high of June 11. Then, USD/INR may extend its upswing to 83.72, a high of April 17. Further north, the additional upside filter to watch is the 84.00 round mark.
The crucial support level for the pair is seen in the 83.30–83.35 zone, portraying the confluence of the 100-day EMA and descending trend channel upper boundary. A break below this level could see a drop to the 83.00 psychological level, followed by 82.78, a low of January 15.
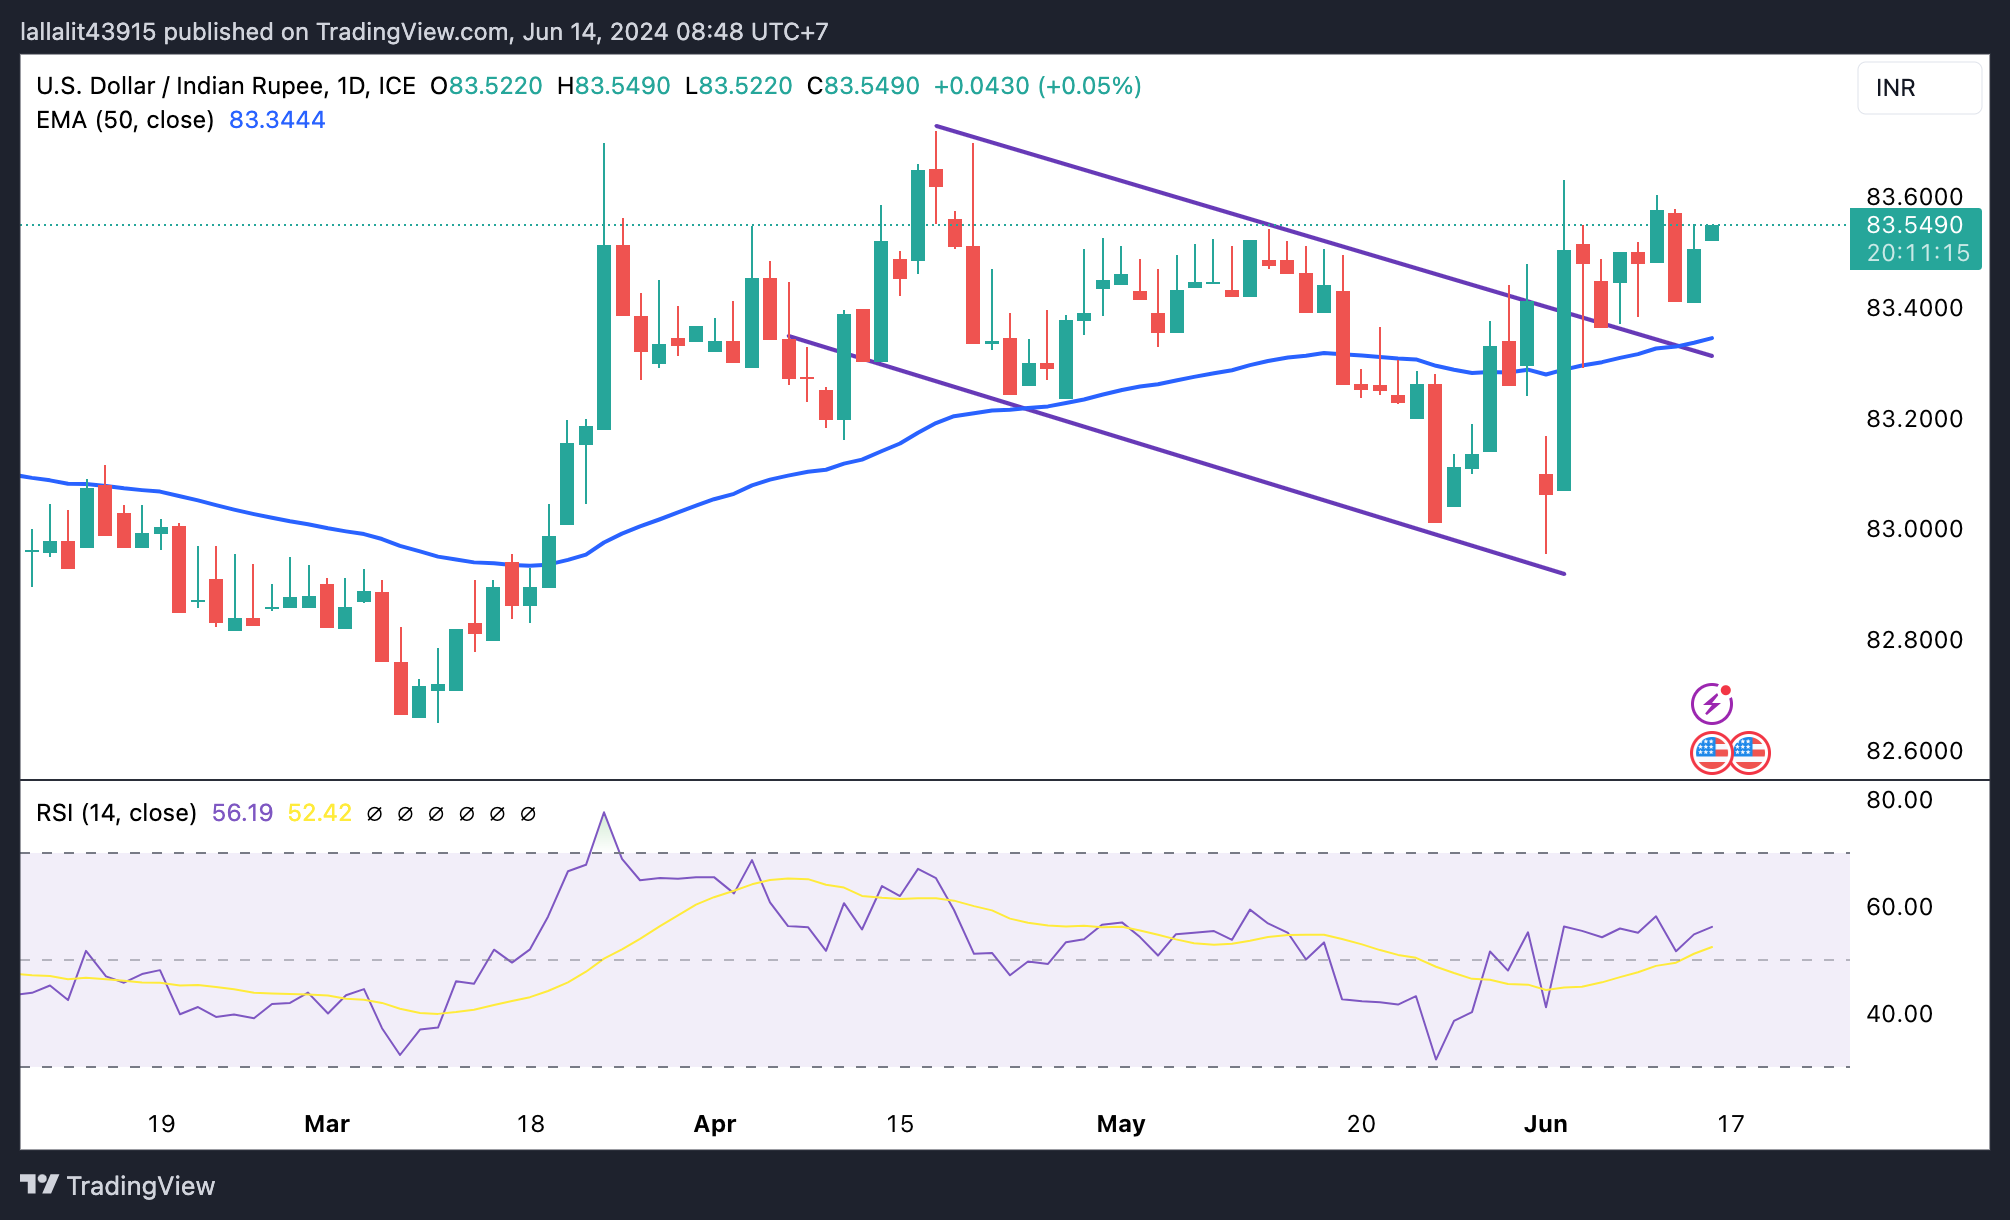
US Dollar price today
The table below shows the percentage change of US Dollar (USD) against listed major currencies today. US Dollar was the strongest against the Japanese Yen.
| USD | EUR | GBP | CAD | AUD | JPY | NZD | CHF | |
| USD | -0.04% | -0.03% | -0.04% | -0.05% | 0.09% | 0.07% | -0.03% | |
| EUR | 0.03% | 0.00% | -0.02% | -0.02% | 0.11% | 0.10% | -0.01% | |
| GBP | 0.02% | 0.00% | -0.02% | -0.02% | 0.11% | 0.10% | -0.02% | |
| CAD | 0.04% | 0.02% | 0.02% | 0.00% | 0.13% | 0.12% | 0.01% | |
| AUD | 0.04% | 0.02% | 0.04% | 0.00% | 0.13% | 0.12% | 0.01% | |
| JPY | -0.09% | -0.11% | -0.10% | -0.14% | -0.14% | -0.01% | -0.12% | |
| NZD | -0.05% | -0.10% | -0.09% | -0.12% | -0.12% | 0.01% | -0.12% | |
| CHF | 0.03% | 0.01% | 0.02% | -0.01% | 0.00% | 0.12% | 0.12% |
The heat map shows percentage changes of major currencies against each other. The base currency is picked from the left column, while the quote currency is picked from the top row. For example, if you pick the Euro from the left column and move along the horizontal line to the Japanese Yen, the percentage change displayed in the box will represent EUR (base)/JPY (quote).
Indian Rupee FAQs
The Indian Rupee (INR) is one of the most sensitive currencies to external factors. The price of Crude Oil (the country is highly dependent on imported Oil), the value of the US Dollar – most trade is conducted in USD – and the level of foreign investment, are all influential. Direct intervention by the Reserve Bank of India (RBI) in FX markets to keep the exchange rate stable, as well as the level of interest rates set by the RBI, are further major influencing factors on the Rupee.
The Reserve Bank of India (RBI) actively intervenes in forex markets to maintain a stable exchange rate, to help facilitate trade. In addition, the RBI tries to maintain the inflation rate at its 4% target by adjusting interest rates. Higher interest rates usually strengthen the Rupee. This is due to the role of the ‘carry trade’ in which investors borrow in countries with lower interest rates so as to place their money in countries’ offering relatively higher interest rates and profit from the difference.
Macroeconomic factors that influence the value of the Rupee include inflation, interest rates, the economic growth rate (GDP), the balance of trade, and inflows from foreign investment. A higher growth rate can lead to more overseas investment, pushing up demand for the Rupee. A less negative balance of trade will eventually lead to a stronger Rupee. Higher interest rates, especially real rates (interest rates less inflation) are also positive for the Rupee. A risk-on environment can lead to greater inflows of Foreign Direct and Indirect Investment (FDI and FII), which also benefit the Rupee.
Higher inflation, particularly, if it is comparatively higher than India’s peers, is generally negative for the currency as it reflects devaluation through oversupply. Inflation also increases the cost of exports, leading to more Rupees being sold to purchase foreign imports, which is Rupee-negative. At the same time, higher inflation usually leads to the Reserve Bank of India (RBI) raising interest rates and this can be positive for the Rupee, due to increased demand from international investors. The opposite effect is true of lower inflation.
- The Japanese Yen edges lower as the BoJ is widely expected to leave interest rates unchanged on Friday.
- Reuters poll indicated the BoJ to keep its benchmark interest rate steady at 0%-0.1%.
- Nikkei reported that the BoJ is contemplating a reduction in its bond holdings to a range between ¥4.8 trillion and ¥7 trillion.
The Japanese Yen (JPY) edges lower against the US Dollar (USD) as the market anticipates the Bank of Japan's (BoJ) upcoming interest rate decision on Friday. According to a Reuters poll, economists widely expect the BoJ to keep its benchmark interest rate steady at 0%-0.1%. However, traders are paying close attention to any announcements concerning changes to the central bank's bond purchasing program, which could influence market dynamics.
Reports from the Nikkei indicate that the BoJ is contemplating a reduction in its Japanese government bond holdings. Currently, the BoJ targets approximately ¥6 trillion (about $38.5 billion) in bond purchases each month. The central bank has communicated plans to buy between ¥4.8 trillion and ¥7 trillion of bonds per month.
The US Dollar Index (DXY), which measures the value of the US Dollar (USD) against six major currencies, edges higher despite the release of weaker-than-expected economic data on Thursday. The US Producer Price Index (PPI) came in softer, and Initial Jobless Claims were higher than anticipated. Nevertheless, the USD's strength can be attributed to the hawkish stance of the US Federal Reserve (Fed).
Federal Open Market Committee (FOMC) policymakers have adjusted their outlook, now projecting only one rate cut for the year, compared to the three cuts forecasted in March. This revised expectation indicates a more aggressive approach to managing inflation and maintaining economic stability, contributing to the USD's resilience.
Investors await the preliminary US Michigan Consumer Sentiment index, set to be released on Friday. This index will provide further insights into consumer confidence and economic outlook.
Daily Digest Market Movers: Japanese Yen declines as BoJ is expected to adopt a dovish stance
- Japanese Finance Minister Shunichi Suzuki said on Friday that he aims to achieve the primary balance goal. Suzuki further stated that he will keep an eye on China's excess production on the Japanese economy, per Reuters.
- US Initial Jobless Claims for the week ending June 7 showed a significant increase, with the number of claims rising by 13,000 to 242,000. This figure surpassed market expectations, which were set at 225,000, marking the highest level of jobless claims since August 2023.
- US Producer Price Index (PPI) came in weaker than expected, increasing 2.2% YoY in May, compared to the 2.3% rise in April (revised from 2.2%). Meanwhile, the core PPI figure rose 2.3% YoY in May, below the consensus and April’s reading of 2.4%.
- The Federal Open Market Committee (FOMC) left its benchmark lending rate in the range of 5.25%–5.50% for the seventh consecutive time in its policy meeting on Wednesday, as widely anticipated. In a press conference following the Fed's decision, Fed Chair Jerome Powell remarked that the restrictive stance on monetary policy is producing the expected effects on inflation.
- Japan Finance Minister Shunichi Suzuki said on Tuesday it is important to continue efforts to achieve economic growth and attain fiscal health to retain confidence in the country's fiscal policy, per Reuters.
- Nearly two-thirds of economists surveyed in a Reuters poll on Tuesday anticipate that the Bank of Japan will opt to commence tapering its monthly bond purchases at Friday's policy meeting. This decision marks a significant initial move aimed at gradually reducing the central bank's burgeoning balance sheet.
- Takeshi Minami, Chief Economist at Norinchukin Research Institute said, "There is no longer any reason to continue large-scale purchases of government bonds since it has been judged that a 2% rise in prices is within reach," per Reuters.
- According to Reuters, while speaking to parliament last week, Bank of Japan (BoJ) Governor Kazuo Ueda stated that inflation expectations are gradually rising but have yet to reach 2%. "We have been scrutinizing market developments since the March decision. As we proceed to exit our massive monetary stimulus, it's appropriate to reduce bond purchases," Ueda said.
Technical Analysis: USD/JPY moves above the key level of 157.00
USD/JPY trades around 157.20 on Friday. Analyzing the daily chart shows a bullish bias, with the pair consolidating within an ascending channel pattern. This pattern typically indicates a continuation of the upward trend, suggesting that the price is likely to keep rising as long as it remains within the channel.
The USD/JPY pair could face a key hurdle at the psychological level of 158.00. If the pair breaks above 158.00, the next target is around the upper boundary of the ascending channel near 159.20. The level of 160.32, marked in April as the highest level in over thirty years, represents a major resistance.
On the downside, the support appears at the lower boundary of the ascending channel around the 50-day Exponential Moving Average (EMA) at 155.18. A breach below this level could intensify downward pressure on the USD/JPY pair, potentially driving it toward the throwback support area around 152.80.
USD/JPY: Daily Chart
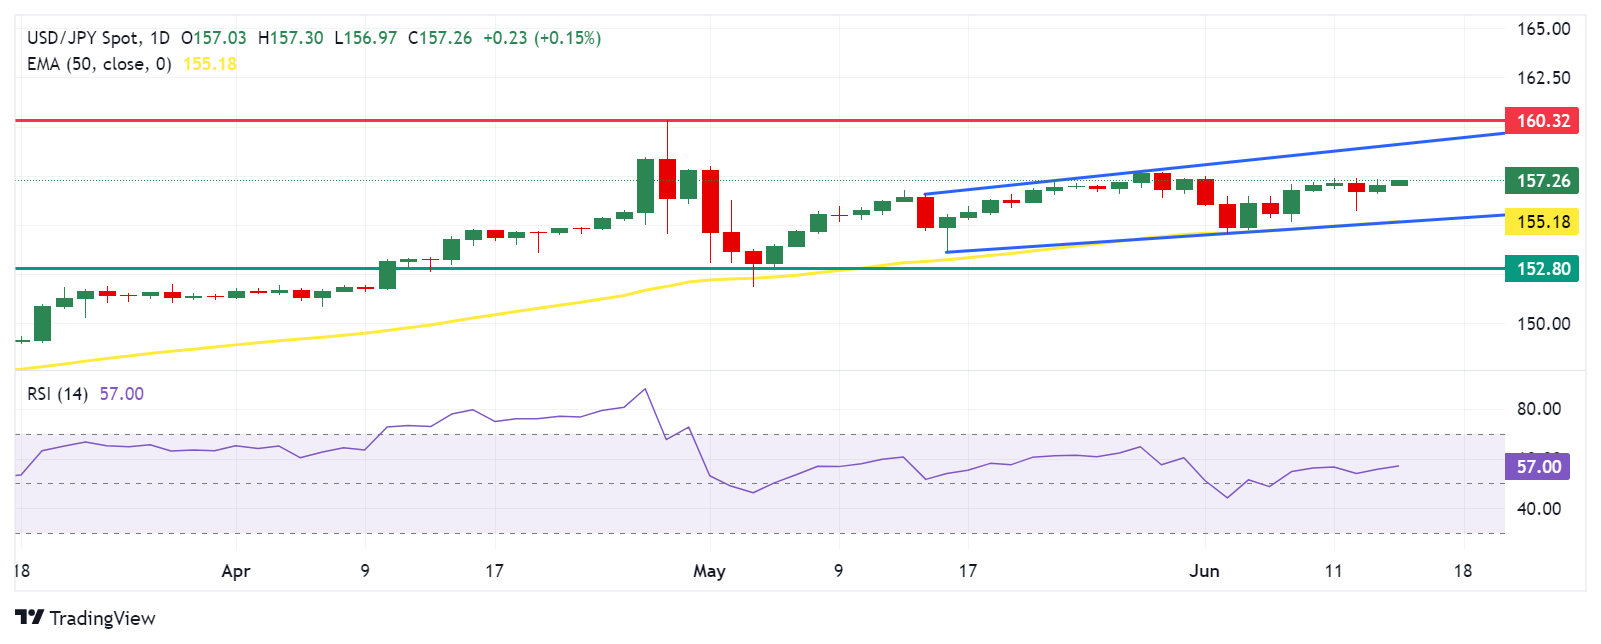
Japanese Yen price today
The table below shows the percentage change of the Japanese Yen (JPY) against listed major currencies today. Japanese Yen was the weakest against the Euro.
| USD | EUR | GBP | CAD | AUD | JPY | NZD | CHF | |
| USD | -0.02% | -0.01% | 0.02% | 0.06% | 0.09% | 0.15% | 0.00% | |
| EUR | 0.02% | 0.01% | 0.04% | 0.08% | 0.10% | 0.17% | 0.01% | |
| GBP | 0.01% | -0.01% | 0.03% | 0.07% | 0.09% | 0.16% | -0.01% | |
| CAD | -0.02% | -0.03% | -0.02% | 0.04% | 0.07% | 0.13% | -0.03% | |
| AUD | -0.07% | -0.08% | -0.07% | -0.05% | 0.03% | 0.09% | -0.07% | |
| JPY | -0.09% | -0.10% | -0.09% | -0.07% | -0.03% | 0.06% | -0.09% | |
| NZD | -0.13% | -0.17% | -0.15% | -0.13% | -0.09% | -0.06% | -0.16% | |
| CHF | 0.00% | -0.01% | 0.01% | 0.03% | 0.08% | 0.10% | 0.17% |
The heat map shows percentage changes of major currencies against each other. The base currency is picked from the left column, while the quote currency is picked from the top row. For example, if you pick the Euro from the left column and move along the horizontal line to the Japanese Yen, the percentage change displayed in the box will represent EUR (base)/JPY (quote).
Japanese Yen FAQs
The Japanese Yen (JPY) is one of the world’s most traded currencies. Its value is broadly determined by the performance of the Japanese economy, but more specifically by the Bank of Japan’s policy, the differential between Japanese and US bond yields, or risk sentiment among traders, among other factors.
One of the Bank of Japan’s mandates is currency control, so its moves are key for the Yen. The BoJ has directly intervened in currency markets sometimes, generally to lower the value of the Yen, although it refrains from doing it often due to political concerns of its main trading partners. The current BoJ ultra-loose monetary policy, based on massive stimulus to the economy, has caused the Yen to depreciate against its main currency peers. This process has exacerbated more recently due to an increasing policy divergence between the Bank of Japan and other main central banks, which have opted to increase interest rates sharply to fight decades-high levels of inflation.
The BoJ’s stance of sticking to ultra-loose monetary policy has led to a widening policy divergence with other central banks, particularly with the US Federal Reserve. This supports a widening of the differential between the 10-year US and Japanese bonds, which favors the US Dollar against the Japanese Yen.
The Japanese Yen is often seen as a safe-haven investment. This means that in times of market stress, investors are more likely to put their money in the Japanese currency due to its supposed reliability and stability. Turbulent times are likely to strengthen the Yen’s value against other currencies seen as more risky to invest in.
The People’s Bank of China (PBoC) set the USD/CNY central rate for the trading session ahead on Friday at 7.1151, as against the previous day's fix of 7.1122 and 7.2620 Reuters estimates.
Japanese Finance Minister Shunichi Suzuki said on Friday that he aims to achieve the primary balance goal. He further stated that he will keep an eye on China's excess production on the Japanese economy.
Key quotes
Aims to achieve primary balance goal.
Will monitor the impact of China's excess production on the Japanese economy.
Poised to soon officially announce new sanction package against Russia.
Does not comment on G7 talks on China overcapacity.
Warns of possible deflationary pressure due to overcapacity in China.
Market reaction
At the time of writing, USD/JPY is trading 0.12% higher on the day to trade at 157.22.
Japanese Yen FAQs
The Japanese Yen (JPY) is one of the world’s most traded currencies. Its value is broadly determined by the performance of the Japanese economy, but more specifically by the Bank of Japan’s policy, the differential between Japanese and US bond yields, or risk sentiment among traders, among other factors.
One of the Bank of Japan’s mandates is currency control, so its moves are key for the Yen. The BoJ has directly intervened in currency markets sometimes, generally to lower the value of the Yen, although it refrains from doing it often due to political concerns of its main trading partners. The current BoJ ultra-loose monetary policy, based on massive stimulus to the economy, has caused the Yen to depreciate against its main currency peers. This process has exacerbated more recently due to an increasing policy divergence between the Bank of Japan and other main central banks, which have opted to increase interest rates sharply to fight decades-high levels of inflation.
The BoJ’s stance of sticking to ultra-loose monetary policy has led to a widening policy divergence with other central banks, particularly with the US Federal Reserve. This supports a widening of the differential between the 10-year US and Japanese bonds, which favors the US Dollar against the Japanese Yen.
The Japanese Yen is often seen as a safe-haven investment. This means that in times of market stress, investors are more likely to put their money in the Japanese currency due to its supposed reliability and stability. Turbulent times are likely to strengthen the Yen’s value against other currencies seen as more risky to invest in.
| Index | Change, points | Closed | Change, % |
|---|---|---|---|
| NIKKEI 225 | -156.24 | 38720.47 | -0.4 |
| Hang Seng | 174.79 | 18112.63 | 0.97 |
| KOSPI | 26.72 | 2754.89 | 0.98 |
| ASX 200 | 34.2 | 7749.7 | 0.44 |
| DAX | -365.18 | 18265.68 | -1.96 |
| CAC 40 | -156.68 | 7708.02 | -1.99 |
| Dow Jones | -65.11 | 38647.1 | -0.17 |
| S&P 500 | 12.71 | 5433.74 | 0.23 |
| NASDAQ Composite | 59.12 | 17667.56 | 0.34 |
- EUR/USD trades flat near 1.0735 amid the firmer US Dollar in Friday’s early Asian session.
- The political uncertainty in Europe and the ECB’s rate cuts weigh on the Euro.
- The US Fed signaled that it will cut its key interest rate just once by 25 bps this year.
The EUR/USD pair trades on a flat note around 1.0735 on Friday during the early Asian trading hours. The upside of the pair might be limited amid the uncertainty surrounding European parliamentary elections. Investors will take more cues from the ECB’s Christine Lagarde speech and the preliminary US Michigan Consumer Sentiment report for June.
The European Parliament election revealed fault lines in several member states. In France, after a defeat by the far-right National Rally, President Emmanuel Macron has dissolved parliament and has called a snap election, risking a far-right rise in the country's parliament, according to the European Council on foreign relations website.
The combination of political uncertainty in Europe and rate cuts from the European Central Bank (ECB) might exert some selling pressure on the Euro (EUR) against the Greenback for the time being. The ECB cut interest rates by 25 basis points (bps) during its June meeting last week, a move widely expected by market participants. It takes the ECB’s key rate to 3.75% from a record 4% since September 2023. Financial markets have fully priced one further reduction this year, but economists polled by Reuters last week forecast two more cuts taking place towards the end of 2024.
Across the pond, the US Producer Price Index (PPI) came in weaker than expected, increasing 2.2% YoY in May, compared to the 2.3% rise in April (revised from 2.2%), the US Bureau of Labor Statistics reported on Thursday. Meanwhile, the core PPI figure rose 2.3% YoY in May, below the consensus and April’s reading of 2.4%. The US Initial Jobless Claims for the week ending June 6 increased by 242K from the previous week's reading of 229K, above the market consensus of 225K.
Nonetheless, the weaker US economic data failed to drag the Greenback lower against its rivals as the Federal Reserve (Fed) signaled that it will cut its key interest rate just once by 25 basis points (bps) toward the end of 2024. Fed Chair Jerome Powell said that only "modest" progress had been achieved towards meeting the target and that the US central bank would need "good inflation readings" before cutting interest rates, per BBC.
| Pare | Closed | Change, % |
|---|---|---|
| AUDUSD | 0.66339 | -0.43 |
| EURJPY | 168.569 | -0.45 |
| EURUSD | 1.07381 | -0.68 |
| GBPJPY | 200.281 | -0.09 |
| GBPUSD | 1.27608 | -0.29 |
| NZDUSD | 0.61683 | -0.29 |
| USDCAD | 1.37379 | 0.12 |
| USDCHF | 0.89356 | -0.05 |
| USDJPY | 156.977 | 0.23 |


© 2000-2026. Sva prava zaštićena.
Sajt je vlasništvo kompanije Teletrade D.J. LLC 2351 LLC 2022 (Euro House, Richmond Hill Road, Kingstown, VC0100, St. Vincent and the Grenadines).
Svi podaci koji se nalaze na sajtu ne predstavljaju osnovu za donošenje investicionih odluka, već su informativnog karaktera.
The company does not serve or provide services to customers who are residents of the US, Canada, Iran, The Democratic People's Republic of Korea, Yemen and FATF blacklisted countries.
Izvršenje trgovinskih operacija sa finansijskim instrumentima upotrebom marginalne trgovine pruža velike mogućnosti i omogućava investitorima ostvarivanje visokih prihoda. Međutim, takav vid trgovine povezan je sa potencijalno visokim nivoom rizika od gubitka sredstava. Проведение торговых операций на финанcовых рынках c маржинальными финанcовыми инcтрументами открывает широкие возможноcти, и позволяет инвеcторам, готовым пойти на риcк, получать выcокую прибыль, но при этом неcет в cебе потенциально выcокий уровень риcка получения убытков. Iz tog razloga je pre započinjanja trgovine potrebno odlučiti o izboru odgovarajuće investicione strategije, uzimajući u obzir raspoložive resurse.
Upotreba informacija: U slučaju potpunog ili delimičnog preuzimanja i daljeg korišćenja materijala koji se nalazi na sajtu, potrebno je navesti link odgovarajuće stranice na sajtu kompanije TeleTrade-a kao izvora informacija. Upotreba materijala na internetu mora biti praćena hiper linkom do web stranice teletrade.org. Automatski uvoz materijala i informacija sa stranice je zabranjen.
Ako imate bilo kakvih pitanja, obratite nam se pr@teletrade.global.
транcфери