- Analiza
- Novosti i instrumenti
- Vesti sa tržišta
Forex-novosti i prognoze od 13-08-2024
- The New Zealand Dollar (NZD) extends upside in Wednesday’s early Asian session.
- Improved risk sentiment and softer US Dollar support the NZD/USD pair.
- Market participants await the RBNZ interest rate decision, with no change in rate expected.
The New Zealand Dollar (NZD) extends the rally on the weaker Greenback on Wednesday. Further optimism in the risk sentiment has maintained the US Dollar (USD) under pressure in the previous sessions and created a tailwind for the pair. The signs of stronger demand from China also underpin the Kiwi as China is New Zealand's largest trading partner.
Nonetheless, escalating geopolitical tensions in the Middle East might limit the upside for the NZD. All eyes will be on the Reserve Bank of New Zealand (RBNZ) interest rate decision on Wednesday at 02:00 GMT. The New Zealand central bank will likely hold its Official Cash Rate (OCR) at 5.50% at its August meeting. The policy decision appears to be a “close call” between a hold and a cut, as inflation expectations fall. Traders will take more cues from the Press conference, and dovish comments from RBNZ Governor Adrian Orr could weigh on the Kiwi. Later in the day, the US July Consumer Price Index (CPI) will be in the spotlight.
Daily Digest Market Movers: New Zealand Dollar strengthens ahead of RBNZ rate decision
- Swap markets imply a nearly 70% chance of the RBNZ lowering the cash rate by 25 basis points (bps) to 5.25%. Markets are pricing in 90 bps of easing this year and another 148 basis points in 2025.
- The US Producer Price Index (PPI) for final demand in the US rose 2.2% YoY in July from 2.7% in June, the Bureau of Labor Statistics showed Tuesday. This figure was below the market expectation of 2.3%. On a monthly basis, the PPI increased 0.1% MoM in the same period after rising by an unrevised 0.2% in June.
- The annual core PPI came in softer than expected, rising by 2.4% in July but falling short of an estimate of 2.7%. On a monthly basis, the core PPI remained unchanged.
- Investors expect a 25 basis point (bps) rate cut in September, followed by similar reductions in November and December. A 50 bps cut in September is possible but depends entirely on the data.
- Atlanta Fed President Raphael Bostic said on Tuesday that recent economic data made him "more confident" that the Fed can get inflation back to its 2% target. Still, more evidence is needed before he's ready to support lowering interest rates, per Reuters.
Technical Analysis: New Zealand Dollar resumes bullish bias
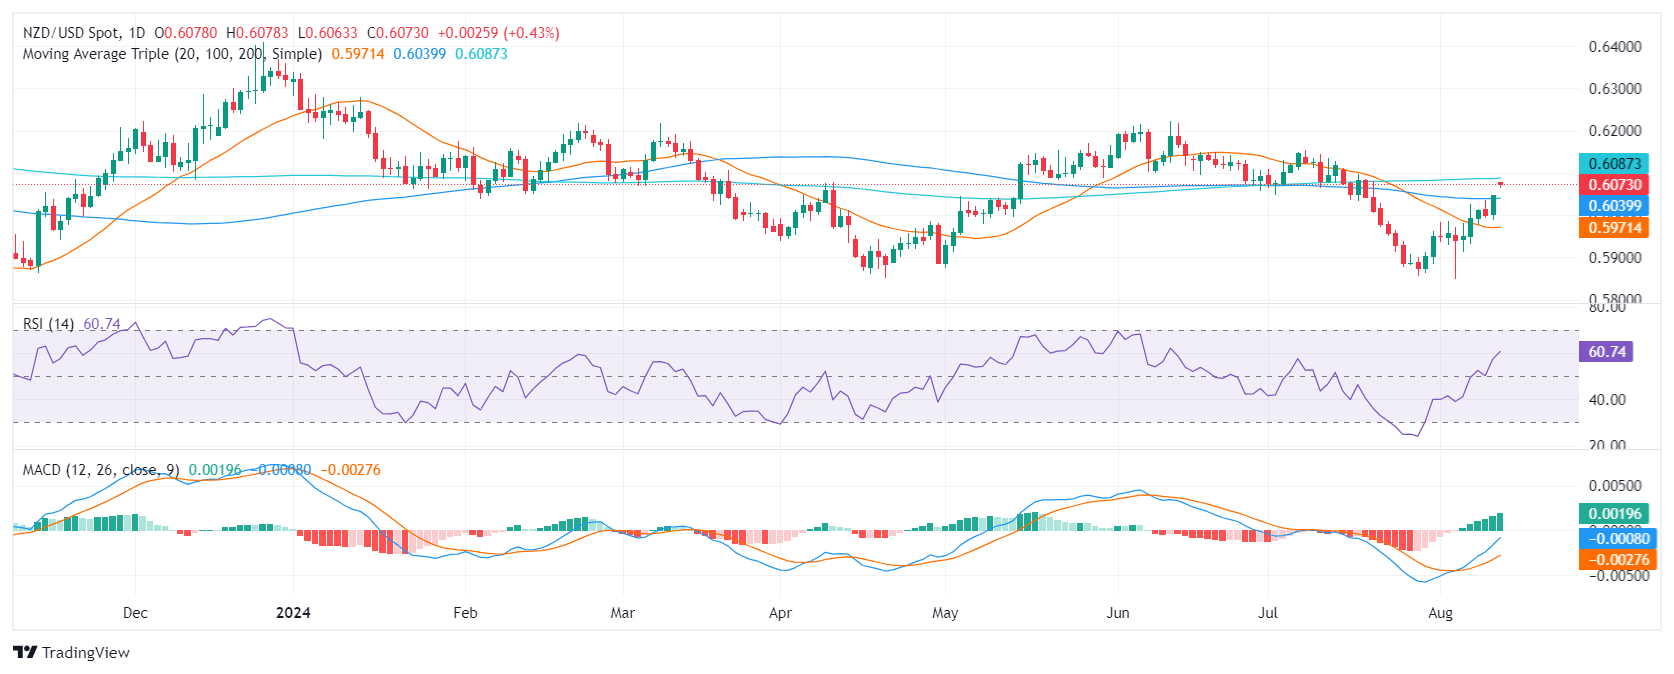
The New Zealand Dollar trades on a firmer note on the day. However, the NZD/USD pair has resumed its uptrend since the price crossed above the key 100-day Exponential Moving Average (EMA) and broke above the descending trendline on the daily chart. The 14-day Relative Strength Index (RSI) is above the midline near 61.00, suggesting that upside momentum is present and the support level is likely to hold rather than break.
The immediate resistance level for NZD/USD emerges at the 0.6090-0.6100 region, portraying the upper boundary of the Bollinger Band and psychological mark. A decisive break above this level could potentially take the price to 0.6154, a high of July 8.
On the other hand, the resistance-turned-support level at 0.6050 acts as an initial support level for the pair. Any follow-through selling below the mentioned level would expose 0.5977, a low of August 8.
US Dollar price today
The table below shows the percentage change of US Dollar (USD) against listed major currencies today. US Dollar was the weakest against the Pound Sterling.
| USD | EUR | GBP | CAD | AUD | JPY | NZD | CHF | |
| USD | 0.02% | 0.00% | 0.01% | 0.00% | -0.04% | 0.00% | 0.02% | |
| EUR | -0.01% | -0.01% | 0.01% | 0.00% | 0.03% | -0.01% | 0.00% | |
| GBP | 0.00% | 0.02% | 0.00% | 0.02% | 0.05% | 0.01% | 0.01% | |
| CAD | -0.01% | 0.00% | -0.01% | 0.02% | 0.00% | -0.02% | 0.00% | |
| AUD | 0.00% | 0.00% | 0.01% | 0.00% | 0.05% | -0.01% | -0.02% | |
| JPY | -0.05% | 0.00% | -0.03% | -0.04% | -0.03% | 0.00% | -0.01% | |
| NZD | -0.03% | 0.00% | 0.02% | -0.05% | -0.01% | 0.00% | -0.03% | |
| CHF | -0.01% | 0.01% | 0.00% | 0.01% | 0.00% | 0.00% | 0.00% |
The heat map shows percentage changes of major currencies against each other. The base currency is picked from the left column, while the quote currency is picked from the top row. For example, if you pick the Euro from the left column and move along the horizontal line to the Japanese Yen, the percentage change displayed in the box will represent EUR (base)/JPY (quote).
New Zealand Dollar FAQs
The New Zealand Dollar (NZD), also known as the Kiwi, is a well-known traded currency among investors. Its value is broadly determined by the health of the New Zealand economy and the country’s central bank policy. Still, there are some unique particularities that also can make NZD move. The performance of the Chinese economy tends to move the Kiwi because China is New Zealand’s biggest trading partner. Bad news for the Chinese economy likely means less New Zealand exports to the country, hitting the economy and thus its currency. Another factor moving NZD is dairy prices as the dairy industry is New Zealand’s main export. High dairy prices boost export income, contributing positively to the economy and thus to the NZD.
The Reserve Bank of New Zealand (RBNZ) aims to achieve and maintain an inflation rate between 1% and 3% over the medium term, with a focus to keep it near the 2% mid-point. To this end, the bank sets an appropriate level of interest rates. When inflation is too high, the RBNZ will increase interest rates to cool the economy, but the move will also make bond yields higher, increasing investors’ appeal to invest in the country and thus boosting NZD. On the contrary, lower interest rates tend to weaken NZD. The so-called rate differential, or how rates in New Zealand are or are expected to be compared to the ones set by the US Federal Reserve, can also play a key role in moving the NZD/USD pair.
Macroeconomic data releases in New Zealand are key to assess the state of the economy and can impact the New Zealand Dollar’s (NZD) valuation. A strong economy, based on high economic growth, low unemployment and high confidence is good for NZD. High economic growth attracts foreign investment and may encourage the Reserve Bank of New Zealand to increase interest rates, if this economic strength comes together with elevated inflation. Conversely, if economic data is weak, NZD is likely to depreciate.
The New Zealand Dollar (NZD) tends to strengthen during risk-on periods, or when investors perceive that broader market risks are low and are optimistic about growth. This tends to lead to a more favorable outlook for commodities and so-called ‘commodity currencies’ such as the Kiwi. Conversely, NZD tends to weaken at times of market turbulence or economic uncertainty as investors tend to sell higher-risk assets and flee to the more-stable safe havens.
- NZD/USD rises further, bullish momentum accelerates.
- RSI remains in positive territory, MACD shows rising bullish momentum.
- The 0.6100 zone (200-day SMA) resistance is in focus, break above could extend gains.
In Tuesday's session, the NZD/USD pair rose by 0.92% to 0.6090, continuing the bullish trend seen in recent sessions. The technical indicators suggest that the bulls have gained the upper hand and a further rise towards 0.6100 where the 200-day Simple Moving Average (SMA) converges is likely.
The Relative Strength Index (RSI) remains in positive territory, currently at 64. This indicates that the bullish momentum is still strong, and there is room for further gains. The Moving Average Convergence Divergence (MACD) is also showing increasing bullish momentum, with rising green bars signaling increasing upside potential.
NZD/USD daily chart
On the daily chart, the NZD/USD pair is facing immediate resistance at 0.6100. A break above this level could open the door for a deeper rally towards 0.6150 and 0.6200. On the downside, support lies at 0.6000 and 0.5950. A break below 0.5950 could trigger a deeper pullback.
In the near term, the NZD/USD pair is expected to remain under bullish pressure. The technical indicators suggest that the bulls have gained the upper hand as they seem to have bottomed at early August around 0.5860 and now seems to be the buyer's time.
- EUR/USD gained over half of a percent on Tuesday.
- Easing US inflation figures bolstered risk appetite, pummeling the US Dollar.
- Key EU GDP growth data remains ahead, as well as US CPI inflation.
EUR/USD climbed on Tuesday, bolstered by a broad weakening of US Dollar bids after US Producer Price Index (PPI) inflation cooled faster than expected. Fiber traders still await pan-EU Gross Domestic Product (GDP) growth numbers slated for early Wednesday, but investors will be broadly focused on upcoming US Consumer Price Index (CPI) inflation figures as risk appetite extends into recovery mode.
Forex Today: Rate cut expectations look at US inflation data
Euro-area GDP for the second quarter is expected to hold steady at previous figures of 0.3% QoQ and 0.6% YoY. While no change is expected, too steep of a deviation in either direction could kick off a fresh round of risk-off selling in Euro markets if the print comes in lower, or add fuel to the current bullish stance if growth finds a bounce.
US CPI inflation is widely expected to continue cooling in July, with markets forecasting core US CPI for the year ended in July to ease to 3.2% from the previous 3.3%. Headline CPI is more of the same, with median market forecasts expecting headline CPI inflation figures to tick down to 2.9% YoY from the previous 3.0%.
US PPI inflation eased to 2.2% YoY in July, falling below the expected 2.3% and declining even further from the previous period’s revised 2.7%. Core PPI inflation also declined to 2.4% for the year ended in July, dropping below the forecast 2.7% and falling well below the previous 3.0%. Continued declines in US inflation pressure bolstered risk appetite in the US market session, and market bets of a 50 basis point double-cut in September from the Federal Reserve (Fed) rose to 55%, according to the CME’s FedWatch Tool.
EUR/USD price forecast
Despite Tuesday’s rally, EUR/USD remains trapped under last week’s peak bids just north of 1.10000. Bullish momentum is set to continue dragging intraday price action higher, but technical weakness remains a real risk as Fiber struggles to develop long-term wheels above the 200-day Exponential Moving Average (EMA) near 1.0820.
EUR/USD daily chart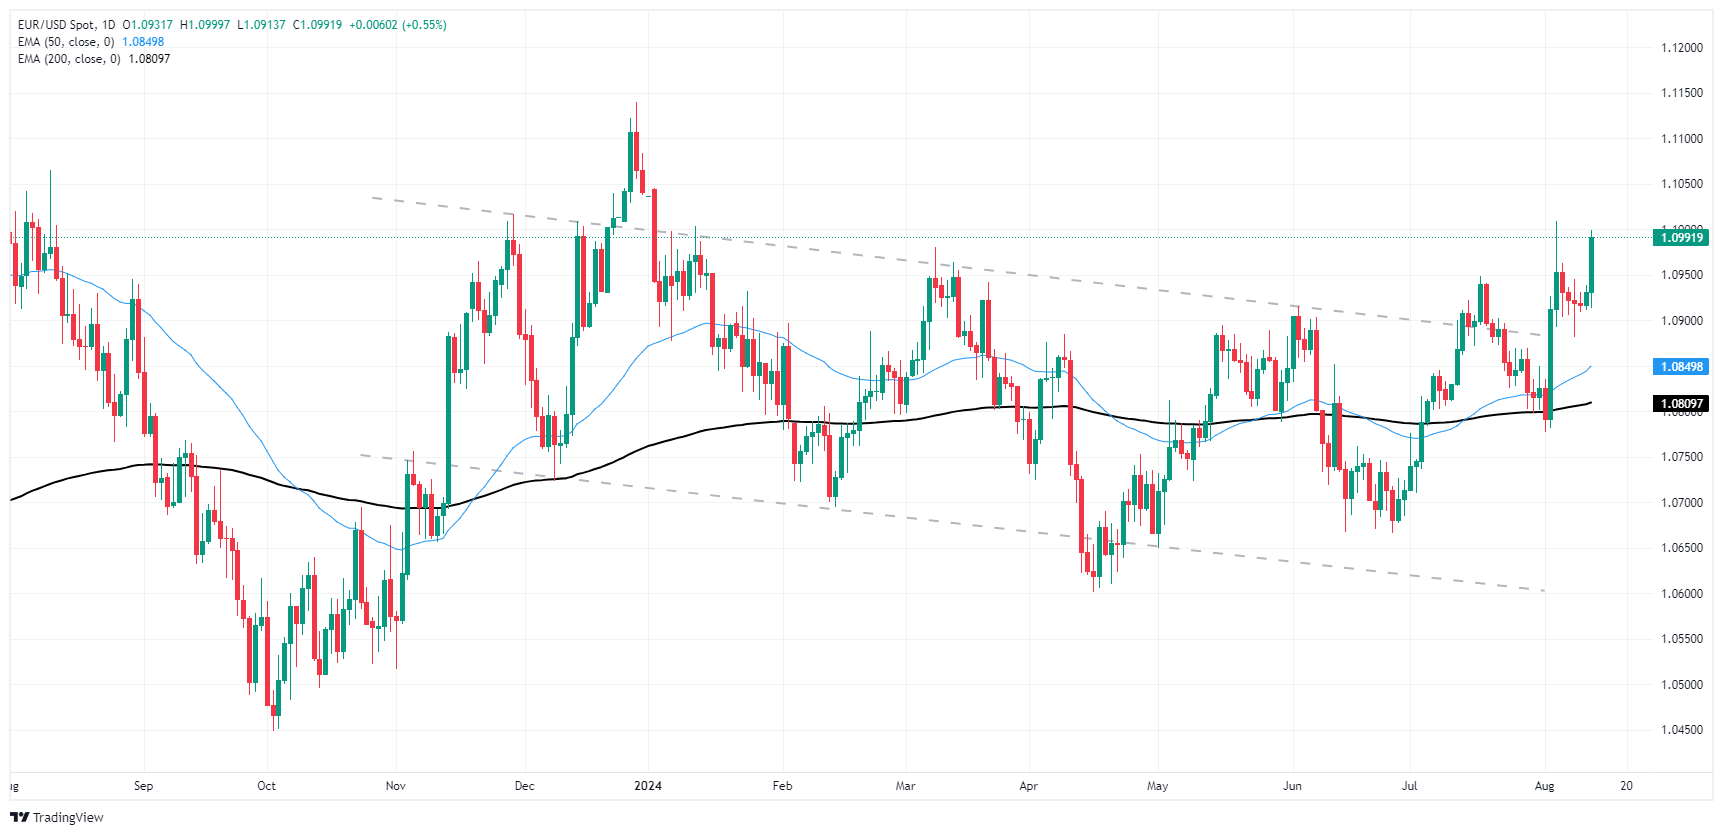
Euro FAQs
The Euro is the currency for the 20 European Union countries that belong to the Eurozone. It is the second most heavily traded currency in the world behind the US Dollar. In 2022, it accounted for 31% of all foreign exchange transactions, with an average daily turnover of over $2.2 trillion a day. EUR/USD is the most heavily traded currency pair in the world, accounting for an estimated 30% off all transactions, followed by EUR/JPY (4%), EUR/GBP (3%) and EUR/AUD (2%).
The European Central Bank (ECB) in Frankfurt, Germany, is the reserve bank for the Eurozone. The ECB sets interest rates and manages monetary policy. The ECB’s primary mandate is to maintain price stability, which means either controlling inflation or stimulating growth. Its primary tool is the raising or lowering of interest rates. Relatively high interest rates – or the expectation of higher rates – will usually benefit the Euro and vice versa. The ECB Governing Council makes monetary policy decisions at meetings held eight times a year. Decisions are made by heads of the Eurozone national banks and six permanent members, including the President of the ECB, Christine Lagarde.
Eurozone inflation data, measured by the Harmonized Index of Consumer Prices (HICP), is an important econometric for the Euro. If inflation rises more than expected, especially if above the ECB’s 2% target, it obliges the ECB to raise interest rates to bring it back under control. Relatively high interest rates compared to its counterparts will usually benefit the Euro, as it makes the region more attractive as a place for global investors to park their money.
Data releases gauge the health of the economy and can impact on the Euro. Indicators such as GDP, Manufacturing and Services PMIs, employment, and consumer sentiment surveys can all influence the direction of the single currency. A strong economy is good for the Euro. Not only does it attract more foreign investment but it may encourage the ECB to put up interest rates, which will directly strengthen the Euro. Otherwise, if economic data is weak, the Euro is likely to fall. Economic data for the four largest economies in the euro area (Germany, France, Italy and Spain) are especially significant, as they account for 75% of the Eurozone’s economy.
Another significant data release for the Euro is the Trade Balance. This indicator measures the difference between what a country earns from its exports and what it spends on imports over a given period. If a country produces highly sought after exports then its currency will gain in value purely from the extra demand created from foreign buyers seeking to purchase these goods. Therefore, a positive net Trade Balance strengthens a currency and vice versa for a negative balance.
- The Reserve Bank of New Zealand is set to maintain its key interest rate at 5.50% on Wednesday.
- The August policy decision appears to be a “close call” between a hold and a cut, as inflation expectations fall.
- The New Zealand Dollar’s fate hinges on the RBNZ policy action, updated forecasts and Governor Orr’s words.
Market participants are eagerly awaiting the Reserve Bank of New Zealand (RBNZ) interest rate decision, due on Wednesday at 02:00 GMT, as it is expected to be a “close call” for the central bank.
The RBNZ is expected to hold the Official Cash Rate (OCR) at 5.50%, maintaining that level since May 2023. However, the market is heavily divided, with analysts and industry experts anticipating a rates on-hold decision. A Reuters poll of 31 analysts, found 12 predicting a cut with the rest supporting the status quo.
On the other hand, swap markets imply a roughly 70% probability of the bank lowering the cash rate by 25 basis points (bps) to 5.25%. Markets are pricing in 90 bps of easing this year and another 148 basis points in 2025.
What to expect from the RBNZ interest rate decision?
Markets leaned in favor of a dovish policy pivot by the RBNZ after the central bank’s quarterly survey showed a continued drop in inflation expectations.
New Zealand's inflation expectations fell to three-year lows of 2.03% in the third quarter, compared to 2.33% in the June quarter. Meanwhile, the survey data from 33 business leaders and professional forecasters saw annual price increases averaging 2.40% over the year ahead, down from 2.73% previously.
However, some of the other fxstreet.com/economic-calendar" data-fxs-autoanchor="">economic indicators suggest that the RBNZ could extend the pause. Non-tradable inflation continues to be a concern for the central bank, as domestic inflation remains stubbornly high. Non-tradeable inflation was 5.4% in the year to the June quarter, declining from the 5.8% print in the second quarter, although still above the 5.0% level.
The country’s labor market still showed some signs of tightness after the Employment Change rebounded by 0.4% in the second quarter, up from a 0.2% decline in Q1 and way above the market estimate of a 0.2% fall. The Unemployment Rate rose from 4.4% to 4.6%, lower than the expected 4.7% figure.
Additionally, New Zealand’s ANZ Business Confidence Index jumped to 27.1 in July from 6.1 in June, showing improving firms’ morale.
As the market remains split on the likely RBNZ policy move this week, traders will pay close attention to the language of the Monetary Policy Statement (MPS) and the updated economic projections for fresh hints on the bank’s outlook on interest rates.
How will the RBNZ interest decision impact the New Zealand Dollar?
The main focus will be on the RBNZ’s OCR forecasts and a downward revision to it for this year could reverberate the market's expectations of a rate cut by the RBNZ earlier than previously projected in the third quarter of 2025. The RBNZ currently forecasts the OCR to peak at 5.65% in Q4 2024.
The New Zealand Dollar (NZD) will be thrown under the bus if the central bank cuts the rate by 25 bps to 5.25% while revising down its OCR forecast for 2024. In such a scenario, NZD/USD could revisit the nine-month low of 0.5900.
In case the central bank holds the rate, any dovish tweak in the policy statement and a potential downward revision to the OCR projections could overshadow and act as a headwind for the Kiwi Dollar.
NZD/USD could extend its recovery momentum only if the MPS expresses concerns over sticky non-tradeable goods and services inflation and acknowledges upside risks to inflation, delivering a hawkish hold outcome. The New Zealand Dollar could also benefit should the bank retain its hawkish bias while maintaining the OCR estimates.
Dhwani Mehta, FXStreet’s Senior Analyst, offers a brief technical outlook for trading the New Zealand Dollar on the RBNZ policy announcements: “The NZD/USD pair is consolidating the previous week’s recovery, capitalizing on a bullish 14-day Relative Strength Index (RSI) on the daily chart.”
“If buyers manage to find acceptance above the key 200-day Simple Moving Average (SMA) at 0.6087, the upside will open up toward the July high of 0.6154. Further up, the 0.6200 threshold will be in sight. Conversely, failure to defend the 21-day SMA at 0.5974 could fuel a fresh downtrend toward the 0.5900 level, below which the April low at 0.5852 will get tested,” Dhwani adds.
Economic Indicator
RBNZ Interest Rate Decision
The Reserve Bank of New Zealand (RBNZ) announces its interest rate decision after its seven scheduled annual policy meetings. If the RBNZ is hawkish and sees inflationary pressures rising, it raises the Official Cash Rate (OCR) to bring inflation down. This is positive for the New Zealand Dollar (NZD) since higher interest rates attract more capital inflows. Likewise, if it reaches the view that inflation is too low it lowers the OCR, which tends to weaken NZD.
Read more.Next release: Wed Aug 14, 2024 02:00
Frequency: Irregular
Consensus: 5.5%
Previous: 5.5%
Source: Reserve Bank of New Zealand
The Reserve Bank of New Zealand (RBNZ) holds monetary policy meetings seven times a year, announcing their decision on interest rates and the economic assessments that influenced their decision. The central bank offers clues on the economic outlook and future policy path, which are of high relevance for the NZD valuation. Positive economic developments and upbeat outlook could lead the RBNZ to tighten the policy by hiking interest rates, which tends to be NZD bullish. The policy announcements are usually followed by Governor Adrian Orr’s press conference.
Interest rates FAQs
Interest rates are charged by financial institutions on loans to borrowers and are paid as interest to savers and depositors. They are influenced by base lending rates, which are set by central banks in response to changes in the economy. Central banks normally have a mandate to ensure price stability, which in most cases means targeting a core inflation rate of around 2%. If inflation falls below target the central bank may cut base lending rates, with a view to stimulating lending and boosting the economy. If inflation rises substantially above 2% it normally results in the central bank raising base lending rates in an attempt to lower inflation.
Higher interest rates generally help strengthen a country’s currency as they make it a more attractive place for global investors to park their money.
Higher interest rates overall weigh on the price of Gold because they increase the opportunity cost of holding Gold instead of investing in an interest-bearing asset or placing cash in the bank. If interest rates are high that usually pushes up the price of the US Dollar (USD), and since Gold is priced in Dollars, this has the effect of lowering the price of Gold.
The Fed funds rate is the overnight rate at which US banks lend to each other. It is the oft-quoted headline rate set by the Federal Reserve at its FOMC meetings. It is set as a range, for example 4.75%-5.00%, though the upper limit (in that case 5.00%) is the quoted figure. Market expectations for future Fed funds rate are tracked by the CME FedWatch tool, which shapes how many financial markets behave in anticipation of future Federal Reserve monetary policy decisions.
- GBP/USD gained three-quarters of a percent on Tuesday.
- Softening US PPI inflation figures pelted the Greenback lower.
- UK unemployment claims soared to its highest level since the pandemic.
GBP/USD rallied into a two-week high on Tuesday, rising to a session peak of 1.2873 after market sentiment found the buy button. US Producer Price Index (PPI) inflation cooled more than expected, prompting a rush of bets into a higher pace of rate cuts from the Federal Reserve (Fed) in September, while Cable traders shrugged off a multi-year peak in UK unemployment claims.
Forex Today: Rate cut expectations look at US inflation data
Consumer Price Index (CPI) inflation figures are due on Wednesday on both sides of the Atlantic. Core UK CPI inflation is expected to tick down to 3.4% YoY in July from 3.5%. On US side, markets are banking on a continued cool-off in US inflation figures, with core US CPI for the year ended in July forecast to ease to 3.2% from the previous 3.3%.
Despite a broad-market pivot into hopes for a Fed rate cut on the back of easing inflation figures, the UK is staring down the barrel of a decaying employment landscape. July’s Claimant Count Change registered 135K new unemployment benefits seekers, nearly ten times the forecast 14.5K and more than quadrupling the previous month’s figure of 32.3K. It is the single-worst print of UK unemployment claims since the 2020 pandemic shuttered most of the country, and Pound Sterling traders will be looking ahead to Friday’s upcoming UK Gross Domestic Product (GDP) print with more trepidation than expected.
US PPI inflation eased to 2.2% YoY in July, falling below the expected 2.3% and declining even further from the previous period’s revised 2.7%. Core PPI inflation also declined to 2.4% for the year ended in July, dropping below the forecast 2.7% and falling well below the previous 3.0%. Continued declines in US inflation pressure bolstered risk appetite in the US market session, and market bets of a 50 basis point double-cut in September from the Federal Reserve (Fed) rose to 55%, according to the CME’s FedWatch Tool.
GBP/USD price forecast
GBP/USD is extending a recovery rally after a technical bounce from the 200-day Exponential Moving Average (EMA) last week near 1.2675. Bulls remain in control of the technical charts, but Cable has yet to pierce and recover the 1.2900 handle that was lost in mid-July.
The long-term trend favors bidders as weakness in the Greenback send the Pound Sterling higher, and a long-run technical pattern of higher lows is keeping bullish momentum on the high side.
GBP/USD daily chart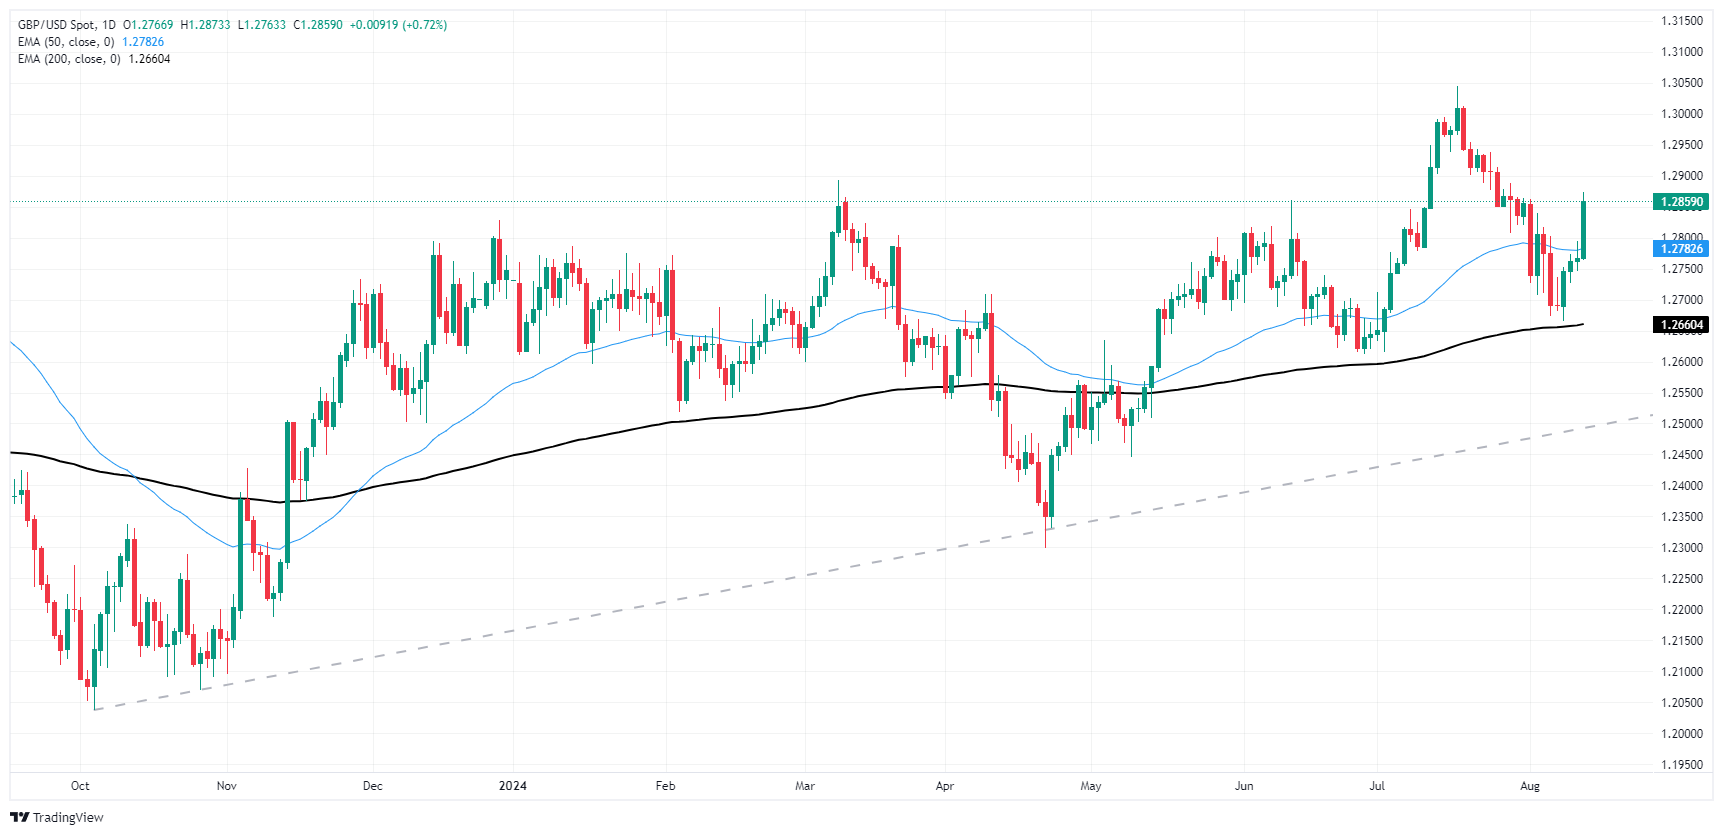
Pound Sterling FAQs
The Pound Sterling (GBP) is the oldest currency in the world (886 AD) and the official currency of the United Kingdom. It is the fourth most traded unit for foreign exchange (FX) in the world, accounting for 12% of all transactions, averaging $630 billion a day, according to 2022 data. Its key trading pairs are GBP/USD, aka ‘Cable’, which accounts for 11% of FX, GBP/JPY, or the ‘Dragon’ as it is known by traders (3%), and EUR/GBP (2%). The Pound Sterling is issued by the Bank of England (BoE).
The single most important factor influencing the value of the Pound Sterling is monetary policy decided by the Bank of England. The BoE bases its decisions on whether it has achieved its primary goal of “price stability” – a steady inflation rate of around 2%. Its primary tool for achieving this is the adjustment of interest rates. When inflation is too high, the BoE will try to rein it in by raising interest rates, making it more expensive for people and businesses to access credit. This is generally positive for GBP, as higher interest rates make the UK a more attractive place for global investors to park their money. When inflation falls too low it is a sign economic growth is slowing. In this scenario, the BoE will consider lowering interest rates to cheapen credit so businesses will borrow more to invest in growth-generating projects.
Data releases gauge the health of the economy and can impact the value of the Pound Sterling. Indicators such as GDP, Manufacturing and Services PMIs, and employment can all influence the direction of the GBP. A strong economy is good for Sterling. Not only does it attract more foreign investment but it may encourage the BoE to put up interest rates, which will directly strengthen GBP. Otherwise, if economic data is weak, the Pound Sterling is likely to fall.
Another significant data release for the Pound Sterling is the Trade Balance. This indicator measures the difference between what a country earns from its exports and what it spends on imports over a given period. If a country produces highly sought-after exports, its currency will benefit purely from the extra demand created from foreign buyers seeking to purchase these goods. Therefore, a positive net Trade Balance strengthens a currency and vice versa for a negative balance.
- AUD/USD registers an additional boost, reaching 0.6610.
- RBA maintains its hawkish position, undergirding a strengthened AUD.
- Strong mid-tier data may fuel additional hawkish bets on the RBA hiking cycle.
The AUD/USD pair experienced an increase of 0.26% during Tuesday's session, settling near 0.6610, above the 100 and 200-day Simple Moving Average (SMA) convergence. The Reserve Bank of Australia's (RBA) unwavering hawkish stance and stronger mid-tier Australian economic data reported during the Asian session underpin the Aussie.
Considering the mixed Australian economic outlook and high inflation, the RBA has all the reasons to remain hawkish, which should continue benefiting the Aussie.
Daily digest market movers: Aussie finds more demand from strong confidence data
- The August Westpac consumer confidence figure came in at 85.0, beating a revised July figure of 82.7. This was the second straight improvement and the highest since February.
- Furthermore, July's NAB business confidence came up a bit short, landing at 1 against a revised June measure of 3.
- Markets are seeing strong odds of a cut by year's end, but if data continues coming in strong, investors might push the easing to 2025.
- On the US front, soft Producer Price Index (PPI) fueled USD weakness, which also favoured the pair’s upside.
AUD/USD technical outlook: Pair consolidates near significant resistance around 0.6610
The Relative Strength Index (RSI) hovers slightly above the neutral zone at 53, indicating a slightly bullish streak. The Moving Average Convergence Divergence (MACD) presents rising green bars.
This points out that the recent bullish recovery is taking shape, but the confirmation will be if the pair manages to consolidate above the 100 and 200-day SMA convergence near 0.6610. Support to the downside line up at 0.6600, 0.6580 and 0.6560.
Australian Dollar FAQs
One of the most significant factors for the Australian Dollar (AUD) is the level of interest rates set by the Reserve Bank of Australia (RBA). Because Australia is a resource-rich country another key driver is the price of its biggest export, Iron Ore. The health of the Chinese economy, its largest trading partner, is a factor, as well as inflation in Australia, its growth rate and Trade Balance. Market sentiment – whether investors are taking on more risky assets (risk-on) or seeking safe-havens (risk-off) – is also a factor, with risk-on positive for AUD.
The Reserve Bank of Australia (RBA) influences the Australian Dollar (AUD) by setting the level of interest rates that Australian banks can lend to each other. This influences the level of interest rates in the economy as a whole. The main goal of the RBA is to maintain a stable inflation rate of 2-3% by adjusting interest rates up or down. Relatively high interest rates compared to other major central banks support the AUD, and the opposite for relatively low. The RBA can also use quantitative easing and tightening to influence credit conditions, with the former AUD-negative and the latter AUD-positive.
China is Australia’s largest trading partner so the health of the Chinese economy is a major influence on the value of the Australian Dollar (AUD). When the Chinese economy is doing well it purchases more raw materials, goods and services from Australia, lifting demand for the AUD, and pushing up its value. The opposite is the case when the Chinese economy is not growing as fast as expected. Positive or negative surprises in Chinese growth data, therefore, often have a direct impact on the Australian Dollar and its pairs.
Iron Ore is Australia’s largest export, accounting for $118 billion a year according to data from 2021, with China as its primary destination. The price of Iron Ore, therefore, can be a driver of the Australian Dollar. Generally, if the price of Iron Ore rises, AUD also goes up, as aggregate demand for the currency increases. The opposite is the case if the price of Iron Ore falls. Higher Iron Ore prices also tend to result in a greater likelihood of a positive Trade Balance for Australia, which is also positive of the AUD.
The Trade Balance, which is the difference between what a country earns from its exports versus what it pays for its imports, is another factor that can influence the value of the Australian Dollar. If Australia produces highly sought after exports, then its currency will gain in value purely from the surplus demand created from foreign buyers seeking to purchase its exports versus what it spends to purchase imports. Therefore, a positive net Trade Balance strengthens the AUD, with the opposite effect if the Trade Balance is negative.
- The Canadian Dollar had little strength on Tuesday, but US Dollar was weaker.
- Canada remains absent from economic calendar as markets focus on inflation figures.
- US PPI inflation cooled further, US CPI inflation in the barrel for Wednesday.
The Canadian Dollar (CAD) found higher ground against the Greenback but otherwise chalked in a poor performance across the major currencies board on Tuesday. Market sentiment has tilted to the upside after US Producer Price Index (PCI) inflation receded in July, sparking a move back into bets of a double rate cut from the Federal Reserve (Fed) in September.
Canada remains absent from the economic data docket this week, leaving traders to focus squarely on Wednesday’s upcoming US Consumer Price Index (CPI) inflation print. US CPI inflation is expected to continue the trend of cooling toward the Fed’s 2% annual inflation target.
Daily digest market movers: Canadian Dollar loses race with Greenback to the bottom
- CAD softened on Tuesday yet gained one-quarter of one percent against the USD.
- US PPI inflation ticked down to 2.2% YoY in July, less than the forecast for 2.3% and easing further back from the previous period’s revised 2.7%.
- Cooling US inflation figures battered the Greenback, sending the USD down across the board.
- Markets still await Wednesday’s US CPI inflation print, expected to fall in-line with overall declining inflation pressures.
- Rate markets see greater-than-even odds of a double cut of 50 basis points in September from the Fed, up from the start of the week but still below last week’s 70% high.
Canadian Dollar price forecast: Falling Greenback drags USD/CAD down from 1.3750
USD/CAD dove toward 1.3700 on Tuesday, falling back below the 50-day Exponential Moving Average (EMA) at 1.3730. The pair has fallen further back from the 1.3750 technical level as pressures mount on the Greenback, sending the CAD into three-week highs against the US Dollar.
Long-term technicals still favor long positions as the pair continues to trade north of the 200-day EMA at 1.3630, but topside momentum remains limited after USD/CAD bidders failed to capture the 1.3950 peak early last week.
USD/CAD daily chart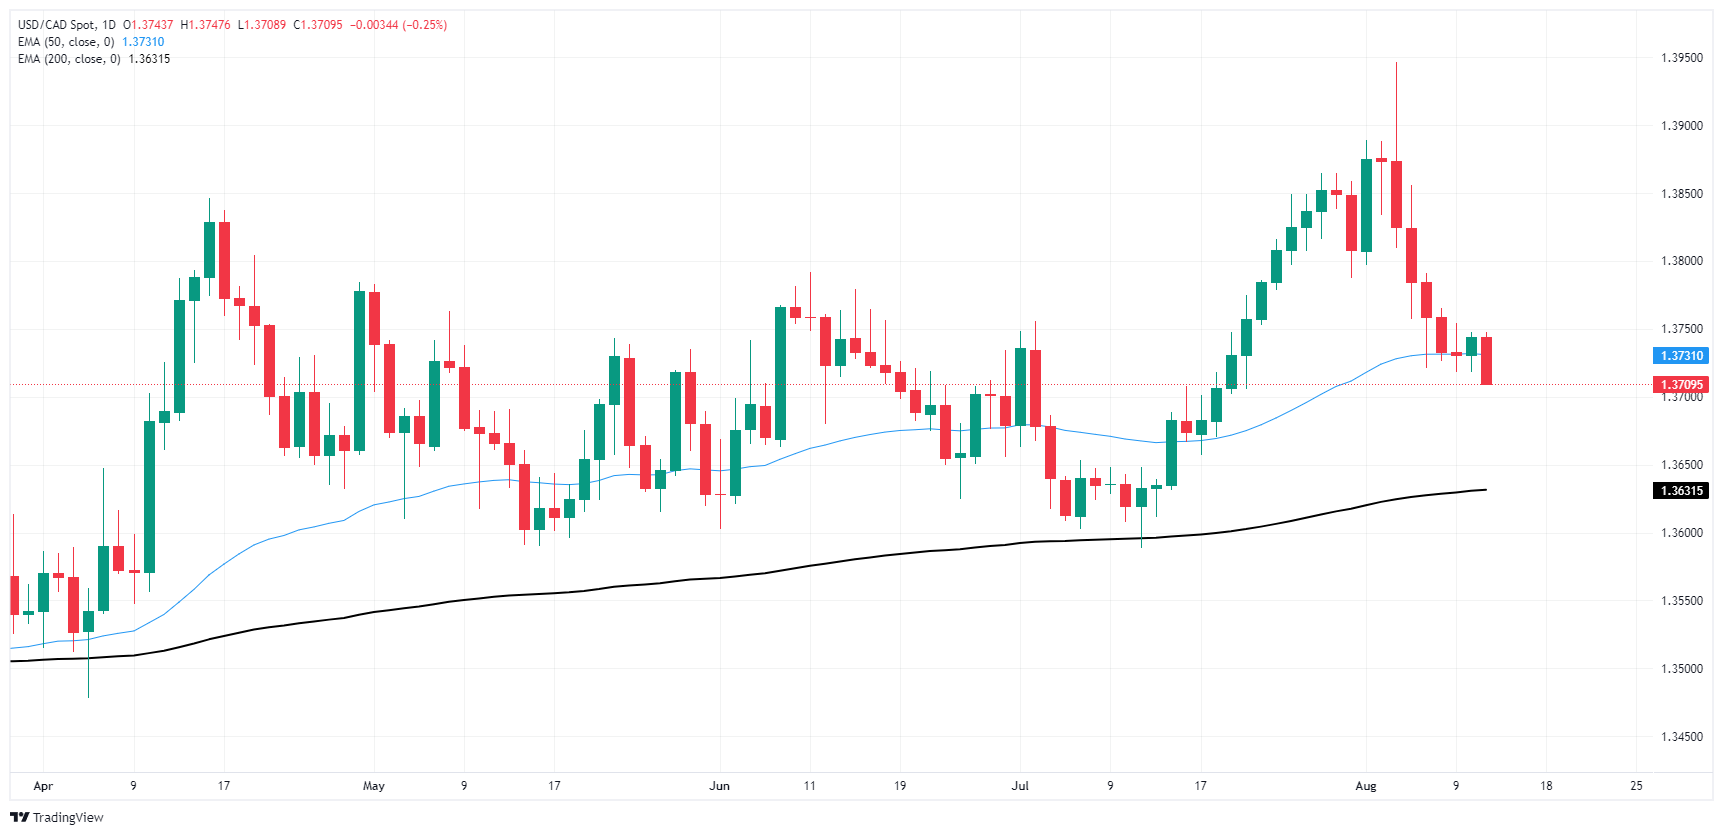
Canadian Dollar FAQs
The key factors driving the Canadian Dollar (CAD) are the level of interest rates set by the Bank of Canada (BoC), the price of Oil, Canada’s largest export, the health of its economy, inflation and the Trade Balance, which is the difference between the value of Canada’s exports versus its imports. Other factors include market sentiment – whether investors are taking on more risky assets (risk-on) or seeking safe-havens (risk-off) – with risk-on being CAD-positive. As its largest trading partner, the health of the US economy is also a key factor influencing the Canadian Dollar.
The Bank of Canada (BoC) has a significant influence on the Canadian Dollar by setting the level of interest rates that banks can lend to one another. This influences the level of interest rates for everyone. The main goal of the BoC is to maintain inflation at 1-3% by adjusting interest rates up or down. Relatively higher interest rates tend to be positive for the CAD. The Bank of Canada can also use quantitative easing and tightening to influence credit conditions, with the former CAD-negative and the latter CAD-positive.
The price of Oil is a key factor impacting the value of the Canadian Dollar. Petroleum is Canada’s biggest export, so Oil price tends to have an immediate impact on the CAD value. Generally, if Oil price rises CAD also goes up, as aggregate demand for the currency increases. The opposite is the case if the price of Oil falls. Higher Oil prices also tend to result in a greater likelihood of a positive Trade Balance, which is also supportive of the CAD.
While inflation had always traditionally been thought of as a negative factor for a currency since it lowers the value of money, the opposite has actually been the case in modern times with the relaxation of cross-border capital controls. Higher inflation tends to lead central banks to put up interest rates which attracts more capital inflows from global investors seeking a lucrative place to keep their money. This increases demand for the local currency, which in Canada’s case is the Canadian Dollar.
Macroeconomic data releases gauge the health of the economy and can have an impact on the Canadian Dollar. Indicators such as GDP, Manufacturing and Services PMIs, employment, and consumer sentiment surveys can all influence the direction of the CAD. A strong economy is good for the Canadian Dollar. Not only does it attract more foreign investment but it may encourage the Bank of Canada to put up interest rates, leading to a stronger currency. If economic data is weak, however, the CAD is likely to fall.
Federal Reserve (Fed) Bank of Atlanta President Raphael Bostic noted on Tuesday that his overall outlook on the US labor market remains positive despite an upturn in the unemployment rate.
Key highlights
The balance of risks in the economy is getting back to level.
Our rate posture is restrictive.
Recent inflation data gives me more confidence we can get back to 2%; I want to see a little more data.
We need to make sure the inflation trend is real.
If the economy evolves as I expect, there would be rate cut by the end of the year.
It would be really bad if we cut rates and then had to raise them again.
I am willing to wait for first rate cut but it is coming.
Housing inflation has come down in an important way the last couple of months.
The unemployment rate in grand scheme of things is still historically low.
We still have a strong, solid labor market.
A recession is not in my outlook.
We need to make sure we don't go from a hot labor market to a freezing cold one.
The labor market can slow but without considerable concern.
Contacts don't tell me there are many layoffs, if that continues we'll be in a good place.
The labor market can slow but without considerable concern.
I am concerned that the unemployment has gone up, but more supply is good
Further optimism in the risk-linked complex maintained the Greenback under pressure in the first half of the week, while investors got ready for the release of crucial US inflation figures on Wednesday. Still around inflation, the UK CPI will also be in the spotlight.
Here is what you need to know on Wednesday, August 14:
The USD Index (DXY) retreated for the third day in a row and once again broke below the 103.00 support amidst lower yields. The Inflation Rate will take centre stage on August 14 seconded by weekly MBA’s Mortgage Applications.
EUR/USD climbed to multi-day highs and revisited the 1.0980 zone on the back of the improved tone in the riskier assets. Another estimate of the Q2 GDP Growth rate in the euro area is due on August 14, followed by Industrial Production and the preliminary Employment Change in Q2.
GBP/USD resumed its uptrend and rose sharply, this time rapidly leaving behind the 1.2800 barrier to print multi-day tops. The salient event across the Channel will be the Inflation Rate on August 14.
USD/JPY maintained its erratic performance seen in past days, although a convincing breakout of the 148.00 barrier appears elusive for the time being. The next significant data releases in Japan will be the advanced Q2 GDP Growth Rate, the final Industrial Production and weekly Foreign Bond Investment, all expected on August 15.
Another positive day saw AUD/USD trespass the key 0.6600 barrier and reach new three-week highs. Next of note on the Australian calendar will be the Consumer Inflation Expectations and the publication of the labour market report, all due on August 15.
WTI prices could not sustain a move past the key $80.00 mark per barrel, eventually succumbing to the renewed selling pressure and returning below the $79.00 mark.
Gold prices approached the $2,480 region per ounce troy before retreating and ending the session with modest losses ahead of the US CPI data on Wednesday. Silver dropped markedly despite briefly surpassing the $28.00 mark per ounce earlier in the day.
- DXY index slips below 103.00 as US Producer Price Index figures disappoint.
- US economic growth continues to trend upwards, suggesting markets may be overestimating aggressive easing requirements.
- CPI is now in focus for a clearer inflation outlook.
On Tuesday, the US Dollar (USD), measured by the US Dollar Index (DXY), showed a mild decline falling under the 103.00 level. This drop followed disappointing Producer Price Index (PPI) figures, which fell short of analysts' estimates.
Based on the entire economic data, the US economy continues to achieve growth above the trend. This suggests that market participants may be overestimating the need for aggressive monetary easing as the Federal Reserve (Fed) may request more data before cutting.
Daily digest market movers: Mild decline follows underwhelming PPI figures
- The release of the Producer Price Index (PPI) for final demand in the US showed a YoY rise of 2.2% in July, less than the market expectation of 2.3%.
- The annually adjusted core PPI also rose by 2.4%, missing analysts' estimated increase of 2.7%.
- On a monthly scale, the PPI saw a 0.1% rise, while the core PPI remained unmoved.
- As for now, A 50-basis-point cut is possible but will entirely depend on the data, with current odds at around 55%. The market is still fully expecting 100 basis points of easing by the end of the year and a total of 175-200 basis points of trimming over the next 12 months.
- This rate path seems improbable unless the US economy enters a severe recession.
DXY technical outlook: Bearish trends continue amid weak buying efforts
There is no significant change in the technical outlook for DXY, bearing in mind the moderate selling pressure. The momentum-based Relative Strength Index (RSI) is stable below the 50 mark, indicative of a sustained selling approach. The Moving Average Convergence Divergence (MACD) continues to graph negative values as the red bars level off, demonstrating continued bearish activity despite flat market movement on Tuesday.
The Index position rests beneath the 20, 100 and 200-day Simple Moving Averages (SMAs), pointing to a predominantly bearish trend.
Support Levels: 102.80, 102.50, 102.20
Resistance Levels: 103.00,103.50, 104.00
US Dollar FAQs
The US Dollar (USD) is the official currency of the United States of America, and the ‘de facto’ currency of a significant number of other countries where it is found in circulation alongside local notes. It is the most heavily traded currency in the world, accounting for over 88% of all global foreign exchange turnover, or an average of $6.6 trillion in transactions per day, according to data from 2022. Following the second world war, the USD took over from the British Pound as the world’s reserve currency. For most of its history, the US Dollar was backed by Gold, until the Bretton Woods Agreement in 1971 when the Gold Standard went away.
The most important single factor impacting on the value of the US Dollar is monetary policy, which is shaped by the Federal Reserve (Fed). The Fed has two mandates: to achieve price stability (control inflation) and foster full employment. Its primary tool to achieve these two goals is by adjusting interest rates. When prices are rising too quickly and inflation is above the Fed’s 2% target, the Fed will raise rates, which helps the USD value. When inflation falls below 2% or the Unemployment Rate is too high, the Fed may lower interest rates, which weighs on the Greenback.
In extreme situations, the Federal Reserve can also print more Dollars and enact quantitative easing (QE). QE is the process by which the Fed substantially increases the flow of credit in a stuck financial system. It is a non-standard policy measure used when credit has dried up because banks will not lend to each other (out of the fear of counterparty default). It is a last resort when simply lowering interest rates is unlikely to achieve the necessary result. It was the Fed’s weapon of choice to combat the credit crunch that occurred during the Great Financial Crisis in 2008. It involves the Fed printing more Dollars and using them to buy US government bonds predominantly from financial institutions. QE usually leads to a weaker US Dollar.
Quantitative tightening (QT) is the reverse process whereby the Federal Reserve stops buying bonds from financial institutions and does not reinvest the principal from the bonds it holds maturing in new purchases. It is usually positive for the US Dollar.
- Dow Jones rallied 300 points in choppy trading on Tuesday.
- Equities found higher ground on Tuesday as US inflation pressures ease.
- After cooling PPI print, US CPI inflation remains in the barrel for Wednesday.
The Dow Jones Industrial Average (DJIA) found the gas pedal on Tuesday, rising 300 points after US Producer Price Index (PPI) inflation eased more than expected in July. This gave stocks a chance to breathe and sent the DJIA into 39,700.00.
Stock news: The Home Depot scores another healthy quarter despite weakness among US consumers
US PPI inflation eased to 2.2% YoY in July, falling below the expected 2.3% and declining even further from the previous period’s revised 2.7%. Core PPI inflation also declined to 2.4% for the year ended in July, dropping below the forecast 2.7% and falling well below the previous 3.0%. Continued declines in US inflation pressure bolstered risk appetite in the US market session, and market bets of a 50 basis point double-cut in September from the Federal Reserve (Fed) rose to 55%, according to the CME’s FedWatch Tool.
US Consumer Price Index (CPI) inflation is the week’s key data print, slated for Wednesday. Core CPI inflation is forecast to tick down to 3.2% YoY from 3.3%. Markets have fully priced in at least a quarter-point cut from the Fed on September 18, and continued easing in inflation metrics will likely spark a further dogpile into bets of a double cut.
Dow Jones news
All but five of the Dow Jones’ constituent securities were in the green on Tuesday, with Walmart Inc. (WMT) falling -1.25% to $67.80 per share ahead of the retail giant’s latest earnings report slated for August 15.
Nike Inc. (NKE) rallied 5.6% on Tuesday to $78.83 per share as the shoe manufacturer sees a rebound in its share price on what investors are calling “brand momentum” following a shuffle of downstream production chains and new franchise shoe releases garnering significant search interest. Nike recently suffered a harsh blow after poorer-than-expected fiscal quarter performance which sent the stock tumbling from valuations above $90.00 per share.
Dow Jones price forecast
Tuesday’s Dow Jones rally dragged the major equity index into a one-week high on approach to 39,800.00 as bidders attempt to reclaim the 40,000.00 major price handle. The Dow Jones recently tumbled to its lowest prices in weeks near 38,400.00 after getting knocked off of all-time highs near 41,400.00.
The DJIA is trading back above the 50-day Exponential Moving Average (EMA) for the first time since tumbling below the technical average in early August. Long-run trends still lean in favor of buyers, with the index continuing to trade on the north side of the 200-day EMA at 38,166.00.
Dow Jones five-minute chart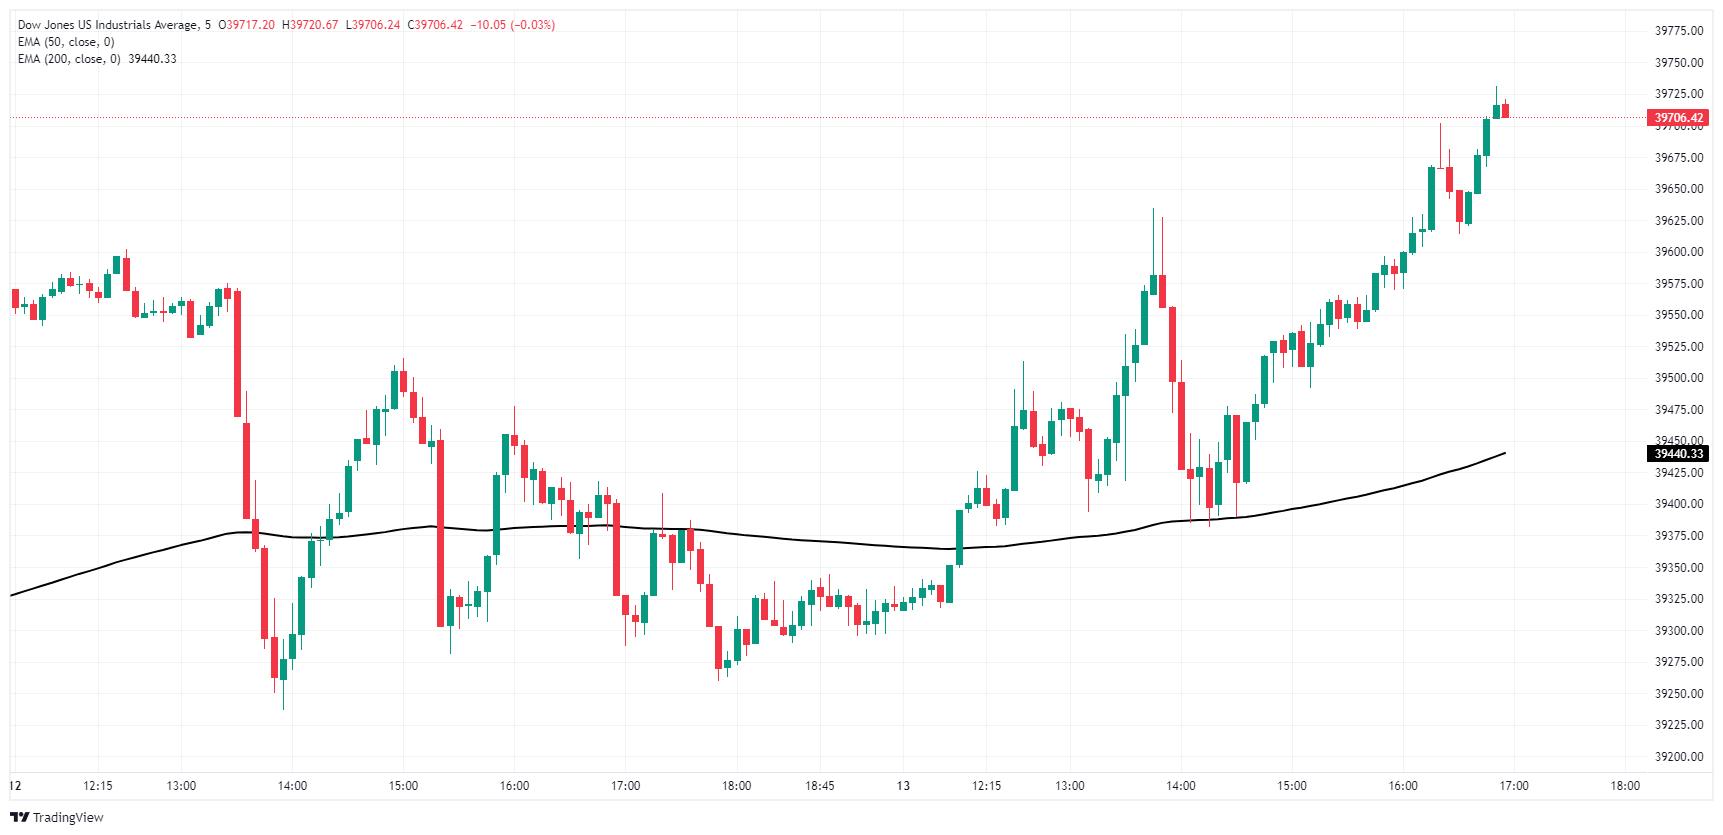
Dow Jones daily chart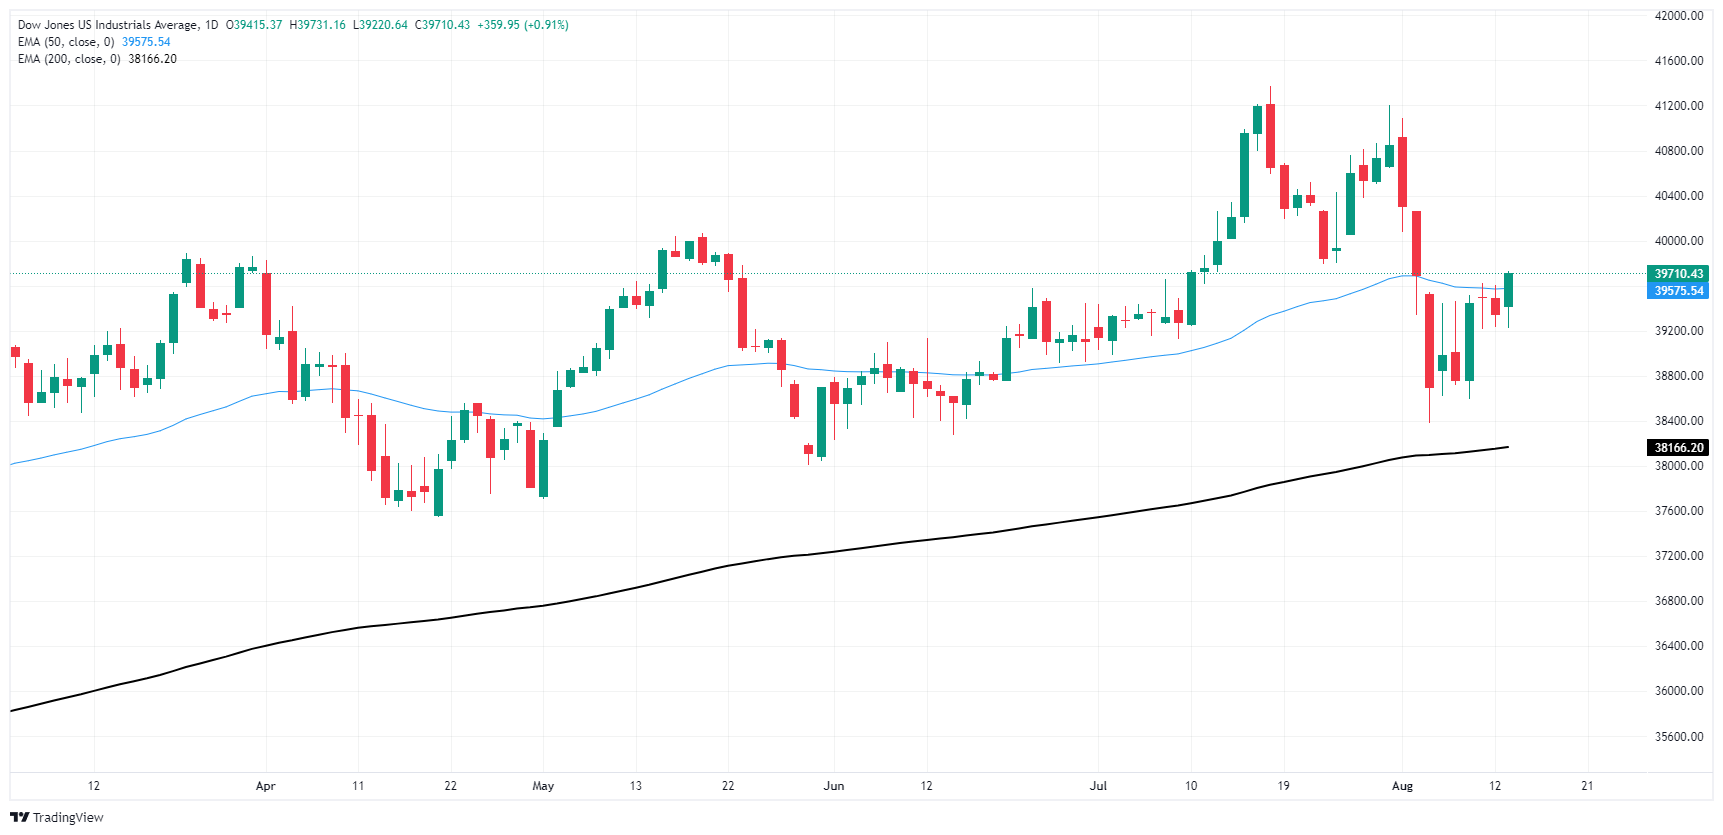
Dow Jones FAQs
The Dow Jones Industrial Average, one of the oldest stock market indices in the world, is compiled of the 30 most traded stocks in the US. The index is price-weighted rather than weighted by capitalization. It is calculated by summing the prices of the constituent stocks and dividing them by a factor, currently 0.152. The index was founded by Charles Dow, who also founded the Wall Street Journal. In later years it has been criticized for not being broadly representative enough because it only tracks 30 conglomerates, unlike broader indices such as the S&P 500.
Many different factors drive the Dow Jones Industrial Average (DJIA). The aggregate performance of the component companies revealed in quarterly company earnings reports is the main one. US and global macroeconomic data also contributes as it impacts on investor sentiment. The level of interest rates, set by the Federal Reserve (Fed), also influences the DJIA as it affects the cost of credit, on which many corporations are heavily reliant. Therefore, inflation can be a major driver as well as other metrics which impact the Fed decisions.
Dow Theory is a method for identifying the primary trend of the stock market developed by Charles Dow. A key step is to compare the direction of the Dow Jones Industrial Average (DJIA) and the Dow Jones Transportation Average (DJTA) and only follow trends where both are moving in the same direction. Volume is a confirmatory criteria. The theory uses elements of peak and trough analysis. Dow’s theory posits three trend phases: accumulation, when smart money starts buying or selling; public participation, when the wider public joins in; and distribution, when the smart money exits.
There are a number of ways to trade the DJIA. One is to use ETFs which allow investors to trade the DJIA as a single security, rather than having to buy shares in all 30 constituent companies. A leading example is the SPDR Dow Jones Industrial Average ETF (DIA). DJIA futures contracts enable traders to speculate on the future value of the index and Options provide the right, but not the obligation, to buy or sell the index at a predetermined price in the future. Mutual funds enable investors to buy a share of a diversified portfolio of DJIA stocks thus providing exposure to the overall index.
- The Mexican Peso treaded water on Tuesday following Monday’s 1.2% backslide.
- Banxico recently delivered a rate cut despite an uptick in headline inflation figures.
- Mexico’s central bank expects inflation bump to smooth out.
The Mexican Peso (MXN) held close to flat on Tuesday, paddling around 19.00 as Peso traders find their balance following a 1.2% drop in the MXN’s value against the Greenback. The Bank of Mexico (Banxico) recently cut interest rates by a quarter-point despite an uptick in headline inflation.
US Producer Price Index (PPI) figures released on Tuesday showed business-level inflation eased in July, softening the Greenback and giving the Peso a foothold as markets pivot to focusing on September rate cut expectations.
Daily digest market movers: Peso-Dollar tug-of-war continues after USD eases on cooling PPI
- US PPI inflation for the year ended in July eased to 2.2%, below the forecast of 2.3%, while the previous period was revised to 2.7% from the initial 2.6%.
- Core US PPI inflation dropped to 2.4% YoY versus the expected 2.7%, falling even further from the previous 3.0%.
- Rate markets edged up bets of a double rate cut from the Federal Reserve (Fed) in September following Tuesday’s PPI print.
- According to the CME’s FedWatch Tool, rate markets are pricing in roughly 55% odds of a 50-basis-point cut on September 18, with 45% odds of at least a 25 bps trim.
- Key US data will continue through the week with July’s Consumer Price Index (CPI) slated to print on Wednesday. Investors expect inflation figures to continue easing.
Economic Indicator
Producer Price Index (YoY)
The Producer Price Index released by the Bureau of Labor statistics, Department of Labor measures the average changes in prices in primary markets of the US by producers of commodities in all states of processing. Changes in the PPI are widely followed as an indicator of commodity inflation. Generally speaking, a high reading is seen as positive (or bullish) for the USD, whereas a low reading is seen as negative (or bearish).
Read more.Last release: Tue Aug 13, 2024 12:30
Frequency: Monthly
Actual: 2.2%
Consensus: 2.3%
Previous: 2.6%
Source: US Bureau of Labor Statistics
Mexican Peso price forecast: Peso bulls look for a floor
The Mexican Peso (MXN) is grappling with the 19.00 handle as USD/MXN traders try to keep the pair pinned. Greenback bidders are struggling to find the gas pedal on a Dollar-negative Tuesday, giving the Peso a chance to extend near-term gains.
USD/MXN hit a 22-month high last week above 20.00, but Peso bulls have returned to the fold, chalking in a 6.44% recovery peak-to-trough. The pair remains firmly pinned on the high side of the 200-day Exponential Moving Average (EMA) at 17.59, and a firm pattern of higher lows is bolstering technical support in favor of the Greenback.
USD/MXN daily chart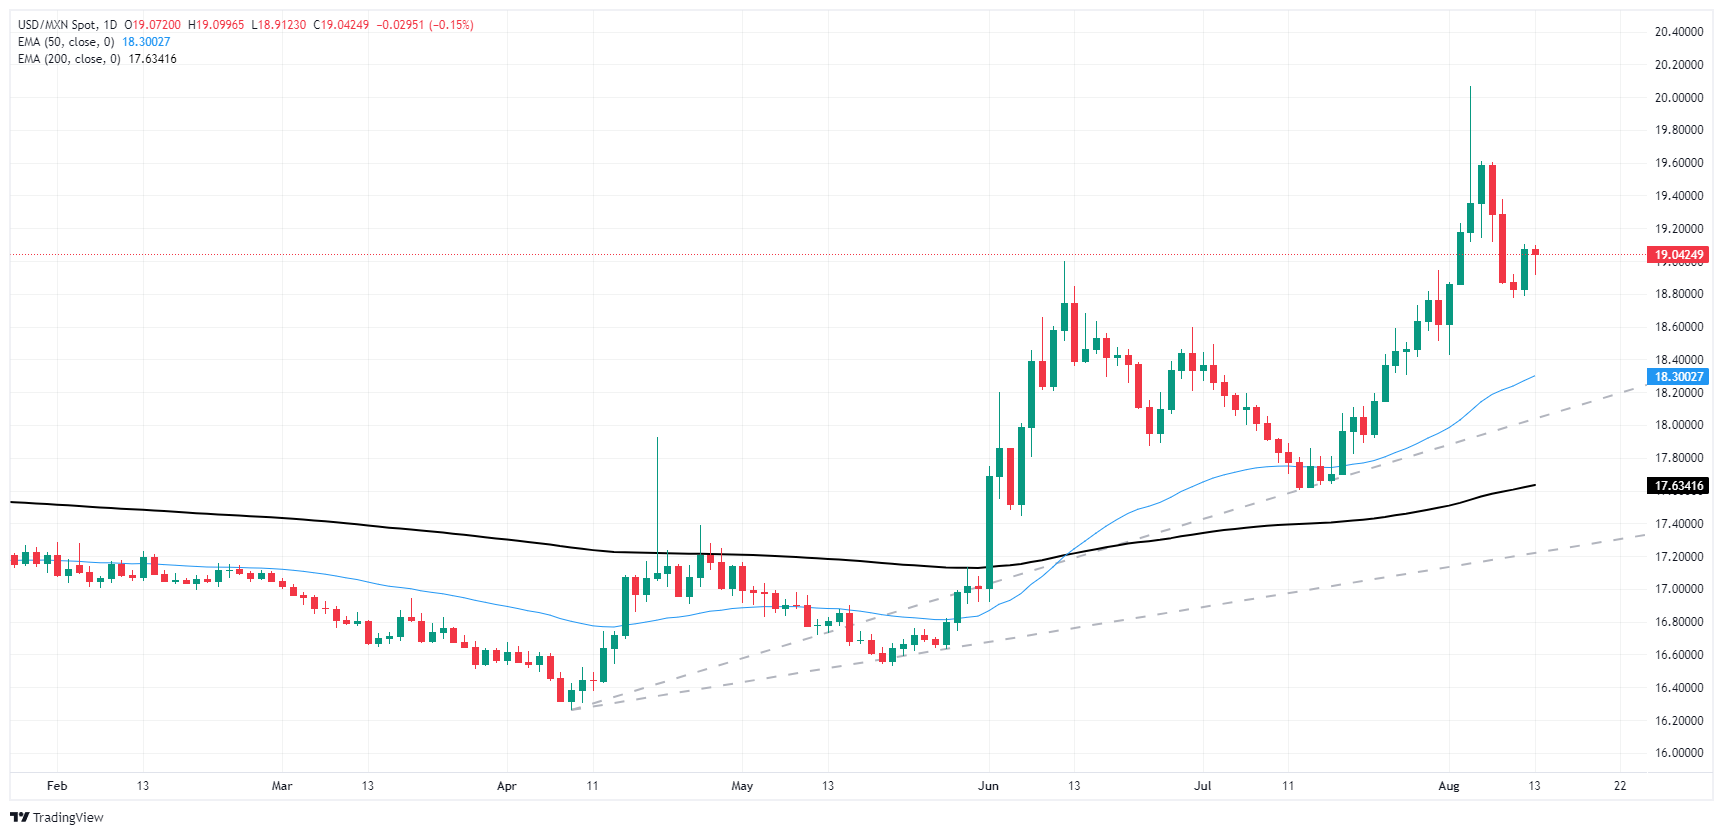
Mexican Peso FAQs
The Mexican Peso (MXN) is the most traded currency among its Latin American peers. Its value is broadly determined by the performance of the Mexican economy, the country’s central bank’s policy, the amount of foreign investment in the country and even the levels of remittances sent by Mexicans who live abroad, particularly in the United States. Geopolitical trends can also move MXN: for example, the process of nearshoring – or the decision by some firms to relocate manufacturing capacity and supply chains closer to their home countries – is also seen as a catalyst for the Mexican currency as the country is considered a key manufacturing hub in the American continent. Another catalyst for MXN is Oil prices as Mexico is a key exporter of the commodity.
The main objective of Mexico’s central bank, also known as Banxico, is to maintain inflation at low and stable levels (at or close to its target of 3%, the midpoint in a tolerance band of between 2% and 4%). To this end, the bank sets an appropriate level of interest rates. When inflation is too high, Banxico will attempt to tame it by raising interest rates, making it more expensive for households and businesses to borrow money, thus cooling demand and the overall economy. Higher interest rates are generally positive for the Mexican Peso (MXN) as they lead to higher yields, making the country a more attractive place for investors. On the contrary, lower interest rates tend to weaken MXN.
Macroeconomic data releases are key to assess the state of the economy and can have an impact on the Mexican Peso (MXN) valuation. A strong Mexican economy, based on high economic growth, low unemployment and high confidence is good for MXN. Not only does it attract more foreign investment but it may encourage the Bank of Mexico (Banxico) to increase interest rates, particularly if this strength comes together with elevated inflation. However, if economic data is weak, MXN is likely to depreciate.
As an emerging-market currency, the Mexican Peso (MXN) tends to strive during risk-on periods, or when investors perceive that broader market risks are low and thus are eager to engage with investments that carry a higher risk. Conversely, MXN tends to weaken at times of market turbulence or economic uncertainty as investors tend to sell higher-risk assets and flee to the more-stable safe havens.
- The EUR/GBP declined to 0.8540, below the 200-day SMA.
- UK employment data bolstered the Pound Sterling during the European session.
- Sentiment data made the Euro lose interest during the session.
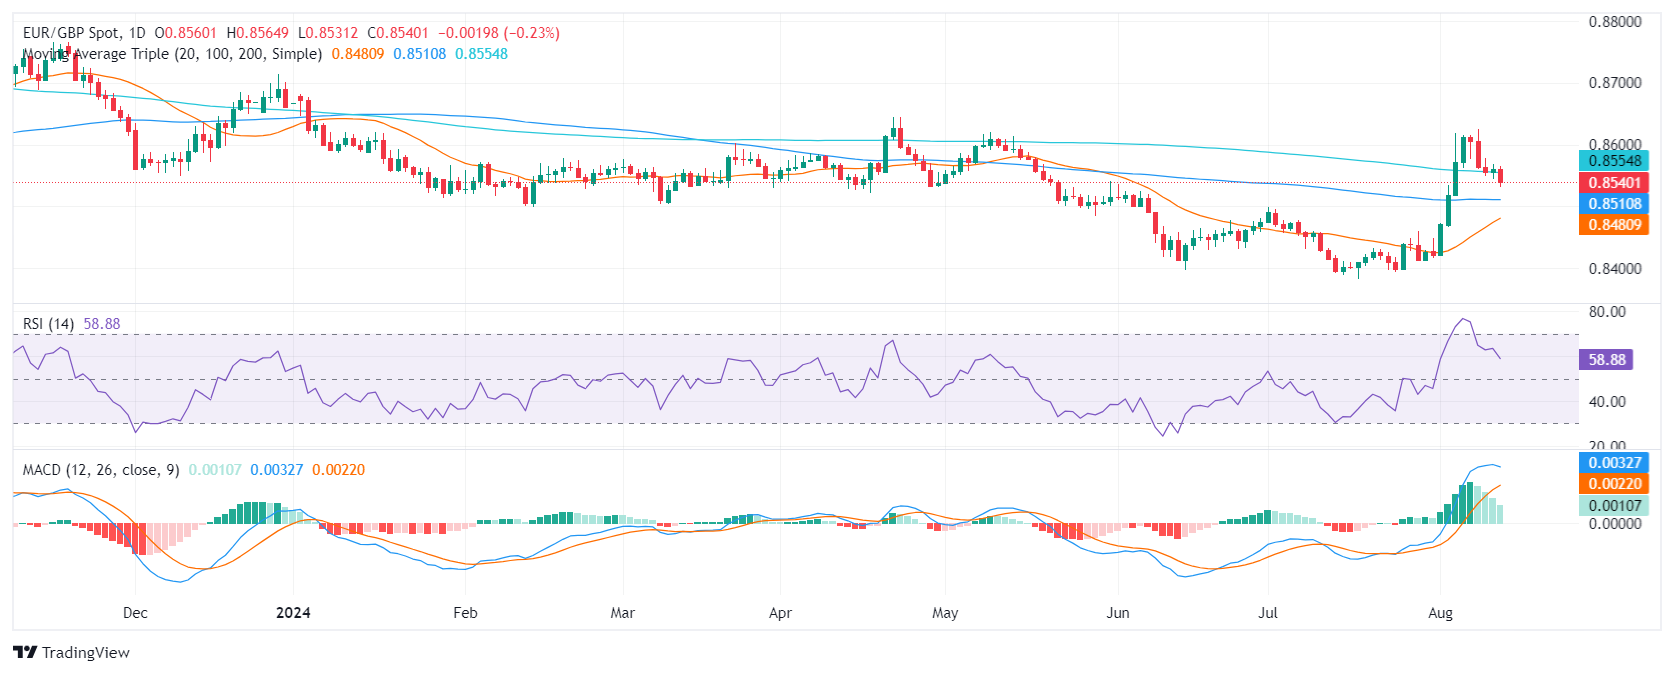
Tuesday witnessed the EUR/GBP pair fall, after the release of UK employment data, which supported the Pound Sterling. On the other hand, weak European Sentiment figures weighted on the Euro.
The UK released mixed labor market data for the three months ending in June. Average weekly earnings, excluding bonuses, rose by 5.4% YoY, aligning with expectations but slightly above the Bank of England's (BoE) Q2 projection of 5.1%. When including bonuses, total earnings growth slowed to 4.5% YoY, a 1.2 percentage point decrease. This deceleration in wage growth could support the BoE's easing stance, though upcoming Consumer Price Index (CPI) data will be crucial. Additionally, unemployment unexpectedly dropped to 4.2%, the lowest since February.
Meanwhile, Germany's August ZEW survey indicated significant economic weakness. Expectations fell to 19.2, down from 41.8 in July, while the current assessment worsened to -77.3. This marks the second consecutive decline in expectations, reaching the lowest level since January, signaling continued economic challenges in the second half of the year. The deteriorating eurozone outlook suggests the European Central Bank (ECB) may continue easing, with a September rate cut anticipated.
EUR/GBP technical analysis
The Relative Strength Index (RSI) of the EUR/GBP is escaping the overbought conditions. Concurrently, the Moving Average Convergence Divergence (MACD) indicator indicated a discernible decrease in its green bars and this shift implies nearing a bearish outlook for the EUR/GBP. This is also backed by the loss of the 200-day Simple Moving Average (SMA) of 0.8575 which is now a resistance. The 0.8530-0.8500 zone is the next target for the sellers.
EUR/GBP daily chart
Meanwhile, concentration is falling elsewhere: according to LME statistics, the share of Nickel stocks of Russian origin fell from 27% at the end of June to 24% at the end of July, and from 27% to 21% for Copper, Commerzbank’s commodity analyst Barbara Lambrecht notes.
Share of Russian Aluminium in LME stocks rises
“However, the main reason for this was an increase in stocks from other sources – probably also thanks to newly approved types of Nickel in Indonesia and China, while stocks of Russian material hardly changed following the tightening of sanctions in April.”
“The opposite is true for the more closely monitored Aluminium stocks: although stocks of Russian origin also hardly changed in July, Aluminium stocks of other origins registered on the LME fell, meaning that the proportion rose from 50% to 65%. The reduction in stocks occurred in particular for Aluminium from India, where there had been a significant build-up in May.”
Yesterday, the benchmark price for European gas reached its highest level since mid-December at almost EUR 43 per MWh. The price is still being driven by fears of supply shortfalls, Commerzbank’s commodity analyst Barbara Lambrecht notes.
Prices likely to fall again if gas flows through Ukraine
“If gas continues to flow through Ukraine – which is believed to be the case due to people with knowledge to the matter according to Bloomberg – prices are likely to fall again slightly. Admittedly, further maintenance work is due to be carried out in Norway later this month.”
“However, natural gas storage facilities in the EU are now a good 87% full and the mandatory mark of 90% by 1 November is therefore already within reach. In addition, Asia's demand for LNG has probably weakened somewhat in the current month and LNG deliveries to Europe have become more attractive again.”
“An easing of the situation on the European gas market should also cause prices in EU emissions trading to fall again somewhat, having briefly risen to almost EUR 74 per ton yesterday as gas became more expensive. However, in view of the stabilisation of production in the energy-intensive sectors, we consider the downside potential to be limited.”
The Brent oil price rose by more than 3% to $82.4 per barrel at the start of the week. This was the strongest daily gain so far this year, Commerzbank’s commodity analyst Carsten Fritsch notes.
Brent net long positions at record low
“Within the last five trading days, the price of Brent has risen by almost 8%. The price is now trading back at the level seen at the end of July. The slump from the beginning of August to a 7-month low of $75 has thus proved to be a brief episode. This price slide was facilitated by a sharp fall in net long positions held by speculative financial investors.”
“These fell to 13.9 thousand contracts in the week ending August 6, the lowest level since the start of the data series in January 2011, according to the ICE. Most recently, net long positions fell for four consecutive weeks. The reduction in positions during this period amounted to 183.5 thousand contracts or 183.5 million barrels. The decline in speculative net long positions in WTI was not quite as excessive.”
“According to the CFTC, these fell to a 2-month low of 172.6 thousand contracts. In the case of gasoil, the ICE reported net short positions for the first time since June 2023. Here, too, there was a rapid reduction in the previously considerable net long positions within a few weeks. This confirms our view that the price decline at the beginning of last week was a temporary exaggeration that has since been corrected.”
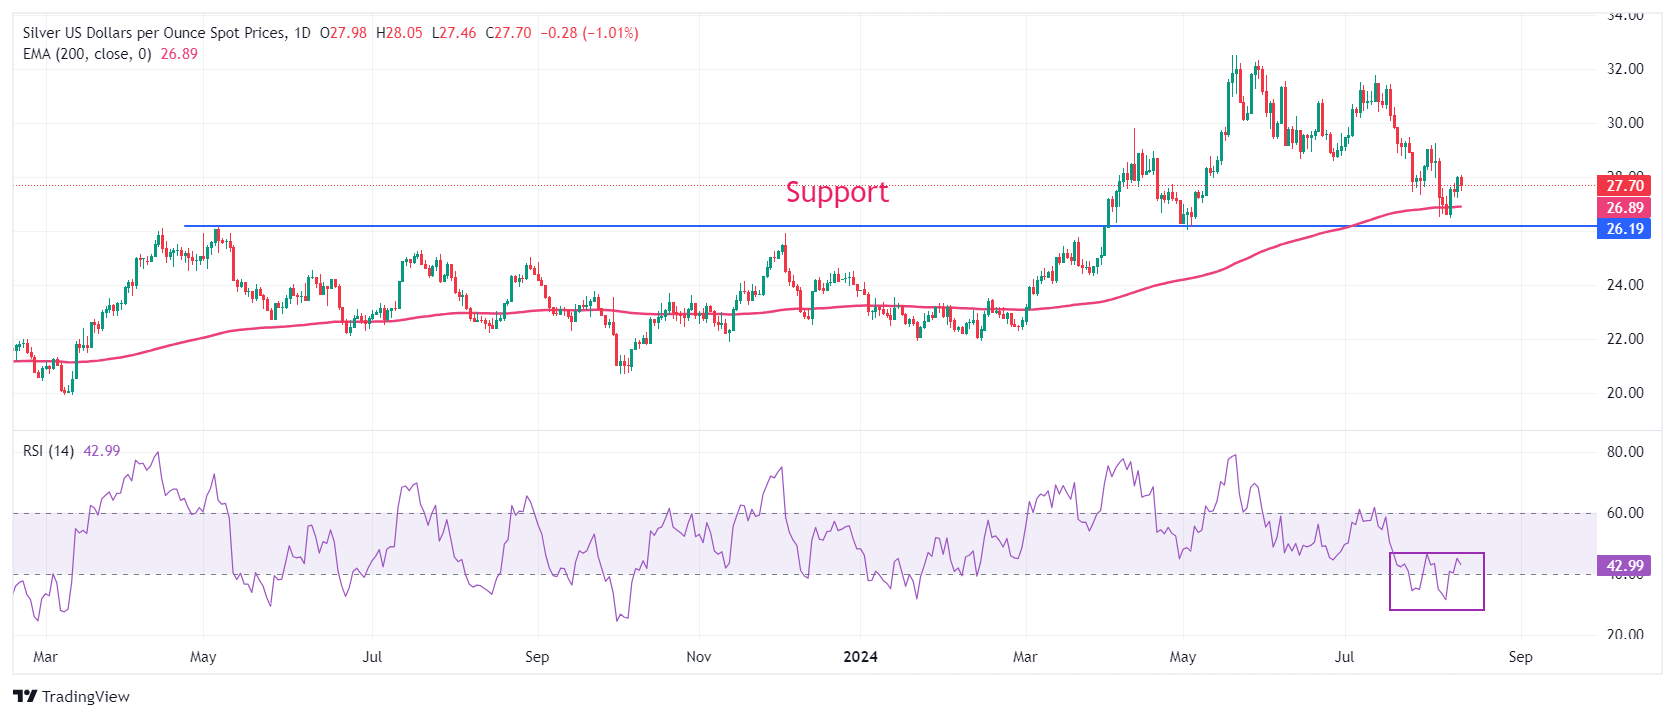
- Silver price remains on backfoot even though the US PPI turned out softer-than-expected in July.
- Soft US producer inflation has increased investors’ confidence that price pressures remain on path that leads to banks’ target of 2%.
- Middle East conflicts limit Silver price’s downside.
Silver price (XAG/USD) faces pressure in Tuesday’s American session even though the United States (US) producer inflation remained soft in July. The US Bureau of Labor Statistics (BLS) showed that the core Producer Price Inflation (PPI), which strips off volatile food and energy prices, remains flat month-on-month. Annually, the underlying PPI decelerated at a faster-than-expected pace to 2.4% from expectations of 2.7% and the former release of 2.4%.
Soft US producer inflation has affirmed confidence among investors that price pressures continue to moderate. This has weighed on the US Dollar (USD) and bond yields by boosting expectations of a big interest-rate cut announcement by the Federal Reserve (Fed) in September.
The US Dollar Index (DXY), which tracks the Greenback’s value against six major currencies, skids below the crucial support of 103.00. 10-year US Treasury Yields tumble to near 3.87%. Historically, lower yields on interest-bearing assets reduce the opportunity cost of holding investment in non-yielding assets, such as Silver. However, the Silver price declines too as investors await for more evidence to confirm that inflation is on track to return to the desired rate of 2%.
For more evidence, investors will focus on the US Consumer Price Index (CPI) data for July, which will be published on Wednesday. The CPI report is expected to show that monthly headline and core inflation rose by 0.2%. Annual headline and core CPI are estimated to have decelerated by one-tenth to 2.9% and 3.2%, respectively.
Meanwhile, geopolitical risks continue to limit the downside in the Silver price. Investors expect an all-out war in the Middle East between Iran and Israel after the killing of Hamas leader in Tehran.
Silver technical forecast
Silver price finds an interim support near the 200-day Exponential Moving Average (EMA) near $26.90, suggesting that the overall trend is uncertain. The major cushion for the Silver price will be the horizontal support plotted from May 5 high at $26.14.
The 14-day Relative Strength Index (RSI) hovers near 40.00. A decisive break below the same will trigger a bearish momentum.
Silver daily chart
Silver FAQs
Silver is a precious metal highly traded among investors. It has been historically used as a store of value and a medium of exchange. Although less popular than Gold, traders may turn to Silver to diversify their investment portfolio, for its intrinsic value or as a potential hedge during high-inflation periods. Investors can buy physical Silver, in coins or in bars, or trade it through vehicles such as Exchange Traded Funds, which track its price on international markets.
Silver prices can move due to a wide range of factors. Geopolitical instability or fears of a deep recession can make Silver price escalate due to its safe-haven status, although to a lesser extent than Gold's. As a yieldless asset, Silver tends to rise with lower interest rates. Its moves also depend on how the US Dollar (USD) behaves as the asset is priced in dollars (XAG/USD). A strong Dollar tends to keep the price of Silver at bay, whereas a weaker Dollar is likely to propel prices up. Other factors such as investment demand, mining supply – Silver is much more abundant than Gold – and recycling rates can also affect prices.
Silver is widely used in industry, particularly in sectors such as electronics or solar energy, as it has one of the highest electric conductivity of all metals – more than Copper and Gold. A surge in demand can increase prices, while a decline tends to lower them. Dynamics in the US, Chinese and Indian economies can also contribute to price swings: for the US and particularly China, their big industrial sectors use Silver in various processes; in India, consumers’ demand for the precious metal for jewellery also plays a key role in setting prices.
Silver prices tend to follow Gold's moves. When Gold prices rise, Silver typically follows suit, as their status as safe-haven assets is similar. The Gold/Silver ratio, which shows the number of ounces of Silver needed to equal the value of one ounce of Gold, may help to determine the relative valuation between both metals. Some investors may consider a high ratio as an indicator that Silver is undervalued, or Gold is overvalued. On the contrary, a low ratio might suggest that Gold is undervalued relative to Silver.
Gold is approaching its all-time high of mid-July again, Commerzbank’s commodity analyst Carsten Fritsch notes.
New record high is therefore only a matter of time
“The geopolitical tensions in the Middle East and speculation about upcoming interest rate cuts by the US Federal Reserve are providing a tailwind, even though these have recently been scaled back somewhat. According to Fed Funds Futures, however, a rate cut of 50 basis points in September is still priced in at around 50%. The US inflation data due tomorrow may raise expectations again, which could give the Gold price a further tailwind.”
“A new record high is therefore only a matter of time. The backdrop to the price slide a week ago, however, remains unclear. The CFTC data published on Friday did not show the expected strong reduction in speculative (net) long positions in the week ending August 6. ETFs do not serve as an explanation either.”
“Bloomberg shows considerable outflows from one ETF provider in the middle of last week, when the price was already rising again. It is therefore impossible to say where the selling pressure came from that caused the Gold price to fall to $2,365 in the meantime. This may have happened via OTC transactions.”
- USD/CAD sees more downside towards 1.3700 on multiple headwinds.
- Soft US PPI report for July has weighed on the US Dollar.
- Upbeat Oil prices have improved the Canadian Dollar’s appeal.
The USD/CAD pair appears vulnerable near 1.3730 in Tuesday’s New York session. The Loonie asset is expected to decline towards the round-level support of 1.3700 as the United States (US) Bureau of Labor Statistics (BLS) has released a soft Producer Price Index (PPI) report for July, which has weighed on the US Dollar (USD).
The report showed that headline producer inflation grew at a slower pace of 2.2% from the estimates of 2.3% and the prior release of 2.7%. Also, the core PPI, which excludes volatile food and energy prices, decelerated at a faster-than-expected pace to 2.4% from expectations of 2.7% and the former reading of 3%. This has boosted expectations that the Federal Reserve (Fed) will pivot to policy-normalization aggressively.
Soft US producer inflation data has improved investors’ risk-appetite. The S&P 500 has opened with strong gains. The US Dollar Index (DXY), which tracks the Greenback’s value against six major currencies, falls to near 103.00. 10-year US Treasury yields have tumbled to near 3.86%.
This week, the major trigger for the US Dollar will be the US Consumer Price Index (CPI) for July, which will be published on Wednesday.
The US CPI report is expected to show that the headline and core inflation rose by 0.2% on month-on-month basis. Annually, the headline and the core CPI are expected to have decelerated by one-tenth to 2.9% and 3.2%, respectively, from levels seen in June.
On the Loonie front, upbeat Oil prices have strengthened the Canadian Dollar’s (CAD) appeal. The Oil price has rallied more than 9% in the past one week amid supply concerns due to deepening Middle East tensions. Market participants worry about a full-fledged attack from Iran on Israel in retaliation for the assassination of the Hamas leader by an Israeli air strike in Tehran. It is worth noting that Canada is the leading exporter of Oil to the US and higher Oil prices prompt foreign flows in the economy.
Canadian Dollar FAQs
The key factors driving the Canadian Dollar (CAD) are the level of interest rates set by the Bank of Canada (BoC), the price of Oil, Canada’s largest export, the health of its economy, inflation and the Trade Balance, which is the difference between the value of Canada’s exports versus its imports. Other factors include market sentiment – whether investors are taking on more risky assets (risk-on) or seeking safe-havens (risk-off) – with risk-on being CAD-positive. As its largest trading partner, the health of the US economy is also a key factor influencing the Canadian Dollar.
The Bank of Canada (BoC) has a significant influence on the Canadian Dollar by setting the level of interest rates that banks can lend to one another. This influences the level of interest rates for everyone. The main goal of the BoC is to maintain inflation at 1-3% by adjusting interest rates up or down. Relatively higher interest rates tend to be positive for the CAD. The Bank of Canada can also use quantitative easing and tightening to influence credit conditions, with the former CAD-negative and the latter CAD-positive.
The price of Oil is a key factor impacting the value of the Canadian Dollar. Petroleum is Canada’s biggest export, so Oil price tends to have an immediate impact on the CAD value. Generally, if Oil price rises CAD also goes up, as aggregate demand for the currency increases. The opposite is the case if the price of Oil falls. Higher Oil prices also tend to result in a greater likelihood of a positive Trade Balance, which is also supportive of the CAD.
While inflation had always traditionally been thought of as a negative factor for a currency since it lowers the value of money, the opposite has actually been the case in modern times with the relaxation of cross-border capital controls. Higher inflation tends to lead central banks to put up interest rates which attracts more capital inflows from global investors seeking a lucrative place to keep their money. This increases demand for the local currency, which in Canada’s case is the Canadian Dollar.
Macroeconomic data releases gauge the health of the economy and can have an impact on the Canadian Dollar. Indicators such as GDP, Manufacturing and Services PMIs, employment, and consumer sentiment surveys can all influence the direction of the CAD. A strong economy is good for the Canadian Dollar. Not only does it attract more foreign investment but it may encourage the Bank of Canada to put up interest rates, leading to a stronger currency. If economic data is weak, however, the CAD is likely to fall.
In its monthly report published yesterday, OPEC revised its demand forecast downwards for the first time for a while, Commerzbank's commodity analyst Carsten Fritsch notes.
OPEC regains its optimism towards global demand
“According to the report, global oil demand is set to rise by 2.1 million barrels per day this year. This is 135 thousand barrels per day less than in the previous forecast. For 2025, OPEC continues to expect an increase in demand of 1.8 million barrels per day. The forecast reduction is primarily due to a weak first quarter, which was reduced by 400 thousand barrels per day.”
“In contrast, the corrections in the other quarters were noticeably smaller. Despite the forecast reduction, OPEC remains significantly more optimistic about demand than other market observers. The IEA confirmed today that it only expects demand to rise by slightly less than 1 million barrels per day this year and next.”
“If the estimated call on OPEC+ is compared with current OPEC+ production, the oil market will remain significantly undersupplied according to OPEC's forecast, even if the voluntary production cuts by some OPEC+ countries are gradually reversed from October as intended. However, despite the downward revision, we believe that OPEC's demand forecast is still far too optimistic and that the estimated call on OPEC+ is therefore too high.”
The Pound Sterling (GBP) picked up —briefly—in response to this morning’s UK labour market data. Unemployment fell unexpectedly in June, dropping to 4.2% (versus and expected rise to 4.5%, from May’s 4.4%).
A break above 1.2850/00 is possible
“Wage data was largely in line with forecasts though. Average weekly earnings eased to 4.5% in the June quarter over last year (from 5.7%), a little lower than expected, while ex-bonus pay remains relatively elevated, gaining 5.4% in the period (down from a revised 5.8% in May).”
“Cable has given back all of the gains made on the data at writing but a September BoE rate cut remains unlikely (swaps are pricing in 8-9bps of easing risk). BoE Governor Mann commented in the FT Monday that wage growth was still a worry for inflation. Mann voted to hold rates at the policy meeting earlier this month when the MPC narrowly voted in favour of a cut.”
“The GBP gave back earlier gains easily but the broader technical undertone for Cable remains positive following the development of the noted bull reversal off the 200-day MA (1.2667) test last week. Corrective gains are stalling around retracement resistance at 1.2810 but an advance through the low 1.28s should see Cable push on to test 1.2850/00.”
Silver prices (XAG/USD) fell on Tuesday, according to FXStreet data. Silver trades at $27.71 per troy ounce, down 0.98% from the $27.98 it cost on Monday.
Silver prices have increased by 16.45% since the beginning of the year.
| Unit measure | Silver Price Today in USD |
|---|---|
| Troy Ounce | 27.71 |
| 1 Gram | 0.89 |
The Gold/Silver ratio, which shows the number of ounces of Silver needed to equal the value of one ounce of Gold, stood at 89.02 on Tuesday, up from 88.38 on Monday.
Silver FAQs
Silver is a precious metal highly traded among investors. It has been historically used as a store of value and a medium of exchange. Although less popular than Gold, traders may turn to Silver to diversify their investment portfolio, for its intrinsic value or as a potential hedge during high-inflation periods. Investors can buy physical Silver, in coins or in bars, or trade it through vehicles such as Exchange Traded Funds, which track its price on international markets.
Silver prices can move due to a wide range of factors. Geopolitical instability or fears of a deep recession can make Silver price escalate due to its safe-haven status, although to a lesser extent than Gold's. As a yieldless asset, Silver tends to rise with lower interest rates. Its moves also depend on how the US Dollar (USD) behaves as the asset is priced in dollars (XAG/USD). A strong Dollar tends to keep the price of Silver at bay, whereas a weaker Dollar is likely to propel prices up. Other factors such as investment demand, mining supply – Silver is much more abundant than Gold – and recycling rates can also affect prices.
Silver is widely used in industry, particularly in sectors such as electronics or solar energy, as it has one of the highest electric conductivity of all metals – more than Copper and Gold. A surge in demand can increase prices, while a decline tends to lower them. Dynamics in the US, Chinese and Indian economies can also contribute to price swings: for the US and particularly China, their big industrial sectors use Silver in various processes; in India, consumers’ demand for the precious metal for jewellery also plays a key role in setting prices.
Silver prices tend to follow Gold's moves. When Gold prices rise, Silver typically follows suit, as their status as safe-haven assets is similar. The Gold/Silver ratio, which shows the number of ounces of Silver needed to equal the value of one ounce of Gold, may help to determine the relative valuation between both metals. Some investors may consider a high ratio as an indicator that Silver is undervalued, or Gold is overvalued. On the contrary, a low ratio might suggest that Gold is undervalued relative to Silver.
(An automation tool was used in creating this post.)
- Producer inflation in the US rose at a softer pace than expected in July.
- US Dollar Index stays near 103.00 following the PPI data.
The Producer Price Index (PPI) for final demand in the US rose 2.2% on a yearly basis in July, the data published by the US Bureau of Labor Statistics showed on Tuesday. This reading followed the 2.7% increase recorded in June and came in below the market expectation of 2.3%.
The annual core PPI rose 2.4% in the same period, falling short of analysts' estimate of 2.7%. On a monthly basis, the PPI increased 0.1%, while the core PPI remained unchanged.
Market reaction
The US Dollar Index showed no reaction to these data and was last seen moving sideways slightly above 103.00.
This week’s slew of US data releases and next week’s Jackson Hole event should leave the market better informed about the potential reaction functions of US policymakers, though our central view is that the Fed will lower rates by 25 bps in September and again before the end of the year, Rabobank’s FX senior FX strategist Jane Foley notes.
Expect a move lower to 142 on a 6-month view
“If this week’s US data releases offer more reassurances that the US economy is only slowing moderately and the Fed is not behind the curve, the USD may benefit from a little additional relief. That said, at the same time, Harris’ performance in US political opinion polls suggest more reason for investors to hesitate with respect to ‘Trump trades’.”
“If Trump’s advantage in the polls continues to slip, this could lessen the USD’s potential in the weeks ahead. On August 6 we wrote that ‘we would expect the market to return to the business of evaluating fundamentals. In our view this will likely start with a recovery in the value of the USD over the coming days, though we expect that USD/JPY can still trend lower on a 3-to-6-month view’.”
“We adhere to that view, though the USD’s near-term adjustment may have now mostly run its course. USD/JPY looks to be carving out a new range, potentially in the 146/148 area in the coming weeks. We expect a move lower to 142 on a 6-month view, which would roughly coincide with expectations regarding the timing of the next BoJ rate hike.”
Germany’s ZEW Investor Expectations Survey fell to 19.2 in August, weaker than expected and well down from July’s 41.8 read, Scotiabank’s chief FX strategist Shaun Osborne notes.
Bulls strive to break above 1.0950
“The survey was conducted through the recent market volatility, so a weak number is not too surprising. EUR/USD was edging lower ahead of the data and hit the intraday low in the low 1.09s around the ZEW release before steadying. The Euro (EUR) remains well-supported on dips and more range trading appears likely for now.”
“Spot is holding a trading range bound by support at 1.0875 and resistance at 1.0950. Trend momentum is neutral on the intraday chart but the EUR retains a positive undertone on the longer run studies, keeping direction risks tilted towards renewed gains—eventually.”
The Czeck koruna rallied on Tuesday after July CPI surprised to the upside. The magnitude of inflation upside was, however, quite modest: 2.2%y/y vs. 2.0%y/y expected. The month-on-month rate of change was sharper (0.7%), but this rate of change works out to a more modest 0.5% m/m after seasonal-adjustment. The 0.5% m/m follows a flat reading in May and a -0.3% m/m decline in June; the exponentially smoothed month-on-month rate of change reached 0.23% in July, Commerzbank’s FX analyst Tatha Ghose notes.
Data may be considered mildly FX-positive
“In short, the trend is not worrying at all, although the July data reversed the extreme dovish readings of the prior two months. We view these variations to represent mainly statistical noise plus some minor administrative and other seasonal changes.”
“In terms of the National Bank’s (CNB’s) rate cuts, we do not think that this changes the practical picture much – CNB will still likely cut the rate in 25bp steps at forthcoming meetings. Perceptions had become somewhat extreme that rates might be cut to quite a low level by the end of the year – for example, to 3.00% – such expectations will probably now be removed from the market.”
“From a practical standpoint, we think that the data will strengthen CNB’s ability to justify an end to rate cuts when it finds appropriate. Hence, the data may be considered mildly FX-positive, in line with the market reaction.”
- Oil price extends gains after some small profit taking during the Asian trading hours.
- Traders sent crude prices up near 3% on Monday even as the OPEC report cut the demand outlook.
- The US Dollar Index trades at the pivotal 103.18 level after being glued to it since last week.
Oil continues is winning streak for a fifth consecutive trading session after prices jumped substantially on Monday despite the bearish demand outlook from OPEC. The International Energy Agency (IEA) is following that narrative, pointing to the risk of a substantial surplus while OPEC is set to let loose of its production cuts. Still, geopolitical tensions over an immediate attack from Iran to Israel keep prices supported, and traders seem to be betting on OPEC deepening their production cuts to further support the black gold.
The US Dollar Index (DXY), which tracks the performance of the US Dollar against six major currencies, is getting torn between two major forces this Tuesday on the quote board. On the one hand, the much battered carry trades from last week are making a comeback against the US Dollar. On the other side, the Greenback itself is outpacing the Japanese Yen (JPY). This results in a near standstill in the DXY US Dollar Index chart ahead of Tuesday’s US Producer Price Index (PPI) numbers and Wednesday’s Consumer Price Index (CPI) release.
At the time of writing, Crude Oil (WTI) trades at $78.25 and Brent Crude at $81.40.
Oil news and market movers: OPEC, IEA agree on bearish outlook
- The monthly IEA report shows that OPEC output rose by 250,000 barrels per day against previous month. Saudi Arabia and Iraq were the main drivers for the additional output.
- Even if OPEC cancels its plans to hike production back to normal, inventories will accumulate next year by 920,000 barrels a day amid booming supplies from the US, Guyana and Brazil, according to the IEA.
- Reuters reports ahead of the numbers from the American Petroleum Institute (API) that the US reserves should be depleted with summer demand having peaked by now.
- The weekly Crude Oil Stock print will be released by the American Petroleum Institute at 20:30 GMT. The previous number showed a marginal build of only 180,000 barrels.
Oil Technical Analysis: Risk of rejection
Oil price is shooting for the stars since Monday. The fact that both OPEC and the IEA are seeing substantial supply surplus at hand has traders doubling down on changes from OPEC, away from its commitment to reduce production limitations. Instead, more output might be needed, with risk of a split division within OPEC again.
On the upside, two other major moving averages are very close, with the 55-day Simple Moving Average (SMA) at $78.56 and the 100-day SMA at $79.83. If that 100-day SMA gets cleared, the $80 area opens up with an ultimate profit target level at around $87.12.
On the downside, the 200-day SMA came in for support on some profit taking in Asia at $77.69. Should price action slide back below it, a quick dip to $75.27 could be in the cards in a washout of this rally. A full unwind back to the start of the rally near $72.00 is possible in case of some bearish headlines or catalyst.
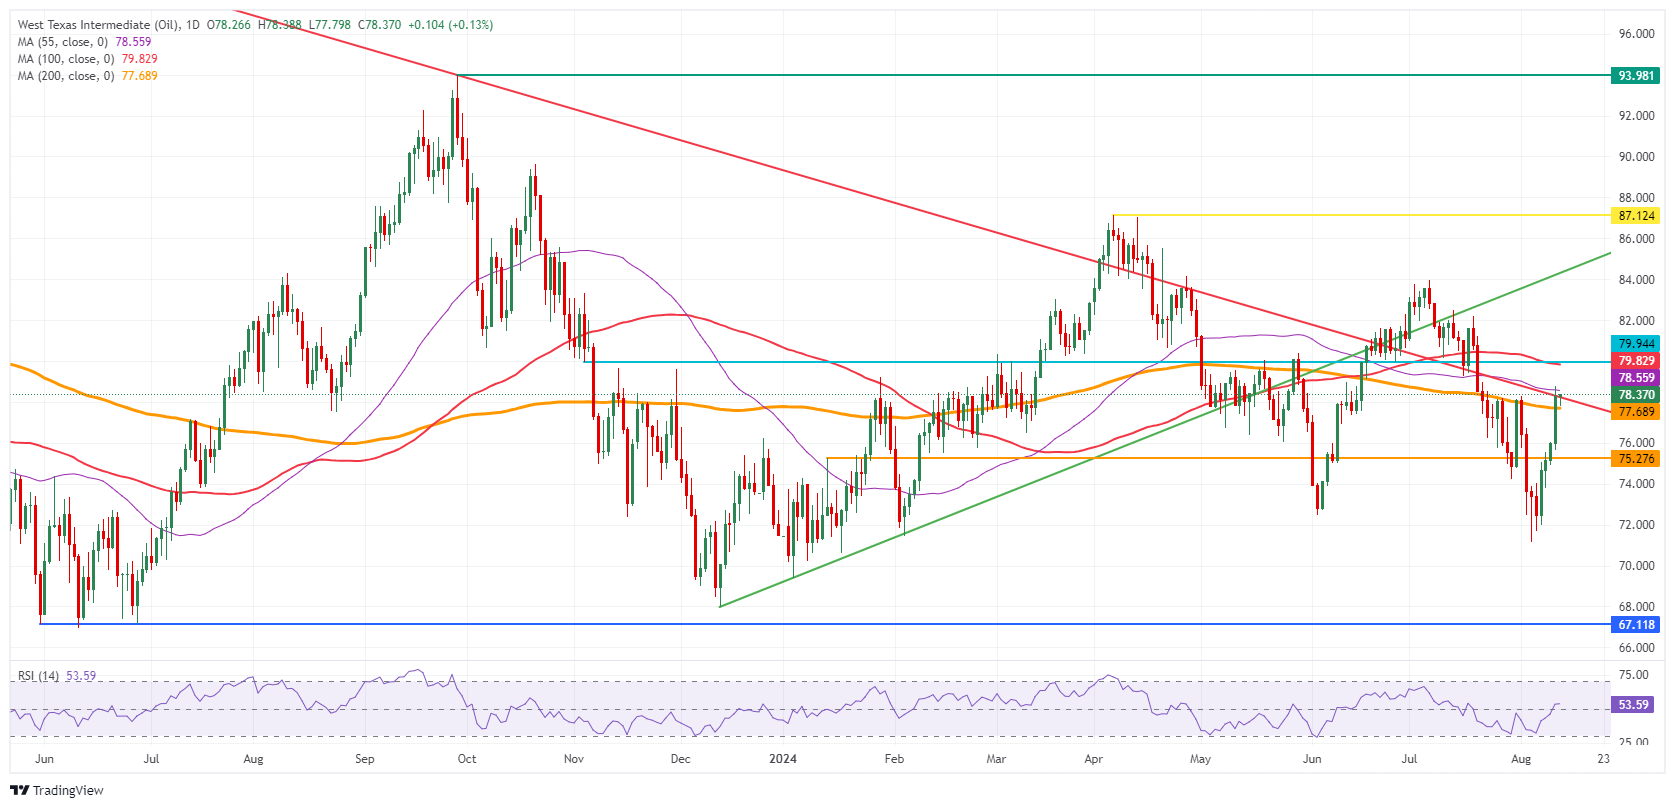
US WTI Crude Oil: Daily Chart
WTI Oil FAQs
WTI Oil is a type of Crude Oil sold on international markets. The WTI stands for West Texas Intermediate, one of three major types including Brent and Dubai Crude. WTI is also referred to as “light” and “sweet” because of its relatively low gravity and sulfur content respectively. It is considered a high quality Oil that is easily refined. It is sourced in the United States and distributed via the Cushing hub, which is considered “The Pipeline Crossroads of the World”. It is a benchmark for the Oil market and WTI price is frequently quoted in the media.
Like all assets, supply and demand are the key drivers of WTI Oil price. As such, global growth can be a driver of increased demand and vice versa for weak global growth. Political instability, wars, and sanctions can disrupt supply and impact prices. The decisions of OPEC, a group of major Oil-producing countries, is another key driver of price. The value of the US Dollar influences the price of WTI Crude Oil, since Oil is predominantly traded in US Dollars, thus a weaker US Dollar can make Oil more affordable and vice versa.
The weekly Oil inventory reports published by the American Petroleum Institute (API) and the Energy Information Agency (EIA) impact the price of WTI Oil. Changes in inventories reflect fluctuating supply and demand. If the data shows a drop in inventories it can indicate increased demand, pushing up Oil price. Higher inventories can reflect increased supply, pushing down prices. API’s report is published every Tuesday and EIA’s the day after. Their results are usually similar, falling within 1% of each other 75% of the time. The EIA data is considered more reliable, since it is a government agency.
OPEC (Organization of the Petroleum Exporting Countries) is a group of 13 Oil-producing nations who collectively decide production quotas for member countries at twice-yearly meetings. Their decisions often impact WTI Oil prices. When OPEC decides to lower quotas, it can tighten supply, pushing up Oil prices. When OPEC increases production, it has the opposite effect. OPEC+ refers to an expanded group that includes ten extra non-OPEC members, the most notable of which is Russia.
The Canadian Dollar (CAD) is little changed and continues to hold its established range, Shaun Osborne chief FX strategist notes.
Spot continues to hold around support in the low 1.37s
“Solid gains in crude are giving Canadian terms of trade a boost which should be a modest positive for the currency at least—and help keep USDCAD’s fair value estimate tracking slightly lower (to 1.3650 by our estimate this morning).”
“Whether the CAD can take advantage remains to be seen, with external drivers (the broader USD tone, risk appetite) remaining important influences on spot trends and sentiment for now. Positioning (IMM data reflect a still very large net short CAD position) remains a potential positive for the CAD.”
“Spot continues to hold around support (retracement, 40-day MA) in the low 1.37s. While short-term momentum remains USD bearish, the CAD’s failure to make more progress (towards 1.3675) might start to weigh against a further drop in spot in the short run. Resistance is 1.3765/75.”
The Reserve Bank of New Zealand will decide on its key interest rate tonight or, more precisely, early Wednesday morning. The current policy rate level of 5.5% has been in place since last May and is the highest since 2008, Commerzbank’s FX analyst Volkmar Baur notes.
All eyes on RBNZ
“According to Bloomberg, nine out of 23 analysts surveyed expect the RBNZ to begin a rate cut cycle, while the market is pricing in a 60% chance of a 25 basis point cut tomorrow. And there are good reasons for that. Economic indicators such as the PMI have been rather weak of late. Consumer confidence has fallen sharply and the construction sector remains under pressure. However, a survey last week provided maybe the best reason.”
“It showed that inflation expectations for next year and 2026 have fallen, the latter even to 2.03%, back to the central bank's target. However, all this is countered by the labor market, which remains very robust, with wage growth still above 4%. This is also likely to be a key reason why inflation itself is still around 4% year over year, while the inflation momentum is not much lower. All in all, the RBNZ should err on the side of caution.”
“Whether it cuts tomorrow or prefers to wait until October, we expect the RBNZ to be more dovish than the Reserve Bank of Australia. But the market is already pricing this in. Eight rate cuts are expected for New Zealand between now and July next year, compared with just three for Australia. If the difference is not as pronounced as currently priced, this would support the Kiwi against the Aussie.”
- AUD/USD stays in positive territory after Australian data indicates economy remains strong.
- Australian business and consumer sentiment remain elevated and wage rises continue apace.
- The data suggests the Reserve Bank of Australia will keep interest rates high until 2025, supporting AUD.
AUD/USD is trading marginally higher on Tuesday, exchanging hands in the 0.6590s during the European session. The pair has seen gains following the release of a slew of Australian economic sentiment and employment data during the Asian session.
The data which included the Westpac-Melbourne Institute Consumer Sentiment Index and the NAB Business Confidence Index showed confidence remaining robust with families and businesses overall optimistic about the outlook.
The Westpac-Melbourne index showed that the “family finances vs a year ago” sub-index surged 11.7% to a two-year top of 70.9 and Matthew Hassan, Senior Economist at Westpac commented “Consumers breathed a small sigh of relief."
The NAB confidence data showed an improvement in the employment situation.
“We were concerned about the sharp decline in the employment index, but it jumped back to an above-average level this month, suggesting the robust jobs growth is continuing for now," said NAB Chief Economist Alan Oster.
The Australian Wage Price Index data meanwhile showed a marginal slowdown to 0.8% on a QoQ when it had been expected to remain at 0.9%. It held steady at 4.1% YoY, however. The stubborn wage inflation was mainly put down to the effect of new regulations coming into force protecting public-sector worker pay.
"By contrast, private-sector wages rose by 0.7% q/q in Q2, marking a slowdown from the 0.9% rise in Q1,” says Abhijit Surya, Australia and New Zealand Economist, for Capital Economics.
“With job mobility easing, the slowdown in private-sector wage growth should continue apace,” she added.
Yet despite the slow decline in wages, Capital’s pessimism around the outlook for “productivity growth” means it sees the RBA erring on the side of caution and holding off on cutting rates until Q2 2025. This gives the Australian Dollar a strong foundation across pairs.
The US Dollar (USD), meanwhile, is edging higher according to the US Dollar Index (DXY) ahead of key inflation data from the US in the form of the Producer Price Index (PPI) for July. The PPI is a measure of “factory-gate” wholesale price inflation. If higher-than-expected it might be expected to filter through into higher prices in shops. This, in turn, could keep interest rates elevated in the US.
The data, along with Consumer Price Index data on Wednesday will provide greater clarity on inflationary forces in the economy and therefore the future trajectory of interest The Federal Reserve (Fed) is currently expected to cut interest rates by either 0.25% to or 0.50% (to 5.25% or 5.00% respectively) in September, however, the PPI and CPI may modify those expectations.
Last week, demand for safety even took EUR/CHF close to its all-time low. The strength of the Franc poses a dilemma for the Swiss National Bank (SNB). A stronger Franc ensures lower imported inflation, while at the same time it makes exports more expensive for domestic businesses. Little wonder, then, that Swiss exporters last week called on the SNB to counteract the appreciation, Commerzbank’s FX analyst Michael Pfister notes.
Rate cuts are likely to remain the instrument of choice
“The Franc has been appreciating steadily against the Euro for many years. Basically, the SNB can react by cutting interest rates or by buying foreign currencies and selling Swiss Francs. The only option for the time being is to intervene until the next meeting. Some commentators therefore claimed to have seen SNB interventions last week, citing the rise in sight deposits and the CHF movement.”
“Of course, it cannot be completely ruled out that the SNB intervened. However, the movement in EUR/CHF over the past week appears to have been very similar to that in USD-JPY, i.e. it is more likely to have been driven by safe-haven demand than by the SNB. It would also be more difficult to counter a market move in such an environment. It's better to intervene at strategically prudent times, as the Bank of Japan has done recently.”
“In my view, it is still more likely that the SNB will react with a rate cut for the time being. This is supported by the fact that the strength of the Swiss Franc has eased somewhat and EUR/CHF is back to around 0.95. As long as the demand for safe havens does not increase significantly, i.e. the EUR/CHF is not targeting new lows, interest rate cuts are likely to remain the instrument of choice.”
In the past, we have sometimes accused the ECB of being too political. Especially during the eurozone crisis, and goals beyond the legally prescribed focus on monetary policy were shining through. In this sense, too, the Fed could become more like the ECB, or even overtake it by a long way. At least if the ideas of presidential candidate Donald Trump were to become reality, Commerzbank’s Head of FX and Commodity Research Ulrich Leuchtmann notes.
Trump set to be USD-negative
“It seems, Trump advocates a disastrous political influence on the Fed. Because the ability to print money is something very special, experience as a real estate mogul does not help in the job as a central banker. Not a bit. And monetary policy that relies on gut feeling is always and everywhere doomed to failure. I can think of no one less competent to have a say in the formulation of US monetary policy than Donald J. Trump.”
“I believe, there is a residual risk that Trump could fundamentally restructure the institutions of the United States if he takes power. For the US Dollar (USD), the US President having a say in Fed interest rate decisions would be the worst-case scenario. In concrete terms, in such a scenario we are not talking about a few pips of USD weakness (in EUR/USD units), but – at least in the medium term – about tens of big figures."
“Everything inflationary that we are already seeing in the US economy and everything inflationary that a Trump administration would produce on top of that would no longer be USD-positive, but negative. Tariffs, tax cuts, etc. would then be signs of a loss of purchasing power for the USD. And because USD weakness would be inflationary, a spiral of inflation and USD devaluation could easily develop.”
The market does not seem to have fully returned to pre-crisis levels. Fed is now likely to deliver more rate cuts than previously expected. But, the Fed's expectations for December have been revised in recent weeks to be in line with those of the ECB. This is despite the fact that the ECB has already cut rates and the Fed has yet to follow suit. In practice, therefore, the market still expects the Fed to cut rates by 50 basis points at one of the three remaining meetings this year, Commerzbank’s analyst FX analyst Michael Pfister notes.
Three things to note about this development
“As we pointed out several times last week, such a move by the Fed would probably require a (further) weakening of the labor market. Officials are likely to lean towards a 50bp cut only if the labor market continues to weaken in the direction of job losses. If job growth remains moderate, the Fed is more likely to start the rate cut cycle with 25 basis points.”
“The fact that the Fed's and the ECB's rate expectations have converged does not support lower EUR/USD levels for the time being. Apparently, the market no longer believes that the Fed has room to cut rates less sharply. However, this greater room for manoeuvre has been a clearly positive USD signal for a long time. Unless this is corrected, i.e. the Fed's rate expectations fall more sharply than those of the ECB, this is unlikely to change.”
“Finally, the Pound Sterling is enjoying its moment in the sun. Undeterred by the much more pronounced correction in the Fed's and ECB's rate expectations, the BoE is still expected to do much less. We have stressed here several times that the BoE is likely to have less room to cut rates. And the fact that the market seems to be taking a similar view speaks in favour of the pound for the time being.”
- USD/JPY gains to near 148.00 as appeal for the Japanese Yen as safe-haven has diminished.
- The US inflation data will influence market speculation for Fed rate-cut size in September.
- Investors see the US headline and core PPI growing at a slower pace on monthly as well as annual basis.
The USD/JPY pair jumps to near 148.00 in Tuesday’s European session. The asset gains as the Japanese Yen (JPY) weakens due to a sharp decline in safe-haven flows. Investors’ appetite for risky assets has improved as fears of a potential United States (US) recession have diminished significantly.
Worries about US slowdown prompted by weak Nonfarm Payrolls (NFP) report for July. However, a decline in the Initial Jobless Claims for the week ending August 2 suggested that labor market conditions are not as bad as expected.
Meanwhile, the market sentiment is upbeat with US Consumer Price Index (CPI) for July on the horizon. S&P 500 futures have posted decent gains in the European session. The US Dollar Index (DXY), which tracks the Greenback’s value against six major currencies, holds the key support level of 103.00. 10-year US Treasury yields edge higher to near 3.91%.
The US CPI is highly expected to influence market speculation for the Federal Reserve (Fed) interest-rate cuts this year. Currently, financial markets expect that the Fed will start reducing interest rates from the September meeting. However, traders are split about the size of rate reduction. The CME FedWatch tool shows that the likelihood of a 50 basis point (bp) rate reduction is 49.5%.
In today’s session, investors will focus on the US Producer Price Index (PPI) data for July, which will be published at 12:30 GMT. Economists expect that monthly headline PPI barely rose last month. While the core PPI, which excludes volatile food and energy prices, grew at a slower pace of 0.2% from the prior release of 0.4%. The annual headline and core PPI are estimated to have decelerated by three-tenth to 2.3% and 2.7%, respectively.
Japanese Yen FAQs
The Japanese Yen (JPY) is one of the world’s most traded currencies. Its value is broadly determined by the performance of the Japanese economy, but more specifically by the Bank of Japan’s policy, the differential between Japanese and US bond yields, or risk sentiment among traders, among other factors.
One of the Bank of Japan’s mandates is currency control, so its moves are key for the Yen. The BoJ has directly intervened in currency markets sometimes, generally to lower the value of the Yen, although it refrains from doing it often due to political concerns of its main trading partners. The current BoJ ultra-loose monetary policy, based on massive stimulus to the economy, has caused the Yen to depreciate against its main currency peers. This process has exacerbated more recently due to an increasing policy divergence between the Bank of Japan and other main central banks, which have opted to increase interest rates sharply to fight decades-high levels of inflation.
The BoJ’s stance of sticking to ultra-loose monetary policy has led to a widening policy divergence with other central banks, particularly with the US Federal Reserve. This supports a widening of the differential between the 10-year US and Japanese bonds, which favors the US Dollar against the Japanese Yen.
The Japanese Yen is often seen as a safe-haven investment. This means that in times of market stress, investors are more likely to put their money in the Japanese currency due to its supposed reliability and stability. Turbulent times are likely to strengthen the Yen’s value against other currencies seen as more risky to invest in.
- The US Dollar trades broadly unchanged ahead of PPI numbers for July.
- Carry and high-beta currencies are pushing back against the US Dollar.
- The US Dollar index remains glued to the 103.18 pivotal level.
The US Dollar (USD) trades mixed on Tuesday, extending Monday’s little moves, with one single pattern that stands out on the quote board. The hurted carry and high-beta trades that were on the fence last week are currently outperforming against the Greenback, with the Polish Zloty (PLN), Australian Dollar (AUD), New Zealand Dollar (NZD) and Czech Koruna (CZK) as main gainers. Still, these moves are not visible at all in the DXY chart because the US Dollar is outperforming against the Japanese Yen (JPY).
On the economic data front, the calendar is starting to pick up a bit. The Producer Price Index (PPI) will be the main topic for this Tuesday in the run up towards the US Consumer Price Index (CPI) release on Wednesday. Overall, a decline in PPI numbers is expected across the board, reinforcing the thesis that inflation pressures are subsiding.
Daily digest market movers: First data points ahead of CPI
- The NFIB Business Optimism Index for July will be released at 10:00 GMT. Expectations is for a broadly steady 91.7 from the 91.5 reported in June.
- At 12:30 GMT, the US Producer Price Index data for July will be released:
- Monthly headline PPI is expected to increase 0.1%, less than the 0.2% advance seen a month earlier. On year, headline PPI is also anticipated to soften to 2.3% from 2.6%.
- As for the core readings, monthly Core PPI is expected to rise 0.2%, easing from the 0.4% advance a month earlier. Yearly core PPI should slip below 3%, to 2.7%..
- Around 17:15 GMT, Federal Reserve Bank of Atlanta President Raphael Bostic participates in a moderated conversation at the Conference of African American Financial Professionals in Atlanta, United States.
- Equity markets are shooting out of the gates with firm gains in Asia. The Japanese TOPIX and Nikkei index are both closing near 3% in the green. European equities and US futures are taking over the positive sentiment, although posting slightly less gains.
- The CME Fedwatch Tool shows a 52.5% chance of a 25 basis points (bps) interest rate cut by the Fed in September against a 47.5% chance for a 50 bps cut. Another 25 bps cut (if September is a 25 bps cut) is expected in November by 38.5%, while there is a 49.7% chance that rates will be 50 bps below the current levels and and a 11.7% probability of rates being 75 basis points lower.
- The US 10-year benchmark rate trades at 3.91%, easing further away from 4%.
US Dollar Index Technical Analysis: Standstill until Wednesday
The US Dollar Index (DXY) is getting torn between two forces. One element is that the high beta and carry traders are regaining strength after their substantially weak performance since the beginning of August. Though, the US Dollar is gaining against the Japanese Yen in the meantime.The Yen accounts for 13.6% of the DXY against no weighting at all for the Australian Dollar or the Polish Zloty, which paints a standstill picture on the DXY chart.
Still, the first level to recover, which gains importance every day, is 103.18, a level held on August 2 though snapped on August 5 in the Asian hours. Once the DXY closes above that level, next up is 104.00, which was the support from June. If the DXY can return above that level, the 200-day Simple Moving Average (SMA) at 104.15 is the next resistance to look out for.
On the downside, the oversold condition in the Relative Strength Index (RSI) indicator has eased in the daily chart and holds room again for a small leg lower. Support nearby is the March 8 low at 102.35. Once through there, pressure will start to build on 102.00 as a big psychological figure before testing 101.90, which was a pivotal level in December 2023 and January 2024.
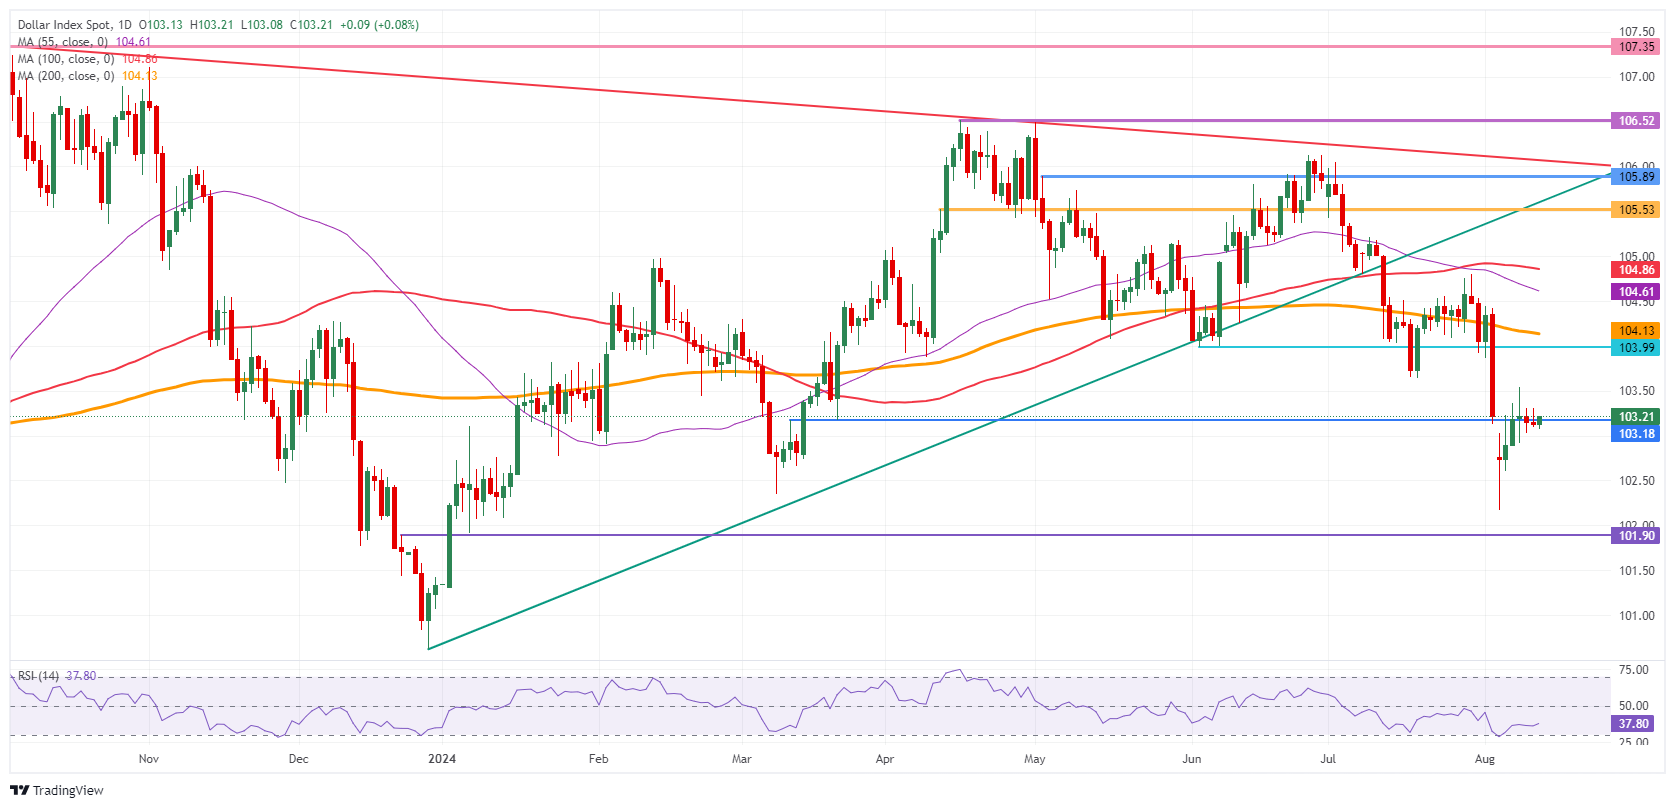
US Dollar Index: Daily Chart
US Dollar FAQs
The US Dollar (USD) is the official currency of the United States of America, and the ‘de facto’ currency of a significant number of other countries where it is found in circulation alongside local notes. It is the most heavily traded currency in the world, accounting for over 88% of all global foreign exchange turnover, or an average of $6.6 trillion in transactions per day, according to data from 2022. Following the second world war, the USD took over from the British Pound as the world’s reserve currency. For most of its history, the US Dollar was backed by Gold, until the Bretton Woods Agreement in 1971 when the Gold Standard went away.
The most important single factor impacting on the value of the US Dollar is monetary policy, which is shaped by the Federal Reserve (Fed). The Fed has two mandates: to achieve price stability (control inflation) and foster full employment. Its primary tool to achieve these two goals is by adjusting interest rates. When prices are rising too quickly and inflation is above the Fed’s 2% target, the Fed will raise rates, which helps the USD value. When inflation falls below 2% or the Unemployment Rate is too high, the Fed may lower interest rates, which weighs on the Greenback.
In extreme situations, the Federal Reserve can also print more Dollars and enact quantitative easing (QE). QE is the process by which the Fed substantially increases the flow of credit in a stuck financial system. It is a non-standard policy measure used when credit has dried up because banks will not lend to each other (out of the fear of counterparty default). It is a last resort when simply lowering interest rates is unlikely to achieve the necessary result. It was the Fed’s weapon of choice to combat the credit crunch that occurred during the Great Financial Crisis in 2008. It involves the Fed printing more Dollars and using them to buy US government bonds predominantly from financial institutions. QE usually leads to a weaker US Dollar.
Quantitative tightening (QT) is the reverse process whereby the Federal Reserve stops buying bonds from financial institutions and does not reinvest the principal from the bonds it holds maturing in new purchases. It is usually positive for the US Dollar.
Headline inflation accelerated in July but lower core and services inflation indicate weak demand, UOB Group economist Ho Woei Chen notes.
July PPI falls at the same pace as June
“Headline inflation accelerated in July at a stronger than expected pace to the fastest in 5 months, but lower core and services inflation indicate weak underlying consumption demand. Meanwhile, producer prices shrank for the 22nd straight month.”
“The headline inflation will continue to be boosted by year-ago low base of comparison and the adverse weather conditions may also contribute to a stronger than expected rebound in food inflation. Meanwhile, PPI deflation is likely to persist through 2024. We maintain our forecasts for CPI at 0.3% and PPI at -1.3% for 2024.”
“Amid further easing by the PBOC, we expect the 1Y loan prime rate (LPR) to fall to 3.20% by end-4Q24 (current 3.35%). We also think there is a possibility of another 50 bps cut to the reserve requirement ratio (RRR) in 2H24.”
The US Dollar (USD) is likely to trade in a sideways range of 7.1700/7.1880. Downward momentum is fading, and the likelihood of USD revisiting the 7.0635 support level has diminished, UOB Group FX strategists Quek Ser Leang and Peter Chia note.
A move below 7.1700 is possible near term
24-HOUR VIEW: “Last Friday, USD traded sideways before closing largely unchanged. Yesterday (Monday), we held the view that ‘further sideways trading seems likely, probably in a range of 7.1620/7.1900.’ Our view of sideways trading was not wrong, even though USD traded in a narrow range of 7.1728/7.1854, again closing largely unchanged (7.1783, +0.05%). The price action provides no fresh clues. Today, we continue to expect USD to trade sideways, likely in a range of 7.1700/7.1880.”
1-3 WEEKS VIEW: “We have held a negative USD view since late last month (as annotated in the chart below). After USD fell sharply to 7.0636 and rebounded, in our update from last Tuesday (06 Aug, spot at 7.1400), we highlighted that ‘while further USD weakness is not ruled out, the low near 7.0635 is solid support now.’ We added, ‘a breach of 7.2000 would mean that the weakness has stabilised.’ USD traded sideways over the past several days, and we noted yesterday (12 Aug, spot at 7.1770) that ‘downward momentum is fading, and the likelihood of USD breaking below 7.0635 has diminished.’ There is no change in our view.”
- The Mexican Peso steadies after Monday’s depreciation.
- The Peso suffered after weak Mexican consumer confidence data and central banker comments weighed.
- US inflation data could cause market volatility if results are unexpected.
The Mexican Peso (MXN) fell over 1.20% in its most traded pairs on Monday after a combination of weak Mexican Consumer Confidence data for July, dovish comments from Mexico’s central bank governor and rising geopolitical concerns weighed.
The Peso is seesawing between mild gains and losses during early trading on Tuesday after a tepid Asian session, which saw confidence return to Japanese stocks, with the Nikkei 225 regaining all the losses from last week’s sell-off.
At the time of writing, one US Dollar (USD) buys 19.00 Mexican Pesos, EUR/MXN trades at 20.75, and GBP/MXN at 24.30.
Mexican Peso falls after weak Consumer data, Banxico comments
The Mexican Peso is trading between mild gains and losses in its key trading pairs on Tuesday as markets return to calm following the dramatic downturns witnessed in the preceding week.
This comes after the Peso lost over a percentage point against its key rivals on Monday in a turnaround from the three days prior when it saw a run-up.
Monday’s pull-back may reflect profit-taking ahead of key US inflation data for July, which will be released on Tuesday (today) in the form of Producer Price Index (PPI), which measures the changes in wholesale “factory-gate” prices, followed by the US Consumer Price Index (CPI) data on Wednesday.
Lower-than-expected inflation in the US will suggest interest rates are coming down more quickly than foreseen, which, in turn, will likely weigh on the US Dollar (USD), pushing USD/MXN down too. The opposite will likely be the case in the event inflation data beat estimates.
The Peso struggled at the start of the week after the release of Mexican Consumer Confidence data for July revealed a fall from the previous month. Confidence dropped to 46.9 from a five-year high of 47.5 in June, according to data from the Instituto Nacional de Estadistica Geografia e Informatica (INEGI), released on Monday.
Comments from the Bank of Mexico (Banxico) Governor, Victoria Rodríguez Ceja, to El Financiero revealed she supported the justification for the bank’s surprise decision to cut interest rates by 0.25% to 10.75% at its August meeting.
Rodríguez Ceja acknowledged that despite headline inflation hitting 5.57%, the decision had been based on core prices decreasing to 4.05% in July, its eighteenth straight month of declines.
“We expect these effects of the shocks that we observe in non-core inflation to be transitory, so we are still expecting headline inflation to return to its target at the same time, at the end of 2025,” Rodriguez Ceja said.
Her tone may suggest the possibility of further cuts to interest rates materializing down the road if core prices continue falling and headline inflation eventually follows suit. This would be expected to probably be negative for the Peso since lower interest rates make it less attractive as a place to park capital by foreign investors.
Technical Analysis: USD/MXN unfolds correction within downmove
USD/MXN recovers after a protracted fall within a rising channel, as shown on the chart below.
USD/MXN 4-hour Chart
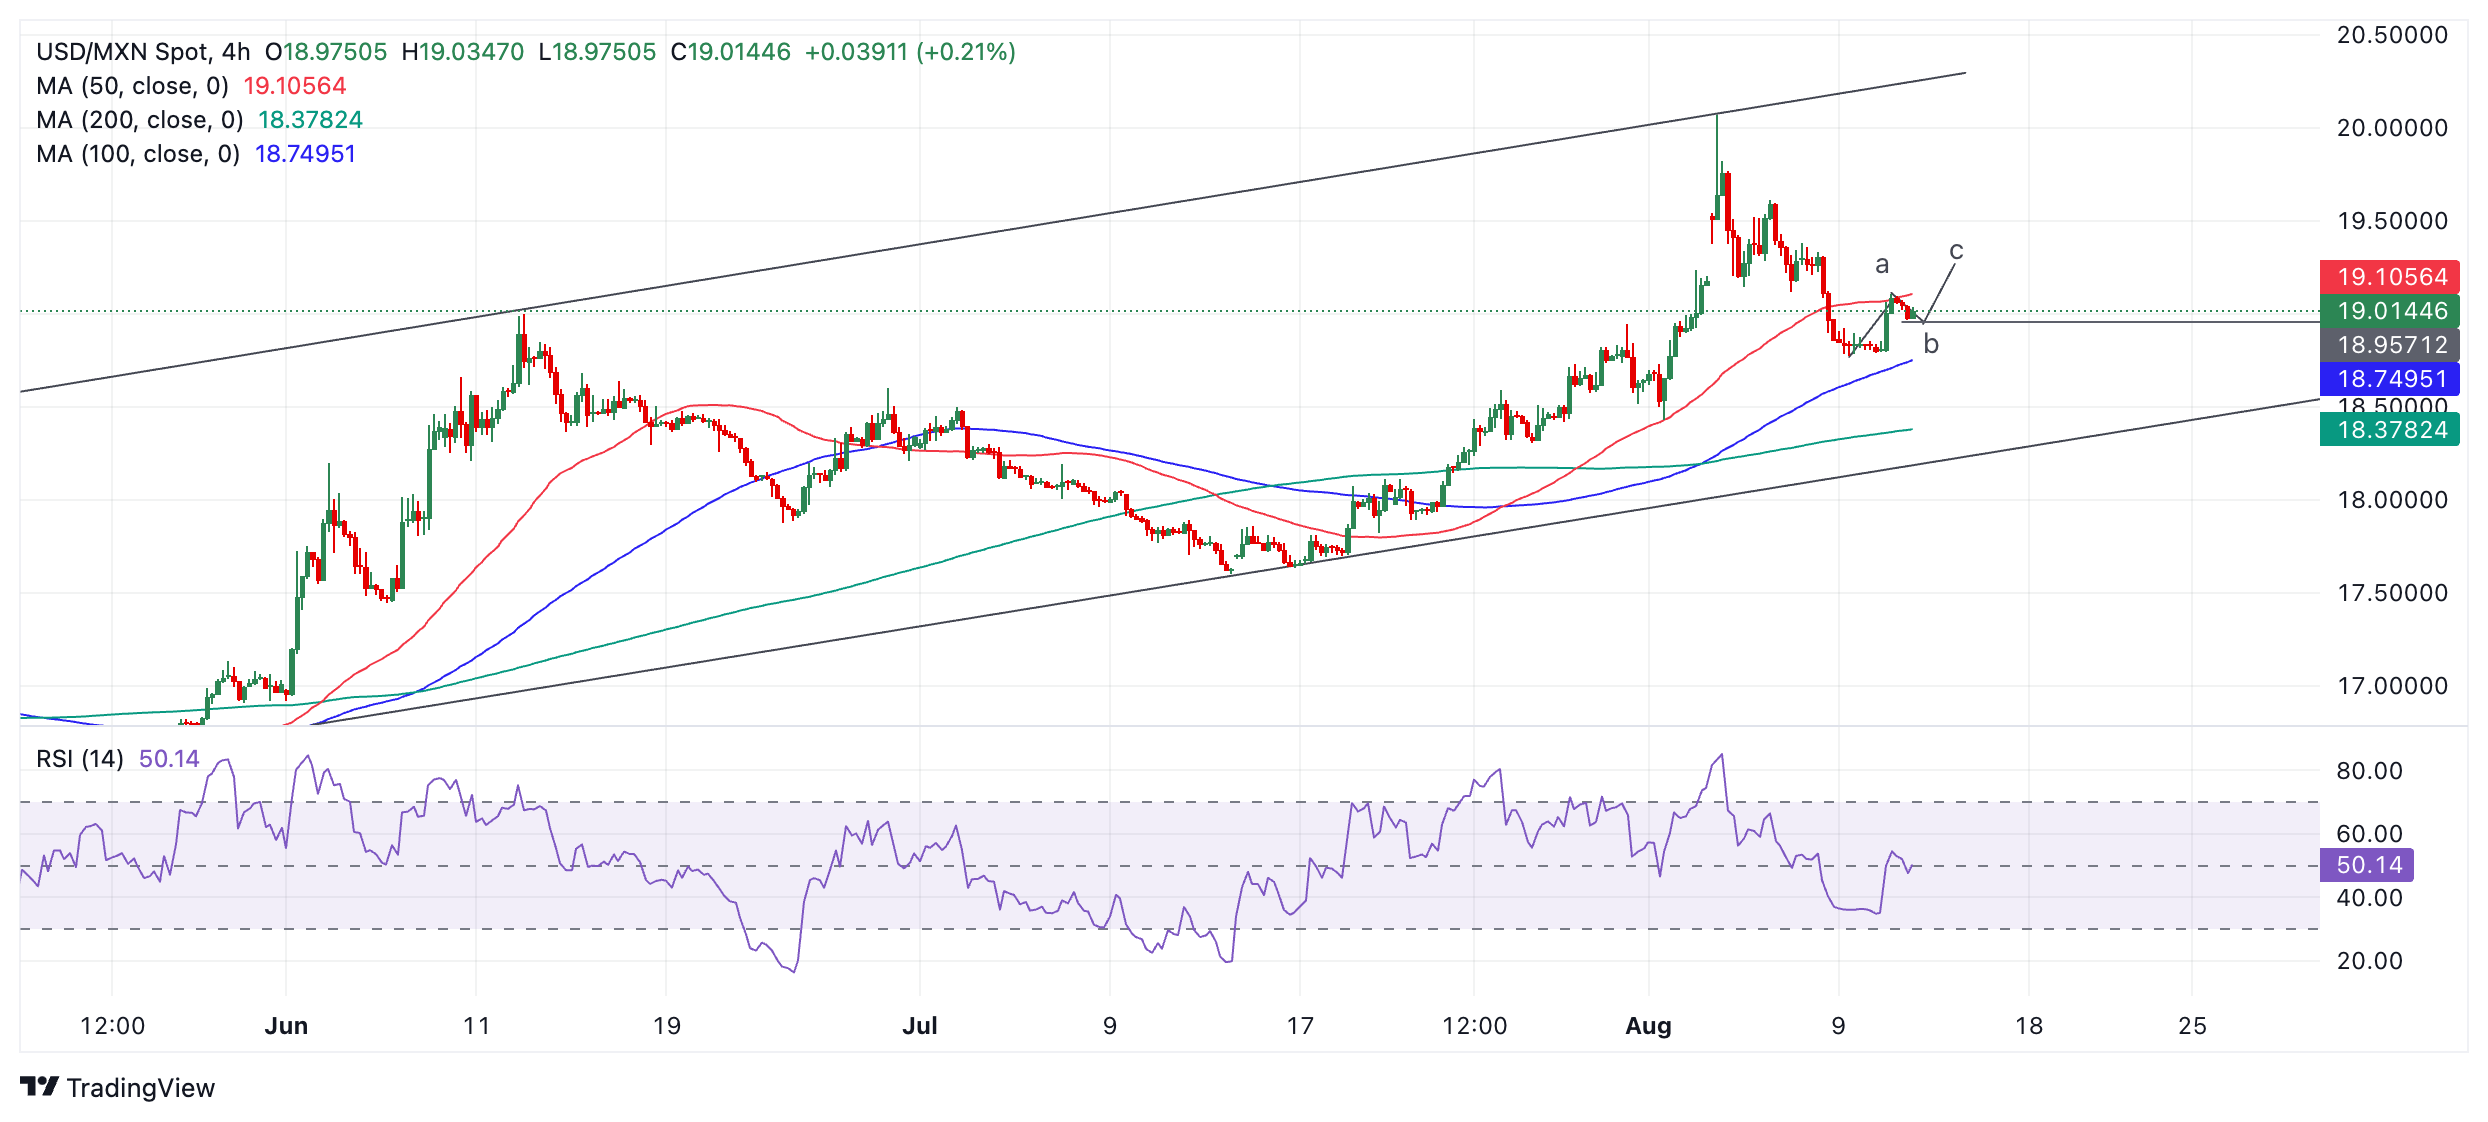
The rebound on Monday looks corrective in nature and, although it will probably stretch a final, third, “c” leg higher to complete an ABC correction, the decline from the top of the channel looks unfinished and is likely to resume again until it reaches the lower channel line at around 18.30. A break back below 18.97 (lows of wave “b”) would provide added confirmation of such a resumption, as would a break below 18.77 (August 9 low).
Such a break lower would probably target 18.35 and the 200-period Simple Moving Average (SMA). The lower channel line will likely provide solid support at roughly 18.30, too.
Economic Indicator
Consumer Confidence s.a
The Consumer Confidence released by INEGI is a leading index that measures the level of consumer confidence in economic activity. A high level of consumer confidence indicates economic expansion while a low level points to a downturn. A high reading is seen as positive (or bullish) for the Mexican Peso, while a low reading is seen as negative (or bearish).
Read more.Last release: Mon Aug 12, 2024 12:00
Frequency: Monthly
Actual: 46.9
Consensus: -
Previous: 47.5
Source: National Institute of Statistics and Geography of Mexico
The US Dollar (USD) is expected to trade in a range, probably between 146.50 and 148.00. Downward momentum is beginning to wane; a breach of 148.30 would mean the weakness in USD has stabilised.
A sustained move towards 148.30 is possible
24-HOUR VIEW: “Yesterday, we expected USD to trade in a range between 146.30 and 147.70. Although USD subsequently traded in a higher range of 146.69/148.22, it closed largely unchanged at 147.19 (-0.06%). There has been no clear increase in either upward or downward momentum. Today, we continue to expect USD to trade in a range, probably between 146.50 and 148.00.”
1-3 WEEKS VIEW: “Our update from yesterday (12 Aug, spot at 146.90) remains valid. As highlighted, downward momentum is beginning to wane, and a breach of 148.30 (no change in ‘strong resistance’ level) would mean that the weakness in USD has stabilised.”
The New Zealand Dollar (NZD) is advancing towards the 0.6055 resistance, UOB Group FX strategists Quek Ser Leang and Peter Chia note.
A test of 0.6055 is possible near term
24-HOUR VIEW: “NZD traded between 0.5991 and 0.6033 yesterday, higher than our expected sideways trading range of 0.5980/0.6020. NZD closed little changed at 0.6018 (+0.05%). Upward momentum has increased, albeit not much. Today, NZD could rise above 0.6035, but it might not be able to maintain a foothold above this level. The major resistance at 0.6055 is unlikely to come into view. Support is at 0.6010, followed by 0.5995.”
1-3 WEEKS VIEW: “We highlighted yesterday (12 Aug, spot at 0.6000) that ‘while NZD could continue to rise, it must break clearly above 0.6035 before an advance to 0.6055 can be expected.’ We also highlighted that ‘the chance of NZD breaking clearly above 0.6035 is not high for now, but it will remain intact as long as 0.5960 (‘strong support’ level previously at 0.5890) is not breached.’ There is no change in our view.”
- USD/CHF marches toward 0.8700 as safe-haven flows to the Swiss Franc have diminished.
- Investors divide over the size of Fed’s interest-rate cuts in September.
- Investors await the US PPI and CPI data for July, which will be published at 12:30 GMT and Wednesday, respectively.
The USD/CHF pair gains to near 0.8675 in Tuesday’s European session. The Swiss Franc asset strengthens as the appeal of the Swiss Franc as a safe-haven asset diminishes due to waning risks of the United States (US) entering a recession.
Fears of a potential US recession faded after upbeat weekly Initial Jobless Claims. Also, the think tank discussed that the Nonfarm Payrolls (NFP) data for July was not as bad as exhibited by sheer sell-off in global equities.
Currently, the market sentiment is cheerful with investors focusing on the US Consumer Price Index (CPI) data for July, which will be published on Wednesday. S&P 500 futures have posted significant gains in the European session. The US Dollar Index (DXY), which tracks the Greenback’s value against six major currencies, edges higher to near 103.25.
The US CPI report is expected to show that annual headline and core inflation, which excludes volatile food and energy prices, decelerated by one-tenth to 2.9% and 3.2%, respectively. Monthly headline and core inflation are estimated to have risen by 0.2%.
The inflation data will provide cues about when and how much the Federal Reserve (Fed) will reduce interest rates this year. Currently, financial markets are divided about the size of interest-rate cut in September. The CME FedWatch tool shows that the likelihood of a 50 basis point (bp) rate reduction is 49.5%.
Before the US CPI data, investors will focus on the Producer Price Index (PPI) report for July, which will be published at 12:30 GMT. Annual headline and core PPI are expected to have decelerated by three-tenth to 2.3% and 2.7%, respectively.
Economic Indicator
Consumer Price Index ex Food & Energy (YoY)
Inflationary or deflationary tendencies are measured by periodically summing the prices of a basket of representative goods and services and presenting the data as the Consumer Price Index (CPI). CPI data is compiled on a monthly basis and released by the US Department of Labor Statistics. The YoY reading compares the prices of goods in the reference month to the same month a year earlier. The CPI Ex Food & Energy excludes the so-called more volatile food and energy components to give a more accurate measurement of price pressures. Generally speaking, a high reading is bullish for the US Dollar (USD), while a low reading is seen as bearish.
Read more.Next release: Wed Aug 14, 2024 12:30
Frequency: Monthly
Consensus: 3.2%
Previous: 3.3%
Source: US Bureau of Labor Statistics
The US Federal Reserve has a dual mandate of maintaining price stability and maximum employment. According to such mandate, inflation should be at around 2% YoY and has become the weakest pillar of the central bank’s directive ever since the world suffered a pandemic, which extends to these days. Price pressures keep rising amid supply-chain issues and bottlenecks, with the Consumer Price Index (CPI) hanging at multi-decade highs. The Fed has already taken measures to tame inflation and is expected to maintain an aggressive stance in the foreseeable future.
- EUR/GBP broke below the nine-day EMA at 0.8539 level, suggesting a short-term bearish trend.
- The momentum indicator 14-day RSI still suggests a bullish bias for the currency cross.
- The 14-day EMA at 0.8520 level could act as immediate support.
EUR/GBP retraces its recent gains from the previous session, trading around 0.8530 during the European hours on Tuesday. The daily chart analysis shows the EUR/GBP cross has broken below the nine-day Exponential Moving Average (EMA) at 0.8539 level, signaling the onset of a bearish trend in the short term.
However, the momentum indicator 14-day Relative Strength Index (RSI) remains above the 50 level, suggesting a bullish bias for the EUR/GBP cross. Further depreciation toward the 50 level would suggest the easing of bullish momentum.
In terms of resistance, the EUR/GBP cross could find an immediate barrier at a three-month high of 0.8624 level marked on August 8, followed by a seven-month high of 0.8644 level recorded on April 23. A break above the latter could strengthen the currency cross to explore the region around the psychological level of 0.8700.
On the downside, the immediate support appears at the 14-day EMA at 0.8520 level, followed by the EUR/GBP cross to test the 50-day EMA at 0.8487 level. A break below this support could suggest a confirmation of a bearish trend, potentially driving the cross toward a throwback support level at 0.8383.
EUR/GBP: Daily Chart
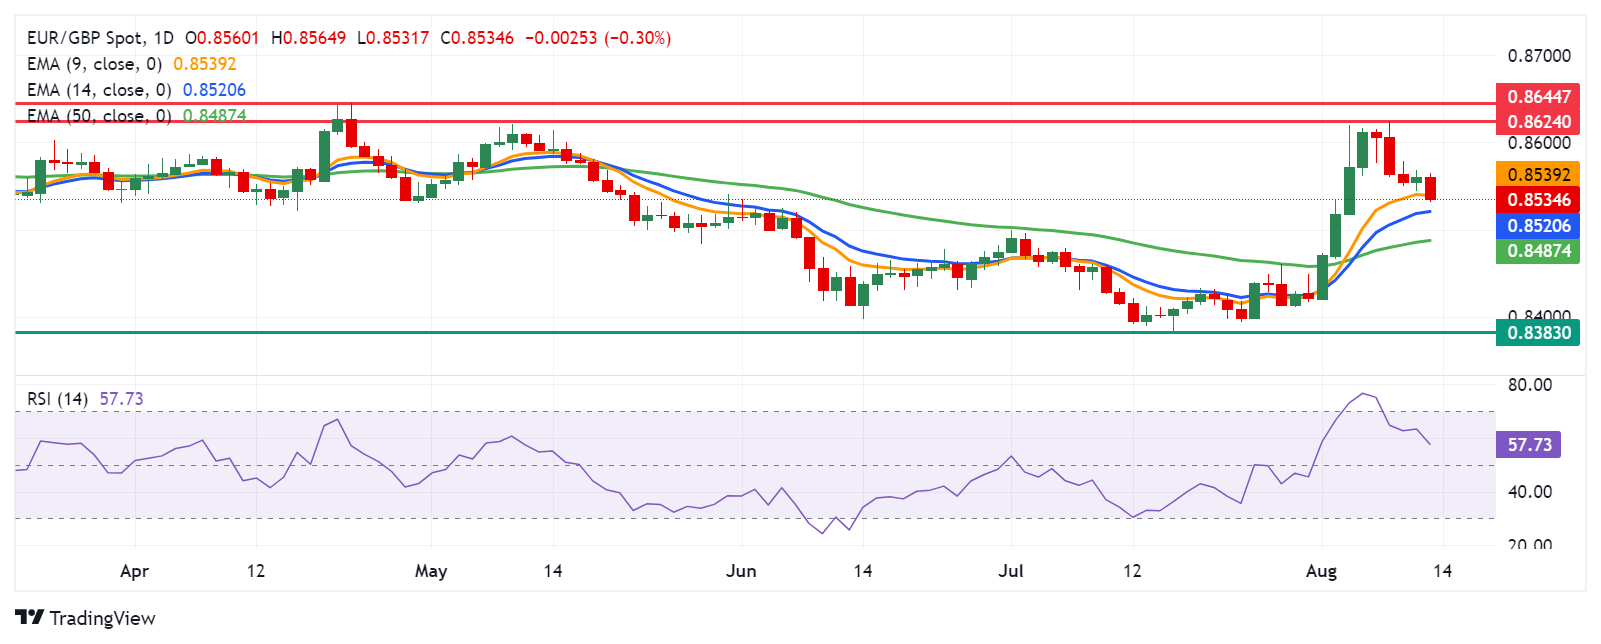
Euro PRICE Today
The table below shows the percentage change of Euro (EUR) against listed major currencies today. Euro was the weakest against the New Zealand Dollar.
| USD | EUR | GBP | JPY | CAD | AUD | NZD | CHF | |
|---|---|---|---|---|---|---|---|---|
| USD | 0.15% | -0.18% | 0.37% | -0.04% | -0.17% | 0.19% | 0.27% | |
| EUR | -0.15% | -0.32% | 0.21% | -0.22% | -0.33% | -0.47% | 0.12% | |
| GBP | 0.18% | 0.32% | 0.55% | 0.12% | -0.01% | -0.13% | 0.47% | |
| JPY | -0.37% | -0.21% | -0.55% | -0.44% | -0.53% | -0.67% | -0.09% | |
| CAD | 0.04% | 0.22% | -0.12% | 0.44% | -0.12% | -0.26% | 0.33% | |
| AUD | 0.17% | 0.33% | 0.00% | 0.53% | 0.12% | -0.11% | 0.47% | |
| NZD | -0.19% | 0.47% | 0.13% | 0.67% | 0.26% | 0.11% | 0.59% | |
| CHF | -0.27% | -0.12% | -0.47% | 0.09% | -0.33% | -0.47% | -0.59% |
The heat map shows percentage changes of major currencies against each other. The base currency is picked from the left column, while the quote currency is picked from the top row. For example, if you pick the Euro from the left column and move along the horizontal line to the US Dollar, the percentage change displayed in the box will represent EUR (base)/USD (quote).
There has been a slight increase in momentum; The Australian Dollar (AUD) must break clearly above 0.6600 before further advance towards 0.6660 can be expected, UOB Group FX strategists Quek Ser Leang and Peter Chia note.
The next level to watch is 0.6660
24-HOUR VIEW: “Yesterday, we expected AUD to consolidate between 0.6545 and 0.6595. However, AUD traded in a higher range of 0.6565/0.6505, closing slightly lower at 0.6586 (-0.10%). The price action did not result in any increase in either downward or upward momentum. Today, we expect AUD to trade sideways, probably in a range of 0.6560/0.6600.”
1-3 WEEKS VIEW: “We continue to hold the same view as yesterday (12 Aug, spot at 0.6570). As highlighted, the recent price action has resulted in a slight increase in momentum, but not sufficiently enough to suggest the start of a sustained advance. Overall, AUD must break and remain above 0.6600 before further advance can be expected. The chance of AUD breaking clearly above 0.6600 will increase in the next few days provided that 0.6520 (‘strong support’ level was at 0.6510 yesterday) is not breached. Looking ahead, if AUD breaks clearly above 0.6600, the next level to watch is 0.6660.”
- Germany’s ZEW Economic Sentiment Index slides to 19.2 in August.
- EUR/USD eases toward 1.0900 after German and Eurozone ZEW surveys.
The headline German ZEW Economic Sentiment Index dropped sharply from 41.8 in July to 19.2 in August, missing the market consensus of 38.0.
The Current Situation Index, however, worsened from -68.9 in July to -77.3 in the eighth month of the year.
The Eurozone ZEW Economic Sentiment Index came in at 17.9 in August, sharply lower than the July reading of 43.7. The data fell short of the market expectation of 35.4.
Key points
Economic outlook for Germany is breaking down.
In the current survey, we observe the strongest decline of the economic expectations over the past two years.
Economic expectations for the eurozone, the US and China also deteriorate markedly.
As a result, especially the expectations for export-intensive german sectors decline.
It is likely that economic expectations are still affected by high uncertainty.
Most recently, this uncertainty expressed itself in a turmoil on international stock markets.
Market reaction
The EUR/USD pair is feeling the pull of gravity on discouraging German and Eurozone ZEW surveys. The pair is losing 0.14% on the day to trade near 1.0915, at the press time.
- AUD/USD prolongs its one-week-old uptrend and climbs to a three-week top on Tuesday.
- The RBA’s hawkish tilt remains supportive amid subdued USD demand ahead of US PPI.
- The technical setup favors bulls and supports prospects for a further appreciating move.
The AUD/USD pair attracts some follow-through buying for the second successive day on Tuesday and climbs to a fresh three-week top during the early part of the European session. Spot prices currently trade around the 0.6600 mark, with bulls looking to build on the momentum beyond the very important 200-day Simple Moving Average (SMA) resistance.
Against the backdrop of the Reserve Bank of Australia's (RBA) hawkish stance, a stable performance across the global equity markets is seen lending some support to the risk-sensitive Australian Dollar (AUD). The US Dollar (USD), on the other hand, struggles to gain any meaningful traction amid expectations for bigger interest rate cuts by the Federal Reserve (Fed). This turns out to be another factor acting as a tailwind for the AUD/USD pair, though the upside potential seems limited ahead of the crucial US inflation figures.
From a technical perspective, sustained strength and acceptance beyond the 200-day SMA hurdle would be seen as a fresh trigger for bullish traders and pave the way for a further appreciating move. Given that oscillators on the daily chart have just started moving in positive territory, the AUD/USD pair might then climb to the 0.6655 intermediate hurdle en route to the 0.6675-0.6680 region and the 0.6700 mark. The latter coincides with the 78.6% Fibonacci retracement level of the July-August fall and should act as a pivotal point.
On the flip side, the 0.6575-0.6570 area, or the 50% Fibo. level now seems to have emerged as an immediate support. This is followed by support near the 0.6545 horizontal zone, the 38.2% Fibo. level near the 0.6520 region, and the 0.6500 psychological mark. Some follow-through buying will suggest that the latest recovery move from the YTD low has run its course and drag the AUD/USD pair to the 0.6435 intermediate support en route to the 0.6400 mark and last week's swing low, around the 0.6350-0.6345 region.
AUD/USD daily chart
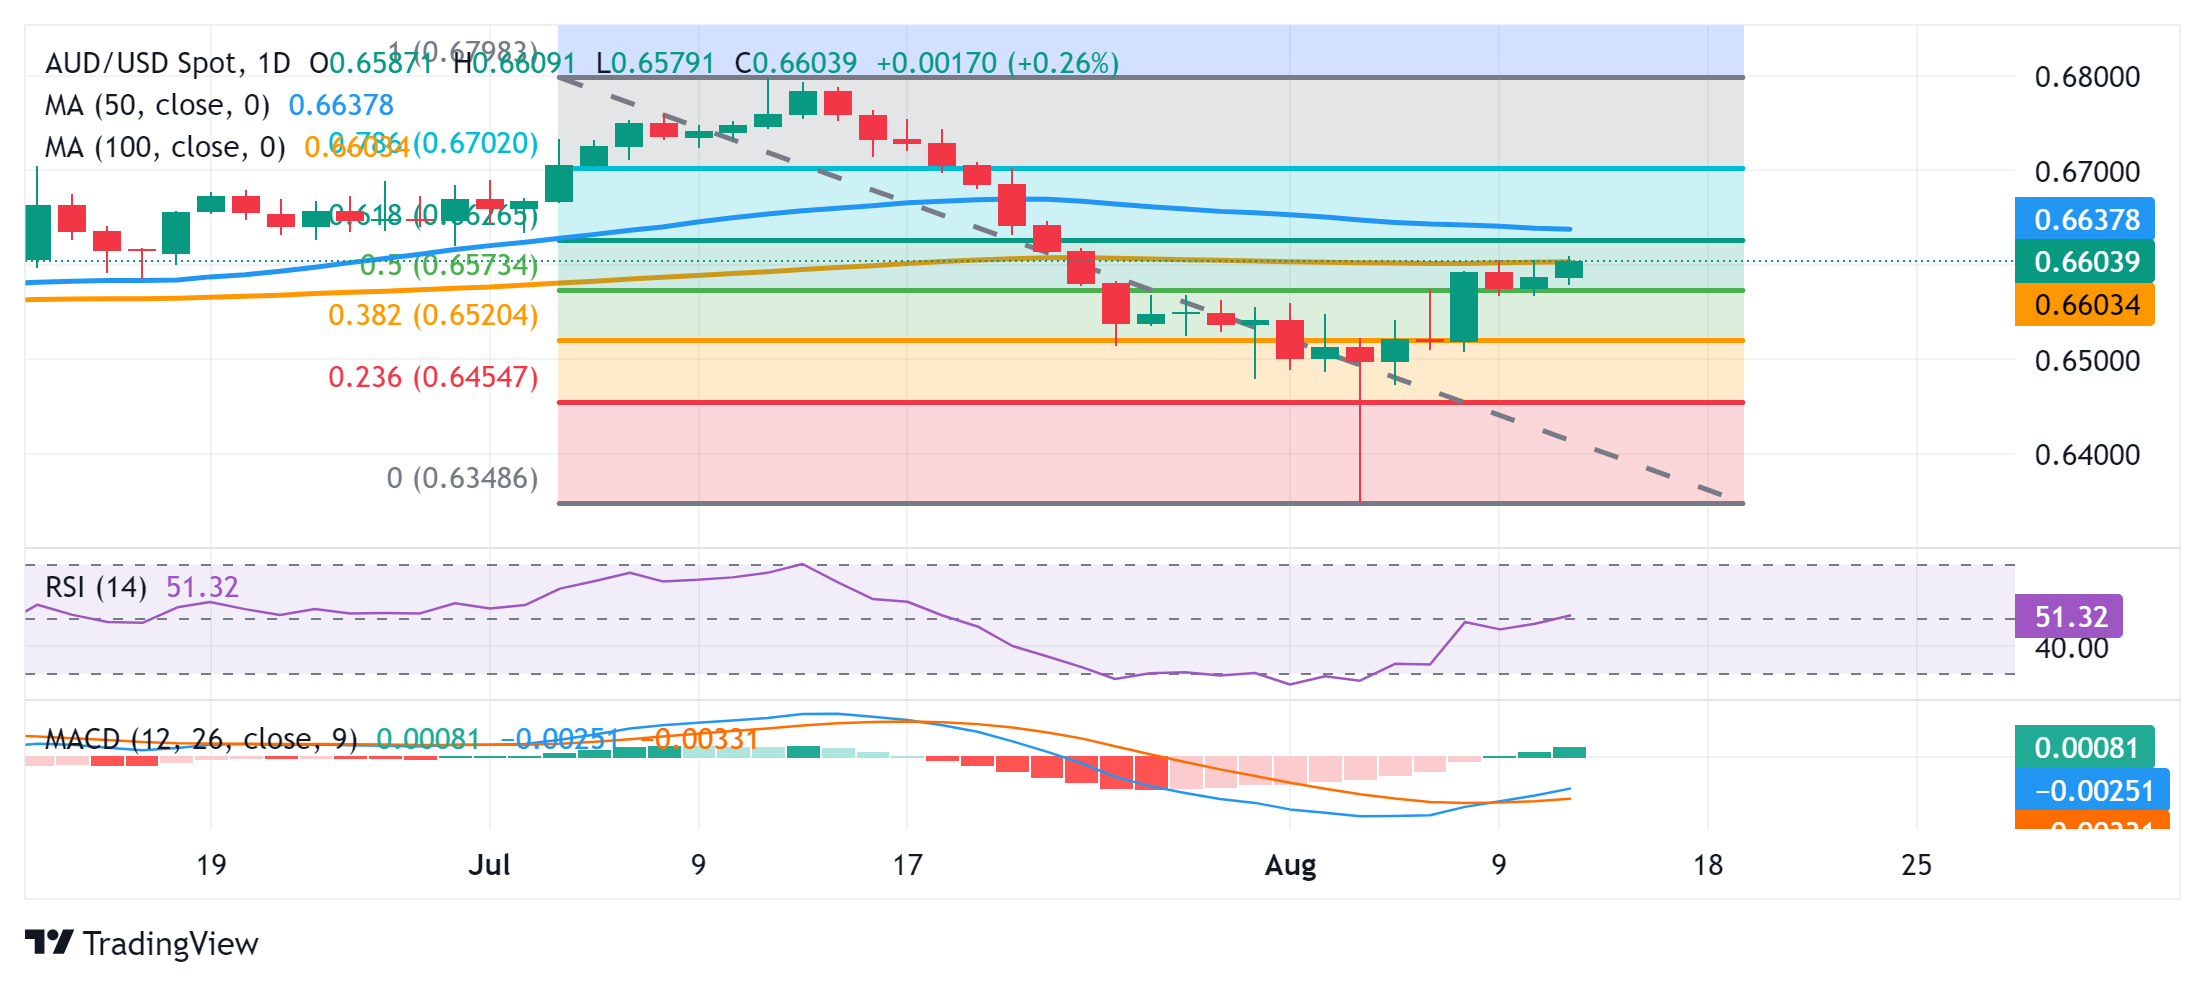
Economic Indicator
Producer Price Index (YoY)
The Producer Price Index released by the Bureau of Labor statistics, Department of Labor measures the average changes in prices in primary markets of the US by producers of commodities in all states of processing. Changes in the PPI are widely followed as an indicator of commodity inflation. Generally speaking, a high reading is seen as positive (or bullish) for the USD, whereas a low reading is seen as negative (or bearish).
Read more.Next release: Tue Aug 13, 2024 12:30
Frequency: Monthly
Consensus: 2.3%
Previous: 2.6%
Source: US Bureau of Labor Statistics
The Pound Sterling (GBP) is expected to trade sideways between 1.2740 and 1.2800. GBP weakness from late last month has stabilised; for the time being, it is expected to trade between 1.2700 and 1.2850, UOB Group FX strategists Quek Ser Leang and Peter Chia note.
A move above 1.2800 is on the cards
24-HOUR VIEW: “Our view for GBP to drift lower yesterday was incorrect. Instead of drifting lower, it traded in a range of 1.2747/1.2794 before settling modestly higher at 1.2766 (+0.11%). The price action did not result in any clear increase in upward momentum. Today, we expect GBP to trade sideways, probably between 1.2740 and 1.2800.”
1-3 WEEKS VIEW: “We turned negative in GBP late last month (see annotations in the chart below). Last Thursday (08 Aug), GBP fell to a low of 1.2665 before rebounding. Yesterday (12 Aug, spot at 1.2750), we indicated that ‘while our 'strong resistance’ level at 1.2780 has not been breached yet, downward momentum has eased considerably, and the chance of GBP dropping below 1.2665 is low.’ GBP then breached 1.2780, reaching a high of 1.2794. The price action indicates that the weakness in GBP from late last month has stabilised. GBP has likely entered a range trading phase. For the time being, we expect GBP to trade between 1.2700 and 1.2850.”
The Euro (EUR) could edge higher; as upward momentum is not strong, any advance is unlikely to break above 1.0960. If EUR breaches 1.0875, it would mean that the likelihood of it rising to 1.1010 has faded, UOB Group FX strategists Quek Ser Leang and Peter Chia note.
Predominantly flat on the day
24-HOUR VIEW: “We expected EUR to consolidate between 1.0895 and 1.0930 yesterday. However, EUR edged to a high of 1.0939 before closing higher at 1.0931 (+0.12%). There has been a slight increase in momentum, and USD could continue to edge higher today. As upward momentum is not strong for now, any advance is unlikely to break the resistance at 1.0960. On the downside, should EUR breach 1.0905 (minor support is at 1.0920), it would indicate that the current mild upward pressure has eased.”
1-3 WEEKS VIEW: “After EUR surged to a high of 1.1008 and then pulled back, we indicated last Tuesday (06 Aug, spot at 1.0955) that EUR ‘is still positive, but it has to surpass 1.1010 before further advance to 1.1070 can be expected.’ EUR subsequently traded mostly sideways. Yesterday (12 Aug, spot at 1.0915), we indicated that if EUR breaches the ‘strong support’ level at 1.0875, it would mean the likelihood of it rising to 1.1010 has faded. Our view remains unchanged.”
In its monthly oil market report published on Tuesday, the International Energy Agency (IEA) made no changes to its global oil demand growth forecast.
Additional takeaways
2024 world oil demand growth forecast unchanged at 970k barrels per day (bpd).
2025 world oil demand growth forecast seen at 950k bpd (previously 980k bpd).
Chinese oil demand has contracted for third consecutive month.
Weak growth in China now significantly dragging on global gains.
OPEC+ cuts are tightening physical markets.
Could see a supply deficit as US summer driving season is set to be strongest since the pandemic.
Market reaction
WTI is little changed by the above findings from the report, keeping its range above $78.
WTI Oil FAQs
WTI Oil is a type of Crude Oil sold on international markets. The WTI stands for West Texas Intermediate, one of three major types including Brent and Dubai Crude. WTI is also referred to as “light” and “sweet” because of its relatively low gravity and sulfur content respectively. It is considered a high quality Oil that is easily refined. It is sourced in the United States and distributed via the Cushing hub, which is considered “The Pipeline Crossroads of the World”. It is a benchmark for the Oil market and WTI price is frequently quoted in the media.
Like all assets, supply and demand are the key drivers of WTI Oil price. As such, global growth can be a driver of increased demand and vice versa for weak global growth. Political instability, wars, and sanctions can disrupt supply and impact prices. The decisions of OPEC, a group of major Oil-producing countries, is another key driver of price. The value of the US Dollar influences the price of WTI Crude Oil, since Oil is predominantly traded in US Dollars, thus a weaker US Dollar can make Oil more affordable and vice versa.
The weekly Oil inventory reports published by the American Petroleum Institute (API) and the Energy Information Agency (EIA) impact the price of WTI Oil. Changes in inventories reflect fluctuating supply and demand. If the data shows a drop in inventories it can indicate increased demand, pushing up Oil price. Higher inventories can reflect increased supply, pushing down prices. API’s report is published every Tuesday and EIA’s the day after. Their results are usually similar, falling within 1% of each other 75% of the time. The EIA data is considered more reliable, since it is a government agency.
OPEC (Organization of the Petroleum Exporting Countries) is a group of 13 Oil-producing nations who collectively decide production quotas for member countries at twice-yearly meetings. Their decisions often impact WTI Oil prices. When OPEC decides to lower quotas, it can tighten supply, pushing up Oil prices. When OPEC increases production, it has the opposite effect. OPEC+ refers to an expanded group that includes ten extra non-OPEC members, the most notable of which is Russia.
- EUR/USD consolidates above 1.0900 as investors await July’s US CPI data for fresh guidance on the Fed’s interest-rate path.
- Market speculation for a 50 basis points interest-rate cut in September has diminished.
- ECB Rehn supports more rate cuts to boost Eurozone economic growth.
EUR/USD edges slightly lower but holds the key support level of 1.0900 in Tuesday’s European session. The major currency pair trades broadly sideways as investors appear to be sidelined ahead of the United States (US) Producer Price Index (PPI) data, which will be published at 12:30 GMT.
The producer inflation data will indicate how much the prices of goods and services were changed by owners at factory gates. Generally, prices of final goods are influenced by input prices and consumer demand.
Economists expect that monthly headline PPI barely rose last month. The core PPI, which excludes volatile food and energy prices, is expected to grow at a slower pace of 0.2% compared with the 0.4% increase seen in June. Annual headline and core PPI are estimated to have decelerated by three-tenths to 2.3% and 2.7%, respectively.
US PPI data is expected to have a limited impact on the US Dollar (USD) – unless the data diverge significantly from expectations – as the major trigger will be the Consumer Price Index (CPI) data for July, which will be published on Wednesday. The inflation data will significantly influence market speculation about the size and timing of interest rate cuts by the Federal Reserve (Fed) for the entire year.
Daily digest market movers: EUR/USD moves sideways ahead of US PPI data
EUR/USD exhibits a subdued performance as the US Dollar edges higher as investors focus on the US CPI inflation data for July. The US Dollar Index (DXY), which tracks the Greenback’s value against six major currencies, remains steady above 103.00.
Annual headline and core inflation is expected to have decelerated by one-tenth to 2.9% and 3.2%, respectively, with monthly figures growing by 0.2%. The inflation data will indicate whether the Fed will adopt a cautious policy-easing approach or will choose to reduce interest rates more aggressively.
According to the CME FedWatch tool, 30-day Federal Funds Futures pricing data shows that traders see a 47.5% chance that interest rates will be reduced by 50 basis points (bps) in September. The likelihood of a 50 bp rate reduction has weakened significantly from the 68% recorded a week ago.
Meanwhile, the Euro (EUR) is being guided by market speculation for European Central Bank (ECB) rate cuts amid an absence of top-tier Eurozone economic data. Still, the German and Eurozone ZEW survey data for August will be watched by investors, which will be published at 09:00 GMT.
Economists are mixed about the ECB’s monetary policy outlook, namely whether the central bank will cut interest rates aggressively or use a calibrated approach.
The Eurozone economy grew faster than expected in the second quarter, but its largest country, Germany, is facing a vulnerable demand from domestic and overseas markets. The German GDP contracted by 0.1% in the second quarter of this year.
Last week, Finnish ECB policymaker Olli Rehn said that “rate cuts would help the eurozone economy recover, in particular the fragile industrial growth and subdued investments,” Reuters reported.
Technical Analysis: EUR/USD holds key 200-day EMA
EUR/USD trades close to near the upper boundary of the Channel formation on the daily time frame. A breakout of the aforementioned chart pattern would result in wider ticks on the upside and heavy volume. The 200-day Exponential Moving Average (EMA) near 1.0800 has acted as major support for the Euro bulls.
The 14-day Relative Strength Index (RSI) returns inside the 40.00-60.00 range, remaining close to its upper boundary. If the RSI sustains above 60.00, a bullish momentum will trigger.
More upside would appear if the major currency pair breaks above the August 5 high of 1.1009. This would drive the asset towards August 10, 2023, high at 1.1065, followed by the round-level resistance of 1.1100.
In an alternate scenario, a downside move below August 1 low at 1.0777 would drag the asset toward February low near 1.0700. A breakdown below the latter would expose the asset to June 14 low at 1.0667.
- Silver comes under renewed selling pressure and erodes a part of the overnight strong gains.
- A move beyond the 100-period SMA on the 4-hour chart will pave the way for further gains.
- The technical setup on the daily chart warrants some caution for aggressive bullish traders.
Silver (XAG/USD) struggles to capitalize on the previous day's strong move up beyond the $28.00 round-figure mark and meets with some supply on Tuesday. The white metal maintains its offered tone through the early part of the European session and currently trades around the $27.75 region, down nearly 1% for the day.
From a technical perspective, the intraday break through a confluence hurdle comprising the 50-period Simple Moving Average (SMA) on the 4-hour chart and the 23.6% Fibonacci retracement level of the July-August fall favors bullish traders. Adding to this, oscillators on the said chart have just started gaining positive traction and support prospects for further gains. That said, failure near the 100-period SMA resistance warrants some caution.
Meanwhile, oscillators on the daily chart – though have recovered from lower levels – are still holding in negative territory. This further makes it prudent to wait for sustained strength and acceptance above the $28.00 mark, or the 100-period SMA on the 4-hour chart, before placing fresh bullish bets. The XAG/USD might then climb to 38.2% Fibo. level, around the $28.45 region, en route to the $29.00 mark, which coincides with the 50% Fibo. level.
On the flip side, any further decline is likely to find some support near the $27.35 horizontal zone, below which the XAG/USD could accelerate the fall towards the $27.00 mark. The downward trajectory could extend further towards a three-month low, around the $26.40-$26.35 region touched last week, en route to the $26.00 round figure mark.
Silver 4-hour chart
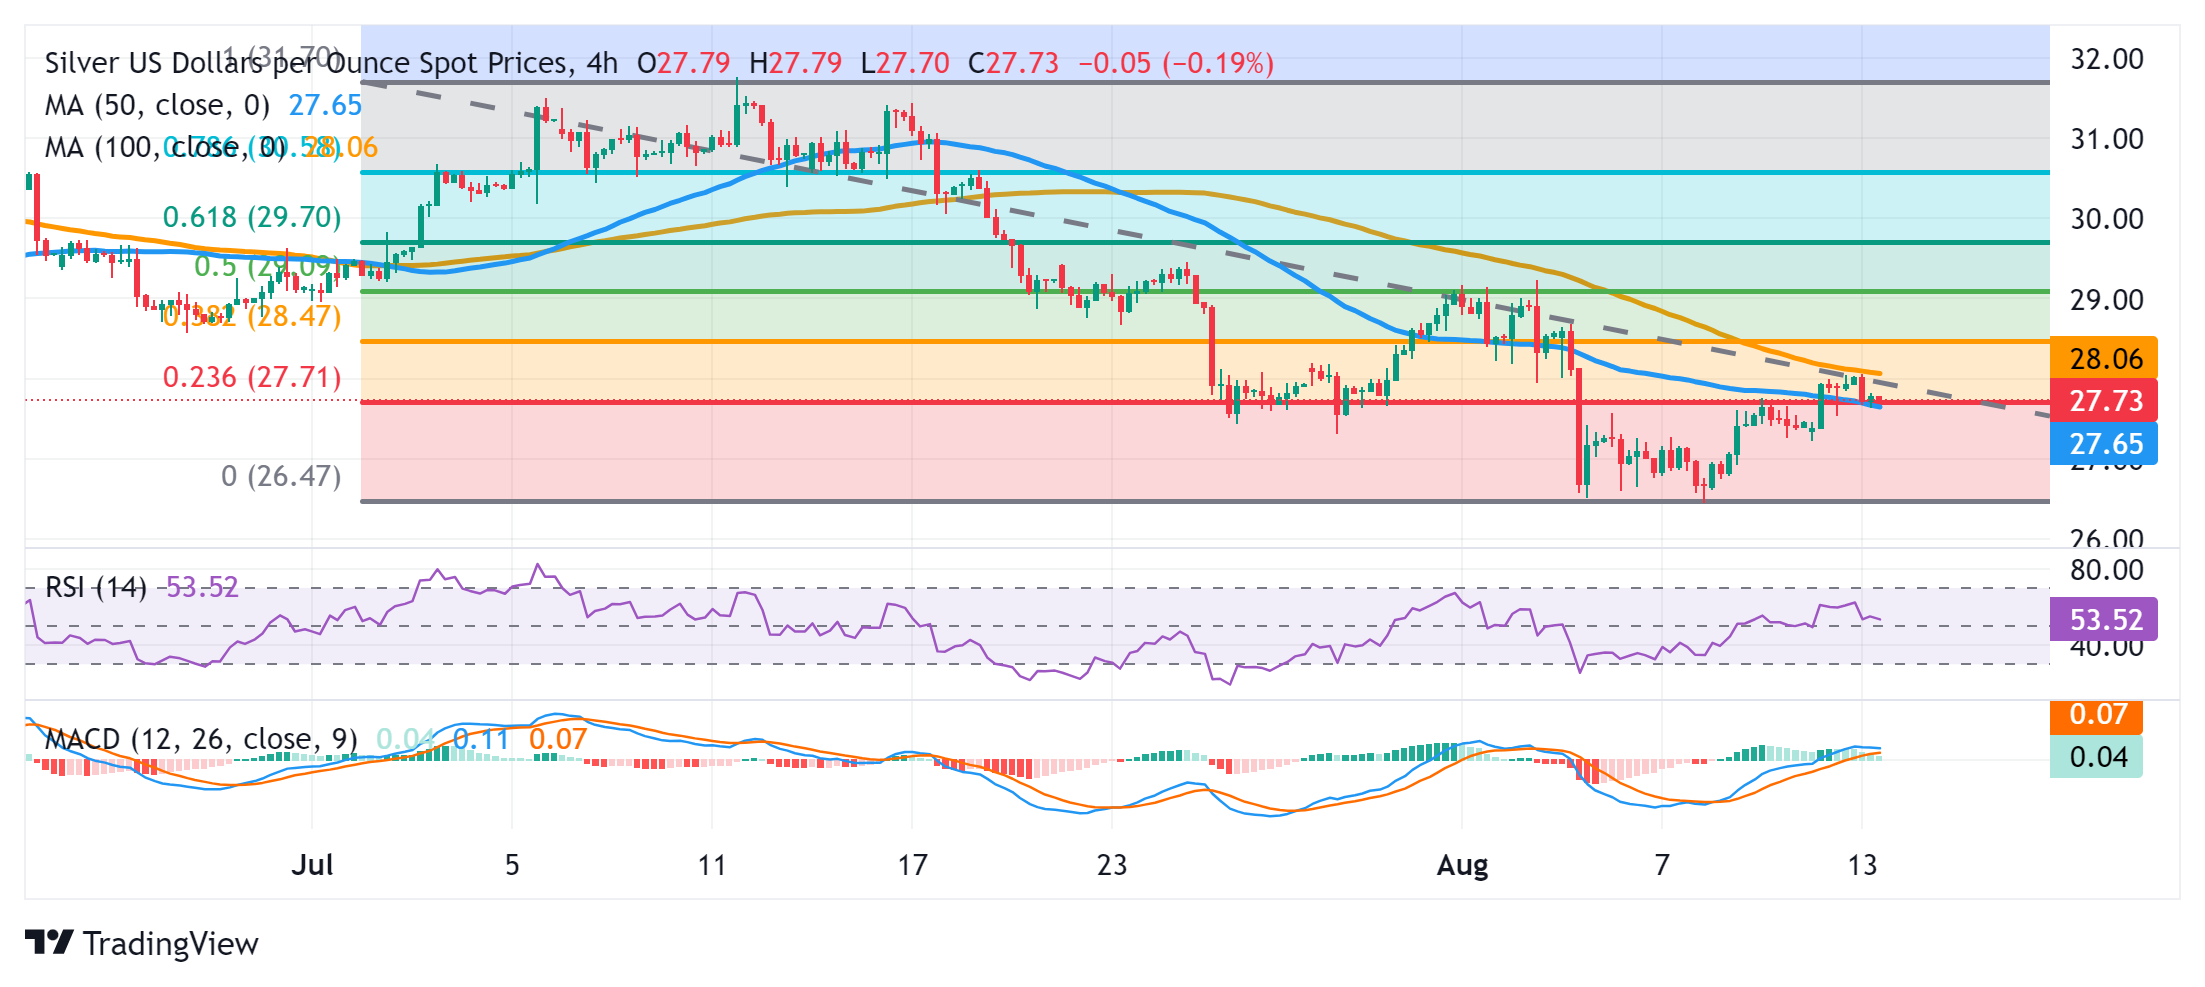
Silver FAQs
Silver is a precious metal highly traded among investors. It has been historically used as a store of value and a medium of exchange. Although less popular than Gold, traders may turn to Silver to diversify their investment portfolio, for its intrinsic value or as a potential hedge during high-inflation periods. Investors can buy physical Silver, in coins or in bars, or trade it through vehicles such as Exchange Traded Funds, which track its price on international markets.
Silver prices can move due to a wide range of factors. Geopolitical instability or fears of a deep recession can make Silver price escalate due to its safe-haven status, although to a lesser extent than Gold's. As a yieldless asset, Silver tends to rise with lower interest rates. Its moves also depend on how the US Dollar (USD) behaves as the asset is priced in dollars (XAG/USD). A strong Dollar tends to keep the price of Silver at bay, whereas a weaker Dollar is likely to propel prices up. Other factors such as investment demand, mining supply – Silver is much more abundant than Gold – and recycling rates can also affect prices.
Silver is widely used in industry, particularly in sectors such as electronics or solar energy, as it has one of the highest electric conductivity of all metals – more than Copper and Gold. A surge in demand can increase prices, while a decline tends to lower them. Dynamics in the US, Chinese and Indian economies can also contribute to price swings: for the US and particularly China, their big industrial sectors use Silver in various processes; in India, consumers’ demand for the precious metal for jewellery also plays a key role in setting prices.
Silver prices tend to follow Gold's moves. When Gold prices rise, Silver typically follows suit, as their status as safe-haven assets is similar. The Gold/Silver ratio, which shows the number of ounces of Silver needed to equal the value of one ounce of Gold, may help to determine the relative valuation between both metals. Some investors may consider a high ratio as an indicator that Silver is undervalued, or Gold is overvalued. On the contrary, a low ratio might suggest that Gold is undervalued relative to Silver.
- AUD/JPY receives support as traders expect the RBA to hold a hawkish stance regarding its policy outlook.
- Australia's Westpac Consumer Confidence increased by 2.8% in August, reversing the 1.1% decline observed in July.
- Japan's parliament will hold a special session to discuss the BoJ’s last interest rate hike.
AUD/JPY advances further for the second successive day, trading around 97.60 during the European hours on Tuesday. The AUD/JPY cross received support from the hawkish sentiment surrounding the Reserve Bank of Australia (RBA).
On Monday, Reserve Bank of Australia (RBA) Deputy Governor Andrew Hauser attributed persistent inflation to weaker supply and a tight labor market. Hauser also noted that economic forecasts are surrounded by significant uncertainty.
On the data front, Australia's Westpac Consumer Confidence rose by 2.8% in August, swinging from a 1.1% fall in July. Meanwhile, the Wage Price Index remained steady with a 0.8% rise in the second quarter, slightly below the market expectation of a 0.9% increase.
The upside of the risk-sensitive Aussie Dollar could be restrained due to rising geopolitical tensions in the Middle East. Safe-haven flows might have contributed support for the Japanese Yen (JPY), limiting the upside of the AUD/JPY cross.
Israeli forces pressed on with their operations near the southern Gaza city of Khan Younis on Monday. CBC News cited Palestinian medics saying Israeli military strikes on Khan Younis on Monday killed at least 18 people.
Japan's parliament is set to hold a special session on August 23 to discuss the Bank of Japan's (BoJ) decision to raise interest rates last month. The session, organized by the lower house financial affairs committee, is expected to invite BoJ Governor Kazuo Ueda, according to government sources cited by Reuters.
Interest rates FAQs
Interest rates are charged by financial institutions on loans to borrowers and are paid as interest to savers and depositors. They are influenced by base lending rates, which are set by central banks in response to changes in the economy. Central banks normally have a mandate to ensure price stability, which in most cases means targeting a core inflation rate of around 2%. If inflation falls below target the central bank may cut base lending rates, with a view to stimulating lending and boosting the economy. If inflation rises substantially above 2% it normally results in the central bank raising base lending rates in an attempt to lower inflation.
Higher interest rates generally help strengthen a country’s currency as they make it a more attractive place for global investors to park their money.
Higher interest rates overall weigh on the price of Gold because they increase the opportunity cost of holding Gold instead of investing in an interest-bearing asset or placing cash in the bank. If interest rates are high that usually pushes up the price of the US Dollar (USD), and since Gold is priced in Dollars, this has the effect of lowering the price of Gold.
The Fed funds rate is the overnight rate at which US banks lend to each other. It is the oft-quoted headline rate set by the Federal Reserve at its FOMC meetings. It is set as a range, for example 4.75%-5.00%, though the upper limit (in that case 5.00%) is the quoted figure. Market expectations for future Fed funds rate are tracked by the CME FedWatch tool, which shapes how many financial markets behave in anticipation of future Federal Reserve monetary policy decisions.
- Gold rally hits resistance from the top of its late-summer range and pulls back.
- Bullish drivers are strong in the form of simmering geopolitical tensions and falling US bond yields.
- US inflation data this week could color the outlook and increase volatility for Gold.
Gold (XAU/USD) is trading in the $2,460s on Tuesday after rallying up to a key chart resistance level in the $2,470s on the previous day. The rally was stimulated by falling US bond yields, which are inversely correlated to Gold, and a growing threat of escalation of conflict in the Middle East.
Gold is now pulling back from Monday’s highs as traders take profit ahead of US inflation data scheduled for Tuesday and Wednesday. The US Producer Price Index (PPI) comes out on Tuesday, and the US Consumer Price Index (CPI) is out on Wednesday. Both could color the outlook for interest rates in the US, a key driver for Gold’s price.
Gold rallies on the back of falling US bond yields
Gold has been rallying on the back of heightened expectations that the Federal Reserve (Fed) might begin aggressively cutting interest rates in September. Previously expecting a modest 0.25% cut, which would bring the fed funds rate down to 5.25%, market gauges now predict a 49.5% chance of a bigger 0.50% cut, bringing the fed funds rate down to 5.00%.
Lower bond yields reflect lower interest rate expectations, which are generally positive for Gold’s price. Gold is a more attractive asset when interest rates are low since it doesn't pay the holder any interest, unlike cash or its equivalents. Therefore, yields and Gold price are negatively correlated, as shown in the chart below, which compares Gold price to the yield on US 10-year Treasury Bonds.
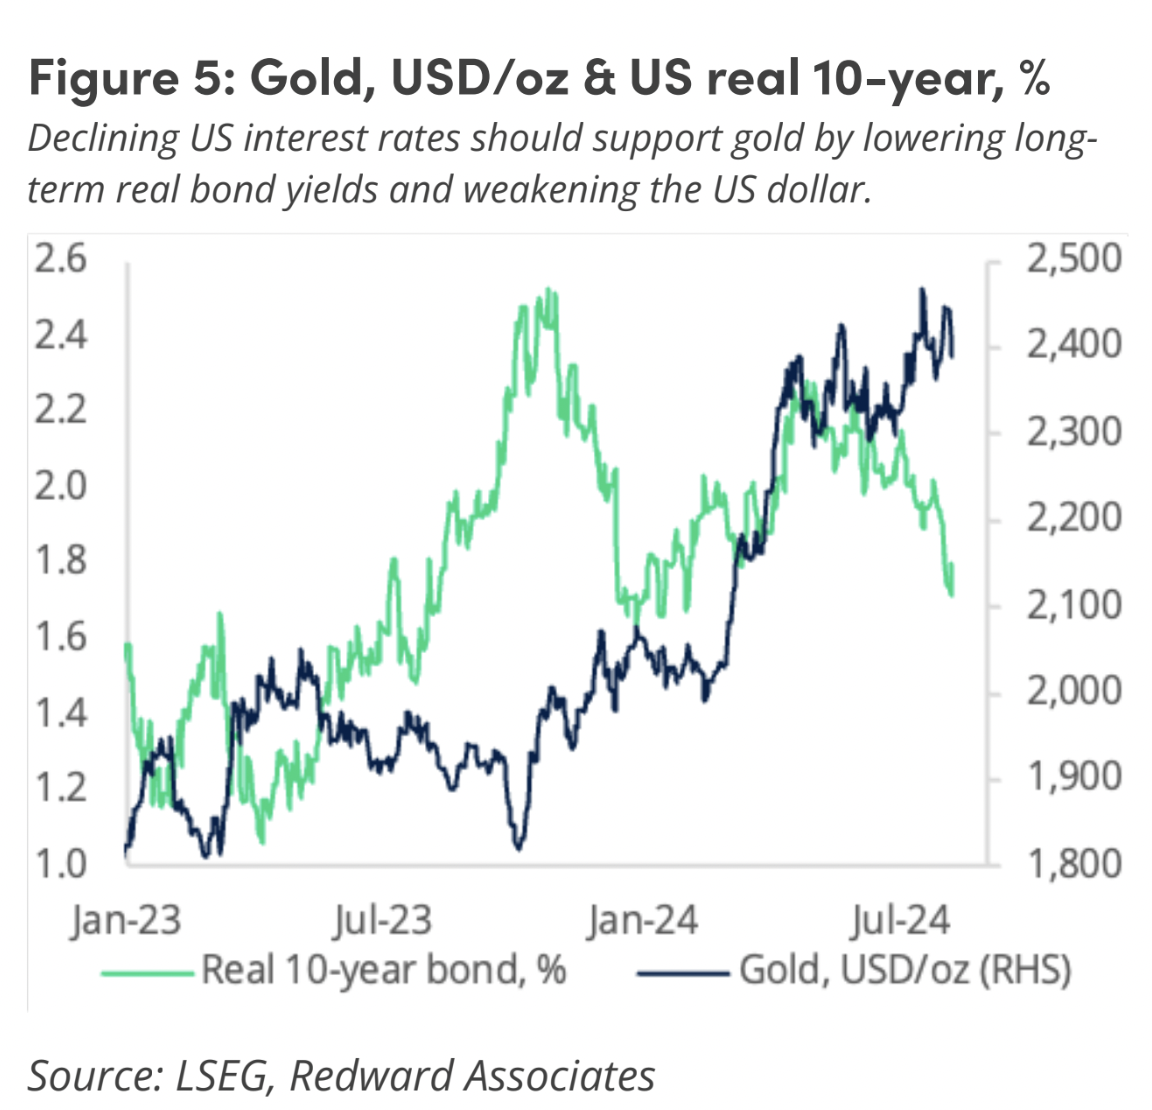
Interest rate expectations will be colored by the US PPI and CPI data results out on Tuesday (today) and Wednesday. If PPI inflation, also known as “factory gate” inflation, comes out lower than the expected 0.1% month-over-month, it will confirm downward pressure on the wholesale price of manufactured goods. This may then feed into the price of consumer goods, leading to a weaker broader outlook for inflation and supporting expectations of lower interest rates. This, in turn, is likely to push up Gold. Conversely, the precious metal is likely to fall if PPI comes out higher than expected.
US Consumer Price Index (CPI) data for July, is to be released on Wednesday, and could further color expectations regarding future changes to interest rates. This, in turn, could impact Gold.
US CPI is expected to have risen by 0.2% in July compared with the previous month, both for headline and core. This comes after a 0.1% decline for headline and a 0.1% rise for core in June. If the real figure overshoots expectations, indicating sticky prices, it could bring into doubt the assumption the Fed will cut interest rates aggressively in September, hurting Gold price in the process.
Geopolitical Risk
Central bank demand for Gold peaked at the start of Russia’s invasion of Ukraine, highlighting Gold’s role as a safe haven. This demand has tapered off over time, according to Redward Associates, which collaborates with the spread-better IG index to produce a Monthly Gold Report.
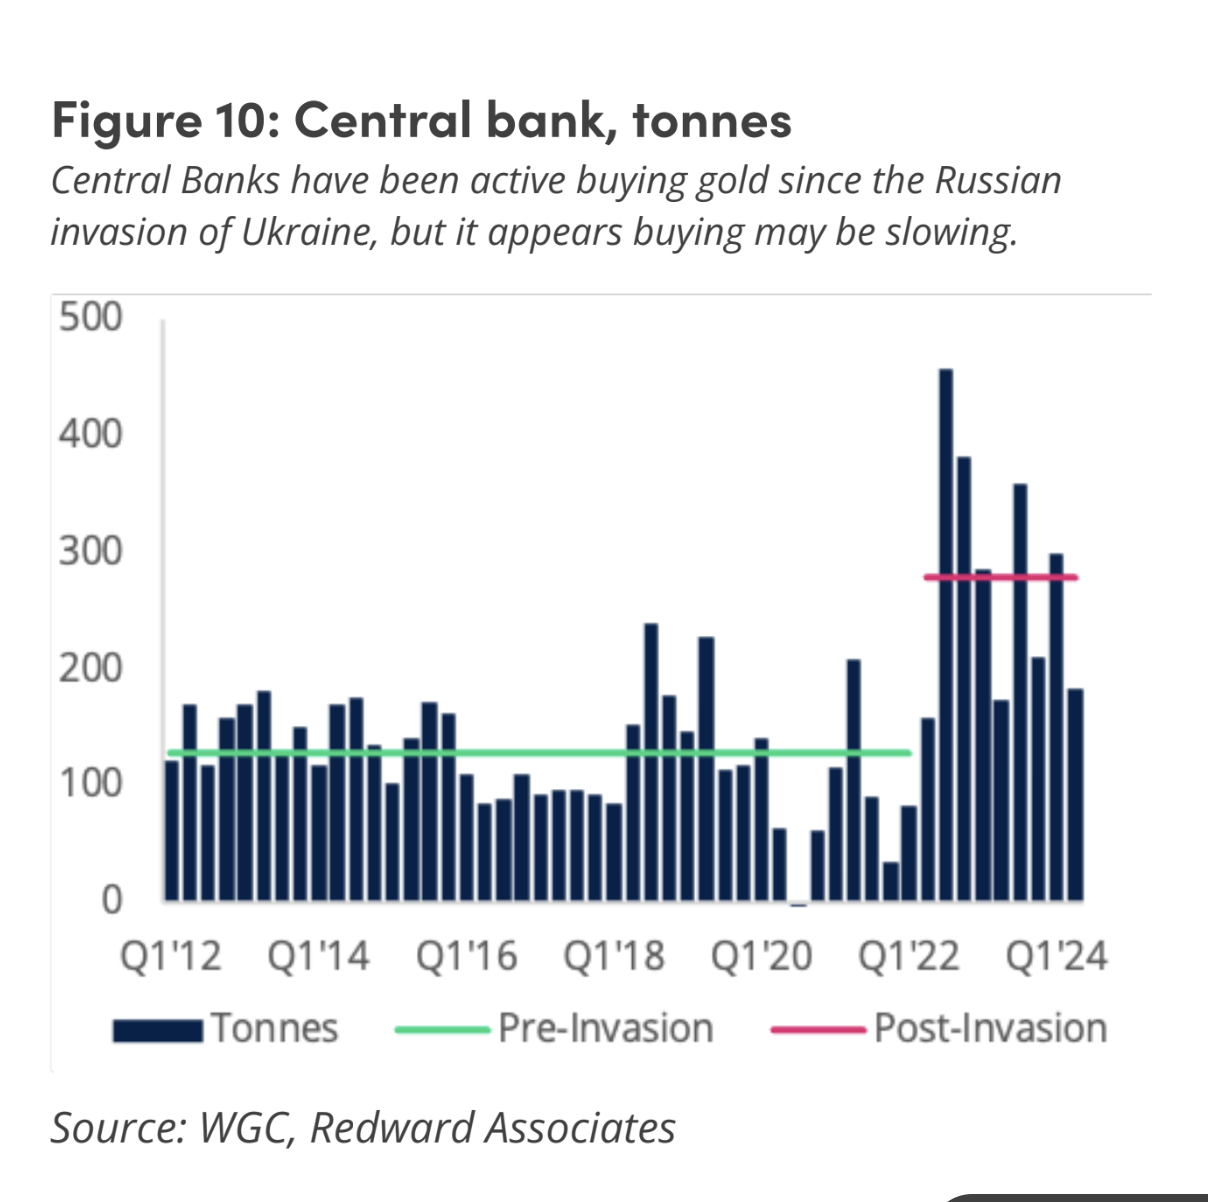
If Iran mounts a large-scale military attack on Israel, however, similar levels of demand could be foreseen, pushing up the Gold price as a consequence. Additionally, Ukraine has raised the stakes in its war against Russia by invading Russian territory, and this could revive Gold buying from investors. If either of these hotspots increasingly threatens global stability, investors are likely to respond by buying up Gold for its safe-haven properties.
Gold positioning is a drag
Despite the multiple bullish factors converging to push up the price of Gold, the data from Gold exchanges shows positioning in the Gold derivatives markets has reached an overextended level that may indicate a vulnerability to pullback, reflecting a reduction in demand and fall in the price of underlying Gold.
The graphic below shows how Gold Futures positioning has moved over a standard deviation away from the average, suggesting an overextension of long positions. The usual response is for positioning to mean-revert, indicating a risk of a pullback.
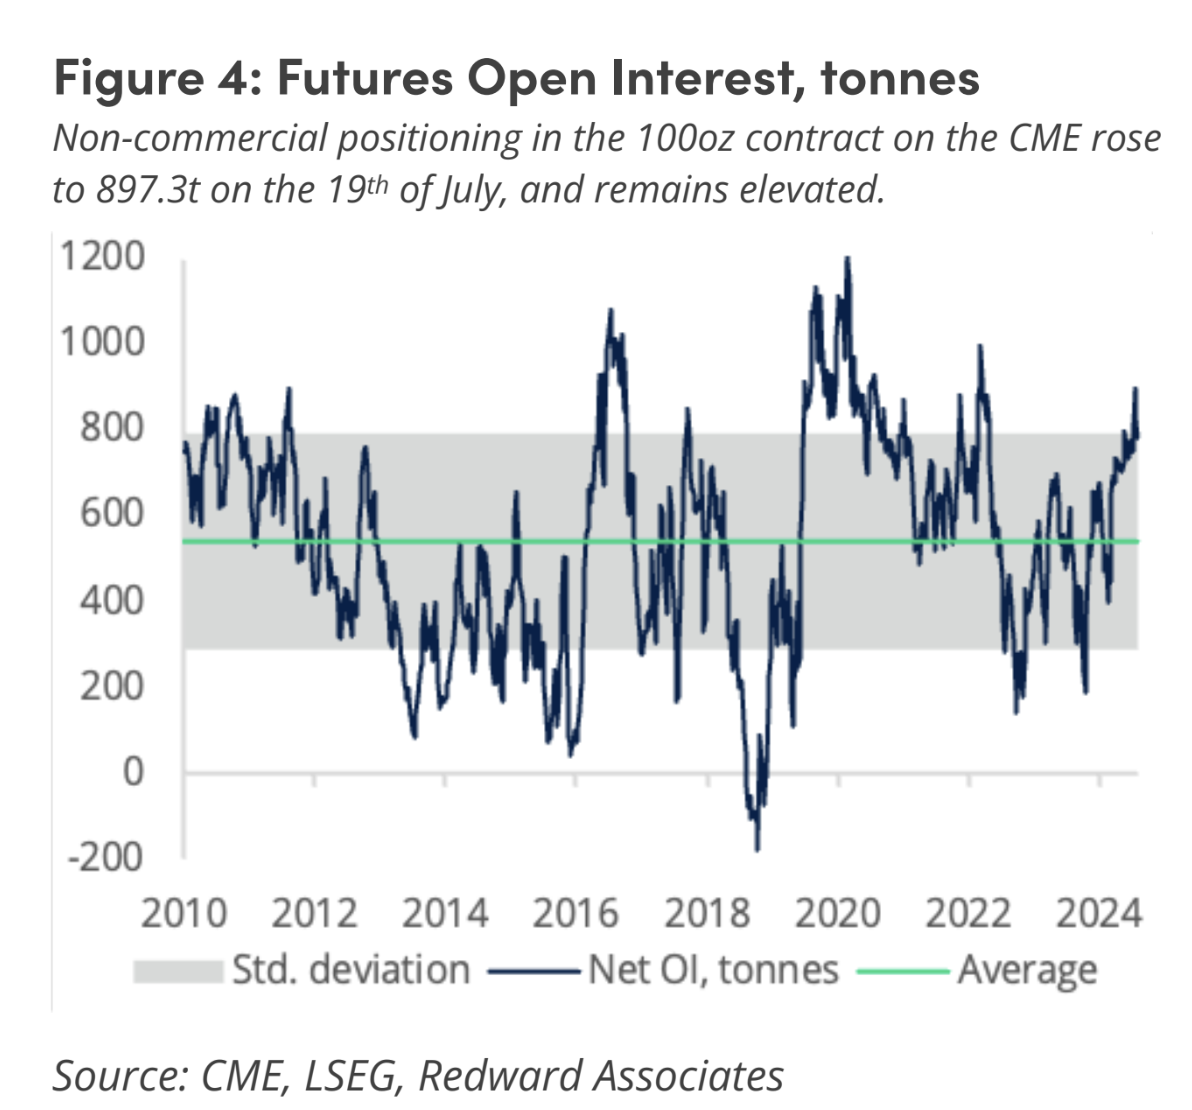
The over-the-counter Options market is also showing a disproportionate preference for bullish call options, reflecting optimism, according to the Redward Associates and IG Index report. The “option volatility skewed in favor of Gold call options at all tenors out to twelve months, with one-month option, volatility skewed 2.1% in favor of calls,” the report says.
“While we see good reason for this optimism - notably ongoing solid Central Bank demand for Gold, coupled with the expectation of easier US monetary conditions leading to a weaker US Dollar and lower US real long-term Bond yields - positioning and technical indicators pointed to position extension,” the report says.
Technical Analysis: Gold touches top of range and pulls back
Gold has rallied up to the ceiling of a range it has been oscillating in since July. After touching this ceiling on Monday, it has pulled back. The trend is probably sideways and, given “the trend is your friend”, likely to extend in that direction.
XAU/USD 4-hour Chart
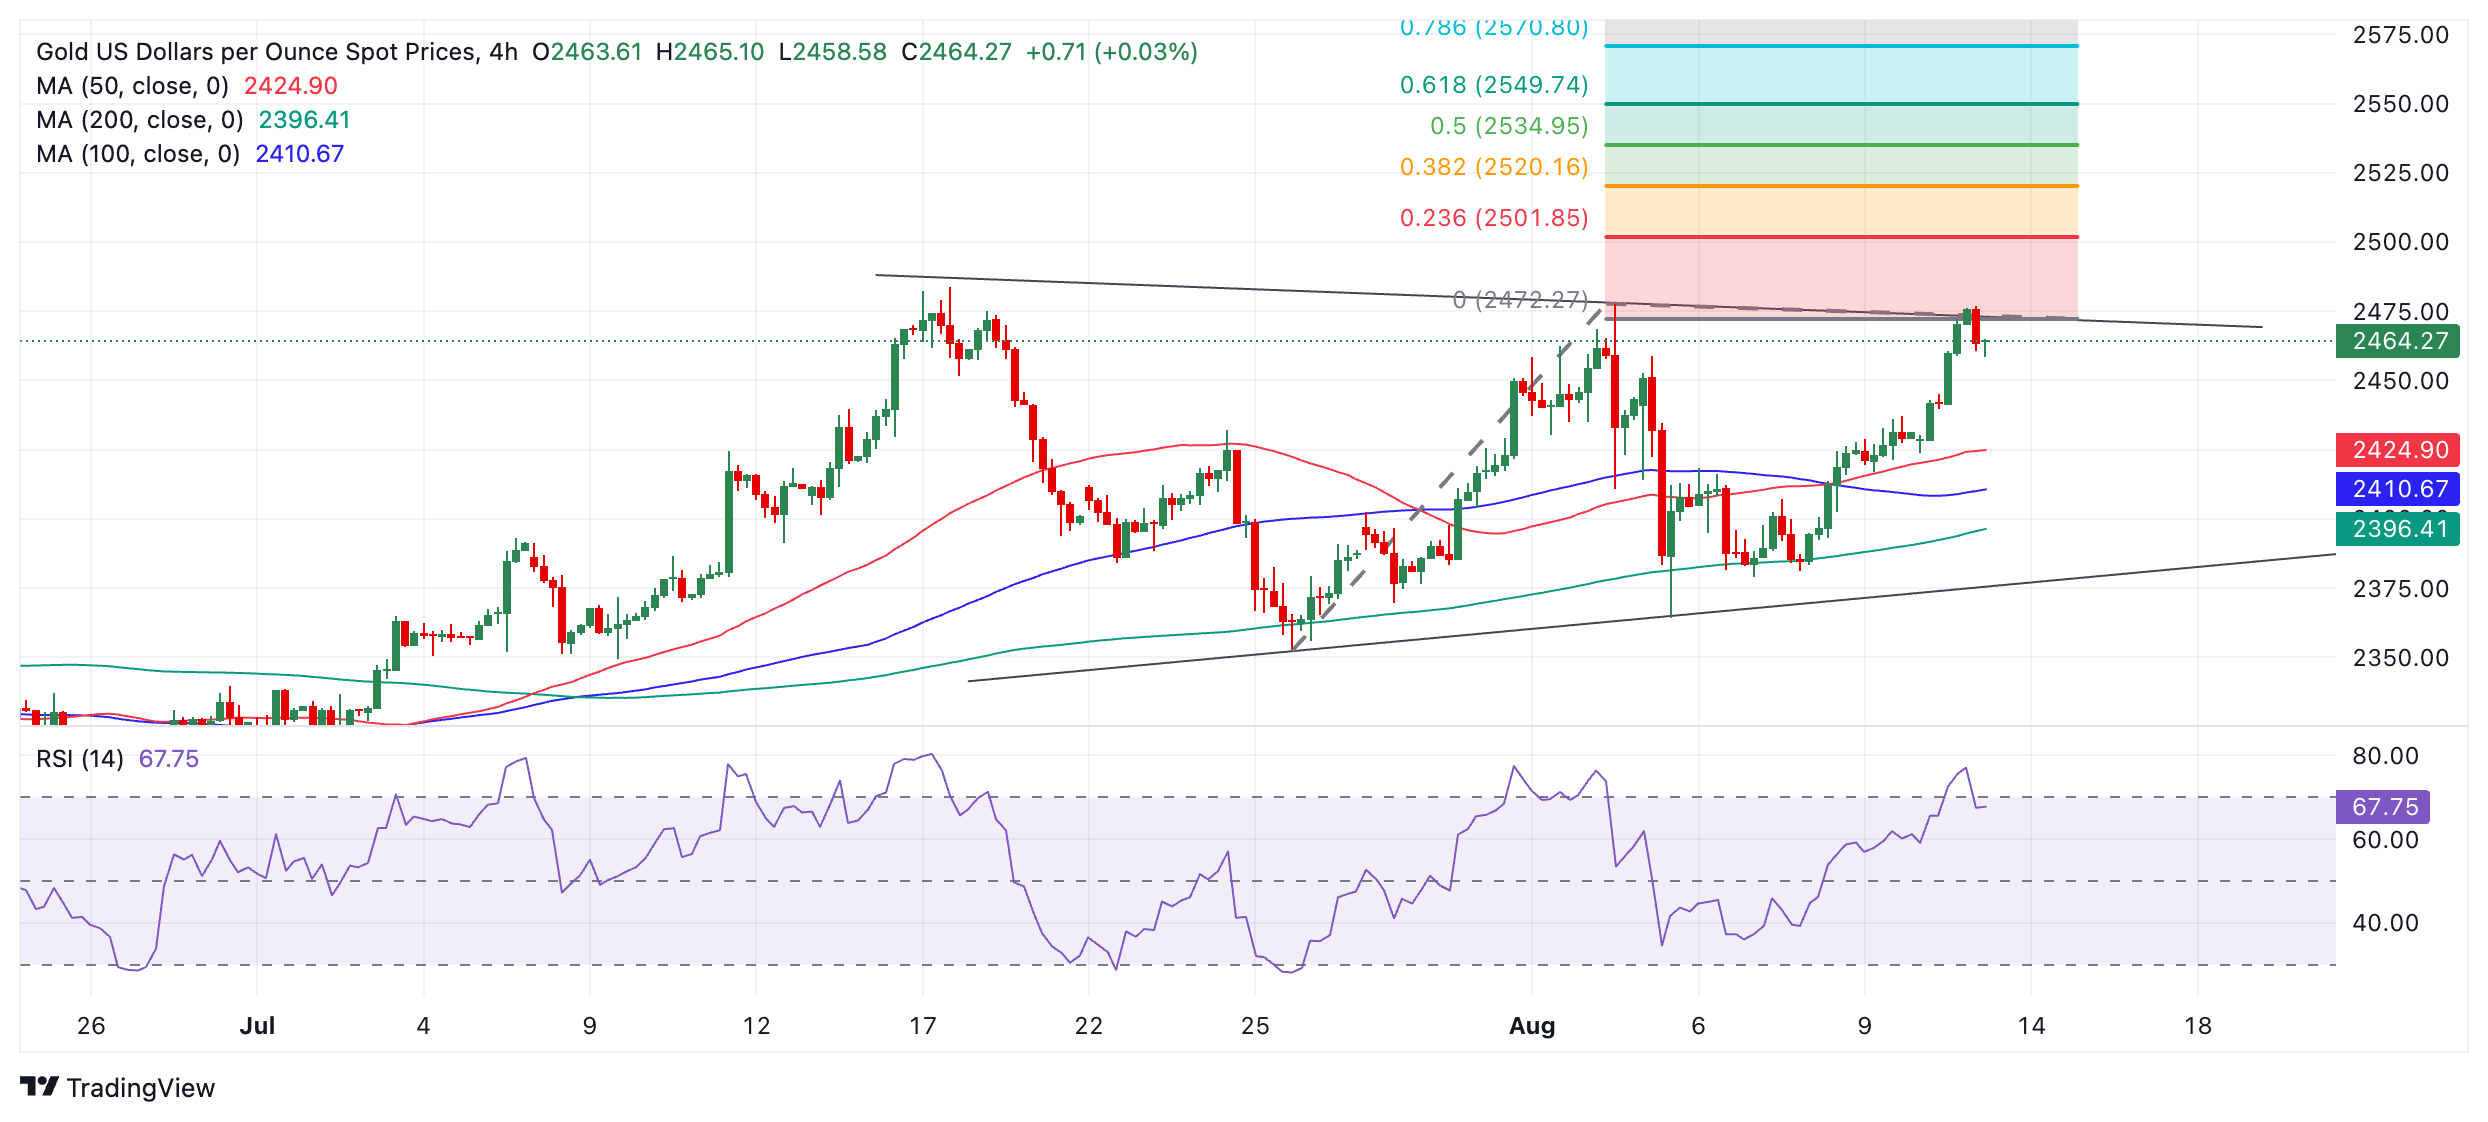
The pair has rolled over after reaching a high of $2,477 earlier in the day and looks poised to start a fresh down leg within the range, thereby extending the sideways trend. A bearish Engulfing Japanese candlestick pattern has formed at the top of the range, and if the current 4-hour period ends as a bearish red candle, this will provide added confirmation of a short-term reversal lower. If so, the price will probably move down to $2,400 at the very least or perhaps the range floor in the $2,390s. Due to the fact the range is tapering slightly, it might also be a triangle pattern in the final stages of development.
A decisive break above the range ceiling, however, would be required to indicate a more bullish trend was developing. Such a move would likely run up to at least $2,550, calculated by taking roughly the 0.618 Fibonacci ratio of the range’s height and extrapolating it higher.
A decisive break would be one characterized by a long green candle that pierced clearly through the level and closed near its high, or three green candles in a row that breached the level.
Economic Indicator
Producer Price Index (MoM)
The Producer Price Index released by the Bureau of Labor statistics, Department of Labor measures the average changes in prices in primary markets of the US by producers of commodities in all states of processing. Changes in the PPI are widely followed as an indicator of commodity inflation. Generally speaking, a high reading is seen as positive (or bullish) for the USD, whereas a low reading is seen as negative (or bearish).
Read more.Next release: Tue Aug 13, 2024 12:30
Frequency: Monthly
Consensus: 0.1%
Previous: 0.2%
Source: US Bureau of Labor Statistics
- EUR/JPY gains positive traction for the second straight day, though the upside seems limited.
- A combination of factors undermines the safe-haven JPY and lends some support to the cross.
- Geopolitical tensions and BoJ rate hike bets to limit the JPY losses, warranting caution for bulls.
The EUR/JPY cross attracts some dip-buying following the previous day's modest pullback from over a one-week top and sticks to its intraday gains through the early European session on Tuesday. Spot prices currently trade just above the mid-161.00s, up nearly 0.50% for the day, and draw support from the offered tone surrounding the Japanese Yen (JPY).
Against the backdrop of the recent dovish remarks by Bank of Japan (BoJ) Deputy Governor Shinichi Uchida, a positive tone around the equity markets is seen undermining demand for the safe-haven JPY. In fact, Uchida said last week that the central bank won't hike rates when markets are unstable. Furthermore, a former BoJ board member Makoto Sakurai predicted a rate hike only by March 2025 citing the recent market turmoil and the low likelihood of a rapid economic recovery.
That said, the BoJ's summary of opinions from the July policy meeting released last week indicated that some members see room for further rate hikes and policy normalization. Moreover, the risk of a further escalation of geopolitical tensions in the Middle East, along with the protracted Russia-Ukraine war, should keep a lid on the market optimism and help limit JPY losses. This, along with the lack of any buying around the shared currency, should contribute to capping gains for the EUR/JPY cross.
Hence, it will be prudent to wait for strong follow-through buying before positioning for an extension of the pair's recent strong recovery move from the 141.70-141.65 region, or the lowest level since early January touched last week. Traders now look to the flash Eurozone Q2 GDP print on Wednesday for a fresh impetus ahead of the prelim Japanese Q2 GDP report on Thursday. Apart from this, geopolitical developments should produce short-term opportunities around the EUR/JPY cross.
Japanese Yen FAQs
The Japanese Yen (JPY) is one of the world’s most traded currencies. Its value is broadly determined by the performance of the Japanese economy, but more specifically by the Bank of Japan’s policy, the differential between Japanese and US bond yields, or risk sentiment among traders, among other factors.
One of the Bank of Japan’s mandates is currency control, so its moves are key for the Yen. The BoJ has directly intervened in currency markets sometimes, generally to lower the value of the Yen, although it refrains from doing it often due to political concerns of its main trading partners. The current BoJ ultra-loose monetary policy, based on massive stimulus to the economy, has caused the Yen to depreciate against its main currency peers. This process has exacerbated more recently due to an increasing policy divergence between the Bank of Japan and other main central banks, which have opted to increase interest rates sharply to fight decades-high levels of inflation.
The BoJ’s stance of sticking to ultra-loose monetary policy has led to a widening policy divergence with other central banks, particularly with the US Federal Reserve. This supports a widening of the differential between the 10-year US and Japanese bonds, which favors the US Dollar against the Japanese Yen.
The Japanese Yen is often seen as a safe-haven investment. This means that in times of market stress, investors are more likely to put their money in the Japanese currency due to its supposed reliability and stability. Turbulent times are likely to strengthen the Yen’s value against other currencies seen as more risky to invest in.
- NZD/USD receives support as RBNZ’s interest rate decision looms.
- The NZD’s upside could be limited due to safe-haven flows amid rising Middle-East tensions.
- The US Dollar receives support from diminished odds of a 50-basis point rate cut by the Fed.
NZD/USD extends its gains for the second consecutive day, trading around 0.6040 during the European session on Tuesday. Traders assess the Reserve Bank of New Zealand’s (RBNZ) policy decision scheduled for Wednesday. The central bank is widely expected to hold its current Official Cash Rate (OCR) at 5.5% for the ninth consecutive time.
The upbeat employment report from New Zealand last week, combined with improving signs of diminished demand from trade partner China, reduces the likelihood of a rate cut by the Reserve Bank of New Zealand on Wednesday.
The safe-haven flows might have put a cap on the upside of risk-sensitive currencies like the New Zealand Dollar (NZD) amid rising geopolitical tensions in the Middle East. Israeli forces pressed on with their operations near the southern Gaza city of Khan Younis on Monday. CBC News cited Palestinian medics saying Israeli military strikes on Khan Younis on Monday killed at least 18 people.
On the USD front, the US Federal Reserve (Fed) is expected to deliver a quarter-point interest rate cut at September’s meeting. Earlier, it was expected a 50 basis point rate cut in September. According to CME’s FedWatch Tool, the probability of 50 basis points (bps) cut in September has dropped to 50%, down from 85% last week.
Traders will likely focus on US Producer Price Index (PPI) data set to be released on Tuesday and Consumer Price Index (CPI) figures on Wednesday. Traders are looking for confirmation that price growth remains stable in the United States.
New Zealand Dollar FAQs
The New Zealand Dollar (NZD), also known as the Kiwi, is a well-known traded currency among investors. Its value is broadly determined by the health of the New Zealand economy and the country’s central bank policy. Still, there are some unique particularities that also can make NZD move. The performance of the Chinese economy tends to move the Kiwi because China is New Zealand’s biggest trading partner. Bad news for the Chinese economy likely means less New Zealand exports to the country, hitting the economy and thus its currency. Another factor moving NZD is dairy prices as the dairy industry is New Zealand’s main export. High dairy prices boost export income, contributing positively to the economy and thus to the NZD.
The Reserve Bank of New Zealand (RBNZ) aims to achieve and maintain an inflation rate between 1% and 3% over the medium term, with a focus to keep it near the 2% mid-point. To this end, the bank sets an appropriate level of interest rates. When inflation is too high, the RBNZ will increase interest rates to cool the economy, but the move will also make bond yields higher, increasing investors’ appeal to invest in the country and thus boosting NZD. On the contrary, lower interest rates tend to weaken NZD. The so-called rate differential, or how rates in New Zealand are or are expected to be compared to the ones set by the US Federal Reserve, can also play a key role in moving the NZD/USD pair.
Macroeconomic data releases in New Zealand are key to assess the state of the economy and can impact the New Zealand Dollar’s (NZD) valuation. A strong economy, based on high economic growth, low unemployment and high confidence is good for NZD. High economic growth attracts foreign investment and may encourage the Reserve Bank of New Zealand to increase interest rates, if this economic strength comes together with elevated inflation. Conversely, if economic data is weak, NZD is likely to depreciate.
The New Zealand Dollar (NZD) tends to strengthen during risk-on periods, or when investors perceive that broader market risks are low and are optimistic about growth. This tends to lead to a more favorable outlook for commodities and so-called ‘commodity currencies’ such as the Kiwi. Conversely, NZD tends to weaken at times of market turbulence or economic uncertainty as investors tend to sell higher-risk assets and flee to the more-stable safe havens.
Here is what you need to know on Tuesday, August 13:
While major currency pairs spent the first day of the week fluctuating in tight ranges, Gold gathered bullish momentum and climbed above $2,470. The trading action turns subdued early Tuesday as investors await the July Producer Price Index (PPI) data from the US. During the European session, Germany's ZEW Institute will release August Economic Sentiment data for Germany and the Euro area.
US Dollar PRICE Last 7 days
The table below shows the percentage change of US Dollar (USD) against listed major currencies last 7 days. US Dollar was the strongest against the Japanese Yen.
| USD | EUR | GBP | JPY | CAD | AUD | NZD | CHF | |
|---|---|---|---|---|---|---|---|---|
| USD | 0.21% | -0.19% | 2.56% | -0.68% | -1.55% | -1.56% | 1.81% | |
| EUR | -0.21% | -0.38% | 2.34% | -0.90% | -1.78% | -1.84% | 1.61% | |
| GBP | 0.19% | 0.38% | 2.74% | -0.50% | -1.39% | -1.45% | 1.94% | |
| JPY | -2.56% | -2.34% | -2.74% | -3.18% | -4.00% | -4.08% | -0.61% | |
| CAD | 0.68% | 0.90% | 0.50% | 3.18% | -0.88% | -0.94% | 2.46% | |
| AUD | 1.55% | 1.78% | 1.39% | 4.00% | 0.88% | -0.05% | 3.39% | |
| NZD | 1.56% | 1.84% | 1.45% | 4.08% | 0.94% | 0.05% | 3.49% | |
| CHF | -1.81% | -1.61% | -1.94% | 0.61% | -2.46% | -3.39% | -3.49% |
The heat map shows percentage changes of major currencies against each other. The base currency is picked from the left column, while the quote currency is picked from the top row. For example, if you pick the US Dollar from the left column and move along the horizontal line to the Japanese Yen, the percentage change displayed in the box will represent USD (base)/JPY (quote).
The US Dollar Index (DXY) closed virtually unchanged on Monday as investors refrained from taking large positions. Wall Street's main indexes ended the day near the previous week's closing levels and the 10-year US Treasury bond yield extended its downward correction, losing nearly 1% on the day. In the European morning on Tuesday, the DXY holds steady slightly above 103.00 and US stock index futures trade marginally higher. According to The Times of Israel, Israel Defense Forces expect an attack by Iran by Thursday.
The UK's Office for National Statistics (ONS) reported on Tuesday that the ILO Unemployment Rate declined to 4.2% in the three months to June from 4.4%. This reading came in below the market expectation of 4.5%. Other details of the UK jobs report showed that the wage inflation, as measured by the change in the Average Earnings Excluding Bonus, edged lower to 5.4% from 5.7% in the same period, surpassing analysts' estimate of 4.6% by a wide margin. GBP/USD gained traction after these data and was last seen trading in positive territory slightly above 1.2800. The ONS will release July inflation data in the early European session on Wednesday.
EUR/USD registered modest gains on Monday and snapped a four-day losing streak. The pair stays relatively quiet below 1.0950 in the European morning on Tuesday.
Crude oil prices rose sharply on Monday, boosted by the ongoing conflict in the Middle East and reports suggesting that Saudi Aramco is looking to lower its oil output from September. The barrel of West Texas Intermediate (WTI) rose over 3% on Monday and reached its highest level since mid-July above $80. Early Tuesday, WTI trades in a tight range at around $79.50.
Gold benefited from retreating US Treasury bond yields and gained more than 1.5% on Monday. After rising toward $2,480 during the Asian trading hours on Tuesday, XAU/USD staged a technical correction and was last seen trading near $2,460.
USD/JPY posted marginal gains on Monday and continued to stretch higher toward 148.00 in the Asian session on Tuesday.
Gold FAQs
Gold has played a key role in human’s history as it has been widely used as a store of value and medium of exchange. Currently, apart from its shine and usage for jewelry, the precious metal is widely seen as a safe-haven asset, meaning that it is considered a good investment during turbulent times. Gold is also widely seen as a hedge against inflation and against depreciating currencies as it doesn’t rely on any specific issuer or government.
Central banks are the biggest Gold holders. In their aim to support their currencies in turbulent times, central banks tend to diversify their reserves and buy Gold to improve the perceived strength of the economy and the currency. High Gold reserves can be a source of trust for a country’s solvency. Central banks added 1,136 tonnes of Gold worth around $70 billion to their reserves in 2022, according to data from the World Gold Council. This is the highest yearly purchase since records began. Central banks from emerging economies such as China, India and Turkey are quickly increasing their Gold reserves.
Gold has an inverse correlation with the US Dollar and US Treasuries, which are both major reserve and safe-haven assets. When the Dollar depreciates, Gold tends to rise, enabling investors and central banks to diversify their assets in turbulent times. Gold is also inversely correlated with risk assets. A rally in the stock market tends to weaken Gold price, while sell-offs in riskier markets tend to favor the precious metal.
The price can move due to a wide range of factors. Geopolitical instability or fears of a deep recession can quickly make Gold price escalate due to its safe-haven status. As a yield-less asset, Gold tends to rise with lower interest rates, while higher cost of money usually weighs down on the yellow metal. Still, most moves depend on how the US Dollar (USD) behaves as the asset is priced in dollars (XAU/USD). A strong Dollar tends to keep the price of Gold controlled, whereas a weaker Dollar is likely to push Gold prices up.
- GBP/JPY holds positive ground around 189.20 in Tuesday’s European session.
- The cross remains negative on the 4-hour chart, with the bearish RSI momentum indicator.
- The first upside barrier is located at 189.50; the initial support level is seen at 186.48.
The GBP/JPY cross attracts some buyers to near 189.20 on Tuesday during the early European trading hours. The Pound Sterling (GBP) gains traction after the latest labor market data showed unemployment across the UK has dropped unexpectedly in the three months to June.
The UK Unemployment Rate fell to 4.2% in April-June versus 4.4% prior, the Office for National Statistics (ONS) showed Tuesday. Economists expected the figure to rise to 4.5%. Meanwhile, the Claimant Count Change increased by 135K in July, compared with a revised gain of 32.3K in June, below the estimation of 14.5K by a wide margin.
GBP/JPY keeps the bearish vibe unchanged on the 4-hour chart as it holds below the key 100-period Exponential Moving Average (EMA). However, a further upside cannot be ruled out as the Relative Strength Index (RSI) edges higher above the midline near 61.85.
A decisive break above the upper boundary of the Bollinger Band near 189.50 will see a rise to the 192.00 psychological level. Any follow-through buying above the mentioned level could pave the way to 193.26, a high of August 1.
On the flip side, a low of August 9 at 186.48 acts as an initial support level for the cross. The key contention level emerges in the 185.55-185.60 zone, representing a low of August 8 and the lower limit of the Bollinger Band. The additional downside filter to watch is 182.81, a low of August 6.
GBP/JPY 4-hour chart
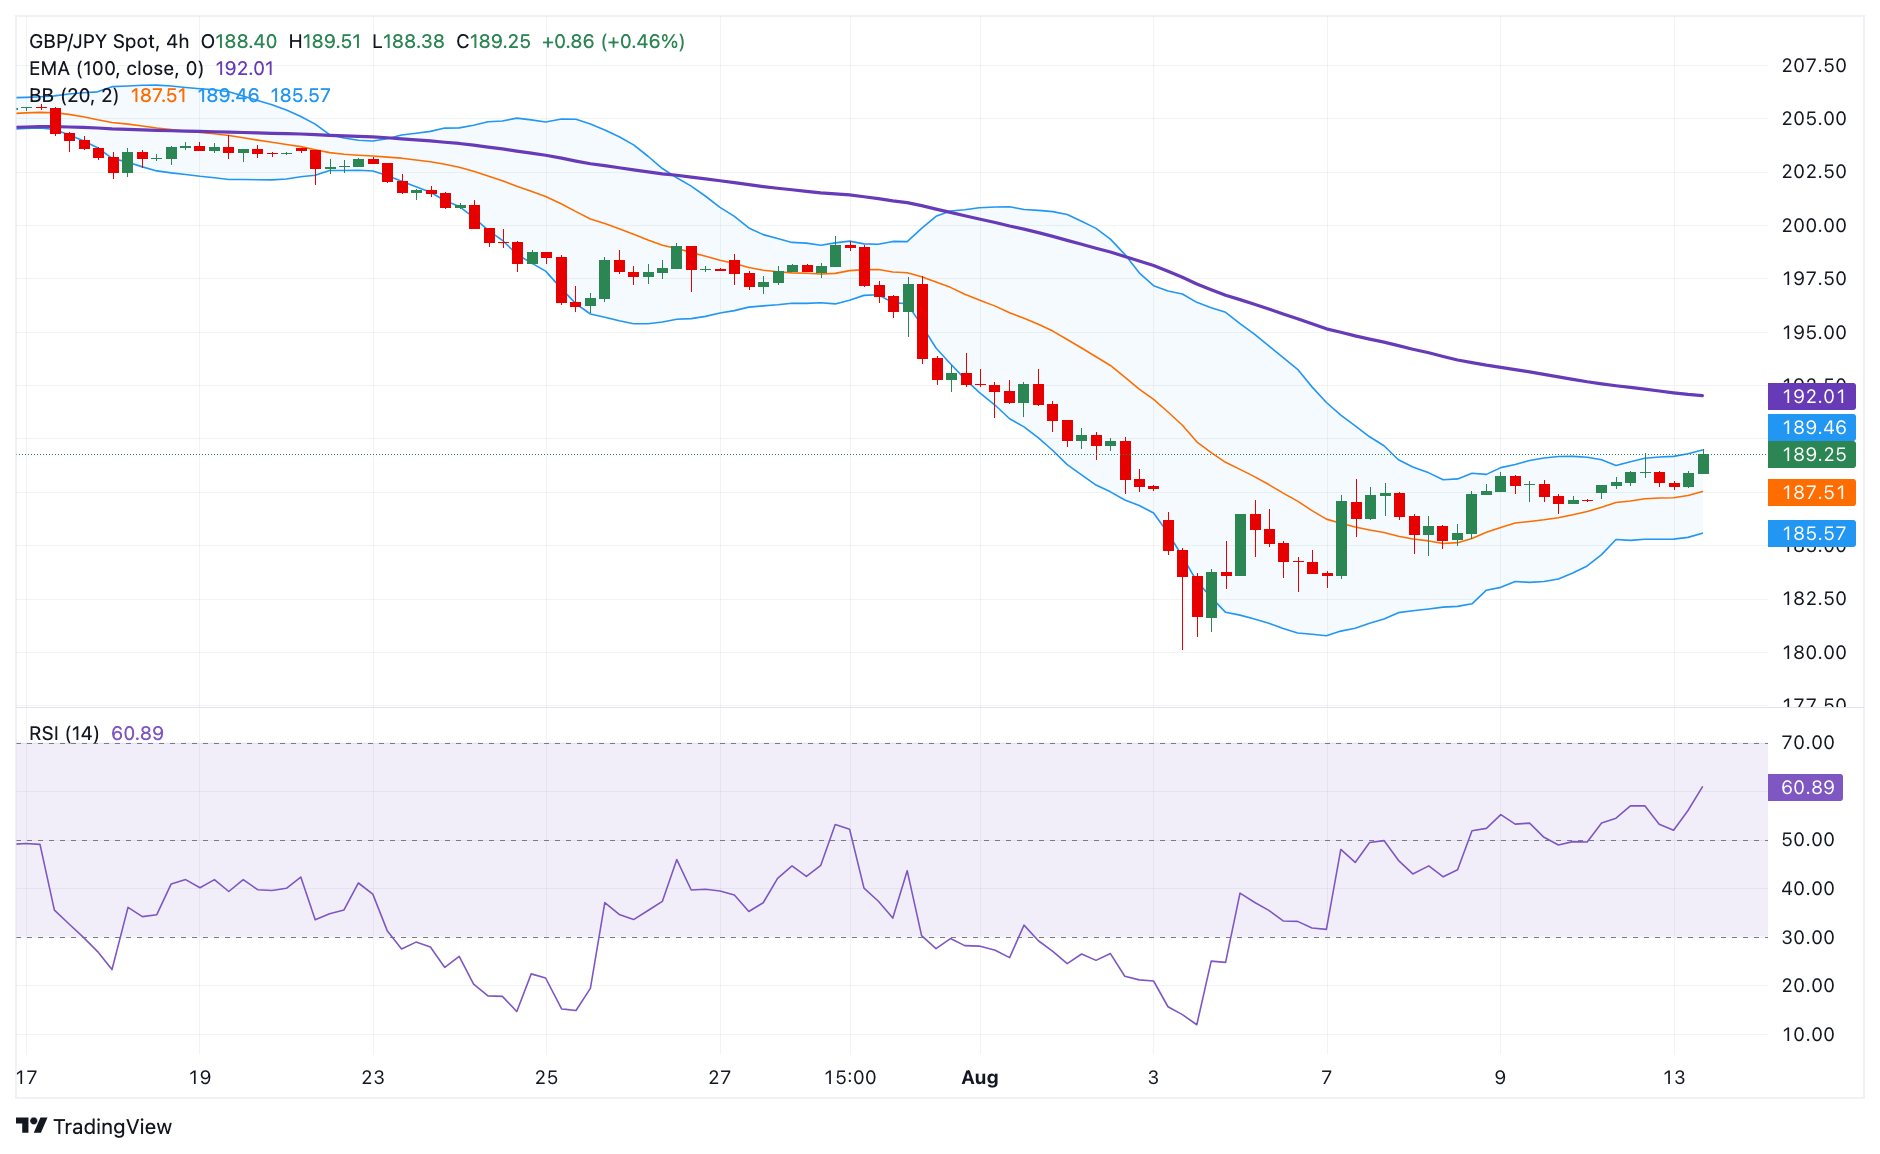
Pound Sterling FAQs
The Pound Sterling (GBP) is the oldest currency in the world (886 AD) and the official currency of the United Kingdom. It is the fourth most traded unit for foreign exchange (FX) in the world, accounting for 12% of all transactions, averaging $630 billion a day, according to 2022 data. Its key trading pairs are GBP/USD, aka ‘Cable’, which accounts for 11% of FX, GBP/JPY, or the ‘Dragon’ as it is known by traders (3%), and EUR/GBP (2%). The Pound Sterling is issued by the Bank of England (BoE).
The single most important factor influencing the value of the Pound Sterling is monetary policy decided by the Bank of England. The BoE bases its decisions on whether it has achieved its primary goal of “price stability” – a steady inflation rate of around 2%. Its primary tool for achieving this is the adjustment of interest rates. When inflation is too high, the BoE will try to rein it in by raising interest rates, making it more expensive for people and businesses to access credit. This is generally positive for GBP, as higher interest rates make the UK a more attractive place for global investors to park their money. When inflation falls too low it is a sign economic growth is slowing. In this scenario, the BoE will consider lowering interest rates to cheapen credit so businesses will borrow more to invest in growth-generating projects.
Data releases gauge the health of the economy and can impact the value of the Pound Sterling. Indicators such as GDP, Manufacturing and Services PMIs, and employment can all influence the direction of the GBP. A strong economy is good for Sterling. Not only does it attract more foreign investment but it may encourage the BoE to put up interest rates, which will directly strengthen GBP. Otherwise, if economic data is weak, the Pound Sterling is likely to fall.
Another significant data release for the Pound Sterling is the Trade Balance. This indicator measures the difference between what a country earns from its exports and what it spends on imports over a given period. If a country produces highly sought-after exports, its currency will benefit purely from the extra demand created from foreign buyers seeking to purchase these goods. Therefore, a positive net Trade Balance strengthens a currency and vice versa for a negative balance.
- USD/CAD loses ground due to improved risk-on sentiment.
- The US Dollar steadies from the reduced bets for a 50 basis point rate cut by the Fed in September.
- The upside of the commodity-linked CAD could be limited due to lower WTI Oil prices.
USD/CAD edges lower to near 1.3740 during the early European session on Tuesday. However, the US Dollar (USD) holds ground due to decreased expectations for a 50 basis point interest rate cut by the US Federal Reserve (Fed) in September.
According to CME’s FedWatch Tool, the probability of 50 basis points (bps) cut in September has dropped to 50%, down from 85% last week. However, the rate markets continue to price in a 100% chance of at least a 25 bps cut at the upcoming meeting.
Investors will likely focus on the US Producer Price Index (PPI) data set to be released on Tuesday and Consumer Price Index (CPI) figures on Wednesday. Traders are looking for confirmation that price growth remains stable in the United States.
The commodity-linked Canadian Dollar (CAD) could face challenges due to lower crude Oil prices, given the fact that Canada is the biggest crude exporter to the United States (US). West Texas Intermediate (WTI) Oil price halts its four-day winning streak, trading around $78.00 per barrel at the time of writing.
WTI crude Oil prices have edged lower amid concerns about demand, following the Organization of the Petroleum Exporting Countries's (OPEC) reduction in its 2024 demand growth forecast due to weaker expectations in China, according to Reuters.
Additionally, the Bank of Canada (BoC) is anticipated to cut interest rates by 25 basis points at both the September and October meetings, which could weaken the Canadian Dollar.
Canadian Dollar FAQs
The key factors driving the Canadian Dollar (CAD) are the level of interest rates set by the Bank of Canada (BoC), the price of Oil, Canada’s largest export, the health of its economy, inflation and the Trade Balance, which is the difference between the value of Canada’s exports versus its imports. Other factors include market sentiment – whether investors are taking on more risky assets (risk-on) or seeking safe-havens (risk-off) – with risk-on being CAD-positive. As its largest trading partner, the health of the US economy is also a key factor influencing the Canadian Dollar.
The Bank of Canada (BoC) has a significant influence on the Canadian Dollar by setting the level of interest rates that banks can lend to one another. This influences the level of interest rates for everyone. The main goal of the BoC is to maintain inflation at 1-3% by adjusting interest rates up or down. Relatively higher interest rates tend to be positive for the CAD. The Bank of Canada can also use quantitative easing and tightening to influence credit conditions, with the former CAD-negative and the latter CAD-positive.
The price of Oil is a key factor impacting the value of the Canadian Dollar. Petroleum is Canada’s biggest export, so Oil price tends to have an immediate impact on the CAD value. Generally, if Oil price rises CAD also goes up, as aggregate demand for the currency increases. The opposite is the case if the price of Oil falls. Higher Oil prices also tend to result in a greater likelihood of a positive Trade Balance, which is also supportive of the CAD.
While inflation had always traditionally been thought of as a negative factor for a currency since it lowers the value of money, the opposite has actually been the case in modern times with the relaxation of cross-border capital controls. Higher inflation tends to lead central banks to put up interest rates which attracts more capital inflows from global investors seeking a lucrative place to keep their money. This increases demand for the local currency, which in Canada’s case is the Canadian Dollar.
Macroeconomic data releases gauge the health of the economy and can have an impact on the Canadian Dollar. Indicators such as GDP, Manufacturing and Services PMIs, employment, and consumer sentiment surveys can all influence the direction of the CAD. A strong economy is good for the Canadian Dollar. Not only does it attract more foreign investment but it may encourage the Bank of Canada to put up interest rates, leading to a stronger currency. If economic data is weak, however, the CAD is likely to fall.
- The Pound Sterling outperforms the US Dollar as upbeat UK Employment data weighs on BoE sequential interest-rate cut bets.
- UK’s Unemployment Rate unexpectedly falls to 4.2%, Average Earnings outperform expectations.
- Investors await the UK/US inflation data for July, which is scheduled for Wednesday.
The Pound Sterling (GBP) delivers a sharp upside move against its major peers in Tuesday’s London session. The British currency strengthens as the United Kingdom (UK) Office for National Statistics (ONS) reported upbeat labor market data for the three months ending in June, which has weighed on market expectations of subsequent interest-rate cuts by the Bank of England (BoE).
The agency reported that the ILO Unemployment Rate unexpectedly declined to 4.2%. Economists expected the jobless rate to have increased to 4.5% from the prior release of 4.4%.
Apart from improving the job market, the slower-than-expected decline in Average Earnings Excluding Bonuses has also dampened expectations of BoE subsequent rate cuts. Average Earnings, a wage growth measure that drives inflation in the service sector, rose at a faster-than-expected pace of 5.4% from the estimates of 4.6% but was slower than the former reading of 5.7%.
On Monday, BoE Monetary Policy Committee (MPC) member Catherine Mann warned that inflation would remain persistent. Mann said, “Goods and services prices were set to rise again, and wage pressures in the economy could take years to dissipate.”
Going forward, more volatility is anticipated in the Pound Sterling as July's UK Consumer Price Index (CPI) data is lined up for release on Wednesday. The CPI report is expected to show that core inflation, which strips off volatile food and energy prices, decelerated to 3.4% from the prior release of 3.5%.
Daily digest market movers: Pound Sterling outperforms its major peers
- The Pound Sterling strengthens against the US Dollar (USD) in Tuesday’s European trading hours. The GBP/USD pair posts a fresh weekly high above 1.2800 as the British currency capitalizes on the upbeat labor market data. Meanwhile, the US Dollar remains sideways, with investors focusing on the United States (US) CPI data for July, which will be published on Wednesday.
- The US Dollar Index (DXY), which tracks the Greenback’s value against six major currencies, steadies above 103.00. The US CPI report is expected to show that monthly headline and core inflation rose by 0.2%. Annual headline and core CPI are estimated to have decelerated by one-tenth to 2.9% and 3.2%, respectively.
- An expected decline in US price pressures would boost expectations of a big interest rate cut announcement by the Federal Reserve (Fed). Currently, the CME FedWatch tool shows that traders see a 49.5% chance that interest rates will be reduced by 50 basis points (bps) in September, which is significantly down from the 68% recorded a week ago.
- Market speculation about a big Fed rate cut in September has diminished due to easing US recession fears, which were prompted by a consistent increase in the Unemployment Rate and slowing labor demand in July.
- According to an aggregate recession probability model by UBS Global Research, the odds of the US economy entering a recession have dropped to 53% in July from 60% recorded a few months ago.
- In Tuesday’s session, the US Dollar will be influenced by the US Producer Price Index (PPI) data for July, which will be published at 12:30 GMT. The report is expected to show that headline and core PPI have grown at a slower pace on a monthly and annual basis.
Technical Analysis: Pound Sterling rises to near 1.2800
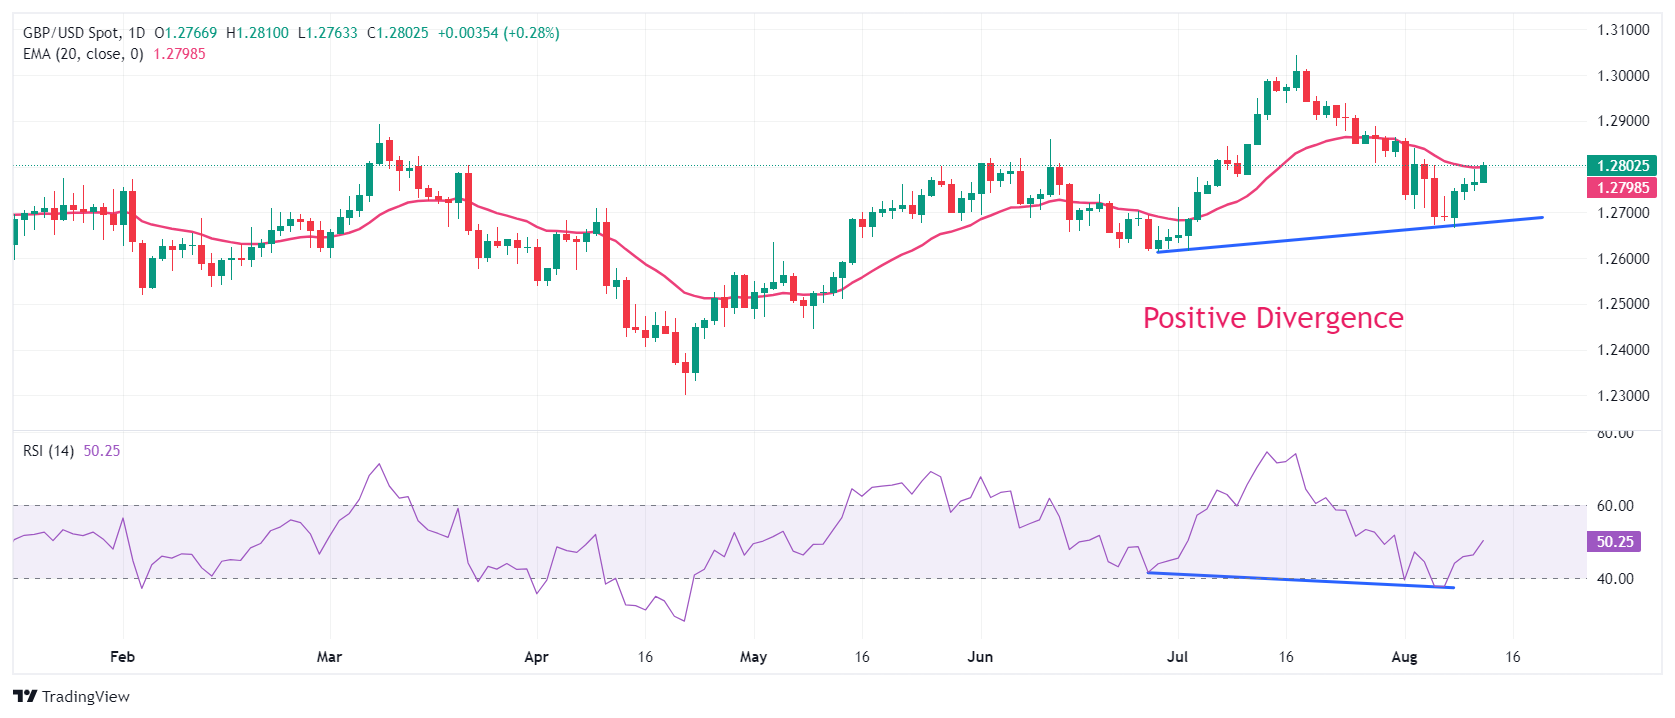
The Pound Sterling climbs to near 1.2800 after a positive divergence formation on a daily timeframe, in which the pair continues to build higher lows while the momentum oscillator makes lower lows. This generally results in a resumption in the uptrend, but it should be confirmed with more indicators.
The 14-day Relative Strength Index (RSI) recovers after finding a cushion near 40.00, exhibiting signs of buying interest at lower levels.
The pair rebounds to near the 20-day Exponential Moving Average (EMA), which trades around 1.2800. The near-term outlook will become bullish if the GBP/USD delivers a decisive break above the 20-day EMA.
On the upside, the August 2 high at 1.2840 and the round level of 1.2900 will act as major resistances for the Pound Sterling. Alternatively, the recovery move could falter if the pair breaks below the August 8 low at 1.2665. This would expose the June 27 low at 1.2613, followed by the April 29 high at 1.2570.
Pound Sterling FAQs
The Pound Sterling (GBP) is the oldest currency in the world (886 AD) and the official currency of the United Kingdom. It is the fourth most traded unit for foreign exchange (FX) in the world, accounting for 12% of all transactions, averaging $630 billion a day, according to 2022 data. Its key trading pairs are GBP/USD, aka ‘Cable’, which accounts for 11% of FX, GBP/JPY, or the ‘Dragon’ as it is known by traders (3%), and EUR/GBP (2%). The Pound Sterling is issued by the Bank of England (BoE).
The single most important factor influencing the value of the Pound Sterling is monetary policy decided by the Bank of England. The BoE bases its decisions on whether it has achieved its primary goal of “price stability” – a steady inflation rate of around 2%. Its primary tool for achieving this is the adjustment of interest rates. When inflation is too high, the BoE will try to rein it in by raising interest rates, making it more expensive for people and businesses to access credit. This is generally positive for GBP, as higher interest rates make the UK a more attractive place for global investors to park their money. When inflation falls too low it is a sign economic growth is slowing. In this scenario, the BoE will consider lowering interest rates to cheapen credit so businesses will borrow more to invest in growth-generating projects.
Data releases gauge the health of the economy and can impact the value of the Pound Sterling. Indicators such as GDP, Manufacturing and Services PMIs, and employment can all influence the direction of the GBP. A strong economy is good for Sterling. Not only does it attract more foreign investment but it may encourage the BoE to put up interest rates, which will directly strengthen GBP. Otherwise, if economic data is weak, the Pound Sterling is likely to fall.
Another significant data release for the Pound Sterling is the Trade Balance. This indicator measures the difference between what a country earns from its exports and what it spends on imports over a given period. If a country produces highly sought-after exports, its currency will benefit purely from the extra demand created from foreign buyers seeking to purchase these goods. Therefore, a positive net Trade Balance strengthens a currency and vice versa for a negative balance.
- EUR/GBP loses momentum around 0.8540 in Tuesday’s European session, down 0.20% on the day.
- UK Unemployment Rate fell to 4.2% in three months to June; Claimant Count Change came in at 135K in July.
- Bloomberg economists expect the ECB to cut its deposit rate once a quarter through the end of next year.
The EUR/GBP cross loses traction near 0.8540 during the early European session on Tuesday. The cross edges lower after the recent mixed UK labor market data. The attention will shift to the German August ZEW survey, which is due later on Tuesday.
Data released by the Office for National Statistics (ONS) on Tuesday showed that the UK ILO Unemployment Rate dropped to 4.2% in the three months to June from 4.4% in the previous period. This figure came in better than the expectation of 4.5%. Meanwhile, the Claimant Count Change increased by 135K in July, compared with a revised gain of 32.3K in June, below the market consensus of 14.5K by a wide margin.
UK Wage inflation, as measured by Average Earnings excluding Bonus climbed 5.4% 3M YoY in June versus 5.7% in May, besting the estimation of a 4.6% rise. Average Earnings including Bonuses also rose by 4.5% in the same period, compared to 5.7% quarter through May. The Pound Sterling attracts some buyers in an immediate reaction to the UK employment report.
On the other hand, the expectation that the European Central Bank (ECB) would ease cycle sooner than previously anticipated weighs on the Euro (EUR). The ECB is likely to cut its deposit rate once a quarter through the end of next year, according to Bloomberg economists. A Bloomberg survey of forecasters indicated that the benchmark is projected to reach 2.25% in December 2025 after six straight quarter-point declines. Previously, respondents projected that this level would be achieved in the second quarter of 2026.
Employment FAQs
Labor market conditions are a key element in assessing the health of an economy and thus a key driver for currency valuation. High employment, or low unemployment, has positive implications for consumer spending and economic growth, boosting the value of the local currency. Moreover, a very tight labor market – a situation in which there is a shortage of workers to fill open positions – can also have implications on inflation levels because low labor supply and high demand leads to higher wages.
The pace at which salaries are growing in an economy is key for policymakers. High wage growth means that households have more money to spend, usually leading to price increases in consumer goods. In contrast to more volatile sources of inflation such as energy prices, wage growth is seen as a key component of underlying and persisting inflation as salary increases are unlikely to be undone. Central banks around the world pay close attention to wage growth data when deciding on monetary policy.
The weight that each central bank assigns to labor market conditions depends on its objectives. Some central banks explicitly have mandates related to the labor market beyond controlling inflation levels. The US Federal Reserve (Fed), for example, has the dual mandate of promoting maximum employment and stable prices. Meanwhile, the European Central Bank’s (ECB) sole mandate is to keep inflation under control. Still, and despite whatever mandates they have, labor market conditions are an important factor for policymakers given their significance as a gauge of the health of the economy and their direct relationship to inflation.
- The UK Unemployment Rate unexpectedly fell to 4.2% in three months to June.
- The Claimant Count Change for Britain arrived at 135K in July.
- GBP/USD jumps to test 1.2800 after mixed UK employment data.
The United Kingdom’s (UK) ILO Unemployment Rate dropped to 4.2% in the three months to June after recording 4.4% in the previous period, the data published by the Office for National Statistics (ONS) showed on Tuesday. The market expectation was for a 4.5% print.
Additional details of the report showed that the number of people claiming jobless benefits increased by 135K in July, compared with a revised gain of 32.3K in June, coming in below the expected 14.5K figure by a wide margin.
The Employment Change data for July arrived at 24K, as against June’s 16K.
Meanwhile, Average Earnings excluding Bonus in the UK rose 5.4% 3M YoY in June versus a 5.7% growth seen in May. The reading matched the expectations of a 4.6% acceleration.
Another measure of wage inflation, Average Earnings including Bonus also increased by 4.5% in the same period, having risen by 5.7% quarter through May.
GBP/USD reaction to the UK employment report
GBP/USD picked up fresh bids in a knee-jerk reaction to the mixed UK employment data. The pair is trading 0.24% higher on the day at 1.2795, as of writing.
British Pound PRICE Today
The table below shows the percentage change of British Pound (GBP) against listed major currencies today. British Pound was the strongest against the Japanese Yen.
| USD | EUR | GBP | JPY | CAD | AUD | NZD | CHF | |
|---|---|---|---|---|---|---|---|---|
| USD | -0.06% | -0.21% | 0.31% | -0.01% | -0.07% | 0.22% | 0.12% | |
| EUR | 0.06% | -0.16% | 0.37% | 0.01% | -0.03% | -0.22% | 0.18% | |
| GBP | 0.21% | 0.16% | 0.55% | 0.19% | 0.13% | -0.04% | 0.37% | |
| JPY | -0.31% | -0.37% | -0.55% | -0.36% | -0.39% | -0.59% | -0.17% | |
| CAD | 0.01% | -0.01% | -0.19% | 0.36% | -0.06% | -0.25% | 0.16% | |
| AUD | 0.07% | 0.03% | -0.13% | 0.39% | 0.06% | -0.17% | 0.24% | |
| NZD | -0.22% | 0.22% | 0.04% | 0.59% | 0.25% | 0.17% | 0.42% | |
| CHF | -0.12% | -0.18% | -0.37% | 0.17% | -0.16% | -0.24% | -0.42% |
The heat map shows percentage changes of major currencies against each other. The base currency is picked from the left column, while the quote currency is picked from the top row. For example, if you pick the British Pound from the left column and move along the horizontal line to the US Dollar, the percentage change displayed in the box will represent GBP (base)/USD (quote).
- USD/CHF trades in positive territory for the second consecutive day near 0.8670 in Tuesday’s Asian session.
- Investors await the US July PPI report, which is due later on Tuesday.
- The safe-haven flows might support the CHF and cap the pair’s upside.
The USD/CHF pair trades with a bullish bias around 0.8670 during the early European session on Tuesday. Traders prefer to wait on the sidelines ahead of the US key economic data this week. The US Producer Price Index (PPI), Consumer Price Index (CPI) and Retail Sales will be released on Tuesday, Wednesday, and Thursday, respectively.
Traders have priced in nearly 47.5% odds that the US Federal Reserve (Fed) will cut the interest rate by 50 basis points (bps) at its September meeting, down from 52.5% last Friday, according to the CME FedWatch Tool. If the US inflation data this week show that the inflation remains elevated, this could diminish the odds of a Fed rate cut and lift the US Dollar (USD).
The US Producer Price Index (PPI) is projected to ease to 0.1% month-over-month in July from 0.2% in the previous reading. The CPI inflation is estimated to drop from 3.0% YoY in July to 2.9% in June.
On the other hand, rising geopolitical tensions in the Middle East and economic uncertainty might boost the safe-haven currency like the Swiss Franc (CHF). On Monday, Israel intensified its operations in the southern Gaza city of Khan Younis, raising the prospect of a wider Middle East conflict. Israel is also bracing for an impending attack from Iran and the Lebanese militia Hezbollah in retaliation for the killing of Hamas leader Ismail Haniyeh in Tehran in late July.
Swiss Franc FAQs
The Swiss Franc (CHF) is Switzerland’s official currency. It is among the top ten most traded currencies globally, reaching volumes that well exceed the size of the Swiss economy. Its value is determined by the broad market sentiment, the country’s economic health or action taken by the Swiss National Bank (SNB), among other factors. Between 2011 and 2015, the Swiss Franc was pegged to the Euro (EUR). The peg was abruptly removed, resulting in a more than 20% increase in the Franc’s value, causing a turmoil in markets. Even though the peg isn’t in force anymore, CHF fortunes tend to be highly correlated with the Euro ones due to the high dependency of the Swiss economy on the neighboring Eurozone.
The Swiss Franc (CHF) is considered a safe-haven asset, or a currency that investors tend to buy in times of market stress. This is due to the perceived status of Switzerland in the world: a stable economy, a strong export sector, big central bank reserves or a longstanding political stance towards neutrality in global conflicts make the country’s currency a good choice for investors fleeing from risks. Turbulent times are likely to strengthen CHF value against other currencies that are seen as more risky to invest in.
The Swiss National Bank (SNB) meets four times a year – once every quarter, less than other major central banks – to decide on monetary policy. The bank aims for an annual inflation rate of less than 2%. When inflation is above target or forecasted to be above target in the foreseeable future, the bank will attempt to tame price growth by raising its policy rate. Higher interest rates are generally positive for the Swiss Franc (CHF) as they lead to higher yields, making the country a more attractive place for investors. On the contrary, lower interest rates tend to weaken CHF.
Macroeconomic data releases in Switzerland are key to assessing the state of the economy and can impact the Swiss Franc’s (CHF) valuation. The Swiss economy is broadly stable, but any sudden change in economic growth, inflation, current account or the central bank’s currency reserves have the potential to trigger moves in CHF. Generally, high economic growth, low unemployment and high confidence are good for CHF. Conversely, if economic data points to weakening momentum, CHF is likely to depreciate.
As a small and open economy, Switzerland is heavily dependent on the health of the neighboring Eurozone economies. The broader European Union is Switzerland’s main economic partner and a key political ally, so macroeconomic and monetary policy stability in the Eurozone is essential for Switzerland and, thus, for the Swiss Franc (CHF). With such dependency, some models suggest that the correlation between the fortunes of the Euro (EUR) and the CHF is more than 90%, or close to perfect.
Gold prices fell in India on Tuesday, according to data compiled by FXStreet.
The price for Gold stood at 6,639.65 Indian Rupees (INR) per gram, down compared with the INR 6,675.44 it cost on Monday.
The price for Gold decreased to INR 77,443.56 per tola from INR 77,861.04 per tola a day earlier.
| Unit measure | Gold Price in INR |
|---|---|
| 1 Gram | 6,639.65 |
| 10 Grams | 66,396.49 |
| Tola | 77,443.56 |
| Troy Ounce | 206,516.30 |
FXStreet calculates Gold prices in India by adapting international prices (USD/INR) to the local currency and measurement units. Prices are updated daily based on the market rates taken at the time of publication. Prices are just for reference and local rates could diverge slightly.
Gold FAQs
Gold has played a key role in human’s history as it has been widely used as a store of value and medium of exchange. Currently, apart from its shine and usage for jewelry, the precious metal is widely seen as a safe-haven asset, meaning that it is considered a good investment during turbulent times. Gold is also widely seen as a hedge against inflation and against depreciating currencies as it doesn’t rely on any specific issuer or government.
Central banks are the biggest Gold holders. In their aim to support their currencies in turbulent times, central banks tend to diversify their reserves and buy Gold to improve the perceived strength of the economy and the currency. High Gold reserves can be a source of trust for a country’s solvency. Central banks added 1,136 tonnes of Gold worth around $70 billion to their reserves in 2022, according to data from the World Gold Council. This is the highest yearly purchase since records began. Central banks from emerging economies such as China, India and Turkey are quickly increasing their Gold reserves.
Gold has an inverse correlation with the US Dollar and US Treasuries, which are both major reserve and safe-haven assets. When the Dollar depreciates, Gold tends to rise, enabling investors and central banks to diversify their assets in turbulent times. Gold is also inversely correlated with risk assets. A rally in the stock market tends to weaken Gold price, while sell-offs in riskier markets tend to favor the precious metal.
The price can move due to a wide range of factors. Geopolitical instability or fears of a deep recession can quickly make Gold price escalate due to its safe-haven status. As a yield-less asset, Gold tends to rise with lower interest rates, while higher cost of money usually weighs down on the yellow metal. Still, most moves depend on how the US Dollar (USD) behaves as the asset is priced in dollars (XAU/USD). A strong Dollar tends to keep the price of Gold controlled, whereas a weaker Dollar is likely to push Gold prices up.
(An automation tool was used in creating this post.)
FX option expiries for Aug 13 NY cut at 10:00 Eastern Time, via DTCC, can be found below.
EUR/USD: EUR amounts
- 1.0820 1.9b
- 1.0865 687m
- 1.0900 2b
- 1.0930 896m
- 1.0960 849m
AUD/USD: AUD amounts
- 0.6575 1.5b
- 0.6675 1.1b
- GBP/JPY extends its gains ahead of the release of UK labor market data on Tuesday.
- The UK Claimant Count Change is anticipated to report a decline in jobless benefits claims for July.
- Japan's parliament will hold a special session to discuss the BoJ’s last interest rate hike.
GBP/JPY continues to gain ground for the second successive day, trading around 188.70 during the Asian hours on Tuesday. The Pound Sterling (GBP) receives support from Monday’s hawkish remarks by the Bank of England (BoE) policymaker Catherine Mann.
In a podcast with the Financial Times (FT), BoE policymaker Mann raised concerns about UK wage growth, identifying it as a major inflation issue. She pointed out that services inflation continues to exceed 5% annually, making it challenging to reach the 2% headline inflation target.
Traders are now awaiting the release of monthly UK employment data on Tuesday, with expecting Claimant Count Change, claiming jobless benefits, declining to 14.5K for July, from the previous 32.3K reading. Furthermore, UK consumer inflation data are expected to show mixed figures on Wednesday.
The upside of risk-sensitive currencies like the British Pound could be restrained due to rising geopolitical tensions in the Middle East. Safe-haven flows might have contributed support for the Japanese Yen (JPY), limiting the upside of the GBP/JPY cross.
Israeli forces pressed on with their operations near the southern Gaza city of Khan Younis on Monday. CBC News cited Palestinian medics saying Israeli military strikes on Khan Younis on Monday killed at least 18 people.
Japan's parliament is set to hold a special session on August 23 to discuss the Bank of Japan's (BoJ) decision to raise interest rates last month. The session, organized by the lower house financial affairs committee, is anticipated to invite BoJ Governor Kazuo Ueda to attend, according to government sources cited by Reuters.
Economic Indicator
Claimant Count Change
The Claimant Count Change released by the UK Office for National Statistics presents the change in the number of unemployed people in the UK claiming benefits. There is a tendency for the metric to influence GBP volatility. Usually, a rise in the indicator has negative implications for consumer spending and economic growth. Generally, a high reading is seen as bearish for the Pound Sterling (GBP), while a low reading is seen as bullish.
Read more.Next release: Tue Aug 13, 2024 06:00
Frequency: Monthly
Consensus: 14.5K
Previous: 32.3K
Source: Office for National Statistics
The change in the number of those claiming jobless benefits is an early gauge of the UK’s labor market. The figures are released for the previous month, contrary to the Unemployment Rate, which is for the prior one. This release is scheduled around the middle of the month. An increase in applications is a sign of a worsening economic situation and implies looser monetary policy, while a decrease indicates improving conditions. A higher-than-expected outcome tends to be GBP-bearish.
- EUR/USD gains ground near 1.0940 in Tuesday’s Asian session.
- The odds for a 50 bps rate cut by the Fed might undermine the USD and create a tailwind for the pair.
- Traders await the German August ZEW survey and the US July PPI report for fresh impetus.
The EUR/USD pair trades in positive territory around 1.0940 during the Asian session on Tuesday. The major pair posts modest gains amid the consolidation of the Greenback. The release of the US Producer Price Index (PPI) will be in the spotlight later on Tuesday. The headline PPI is estimated to ease to 0.1% month-over-month in July from 0.2% in the previous reading, while the Core PPI is forecasted to drop to 2.7% YoY in July from 3.0% in June.
Markets have fully priced in the chance of at least 25 basis points (bps) rate cuts in September and a strong likelihood that the Fed will lower by a full percentage point by the end of the year. Morgan Stanley analysts stated on Monday their forecast for a 25 basis point (bps) rate cut by the Federal Reserve (Fed) in September, maintaining a stance despite the current global market downturn. The rising bets on the Fed rate cut are likely to weigh on the US Dollar (USD) and create a tailwind for EUR/USD for the time being.
Across the pond, the German ZEW Expectations are expected to arrive at 31.8 in August versus 41.8 in July, while the current assessment is expected to show -75.0 in August versus -68.9 prior. The weaker-than-expected data will contribute to a negative outlook in the economy and might keep the European Central Bank (ECB) in easing mode, with a September 12 rate cut fully priced in.
Euro FAQs
The Euro is the currency for the 20 European Union countries that belong to the Eurozone. It is the second most heavily traded currency in the world behind the US Dollar. In 2022, it accounted for 31% of all foreign exchange transactions, with an average daily turnover of over $2.2 trillion a day. EUR/USD is the most heavily traded currency pair in the world, accounting for an estimated 30% off all transactions, followed by EUR/JPY (4%), EUR/GBP (3%) and EUR/AUD (2%).
The European Central Bank (ECB) in Frankfurt, Germany, is the reserve bank for the Eurozone. The ECB sets interest rates and manages monetary policy. The ECB’s primary mandate is to maintain price stability, which means either controlling inflation or stimulating growth. Its primary tool is the raising or lowering of interest rates. Relatively high interest rates – or the expectation of higher rates – will usually benefit the Euro and vice versa. The ECB Governing Council makes monetary policy decisions at meetings held eight times a year. Decisions are made by heads of the Eurozone national banks and six permanent members, including the President of the ECB, Christine Lagarde.
Eurozone inflation data, measured by the Harmonized Index of Consumer Prices (HICP), is an important econometric for the Euro. If inflation rises more than expected, especially if above the ECB’s 2% target, it obliges the ECB to raise interest rates to bring it back under control. Relatively high interest rates compared to its counterparts will usually benefit the Euro, as it makes the region more attractive as a place for global investors to park their money.
Data releases gauge the health of the economy and can impact on the Euro. Indicators such as GDP, Manufacturing and Services PMIs, employment, and consumer sentiment surveys can all influence the direction of the single currency. A strong economy is good for the Euro. Not only does it attract more foreign investment but it may encourage the ECB to put up interest rates, which will directly strengthen the Euro. Otherwise, if economic data is weak, the Euro is likely to fall. Economic data for the four largest economies in the euro area (Germany, France, Italy and Spain) are especially significant, as they account for 75% of the Eurozone’s economy.
Another significant data release for the Euro is the Trade Balance. This indicator measures the difference between what a country earns from its exports and what it spends on imports over a given period. If a country produces highly sought after exports then its currency will gain in value purely from the extra demand created from foreign buyers seeking to purchase these goods. Therefore, a positive net Trade Balance strengthens a currency and vice versa for a negative balance.
- GBP/USD gains positive traction for the fourth successive day on Tuesday.
- Dovish Fed expectations undermine the USD and lend support to the pair.
- Traders now look to UK jobs data for some impetus ahead of the US PPI.
The GBP/USD pair attracts some dip-buyers during the Asian session on Tuesday and climbs to a fresh daily peak, around the 1.2775-1.2780 region in the last hour. Spot prices, however, remain confined in the previous day's broader trading range as traders keenly await important macro data from the UK and the US before placing fresh directional bets.
The monthly UK employment report and the US Producer Price Index (PPI) will be published later today, which will be followed by the latest consumer inflation figures from the UK and the US on Wednesday. This, along with the release of the Preliminary UK Q2 GDP on Thursday, will play a key role in influencing the sentiment surrounding the British Pound (GBP) and provide a fresh directional impetus to the GBP/USD pair.
In the meantime, expectations that the Bank of England (BoE) will lower borrowing costs two more times this year, after the first rate cut since 2020 on August 1, might continue to undermine the GBP. The US Dollar (USD), on the other hand, struggles to attract any meaningful buyers in the wake of rising bets for bigger rate cuts by the Federal Reserve (Fed). This warrants caution before placing bullish bets around the GBP/USD pair.
From a technical perspective, spot prices last week showed some resilience below the 100-day Simple Moving Average (SMA) and staged a goodish recovery from the 1.2665 region, or over a one-month low. This, along with the fact that oscillators have turned neutral on the daily chart, supports prospects for a further appreciating move. That said, a sustained strength beyond the 1.2800 mark is needed to confirm the positive outlook.
Economic Indicator
Claimant Count Change
The Claimant Count Change released by the UK Office for National Statistics presents the change in the number of unemployed people in the UK claiming benefits. There is a tendency for the metric to influence GBP volatility. Usually, a rise in the indicator has negative implications for consumer spending and economic growth. Generally, a high reading is seen as bearish for the Pound Sterling (GBP), while a low reading is seen as bullish.
Read more.Next release: Tue Aug 13, 2024 06:00
Frequency: Monthly
Consensus: 14.5K
Previous: 32.3K
Source: Office for National Statistics
The change in the number of those claiming jobless benefits is an early gauge of the UK’s labor market. The figures are released for the previous month, contrary to the Unemployment Rate, which is for the prior one. This release is scheduled around the middle of the month. An increase in applications is a sign of a worsening economic situation and implies looser monetary policy, while a decrease indicates improving conditions. A higher-than-expected outcome tends to be GBP-bearish.
- Silver price edges lower as traders ease back on a deeper rate cut by the Fed in September.
- CME’s FedWatch Tool suggests odds of a 50 basis points cut by the Fed in September have dropped to 50%.
- Israeli forces continued their operations near the southern Gaza city of Khan Younis on Monday.
Silver price (XAG/USD) retraces its recent gains from the previous session, trading around $27.70 during the Asian session on Tuesday. This downside could be attributed to diminished expectations for a 50-basis point interest rate cut by the US Federal Reserve in September.
US Federal Reserve (Fed) in September. According to CME’s FedWatch Tool, the probability of 50 basis points (bps) cut in September has dropped to 50%, down from 85% last week. However, the rate markets continue to price in a 100% chance of at least a 25 bps cut at the upcoming meeting.
Traders are likely to focus on US producer inflation data due on Tuesday and consumer inflation figures on Wednesday, looking for confirmation that price growth remains stable in the United States (US).
The downside of safe-haven metals like Silver could be restrained due to rising geopolitical tensions in the Middle East. Israeli forces pressed on with their operations near the southern Gaza city of Khan Younis on Monday. CBC News cited Palestinian medics saying Israeli military strikes on Khan Younis on Monday killed at least 18 people.
On Monday, Israel Defense Forces (IDF) intercepted around 30 "projectiles" crossing from Lebanon into northern Israel early Monday. The IDF stated that some projectiles landed in open areas, and no injuries were reported, as reported by ABC News.
Silver FAQs
Silver is a precious metal highly traded among investors. It has been historically used as a store of value and a medium of exchange. Although less popular than Gold, traders may turn to Silver to diversify their investment portfolio, for its intrinsic value or as a potential hedge during high-inflation periods. Investors can buy physical Silver, in coins or in bars, or trade it through vehicles such as Exchange Traded Funds, which track its price on international markets.
Silver prices can move due to a wide range of factors. Geopolitical instability or fears of a deep recession can make Silver price escalate due to its safe-haven status, although to a lesser extent than Gold's. As a yieldless asset, Silver tends to rise with lower interest rates. Its moves also depend on how the US Dollar (USD) behaves as the asset is priced in dollars (XAG/USD). A strong Dollar tends to keep the price of Silver at bay, whereas a weaker Dollar is likely to propel prices up. Other factors such as investment demand, mining supply – Silver is much more abundant than Gold – and recycling rates can also affect prices.
Silver is widely used in industry, particularly in sectors such as electronics or solar energy, as it has one of the highest electric conductivity of all metals – more than Copper and Gold. A surge in demand can increase prices, while a decline tends to lower them. Dynamics in the US, Chinese and Indian economies can also contribute to price swings: for the US and particularly China, their big industrial sectors use Silver in various processes; in India, consumers’ demand for the precious metal for jewellery also plays a key role in setting prices.
Silver prices tend to follow Gold's moves. When Gold prices rise, Silver typically follows suit, as their status as safe-haven assets is similar. The Gold/Silver ratio, which shows the number of ounces of Silver needed to equal the value of one ounce of Gold, may help to determine the relative valuation between both metals. Some investors may consider a high ratio as an indicator that Silver is undervalued, or Gold is overvalued. On the contrary, a low ratio might suggest that Gold is undervalued relative to Silver.
- AUD/JPY regains positive traction following the overnight pullback from over a one-week top.
- The RBA’s hawkish stance, along with a positive risk tone, underpins the risk-sensitive Aussie
- Geopolitical risks and BoJ rate cut bets help limit the JPY losses, warranting caution for bulls.
The AUD/JPY cross attracts some buyers for the second straight day on Tuesday and remains well within the striking distance of a one-and-half-week top, around the 97.85 region touched the previous day. Spot prices currently trade around the 97.15-97.20 region, up nearly 0.25% for the day and draw support from a combination of factors.
The Australian Dollar (AUD) continues to be underpinned by the Reserve Bank of Australia's (RBA) stance, showing readiness to hike interest rates further to combat still sticky inflation. In fact, RBA Governor Michele Bullock last week emphasized the need to stay vigilant about inflation risks and said that the central bank will not hesitate to tighten monetary policy again if needed. This, along with a mildly offered tone surrounding the Japanese Yen (JPY), turns out to be a key factor acting as a tailwind for the AUD/JPY cross.
A former Bank of Japan (BoJ) board member Makoto Sakurai said on Monday that the central bank will not be able to hike again in 2024 and predicted a rate hike by March 2025. This comes on top of the recent dovish remarks by BoJ Deputy Governor Shinichi Uchida, saying that the central bank won't hike rates when markets are unstable. Apart from this, the upbeat market mood dents the Japanese Yen's (JPY) safe-haven demand and benefits the risk-sensitive Aussie, lending additional support to the AUD/JPY cross.
That said, persistent geopolitical risks stemming from the ongoing conflicts in the Middle East and the protracted Russia-Ukraine war should keep a lid on any market optimism. Furthermore, the BoJ's summary of opinions from the July policy meeting released last week indicated that some members see room for further rate hikes and policy normalization, which should help limit deeper JPY losses and cap the AUD/JPY cross. This, in turn, warrants some caution before positioning for any further appreciating move.
Bank of Japan FAQs
The Bank of Japan (BoJ) is the Japanese central bank, which sets monetary policy in the country. Its mandate is to issue banknotes and carry out currency and monetary control to ensure price stability, which means an inflation target of around 2%.
The Bank of Japan has embarked in an ultra-loose monetary policy since 2013 in order to stimulate the economy and fuel inflation amid a low-inflationary environment. The bank’s policy is based on Quantitative and Qualitative Easing (QQE), or printing notes to buy assets such as government or corporate bonds to provide liquidity. In 2016, the bank doubled down on its strategy and further loosened policy by first introducing negative interest rates and then directly controlling the yield of its 10-year government bonds.
The Bank’s massive stimulus has caused the Yen to depreciate against its main currency peers. This process has exacerbated more recently due to an increasing policy divergence between the Bank of Japan and other main central banks, which have opted to increase interest rates sharply to fight decades-high levels of inflation. The BoJ’s policy of holding down rates has led to a widening differential with other currencies, dragging down the value of the Yen.
A weaker Yen and the spike in global energy prices have led to an increase in Japanese inflation, which has exceeded the BoJ’s 2% target. With wage inflation becoming a cause of concern, the BoJ looks to move away from ultra loose policy, while trying to avoid slowing the activity too much.
- The downside of the Japanese Yen could be restrained by safe-haven flows amid Middle East tensions.
- Japan's parliament will hold a special session to discuss the BoJ’s last interest rate hike.
- CME’s FedWatch Tool suggests odds of a 50 basis points cut by the Fed in September have dropped to 50%.
The Japanese Yen (JPY) extends its losses against the US Dollar (USD) on Tuesday. The safe-haven flows might limit the downside for the Yen, which could be attributed to rising geopolitical tensions in the Middle East.
Japan's parliament is scheduled to hold a special session on August 23 to discuss the Bank of Japan's (BoJ) decision to raise interest rates last month. The session, organized by the lower house financial affairs committee, is expected to invite BoJ Governor Kazuo Ueda to attend, according to government sources cited by Reuters.
The USD/JPY pair receives support as the pressure on the US Dollar eases due to decreased expectations for a 50 basis point interest rate cut by the US Federal Reserve (Fed) in September. According to CME’s FedWatch Tool, the probability of 50 basis points (bps) cut in September has dropped to 50%, down from 85% last week. However, the rate markets continue to price in a 100% chance of at least a 25 bps cut at the upcoming meeting.
Daily Digest Market Movers: Japanese Yen declines as odds of a 50 bps Fed rate cut diminish
- On Sunday, Federal Reserve Governor Michelle Bowman stated that she continues to see upside risks for inflation and ongoing strength in the labor market. Bowman suggested that the Federal Reserve may not be prepared to cut rates at its next meeting in September, according to Bloomberg.
- As per a Bloomberg report last week, JP Morgan Asset Management (JPAM) believes the Bank of Japan is unlikely to raise interest rates in the near term. According to JPAM, the BoJ may only consider further rate hikes if the Federal Reserve cuts rates and the US economy stabilizes. They anticipate that any additional tightening by the BoJ is more likely to occur in 2025, provided the global economic environment remains stable.
- The Bank of Japan’s Summary of Opinions from the Monetary Policy Meeting on July 30 and 31 indicated that several members believe economic activity and prices are evolving as expected by the BoJ. They are aiming for a neutral rate of "at least around 1%" as a medium-term target.
- Last week, BoJ Deputy Governor Shinichi Uchida also noted that BoJ's interest rate strategy will adapt if market volatility alters economic forecasts, risk assessments, or projections. Given recent market volatility, he emphasized the need for careful monitoring of the economic and price impacts of their policies, stating, “We must maintain the current degree of monetary easing for the time being.”
- The minutes from the Bank of Japan's June meeting indicated that some members voiced concerns about rising import prices due to the recent decline in the JPY, which could present an upside risk to inflation. One member highlighted that cost-push inflation might exacerbate underlying inflation if it leads to increased inflation expectations and wage hikes.
Technical Analysis: USD/JPY tests 147.50; next barrier at nine-day EMA
USD/JPY trades around 147.40 on Tuesday. The daily chart analysis shows that the pair remains below the nine-day Exponential Moving Average (EMA), suggesting a bearish trend in the short term. Moreover, the 14-day Relative Strength Index (RSI) has breached above the 30 level, suggesting a potential for a correction. If the RSI moves toward the 50 level, it could signal a potential improvement in the pair's momentum.
For support levels, the USD/JPY pair may test a seven-month low at 141.69, recorded on August 5, followed by the throwback support at 140.25.
On the upside, the USD/JPY pair could test the immediate barrier at the nine-day EMA around the 147.72 level. A breakout above this level could diminish bearish momentum and allow the pair to approach the 5-day EMA at 153.68, followed by the "throwback support turned resistance" at 154.50.
USD/JPY: Daily Chart
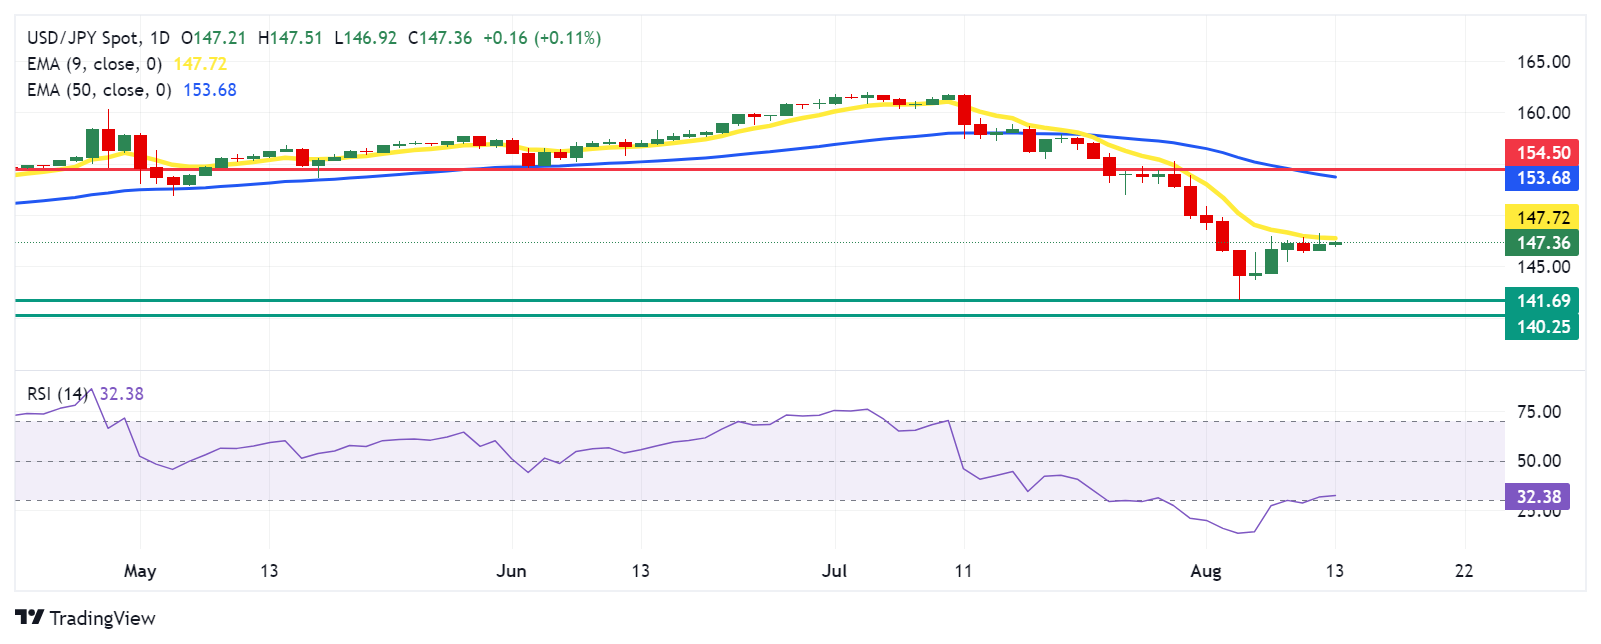
Japanese Yen PRICE Today
The table below shows the percentage change of Japanese Yen (JPY) against listed major currencies today. Japanese Yen was the weakest against the New Zealand Dollar.
| USD | EUR | GBP | JPY | CAD | AUD | NZD | CHF | |
|---|---|---|---|---|---|---|---|---|
| USD | -0.06% | -0.06% | 0.12% | -0.04% | -0.10% | 0.24% | 0.04% | |
| EUR | 0.06% | -0.01% | 0.18% | -0.02% | -0.06% | -0.21% | 0.10% | |
| GBP | 0.06% | 0.00% | 0.19% | 0.01% | -0.05% | -0.18% | 0.14% | |
| JPY | -0.12% | -0.18% | -0.19% | -0.20% | -0.22% | -0.38% | -0.07% | |
| CAD | 0.04% | 0.02% | -0.01% | 0.20% | -0.06% | -0.21% | 0.11% | |
| AUD | 0.10% | 0.06% | 0.05% | 0.22% | 0.06% | -0.12% | 0.19% | |
| NZD | -0.24% | 0.21% | 0.18% | 0.38% | 0.21% | 0.12% | 0.32% | |
| CHF | -0.04% | -0.10% | -0.14% | 0.07% | -0.11% | -0.19% | -0.32% |
The heat map shows percentage changes of major currencies against each other. The base currency is picked from the left column, while the quote currency is picked from the top row. For example, if you pick the Japanese Yen from the left column and move along the horizontal line to the US Dollar, the percentage change displayed in the box will represent JPY (base)/USD (quote).
Interest rates FAQs
Interest rates are charged by financial institutions on loans to borrowers and are paid as interest to savers and depositors. They are influenced by base lending rates, which are set by central banks in response to changes in the economy. Central banks normally have a mandate to ensure price stability, which in most cases means targeting a core inflation rate of around 2%. If inflation falls below target the central bank may cut base lending rates, with a view to stimulating lending and boosting the economy. If inflation rises substantially above 2% it normally results in the central bank raising base lending rates in an attempt to lower inflation.
Higher interest rates generally help strengthen a country’s currency as they make it a more attractive place for global investors to park their money.
Higher interest rates overall weigh on the price of Gold because they increase the opportunity cost of holding Gold instead of investing in an interest-bearing asset or placing cash in the bank. If interest rates are high that usually pushes up the price of the US Dollar (USD), and since Gold is priced in Dollars, this has the effect of lowering the price of Gold.
The Fed funds rate is the overnight rate at which US banks lend to each other. It is the oft-quoted headline rate set by the Federal Reserve at its FOMC meetings. It is set as a range, for example 4.75%-5.00%, though the upper limit (in that case 5.00%) is the quoted figure. Market expectations for future Fed funds rate are tracked by the CME FedWatch tool, which shapes how many financial markets behave in anticipation of future Federal Reserve monetary policy decisions.
- The Indian Rupee drifts lower in Tuesday’s Asian session.
- The weakness of Asian peers, higher crude oil prices and softer Indian CPI data weigh on the INR.
- Investors will monitor the US July PPI, which is due on Tuesday.
The Indian Rupee (INR) weakens on Tuesday despite the US Dollar (USD) trading in a consolidative theme. The combination of a decline in its Asian peers, the rise of crude oil prices, the softer Indian inflation data and a cautious mood in the market ahead of key US economic data contribute to the INR’s downside. However, the likely intervention by the Reserve Bank of India (RBI) to sell USD to prevent local currency from a more significant depreciation could limit the pair’s upside.
Traders will focus on the US Producer Price Index (PPI) for July for fresh impetus. On Wednesday, the US Consumer Price Index (CPI) will offer some hints about the Federal Reserve's (Fed) decisions regarding rate cuts. On the Indian docket, the Wholesale Price Index (WPI) inflation will be closely monitored, which is estimated to ease from 3.36% YoY in June to 2.39% in July.
Daily Digest Market Movers: Indian Rupee remains weak amid multiple headwinds
- India’s CPI inflation eased to 3.54% YoY in July from 5.08% in June. This figure registered the lowest since August 2019, according to official data released on Monday.
- Indian Industrial Production rose by 4.2% in June, compared to 6.2% in the previous reading, worse than the expectation of 5.5%.
- The swaps market is pricing in steady rates by the RBI over the next three months. However, this is followed by 25 basis points (bps) of easing over the subsequent three months, followed by another 25 bps over the subsequent six months.
- The CME FedWatch Tool showed the possibility of a 50 basis points (bps) interest rate cut by the Fed at the September meeting at 47.5%, down from 52.5% last Friday.
- The US Producer Price Index (PPI) is estimated to ease to 0.1% month-over-month in July from 0.2% in the previous reading.
Technical Analysis: USD/INR’s broader outlook is still positive
Indian Rupee trades weaker on the day. The USD/INR pair maintains a constructive outlook on the daily timeframe, with the price holding above the key 100-day Exponential Moving Average (EMA) and the two-month-old uptrend line. The 14-day Relative Strength Index (RSI) is well-supported above the midline near 65.50, suggesting the path of least resistance level is to the upside.
The 84.00 psychological barrier appears to be a tough nut to crack for USD/INR buyers. A decisive bullish breakout above this level could pave the way to the all-time high of 84.24. Extended gains could see a rally to 84.50.
On the flip side, the initial support level is seen near the uptrend line at 83.84. A breach of this level could expose the 100-day EMA at 83.52.
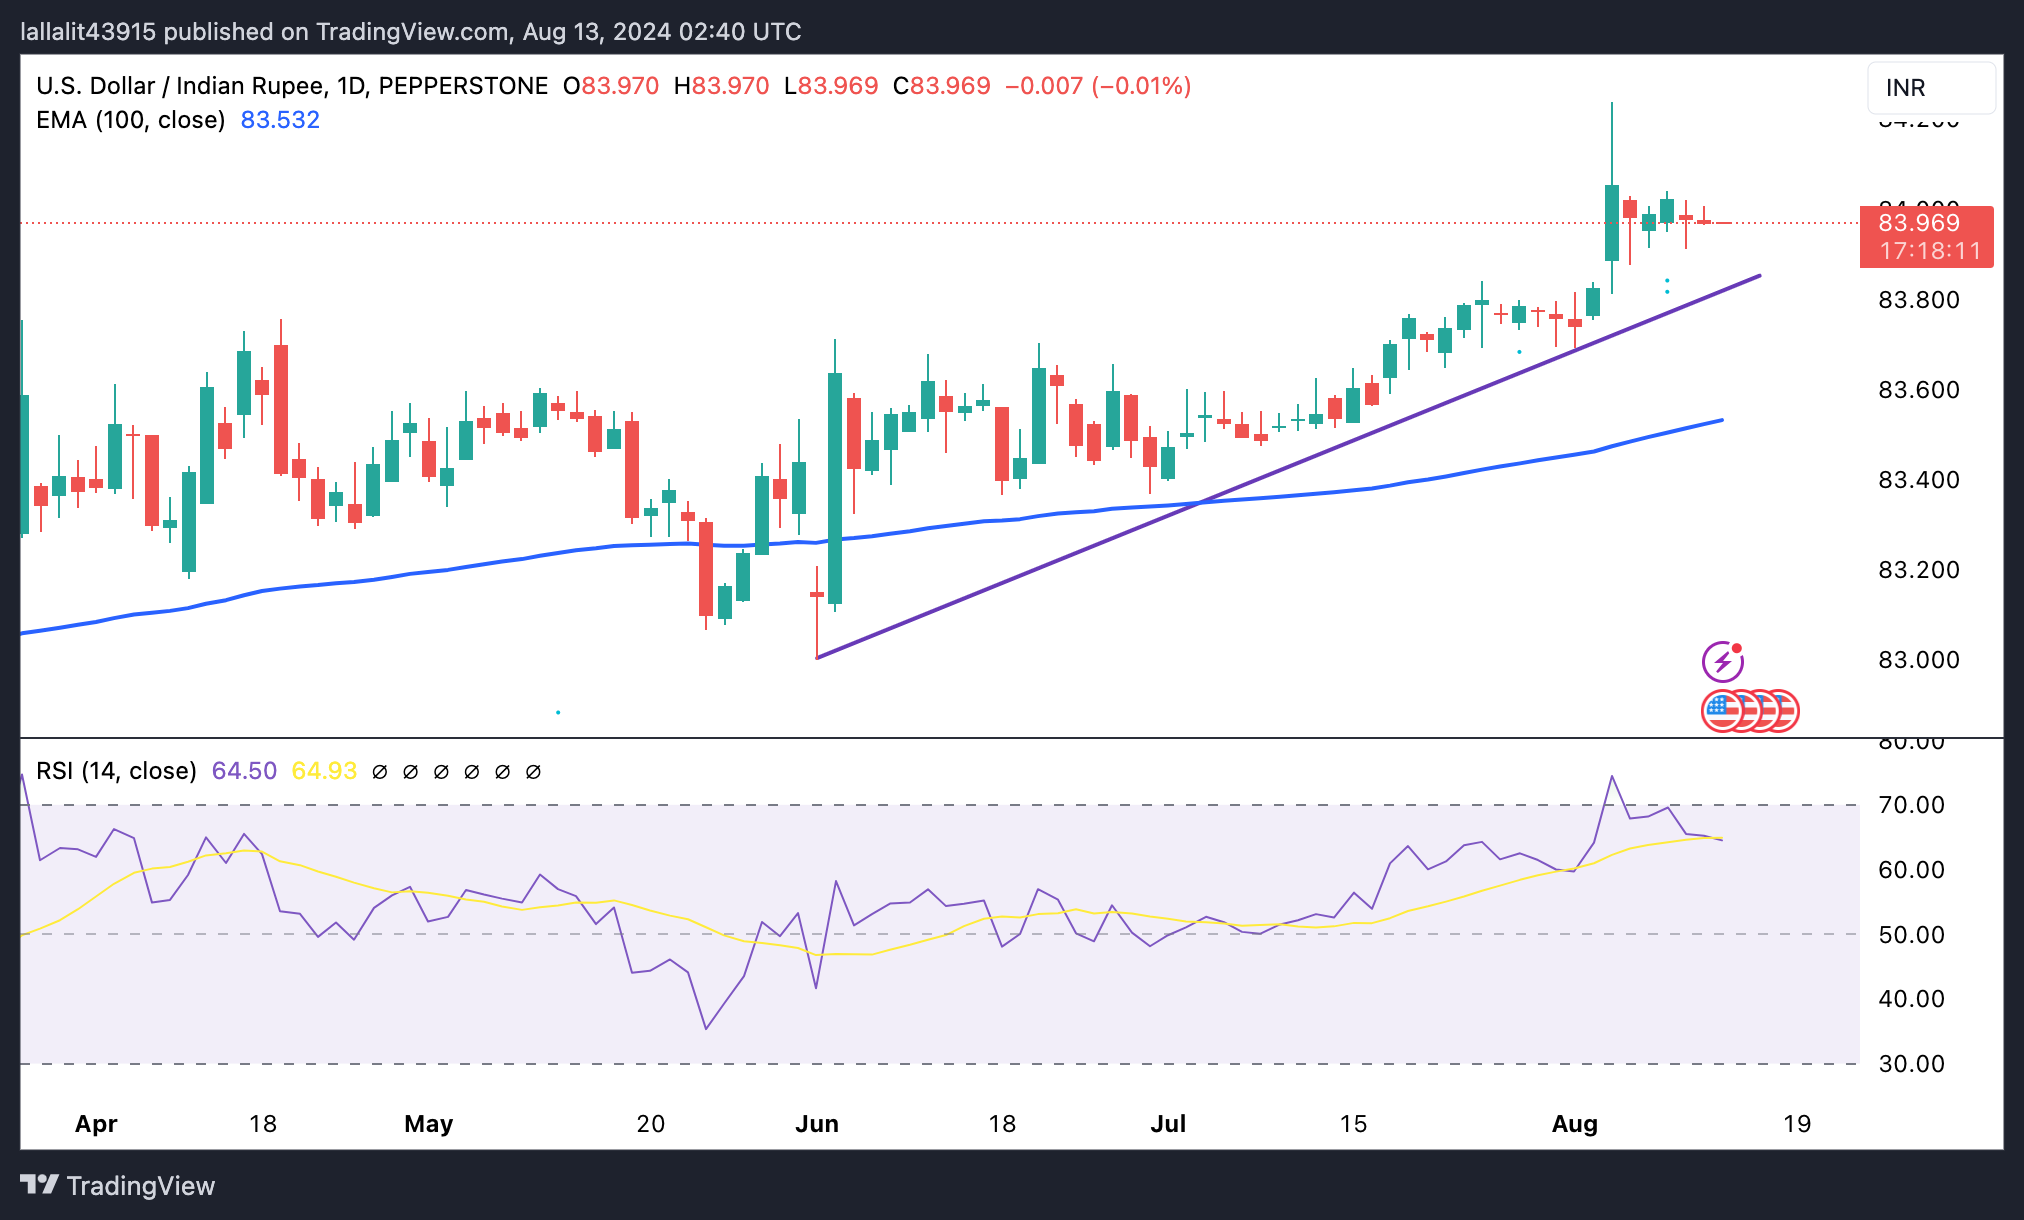
Indian Rupee FAQs
The Indian Rupee (INR) is one of the most sensitive currencies to external factors. The price of Crude Oil (the country is highly dependent on imported Oil), the value of the US Dollar – most trade is conducted in USD – and the level of foreign investment, are all influential. Direct intervention by the Reserve Bank of India (RBI) in FX markets to keep the exchange rate stable, as well as the level of interest rates set by the RBI, are further major influencing factors on the Rupee.
The Reserve Bank of India (RBI) actively intervenes in forex markets to maintain a stable exchange rate, to help facilitate trade. In addition, the RBI tries to maintain the inflation rate at its 4% target by adjusting interest rates. Higher interest rates usually strengthen the Rupee. This is due to the role of the ‘carry trade’ in which investors borrow in countries with lower interest rates so as to place their money in countries’ offering relatively higher interest rates and profit from the difference.
Macroeconomic factors that influence the value of the Rupee include inflation, interest rates, the economic growth rate (GDP), the balance of trade, and inflows from foreign investment. A higher growth rate can lead to more overseas investment, pushing up demand for the Rupee. A less negative balance of trade will eventually lead to a stronger Rupee. Higher interest rates, especially real rates (interest rates less inflation) are also positive for the Rupee. A risk-on environment can lead to greater inflows of Foreign Direct and Indirect Investment (FDI and FII), which also benefit the Rupee.
Higher inflation, particularly, if it is comparatively higher than India’s peers, is generally negative for the currency as it reflects devaluation through oversupply. Inflation also increases the cost of exports, leading to more Rupees being sold to purchase foreign imports, which is Rupee-negative. At the same time, higher inflation usually leads to the Reserve Bank of India (RBI) raising interest rates and this can be positive for the Rupee, due to increased demand from international investors. The opposite effect is true of lower inflation.
- WTI moves away from a three-week high touched, though the bias seems tilted in favor of bulls.
- Geopolitical tensions in the Middle East could tighten access to global supplies and lend support.
- Dovish Fed expectations continue to undermine the USD and should contribute to limiting losses.
West Texas Intermediate (WTI) US crude Oil prices tick lower during the Asian session on Tuesday and for now, seem to have snapped a four-day winning streak to a three-week top, around the $78.75-$78.80 area touched the previous day. The commodity currently trades just below the $78.00 mark, down nearly 0.50% for the day, though any meaningful downside seems elusive in the wake of rising Middle East tensions.
Israeli forces continued their operations near the southern Gaza city of Khan Younis on Monday and are preparing for some sort of retaliatory attacks by Iran, and its allies, amid the risk of a broader conflict in the Middle East. Moreover, the subsequent Israeli response could lead to a full-blown war in the key Oil producing region and disrupt global crude supplies. This, in turn, should continue to act as a tailwind for the black liquid and help limit losses.
Furthermore, market players seem convinced that the Federal Reserve (Fed) will start its rate-cutting cycle in September, which is expected to lift economic activity and boost fuel demand. Apart from this, subdued US Dollar (USD) price action might turn out to be another factor lending support to the USD-denominated commodity. The USD bears, however, seem reluctant ahead of the release of the crucial US inflation figures on Tuesday and Wednesday.
In the meantime, Tuesday's downtick could be attributed to some technical selling following the overnight failure near the 50-day Simple Moving Average (SMA) resistance. Nevertheless, the aforementioned supportive fundamental backdrop supports prospects for an extension of the recent goodish recovery move from the $71.20-$71.15 region, or a multi-month low touched last week. Hence, any meaningful dip might still be seen as a buying opportunity.
WTI Oil FAQs
WTI Oil is a type of Crude Oil sold on international markets. The WTI stands for West Texas Intermediate, one of three major types including Brent and Dubai Crude. WTI is also referred to as “light” and “sweet” because of its relatively low gravity and sulfur content respectively. It is considered a high quality Oil that is easily refined. It is sourced in the United States and distributed via the Cushing hub, which is considered “The Pipeline Crossroads of the World”. It is a benchmark for the Oil market and WTI price is frequently quoted in the media.
Like all assets, supply and demand are the key drivers of WTI Oil price. As such, global growth can be a driver of increased demand and vice versa for weak global growth. Political instability, wars, and sanctions can disrupt supply and impact prices. The decisions of OPEC, a group of major Oil-producing countries, is another key driver of price. The value of the US Dollar influences the price of WTI Crude Oil, since Oil is predominantly traded in US Dollars, thus a weaker US Dollar can make Oil more affordable and vice versa.
The weekly Oil inventory reports published by the American Petroleum Institute (API) and the Energy Information Agency (EIA) impact the price of WTI Oil. Changes in inventories reflect fluctuating supply and demand. If the data shows a drop in inventories it can indicate increased demand, pushing up Oil price. Higher inventories can reflect increased supply, pushing down prices. API’s report is published every Tuesday and EIA’s the day after. Their results are usually similar, falling within 1% of each other 75% of the time. The EIA data is considered more reliable, since it is a government agency.
OPEC (Organization of the Petroleum Exporting Countries) is a group of 13 Oil-producing nations who collectively decide production quotas for member countries at twice-yearly meetings. Their decisions often impact WTI Oil prices. When OPEC decides to lower quotas, it can tighten supply, pushing up Oil prices. When OPEC increases production, it has the opposite effect. OPEC+ refers to an expanded group that includes ten extra non-OPEC members, the most notable of which is Russia.
| Raw materials | Closed | Change, % |
|---|---|---|
| Silver | 27.956 | 1.96 |
| Gold | 247.222 | 1.81 |
| Palladium | 917.28 | 1.22 |
- Gold price pulls back from the vicinity of the monthly peak retested earlier this Tuesday.
- Bulls opt to lighten their bets amid a positive risk tone and ahead of the US inflation data.
- Geopolitical risks and bets for a 50-bps rate cut by the Fed should help limit the downside.
Gold price (XAU/USD) rallied more than 1% on Monday amid safe-haven flows on the back of concerns about a wider conflict in the Middle East and Ukraine's surprise offensive attack on Russia. Furthermore, dovish Federal Reserve (Fed) expectations kept the US Dollar (USD) bulls on the defensive and pushed the non-yielding yellow metal back closer to the monthly top during the Asian session on Tuesday.
That said, the upbeat market mood prompts some selling around the Gold price during the Asian session on Tuesday. Bulls also seem reluctant and prefer to wait for the release of the US inflation figures before positioning for any further appreciating move. Nevertheless, the commodity remains close to the all-time peak touched in July and seems poised to break through a short-term range held over the past month or so.
Daily Digest Market Movers: Gold price might continue to draw support from Middle East tensions and dovish Fed expectations
- Israel stepped up its operations near the southern Gaza city of Khan Younis on Monday amid the risk of a broader conflict in the Middle East, boosting demand for the safe-haven Gold price.
- Israel is also preparing for the possibility of an imminent attack by Iran and the Lebanese group Hezbollah in retaliation for the assassination of Hamas leader Ismail Haniyeh in Tehran in late July.
- Russian President Vladimir Putin told Ukraine to expect a worthy response to its recent cross-border incursion into western parts of the Kursk region, which was about 12 km deep and 40 km wide.
- This comes on top of market expectations for a bigger, 50 basis points interest rate cut by the Federal Reserve in September and continues to act as a tailwind for the non-yielding yellow metal.
- The upside for the XAU/USD, however, remains capped in the wake of a positive risk tone and as traders opt to move to the sidelines ahead of the critical US inflation figures.
- The US Producer Price Index (PPI) is due on Tuesday, followed by the US Consumer Price Index (CPI) on Wednesday and should provide fresh cues about the Fed's policy path.
- The readings are expected to show that inflation cooled in July, giving the US central bank headroom to start its policy-easing cycle, supporting prospects for further gains for the commodity.
Technical Analysis: Gold price bulls could aim to retest the all-time peak, around the $2,483-2,484 area touched in July
From a technical perspective, the overnight breakout through the $2,448-2,450 horizontal resistance was seen as a fresh trigger for bullish traders. Moreover, oscillators on the daily chart have been gaining positive traction and further suggest that the path of least resistance for the Gold price is to the upside. Hence, a subsequent move back towards challenging the record high, around the $2,483-2,484 area, looks like a distinct possibility. This is followed by the $2,500 psychological mark, which if cleared decisively will set the stage for an extension of the upward trajectory.
On the flip side, the $2,450-2,448 resistance breakpoint now seems to protect the immediate downside, below which the Gold price could slide back to the overnight swing low around the $2,424-2,423 region. The next relevant support is pegged near the $2,412-2,410 area ahead of the $2,400 round-figure mark. A convincing break below could expose the 50-day Simple Moving Average (SMA) support near the $2,376-2,375 region, which should act as a key pivotal point. Some follow-through selling could drag the Gold price to the late July low, around the $2,353-2,352 area. The latter coincides with the 100-day SMA and a sustained weakness below will shift the near-term bias in favor of bearish traders.
Gold FAQs
Gold has played a key role in human’s history as it has been widely used as a store of value and medium of exchange. Currently, apart from its shine and usage for jewelry, the precious metal is widely seen as a safe-haven asset, meaning that it is considered a good investment during turbulent times. Gold is also widely seen as a hedge against inflation and against depreciating currencies as it doesn’t rely on any specific issuer or government.
Central banks are the biggest Gold holders. In their aim to support their currencies in turbulent times, central banks tend to diversify their reserves and buy Gold to improve the perceived strength of the economy and the currency. High Gold reserves can be a source of trust for a country’s solvency. Central banks added 1,136 tonnes of Gold worth around $70 billion to their reserves in 2022, according to data from the World Gold Council. This is the highest yearly purchase since records began. Central banks from emerging economies such as China, India and Turkey are quickly increasing their Gold reserves.
Gold has an inverse correlation with the US Dollar and US Treasuries, which are both major reserve and safe-haven assets. When the Dollar depreciates, Gold tends to rise, enabling investors and central banks to diversify their assets in turbulent times. Gold is also inversely correlated with risk assets. A rally in the stock market tends to weaken Gold price, while sell-offs in riskier markets tend to favor the precious metal.
The price can move due to a wide range of factors. Geopolitical instability or fears of a deep recession can quickly make Gold price escalate due to its safe-haven status. As a yield-less asset, Gold tends to rise with lower interest rates, while higher cost of money usually weighs down on the yellow metal. Still, most moves depend on how the US Dollar (USD) behaves as the asset is priced in dollars (XAU/USD). A strong Dollar tends to keep the price of Gold controlled, whereas a weaker Dollar is likely to push Gold prices up.
- The Australian Dollar appreciates after the domestic economic data release on Tuesday.
- Australia's Westpac Consumer Confidence increased by 2.8% in August, reversing the 1.1% decline observed in July.
- The pressure on US Dollar is alleviated due to diminished odds of a 50-basis point rate cut by the Fed.
The Australian Dollar (AUD) extends its gains against the US Dollar (USD) following key domestic economic data released on Tuesday. The AUD/USD pair may appreciate due to the hawkish sentiment surrounding the Reserve Bank of Australia (RBA).
Australia's Westpac Consumer Confidence rose by 2.8% in August, swinging from a 1.1% fall in July. Meanwhile, the Wage Price Index remained steady with a 0.8% rise in the second quarter, slightly below the market expectation of a 0.9% increase.
The AUD/USD pair receives support as the US Dollar (USD) faces challenges from expectations for a potential interest rate cut by the Federal Reserve (Fed) in September. However, this pressure might be alleviated due to reduced chances of a 50-basis point rate cut at the Fed's September meeting.
Traders will likely focus on US producer inflation data set to be released on Tuesday and consumer inflation figures on Wednesday. Traders are looking for confirmation that price growth remains stable.
Daily Digest Market Movers: Australian Dollar advances due to a hawkish mood surrounding the RBA
- On Monday, Reserve Bank of Australia (RBA) Deputy Governor Andrew Hauser attributed persistent inflation to weaker supply and a tight labor market. Hauser also noted that economic forecasts are surrounded by significant uncertainty.
- The upside of the risk-sensitive AUD could be restrained due to safe-haven flows amid increased geopolitical tensions in the Middle East. On Sunday, Defense Minister Yoav Gallant informed US Defense Secretary Lloyd Austin that Iran's military activities indicate preparations for a significant strike on Israel, as reported by Axios writer Barak Ravid.
- On Sunday, Federal Reserve Governor Michelle Bowman stated that she continues to see upside risks for inflation and ongoing strength in the labor market. This suggests that the Fed may not be prepared to cut rates at their next meeting in September, according to Bloomberg.
- China's Consumer Price Index (CPI) rose 0.5% year-on-year in July, exceeding the expected 0.3% and previous 0.2% readings. Meanwhile, the monthly index also increased 0.5%, swinging from the previous decline of 0.2%.
- Westpac updated its RBA forecast, now predicting the first rate cut will occur in February 2025, a shift from the previously anticipated November 2024. They also revised their terminal rate forecast to 3.35%, up from the previous 3.10%. The RBA is now viewed as more cautious, needing stronger evidence before considering rate cuts.
- On Thursday, Kansas City Fed President Jeffrey Schmid stated that reducing monetary policy could be "appropriate" if inflation remains low. Schmid noted that the current Fed policy is "not that restrictive" and that while the Fed is close to its 2% inflation goal, it has not yet fully achieved it, per Reuters.
- Last week, Treasurer Jim Chalmers contested the RBA's view that the economy remains too robust and that large government budgets are contributing to prolonged inflation, according to Macrobusiness.
- Last week, RBA Governor Michele Bullock expressed that the Australian central bank will not hesitate to raise rates again to combat inflation if needed. Those comments came just days after the RBA held rates steady at 4.35% for the sixth straight meeting.
Technical Analysis: Australian Dollar hovers around 0.6600 with testing a throwback support
The Australian Dollar trades around 0.6590 on Tuesday. The daily chart analysis shows that the AUD/USD pair steadies within an ascending channel, suggesting a bullish bias. However, the 14-day Relative Strength Index (RSI) consolidates below the 50 mark. A rise above this threshold could signal an increase in bullish momentum.
On the upside, the AUD/USD pair might test the upper boundary of the ascending channel at the 0.6660 level. A breakout above this level could push the pair toward its six-month high of 0.6798, reached on July 11.
In terms of support, the AUD/USD pair is testing immediate support at the throwback level of 0.6575. A drop below this level could strengthen a bearish bias, potentially driving the pair toward the lower boundary of the ascending channel near 0.6560, followed by the throwback level of 0.6470.
AUD/USD: Daily Chart
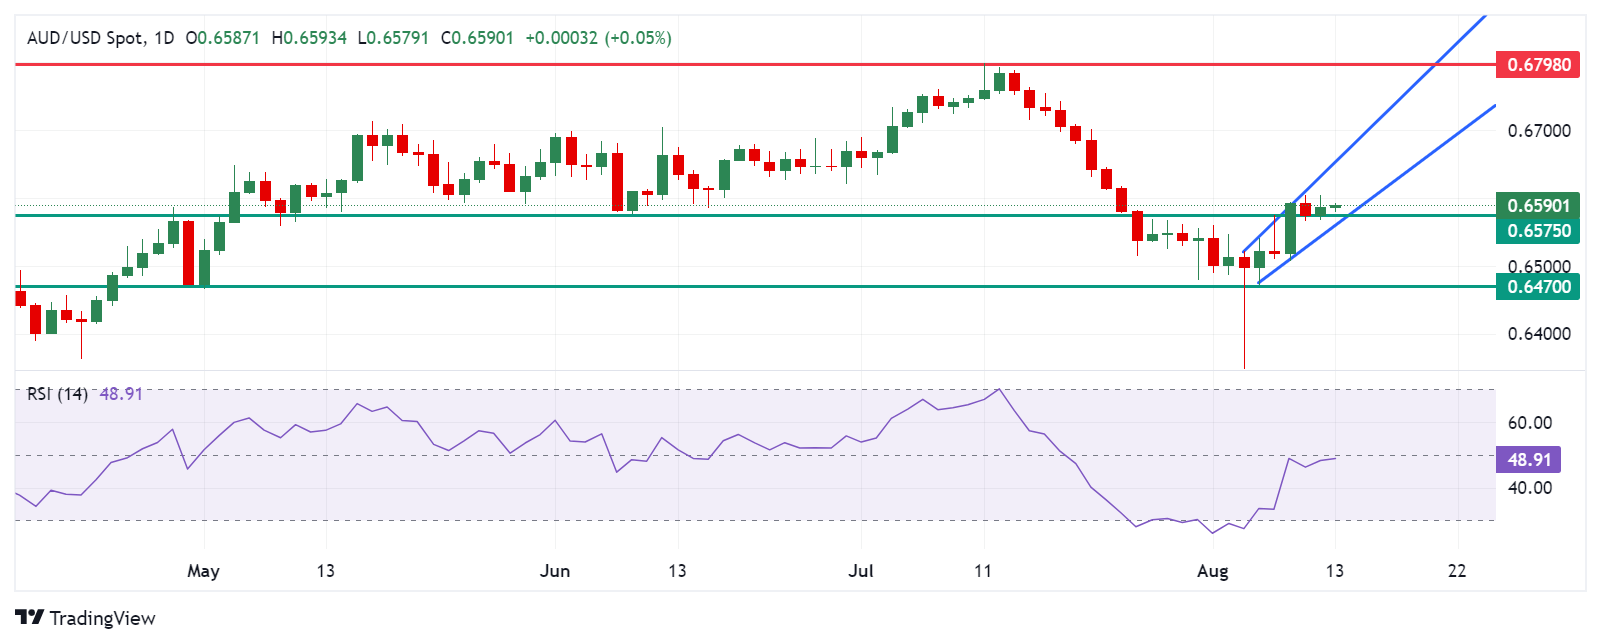
Australian Dollar PRICE Today
The table below shows the percentage change of Australian Dollar (AUD) against listed major currencies today. Australian Dollar was the strongest against the Swiss Franc.
| USD | EUR | GBP | JPY | CAD | AUD | NZD | CHF | |
|---|---|---|---|---|---|---|---|---|
| USD | -0.02% | -0.05% | 0.12% | -0.00% | -0.07% | 0.33% | 0.10% | |
| EUR | 0.02% | -0.03% | 0.13% | -0.01% | -0.06% | -0.16% | 0.12% | |
| GBP | 0.05% | 0.03% | 0.17% | 0.04% | -0.03% | -0.10% | 0.18% | |
| JPY | -0.12% | -0.13% | -0.17% | -0.16% | -0.19% | -0.30% | -0.01% | |
| CAD | 0.00% | 0.01% | -0.04% | 0.16% | -0.06% | -0.16% | 0.12% | |
| AUD | 0.07% | 0.06% | 0.03% | 0.19% | 0.06% | -0.07% | 0.21% | |
| NZD | -0.33% | 0.16% | 0.10% | 0.30% | 0.16% | 0.07% | 0.29% | |
| CHF | -0.10% | -0.12% | -0.18% | 0.01% | -0.12% | -0.21% | -0.29% |
The heat map shows percentage changes of major currencies against each other. The base currency is picked from the left column, while the quote currency is picked from the top row. For example, if you pick the Australian Dollar from the left column and move along the horizontal line to the US Dollar, the percentage change displayed in the box will represent AUD (base)/USD (quote).
Interest rates FAQs
Interest rates are charged by financial institutions on loans to borrowers and are paid as interest to savers and depositors. They are influenced by base lending rates, which are set by central banks in response to changes in the economy. Central banks normally have a mandate to ensure price stability, which in most cases means targeting a core inflation rate of around 2%. If inflation falls below target the central bank may cut base lending rates, with a view to stimulating lending and boosting the economy. If inflation rises substantially above 2% it normally results in the central bank raising base lending rates in an attempt to lower inflation.
Higher interest rates generally help strengthen a country’s currency as they make it a more attractive place for global investors to park their money.
Higher interest rates overall weigh on the price of Gold because they increase the opportunity cost of holding Gold instead of investing in an interest-bearing asset or placing cash in the bank. If interest rates are high that usually pushes up the price of the US Dollar (USD), and since Gold is priced in Dollars, this has the effect of lowering the price of Gold.
The Fed funds rate is the overnight rate at which US banks lend to each other. It is the oft-quoted headline rate set by the Federal Reserve at its FOMC meetings. It is set as a range, for example 4.75%-5.00%, though the upper limit (in that case 5.00%) is the quoted figure. Market expectations for future Fed funds rate are tracked by the CME FedWatch tool, which shapes how many financial markets behave in anticipation of future Federal Reserve monetary policy decisions.
- USD/CAD trades with mild gains around 1.3740 in Tuesday’s Asian session.
- Traders await the US PPI data on Tuesday for fresh impetus.
- Higher crude oil prices and hopes of a Fed rate cut in September might underpin the CAD in the near term.
The USD/CAD pair trades on a stronger note near 1.3740 during the Asian session on Tuesday. Traders prefer to wait on the sidelines ahead of key US data releases. The US Producer Price Index (PPI) will take centre stage later in the day, along with the speech by the Federal Reserve’s (Fed) Raphael W. Bostic.
The Greenback trades in a consolidative theme amid a flattish mood in global markets. Traders will take more cues from the US PPI data on Tuesday. The PPI is estimated to ease to 2.3% YoY in July from 2.6%, while the Core PPI is forecasted to drop to 2.7% YoY in July from the previous reading of 3.0%. This report could provide some insight about the US rate.
Analysts from BBH Global Currency Strategy noted that a 50 basis points (bps) rate cut by the Fed is possible but will fully depend on the data, with nearly 55% odds priced in now. The softer key US economic data this week might trigger the chance that the Fed will cut rates more aggressively in September, which might drag the USD lower against its rivals.
Fed Governor Bowman said on the weekend that the progress in lowering inflation in recent months is a welcome development, but inflation is still uncomfortably above the Fed’s 2% target. Bowman further stated that she will remain cautious in her approach to considering adjustments to the policy.
The Bank of Canada (BoC) is expected to cut rates by 25 bps two more times this year, at the September and October meetings. This, in turn, is likely to cap the upside for the Canadian Dollar (CAD). However, the rise of crude oil prices due to rising geopolitical concerns in the Middle East and hopes of the start of the easing cycle by the Fed in September might underpin the CAD. It's worth noting that higher oil prices generally support the CAD lower as Canada is the leading exporter of Oil to the United States (US).
Canadian Dollar FAQs
The key factors driving the Canadian Dollar (CAD) are the level of interest rates set by the Bank of Canada (BoC), the price of Oil, Canada’s largest export, the health of its economy, inflation and the Trade Balance, which is the difference between the value of Canada’s exports versus its imports. Other factors include market sentiment – whether investors are taking on more risky assets (risk-on) or seeking safe-havens (risk-off) – with risk-on being CAD-positive. As its largest trading partner, the health of the US economy is also a key factor influencing the Canadian Dollar.
The Bank of Canada (BoC) has a significant influence on the Canadian Dollar by setting the level of interest rates that banks can lend to one another. This influences the level of interest rates for everyone. The main goal of the BoC is to maintain inflation at 1-3% by adjusting interest rates up or down. Relatively higher interest rates tend to be positive for the CAD. The Bank of Canada can also use quantitative easing and tightening to influence credit conditions, with the former CAD-negative and the latter CAD-positive.
The price of Oil is a key factor impacting the value of the Canadian Dollar. Petroleum is Canada’s biggest export, so Oil price tends to have an immediate impact on the CAD value. Generally, if Oil price rises CAD also goes up, as aggregate demand for the currency increases. The opposite is the case if the price of Oil falls. Higher Oil prices also tend to result in a greater likelihood of a positive Trade Balance, which is also supportive of the CAD.
While inflation had always traditionally been thought of as a negative factor for a currency since it lowers the value of money, the opposite has actually been the case in modern times with the relaxation of cross-border capital controls. Higher inflation tends to lead central banks to put up interest rates which attracts more capital inflows from global investors seeking a lucrative place to keep their money. This increases demand for the local currency, which in Canada’s case is the Canadian Dollar.
Macroeconomic data releases gauge the health of the economy and can have an impact on the Canadian Dollar. Indicators such as GDP, Manufacturing and Services PMIs, employment, and consumer sentiment surveys can all influence the direction of the CAD. A strong economy is good for the Canadian Dollar. Not only does it attract more foreign investment but it may encourage the Bank of Canada to put up interest rates, leading to a stronger currency. If economic data is weak, however, the CAD is likely to fall.
The People’s Bank of China (PBOC) set the USD/CNY central rate for the trading session ahead on Tuesday at 7.1479, as against the previous day's fix of 7.1458 and 7.1744 Reuters estimates.
- USD/JPY drifts lower to around 147.10 in Tuesday’s early Asian session.
- The rising geopolitical risks in the Middle East continue to support the JPY.
- The US Producer Price Index (PPI) for July will be in the spotlight on Tuesday.
The USD/JPY pair weakens to near 147.10 during the early Asian session on Tuesday. The modest decline of the US Dollar (USD) drags the pair lower on the day. The expectation that the US Federal Reserve (Fed) will cut the interest rate in September continues to weigh on the Greenback in the near term.
Traders ease back on bets of a double-cut in September, according to the CME’s FedWatch Tool. The markets are now pricing in less than 50% chance of a 50 basis points (bps) cut on September 18, down from 70% last week. However, the rate markets are still pricing in a 100% possibility of at least a 25 bps cut at the Fed September meeting.
The US Producer Price Index (PPI), which is due on Tuesday, could offer some hints about the Fed's outlook for rates. The PPI is expected to ease to 2.3% YoY in July from 2.6%, while the Core PPI is projected to drop to 2.7% YoY in July from the previous reading of 3.0%. The hotter PPI could diminish rate cut expectations and cap the downside for the USD.
On the other hand, the ongoing geopolitical risks in the Middle East might boost the safe-haven flows, benefiting the Japanese Yen (JPY). The Israeli intelligence community believed that Iran has decided to attack Israel directly and may do so within days in retaliation for the assassination of Hamas leader Ismail Haniyeh in Tehran in late July.
Elsewhere, the Japanese PPI came in at 3.0% YoY in July, compared to the previous reading of 2.9%, in line with the market consensus. On a monthly basis, the PPI rose 0.3% in July versus 0.2% prior.
Japanese Yen FAQs
The Japanese Yen (JPY) is one of the world’s most traded currencies. Its value is broadly determined by the performance of the Japanese economy, but more specifically by the Bank of Japan’s policy, the differential between Japanese and US bond yields, or risk sentiment among traders, among other factors.
One of the Bank of Japan’s mandates is currency control, so its moves are key for the Yen. The BoJ has directly intervened in currency markets sometimes, generally to lower the value of the Yen, although it refrains from doing it often due to political concerns of its main trading partners. The current BoJ ultra-loose monetary policy, based on massive stimulus to the economy, has caused the Yen to depreciate against its main currency peers. This process has exacerbated more recently due to an increasing policy divergence between the Bank of Japan and other main central banks, which have opted to increase interest rates sharply to fight decades-high levels of inflation.
The BoJ’s stance of sticking to ultra-loose monetary policy has led to a widening policy divergence with other central banks, particularly with the US Federal Reserve. This supports a widening of the differential between the 10-year US and Japanese bonds, which favors the US Dollar against the Japanese Yen.
The Japanese Yen is often seen as a safe-haven investment. This means that in times of market stress, investors are more likely to put their money in the Japanese currency due to its supposed reliability and stability. Turbulent times are likely to strengthen the Yen’s value against other currencies seen as more risky to invest in.
| Index | Change, points | Closed | Change, % |
|---|---|---|---|
| Hang Seng | 21.42 | 17111.65 | 0.13 |
| KOSPI | 29.87 | 2618.3 | 1.15 |
| ASX 200 | 36 | 7813.7 | 0.46 |
| DAX | 3.59 | 17726.47 | 0.02 |
| CAC 40 | -19.04 | 7250.67 | -0.26 |
| Dow Jones | -140.53 | 39357.01 | -0.36 |
| S&P 500 | 0.23 | 5344.39 | 0 |
| NASDAQ Composite | 35.31 | 16780.61 | 0.21 |
| Pare | Closed | Change, % |
|---|---|---|
| AUDUSD | 0.65852 | 0.16 |
| EURJPY | 160.888 | 0.35 |
| EURUSD | 1.09316 | 0.16 |
| GBPJPY | 187.887 | 0.25 |
| GBPUSD | 1.27659 | 0.07 |
| NZDUSD | 0.60173 | 0.31 |
| USDCAD | 1.3741 | 0.08 |
| USDCHF | 0.86501 | -0.03 |
| USDJPY | 147.17 | 0.18 |


© 2000-2026. Sva prava zaštićena.
Sajt je vlasništvo kompanije Teletrade D.J. LLC 2351 LLC 2022 (Euro House, Richmond Hill Road, Kingstown, VC0100, St. Vincent and the Grenadines).
Svi podaci koji se nalaze na sajtu ne predstavljaju osnovu za donošenje investicionih odluka, već su informativnog karaktera.
The company does not serve or provide services to customers who are residents of the US, Canada, Iran, The Democratic People's Republic of Korea, Yemen and FATF blacklisted countries.
Izvršenje trgovinskih operacija sa finansijskim instrumentima upotrebom marginalne trgovine pruža velike mogućnosti i omogućava investitorima ostvarivanje visokih prihoda. Međutim, takav vid trgovine povezan je sa potencijalno visokim nivoom rizika od gubitka sredstava. Проведение торговых операций на финанcовых рынках c маржинальными финанcовыми инcтрументами открывает широкие возможноcти, и позволяет инвеcторам, готовым пойти на риcк, получать выcокую прибыль, но при этом неcет в cебе потенциально выcокий уровень риcка получения убытков. Iz tog razloga je pre započinjanja trgovine potrebno odlučiti o izboru odgovarajuće investicione strategije, uzimajući u obzir raspoložive resurse.
Upotreba informacija: U slučaju potpunog ili delimičnog preuzimanja i daljeg korišćenja materijala koji se nalazi na sajtu, potrebno je navesti link odgovarajuće stranice na sajtu kompanije TeleTrade-a kao izvora informacija. Upotreba materijala na internetu mora biti praćena hiper linkom do web stranice teletrade.org. Automatski uvoz materijala i informacija sa stranice je zabranjen.
Ako imate bilo kakvih pitanja, obratite nam se pr@teletrade.global.
транcфери