- Analiza
- Novosti i instrumenti
- Vesti sa tržišta
Forex-novosti i prognoze od 13-06-2024
- GBP/USD loses traction around 1.2760 in Friday’s early Asian session amid the stronger US Dollar.
- The Fed's revised projections have boosted the US dollar broadly despite the weaker US May PPI data.
- Traders increased their bets on the BoE’s rate cut as the UK economy stagnated in April.
The GBP/USD pair edges lower near 1.2760 after three consecutive sessions of gain during the early Asian session on Friday. The recovery of the USD Index (DXY) above the 105.00 barrier weighs on the major pair. Later on Friday, the preliminary US Michigan Consumer Sentiment report is due, followed by a speech by Federal Reserve (Fed) Bank of Chicago President Austan Goolsbee.
The US Fed signaled that it will cut its key interest rate just once by 25 basis points (bps) toward the end of 2024 despite inflation easing, according to the dot plot. The Fed's revised projections have lifted the Greenback across the board and created a headwind for GBP/USD despite the weaker-than-expected US economic data released on Thursday.
The US Producer Price Index (PPI) rose 2.2% YoY in May, compared to the 2.3% increase in April (revised from 2.2%), below the market expectation of 2.5%, according to the US Bureau of Labor Statistics on Thursday. The core PPI figure climbed 2.3% YoY in May, below the estimation and previous reading of 2.4%. On a monthly basis, the PPI declined 0.2% in May, while the core PPI remained unchanged at 0%.
Additionally, the weekly Initial Jobless Claims for the week ending June 6 increased by 242K from the previous week's reading of 229K. This figure came in above the market consensus of 225K.
The growing speculation that the Bank of England (BoE) to start cutting interest rates in the August or September meeting exerts some selling pressure on the Pound Sterling (GBP). Traders raised their bets on the BoE’s rate cut due to the stagnant UK monthly Gross Domestic Product (GDP) number for April. "While we are seeing some tentative signs of cooling in the labour market, service sector inflation remains persistently high, and it is likely the MPC would want to wait until the next set of forecasts and a few more data points before it embarks on its first rate cut," said KPMG chief UK economist, Yael Selfin.
- The Bank of Japan is largely expected to keep its policy rate unchanged.
- Markets’ attention will be on a potential hawkish message by Governor Kazuo Ueda.
- Further announcements could be around JGB purchases.
The Bank of Japan (BoJ) is expected to maintain its short-term rate target between 0% and 0.1% on Friday, June 14, after concluding its two-day monetary policy review meeting for June.
The decision will be announced at 3:00 GMT on Friday. It is worth recalling that, in March, the BoJ raised the interest rate for the first time in 17 years, ending the negative interest rate policy that had been in place since 2016.
What can we expect from the BoJ interest rate decision?
With a steady policy widely expected at this gathering, market participants will keep their attention on the probable changes in the policy statement for fresh hints on the timing of the bank’s next rate increase.
So far, money markets see around 16 bps of hiking in October and nearly 22 bps at the December 19 meeting, according to Reuters.
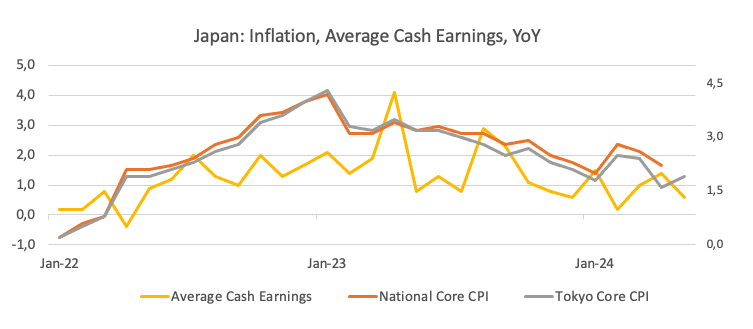
Data released on Wednesday revealed that Japan's wholesale inflation surged in May at the fastest annual rate in nine months. This indicates that the weak Yen is driving up the cost of raw material imports, thereby exerting upward pressure on prices.
This development complicates the central bank’s decision on the timing of raising interest rates, as price increases driven by cost pressures might reduce consumption, undermining the possibility of achieving the demand-driven inflation the BoJ aims for before further scaling back its stimulus measures.
Also pouring cold water over expectations of extra rate hikes, the National Core CPI approached the bank’s target in April (2.2% YoY), while the Tokyo Core CPI navigated below the inflation goal for the second month in a row in May (1.9% YoY).
Last week, Governor Ueda stated that it would be appropriate to scale back the central bank's bond-buying as it progresses towards ending its extensive monetary stimulus. Ueda also emphasized that the BoJ will proceed "cautiously" in deciding the timing and extent of short-term interest rate increases "to avoid making any significant errors."
In addition, board member Toyoaki Nakamura also argued last week that the central bank should not raise interest rates solely to slow the Yen's decline. He explained that attempting to address the weak Yen through interest rate adjustments would negatively impact the economy, as higher borrowing costs would dampen demand.
Analysts at TD Securities comment: “We expect the BoJ to keep the policy balance rate unchanged at 0% and announce a reduction of their JGB monthly purchases to likely around JPY5tn/mth”
How could the Bank of Japan interest rate decision affect USD/JPY?
A hawkish surprise by the BoJ could certainly give the Japanese Yen fresh legs and, therefore, sponsor a knee-jerk drop in USD/JPY. The opposite is likely to happen if the central bank disappoints expectations and signals that the next rate hike is still some time away or that the focus remains on achieving the bank’s inflation target before a move higher on rates.
A glimpse at the broader picture shows Fed-BoJ policy divergence remains at center stage. Following the cautious hold by the Federal Reserve (Fed) at its June 12 event and prospects of just one interest rate cut this year (most likely in December), a sustainable move lower in spot does not appear as the most favourable scenario for the time being.
Looking at the techs surrounding USD/JPY, Senior Analyst at FXStreet.com Pablo Piovano suggests that “further advances are expected to target the weekly high of 157.71 recorded on May 29, followed by the 2024 top of 160.20 from April 29.”
On the downside, “the June low of 154.52 (June 4) emerges as the initial target, ahead of the weekly low of 153.60 reached on May 16 and the provisional 100-day SMA at 152.55”, Pablo adds.
Economic Indicator
BoJ Interest Rate Decision
The Bank of Japan (BoJ) announces its interest rate decision after each of the Bank’s eight scheduled annual meetings. Generally, if the BoJ is hawkish about the inflationary outlook of the economy and raises interest rates it is bullish for the Japanese Yen (JPY). Likewise, if the BoJ has a dovish view on the Japanese economy and keeps interest rates unchanged, or cuts them, it is usually bearish for JPY.
Read more.Last release: Fri Apr 26, 2024 03:20
Frequency: Irregular
Actual: 0%
Consensus: 0%
Previous: 0%
Source: Bank of Japan
Bank of Japan FAQs
The Bank of Japan (BoJ) is the Japanese central bank, which sets monetary policy in the country. Its mandate is to issue banknotes and carry out currency and monetary control to ensure price stability, which means an inflation target of around 2%.
The Bank of Japan has embarked in an ultra-loose monetary policy since 2013 in order to stimulate the economy and fuel inflation amid a low-inflationary environment. The bank’s policy is based on Quantitative and Qualitative Easing (QQE), or printing notes to buy assets such as government or corporate bonds to provide liquidity. In 2016, the bank doubled down on its strategy and further loosened policy by first introducing negative interest rates and then directly controlling the yield of its 10-year government bonds.
The Bank’s massive stimulus has caused the Yen to depreciate against its main currency peers. This process has exacerbated more recently due to an increasing policy divergence between the Bank of Japan and other main central banks, which have opted to increase interest rates sharply to fight decades-high levels of inflation. The BoJ’s policy of holding down rates has led to a widening differential with other currencies, dragging down the value of the Yen.
A weaker Yen and the spike in global energy prices have led to an increase in Japanese inflation, which has exceeded the BoJ’s 2% target. Still, the Bank judges that the sustainable and stable achievement of the 2% target has not yet come in sight, so any sudden change in the current policy looks unlikely.
- USD/CHF holds near 0.8939, minimal losses despite weaker US producer inflation data.
- Technical outlook: Pair remains neutral to upward biased, consolidating around the 200-DMA at 0.8896.
- Key levels: Support at 0.8800 and 0.8729; resistance at June 11 high of 0.8993 and 50-DMA at 0.9069.
The USD/CHF was subdued on Thursday, yet minimal losses of 0.06% were printed following the release of the softer US producer inflation report. The Greenback’s losses were capped by the Federal Reserve’s decision to hold rates and project one rate cut, as the disinflation process had stalled. The pair trades at 0.8939 at the time of writing.
USD/CHF Price Analysis: Technical outlook
The daily chart portrays the pair as neutral to upward biased, yet it remains consolidated at around the 200-day moving average (DMA) at 0.8896.
Momentum favors sellers, but they take a respite as they push the USD/CHF below the 200-DMA. Once cleared, the next support would be the 0.8800 figure, followed by the March 8 cycle low of 0.8729.
Conversely. If USD/CHF pushes back above the June 11 high of 0.8993, that would exacerbate a rally past the 0.9000 figure. The next resistance level would be the 50-DMA at 0.9069.
USD/CHF Price Action – Daily Chart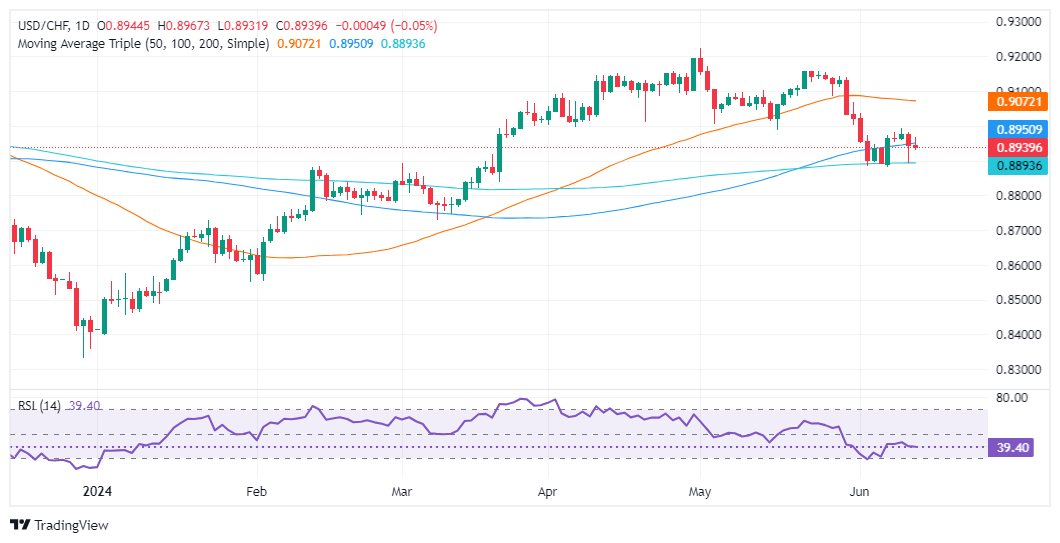
New Zealand’s Business NZ Performance of Manufacturing Index (PMI) contracted to 47.2 in May from the previous reading of 48.9, according to Business NZ on Friday.
“PMI readings to date this year are consistent with falling manufacturing GDP. We anticipate next week’s Q1 GDP figures to include a contraction in the manufacturing component. The latest PMI indicators suggests Q2 will also be weak and potentially weaker than we already anticipate,” said BNZ’s Senior Economist Doug Steel.
Market reaction
At the press time, the NZD/USD pair was down 0.06% on the day to trade at 0.6165.
New Zealand Dollar FAQs
The New Zealand Dollar (NZD), also known as the Kiwi, is a well-known traded currency among investors. Its value is broadly determined by the health of the New Zealand economy and the country’s central bank policy. Still, there are some unique particularities that also can make NZD move. The performance of the Chinese economy tends to move the Kiwi because China is New Zealand’s biggest trading partner. Bad news for the Chinese economy likely means less New Zealand exports to the country, hitting the economy and thus its currency. Another factor moving NZD is dairy prices as the dairy industry is New Zealand’s main export. High dairy prices boost export income, contributing positively to the economy and thus to the NZD.
The Reserve Bank of New Zealand (RBNZ) aims to achieve and maintain an inflation rate between 1% and 3% over the medium term, with a focus to keep it near the 2% mid-point. To this end, the bank sets an appropriate level of interest rates. When inflation is too high, the RBNZ will increase interest rates to cool the economy, but the move will also make bond yields higher, increasing investors’ appeal to invest in the country and thus boosting NZD. On the contrary, lower interest rates tend to weaken NZD. The so-called rate differential, or how rates in New Zealand are or are expected to be compared to the ones set by the US Federal Reserve, can also play a key role in moving the NZD/USD pair.
Macroeconomic data releases in New Zealand are key to assess the state of the economy and can impact the New Zealand Dollar’s (NZD) valuation. A strong economy, based on high economic growth, low unemployment and high confidence is good for NZD. High economic growth attracts foreign investment and may encourage the Reserve Bank of New Zealand to increase interest rates, if this economic strength comes together with elevated inflation. Conversely, if economic data is weak, NZD is likely to depreciate.
The New Zealand Dollar (NZD) tends to strengthen during risk-on periods, or when investors perceive that broader market risks are low and are optimistic about growth. This tends to lead to a more favorable outlook for commodities and so-called ‘commodity currencies’ such as the Kiwi. Conversely, NZD tends to weaken at times of market turbulence or economic uncertainty as investors tend to sell higher-risk assets and flee to the more-stable safe havens.
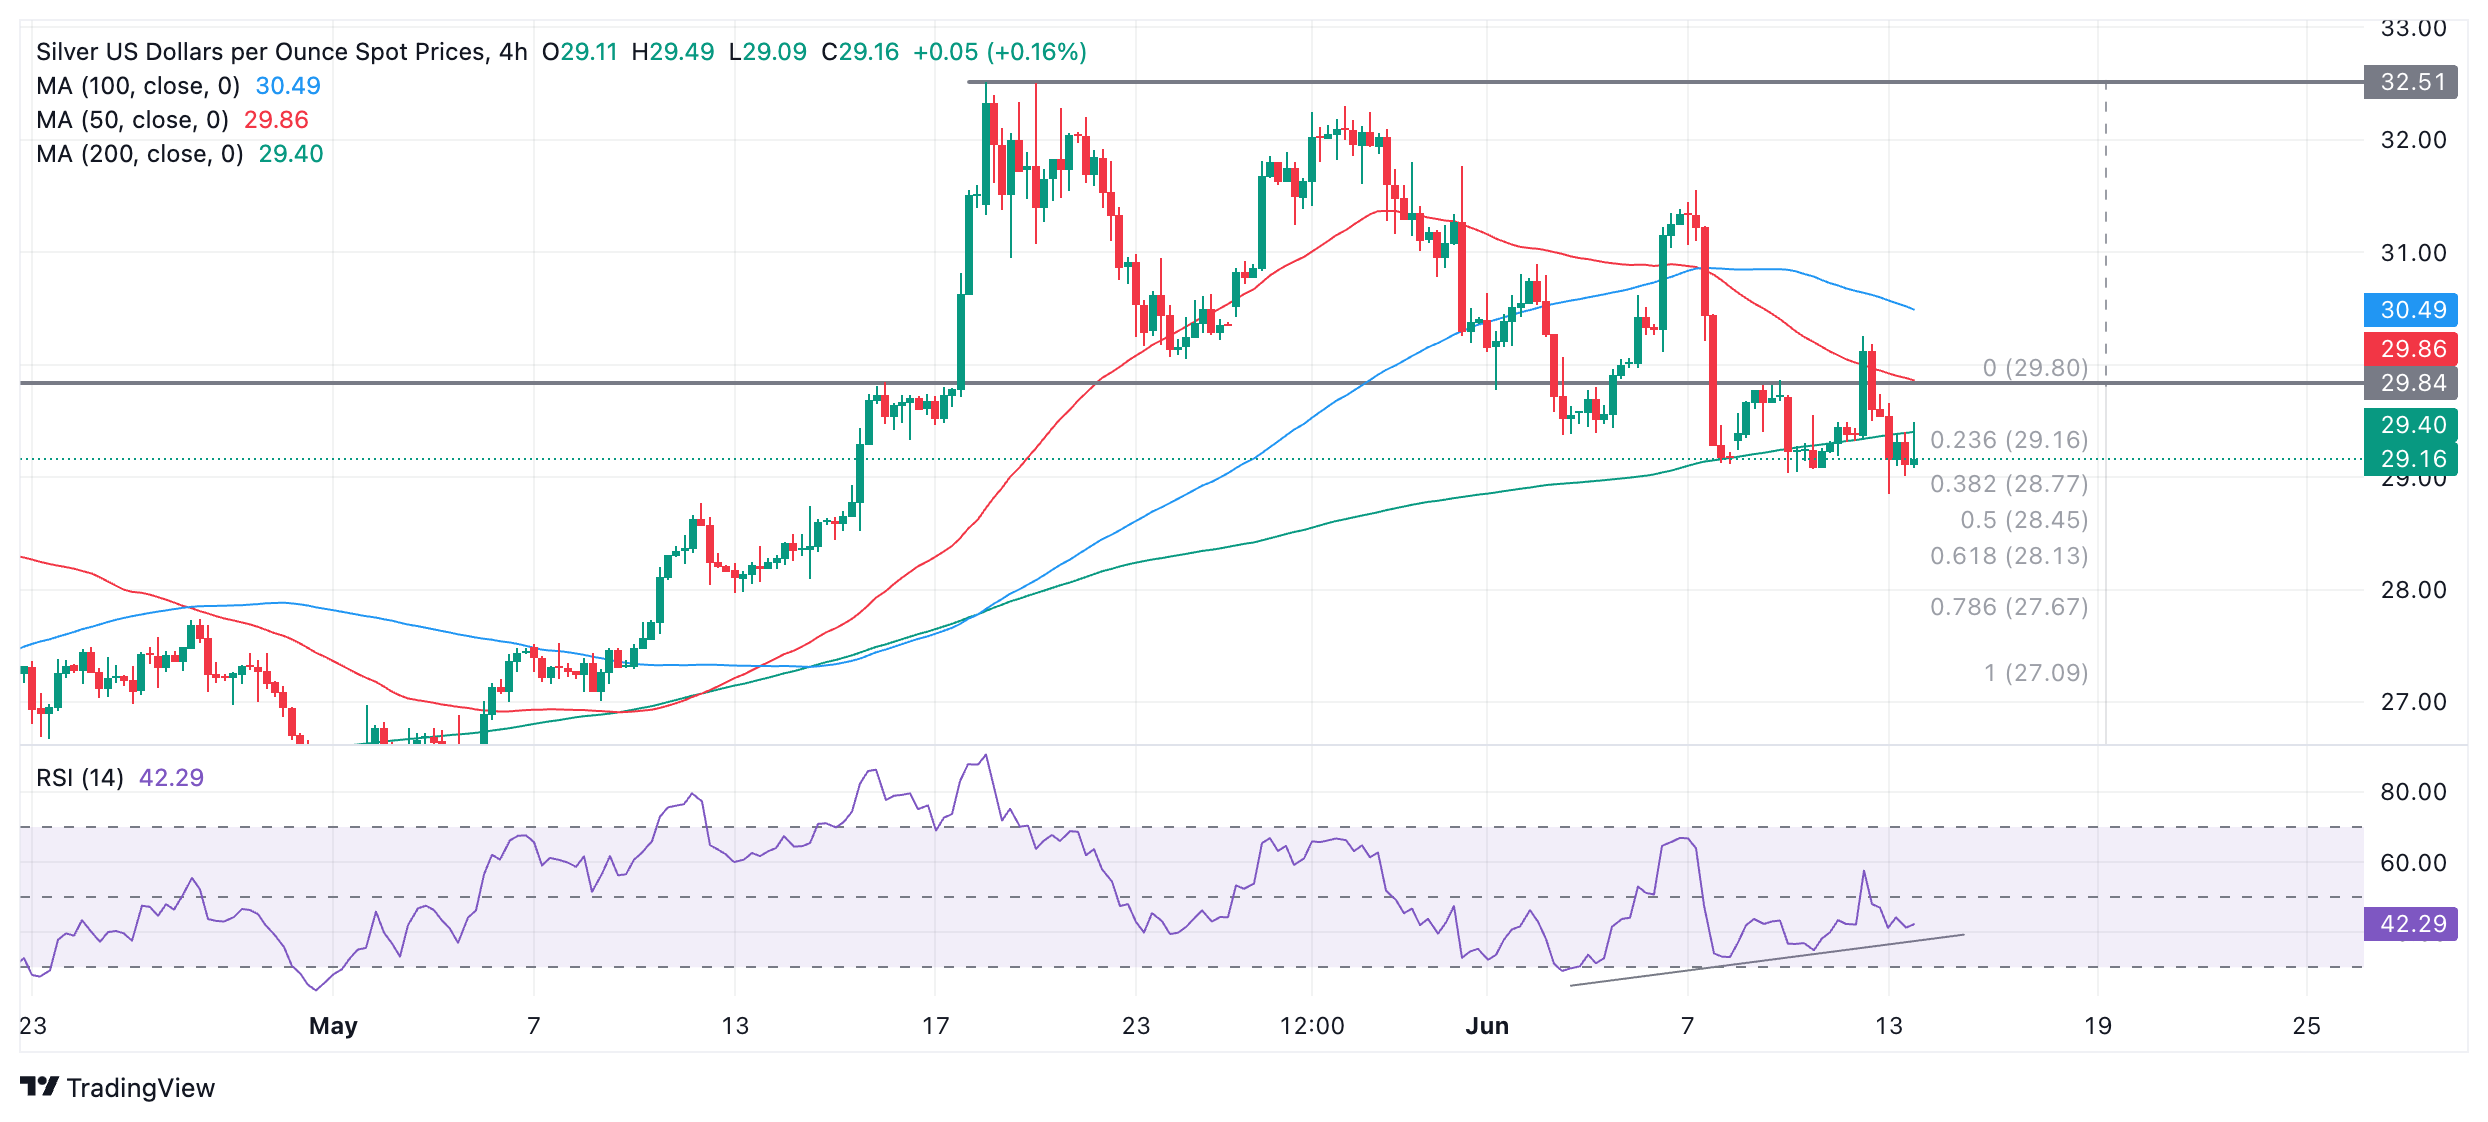
- Silver prices have fallen aggressively during the last six days, with losses of more than 7%.
- Momentum supports further downside as RSI turned bearish.
- Key support levels are seen at $28.74, followed by $26.40 and $26.02.
Silver prices registered losses of more than 2.40% on Thursday after the Federal Reserve held rates unchanged and hinted that they would likely cut once instead of the three foreseen in the March Summary of Economic Projections (SEP). At the time of writing, the XAG/USD trades at $28.95.
XAG/USD Price Analysis: Technical outlook
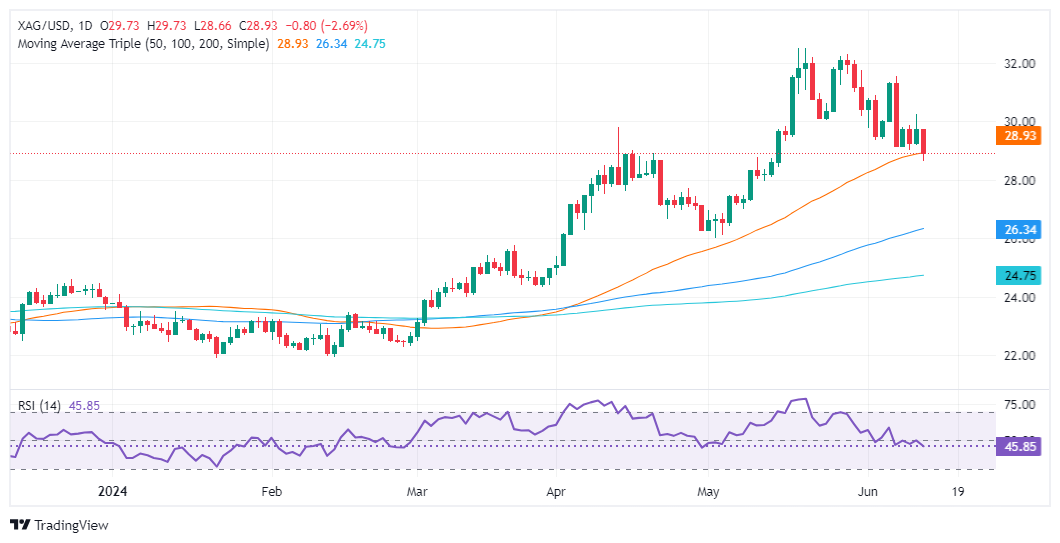
From a price action standpoint, the XAG/USD is neutral to upward biased. The downtrend is capped by the presence of the 50-day moving average (DMA) at around $28.74, which is seen as the first support level. The grey metal bounced from around three-week lows of $28.66 to current spot prices.
Momentum remains bearish, as the Relative Strength Index (RSI) depicts. Hence, if XAG/USD achieves a daily close below the 50-DMA, the Silver price could plunge to the next support level seen at the 100-DMA at $26.40, ahead of the May 2 low of $26.02.
On the other hand, if Silver buyers conquer $29.00, they must clear the $30.00 handle, if they would like to re-test the year-to-date (YTD) high of $32.51.
XAG/USD Price Action – Daily Chart
- The NZD/USD holds in consolidation after a sharp mid-May rise.
- Buyers struggle to breach the 0.6220 area.
- Indicators remain in positive territory on the daily chart, though momentum points downward.
The NZD/USD rose to a high of 0.6217 before stabilizing at 0.6170. The upward momentum of this pair has encountered resistance in the 0.6220 area, with attempts to breach this level remaining unsuccessful.
In the daily chart, the Relative Strength Index (RSI) stands at 56 but points down suggesting a slight decline in buying pressure. This decrease in the RSI is consistent with the presence of flat red bars on the Moving Average Convergence Divergence (MACD), reinforcing the ongoing consolidation pattern.
NZD/USD daily chart
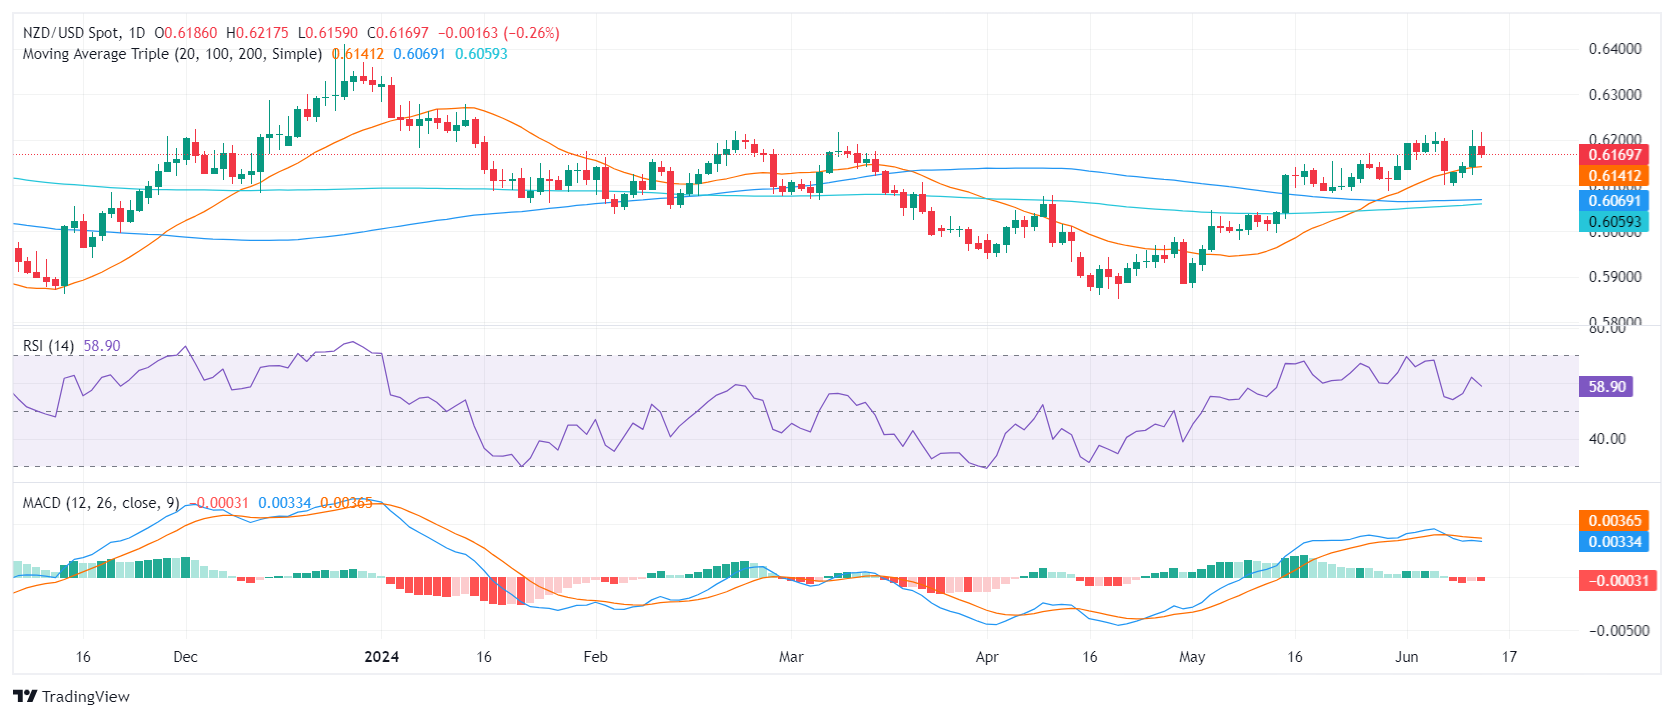
NZD/USD continues to show strong signs of consolidation with its 20-day Simple Moving Average (SMA) forming the immediate support at 0.6140. Furthermore, the convergence of the 100 and 200-day SMAs in the 0.6050-0.6060 region continues to act as a robust support base for the pairing. This may serve as a trajectory for correction if a bearish trend emerges. Any movements below this point of convergence could be considered a sell signal.
- EUR/USD erases recent gains to fall back into technical weak zone.
- Euro under pressure as political turmoil shakes markets.
- Greenback bolstered by risk-off flows as US data misses the mark.
EUR/USD tumbled back into recent lows below 1.0750 on Thursday, paring away recent gains as confidence in the Euro (EUR) flounders on the back of EU political instability. A miss in US Producer Price Index (PPI) figures is steepening concerns of an economic slowdown in the US, sparking a hard curve in risk appetite heading into the week’s final trading sessions.
European parliamentary elections drove confidence in the Euro even lower as France dissolves parliament and heads into snap elections. French President Emmanuel Macron called for a short-notice presidential election after suffering a crushing defeat in EU parliament elections, and financial markets are tilting to the downside at the prospect of France’s President Macron getting replaced by the National Rally’s Marine Le Pen, a right-leaning conservative politician sweeping to popularity within France on a platform of steep tax cuts, lowering the retirement age, and stiff limits to immigration into France from both outside and within the EU.
Financial markets in Europe are increasingly uneasy about a Le Pen win in France, which would carry steep fiscal burdens at a time when European economic figures are broadly missing the mark but rate cuts from the European Central Bank (ECB) remain difficult to deliver with lopsided inflation still plaguing the Eurozone.
US Dollar flows spiked higher on Thursday after US PPI figures eased quicker than forecasts, and US Initial Jobless Claims flagged a faster-than-expected uptick in new unemployment claims. Markets are now pivoting to Friday’s University of Michigan Consumer Sentiment Index for June, which is forecast to rise to 72.0 from 69.1.
A smattering of talking points from several ECB policymakers are expected throughout Friday as finance ministers from across the European Union meet to kick off the next round of Eurogroup Meetings.
EUR/USD technical outlook
Thursday’s decline has sent EUR/USD back into recent lows as the pair struggles to hold onto chart territory north of 1.0750. Fiber bids were unable to dig in a foothold above the 200-hour Exponential Moving Average (EMA) at 1.0804 this week, and the pair heads into Friday’s trading sessions on the back foot.
EUR/USD has buckled underneath the weight of descending trendlines drawn from 2024’s peak bids near 1.1140. Downside pressure has been building since the pair declined from June’s early highs above 1.0900, and the Fiber is now trading back into the low side of the 200-day EMA at 1.0804.
EUR/USD hourly chart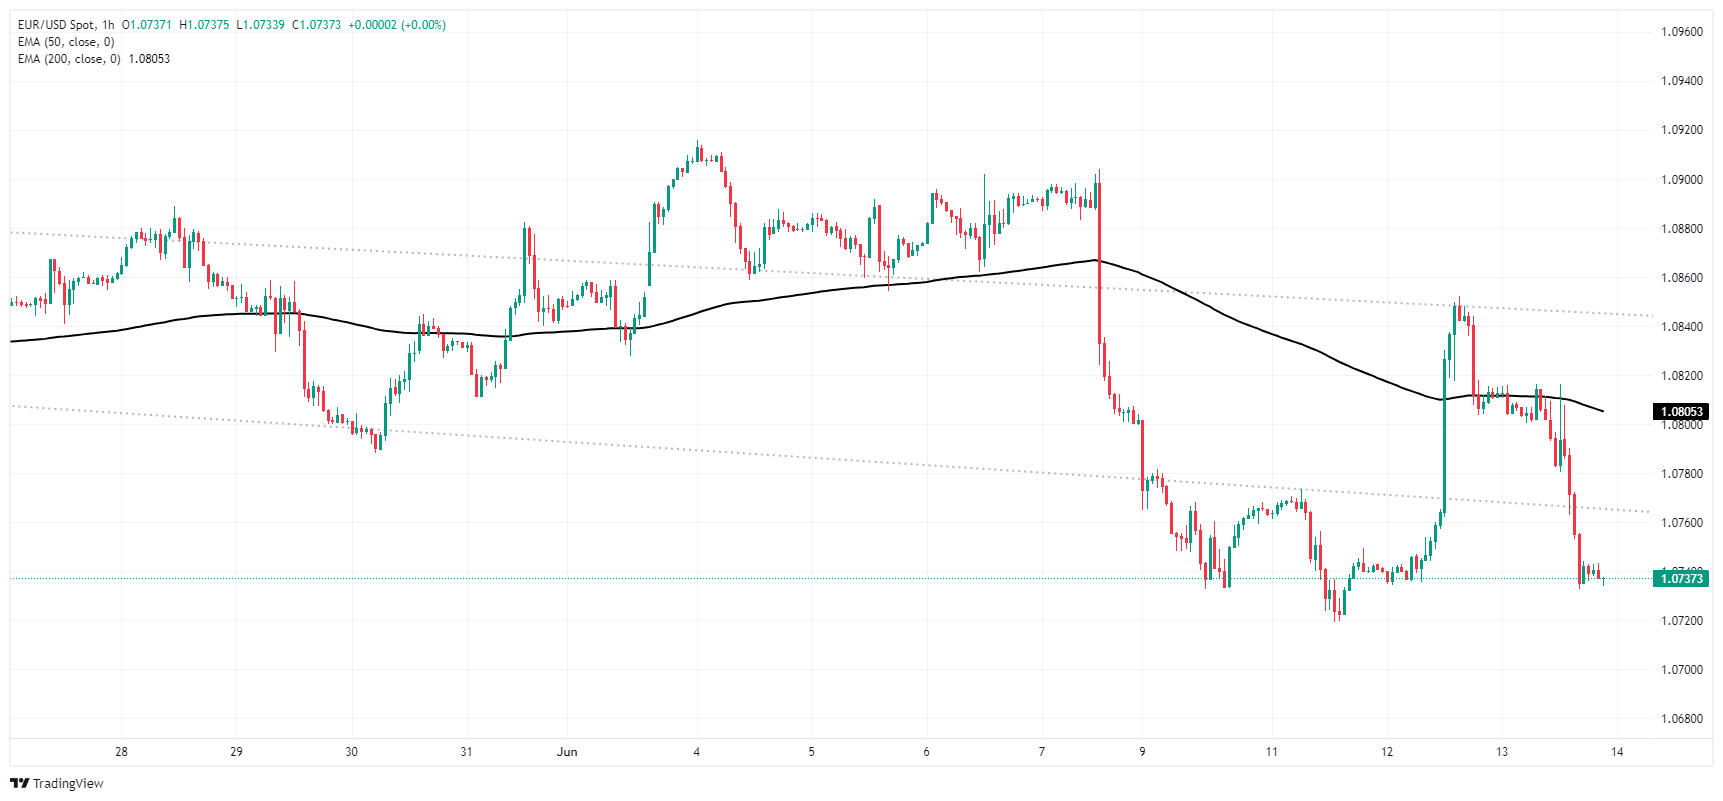
EUR/USD daily chart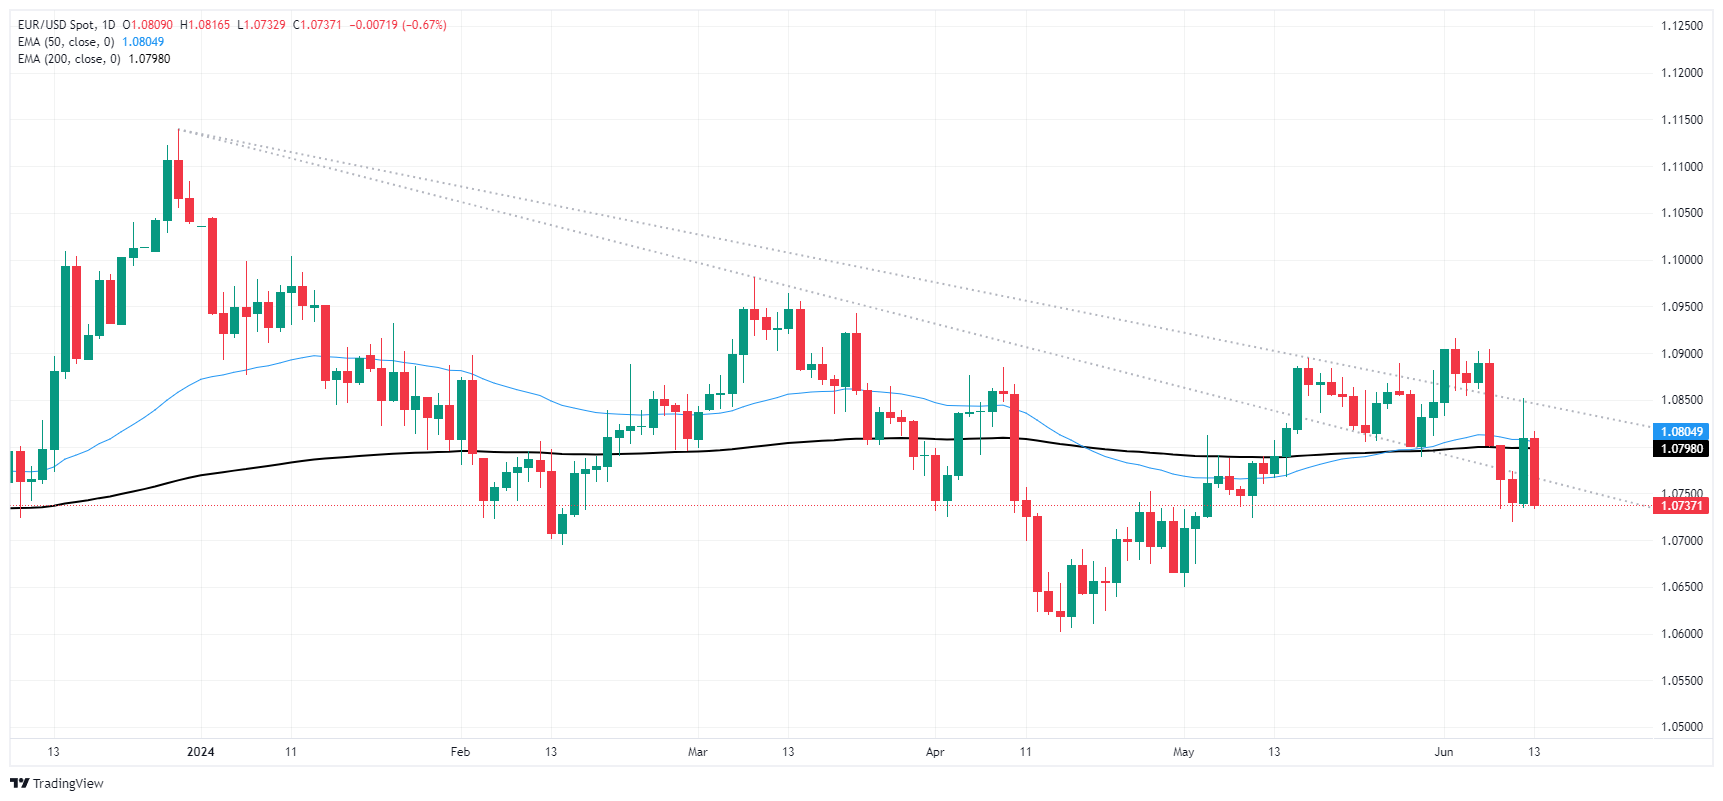
- The AUD/JPY pair is experiencing a decline as buyers take profits, causing it to hover around the 20-day SMA.
- In spite of the drop, the pair remains in consolidation, suggesting the possibility of a limited decline for the time being.
- If the bulls are successful in building support around the 20-day SMA, the next potential target lies within the 104.50-105.00 price range.
In Thursday's session, the AUD/JPY pair witnessed a dip towards 104.00 as buyers cashed in their profits, which saw the pair soaring above the 20-day Simple Moving Average (SMA). The 20-day SMA, which previously acted as a point of resistance, seems to be the new focus point for building support in order to lessen further losses. Nevertheless, the persistent consolidation phase suggests a lack of momentum for a steady rise.
The daily Relative Strength Index (RSI) of the AUDJPY now stands at 54, a decrease from the previous session's score of 57, indicating a slight downward trend and implying that the previous upward momentum may be losing steam. In contrast, the Moving Average Convergence Divergence (MACD) is exhibiting stationary red bars, indicative of a stabilizing momentum.
AUD/JPY daily chart
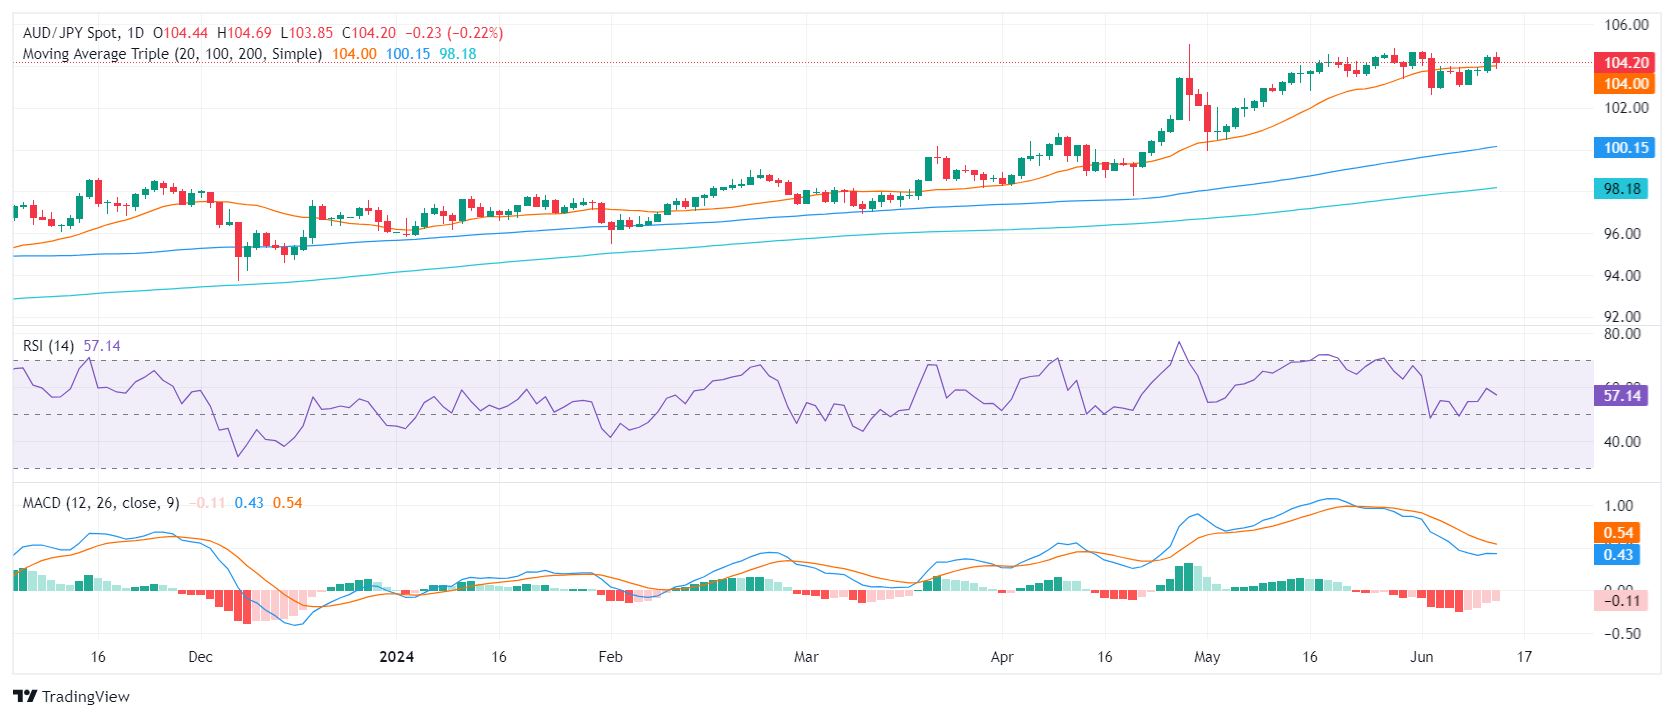 In conclusion, the AUD/JPY pair appears to be in a consolidation phase, despite a drop this Thursday as trading hovers around the 20-day SMA. The possible range of 102.00-103.00 for the upcoming sessions may denote the continuation of side-ways trading as bulls seem to be consolidating from the May rally which had lifted the pair near 105.00. Nonetheless, the reduction in selling momentum could represent a gearing up by the bulls for the next upward swing, potentially retesting the 104.50-105.00 area.
- EUR/GBP heads for 0.8400 as Euro gets forced lower by political turmoil.
- Economic figures from the EU continue to disappoint.
- A rate cut from the ECB has widened the rate differential.
EUR/GBP saw a sharp downside push on Thursday, driving the pair to a nearly two-year low near the 0.8400 handle as political and economic uncertainty weigh on the Euro (EUR). Economic data has broadly missed forecasts in both the UK and the European economic zone, but a recent rate cut from the European Central Bank (ECB) has widened the Euro’s rate differential against other major currencies.
Pan-European Industrial Production contracted -0.1% MoM in April, missing the forecast 0.2% and the previous month was revised to 0.5% from 0.6%. YoY Industrial Production alos declined by a steeper-than-expected -3.0% compared to the forecast -1.9% and the previous period’s revised -1.2%.
European Parliamentary elections swung in favor of center-right and right-leaning parties across the European Union, sparking uncertainty in European financial markets. France has been driven to snap elections that could see President Emmanuel Macron get unseated by Deputy of the French National Assembly (FNA) Marine Le Pen. Le Pen’s political rise is shaking stability in financial markets as Le Pen's National Rally party's platform of steep tax cuts and lowering of the retirement age threatens to introduce financial instability in echoes of Lizz Truss’s brief stint as the Prime Minister of the UK.
UK data remains limited this week, leaving GBP traders to wait for next week’s latest UK Consumer Price Index (CPI) inflation print. The Bank of England (BoE) also delivers its latest rate call later next week. The BoE last voted 7-to-2 to keep interest rates on hold at 5.25%.
EUR/GBP technical outlook
EUR/GBP’s backslide on Thursday marks a fresh 22-month low for the pair, sending bids tumbling towards the 0.8400 handle. Bearish flows have dragged the pair into further declines after the EUR/GBP through technical support at 0.8500, and bulls are having a difficult time hitting the brakes.
EUR/GBP is accelerating towards the downside away from the 200-day Exponential Moving Average (EMA) at 0.8581. The pair is down 3% from 2024’s opening bids, and major resistance is priced in even further down at 0.8300.
EUR/GBP daily chart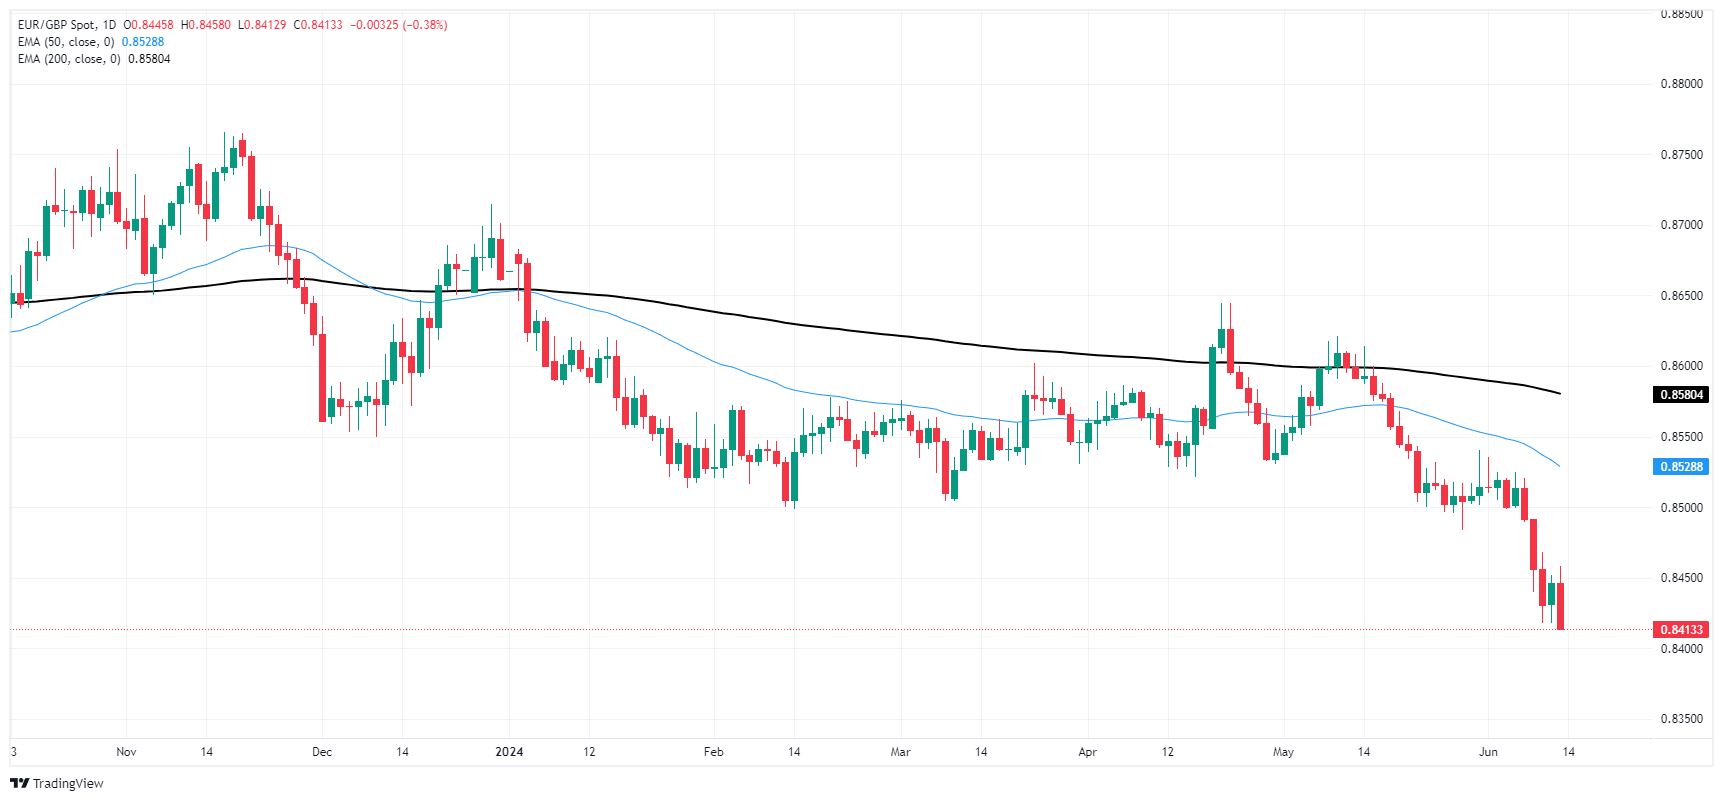
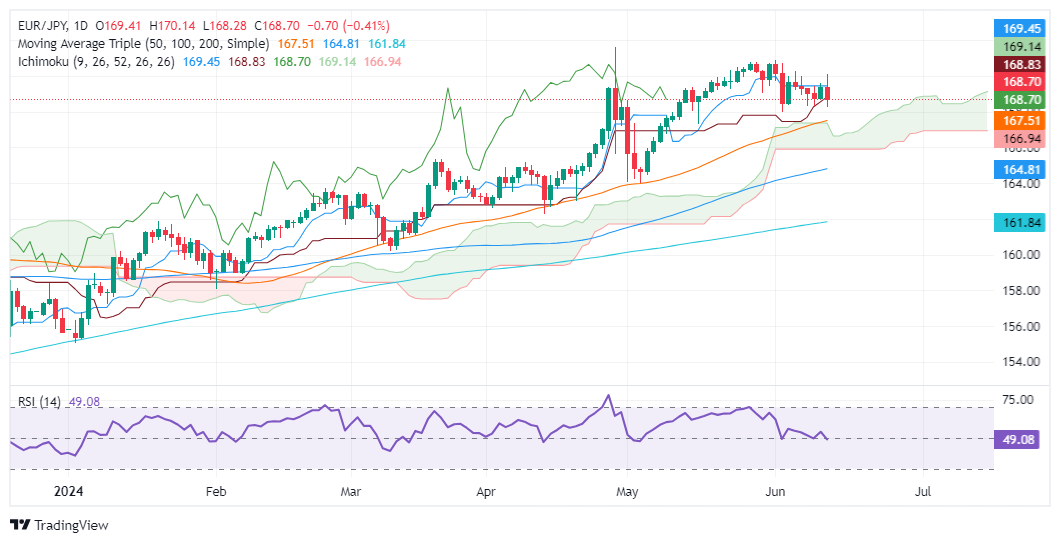
- EUR/JPY buying pressure fades after consolidating around 168-170 for almost one month.
- Momentum supports sellers, with potential targets seen at 167.47 and 165.92.
- Upside is limited, yet a breach of 170.00, could pave the way to test the year-to-date (YTD) high of 171.58.
The EUR/JPY seesawed within a 180-pip range on Thursday yet is posting losses of 0.45% after hitting a daily high of 170.13. At the time of writing, the pair exchanged hands at 168.60, below its opening price.
EUR/JPY Price Analysis: Technical outlook
After peaking at around 170.00, the EUR/JPY has consolidated below the latter, yet it cannot drop below the Ichimoku Cloud (Kumo), which would accelerate the downtrend.
The Relative Strength Index (RSI) shows sellers gather momentum after the RSI punches below the 50-line. This suggests the EUR/JPY would be subject to further losses.
If EUR/JPY falls below the 50-day moving average (DMA) of 167.47, that could exacerbate a dip inside the Kumo, an indication of the acceleration of the downtrend. The next support would be the bottom of the Kumo at 165.92, followed by the 100-DMA at 164.78.
EUR/JPY Price Action – Daily Chart
- Kiwi shows signs of fatigue against the Yen, after reaching highest level since June 2007 on Thursday.
- Indicators on the daily chart suggest potential further consolidation, with trading confined between 95.00 and 97.00.
- A retest of the 97.00 level is possible, but a breach is unlikely as buyers consolidate gains from the significant ascent in May.
On Thursday, the NZD/JPY pair exhibited signs of fatigue, following its advancement to the multi-year highs logged earlier in the week. Clearly, the technical landscape suggests an extension of the consolidation phase, potentially keeping the pair's upside movements capped below the psychological 97.00 level.
The daily Relative Strength Index (RSI) for NZD/JPY has slightly retreated to 59, indicative of a waning in the bullish momentum. The Moving Average Convergence Divergence (MACD) continues to print flat red bars, further endorsing the perspective of ongoing consolidation.
NZD/JPY daily chart
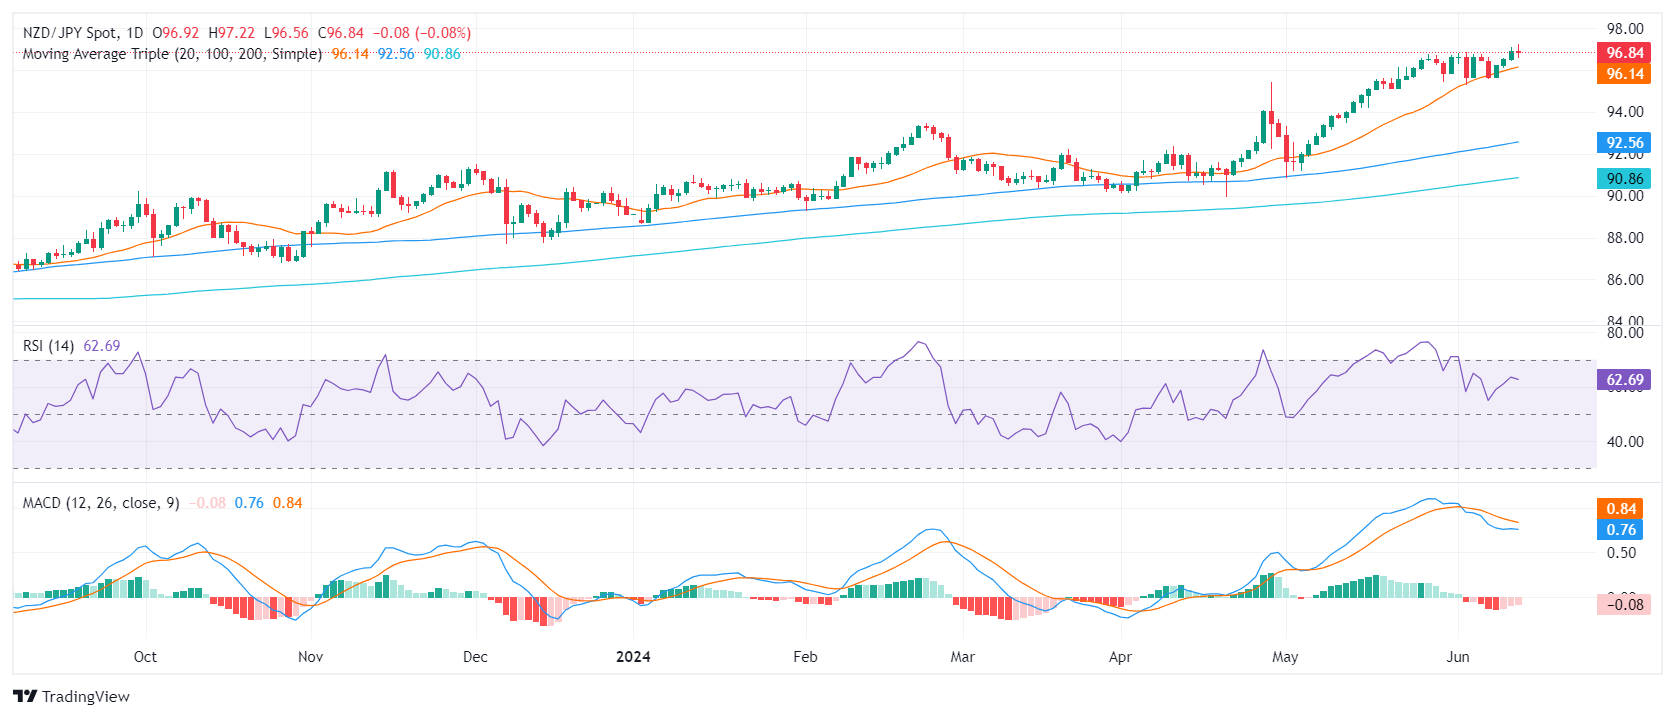 The continuous presence of buyers above the 20-day Simple Moving Average (SMA) indicates their effort to sustain the bullish push. Yet, the recent exhaustion signal demonstrated by the daily technical indicators supports the market's need to consolidate following the significant surge recorded in May. The upcoming trading sessions might see the pair oscillate between the 95.00 level, serving as support, and the 97.00 level, acting as resistance, as the pair looks to stabilize after recent gains.
The longer-term SMAs established around 90.00 - 92.00 safeguard the overall bullish complexion of the pair.
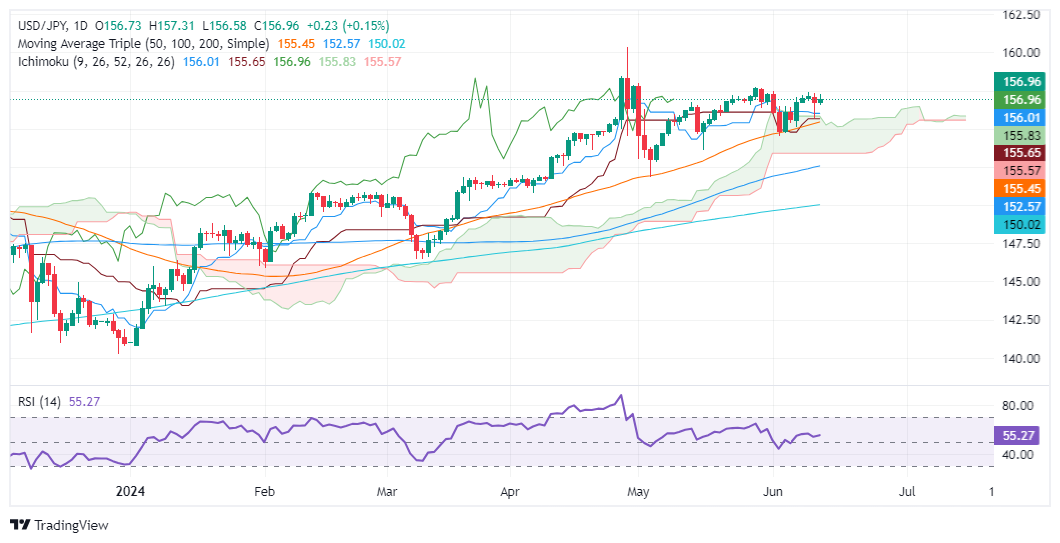
- USD/JPY edges up slightly despite falling US Treasury yields.
- Technical outlook: Buyers in control, targeting 157.00 and potentially April's high of 158.44.
- Downside risks are seen below 156.00, followed by 155.72 and further targets at 154.00 and 153.35/40.
The USD/JPY recovered some ground during the North American session yet is virtually unchanged, up by a minimal 0.08%, weighed by a fall in US Treasury bond yields. US economic data from the United States (US) shows that inflation is getting lower, yet the Federal Reserve remains skeptical that the battle against higher prices isn’t finished. The pair trades at 156.87 at the time of writing.
USD/JPY Price Analysis: Technical outlook
From a technical standpoint, the USD/JPY climbs steadily, with buyers remaining in charge, as depicted by the Relative Strength Index (RSI). Momentum shows that bulls are losing steam, yet the RSI remains bullish.
If USD/JPY climbs past 157.00, that could pave the way for further gains, with buyers targeting April 26 high of 158.44. Further upside is seen above 159.00, like the year-to-date (YTD) high of 160.32.
Conversely, if USD/JPY slides beneath the Tenkan-Sen at 156.0, the next stop would be June 12 low of 155.72. A breach of the latter and the pair could tumble toward the 154.00 figure, before testing the Ichimoku Cloud (Kumo) low of 153.35/40.
USD/JPY Price Action – Daily Chart
- GBP/JPY hit a new 16-year peak of 201.32 on Thursday.
- JPY traders are buckling down ahead of the BoJ’s latest rate call.
- Sterling markets are shrugging off misses in UK data.
GBP/JPY tested into a fresh 16-year high above 201.00 on Thursday, tipping into 201.32 before falling back into the previous day’s range as Guppy traders jostle for position ahead of the Bank of Japan’s (BoJ) latest rate call and Monetary Policy Statement. The BoJ’s latest rate statement is due early on Friday, and Sterling traders will be looking ahead to next week’s latest UK Consumer Price Index (CPI) inflation update.
UK data has broadly missed the mark this week, with an unexpected surge in unemployment claims and a sharper-than-forecast contraction in industrial activity. However, GBP traders have broadly shrugged off the bleaker economic outlook for the UK to bolster the Guppy as Japan’s hypereasy monetary policy stance keeps the Yen unsupported against its major currency peers.
The BoJ is broadly expected to hold rates at 0% early Friday, and investors aren’t expecting much movement from the Japanese central bank in the way of tightening monetary policy. The economic calendar remains thin on the UK side, leaving GBP traders to sit and wait for next Wednesday’s CPI inflation print, followed by Thursday’s rate call from the Bank of England (BoE). The BoE last voted 7-to-2 to keep interest rates steady at 5.25%, with only two Monetary Policy Committee (MPC) members voting for a rate cut.
GBP/JPY technical outlook
GBP/JPY peaked at a fresh 16-year high of 201.32 early Thursday before quickly pulling back to the 200-hour Exponential Moving Average (EMA) at 199.89. The pair is still tilted firmly into bullish territory, but downside pulses are keeping the pair in a choppy rising consolidation pattern.
The Guppy closed five of the last six trading days in the green, and is showing signs of bullish exhaustion. The pair could be poised for a fresh drop to the 50-day EMA at 196.56, though GBP/JPY remains deep in bull country, trading above the 200-day EMA at 188.91.
GBP/JPY hourly chart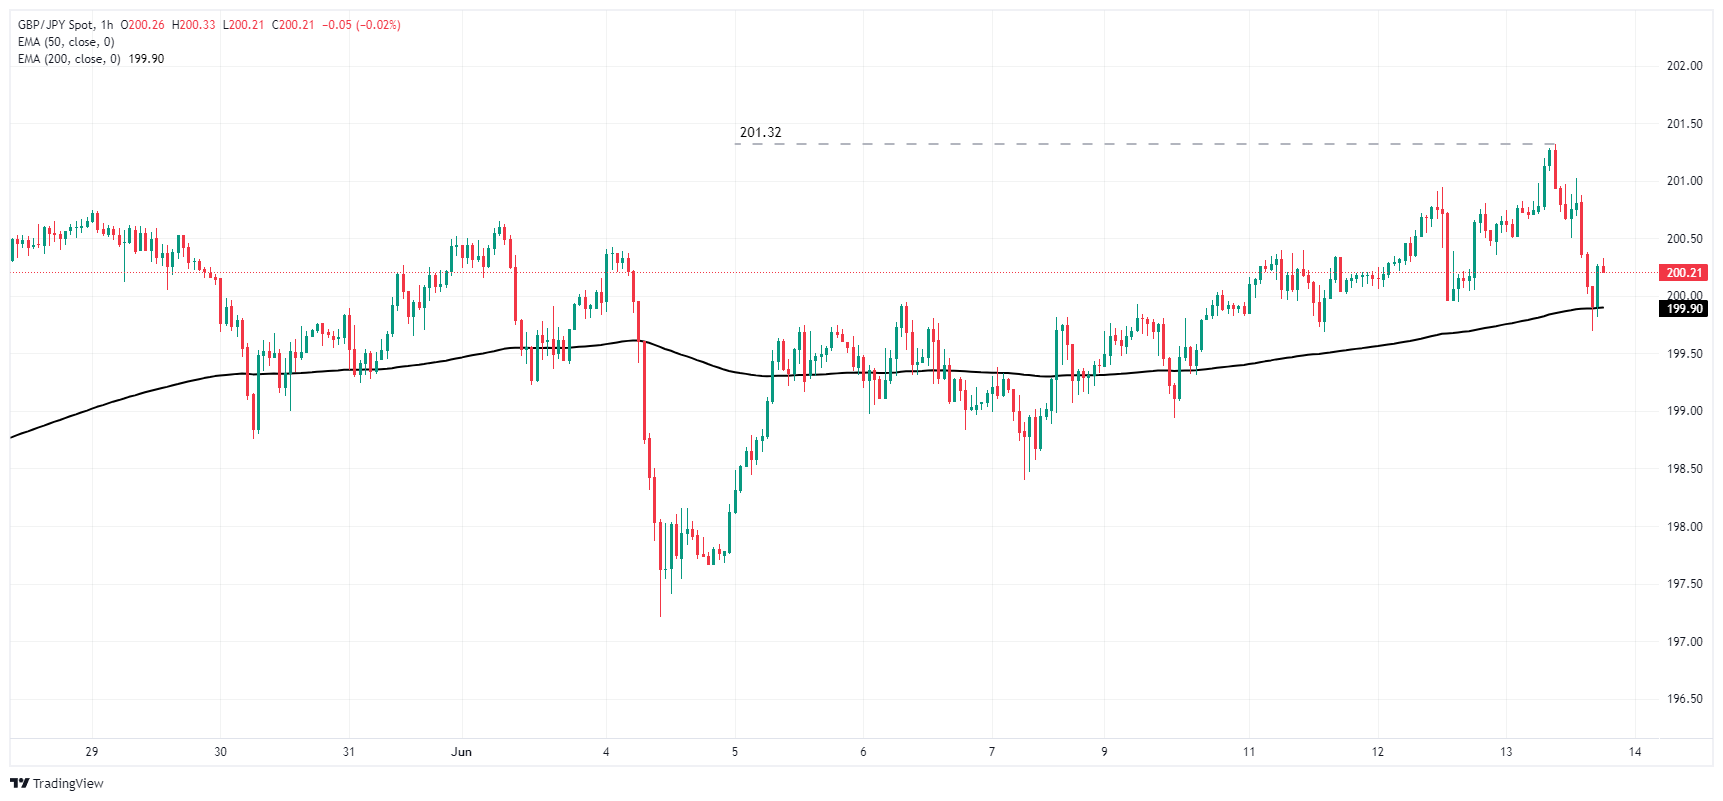
GBP/JPY daily chart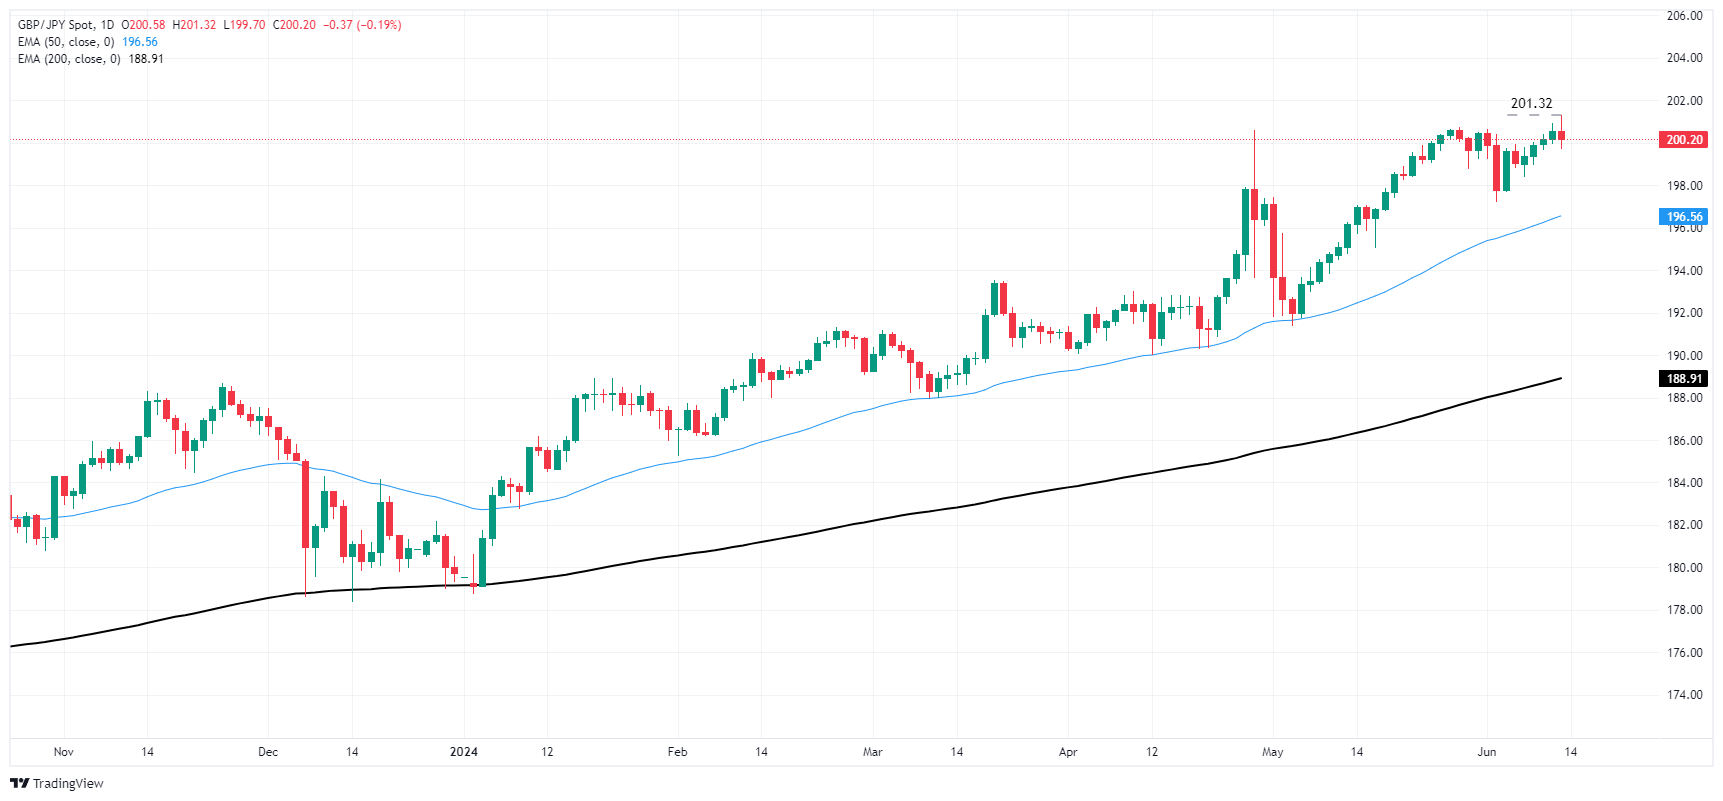
The US Dollar managed to regain balance and reverse the post-CPI pullback on Thursday along with investors’ assessment of a potential one interest rate cut by the Fed at some point by year-end and declining US yields across the curve. The BoJ is expected to keep rates on hold.
Here is what you need to know on Friday, June 14:
The USD Index (DXY) regained its uptrend and reclaimed the area beyond the 105.00 barrier, despite US yields continuing to trend lower. On June 14, the preliminary Michigan Consumer Sentiment gauge is due, seconded by the speech by the Fed’s Goolsbee (Chicago).
EUR/USD sharply reversed Wednesday’s bullish attempt and traded at shouting distance from monthly lows near 1.0720. The Balance of Trade results are expected in the euro zone on June 14, along with the speech by the ECB’s Lagarde.
GBP/USD made a U-turn after three consecutive sessions of gains in response to the marked rebound in the Greenback. The UK calendar is empty on June 14.
USD/JPY maintained cautious trade near the 157.00 region, up modestly for the day ahead of the key BoJ meeting. In fact, the BoJ’s interest rate decision takes centre stage on June 14, seconded by final Industrial Production, and the Tertiary Industry Index.
AUD/USD came under pressure following gains in the US Dollar, partially fading Wednesday’s strong advance. The publication of Consumer Inflation Expectations will be unveiled o June 14 followed by the Consumer Confidence Index tracked by Westpac.
WTI prices traded within a narrow range around the $78.00 mark per barrel, as traders digested recent US crude oil inventories report and inflation data.
Gold corrected sharply lower after three sessions in a row of gains on the back of the strong dollar and expectations of just one interest rate cut by the Fed this year. Silver sold off to four-week lows, breaking below the $29.00 mark per ounce amidst a generalized bearish tone in the commodity complex.
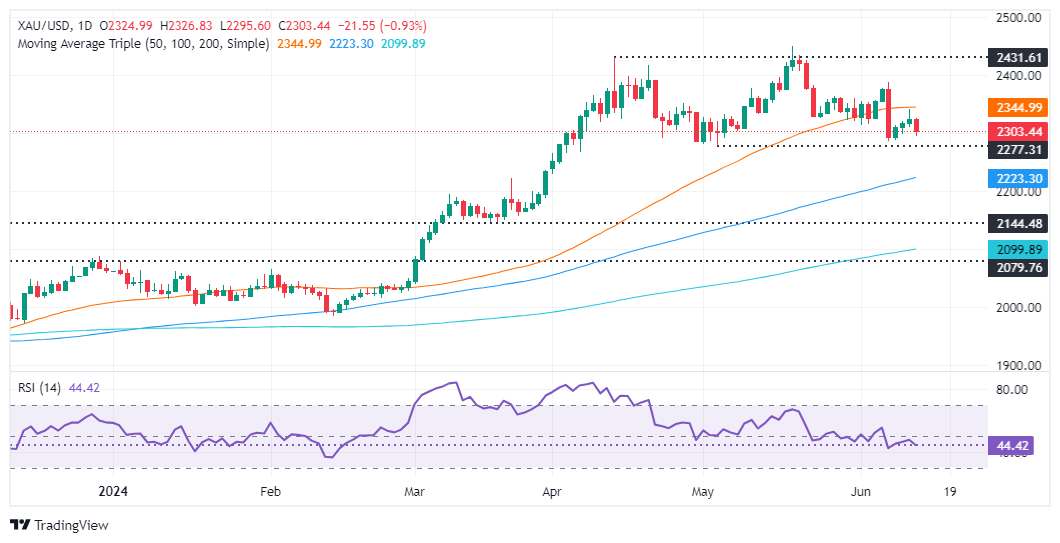
- Gold retreats on its way toward $2,300 after hitting a daily high of $2,326.
- Fed's revised projections show just one rate cut in 2024, a headwind for XAU/USD prices.
- Lower producer prices and higher unemployment claims boost USD, 10-year Treasury yield drops to 4.242%.
Gold prices retreated during the North American session on Thursday after hitting a daily high of $2,326. The Federal Reserve (Fed) projects just one interest rate cut instead of the three proposed since December’s 2023 Summary of Economic Projections (SEP), aka the dot plot. In the meantime, mixed US economic data boosted the Greenback to the detriment of the golden metal.
The XAU/USD spot trades at $2,303, down almost 1%. US data from the Bureau of Labor Statistics (BLS) showed lower prices paid by producers, while the number of Americans applying for unemployment benefits exceeded estimates and the previous reading.
Although the figures suggest that the Fed could set the stage to lower interest rates, Fed officials estimate just 25 basis points (bps) of easing toward the end of 2024, according to the dot plot.
Despite that, according to data from the Chicago Board of Trade, market participants are eyeing 39 basis points of easing via December’s 2024 fed funds rate contract.
The US 10-year Treasury note yield dropped seven bps from 4.310% to 4.242%, usually a tailwind for the non-yielding metal that is feeling China’s Gold buying pause.
News that the People’s Bank of China paused its 18-month bullion buying spree weighed on the precious metal. PBOC holdings held steady at 72.80 million troy ounces of Gold in May.
On Wednesday, Fed Chair Jerome Powell stated that they are less confident about inflation than previously "in order to cut." He added, "If jobs are to weaken unexpectedly, the Fed is ready to respond." When asked about the US CPI report, Powell mentioned that it is just one and emphasized the need to see the deflation process evolving toward the Fed’s goal.
Daily digest market movers: Gold price tumbles after softer US data
- US Dollar Index (DXY) increased by 0.49% to 105.20, a headwind for Gold prices.
- US Producer Price Index (PPI) in May dipped from 0.5% to -0.2%, below estimates of 0.1% expansion.
- Core PPI in May was unchanged at 0%, below forecasts of a 0.3% expansion and beneath April’s 0.5%.
- Initial Jobless Claims for the week ending June 6 rose by 242K, above the consensus of 225K and the previous week's reading of 229K.
- Despite US CPI report showing disinflation process continuing, Fed Chair Jerome Powell commented that they remain “less confident” about the progress on inflation.
- Even though the latest US CPI and PPI reports were weaker than expected, the latest NFIB Small Business Optimism Index survey for May showed that businesses are struggling with higher prices and access to cheap financing.
Technical analysis: Gold price sellers regain control as prices are headed toward $2,300
The Gold price remains neutral to downwardly biased as the Head-and-Shoulders chart pattern remains in place, hinting that the non-yielding metal price is set for further losses. Momentum as measured by the Relative Strength Index (RSI) shows that sellers are in charge, an indication that once XAU/USD’s price drops below $2,300, lower prices lie ahead.
Gold’s first support would be $2,300. Once cleared the next stop would be the May 3 low of $2,277, followed by the March 21 high of $2,222. Further losses lie beneath, as sellers would eye the Head-and-Shoulders chart pattern objective at around $2,170 to $2,160.
On the flipside, if XAU/USD soars past the June 7 cycle high of $2.387, that paves the way to test the $2,400 figure.
Gold FAQs
Gold has played a key role in human’s history as it has been widely used as a store of value and medium of exchange. Currently, apart from its shine and usage for jewelry, the precious metal is widely seen as a safe-haven asset, meaning that it is considered a good investment during turbulent times. Gold is also widely seen as a hedge against inflation and against depreciating currencies as it doesn’t rely on any specific issuer or government.
Central banks are the biggest Gold holders. In their aim to support their currencies in turbulent times, central banks tend to diversify their reserves and buy Gold to improve the perceived strength of the economy and the currency. High Gold reserves can be a source of trust for a country’s solvency. Central banks added 1,136 tonnes of Gold worth around $70 billion to their reserves in 2022, according to data from the World Gold Council. This is the highest yearly purchase since records began. Central banks from emerging economies such as China, India and Turkey are quickly increasing their Gold reserves.
Gold has an inverse correlation with the US Dollar and US Treasuries, which are both major reserve and safe-haven assets. When the Dollar depreciates, Gold tends to rise, enabling investors and central banks to diversify their assets in turbulent times. Gold is also inversely correlated with risk assets. A rally in the stock market tends to weaken Gold price, while sell-offs in riskier markets tend to favor the precious metal.
The price can move due to a wide range of factors. Geopolitical instability or fears of a deep recession can quickly make Gold price escalate due to its safe-haven status. As a yield-less asset, Gold tends to rise with lower interest rates, while higher cost of money usually weighs down on the yellow metal. Still, most moves depend on how the US Dollar (USD) behaves as the asset is priced in dollars (XAU/USD). A strong Dollar tends to keep the price of Gold controlled, whereas a weaker Dollar is likely to push Gold prices up.
- AUD/USD experiences an extended decline following release of labor market figures from Australia during Asian session.
- Federal Reserve's projection of higher interest rates continues to favor USD.
- Despite clearing some losses, US Treasury yields remain down by more than 2%.
The Australian Dollar (AUD) fell further against the US Dollar (USD) on Thursday despite strong labor market data from Australia reported earlier in the session. The US seems to be enjoying demand thanks to the interest rate revisions, which saw the Federal Reserve (Fed) governors forecasting fewer rate cuts this year. In addition, the Greenback kept its strength despite soft inflation figures reported during the European session.
The Australian economy shows some signs of weakness, but the stubbornly high inflation is prompting the Reserve Bank of Australia to delay cuts, which may limit the downside.
Daily digest market movers: Australian Dollar maintains selling bias despite positive employment numbers
- Australian Bureau of Statistics (ABS) released employment data showing a drop in Australia’s Unemployment Rate to 4.0% in May, meeting expectations. This figure marked a slight improvement from the previous rate of 4.1%.
- Australian Employment Change increased to 39.7K in May from 38.5K in April, surpassing the forecast of 30.0K.
- Participation rate increased slightly to 66.8% in May, up from 66.7% in April. There was a significant increase in Full-Time Employment, while Part-Time Employment decreased.
- On the US side, the US Bureau of Labor Statistics revealed on Thursday that the Producer Price Index (PPI) for final demand in the US rose 2.2% on a yearly basis in May, indicating looser inflationary pressure than expected.
- On the negative side, weekly Initial Jobless Claims came in higher than expected.
Technical analysis: AUD/USD sellers gather momentum, positive outlook remains
The Relative Strength Index (RSI) remains above 50 but points downwards, suggesting that bullish momentum might be losing steam. Meanwhile, the Moving Average Convergence Divergence (MACD) shows steady red bars indicating stable selling pressure.
However, the short-term outlook remains positive as the pair sustains its position above the 20-day Simple Moving Average (SMA) at 0.6640. If lost, the 100 and 200-day SMAs offer themselves as barriers around the 0.6560 area.
Australian Dollar FAQs
One of the most significant factors for the Australian Dollar (AUD) is the level of interest rates set by the Reserve Bank of Australia (RBA). Because Australia is a resource-rich country another key driver is the price of its biggest export, Iron Ore. The health of the Chinese economy, its largest trading partner, is a factor, as well as inflation in Australia, its growth rate and Trade Balance. Market sentiment – whether investors are taking on more risky assets (risk-on) or seeking safe-havens (risk-off) – is also a factor, with risk-on positive for AUD.
The Reserve Bank of Australia (RBA) influences the Australian Dollar (AUD) by setting the level of interest rates that Australian banks can lend to each other. This influences the level of interest rates in the economy as a whole. The main goal of the RBA is to maintain a stable inflation rate of 2-3% by adjusting interest rates up or down. Relatively high interest rates compared to other major central banks support the AUD, and the opposite for relatively low. The RBA can also use quantitative easing and tightening to influence credit conditions, with the former AUD-negative and the latter AUD-positive.
China is Australia’s largest trading partner so the health of the Chinese economy is a major influence on the value of the Australian Dollar (AUD). When the Chinese economy is doing well it purchases more raw materials, goods and services from Australia, lifting demand for the AUD, and pushing up its value. The opposite is the case when the Chinese economy is not growing as fast as expected. Positive or negative surprises in Chinese growth data, therefore, often have a direct impact on the Australian Dollar and its pairs.
Iron Ore is Australia’s largest export, accounting for $118 billion a year according to data from 2021, with China as its primary destination. The price of Iron Ore, therefore, can be a driver of the Australian Dollar. Generally, if the price of Iron Ore rises, AUD also goes up, as aggregate demand for the currency increases. The opposite is the case if the price of Iron Ore falls. Higher Iron Ore prices also tend to result in a greater likelihood of a positive Trade Balance for Australia, which is also positive of the AUD.
The Trade Balance, which is the difference between what a country earns from its exports versus what it pays for its imports, is another factor that can influence the value of the Australian Dollar. If Australia produces highly sought after exports, then its currency will gain in value purely from the surplus demand created from foreign buyers seeking to purchase its exports versus what it spends to purchase imports. Therefore, a positive net Trade Balance strengthens the AUD, with the opposite effect if the Trade Balance is negative.
- Mexican Peso counterattacks, snapping two days of losses.
- Banxico Governor Victoria Rodriguez Ceja assures intervention if Peso exhibits “atypical behavior or extreme volatility.”
- Greenback weakens against Peso despite Fed's unchanged rates and revised projections with US economic data showing mixed signals.
The Mexican Peso recovered some ground on Thursday and appreciated 0.93% following a verbal intervention by the Bank of Mexico (Banxico). Governor Victoria Rodriguez Ceja commented that the Bank is ready to step in if the Peso shows “atypical behavior or extreme volatility.” The USD/MXN trades at 18.56, around two-day lows.
Mexico’s economic docket remains absent for the rest of the week, with traders awaiting the release of Aggregate Demand, Private Spending, and Retail Sales data next week. However, the USD/MXN exchange rate continues to be driven by political uncertainty about the changes to the Mexican Constitution that threaten the state of law.
In the meantime, on Wednesday, Banxico’s Governor Victoria Rodriguez Ceja commented that the Mexican central bank remains attentive to the USD/MXN exchange rate and insisted that policymakers are not trying to defend a specific level.
Aside from this, the Greenback is on the back foot against the Mexican currency even though the US Federal Reserve (Fed) held rates unchanged and adjusted their projections for future monetary policy. Fed Chair Jerome Powell and the central bank’s governors estimate one interest rate cut in 2024 instead of the three projected by the dot plot since December 2023.
Meanwhile, US economic data showed that prices paid by producers in May were virtually unchanged compared to April, while the number of Americans filing for unemployment benefits exceeded estimates.
Daily digest market movers: Mexican Peso on defensive amidst political uncertainty
- In February 2024, AMLO put forward several proposals to the Mexican Congress. These include a Supreme Court reform that suggests electing Supreme Court ministers through popular vote; an electoral reform aimed at electing electoral commission councilors by popular vote and reducing multi-member representation; and a reform of autonomous bodies that proposes dissolving the transparency body.
- Mexican Peso depreciation could weigh on the Bank of Mexico's (Banxico) decision to ease policy on June 27 despite last month’s dip in core prices. Therefore, keeping interest rates higher could prompt deceleration in the economy and increase the odds of a possible recession.
- Morgan Stanley noted that if Mexico’s upcoming government and Congress adopted an unorthodox agenda, it would undermine Mexican institutions and be bearish for the Mexican Peso, which could weaken to 19.20.
- The US Department of Labor revealed that the Producer Price Index (PPI) in May was 2.2% YoY, below estimates of 2.5%, and a tenth below April’s 2.3%. Core PPI for the same month expanded 2.3% YoY, beneath the consensus and the previous reading of 2.4%.
- The latest US inflation report increased the odds for a Fed rate cut in September, according to the CME FedWatch Tool, from 46.7% to 60.5%.
- December’s 2024 fed funds futures contract hints that investors expect 38 basis points of rate cuts by the Fed through the end of the year.
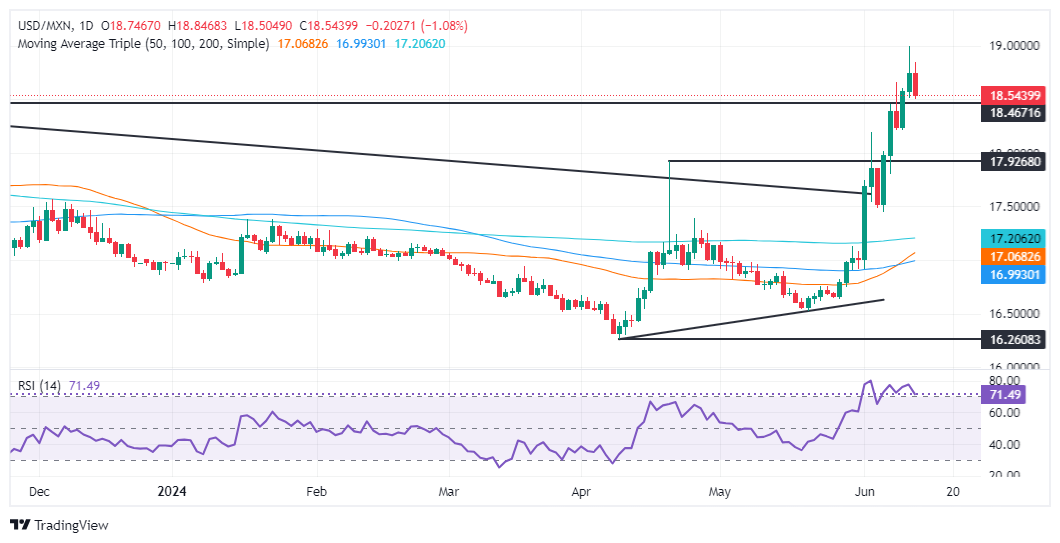
Technical analysis: Mexican Peso advances as USD/MXN slides below 18.60
The USD/MXN uptrend remains intact despite retreating toward the 18.50s region, which could be seen as buyers taking a respite as the Relative Strength Index (RSI) turned overbought. Despite that, momentum favors further upside after the exotic pair cleared strong resistance levels, opening the door for higher spot prices.
The USD/MXN's next resistance would be the year-to-date high of 18.99, followed by the March 20, 2023, high of 19.23. A breach of the latter will sponsor an uptick to 19.50, ahead of the psychological 20.00 mark.
On the other hand, sellers must push the USD/MXN back below the April 19 high of 18.15 if they want to keep the pair within the 18.00-18.15 trading range.
Mexican Peso FAQs
The Mexican Peso (MXN) is the most traded currency among its Latin American peers. Its value is broadly determined by the performance of the Mexican economy, the country’s central bank’s policy, the amount of foreign investment in the country and even the levels of remittances sent by Mexicans who live abroad, particularly in the United States. Geopolitical trends can also move MXN: for example, the process of nearshoring – or the decision by some firms to relocate manufacturing capacity and supply chains closer to their home countries – is also seen as a catalyst for the Mexican currency as the country is considered a key manufacturing hub in the American continent. Another catalyst for MXN is Oil prices as Mexico is a key exporter of the commodity.
The main objective of Mexico’s central bank, also known as Banxico, is to maintain inflation at low and stable levels (at or close to its target of 3%, the midpoint in a tolerance band of between 2% and 4%). To this end, the bank sets an appropriate level of interest rates. When inflation is too high, Banxico will attempt to tame it by raising interest rates, making it more expensive for households and businesses to borrow money, thus cooling demand and the overall economy. Higher interest rates are generally positive for the Mexican Peso (MXN) as they lead to higher yields, making the country a more attractive place for investors. On the contrary, lower interest rates tend to weaken MXN.
Macroeconomic data releases are key to assess the state of the economy and can have an impact on the Mexican Peso (MXN) valuation. A strong Mexican economy, based on high economic growth, low unemployment and high confidence is good for MXN. Not only does it attract more foreign investment but it may encourage the Bank of Mexico (Banxico) to increase interest rates, particularly if this strength comes together with elevated inflation. However, if economic data is weak, MXN is likely to depreciate.
As an emerging-market currency, the Mexican Peso (MXN) tends to strive during risk-on periods, or when investors perceive that broader market risks are low and thus are eager to engage with investments that carry a higher risk. Conversely, MXN tends to weaken at times of market turbulence or economic uncertainty as investors tend to sell higher-risk assets and flee to the more-stable safe havens.
- Dow Jones backslides over 150 points on Thursday.
- Treasury yields and equities backslid after US PPI figures declined.
- US Initial Jobless Claims also rose faster than expected, sparking recession concerns.
The Dow Jones Industrial Average (DJIA) tumbled another 150-plus points on Thursday after US data hinted at a further contraction of the overall economy, briefly sparking risk-off bids into the US Dollar (USD) and forcing Treasury yields lower alongside equity indexes.
US Producer Price Index (PPI) inflation eased faster than expected in May, contracting -0.2% MoM compared to the forecast move lower to 0.1% from 0.5%. Annualized Core PPI also ticked down to 2.3% YoY, falling from the forecast steady print at 2.4%.
US Initial Jobless Claims also rose faster than expected for the week ended June 7, rising to 242K versus the forecast 225K and the previous 229K. Declining producer-level inflation and rising unemployment benefits seekers are exposing cracks in the US economy, reigniting fears of a possible recession looming ahead.
Investor sentiment is on the ropes on Thursday after the Federal Reserve (Fed) held rates on Wednesday and cautioned that the US central bank only expects to make a single rate cut in 2024, down from the three initially forecast in March. Risk-off flows are sapping strength out of equity indexes heading into the tail-end of the trading week, though momentum could flip back to the bullish side. According to the CME’s FedWatch Tool, rate traders are pricing in nearly-even odds of a first quarter-point rate trim in either September or November, with rate markets pricing in a 76% chance of a quarter-point rate cut on September 18.
Dow Jones news
Two-thirds of the Dow Jones index is underwater on Thursday, with losses being led by Salesforce Inc. (CRM) which declined -2.16% to $230.71 per share. On the high side, JPMorgan Chase & Co. (JPM) is recovering from a recent selloff, climbing 0.92% to $193.34 per share.
Dow Jones technical outlook
The Dow Jones is grappling with an intraday recovery from the day’s early lows near 38,393.00, as DJIA bidders try to force action back above the 38,600.00 level. US equities are grinding out a slow recovery from Thursday’s early declines, pulling back into the trading week’s range after setting a brief new low for the week.
The Dow Jones is on pace for a third consecutive down day, but price action continues to hold above a near-term demand zone below the 38,000.00 handle. The index remains down nearly 4% from all-time highs above 40,000.00, but is still decidedly bullish in 2024, up 2.3% from January’s opening bids.
Dow Jones five minute chart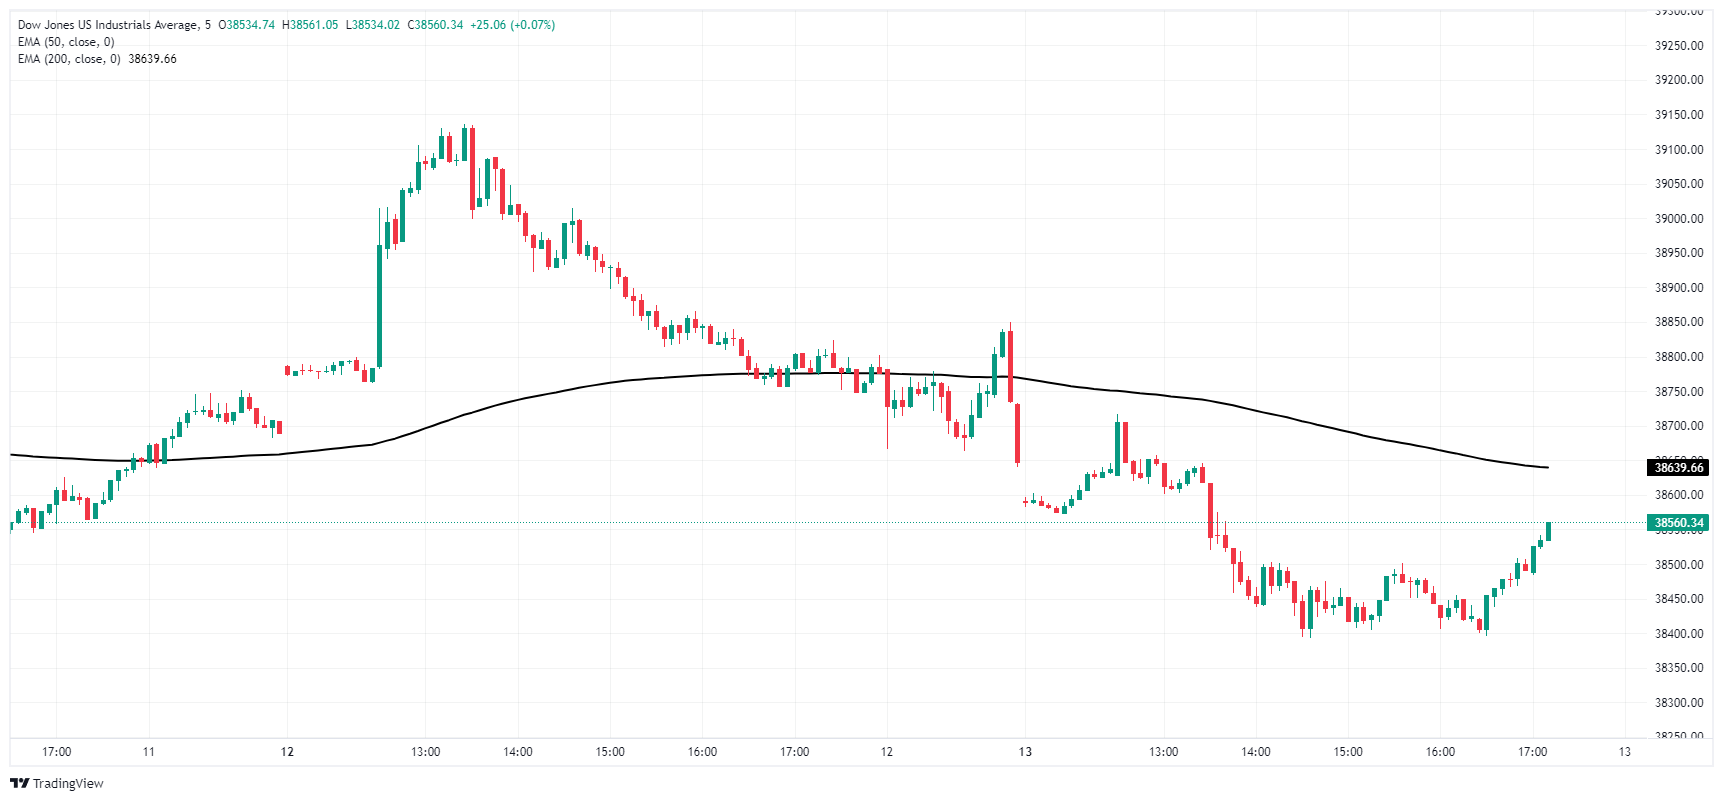
Dow Jones daily chart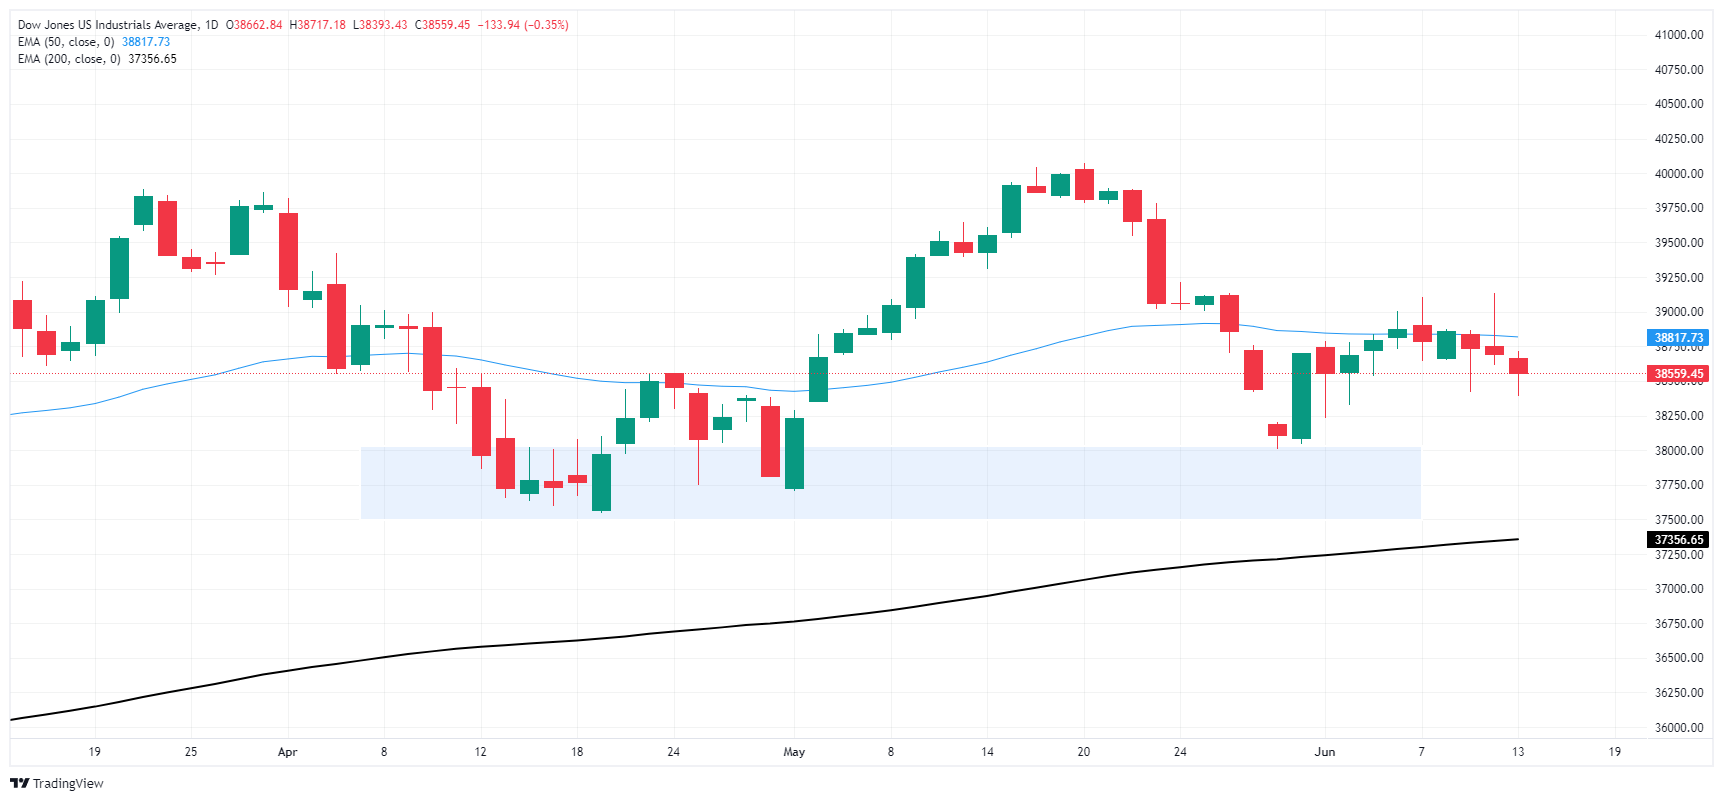
Dow Jones FAQs
The Dow Jones Industrial Average, one of the oldest stock market indices in the world, is compiled of the 30 most traded stocks in the US. The index is price-weighted rather than weighted by capitalization. It is calculated by summing the prices of the constituent stocks and dividing them by a factor, currently 0.152. The index was founded by Charles Dow, who also founded the Wall Street Journal. In later years it has been criticized for not being broadly representative enough because it only tracks 30 conglomerates, unlike broader indices such as the S&P 500.
Many different factors drive the Dow Jones Industrial Average (DJIA). The aggregate performance of the component companies revealed in quarterly company earnings reports is the main one. US and global macroeconomic data also contributes as it impacts on investor sentiment. The level of interest rates, set by the Federal Reserve (Fed), also influences the DJIA as it affects the cost of credit, on which many corporations are heavily reliant. Therefore, inflation can be a major driver as well as other metrics which impact the Fed decisions.
Dow Theory is a method for identifying the primary trend of the stock market developed by Charles Dow. A key step is to compare the direction of the Dow Jones Industrial Average (DJIA) and the Dow Jones Transportation Average (DJTA) and only follow trends where both are moving in the same direction. Volume is a confirmatory criteria. The theory uses elements of peak and trough analysis. Dow’s theory posits three trend phases: accumulation, when smart money starts buying or selling; public participation, when the wider public joins in; and distribution, when the smart money exits.
There are a number of ways to trade the DJIA. One is to use ETFs which allow investors to trade the DJIA as a single security, rather than having to buy shares in all 30 constituent companies. A leading example is the SPDR Dow Jones Industrial Average ETF (DIA). DJIA futures contracts enable traders to speculate on the future value of the index and Options provide the right, but not the obligation, to buy or sell the index at a predetermined price in the future. Mutual funds enable investors to buy a share of a diversified portfolio of DJIA stocks thus providing exposure to the overall index.
- Canadian Dollar sheds -0.20% against USD as price action rebounds.
- Canada remains absent from the economic calendar on Thursday.
- BoC Governor Macklem due to speak at event, policy comments expected.
The Canadian Dollar (CAD) pared back recent gains against the US Dollar (USD) on Thursday, shedding a quarter of a percent against the USD as market flows pull back to safety and bolster the Greenback. US economic data broadly printed worse than expected on Thursday, driving investors back into safe havens.
Canada brings strictly low-tier economic calendar events this week, leaving CAD flows at the mercy of broader market sentiment. However, Bank of Canada (BoC) Governor Tiff Macklem is scheduled to speak at an event later on Thursday, and CAD traders will be looking for any updates on the Canadian central bank’s policy stance.
Daily digest market movers: Greenback flows reverse bullish CAD momentum
- US data missed expectations across the board on Thursday, sparking moderate safe haven bids.
- US Initial Jobless Claims for the week ended June 7 jumped to 242K, above the forecast 225K and the previous week’s 229K.
- US Producer Price Index (PPI) in May contracted -0.2%, missing the forecast of 0.1% and declining further from the previous 0.5%.
- Core US PPI (PPI excluding volatile food and energy prices) ticked down to 2.3% YoY versus the forecast hold at 2.4%.
- BoC Governor Macklem due to participate in a fireside chat at the Bank of International Settlements’ Innovation Hub Center in Toronto. CAD traders will be keeping an ear out for any statements about the BoC’s expectations of further rate cuts in the future.
Canadian Dollar PRICE Today
The table below shows the percentage change of Canadian Dollar (CAD) against listed major currencies today. Canadian Dollar was the strongest against the Euro.
| USD | EUR | GBP | JPY | CAD | AUD | NZD | CHF | |
|---|---|---|---|---|---|---|---|---|
| USD | 0.60% | 0.39% | 0.06% | 0.26% | 0.53% | 0.38% | -0.02% | |
| EUR | -0.60% | -0.20% | -0.52% | -0.34% | -0.07% | -0.22% | -0.61% | |
| GBP | -0.39% | 0.20% | -0.32% | -0.13% | 0.15% | -0.03% | -0.40% | |
| JPY | -0.06% | 0.52% | 0.32% | 0.19% | 0.47% | 0.28% | -0.08% | |
| CAD | -0.26% | 0.34% | 0.13% | -0.19% | 0.27% | 0.12% | -0.26% | |
| AUD | -0.53% | 0.07% | -0.15% | -0.47% | -0.27% | -0.17% | -0.55% | |
| NZD | -0.38% | 0.22% | 0.03% | -0.28% | -0.12% | 0.17% | -0.37% | |
| CHF | 0.02% | 0.61% | 0.40% | 0.08% | 0.26% | 0.55% | 0.37% |
The heat map shows percentage changes of major currencies against each other. The base currency is picked from the left column, while the quote currency is picked from the top row. For example, if you pick the Canadian Dollar from the left column and move along the horizontal line to the US Dollar, the percentage change displayed in the box will represent CAD (base)/USD (quote).
Technical analysis: CAD walks back gains against Greenback, but remains mixed overall
The Canadian Dollar (CAD) is mixed overall on Thursday, shedding weight against the US Dollar but gaining ground against the Euro (EUR). The CAD is down a third of a percent against the Swiss Franc (CHF), but gained three-tenths of one percent against the Euro, Thursday’s worst-performing major currency.
USD/CAD has risen above 1.3750 as the Greenback climbs over the CAD, dragging the pair higher but still falling on the short side of the week’s peak bids near 1.3790. Bidders are making a fresh push to try and recapture the 1.3800 handle, while short positions will accumulate in an attempt to drag USD/CAD back down to the 50-day Exponential Moving Average (EMA) at 1.3668.
USD/CAD hourly chart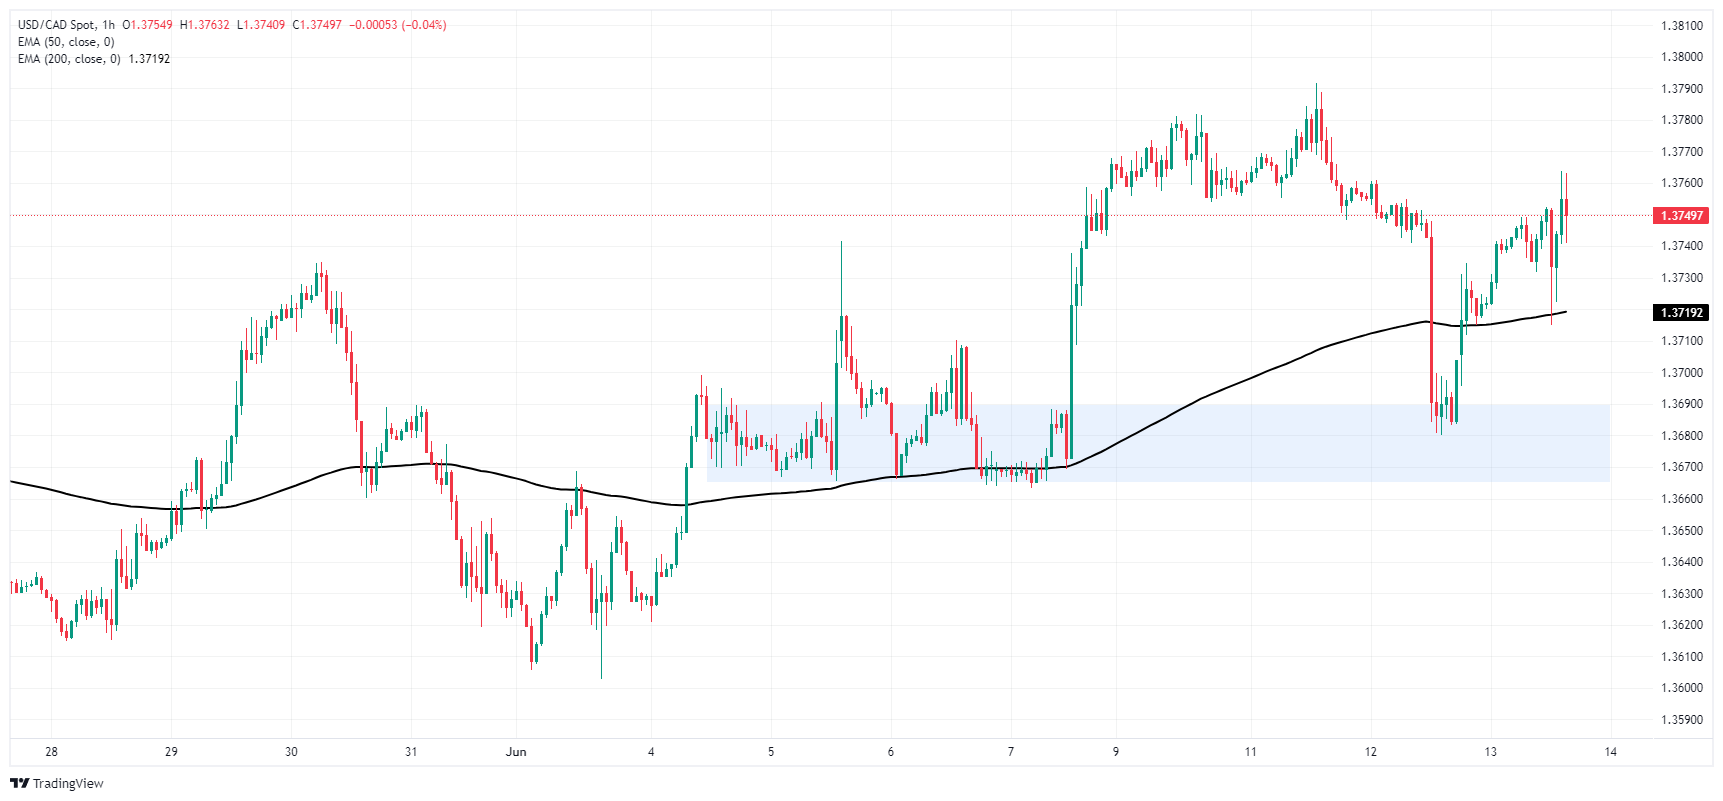
USD/CAD daily chart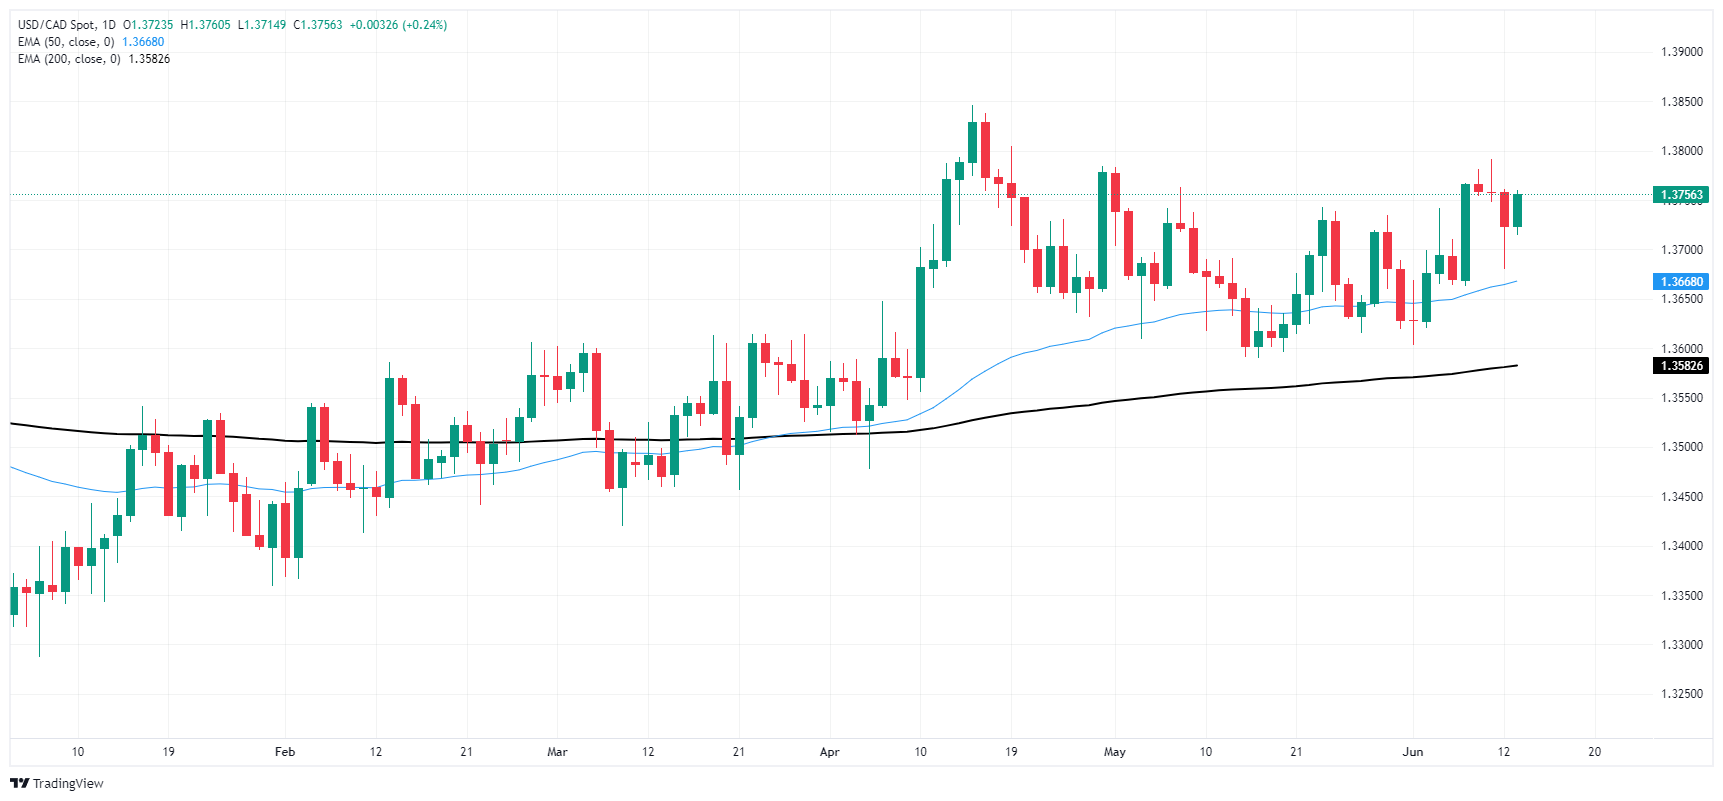
Canadian Dollar FAQs
The key factors driving the Canadian Dollar (CAD) are the level of interest rates set by the Bank of Canada (BoC), the price of Oil, Canada’s largest export, the health of its economy, inflation and the Trade Balance, which is the difference between the value of Canada’s exports versus its imports. Other factors include market sentiment – whether investors are taking on more risky assets (risk-on) or seeking safe-havens (risk-off) – with risk-on being CAD-positive. As its largest trading partner, the health of the US economy is also a key factor influencing the Canadian Dollar.
The Bank of Canada (BoC) has a significant influence on the Canadian Dollar by setting the level of interest rates that banks can lend to one another. This influences the level of interest rates for everyone. The main goal of the BoC is to maintain inflation at 1-3% by adjusting interest rates up or down. Relatively higher interest rates tend to be positive for the CAD. The Bank of Canada can also use quantitative easing and tightening to influence credit conditions, with the former CAD-negative and the latter CAD-positive.
The price of Oil is a key factor impacting the value of the Canadian Dollar. Petroleum is Canada’s biggest export, so Oil price tends to have an immediate impact on the CAD value. Generally, if Oil price rises CAD also goes up, as aggregate demand for the currency increases. The opposite is the case if the price of Oil falls. Higher Oil prices also tend to result in a greater likelihood of a positive Trade Balance, which is also supportive of the CAD.
While inflation had always traditionally been thought of as a negative factor for a currency since it lowers the value of money, the opposite has actually been the case in modern times with the relaxation of cross-border capital controls. Higher inflation tends to lead central banks to put up interest rates which attracts more capital inflows from global investors seeking a lucrative place to keep their money. This increases demand for the local currency, which in Canada’s case is the Canadian Dollar.
Macroeconomic data releases gauge the health of the economy and can have an impact on the Canadian Dollar. Indicators such as GDP, Manufacturing and Services PMIs, employment, and consumer sentiment surveys can all influence the direction of the CAD. A strong economy is good for the Canadian Dollar. Not only does it attract more foreign investment but it may encourage the Bank of Canada to put up interest rates, leading to a stronger currency. If economic data is weak, however, the CAD is likely to fall.
- DXY rallies further following Federal Reserve's decision, trades above 105.00.
- US releases soft PPI figures from May and higher weekly Initial Jobless Claims.
- US Treasury yields continue to move down and may limit the upside.
On Thursday, the US Dollar Index (DXY) continued its positive momentum, extending its recovery into Thursday's session above 105.00. This followed Wednesday's Federal Reserve (Fed) decision and as markets digested fresh Producer Price Index (PPI) figures from May and weekly Initial Jobless Claims, which showcased weaker than anticipated inflation and higher unemployment benefit requests.
The Fed kept its economic activity revisions unchanged while upgrading the Personal Consumption Expenditures (PCE) forecasts. The US economy is currently showcasing mixed signs with preliminary evidence indicating softening inflation but with a resilient labor market, which seems to have made Fed officials project fewer rate cuts in 2024.
Daily digest market movers: DXY reacts to Fed decision, PPI data
- Federal Open Market Committee (FOMC) dot plot update on Wednesday shows just one rate cut for 2024 as the median outcome, down from the three rate cut expectation last March by Fed Officials.
- This adjusted the market's expectations, which priced in between one or two cuts this year, indicating a longer timeline for potential rate cuts.
- Producer Price Index (PPI) for final demand rose 2.2% on a yearly basis in May, below the market expectation of 2.5%.
- Annual core PPI rose by 2.3%, also below market expectations.
- Weekly Jobless Claims showed 242K in the week ending June 8, higher than initial estimates of 225K and last week's print of 229K.
DXY technical analysis: Bulls maintain control and recover SMAs
Following Wednesday’s session, indicators recovered to stand in positive terrain. The Relative Strength Index (RSI) is now above 50 midline, and the Moving Average Convergence Divergence (MACD) is printing green bars. In addition, the Index is now trending above its 20, 100, and 200-day Simple Moving Averages (SMA). This extends the bullish outlook for the US Dollar, following Wednesday’s sharp decline.
US Dollar FAQs
The US Dollar (USD) is the official currency of the United States of America, and the ‘de facto’ currency of a significant number of other countries where it is found in circulation alongside local notes. It is the most heavily traded currency in the world, accounting for over 88% of all global foreign exchange turnover, or an average of $6.6 trillion in transactions per day, according to data from 2022. Following the second world war, the USD took over from the British Pound as the world’s reserve currency. For most of its history, the US Dollar was backed by Gold, until the Bretton Woods Agreement in 1971 when the Gold Standard went away.
The most important single factor impacting on the value of the US Dollar is monetary policy, which is shaped by the Federal Reserve (Fed). The Fed has two mandates: to achieve price stability (control inflation) and foster full employment. Its primary tool to achieve these two goals is by adjusting interest rates. When prices are rising too quickly and inflation is above the Fed’s 2% target, the Fed will raise rates, which helps the USD value. When inflation falls below 2% or the Unemployment Rate is too high, the Fed may lower interest rates, which weighs on the Greenback.
In extreme situations, the Federal Reserve can also print more Dollars and enact quantitative easing (QE). QE is the process by which the Fed substantially increases the flow of credit in a stuck financial system. It is a non-standard policy measure used when credit has dried up because banks will not lend to each other (out of the fear of counterparty default). It is a last resort when simply lowering interest rates is unlikely to achieve the necessary result. It was the Fed’s weapon of choice to combat the credit crunch that occurred during the Great Financial Crisis in 2008. It involves the Fed printing more Dollars and using them to buy US government bonds predominantly from financial institutions. QE usually leads to a weaker US Dollar.
Quantitative tightening (QT) is the reverse process whereby the Federal Reserve stops buying bonds from financial institutions and does not reinvest the principal from the bonds it holds maturing in new purchases. It is usually positive for the US Dollar.
- Banxico Governor Rodriguez Ceja attributes Peso volatility to external factors, not solely domestic political issues.
- USD/MXN surged from 16.91 to 18.99 after the June 2 election, with 10-year Mbono yield rising to 10.74%.
- Banxico may deploy a $30 billion hedging program to stabilize markets; USD/MXN currently retreats below 18.80, down 0.87%.
Bank of Mexico (Banxico) Governor Victoria Rodriguez Ceja commented on Wednesday that the central bank has the tools to intervene in the markets and restore market order after the Mexican Peso depreciated more than 9% following the June 2 election.
Banxico is ready to intervene following Peso's 9% depreciation post-election
Rodriguez Ceja said that volatility is mostly attributed to external factors and refrained from expressing that the USD/MXN exchange rate jumped due to Andres Manuel Lopez Obrador’s (AMLO) intentions to push a bill to make a judiciary reform and to reforms to disappear autonomous bodies, which bring certainty to investors.
She said volatility is due to “idiosyncratic factors” and global issues such as the Middle East war and the outlook for US interest rates.
After the elections, the USD/MXN rallied from 16.91 and hit a 14-month high of 18.99 on June 12. Additionally, the yield on the 10-year Mexican Bono (Mbono) jumped from 9.76% to 10.74% amid analysts’ comments on the lack of bids for Mexican debt.
Banxico Governor Rodriguez commented they could turn to a $30 billion hedging program aimed at stabilizing the markets and protecting banks from MXN losses, according to Bloomberg.
USD/MXN Reaction
On Thursday, the USD/MXN so far retreated below 18.80, with the emerging market appreciating some 0.87%. Still, upside risks remain unless the pair drops below the April 19 high of 18.15 after the Peso crashed to a new multi-month low.
Banxico FAQs
The Bank of Mexico, also known as Banxico, is the country’s central bank. Its mission is to preserve the value of Mexico’s currency, the Mexican Peso (MXN), and to set the monetary policy. To this end, its main objective is to maintain low and stable inflation within target levels – at or close to its target of 3%, the midpoint in a tolerance band of between 2% and 4%.
The main tool of the Banxico to guide monetary policy is by setting interest rates. When inflation is above target, the bank will attempt to tame it by raising rates, making it more expensive for households and businesses to borrow money and thus cooling the economy. Higher interest rates are generally positive for the Mexican Peso (MXN) as they lead to higher yields, making the country a more attractive place for investors. On the contrary, lower interest rates tend to weaken MXN. The rate differential with the USD, or how the Banxico is expected to set interest rates compared with the US Federal Reserve (Fed), is a key factor.
Banxico meets eight times a year, and its monetary policy is greatly influenced by decisions of the US Federal Reserve (Fed). Therefore, the central bank’s decision-making committee usually gathers a week after the Fed. In doing so, Banxico reacts and sometimes anticipates monetary policy measures set by the Federal Reserve. For example, after the Covid-19 pandemic, before the Fed raised rates, Banxico did it first in an attempt to diminish the chances of a substantial depreciation of the Mexican Peso (MXN) and to prevent capital outflows that could destabilize the country.
Bank of Canada (BoC) Deputy Governor Sharon Kozicki noted on Thursday that the BoC is set to end its quantitative easing program and that future applications of QE will have a very high bar to pass before accessing additional monetary policy mechanisms.
Key highlights
- Unwinding of quantitative easing through quantitative tightening has gone smoothly.
- If inflation continues to ease, it is reasonable to expect further rate cuts. We are taking our interest rate decisions one meeting at a time.
- The bar for us to use QE again is very high.
- The BoC expects to end quantitative tightening at some point in 2025.
Industrial metals prices slide down from the late May highs amid China’s lowering demand, TDS analysts note.
Future Federal Reserve rate cuts can provide a boost for metals
“Industrial metals continue to trade weaker as prices recalibrate from the late May highs. Weaker US data driving interest rates lower can provide a marginal boost, but Chinese growth concerns are the bigger factor.”
“With few signs of physical tightness, and increasing inventory levels across the globe, Copper remains at risk given macro traders have already built an extremely bloated long position. As traders begin to lose patience with the fundamental narrative, we have seen early signs of money managers unwinding their large long positions.”
“With that said, Commodity Trading Advisors (CTAs) remain comfortable with their length, but the margin of safety grows smaller with the first selling trigger now sitting at $9,715/t.”
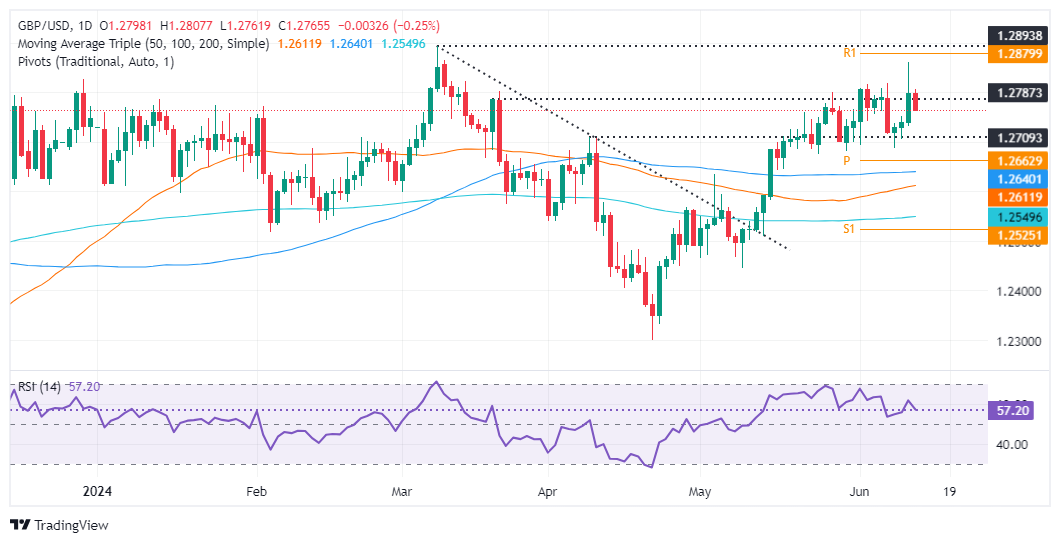
- GBP/USD snaps three days of gains, drops below 1.2800.
- The pair remains consolidated yet lacks the strength to rally towards the YTD high.
- Momentum favors sellers, but they must push GBP/USD below 1.2700.
The GBP/USD experienced a retreat early in the North American session, down by 0.23%. This was a continuation of a trend, as the major trades below 1.2800 at around 1.2769 were unable to achieve a daily close above 1.2800 for the ninth consecutive trading day.
GBP/USD Price Analysis: Technical outlook
Despite reaching a three-month high, the GBP/USD remains consolidated, with buyers unable to push the exchange rate above the 1.2800 figure to challenge the year-to-date (YTD) high of 1.2894.
Momentum has shifted, and sellers appear to gather traction, yet the Relative Strength Index (RSI) remains in bullish territory but is dropping towards the 50-midline. Once the RSI pierces the latter, that would be the green light to drive the GBP/USD lower.
Key support levels lie ahead, like the latest cycle low of 1.2687, the June 10 low. A breach of the latter will pave the way toward the confluence of the 100-day moving average (DMA) and the May 16 low of 1.2643 before challenging the 50-DMA at 1.2610.
GBP/USD Price Action – Daily Chart
- Silver posts another lower low as it continues its steady decline.
- The 50-day SMA, however, could provide an obstacle to further weakness.
- The RSI momentum indicator is converging bullishly with price.
Silver (XAG/USD) trades almost 2.0% lower on Thursday after the release of US factory-gate inflation data.
The precious metal has broken below $29.04 (June 11 low) and thereby posted a lower low at $28.85, the low of the day.
The sequence of lower lows and lower highs witnessed since the May highs suggests Silver is in a short-term downtrend, which given “the trend is your friend” is expected to extend.
Silver 4-hour Chart
A break below $28.85 (June 13 low) would confirm another lower low, continuing the bearish sequence.
There is a chance Silver could fall to an initial target at $28.21, the 0.618 Fibonacci ratio of the height of the range that unfolded in the second half of May, extrapolated lower. This is the usual method used by technical analysts for establishing targets after breakouts from ranges.
The 50-day Simple Moving Average (SMA) at $28.93, however, could provide a barrier to further downside.
That said, more bearishness could still see Silver reach as low as $27.19, the second target at the 100% extrapolation of the height of the range lower.
The Relative Strength Index (RSI) is showing bullish convergence with price since the June 4 low. Although price has gone on to make progressively lower lows, RSI has not. The non-correlation indicates a lack of bearish momentum and increases the risk of Silver making a pullback or a recovery.
It would take a close above $31.00 to bring the short-term downtrend into doubt. A move above the $31.55 lower high would suggest the possibility of a recovery to the range high at $32.51, and a reversal of the short-term trend too.
The latest Department of Energy (DOE) inventory statistics weighed on the crude Oil markets, but with that said, the energy complex has recovered from the post-OPEC+ sell-off, TD Securities analysts note.
Crude Oil market loses optimism
“The latest DOE inventory statistics, which showed larger inventory builds than expected, have sapped some of the recent optimism out of the crude oil market.”
“The energy complex has recovered nicely from the OPEC+ driven jolt lower. CTAs are now more likely buyers with uptrends reforming, and spreads have also shown major signs of recovery. Indeed, Commodity Trading Advisor (CTAs) may be back on the bid in WTI and Brent crude, if prices can reach north of $78.46/bbl and $82.77/bbl respectively.”
The Federal Reserve (Fed) appeared to have a hawkish tilt, but the details suggest otherwise, analysts at TD Securities suggest.
Most of the Fed officials look to ease later this year
"On the hawkish front the Fed penciled in only one cut for 2024, rather than the two the market was expecting. However, while the dots shifted higher across the 2024-25 policy horizon, the fed funds rate for 2026 sits at the same level that was projected in March when all is said and done (3.125%). The majority of Fed officials is looking for the start of the easing cycle later this year."
"Indeed, the FOMC appears to be only split around the number of cuts in 2024: 7 Fed officials penciled in one cut while 8 penciled in two cuts, the tiebreaker was the 4 Fed officials who are now looking for no cuts this year (up from only 2 in March)."
"Nonetheless, Gold (XAU/USD) markets gave back the early morning CPI gains, and will remain locked in on the data moving forward. On this front, this morning's PPI data also came in below expectations, which is once again providing a boost to the precious metals. With that said, Gold has eroded some margin of safety, with the first selling trigger now standing at $2,227/oz."
- AUD/USD finds cushion near 0.6650 after soft US PPI report for May boosts Fed rate-cut hopes for September.
- The Fed’s dot plot signaled only one rate cut this year.
- Australian Employment data for May beats estimates.
The AUD/USD pair finds support near 0.6650 in Thursday’s New York session. The Aussie asset bounces back as cooling United States consumer and producer inflation has prompted expectations of the Federal Reserve (Fed) to begin reducing interest rates from the September meeting.
The US PPI report for May showed that the monthly headline PPI contracted by 0.2% as gasoline prices slumped and the core reading was stagnant. Also, annual headline and core PPI decelerated to 2.2% and 2.3%, respectively, from their expectations.
The CME FedWatch tool shows that 30-day Fed Funds futures have priced in a 67.7% chance for rate cuts in September, up from 64.7% recorded on Wednesday. The tool also indicates that there will be two rate cuts this year against one projected in the Fed’s dot plot.
On Wednesday, the Fed’s dot plot showed that policymakers have scaled back projections for several rate cuts, one from their anticipated when they last met in March. Fed Chair Jerome Powell welcomed the soft inflation report but clarified that policymakers need more soft CPI reports to gain confidence that inflation is on course to return to the 2% target.
Meanwhile, market sentiment is positive regarding firm speculation about Fed rate cuts. The S&P 500 has opened slightly bullish. 10-year US Treasury yields have declined to 4.28%.
In Australia, stronger-than-expected Employment data for May has improved speculation that the Reserve Bank of Australia (RBA) will keep its Official Cash Rate (OCR) at its current levels for the entire year. In May, Australian employers hired 39.7K job-seekers, beating estimates of 30K and the prior release of 37.4K, downwardly revised from 38.5k. The Unemployment Rate declined to 4.0%, as expected, from 4.1% in April.
As expected, the Federal Reserve (Fed) kept monetary policy on hold again in its June meeting, reiterating that it will take longer to gain confidence that inflation is on its way back to 2%, says Rogier Quaedvlieg, Senior Economist at ABN AMRO.
Median number of cuts is reduced to a single one for 2024 in June
“The policy statement contained a minimal change, revising the ‘lack of further progress' on inflation to ‘modest progress (…),' following April PCE and May CPI inflation releases. A stronger revision was seen in the dot plot, which reduced the median number of cuts from three in March to a single one in June.”
“This meeting also saw the release of updated economic projections. Headline and core PCE inflation forecasts for 2024 rose to 2.8% for 2024, from 2.6% in March, and to 2.3% in 2025, from 2.2% in March. Median growth forecasts remain unchanged, while the unemployment rate in 2025 and 2026 was raised by 0.1 pp.”
“In the press conference, Fed's Chair Jerome Powell generally struck a more balanced tone compared to the relatively doveish performance in May. He reiterated the need for confidence that inflation will come down to 2%. Reflecting on inflation readings of this year, he noted that one has to be careful not to dismiss inflation readings one doesn't like, referring to the high readings in the first quarter.”
The US Dollar (USD) dropped a bit following the release of the softer-than-expected US CPI inflation report on Wednesday. At the same time, the report made the Japanese Yen (JPY) stronger against the USD for a short period of time, Rabobank analysts note.
Market sees little scope for a hawkish surprise from the BoJ
“The drop in the value of the USD following the release of the softer than expected US CPI inflation report yesterday provided the JPY with a short-lived reprieve vs. the USD. A few hours later the headline news from yesterday’s FOMC meeting was that the dot plots are now only pointing to 1 Fed rate cut this year. This lent the USD some support.”
“That said, for the most part Fed officials would have made their decisions on their policy outlooks before yesterday’s data release. This understanding dulled the impact of the dot plots. Despite this USD/JPY has returned to the levels traded before yesterday’s US data release, with the JPY being the worst performing G10 currency on a 1-day view.”
“The soft stance of the JPY suggests the market sees little scope for a hawkish surprise from the BoJ at tomorrow’s policy meeting. The market’s bearish outlook on the JPY is an ongoing problem for Japanese policy makers, though it may present an opportunity for Governor Ueda to attempt to wrongfoot the consensus.”
- Initial Jobless Claims rose by 242K vs. the previous week.
- Continuing Jobless Claims rose by more than 1.80M.
US citizens that applied for unemployment insurance benefits increased by 242K in the week ending June 8 according to the US Department of Labor (DoL) on Thursday. The prints surpassed initial estimates (225K) and the previous weekly gain of 229K (unrevised).
Further details of the publication revealed that the advance seasonally adjusted insured unemployment rate was 1.2% and the 4-week moving average was 227K, an increase of 4.75K from the previous week's unrevised average.
In addition, Continuing Claims increased by 30K to 1.820M in the week ended June 1.
Market reaction
The US Dollar Index (DXY) trades slightly on the positive tone around 104.80, reversing part of Wednesday’s sharp retracement in the wake of US CPI data and the FOMC event.
The Producer Price Index (PPI) for final demand in the US rose 2.2% on a yearly basis in May, the data published by the US Bureau of Labor Statistics showed on Thursday. This reading followed the 2.3% increase recorded in April (revised from 2.2%) and came in below the market expectation of 2.5%.
The annual core PPI rose 2.3% in the same period, coming in below April's increase and the market expectation of 2.4%. On a monthly basis, the PPI declined 0.2%, while the core PPI remained unchanged.
Market reaction to PPI inflation data
The US Dollar came under modest selling pressure with the immediate reaction and the US Dollar Index retreated to the 104.70 area from the daily high it set near 105.00.
US Dollar PRICE This week
The table below shows the percentage change of US Dollar (USD) against listed major currencies this week. US Dollar was the weakest against the New Zealand Dollar.
| USD | EUR | GBP | JPY | CAD | AUD | NZD | CHF | |
|---|---|---|---|---|---|---|---|---|
| USD | -0.01% | -0.56% | -0.05% | -0.27% | -1.21% | -1.30% | -0.32% | |
| EUR | 0.00% | -0.21% | 0.24% | -0.01% | -0.93% | -1.03% | -0.05% | |
| GBP | 0.56% | 0.21% | 0.58% | 0.20% | -0.72% | -0.84% | 0.15% | |
| JPY | 0.05% | -0.24% | -0.58% | -0.25% | -1.28% | -1.40% | -0.26% | |
| CAD | 0.27% | 0.00% | -0.20% | 0.25% | -0.91% | -1.04% | -0.05% | |
| AUD | 1.21% | 0.93% | 0.72% | 1.28% | 0.91% | -0.11% | 0.90% | |
| NZD | 1.30% | 1.03% | 0.84% | 1.40% | 1.04% | 0.11% | 1.00% | |
| CHF | 0.32% | 0.05% | -0.15% | 0.26% | 0.05% | -0.90% | -1.00% |
The heat map shows percentage changes of major currencies against each other. The base currency is picked from the left column, while the quote currency is picked from the top row. For example, if you pick the US Dollar from the left column and move along the horizontal line to the Japanese Yen, the percentage change displayed in the box will represent USD (base)/JPY (quote).
Economic Indicator
Producer Price Index (YoY)
The Producer Price Index released by the Bureau of Labor statistics, Department of Labor measures the average changes in prices in primary markets of the US by producers of commodities in all states of processing. Changes in the PPI are widely followed as an indicator of commodity inflation. Generally speaking, a high reading is seen as positive (or bullish) for the USD, whereas a low reading is seen as negative (or bearish).
Read more.Next release: Fri Jul 12, 2024 12:30
Frequency: Monthly
Consensus: -
Previous: -
Source: US Bureau of Labor Statistics
US Treasury Secretary Janet Yellen said on Thursday that a significant share of remaining inflation represents housing costs returning to normal slowly, per Reuters.
Key takeaways
"We are creating jobs at a very rapid pace."
"Unemployment rate has drifted up a little bit, the labor market has become a little less hot, a little more normal."
"Labor market is now resembling pre-pandemic."
"Wages are not a threat to contribute to inflation."
"Substantial lock-in effect is limiting supply of homes on the market."
Market reaction
The US Dollar Index showed no reaction to these comments and was last seen gaining 0.25% on the day at 104.95.
- Gold trades marginally lower on Thursday after the Federal Reserve’s more-sober-than-expected policy assessment.
- Gold spiked higher following cooler US inflation data on Wednesday, however, it pulled back after the Fed meeting.
- XAU/USD might have formed a bearish Head-and-Shoulders pattern on the daily chart.
Gold (XAU/USD) trades marginally lower in familiar territory in the $2,310s on Thursday, after some volatile whipsaws. The yellow metal remains broadly stuck in the range between $2,270 and $2,450, the parameters of which were pegged out in April and early May.
Gold has steadied after its spike higher on Wednesday due to the release of less-inflationary US data, which recalibrated near-term interest-rate expectations lower, benefiting Gold.
A more sober assessment by the US Federal Reserve (Fed) after their meeting later on Wednesday, however, stopped bulls in their tracks, after Fed Chair Jerome Powell advocated a cautious data-dependent approach to interest rates going forward.
Gold volatile on snap revisions to interest-rate outlook
Gold shot higher in the minutes following the release of US Consumer Price Index (CPI) data for May on Wednesday.
Headline CPI showed prices steadied month-over-month in May from the 0.3% increase in April, and edged up by 3.3% year-over-year compared to 3.4% previously. The readings were below economists's expectations of 0.1% MoM and 3.4% YoY.
CPI ex Food & Energy showed prices rose 0.2% MoM from 0.3% in April and 3.4% YoY from 3.6% previously. This was also below expectations of 0.3% and 3.5%, respectively.
The cooler-than-expected CPI data led to a sell-off in the US Dollar (USD) which is negatively correlated to Gold.
Gold price itself rose over half a percent to a peak of $2,342 after the release. Lower inflation suggests interest rates are more likely to fall, which in turn reduces the opportunity cost of holding Gold, making it more attractive to investors.
The data provided a counterweight to US Nonfarm Payrolls (NFP) data on Friday, which reflected a buoyant labor market and rising wages in the US. These were expected to put upside pressure on inflation.
Fed pours cold water on rate cut hopes
Market optimism at the possibility of lower interest rates, however, was quickly curtailed by a more sober assessment from those that are responsible for setting interest rates, the officials of the US Federal Reserve.
The Fed did not see fit to alter interest rates at their June meeting on Wednesday, as expected. However, they did radically dial down projections of future rate cuts in their attached Summary of Economic Projections (SEP), or dot-plot. This showed Fed officials now on average project only one 0.25% reduction in 2024, compared to three 0.25% cuts in the previous March SEP.
“The revised Summary of Economic Projections, the so called dot-plot published alongside the policy statement, showed that 4 of 19 officials saw no rate cuts in 2024, 7 projected a 25 basis points (bps) rate reduction, while 8 marked down a 50 bps cut in the policy rate,” says Eren Sengezer, Lead Analyst at FXStreet.
Gold retreated on the news, pulling back down to close the day at $2,325.
Traders of the precious metal now await US Producer Price Index data, or “factory gate prices” at 12:30 GMT on Thursday for more intelligence regarding the outlook for inflation and interest rates.
Technical Analysis: Gold potentially forming Head-and-Shoulders
Gold is potentially forming a bearish Head-and-Shoulders (H&S) price pattern. These patterns generally occur at market tops and signal a change of trend. If the H&S is valid it may be an indication that the medium-term bull trend is reversing.
XAU/USD Daily Chart
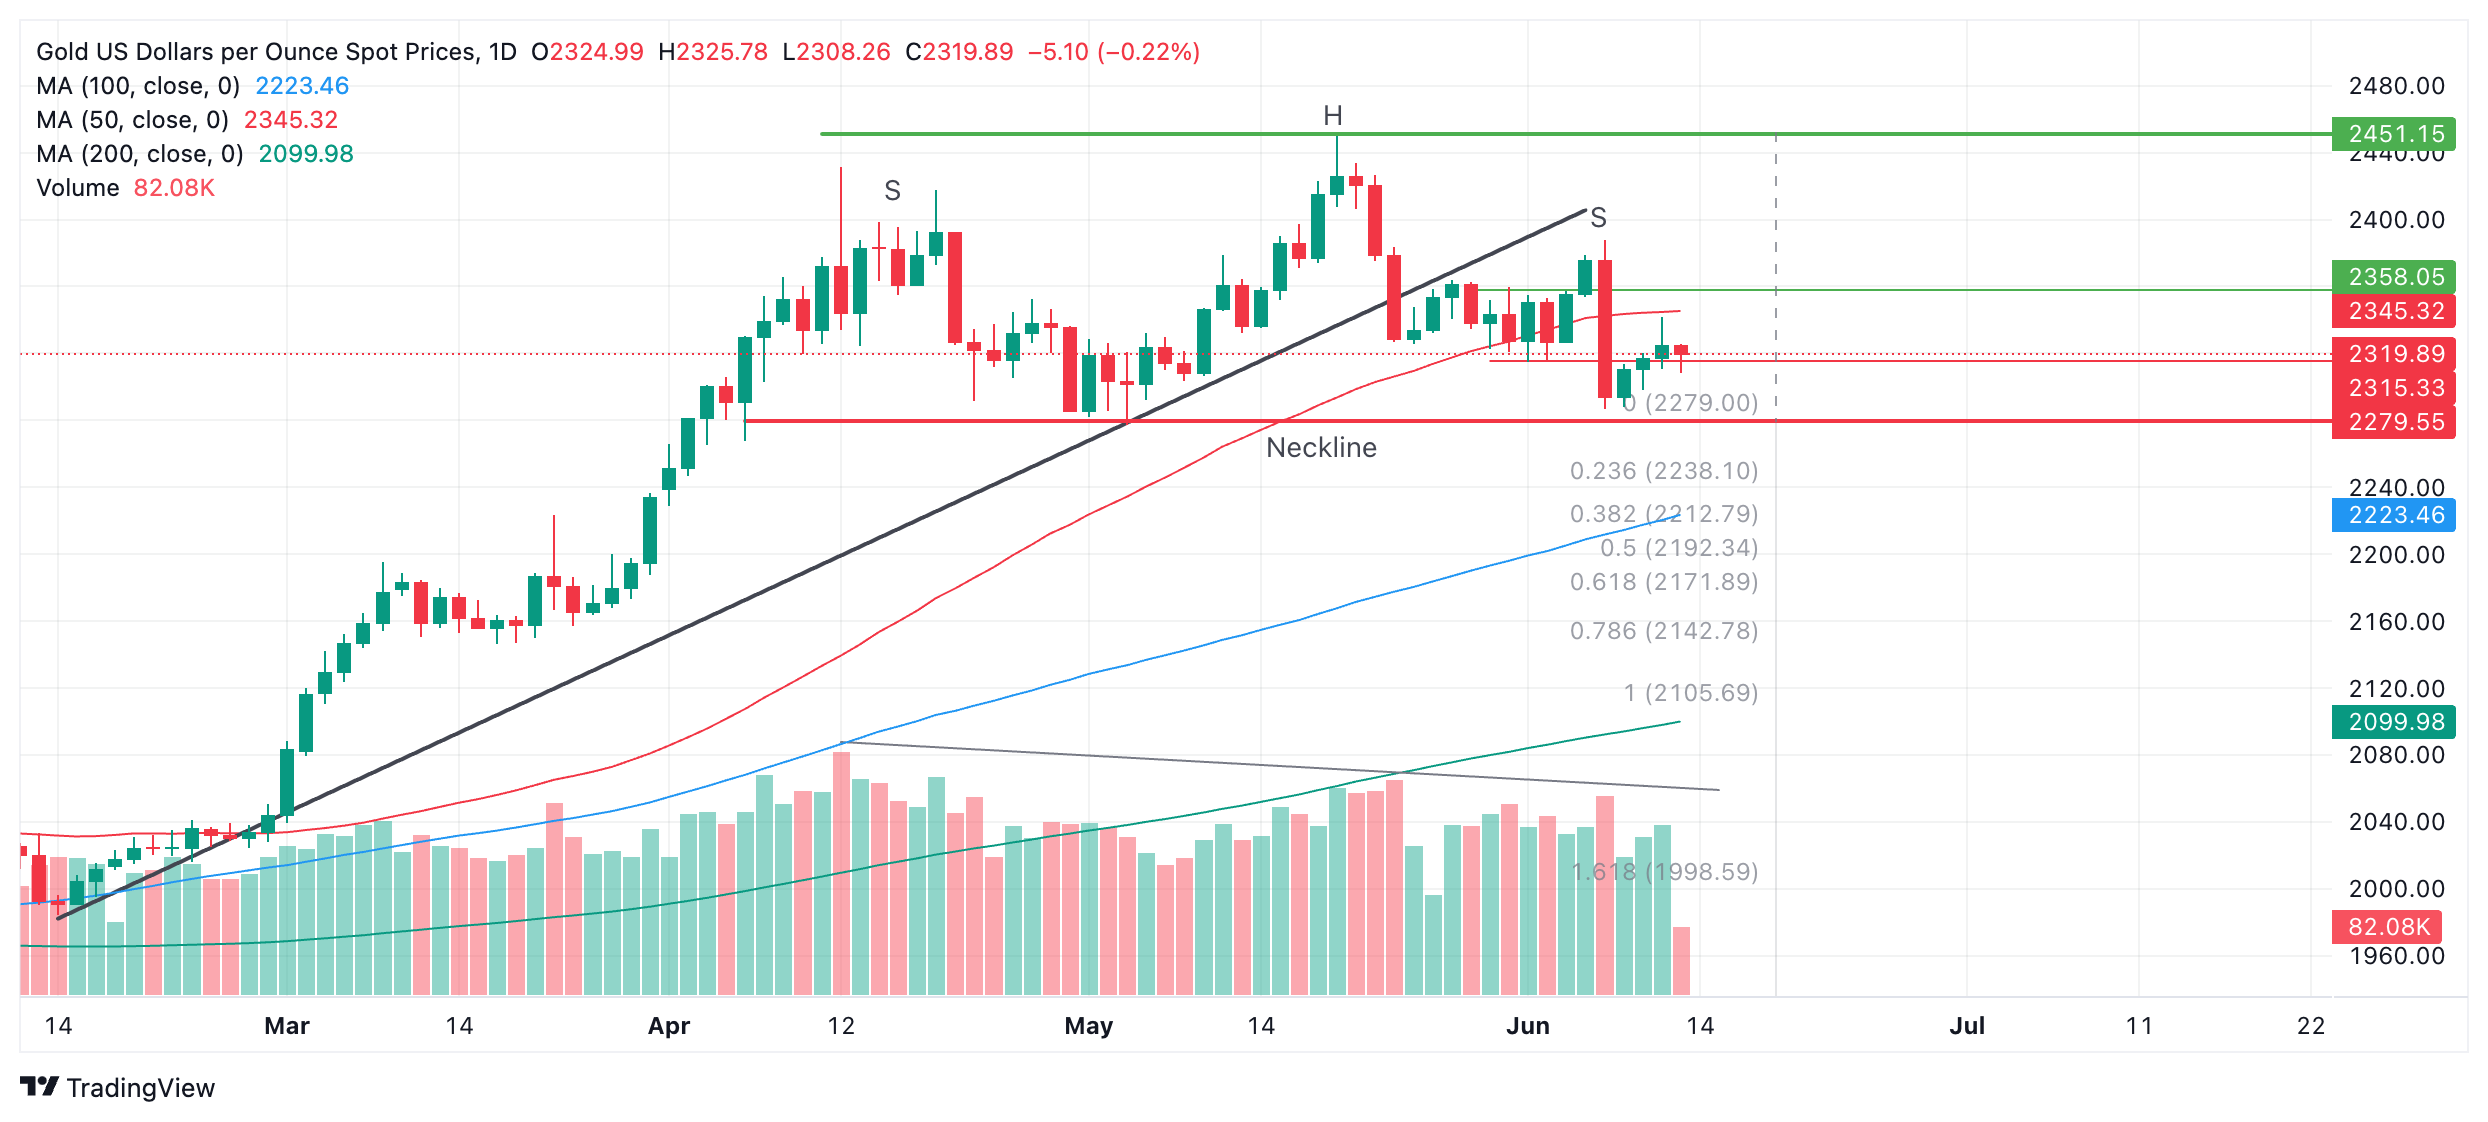
The H&S pattern began forming in April and has now completed a left and right shoulder (labeled “S”) and a “head” (labeled “H”). The so-called “neckline” of the pattern appears to be at the $2,279 support level (red line).
Declining trade volume during its development corroborates the pattern.
A decisive break below the neckline would validate the H&S pattern and activate downside targets. The first, more conservative, target would be $2,171, calculated by taking the 0.618 Fibonacci ratio of the height of the pattern and extrapolating it lower from the neckline. The second target would be at $2,106, the full height of the pattern extrapolated lower.
A break above $2,345, however, would bring the H&S into doubt and could signal a continuation higher, to an initial target at the $2,450 peak.
Economic Indicator
Fed Interest Rate Decision
The Federal Reserve (Fed) deliberates on monetary policy and makes a decision on interest rates at eight pre-scheduled meetings per year. It has two mandates: to keep inflation at 2%, and to maintain full employment. Its main tool for achieving this is by setting interest rates – both at which it lends to banks and banks lend to each other. If it decides to hike rates, the US Dollar (USD) tends to strengthen as it attracts more foreign capital inflows. If it cuts rates, it tends to weaken the USD as capital drains out to countries offering higher returns. If rates are left unchanged, attention turns to the tone of the Federal Open Market Committee (FOMC) statement, and whether it is hawkish (expectant of higher future interest rates), or dovish (expectant of lower future rates).
Read more.Last release: Wed Jun 12, 2024 18:00
Frequency: Irregular
Actual: 5.5%
Consensus: 5.5%
Previous: 5.5%
Source: Federal Reserve
- Natural Gas recovers slightly from Wednesday’s decline, which was prompted by the Federal Reserve decision.
- German utility company Uniper terminates Gas supply contracts with Russia’s Gazprom after a court ruling.
- The US Dollar Index trades sideways after a very volatile session on Wednesday.
Natural Gas price (XNG/USD) recovers slightly on Thursday close to the pivotal technical support at $3.08 after declining on Wednesday, when US Federal Reserve (Fed) Chairman Jerome Powell left the markets hung out to dry. With only one interest-rate cut projected in the dot plot for the remainder of the year and Powell unwilling to divert from the “data dependent” stance, markets did not see much reason to be enthusiastic about it all. This sour mood sent Natural Gas prices lower as traders priced in less demand over the summer horizon given the elevated rates in the US.
Meanwhile, the US Dollar Index (DXY), which tracks the Greenback’s value against six major currencies, traded very volatile on Wednesday. First, the US inflation report led to a substantial depreciation as it showed price pressures are cooling.. However, the weakness was largely pared back by the Fed meeting, which dampened hopes that this inflation report would be enough to get a firm commitment to an initial rate cut. The Fed has set up the Greenback to weaken further in summer, although this will largely depend on how economic data comes in.
Natural Gas is trading at $3.11 per MMBtu at the time of writing.
Natural Gas news and market movers: Headlines tell a whole other story
- Supply issues in Australia persist, with the Wheatstone offshore plant from Chevron still fully shut down. Repairs will take longer than expected, Reuters reports.
- A court ruling rewarded German company Uniper SE more than $14.1 billion in damages for undelivered Gas from Russia. This court ruling could result in a cut in supply for other European countries that are still very much dependent on Russian Gas flows, Bloomberg reports.
- US Venture Global LNG Inc. has signed a non-binding deal with a Ukrainian energy trading company to supply US Liquified Natural Gas (LNG) to the Ukrainian storages.
Natural Gas Technical Analysis: Hold for now
From a technical perspective, price action on Wednesday led to a firm test on support. With Fed Chairman Powell slamming the door on two quick rate cuts, Gas prices briefly crashed below the pivotal level at $3.08, but managed to close the day above it. The question now is how quickly markets will be able to shrug off this hawkish tilt from the Fed. Meanwhile, the increasing uncertainty over European Gas supplies should keep Gas prices supported.
The pivotal level near $3.07 (the high from March 6, 2023) remains key as prices on Wednesday closed above it by just a few cents. Looking up, the red descending trendline at $3.12 would likely slam down any attempts to jump higher. Further up, the fresh year-to-date high at $3.16 is the level to beat.
On the downside, the 200-day Simple Moving Average (SMA) acts as the first support near $2.53. Should that support area fail to hold, the next target could be the pivotal level near $2.14, with interim support by the 55-day SMA near $2.34. Further down, the biggest support comes at $2.11 with the 100-day SMA.
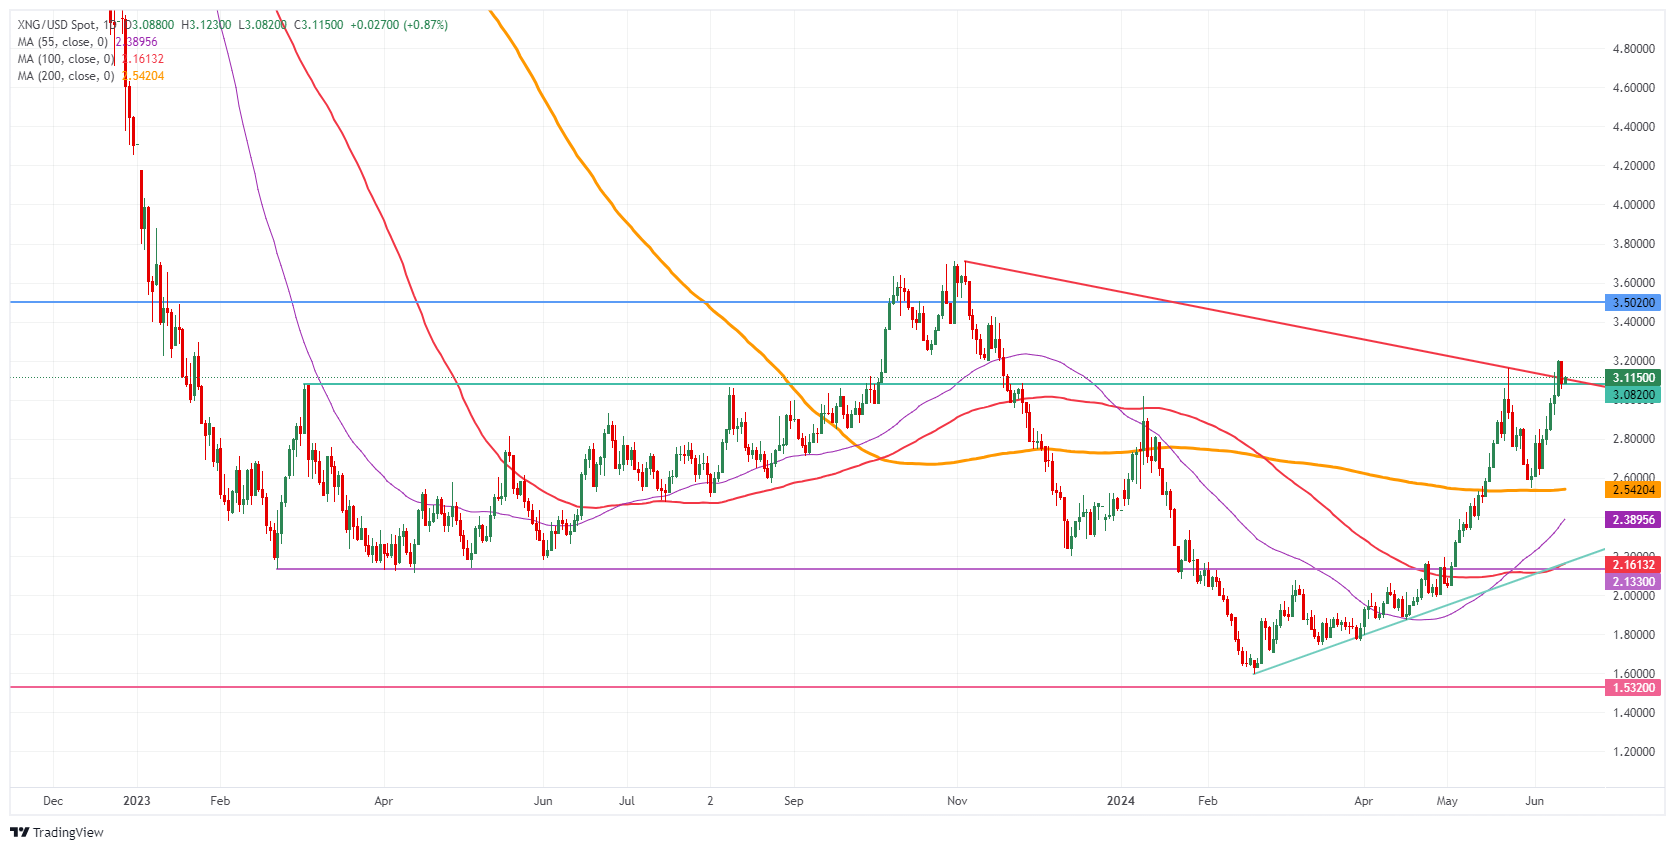
Natural Gas: Daily Chart
Natural Gas FAQs
Supply and demand dynamics are a key factor influencing Natural Gas prices, and are themselves influenced by global economic growth, industrial activity, population growth, production levels, and inventories. The weather impacts Natural Gas prices because more Gas is used during cold winters and hot summers for heating and cooling. Competition from other energy sources impacts prices as consumers may switch to cheaper sources. Geopolitical events are factors as exemplified by the war in Ukraine. Government policies relating to extraction, transportation, and environmental issues also impact prices.
The main economic release influencing Natural Gas prices is the weekly inventory bulletin from the Energy Information Administration (EIA), a US government agency that produces US gas market data. The EIA Gas bulletin usually comes out on Thursday at 14:30 GMT, a day after the EIA publishes its weekly Oil bulletin. Economic data from large consumers of Natural Gas can impact supply and demand, the largest of which include China, Germany and Japan. Natural Gas is primarily priced and traded in US Dollars, thus economic releases impacting the US Dollar are also factors.
The US Dollar is the world’s reserve currency and most commodities, including Natural Gas are priced and traded on international markets in US Dollars. As such, the value of the US Dollar is a factor in the price of Natural Gas, because if the Dollar strengthens it means less Dollars are required to buy the same volume of Gas (the price falls), and vice versa if USD strengthens.
- USD/CHF recovers further to 0.8955 as the Fed maintains a hawkish narrative on the interest rate outlook.
- Investors await the US PPI to get more cues for more guidance.
- Weak Swiss produce inflation boosts SNB’s subsequent rate-cut bets.
The USD/CHF pair edges higher to 0.8955 in Thursday’s European session. The Swiss Franc asset holds the strong recovery move of Wednesday as the US Dollar (USD) rises amid expectations that the Federal Reserve (Fed) will not reduce interest rates more than once this year.
The US Dollar Index (DXY) extends recovery to 104.80 after the Fed signaled only one rate cut this year against three anticipated when policymakers last met in March. The Fed maintained a “higher for longer” interest rate narrative despite acknowledging that soft May report is encouraging. However, Fed Chair Jerome Powell cleared that policymakers need more good inflation data for months to build confidence before considering rate cuts.
Going forward, investors will focus on the US Producer Price Index (PPI) report for May, which will be published at 12:30 GMT. The PPI report will indicate the change in prices of goods and services done at the factory gates.
Meanwhile, the Swiss Franc weakens after weak Producer and Import Prices for May. On a month-on-month basis, producer inflation unexpectedly contracted by 0.3%, while investors forecasted it to rise by 0.5%. Annual PPI contracted at a steady pace of 1.8%, which would boost expectations of subsequent rate cuts by the Swiss National Bank (SNB) in June’s policy meeting.
USD/CHF continues to take support near the 38.2% Fibonacci retracement support at 0.8885, plotted from 28 December 2023 low at 0.8333 to May 1 high at 0.9225. Earlier, the Swiss Franc asset weakened after breaking below the horizontal support marked from March 28 low near 0.9000, which has become a major resistance for the US Dollar bulls.
The major's long-term trend is uncertain as it hovers near the 200-day Exponential Moving Averages (EMAs), which trade around 0.8950.
The 14-period Relative Strength Index (RSI) shifts into the bearish range of 20.00-60.00 from the bullish range of 40.00-80.00, indicating a bearish reversal.
Going forward, more recovery above the psychological resistance of 0.9000 will drive the asset towards June 3 high at 0.9036, followed by May 28 low at 0.9086.
On the flip side, the asset would expose to March 21 low at 0.8840 and the round-level support of 0.8800 will open if the asset breaks below June 4 low of 0.8900.
USD/CHF daily chart
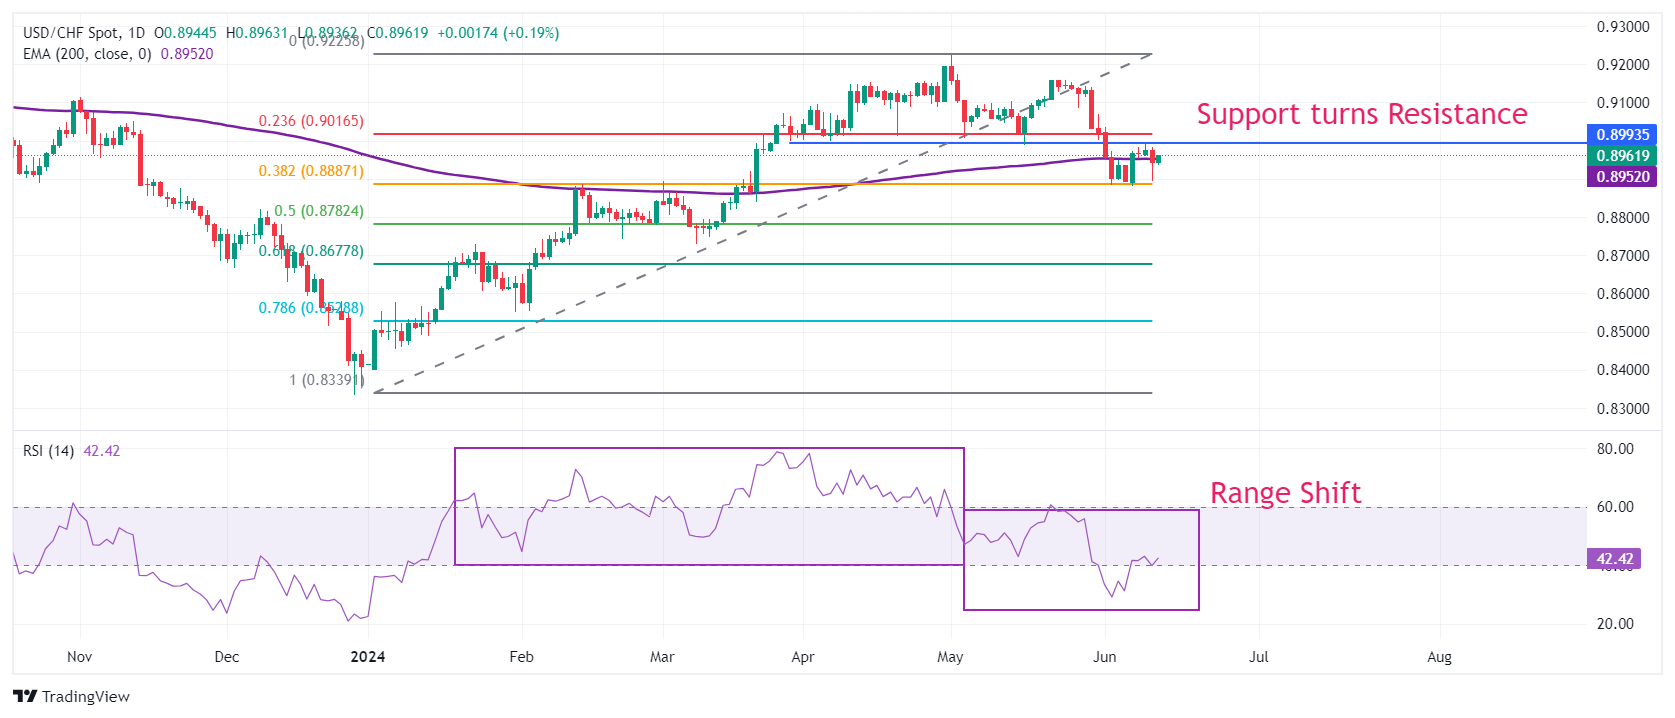
- The US Dollar trades flat, looking for direction after the Federal Reserve decision.
- Powell kept his cards close to his chest, not committing to any path for interest rates.
- The US Dollar index trades in the middle of a 30-day range between 104.00 and 105.50.
The US Dollar (USD) trades overall in the green against most peers on Thursday, posting only slight gains, making the US Dollar Index (DXY) trade in a very narrow range. The devaluation of the Greenback seen on Wednesday after the disinflationary Consumer Price Index (CPI) numbers got partially erased by the US Federal Reserve (Fed) rate decision and its dot plot. Federal Open Market Committee (FOMC) members only see reason for one rate cut in 2024, and four in 2025, while markets were expecting two rate cuts for this year.
Fed Chairman Powell left markets rather clueless as he didn’t commit to any path for interest rates.. This means markets are likely to respond to upcoming data, and with the Producer Price Index (PPI) numbers on the docket, together with the weekly Jobless Claims, any soft number will be enough to trigger US Dollar easing. Similarly, upbeat economic data points will move the needle in favour of a stronger Greenback, making it a bumpy ride until that possible first interest-rate cut in September.
Daily digest market movers: Focus returns to data
- At 12:30 GMT, the weekly Jobless Claims and the Producer Price Index numbers will be released:
- Weekly jobless claims for the last week of May:
- Initial claims are expected to subside a little to 225,000 from 229,000.
- Continuing Jobless Claims should pick up to 1.800 million from 1.792 million.
- May’s Producer Price Index numbers:
- Monthly headline PPI is seen advancing by a marginal 0.1%, easing from the 0.5% increase seen in April. On year, headline PPI is seen rising to 2.5% from 2.2% .
- Monthly core PPI should ease as well to 0.3% from 0.5%. Yearly core PPI should remain stable at 2.4%.
- Weekly jobless claims for the last week of May:
- Federal Reserve Bank of New York President John Williams will be the first Fed speaker to come out of the blackout period that takes place during a Fed rate decision. Williams will participate in a moderated discussion at around 16:00 GMT with US Treasury Secretary Janet Yellen at the Economic Club of New York.
- Equities do not like to be left behind clueless by the Fed, with both Asian and European indexes trading in the red. US futures are up though, with a small exception for the Dow Jones Industrial Index.
- The CME FedWatch Tool shows a 38.5% chance of Fed interest rate at the current level in September. Odds for a 25-basis-points rate cut stand at 56.7%, while a very slim 4.8% chance is priced in for a 50-basis-points rate cut.
- The benchmark 10-year US Treasury Note slides to the lowest level for this month, near 4.31%.
US Dollar Index Technical Analysis: Nobody knows
The US Dollar Index (DXY) faces the consequences of an eventful Wednesday that brought a disinflationary inflation report and a Fed rate decision that clouded the outlook. With the Fed not committing to any plan ahead, any softer data point this summer will contribute to a further easing for the Greenback. In case US data keeps easing, a weaker USD can be expected in the next few months.
On the upside, no big changes to the levels traders need to watch out for. The first is 105.52, a level that held during most of April. The next level to watch is 105.88, which triggered a rejection at the start of May and will likely play its role as resistance again. Further up, the biggest challenge remains at 106.51, the year-to-date high from April 16.
On the downside, the trifecta of Simple Moving Averages (SMA) is still playing support. First, and very close, is the 55-day SMA at 105.07. A touch lower, near 104.48, both the 100-day and the 200-day SMA are forming a double layer of protection to support any declines. Should this area be broken, look for 104.00 to salvage the situation.
US Dollar FAQs
The US Dollar (USD) is the official currency of the United States of America, and the ‘de facto’ currency of a significant number of other countries where it is found in circulation alongside local notes. It is the most heavily traded currency in the world, accounting for over 88% of all global foreign exchange turnover, or an average of $6.6 trillion in transactions per day, according to data from 2022. Following the second world war, the USD took over from the British Pound as the world’s reserve currency. For most of its history, the US Dollar was backed by Gold, until the Bretton Woods Agreement in 1971 when the Gold Standard went away.
The most important single factor impacting on the value of the US Dollar is monetary policy, which is shaped by the Federal Reserve (Fed). The Fed has two mandates: to achieve price stability (control inflation) and foster full employment. Its primary tool to achieve these two goals is by adjusting interest rates. When prices are rising too quickly and inflation is above the Fed’s 2% target, the Fed will raise rates, which helps the USD value. When inflation falls below 2% or the Unemployment Rate is too high, the Fed may lower interest rates, which weighs on the Greenback.
In extreme situations, the Federal Reserve can also print more Dollars and enact quantitative easing (QE). QE is the process by which the Fed substantially increases the flow of credit in a stuck financial system. It is a non-standard policy measure used when credit has dried up because banks will not lend to each other (out of the fear of counterparty default). It is a last resort when simply lowering interest rates is unlikely to achieve the necessary result. It was the Fed’s weapon of choice to combat the credit crunch that occurred during the Great Financial Crisis in 2008. It involves the Fed printing more Dollars and using them to buy US government bonds predominantly from financial institutions. QE usually leads to a weaker US Dollar.
Quantitative tightening (QT) is the reverse process whereby the Federal Reserve stops buying bonds from financial institutions and does not reinvest the principal from the bonds it holds maturing in new purchases. It is usually positive for the US Dollar.
- EUR/USD trades sideways as investors look for fresh cues for Fed rate-cut timing.
- Fed Chairman Powell said May’s soft CPI report is encouraging but insufficient to build confidence for rate cuts.
- ECB policymakers see a bumpy path towards the 2% inflation target.
EUR/USD trades in a tight range near the round-level figure of 1.0800 in Thursday’s European session. The major currency pair turns quiet after a bullish Wednesday, when the shared currency pair rallied to 1.0850 from an almost six-week low of 1.0720 after the United States (US) Consumer Price Index (CPI) data for May was cooler than expected, weighing heavily on the US Dollar (USD).
Later on Wednesday, however, EUR/USD pared gains after the Federal Reserve’s (Fed) monetary policy meeting. The Fed kept interest rates unchanged in the range of 5.25%-5.50% for the seventh straight time, as expected, and policymakers projected fewer rate cuts for this year than they expected three months ago.
Specifically, the Fed’s dot plot indicated that policymakers see only one rate cut this year against the three forecasted in March. Fed officials scaled back the number of rate cuts due to the strong labor market and stubbornly higher inflation in the January-March period. Also, they revised the year-end forecast for the core Personal Consumption Expenditures Price Index (PCE), which is the Fed’s preferred inflation measure, higher to 2.8% from March’s estimate of 2.6%.
In the press conference, Fed Chair Jerome Powell said the May’s CPI report is encouraging but also that policymakers want to see more good data to gain confidence before turning to policy normalization. Fed Powell didn’t provide any cues about Fed rate-cut timing and advocated for maintaining the current interest rate framework for a longer period. Powell added that “unexpected easing” in the labor market could force policymakers to address rate cuts early, but also that the employment outlook appears to be firm.
Before the Fed announcements, the CPI report showed that US inflation cooled in May. On the month, headline inflation steadied, and the core reading grew by 0.2%, less the estimated 0.3%. On the year, headline and core CPI decelerated to 3.3% and 3.4%, respectively.
Daily digest market movers: EUR/USD trades sideways amid EU election uncertainty
- Investors look for fresh cues about the French election outcome. Polls show that Marine Le Pen's far-right National Rally has presented a strong claim for parliamentary elections but it is slightly short of having an absolute majority. Meanwhile, French Finance Minister Bruno Le Maire said that if RN gains power and goes ahead with its program, “a debt crisis is possible in France," Reuters reported.
- On the monetary policy front, European Central Bank’s (ECB) policymakers have refused to commit to any specific rate-cut trajectory. Conversely, ECB officials have cautioned about inflation remaining persistent due to stubborn price growth in the services sector, which is mainly driven by wage growth.
- This week, ECB President Christine Lagarde said in an interview that last week’s rate-cut move doesn’t commit any linear declining path. "There might be periods where we hold rates again,” she added, according to Reuters.
- In Thursday’s session, the major currency pair will be guided by the US Producer Price Index (PPI) data for May, which will be published at 12:30 GMT. Annual headline PPI is estimated to have accelerated to 2.5% from 2.2% in April, with core reading growing steadily by 2.4%. Stubborn PPI data would diminish market expectations for Fed rate cuts in the September meeting, while soft figures will boost them.
Technical Analysis: EUR/USD hovers around 1.0800
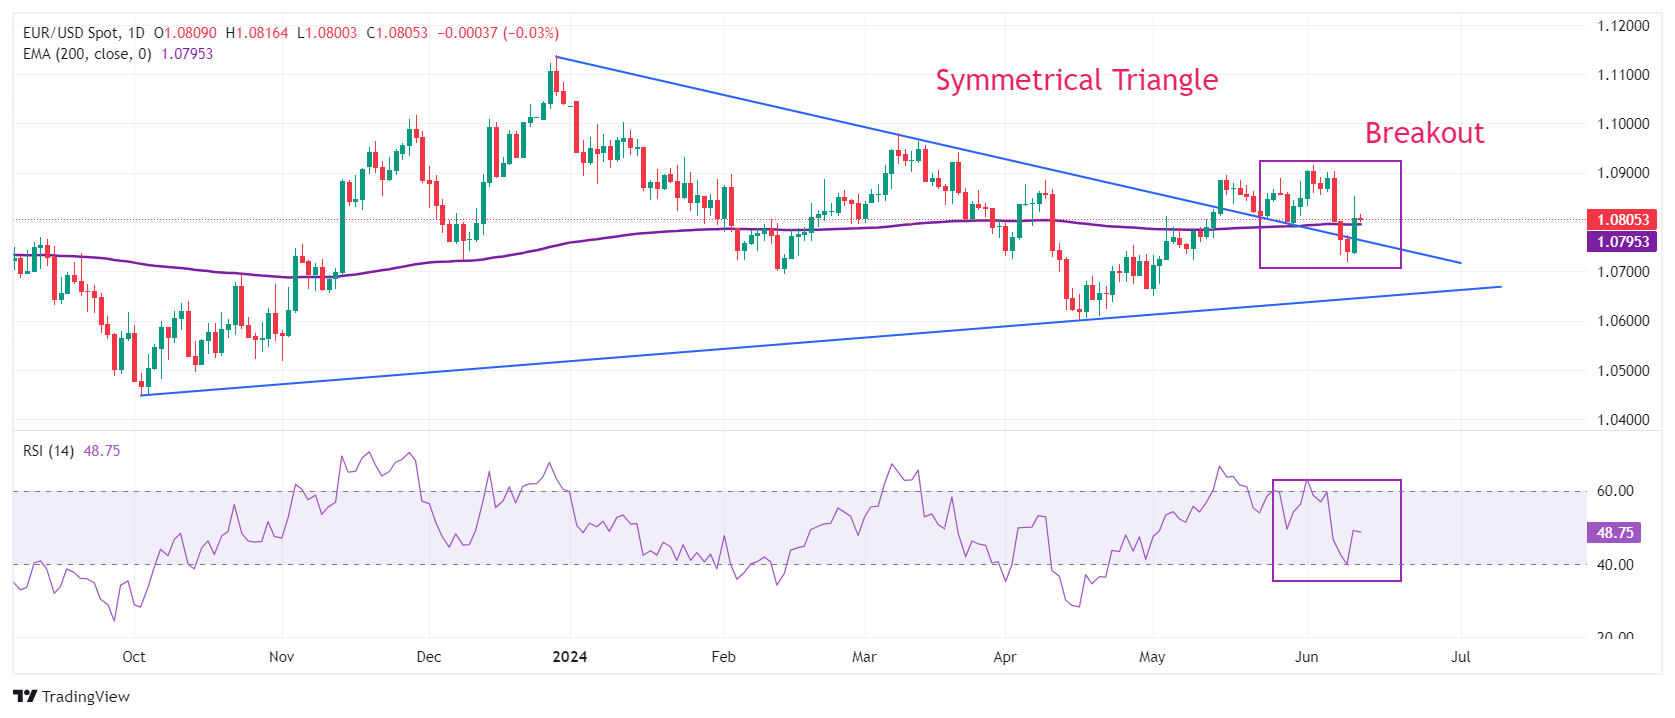
EUR/USD recovers swiftly after sliding to an almost five-week low near 1.0710. The near-term outlook of the major currency pair improves as it breaks above the Symmetrical Triangle chart formation on the daily time frame. The shared currency pair aims for a two-month high near 1.0900.
The long-term outlook of the shared currency pair remains uncertain as it hovers near the 200-day Exponential Moving Average (EMA), which trades around 1.0800.
The 14-period Relative Strength Index (RSI) finds a cushion near 40.00 and is expected to oscillate in the 40.00-60.00 range, which indicates that the current consolidation could persist.
Euro FAQs
The Euro is the currency for the 20 European Union countries that belong to the Eurozone. It is the second most heavily traded currency in the world behind the US Dollar. In 2022, it accounted for 31% of all foreign exchange transactions, with an average daily turnover of over $2.2 trillion a day. EUR/USD is the most heavily traded currency pair in the world, accounting for an estimated 30% off all transactions, followed by EUR/JPY (4%), EUR/GBP (3%) and EUR/AUD (2%).
The European Central Bank (ECB) in Frankfurt, Germany, is the reserve bank for the Eurozone. The ECB sets interest rates and manages monetary policy. The ECB’s primary mandate is to maintain price stability, which means either controlling inflation or stimulating growth. Its primary tool is the raising or lowering of interest rates. Relatively high interest rates – or the expectation of higher rates – will usually benefit the Euro and vice versa. The ECB Governing Council makes monetary policy decisions at meetings held eight times a year. Decisions are made by heads of the Eurozone national banks and six permanent members, including the President of the ECB, Christine Lagarde.
Eurozone inflation data, measured by the Harmonized Index of Consumer Prices (HICP), is an important econometric for the Euro. If inflation rises more than expected, especially if above the ECB’s 2% target, it obliges the ECB to raise interest rates to bring it back under control. Relatively high interest rates compared to its counterparts will usually benefit the Euro, as it makes the region more attractive as a place for global investors to park their money.
Data releases gauge the health of the economy and can impact on the Euro. Indicators such as GDP, Manufacturing and Services PMIs, employment, and consumer sentiment surveys can all influence the direction of the single currency. A strong economy is good for the Euro. Not only does it attract more foreign investment but it may encourage the ECB to put up interest rates, which will directly strengthen the Euro. Otherwise, if economic data is weak, the Euro is likely to fall. Economic data for the four largest economies in the euro area (Germany, France, Italy and Spain) are especially significant, as they account for 75% of the Eurozone’s economy.
Another significant data release for the Euro is the Trade Balance. This indicator measures the difference between what a country earns from its exports and what it spends on imports over a given period. If a country produces highly sought after exports then its currency will gain in value purely from the extra demand created from foreign buyers seeking to purchase these goods. Therefore, a positive net Trade Balance strengthens a currency and vice versa for a negative balance.
- The Mexican Peso bottoms out after falling to 18-month lows midweek.
- President Obrador hits back at critics and speculators, defending his judicial reforms.
- USD/MXN pulls back from 18.99 peak but continues trading with a bullish tone.
The Mexican Peso (MXN) seesaws between tepid gains and losses on Thursday after bottoming out at an 18-month low due to politically-inspired market jitters.
Traders are selling the Peso on concerns about the impact of a controversial package of reforms the newly elected left-leaning coalition government, Sigamos Haciendo Historia (SHH), is seeking to pass and enshrine in the constitution.
The proposal to reform the judiciary is making markets particularly anxious apparently because it would see judges elected by popular vote rather than appointment. Critics say the reforms would compromise the independence of the judiciary, frightening off foreign investors; supporters argue it will eradicate endemic corruption and attract more investment.
At the time of writing, a single US Dollar (USD) buys 18.77 Mexican Pesos (compared to circa 17.00 just prior to the election). EUR/MXN, meanwhile, is trading at 20.29 and GBP/MXN at 24.03.
Mexican Peso to stay strong because of the economy, says Obrador
The Mexican Peso bottomed out at a one-and-a-half-year low on Wednesday as President Andres Manuel Lopez Obrador (AMLO) hit back at critics of his policies during a press conference.
“They don’t like it (the reforms) and so they are applying pressure to gauge whether there is fear in the markets,” said AMLO during his daily broadcast. “Our economy is very strong, thankfully. So how long are they going to keep stoking concerns – in the television, in the radio, in the newspaper columns of financial experts? And they know how to move the markets. But today the Peso has recovered 1% against the US Dollar because we have a strong economy and healthy public finances,” he added.
Obrador argued that Mexico’s strong economy was due precisely because of the government’s war on corruption.
He went on to say that the Peso’s fall was due to speculators not investors, and that real investors would welcome his reforms because they wanted a “real” government whilst speculators wanted a “bowlegged” government – “It is the latter who don’t want reforms to clean a corrupt judiciary,” he added.
When asked at what point the depreciation of the Peso would begin to concern him, AMLO said there was no problem with the Peso. Rather, the corrupt elites were stirring market sentiment in an attempt to blackmail the government into ditching its reforms so they could hang onto their power and privileges, he added.
Obrador then pointed at a graphic behind him showing the changes in the value of the Peso under the last six Presidents. His administration was the only one under which the Mexican Peso had risen and not fallen in value.
When asked how soon it would be before the reforms to the judiciary would be passed, AMLO said, given their importance, “September”. Mexico’s congress is expected to convene on September 1, which would give López Obrador a one-month window to push through reforms before retiring.
To the argument that there would not be a clear separation of powers in the case where judges were elected, AMLO countered, “On the contrary, there would be more separation, since the appointment of judges would not depend on a minority but the population at large.”
The Peso, in particular, bounced against the US Dollar (USD) as it was aided by USD weakness. The release of cooler-than-expected US inflation data on Wednesday in the form of the Consumer Price Index (CPI), increased the chances the US Federal Reserve (Fed) will cut interest rates in September. Lower interest rates are negative for the Dollar as they attract less foreign capital inflows.
Technical Analysis: USD/MXN almost peaks at 19.00 and rolls over
USD/MXN pulls back in the last 24 hours after peaking at 18.99. Despite falling to the 18.70s, it continues trading with a bullish bias on Thursday.
USD/MXN is in a short and intermediate term uptrend after decisively breaking above key resistance at 18.49 (October 2023 high).
USD/MXN Daily Chart
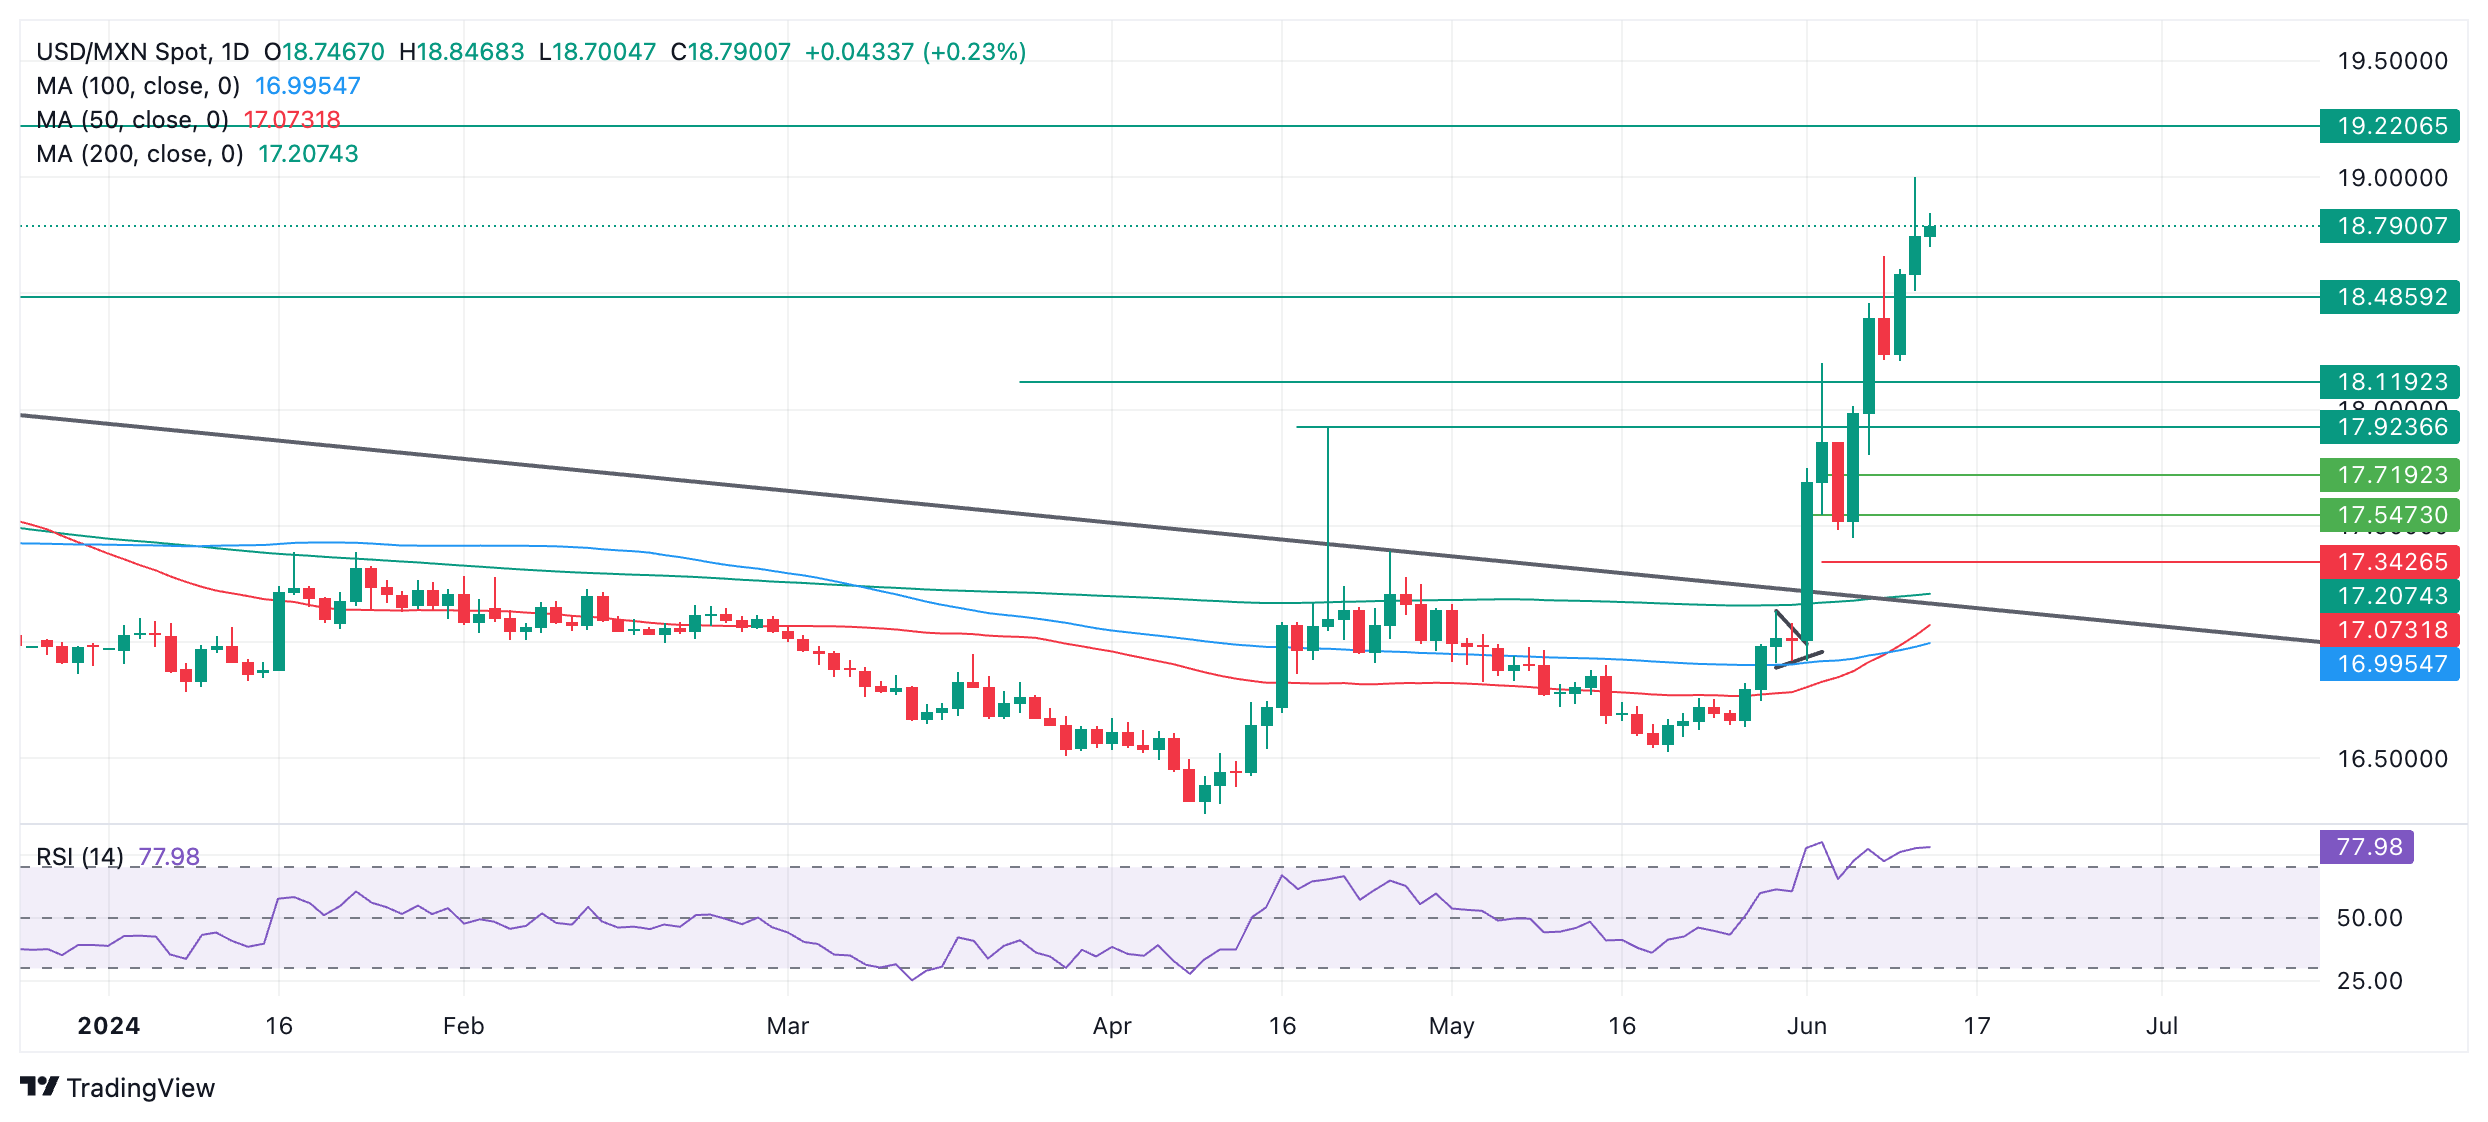
Given “the trend is your friend,” the odds favor a continuation higher in the short term, with the next target potentially situated at 19.22 (March 2023 high).
The Relative Strength Index (RSI) is in the overbought zone, however, suggesting traders should not add to their long positions. It also increases the possibility of a pullback developing, although the established uptrend is likely to eventually resume.
The direction of the long-term trend is in doubt after the break above the October 2023 high. Previous to that, it was down.
Economic Indicator
Consumer Price Index (YoY)
Inflationary or deflationary tendencies are measured by periodically summing the prices of a basket of representative goods and services and presenting the data as The Consumer Price Index (CPI). CPI data is compiled on a monthly basis and released by the US Department of Labor Statistics. The YoY reading compares the prices of goods in the reference month to the same month a year earlier.The CPI is a key indicator to measure inflation and changes in purchasing trends. Generally speaking, a high reading is seen as bullish for the US Dollar (USD), while a low reading is seen as bearish.
Read more.Last release: Wed Jun 12, 2024 12:30
Frequency: Monthly
Actual: 3.3%
Consensus: 3.4%
Previous: 3.4%
Source: US Bureau of Labor Statistics
The US Federal Reserve has a dual mandate of maintaining price stability and maximum employment. According to such mandate, inflation should be at around 2% YoY and has become the weakest pillar of the central bank’s directive ever since the world suffered a pandemic, which extends to these days. Price pressures keep rising amid supply-chain issues and bottlenecks, with the Consumer Price Index (CPI) hanging at multi-decade highs. The Fed has already taken measures to tame inflation and is expected to maintain an aggressive stance in the foreseeable future.
- USD/CAD could test the lower boundary of the rising channel, potentially rebounding to re-enter the rising channel.
- A break below the 50 level on the 14-day RSI could indicate the emergence of a bearish bias.
- The pair may find immediate support at the psychological level of 1.3700 and the 21-day EMA of 1.3697 level.
USD/CAD breaks its three-day losing streak, trading around 1.3730 during the European session on Thursday. Analysis of the daily chart suggests a weakening bullish bias for the USD/CAD pair, as it has broken below the rising channel pattern. However, the 14-day Relative Strength Index (RSI) is still positioned slightly above the 50 level. Further movement may give a clear directional indication.
Additionally, the momentum indicator Moving Average Convergence Divergence (MACD) suggests a bullish trend for the pair as the MACD line is positioned above the centerline, it shows divergence above the signal line.
The USD/CAD pair may test the lower boundary of the rising channel around the level of 1.3760, followed by the key barrier at the psychological level of 1.3800. A return to the rising channel could reinforce the bullish bias and support the pair to explore the region April’s high of 1.3846.
A break above the latter could lead the USD/CAD pair to approach the upper threshold of the rising channel around the level of 1.3870.
On the downside, the USD/CAD pair could find immediate support at the psychological level of 1.3700, aligned with the 21-day Exponential Moving Average (EMA) of 1.3697 level. A break below this level could exert pressure on the pair to navigate the region of the throwback support at 1.3590.
USD/CAD: Daily Chart
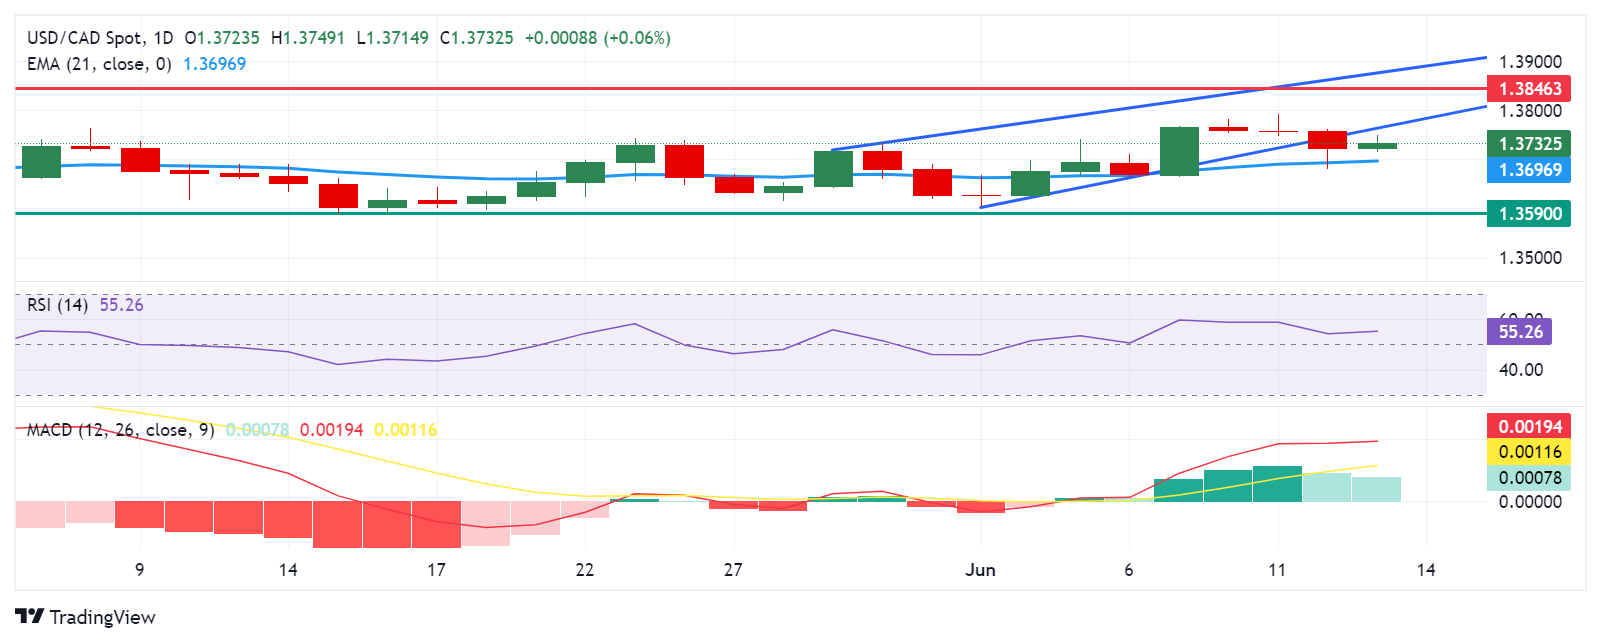
Silver prices (XAG/USD) fell on Thursday, according to FXStreet data. Silver trades at $29.33 per troy ounce, down 1.34% from the $29.73 it cost on Wednesday.
Silver prices have increased by 15.16% since the beginning of the year.
| Unit measure | Today Price |
|---|---|
| Silver price per troy ounce | $29.33 |
| Silver price per gram | $0.94 |
The Gold/Silver ratio, which shows the number of troy ounces of Silver needed to equal the value of one troy ounce of Gold, stood at 78.97 on Thursday, up from 78.21 on Wednesday.
Investors might use this ratio to determine the relative valuation of Gold and Silver. Some may consider a high ratio as an indicator that Silver is undervalued – or Gold is overvalued – and might buy Silver or sell Gold accordingly. Conversely, a low ratio might suggest that Gold is undervalued relative to Silver.
Silver FAQs
Silver is a precious metal highly traded among investors. It has been historically used as a store of value and a medium of exchange. Although less popular than Gold, traders may turn to Silver to diversify their investment portfolio, for its intrinsic value or as a potential hedge during high-inflation periods. Investors can buy physical Silver, in coins or in bars, or trade it through vehicles such as Exchange Traded Funds, which track its price on international markets.
Silver prices can move due to a wide range of factors. Geopolitical instability or fears of a deep recession can make Silver price escalate due to its safe-haven status, although to a lesser extent than Gold's. As a yieldless asset, Silver tends to rise with lower interest rates. Its moves also depend on how the US Dollar (USD) behaves as the asset is priced in dollars (XAG/USD). A strong Dollar tends to keep the price of Silver at bay, whereas a weaker Dollar is likely to propel prices up. Other factors such as investment demand, mining supply – Silver is much more abundant than Gold – and recycling rates can also affect prices.
Silver is widely used in industry, particularly in sectors such as electronics or solar energy, as it has one of the highest electric conductivity of all metals – more than Copper and Gold. A surge in demand can increase prices, while a decline tends to lower them. Dynamics in the US, Chinese and Indian economies can also contribute to price swings: for the US and particularly China, their big industrial sectors use Silver in various processes; in India, consumers’ demand for the precious metal for jewellery also plays a key role in setting prices.
Silver prices tend to follow Gold's moves. When Gold prices rise, Silver typically follows suit, as their status as safe-haven assets is similar. The Gold/Silver ratio, which shows the number of ounces of Silver needed to equal the value of one ounce of Gold, may help to determine the relative valuation between both metals. Some investors may consider a high ratio as an indicator that Silver is undervalued, or Gold is overvalued. On the contrary, a low ratio might suggest that Gold is undervalued relative to Silver.
(An automation tool was used in creating this post.)
Gold prices fell in India on Thursday, according to data compiled by FXStreet.
The price for Gold stood at 6,219.88 Indian Rupees (INR) per gram, down compared with the INR 6,244.83 it cost on Wednesday.
The price for Gold decreased to INR 72,544.30 per tola from INR 72,838.46 per tola a day earlier.
| Unit measure | Gold Price in INR |
|---|---|
| 1 Gram | 6,219.88 |
| 10 Grams | 62,196.09 |
| Tola | 72,544.30 |
| Troy Ounce | 193,457.40 |
FXStreet calculates Gold prices in India by adapting international prices (USD/INR) to the local currency and measurement units. Prices are updated daily based on the market rates taken at the time of publication. Prices are just for reference and local rates could diverge slightly.
Global Market Movers: Comex Gold price turns vulnerable as reduced Fed rate cut bets boost USD
- The initial market reaction to the softer US consumer inflation data on Wednesday faded rather quickly after the Federal Reserve said that it sees only one rate cut this year, which, in turn, is seen undermining the non-yielding Gold price.
- The US Bureau of Labor Statistics (BLS) reported that inflation, as measured by the change in the Consumer Price Index (CPI), was unchanged in May for the first time since last June, and the yearly rate edged down to 3.3% from 3.4%.
- The annual core CPI, which excludes volatile food and energy prices, was up 0.2% during the reported month and rose 3.4% on a yearly basis as compared to the 3.6% increase in April and consensus estimates for a reading of 3.5%.
- The Fed kept interest rates unchanged at the end of a two-day policy meeting and projected the benchmark rate falling to 5.1% this year, suggesting just one rate cut in 2024 as against a prior estimate of three cuts at the March meeting.
- Adding to this, the Fed lifted its forecast on the neutral rate to 2.8% from 2.6% previously, providing a modest lift to the US Dollar and contributing to driving flows away from the USD-denominated commodity.
- French President Emmanuel Macron's decision to call snap elections later this month increased political uncertainty in the Eurozone's second-biggest economy and could lend support to the safe-haven precious metal.
- Thursday's US macro data could produce short-term trading opportunities later during the early North American session ahead of the Bank of Japan (BoJ) policy decision on Friday, which could infuse volatility in the market.
Gold FAQs
Gold has played a key role in human’s history as it has been widely used as a store of value and medium of exchange. Currently, apart from its shine and usage for jewelry, the precious metal is widely seen as a safe-haven asset, meaning that it is considered a good investment during turbulent times. Gold is also widely seen as a hedge against inflation and against depreciating currencies as it doesn’t rely on any specific issuer or government.
Central banks are the biggest Gold holders. In their aim to support their currencies in turbulent times, central banks tend to diversify their reserves and buy Gold to improve the perceived strength of the economy and the currency. High Gold reserves can be a source of trust for a country’s solvency. Central banks added 1,136 tonnes of Gold worth around $70 billion to their reserves in 2022, according to data from the World Gold Council. This is the highest yearly purchase since records began. Central banks from emerging economies such as China, India and Turkey are quickly increasing their Gold reserves.
Gold has an inverse correlation with the US Dollar and US Treasuries, which are both major reserve and safe-haven assets. When the Dollar depreciates, Gold tends to rise, enabling investors and central banks to diversify their assets in turbulent times. Gold is also inversely correlated with risk assets. A rally in the stock market tends to weaken Gold price, while sell-offs in riskier markets tend to favor the precious metal.
The price can move due to a wide range of factors. Geopolitical instability or fears of a deep recession can quickly make Gold price escalate due to its safe-haven status. As a yield-less asset, Gold tends to rise with lower interest rates, while higher cost of money usually weighs down on the yellow metal. Still, most moves depend on how the US Dollar (USD) behaves as the asset is priced in dollars (XAU/USD). A strong Dollar tends to keep the price of Gold controlled, whereas a weaker Dollar is likely to push Gold prices up.
(An automation tool was used in creating this post.)
- WTI Oil price remains steady ahead of the release of US producer price figures on Thursday.
- Oil prices may weaken as higher interest rates dampen the economic growth in the United States.
- Crude Oil prices faced a challenge as US crude inventories increased by 3.7 million barrels against the 1.55 million-barrel decline.
West Texas Intermediate (WTI) Oil price remains steady with thin trading, possibly due to anticipation of upcoming producer price figures from the United States (US). WTI Oil price hovers around $78.00 per barrel during the European session on Thursday.
Oil traders have absorbed the hawkish stance maintained by the US Federal Reserve (Fed). The Federal Open Market Committee (FOMC) kept its benchmark lending rate within the range of 5.25%–5.50% for the seventh consecutive time during its June meeting on Wednesday, as widely anticipated. Higher interest rates could hinder economic growth, which in turn negatively impacts Oil demand.
Fed Chair Jerome Powell said in a press conference following the Fed's decision that the restrictive stance on monetary policy is having the expected effect on inflation. "So far this year, we have not gained greater confidence on inflation to warrant a rate cut," Powell added.
On the supply side, higher US crude Oil stockpiles put pressure on the price of the liquid Gold. Official data released by the Energy Information Administration (EIA) on Wednesday showed that US crude inventories increased by 3.7 million barrels in the week ending June 7. This contrasts with market expectations of a 1.55 million barrel decline, following the previous week's increase of 1.233 million barrels. Additionally, the EIA, in its monthly report, reduced its forecast for Oil demand growth in 2024 by 100,000 barrels per day (bpd), bringing the new estimate to 960,000 bpd.
In the Middle East, attention is focused on ceasefire talks in Gaza. Any success could alleviate concerns about potential supply disruptions from the Oil-producing region. In the latest incident affecting maritime security, Iran-allied Houthi militants claimed responsibility for small watercraft and missile attacks on Wednesday. These attacks left a Greek-owned coal carrier in need of rescue near Yemen's Red Sea port of Hodeidah, according to Reuters.
- NZD/USD loses ground as US Dollar rises due to the Fed’s hawkish hold on Wednesday.
- The rebound in the US Treasury yields support the US Dollar.
- Electronic Card Retail Sales dropped by 1.1% MoM in May as compared to April's 0.4% decrease.
NZD/USD halts its three-day winning streak, trading around 0.6170 during the early European session on Thursday. The decline of the NZD/USD pair could be attributed to the advancement of the US Dollar (USD) after the hawkish hold from the US Federal Reserve (Fed) on Wednesday. Investors await the US weekly Initial Jobless Claims and Producer Prices Index (PPI) on Thursday to gain further impetus on economic conditions in the United States (US).
The Federal Open Market Committee (FOMC) left its benchmark lending rate in a range of 5.25%–5.50% for the seventh time in a row at its June meeting on Wednesday, as widely expected. Fed Chair Jerome Powell said in a press conference following the Fed's decision that the restrictive stance on monetary policy is having the expected effect on inflation. "So far this year, we have not gained greater confidence on inflation to warrant a rate cut," Powell added.
The US Dollar Index (DXY), which measures the value of the US Dollar (USD) against six major currencies, edges higher to near 104.80, possibly supported by the rebound in the US Treasury yields. 2-year and 10-year yields on US Treasury bonds stand at 4.76% and 4.32%, respectively, at the time of writing.
In New Zealand, Electronic Card Retail Sales dropped by 1.1% month-over-month in May, a steeper decline against April's 0.4% decrease. However, on an annual basis, the decline was 1.6%, significantly less than the previous year's 3.8% drop.
The Reserve Bank of New Zealand (RBNZ) indicated that it has no plans to reduce rates in 2024, with any rate cuts unlikely until mid-2025. Despite facing economic challenges, policymakers have warned that there are still upward risks to inflation. According to a Reuters report, the bond futures market is pricing in about a 44% chance that the RBNZ could ease policy as early as October this year.
The European Central Bank (ECB) policymaker Bostjan Vasle said on Thursday, it is “possible for more rate cuts if baseline scenario holds.”
Additional quotes
Also more rate cuts next year if disinflation process continues.
But there is a risk that the process could slow down.
Wage momentum is still relatively strong.
Market reaction
As of writing, EUR/USD continues to hold steady near the 1.0800 mark, taking account of Wednesday’s US inflation data and the Fed policy decision.
- EUR/GBP trades with a bullish bias around 0.8455 in Thursday’s early European session.
- The weaker UK economic reports create a tailwind for the cross.
- The lower bets on another interest rate cut from the ECB in July cap the pair’s downside.
The EUR/GBP cross extends the recovery to 0.8455 during the early European session on Thursday. The cross bounced off the lowest level since August 2022 near 0.8418 as the stagnant UK monthly Gross Domestic Product (GDP) number and weaker Industrial Production data for April dragged the Pound Sterling (GBP) lower against the Euro (EUR).
On Wednesday, published by the Office for National Statistics (ONS) showed that the UK economy stagnated in April after growing 0.4% in March. The figure was in line with the market expectations. Meanwhile, UK Industrial Production dropped 0.9% MoM in April from a 0.2% increase in March, worse than the estimation of -0.1%.
On the Euro front, the hawkish cut from the European Central Bank (ECB) seems to underpin the shared currency as ECB President Christine Lagarde cooled down expectations for another interest rate cut in July and preferred to wait for upcoming data. Later on Thursday, the Eurozone Industrial Production for April will be published, which is expected to rise 0.2% on a monthly basis from 0.6% in March. The weaker sign of the manufacturing sector in the Eurozone might weigh on the EUR and cap the upside for the EUR/GBP cross.
Here is what you need to know on Thursday, June 13:
The US Dollar (USD) seems to have stabilized early Thursday after suffering large losses against its major rivals on soft inflation data on Wednesday. In the second half of the day, the US economic docket will feature weekly Initial Jobless Claims data and Producer Price Index figures for May.
US Dollar PRICE This week
The table below shows the percentage change of US Dollar (USD) against listed major currencies this week. US Dollar was the weakest against the New Zealand Dollar.
| USD | EUR | GBP | JPY | CAD | AUD | NZD | CHF | |
|---|---|---|---|---|---|---|---|---|
| USD | -0.02% | -0.47% | 0.25% | -0.11% | -0.94% | -1.00% | -0.22% | |
| EUR | 0.02% | -0.10% | 0.54% | 0.17% | -0.65% | -0.72% | 0.04% | |
| GBP | 0.47% | 0.10% | 0.76% | 0.28% | -0.55% | -0.62% | 0.14% | |
| JPY | -0.25% | -0.54% | -0.76% | -0.35% | -1.27% | -1.35% | -0.44% | |
| CAD | 0.11% | -0.17% | -0.28% | 0.35% | -0.80% | -0.89% | -0.12% | |
| AUD | 0.94% | 0.65% | 0.55% | 1.27% | 0.80% | -0.07% | 0.69% | |
| NZD | 1.00% | 0.72% | 0.62% | 1.35% | 0.89% | 0.07% | 0.77% | |
| CHF | 0.22% | -0.04% | -0.14% | 0.44% | 0.12% | -0.69% | -0.77% |
The heat map shows percentage changes of major currencies against each other. The base currency is picked from the left column, while the quote currency is picked from the top row. For example, if you pick the US Dollar from the left column and move along the horizontal line to the Japanese Yen, the percentage change displayed in the box will represent USD (base)/JPY (quote).
The Bureau of Labor Statistics reported on Wednesday that inflation in the US, as measured by the change in the Consumer Price Index (CPI), declined to 3.3% on a yearly basis in May from 3.4% in April. The annual core CPI, which excludes volatile food and energy prices, rose 3.4%, compared to analysts' estimate of 3.5%. On a monthly basis, the CPI was unchanged, while the core CPI was up 0.2%. The USD Index turned south and slumped below 104.50 with the immediate reaction.
Later in the day, the Federal Reserve (Fed) announced that it left the policy settings unchanged following the June meeting, as widely anticipated. The revised Summary of Economic Projections, the so called dot-plot published alongside the policy statement, showed that 4 of 19 officials saw no rate cuts in 2024, 7 projected a 25 basis points (bps) rate reduction, while 8 marked down a 50 bps cut in the policy rate.
In the post-meeting press conference, Fed Chairman Jerome Powell acknowledged the encouraging inflation data for May but said that they need to see more "good data" to bolster their confidence on inflation sustainably moving toward the 2% target. Powell further reiterated the data-dependent approach to policy and helped the USD find a foothold. Following the Fed meeting, the S&P 500 Index gained 0.85%, the Nasdaq Composite rose 1.3%, while the Dow Jones Industrial Average lost 0.1%.
EUR/USD climbed above 1.0850 on Wednesday but erased a portion of its daily gains later in the American session. The pair holds steady at around 1.0800 in the European morning on Thursday.
GBP/USD touched its highest level since early March above 1.2850 on Wednesday but struggled to preserve its bullish momentum. At the time of press, the pair was trading modestly lower on the day at around 1.2780.
USD/JPY registered small losses on Wednesday and climbed back above 157.00 in the European morning on Thursday. The Bank of Japan will announce monetary policy decisions during the Asian trading hours on Friday.
The data from Australia showed that the Unemployment Rate edged lower to 4% in May from 4.1% in April as expected. The Employment Change arrived at +39.7K, surpassing the market expectation of +30K. After rising nearly 1% on Wednesday, AUD/USD struggled to extend its rally despite the upbeat data and retreated to the 0.6650 area on Thursday.
Gold posted modest gains for the third straight trading day on Wednesday. With the benchmark 10-year US Treasury bond yield stabilizing above 4.3% following Wednesday's sharp decline, however, XAU/USD finds it difficult to attract bulls. At the time of press, the pair was down 0.5% on the day at $2,312.
Inflation FAQs
Inflation measures the rise in the price of a representative basket of goods and services. Headline inflation is usually expressed as a percentage change on a month-on-month (MoM) and year-on-year (YoY) basis. Core inflation excludes more volatile elements such as food and fuel which can fluctuate because of geopolitical and seasonal factors. Core inflation is the figure economists focus on and is the level targeted by central banks, which are mandated to keep inflation at a manageable level, usually around 2%.
The Consumer Price Index (CPI) measures the change in prices of a basket of goods and services over a period of time. It is usually expressed as a percentage change on a month-on-month (MoM) and year-on-year (YoY) basis. Core CPI is the figure targeted by central banks as it excludes volatile food and fuel inputs. When Core CPI rises above 2% it usually results in higher interest rates and vice versa when it falls below 2%. Since higher interest rates are positive for a currency, higher inflation usually results in a stronger currency. The opposite is true when inflation falls.
Although it may seem counter-intuitive, high inflation in a country pushes up the value of its currency and vice versa for lower inflation. This is because the central bank will normally raise interest rates to combat the higher inflation, which attract more global capital inflows from investors looking for a lucrative place to park their money.
Formerly, Gold was the asset investors turned to in times of high inflation because it preserved its value, and whilst investors will often still buy Gold for its safe-haven properties in times of extreme market turmoil, this is not the case most of the time. This is because when inflation is high, central banks will put up interest rates to combat it. Higher interest rates are negative for Gold because they increase the opportunity-cost of holding Gold vis-a-vis an interest-bearing asset or placing the money in a cash deposit account. On the flipside, lower inflation tends to be positive for Gold as it brings interest rates down, making the bright metal a more viable investment alternative.
- Silver price appears to be failing to maintain trade above $29.00 as the Fed sees only one rate cut this year.
- US bond yields rise despite traders holding Fed rate-cut bets for September.
- Investors await the US PPI data for further action.
Silver price (XAG/USD) struggles to gain ground above the crucial support of $29.00 in Thursday’s early European session. The white metal weakens as the Federal Reserve’s (Fed) dot plot of the June meeting has indicated that policymakers see only one rate cut this year. A few policymakers also advocated for maintaining the current interest rate framework for the entire year as they are less confident about inflation declining to the desired rate of 2%.
The appeal for precious metals remains vulnerable even though Fed Chair Jerome Powell acknowledged that there is a slower progress in the disinflation process and the Consumer Price Index (CPI) data for May was cooler than expected.
Meanwhile, the US Dollar Index (DXY) has extended its recovery to 104.80 and 10-year US Treasury yields bounce back to 4.33% albeit the CME FedWatch tool shows that traders hold their bets for the Fed to reduce interest rates in the September meeting. Higher yields on interest-bearing assets increase the opportunity cost of holding an investment in non-yielding assets such as Silver.
Going forward, investors will focus on the US Producer Price Index (PPI) data for May, which will be published at 12:30 GMT. Annual headline PPI is estimated to have accelerated to 2.5% from 2.2% in April, with core reading growing steadily by 2.4%.
Silver technical analysis
Silver price will likely deliver a breakdown of the neckline of the Head and Shoulder (H&S) chart pattern, which is marked from May 24 low at $30.00 on a four-hour timeframe. A breakdown of the above-mentioned chart pattern results in a bearish reversal.
The near-term outlook remains uncertain as 20 and 50-day Exponential Moving Averages (EMAs) near $29.50 and $29.90, respectively, are declining.
The 14-period Relative Strength Index (RSI) hovers near 40.00. A bearish momentum would trigger if it breaks below the same.
Silver four-hour chart
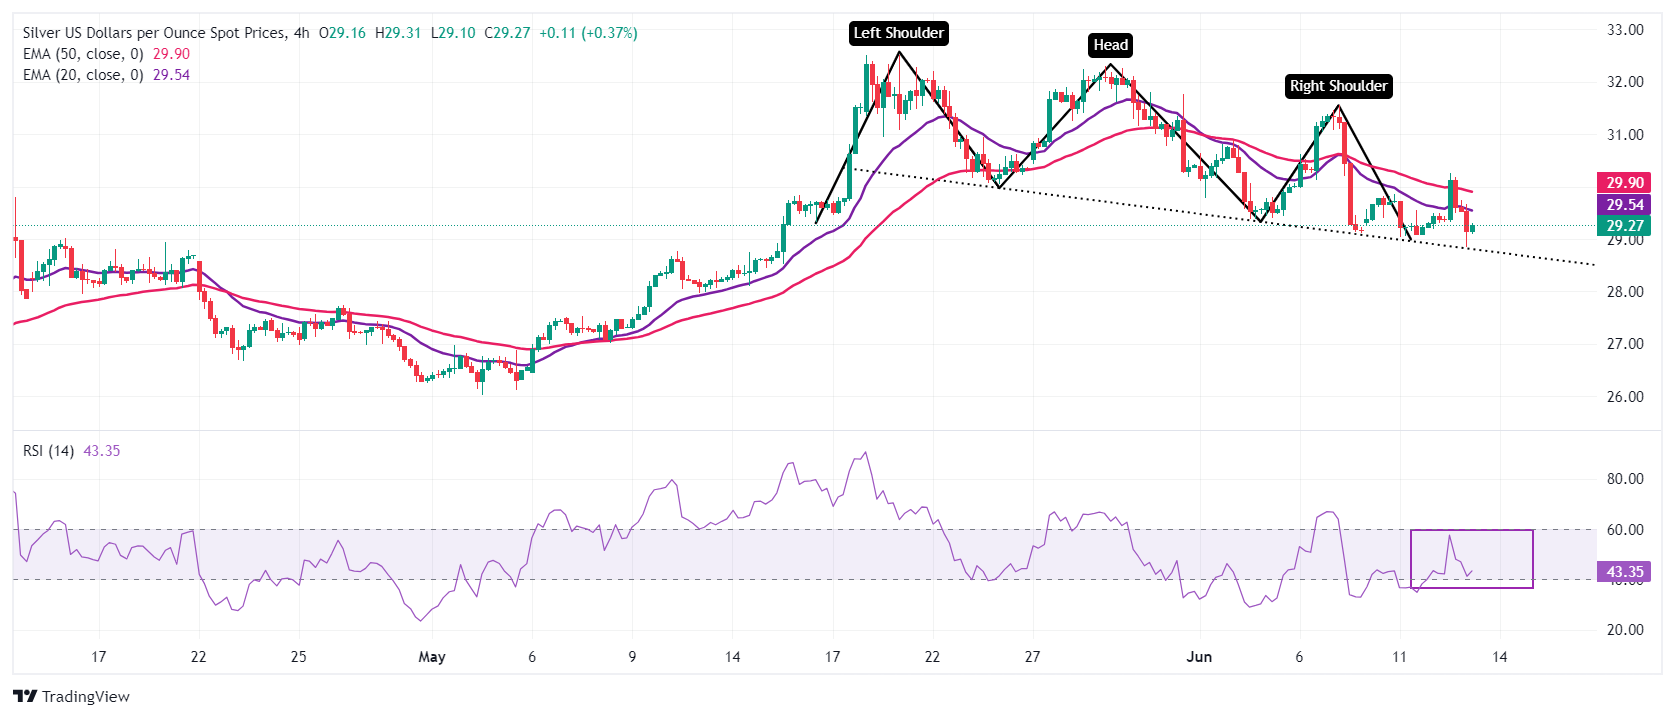
FX option expiries for June 13 NY cut at 10:00 Eastern Time, via DTCC, can be found below
- EUR/USD: EUR amounts
- 1.0685 899m
- 1.0750 1.3b
- 1.0775 1.8b
- 1.0780 2b
- 1.0800 1.2b
- 1.0810 909m
- GBP/USD: GBP amounts
- 1.2700 495m
- 1.2750 594m
- USD/JPY: USD amounts
- 156.00 1.4b
- 156.20 616m
- 156.80 703m
- 158.10 693m
- USD/CHF: USD amounts
- 0.8850 720m
- 0.8900 705m
- 0.8950 1.3b
- 0.9000 949m
- AUD/USD: AUD amounts
- 0.6630 1b
- 0.6650 1.3b
- USD/CAD: USD amounts
- 1.3670 801m
- 1.3675 949m
- 1.3700 978m
- 1.3750 1.5b
- 1.3775 726m
- 1.3800 505m
- EUR/JPY trades on a stronger note near 169.75 in Thursday’s early European session, gaining 0.22% on the day.
- The cross maintains a positive stance above the key 100-period EMA, with a bullish RSI indicator.
- The first upside barrier is seen at the 170.00 psychological mark; the initial support level is seen at 169.32.
The EUR/JPY cross gathers strength around 169.75 during the early European session on Thursday. The uncertainty that the Bank of Japan (BoJ) will announce a reduction in monthly government bond purchases amid a weaker economy continues to undermine the Japanese Yen (JPY) and create a tailwind for EUR/JPY. Market players await the Bank of Japan (BoJ) monetary policy meeting on Friday, which is widely expected to leave interest rates unchanged.
According to the 4-hour chart, EUR/JPY keeps the bullish vibe unchanged as the cross is above the key 100-period Exponential Moving Averages (EMA). The upward momentum is supported by the Relative Strength Index (RSI), which stands in bullish territory near 58.0, supporting the buyers for the time being.
A decisive break above 169.75, the upper boundary of Bollinger Band, will attract some buyers to the 170.00 psychological level. Further north, the additional upside filter to watch is 170.85, a high of June 3, en route to an all-time high of 171.60.
On the downside, the initial support level is located at 169.32, the 100-period EMA. A breach of the mentioned level could pave the way to 168.75, a low of June 12. Extended losses will see a drop to 168.40, the lower limit of Bollinger Band.
EUR/JPY 4-hour chart
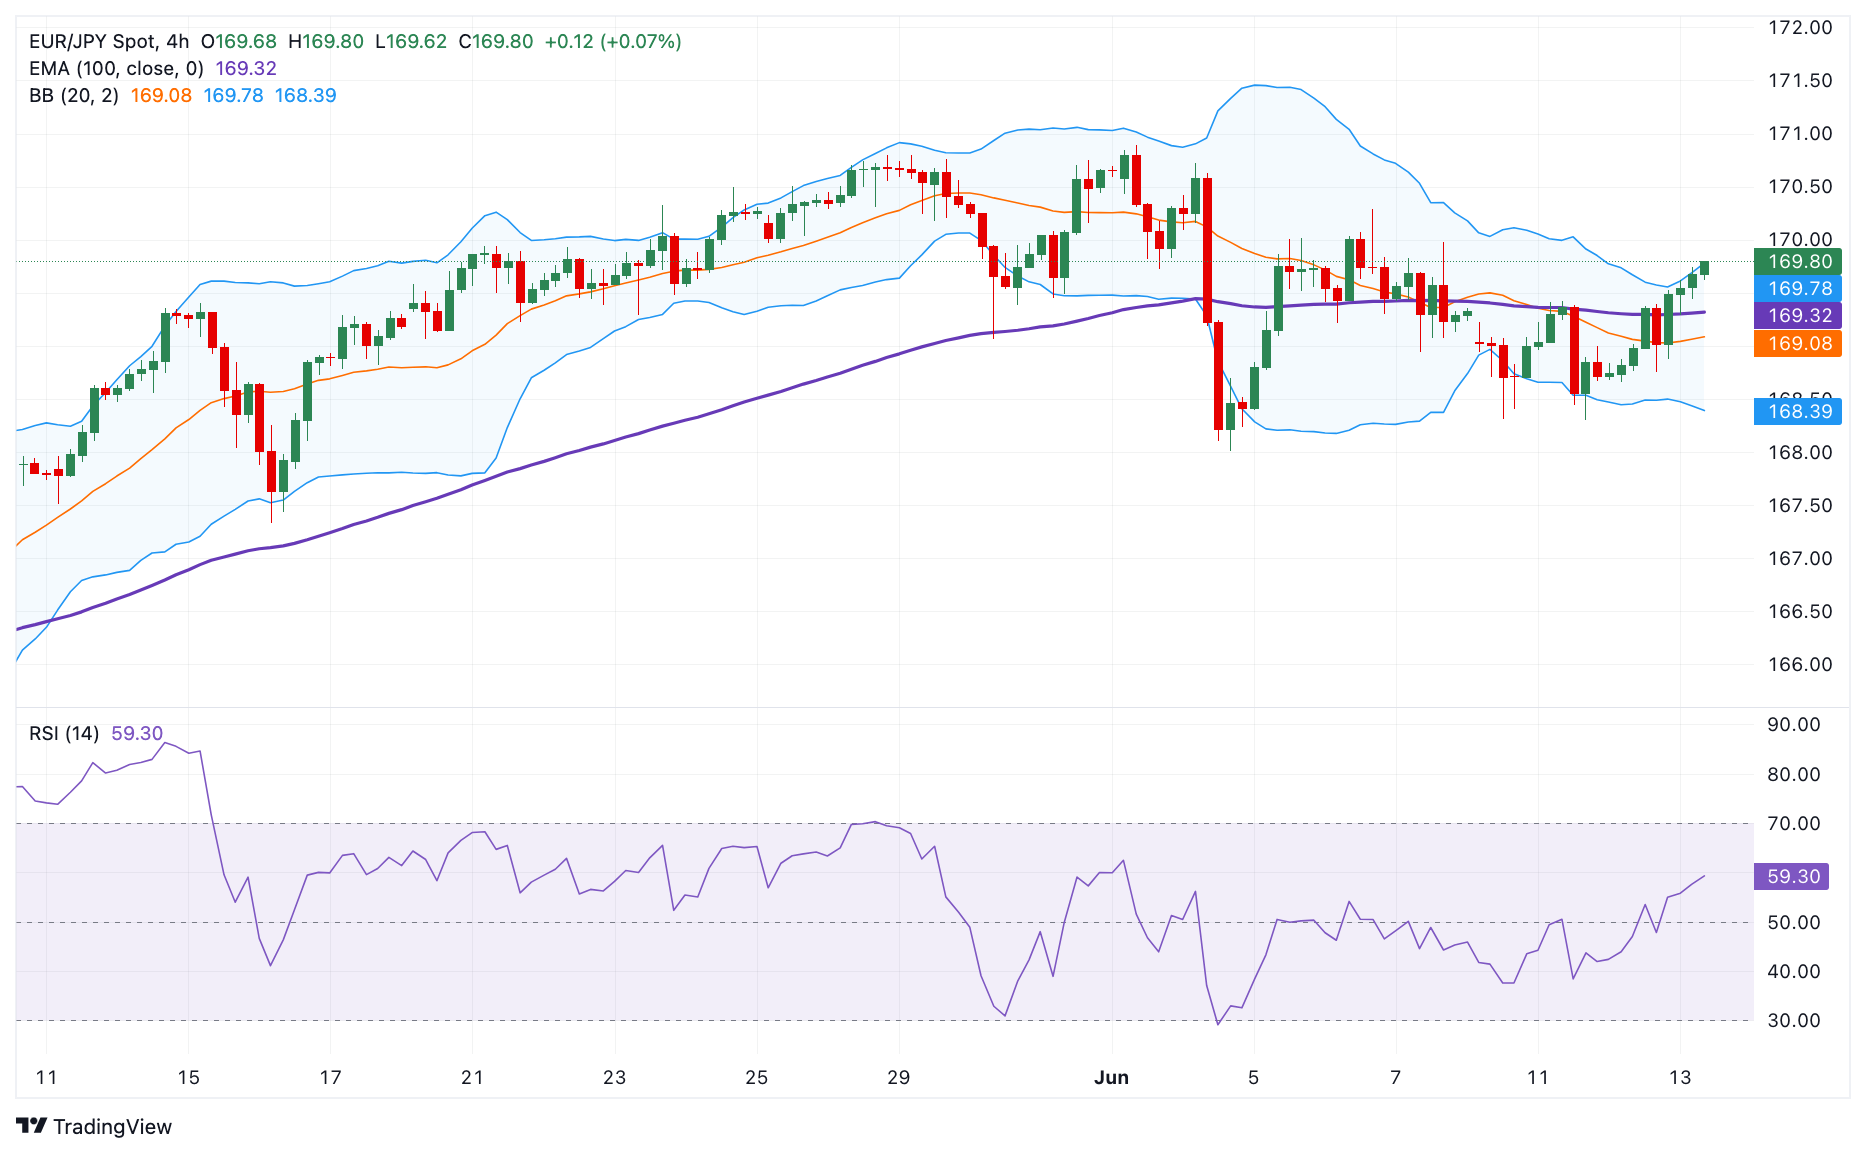
- USD/CHF gained ground as FOMC left its benchmark lending rate in the range of 5.25%–5.50% on Wednesday.
- Powell stated, “We don't see ourselves as having the confidence that would warrant policy loosening at this time.”
- Swiss Franc may see limited downside as SNB is unlikely to implement a rate cut in June.
USD/CHF retraces its losses from the previous session after the hawkish hold from the US Federal Reserve (Fed). The Federal Open Market Committee (FOMC) left its benchmark lending rate in the range of 5.25%–5.50% for the seventh consecutive time in its policy meeting on Wednesday, as widely anticipated. The pair edges higher to near 0.8950 during the Asian session on Thursday.
However, the Greenback faced challenges after the release of the softer inflation figures from the United States (US). The US Consumer Price Index (CPI) rose 3.3% year-over-year in May, slightly below both the previous reading and expectations of 3.4%. The core CPI, which excludes volatile food and energy prices, increased by 3.4% year-over-year in May, compared to a 3.6% rise in April and an estimated 3.5%.
In a press conference following the Fed's decision, Fed Chair Jerome Powell noted that the restrictive stance on monetary policy is having the expected effect on inflation. "So far this year, we have not gained greater confidence on inflation to warrant a rate cut," Powell added.
On the Swiss side, the Swiss National Bank (SNB) is unlikely to implement an interest rate cut in June, which is likely to provide support for the Swiss Franc (CHF). Previously, SNB Chairman Thomas J. Jordan warned of minor upside risks to inflation expectations.
Traders are anticipating the SNB Financial Stability Report on Thursday, which will offer an assessment of the banking sector's stability and the financial market infrastructure. Additionally, attention will be on Producer and Import Prices data.
- GBP/USD drifts lower on Thursday amid the hawkish Fed-inspired USD buying interest.
- The mixed technical setup warrants some caution before positioning for deeper losses.
- A daily close above the 1.2800 mark will set the stage for a further appreciating move.
The GBP/USD pair edges lower during the Asian session on Thursday and retreats further from over a three-month top, around the 1.2860 region touched the previous day, in reaction to softer US consumer inflation figures. Spot prices, for now, seem to have snapped a three-day winning streak and currently trade around the 1.2785 area, down 0.10% for the day.
The US Dollar (USD) builds on the overnight bounce from the weekly low in the wake of the Federal Reserve's (Fed) hawkish surprise, indicating that fewer rate cuts were needed this year. Moreover, flash figures published on Wednesday showed that the UK economic growth stalled in April after the muted rebound from last year’s recession. This, in turn, is seen undermining the British Pound (GBP) and contributing to the offered tone surrounding the GBP/USD pair.
From a technical perspective, the recent repeated failures to find acceptance above the 1.2800 mark warrant some caution for bullish traders ahead of the UK national election on July 4. That said, mixed oscillators on the daily chart make it prudent to wait for strong follow-through selling before confirming that the recent strong rally from the YTD trough touched in April has run its course and positioning for any meaningful depreciating move for the GBP/USD pair.
Meanwhile, any further decline is more likely to find some support near the 1.2755-1.2750 horizontal zone, below which spot prices could slide to the 1.2715-1.2710 intermediate support. The downfall could extend further towards the 1.2690-1.2685 region en route to the 100-day Simple Moving Average (SMA) support, currently pegged near the 1.2640-1.2635 area. A convincing break below the latter will be seen as a fresh trigger for bears and pave the way for further losses.
On the flip side, positive momentum back above the 1.2800 mark might continue to face resistance near the 1.2855-1.2860 region. A sustained strength beyond should allow the GBP/USD pair to retest the YTD peak, around the 1.2900 neighborhood touched in March, and climb further towards the 1.2950 resistance before aiming to reclaim the 1.3000 psychological mark for the first time since July 2023.
GBP/USD daily chart
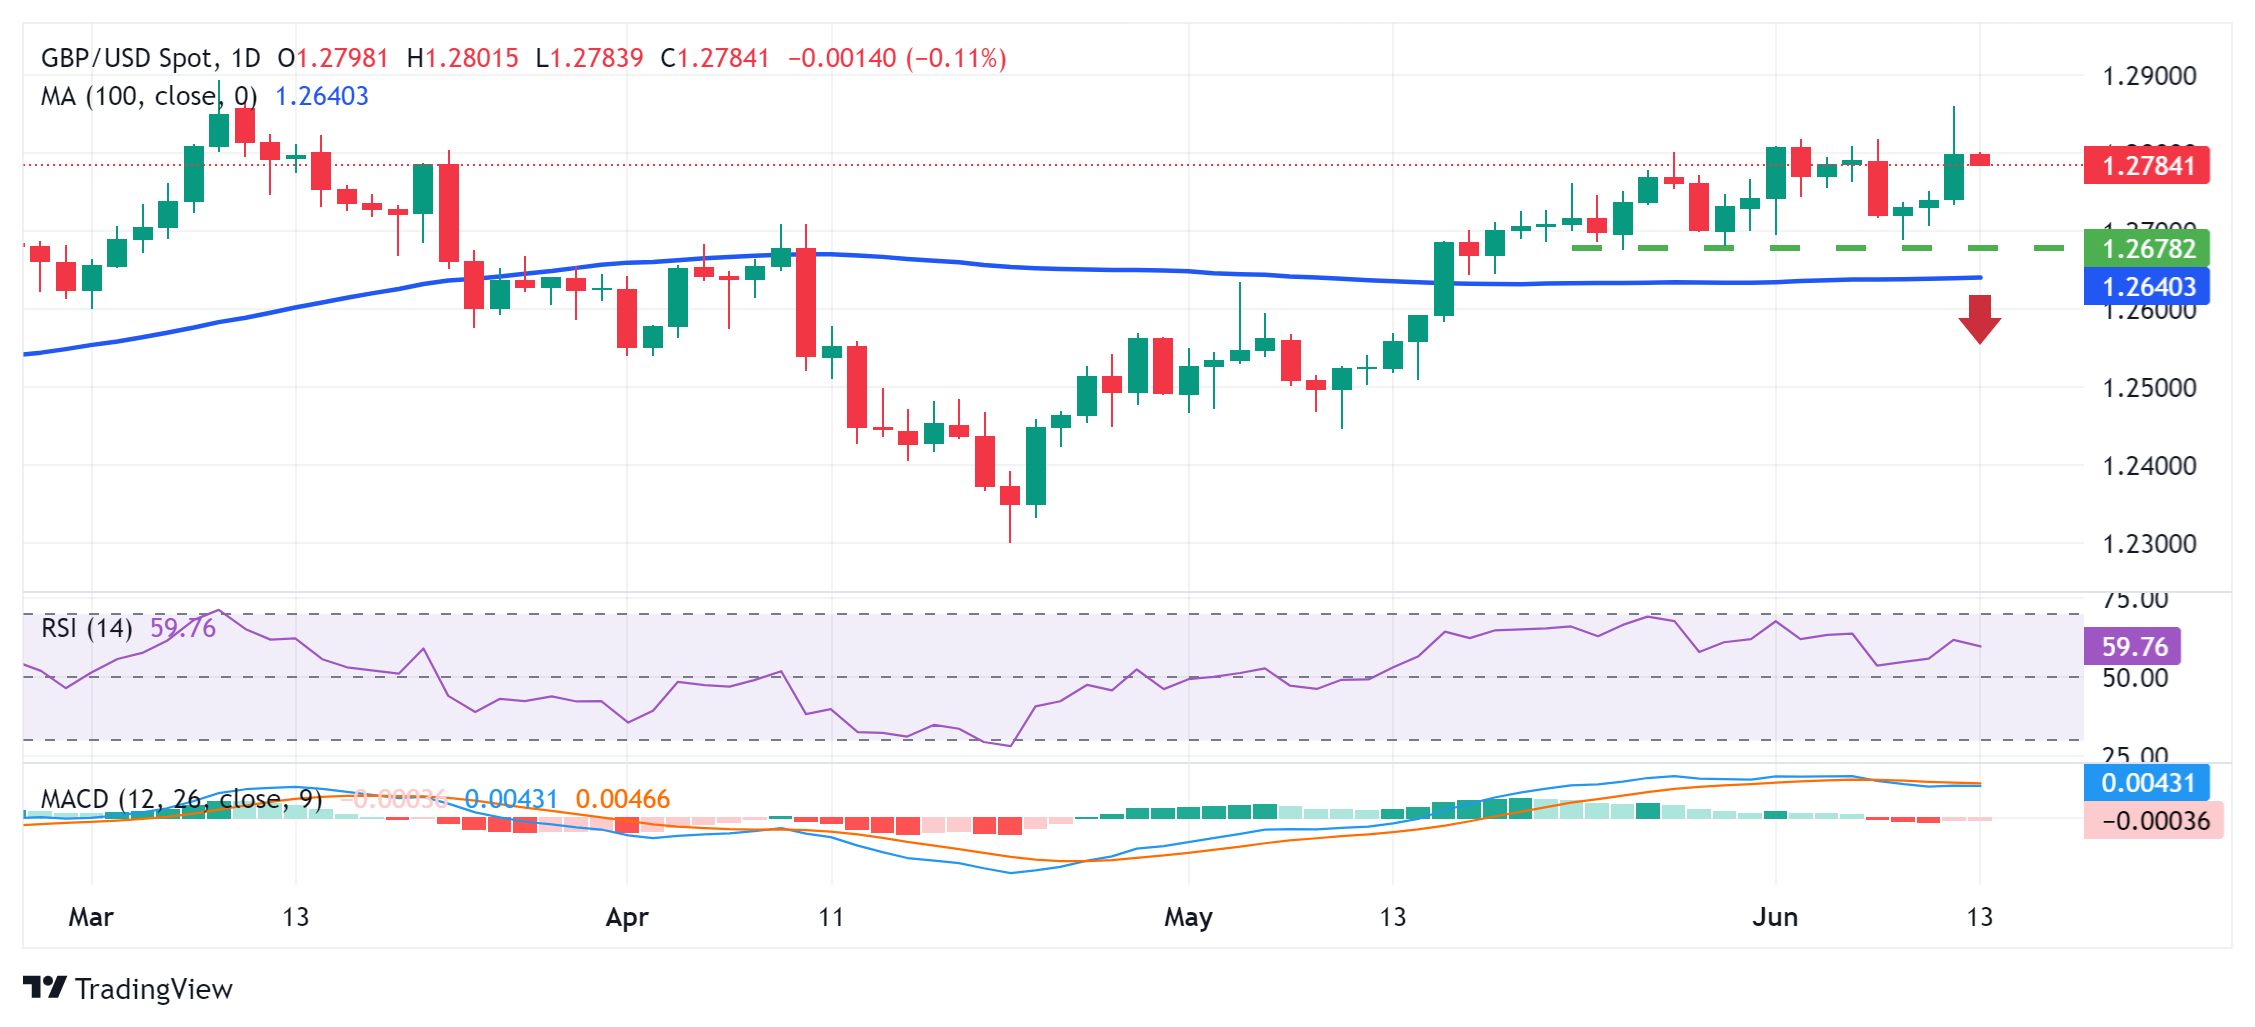
- EUR/USD remains stable as Eurozone Industrial Production is anticipated to decline on a monthly basis.
- The US Dollar advances following a hawkish hold from the Fed on Wednesday.
- Fed Chair Jerome Powell stated, “We don't see ourselves as having the confidence that would warrant policy loosening at this time.”
EUR/USD remains stable following the trimming of losses registered in the previous session. The EUR/USD pair trades around 1.0810 during the Asian hours on Thursday. Eurozone Industrial Production figures for April are scheduled for Thursday, with median market forecasts anticipating a decline to 0.2% month-over-month, down from the previous 0.6%.
Traders will likely observe the Eurogroup Meeting and several speeches from European Central Bank (ECB) policymakers on Thursday and Friday.
On the other side, the US Dollar (USD) advances following a hawkish hold from the US Federal Reserve (Fed). The Federal Open Market Committee (FOMC) left its benchmark lending rate in the range of 5.25%–5.50% for the seventh consecutive time in its policy meeting on Wednesday, as widely anticipated.
In a press conference following the Fed's decision, Fed Chair Jerome Powell noted that the restrictive stance on monetary policy is having the expected effect on inflation. "So far this year, we have not gained greater confidence on inflation to warrant a rate cut." "We will need to see more positive data to bolster confidence in inflation control. We don't see ourselves as having the confidence that would warrant policy loosening at this time," Powell added.
The US Dollar Index (DXY), which measures the value of the US Dollar (USD) against six major currencies, edges higher to near 104.80, possibly supported by the rebound in the US Treasury yields. 2-year and 10-year yields on US Treasury bonds stand at 4.76% and 4.31%, respectively, by the press time.
Investors await the US weekly Initial Jobless Claims and Producer Prices Index (PPI) on Thursday to gain further impetus on economic conditions in the United States (US).
- WTI is undermined by a surprise build in US inventories and lower demand growth forecast by IEA.
- The Fed’s hawkish surprise lifts the USD and weighs on the dollar-denominated commodity.
- The lack of strong follow-through selling warrants caution before positioning for deeper losses.
West Texas Intermediate (WTI) US crude Oil prices trade with a mild negative bias during the Asian session on Thursday, albeit lack bearish conviction and remain well within the striking distance of a nearly two-week high touched the previous day.
Official data published by the Energy Information Administration (EIA) on Wednesday showed that US Crude inventories grew by 3.7 million barrels in the first week of June. Adding to this, the International Energy Agency (EIA), in its monthly report, trimmed the outlook for Oil demand growth in 2024 by 100,000 barrels per day to 960,000 bpd. Apart from this, some follow-through US Dollar (USD) buying, bolstered by the Federal Reserve's (Fed) hawkish surprise, further seems to undermine USD-denominated commodities, including Crude Oil prices.
The Fed kept interest rates unchanged at the end of a two-day policy meeting and now see the benchmark rate falling to 5.1% this year, suggesting just one rate cut in 2024 as compared to three estimated in March. The shift in projection provides a modest lift to the US Treasury bond yields and assists the USD to build on the overnight bounce from the weekly low touched in the aftermath of softer US consumer inflation figures. That said, persistent geopolitical tensions in the Middle East might continue to lend some support to Crude Oil prices and limit losses.
Market participants now look to the US economic docket, featuring the release of the Producer Price Index (PPI) and the usual Weekly Initial Jobless Claims data later during the early North American session. This, along with the US bond yields and the broader risk sentiment, will influence the USD and provide some impetus to Oil prices. The aforementioned fundamental backdrop, meanwhile, warrants some caution before positioning for a firm near-term direction.
China’s FX regulator, the State Administration of Foreign Exchange (SAFE), said in a statement on Thursday, it “will strengthen FX situation monitoring and policy reserves.”
Additional quotes
Will severely crack down on illegal FX activities.
Will further improve management of FX reserves.
Will effectively safeguard stable operations of forex market, and the national economy, and financial stability.
Will steadily promote diversified asset allocation, ensure safety of liquidity and value preservation of FX reserve assets.
Market reaction
At the time of writing, AUD/USD is losing 0.17% on the day to trade at 0.6650.
Australian Dollar FAQs
One of the most significant factors for the Australian Dollar (AUD) is the level of interest rates set by the Reserve Bank of Australia (RBA). Because Australia is a resource-rich country another key driver is the price of its biggest export, Iron Ore. The health of the Chinese economy, its largest trading partner, is a factor, as well as inflation in Australia, its growth rate and Trade Balance. Market sentiment – whether investors are taking on more risky assets (risk-on) or seeking safe-havens (risk-off) – is also a factor, with risk-on positive for AUD.
The Reserve Bank of Australia (RBA) influences the Australian Dollar (AUD) by setting the level of interest rates that Australian banks can lend to each other. This influences the level of interest rates in the economy as a whole. The main goal of the RBA is to maintain a stable inflation rate of 2-3% by adjusting interest rates up or down. Relatively high interest rates compared to other major central banks support the AUD, and the opposite for relatively low. The RBA can also use quantitative easing and tightening to influence credit conditions, with the former AUD-negative and the latter AUD-positive.
China is Australia’s largest trading partner so the health of the Chinese economy is a major influence on the value of the Australian Dollar (AUD). When the Chinese economy is doing well it purchases more raw materials, goods and services from Australia, lifting demand for the AUD, and pushing up its value. The opposite is the case when the Chinese economy is not growing as fast as expected. Positive or negative surprises in Chinese growth data, therefore, often have a direct impact on the Australian Dollar and its pairs.
Iron Ore is Australia’s largest export, accounting for $118 billion a year according to data from 2021, with China as its primary destination. The price of Iron Ore, therefore, can be a driver of the Australian Dollar. Generally, if the price of Iron Ore rises, AUD also goes up, as aggregate demand for the currency increases. The opposite is the case if the price of Iron Ore falls. Higher Iron Ore prices also tend to result in a greater likelihood of a positive Trade Balance for Australia, which is also positive of the AUD.
The Trade Balance, which is the difference between what a country earns from its exports versus what it pays for its imports, is another factor that can influence the value of the Australian Dollar. If Australia produces highly sought after exports, then its currency will gain in value purely from the surplus demand created from foreign buyers seeking to purchase its exports versus what it spends to purchase imports. Therefore, a positive net Trade Balance strengthens the AUD, with the opposite effect if the Trade Balance is negative.
- Indian Rupee struggles to gain ground on the USD demand on Thursday.
- The hawkish hold by the Fed supported the Greenback, but the RBI intervention might limit the pair’s upside.
- The US weekly Initial Jobless Claims, Producer Prices Index (PPI), and Fed’s John Williams speech will be in focus on Thursday.
Indian Rupee (INR) weakens on Thursday amid the persistent US Dollar (USD) demand from local oil companies and other importers. The hawkish hold by the US Federal Reserve (Fed) helped the Greenback to regain some composure despite the release of softer-than-expected US May inflation data. The INR encounters a push-pull dynamic driven by multiple market factors. Nonetheless, the foreign exchange (FX) intervention from the Reserve Bank of India (RBI) might curb the Indian Rupee's decline for the time being.
Traders will watch the US weekly Initial Jobless Claims, Producer Prices Index (PPI), and Fed’s John Williams speech, which are due later on Thursday. On Friday, the preliminary US Michigan Consumer Sentiment Index for June will be released. The highlight on Friday will be India’s Wholesale Price Index (WPI) Inflation data. The hotter-than-expected consumer inflation might lift the Indian Rupee and cap the upside for the pair in the near term.
Daily Digest Market Movers: Indian Rupee edges lower amid various factors
- India's CPI inflation eased to a 12-month low of 4.75% in May, compared to 4.83% in April, which is softer than the market expectation of 4.90%.
- The US headline Consumer Price Index (CPI) inflation eased to 3.3% on a yearly basis in May from 3.4% in April, below the market consensus of 3.4%.
- The core CPI figure, which excludes volatile food and energy prices, rose 3.4%, compared to a 3.6% rise in April and the estimation of 3.5%. On a monthly basis, the core CPI increased 0.2% in May.
- The Federal Open Market Committee (FOMC) decided to keep its benchmark lending rate in a range of 5.25%–5.50% for the seventh time in a row at its June meeting on Wednesday.
- The so-called ‘dot-plot’ showed that the median of FOMC officials revised their forecast of the federal funds rate from 4.6% to 5.1% toward the end of 2024.
- Fed Chair Jerome Powell said on Wednesday during the press conference that the restrictive stance on monetary policy is affecting inflation, which the Fed had hoped to see, but the central bank will wait to see sufficient progress on inflation.
Technical analysis: USD/INR displays a bullish vibe in the longer term
The Indian Rupee trades in negative territory on the day. The constructive outlook of the USD/INR pair remains intact as the pair holds above the key 100-day Exponential Moving Average (EMA) and descending trend channel upper boundary on the daily timeframe.
USD/INR is likely to extend the consolidative mode in the near term as the 14-day Relative Strength Index (RSI) still hovers around the 50-midline, indicating the neutral momentum of the pair.
In the bullish event, the immediate upside barrier is located at 83.60, a high of June 11. Then, the pair could extend its upswing to 83.72, a high of April 17. The next hurdle will emerge at the 84.00 round mark.
A break below the crucial support at 83.35, the confluence of the 100-day EMA and descending trend channel upper boundary, could mark the start of a reversal from the uptrend. The next contention level is seen at the 83.00 psychological level, followed by 82.78, a low of January 15.
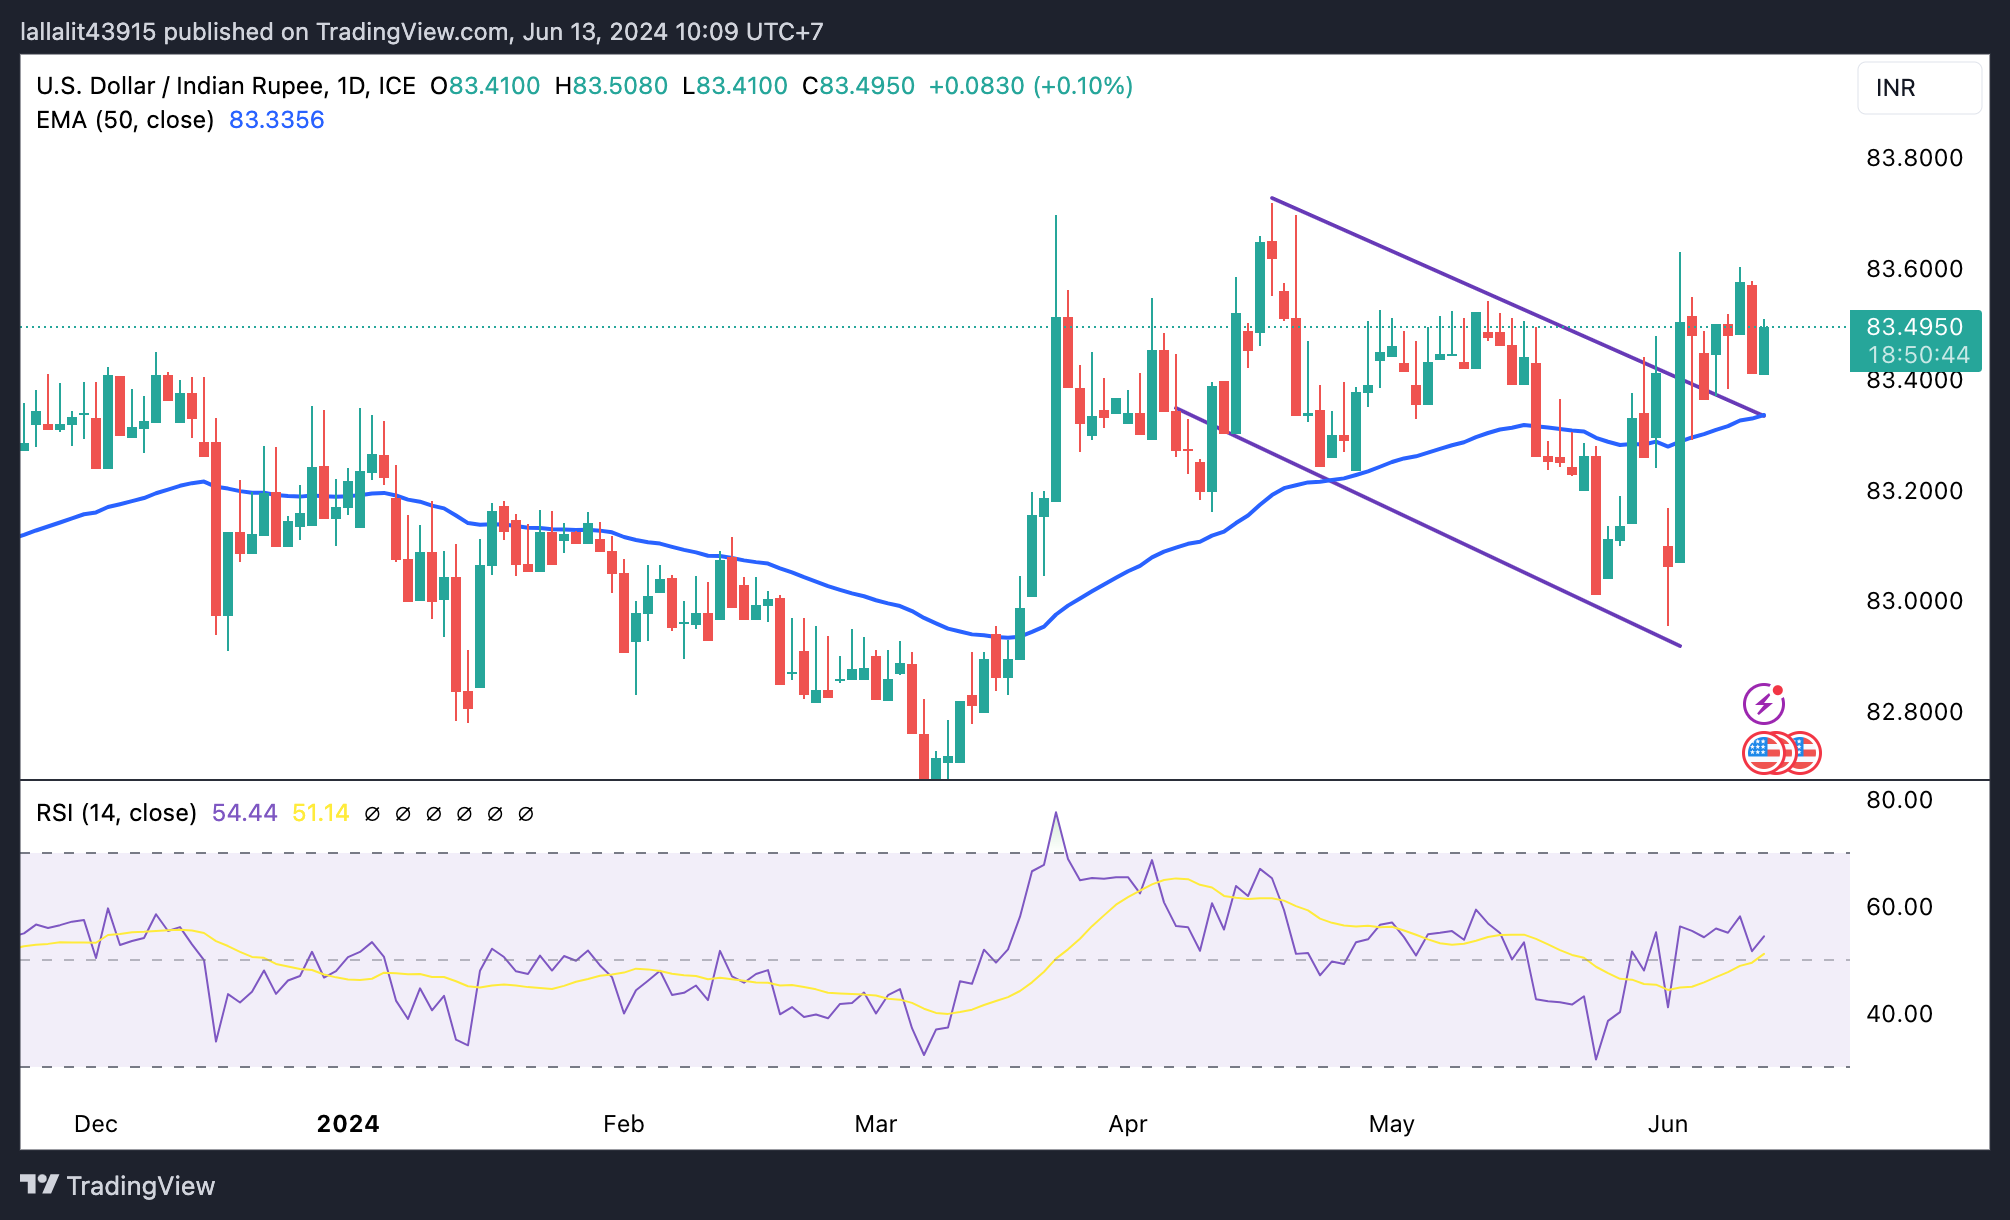
US Dollar price today
The table below shows the percentage change of US Dollar (USD) against listed major currencies today. US Dollar was the strongest against the New Zealand Dollar.
| USD | EUR | GBP | CAD | AUD | JPY | NZD | CHF | |
| USD | 0.04% | 0.04% | 0.12% | 0.14% | 0.13% | 0.17% | 0.07% | |
| EUR | -0.03% | -0.01% | 0.09% | 0.10% | 0.09% | 0.13% | 0.03% | |
| GBP | -0.05% | 0.01% | 0.09% | 0.08% | 0.07% | 0.10% | 0.01% | |
| CAD | -0.12% | -0.07% | -0.06% | -0.02% | -0.01% | 0.05% | -0.07% | |
| AUD | -0.14% | -0.08% | -0.08% | 0.00% | -0.01% | 0.04% | -0.07% | |
| JPY | -0.13% | -0.07% | -0.07% | 0.01% | 0.00% | 0.05% | -0.06% | |
| NZD | -0.17% | -0.12% | -0.13% | -0.05% | -0.04% | -0.06% | -0.12% | |
| CHF | -0.06% | 0.00% | -0.01% | 0.08% | 0.08% | 0.07% | 0.12% |
The heat map shows percentage changes of major currencies against each other. The base currency is picked from the left column, while the quote currency is picked from the top row. For example, if you pick the Euro from the left column and move along the horizontal line to the Japanese Yen, the percentage change displayed in the box will represent EUR (base)/JPY (quote).
Indian Rupee FAQs
The Indian Rupee (INR) is one of the most sensitive currencies to external factors. The price of Crude Oil (the country is highly dependent on imported Oil), the value of the US Dollar – most trade is conducted in USD – and the level of foreign investment, are all influential. Direct intervention by the Reserve Bank of India (RBI) in FX markets to keep the exchange rate stable, as well as the level of interest rates set by the RBI, are further major influencing factors on the Rupee.
The Reserve Bank of India (RBI) actively intervenes in forex markets to maintain a stable exchange rate, to help facilitate trade. In addition, the RBI tries to maintain the inflation rate at its 4% target by adjusting interest rates. Higher interest rates usually strengthen the Rupee. This is due to the role of the ‘carry trade’ in which investors borrow in countries with lower interest rates so as to place their money in countries’ offering relatively higher interest rates and profit from the difference.
Macroeconomic factors that influence the value of the Rupee include inflation, interest rates, the economic growth rate (GDP), the balance of trade, and inflows from foreign investment. A higher growth rate can lead to more overseas investment, pushing up demand for the Rupee. A less negative balance of trade will eventually lead to a stronger Rupee. Higher interest rates, especially real rates (interest rates less inflation) are also positive for the Rupee. A risk-on environment can lead to greater inflows of Foreign Direct and Indirect Investment (FDI and FII), which also benefit the Rupee.
Higher inflation, particularly, if it is comparatively higher than India’s peers, is generally negative for the currency as it reflects devaluation through oversupply. Inflation also increases the cost of exports, leading to more Rupees being sold to purchase foreign imports, which is Rupee-negative. At the same time, higher inflation usually leads to the Reserve Bank of India (RBI) raising interest rates and this can be positive for the Rupee, due to increased demand from international investors. The opposite effect is true of lower inflation.
- The Japanese Yen edges lower as the US Dollar appreciates on hawkish hold from the Fed on Wednesday.
- The downside of the Japanese Yen could be limited as caution prevails ahead of the BoJ policy decision on Friday.
- CME FedWatch Tool indicates that the likelihood of a Fed rate cut in September decreased to 61.5, down from 69.4% a week earlier.
The Japanese Yen (JPY) retraces its recent gains on Thursday as the US Dollar (USD) advances following a hawkish hold from the US Federal Reserve (Fed), boosting the USD/JPY pair. The Federal Open Market Committee (FOMC) left its benchmark lending rate in the range of 5.25%–5.50% for the seventh consecutive time in its policy meeting on Wednesday, as widely anticipated.
The Japanese Yen may see limited downside as caution prevails ahead of the Bank of Japan’s (BoJ) policy decision on Friday. While the BoJ is widely expected to leave interest rates unchanged, traders will be closely monitoring any announcements regarding a potential reduction in the central bank's monthly bond purchases.
The US Dollar Index (DXY), which measures the value of the US Dollar (USD) against six major currencies, recovers its recent losses. This recovery can be attributed to the hawkish stance of the Federal Reserve. FOMC policymakers now anticipate just one rate cut this year, down from the three that were projected in March.
The CME FedWatch Tool indicates that the likelihood of a Fed rate cut in September by at least 25 basis points has decreased to 61.5, down from 69.4% a week earlier.
Investors await the US weekly Initial Jobless Claims and Producer Prices Index (PPI) on Thursday to gain further impetus on economic conditions in the United States (US).
Daily Digest Market Movers: Japanese Yen declines as Fed adopts a hawkish stance
- In a press conference following the Fed's decision, Fed Chair Jerome Powell remarked that the restrictive stance on monetary policy is producing the expected effects on inflation.
- The US Consumer Price Index (CPI) rose 3.3% year-over-year in May, slightly below both the previous reading and expectations of 3.4%. The core CPI, which excludes volatile food and energy prices, increased by 3.4% year-over-year in May, compared to a 3.6% rise in April and an estimated 3.5%.
- Japanese Producer Price Index (PPI) data showed that producer prices jumped 2.4% year-on-year in May, exceeding market expectations of a 2.0% rise, fueling concerns that this might lead to higher consumer inflation.
- Japan Finance Minister Shunichi Suzuki said on Tuesday it is important to continue efforts to achieve economic growth and attain fiscal health to retain confidence in the country's fiscal policy, per Reuters.
- Nearly two-thirds of economists surveyed in a Reuters poll on Tuesday anticipate that the Bank of Japan will opt to commence tapering its monthly bond purchases at Friday's policy meeting. This decision marks a significant initial move aimed at gradually reducing the central bank's burgeoning balance sheet.
- Takeshi Minami, Chief Economist at Norinchukin Research Institute said, "There is no longer any reason to continue large-scale purchases of government bonds since it has been judged that a 2% rise in prices is within reach," per Reuters.
- According to Reuters, while speaking to parliament last week, Bank of Japan (BoJ) Governor Kazuo Ueda stated that inflation expectations are gradually rising but have yet to reach 2%. "We have been scrutinizing market developments since the March decision. As we proceed to exit our massive monetary stimulus, it's appropriate to reduce bond purchases," Ueda said.
Technical Analysis: USD/JPY could test the key level of 157.00
USD/JPY trades around 156.90 on Thursday. Analysis of the daily chart indicates a bullish inclination as the pair consolidates within an ascending channel pattern. Moreover, the 14-day Relative Strength Index (RSI) is above the 50 level, suggesting a tendency for upward momentum.
An immediate hurdle is noticeable at the psychological level of 157.00. A breakthrough above this level could provide support, potentially guiding the USD/JPY pair toward the vicinity of the significant level of 158.00, following the upper boundary near 158.80. Further resistance is observed at 160.32, marking its highest level in over thirty years.
On the downside, the lower boundary of the ascending channel is near the 50-day Exponential Moving Average (EMA) at 155.09. A breach below this level could intensify downward pressure on the USD/JPY pair, potentially driving it toward the throwback support area around 152.80.
USD/JPY: Daily Chart
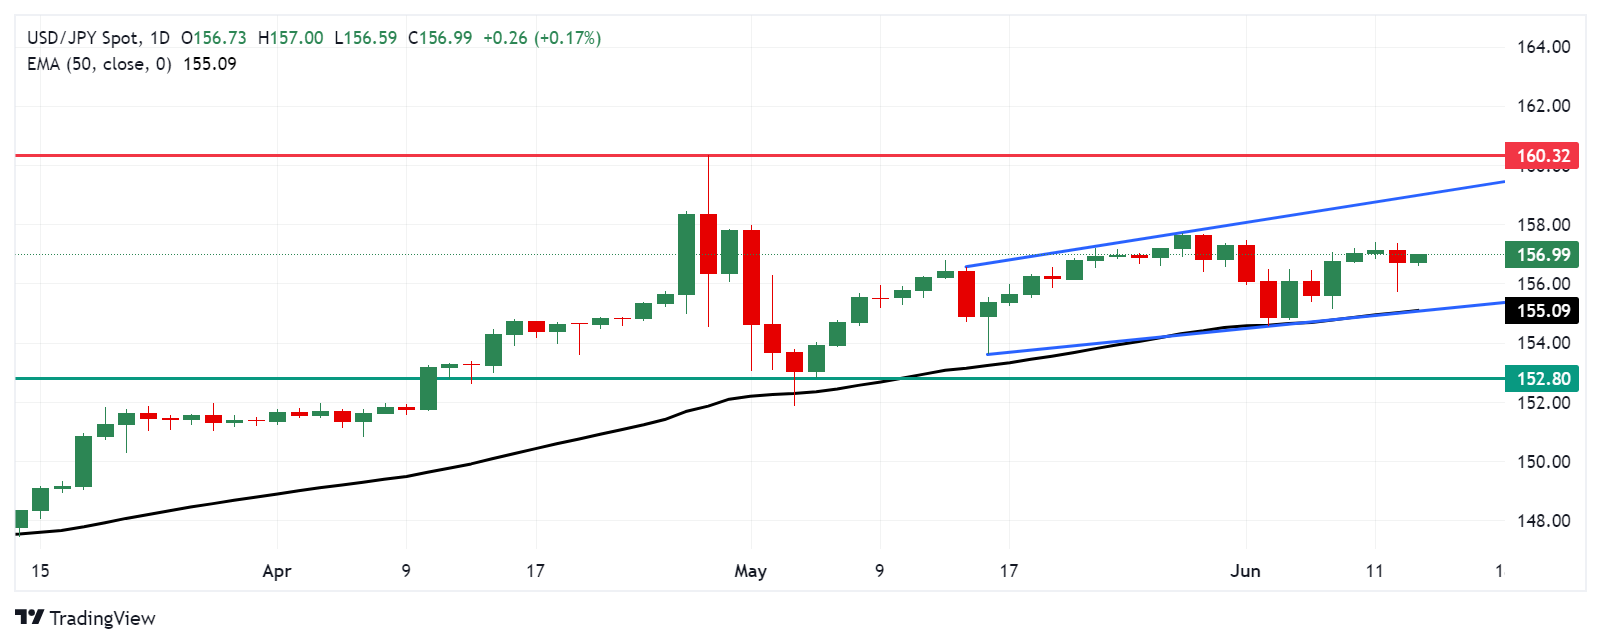
Japanese Yen price today
The table below shows the percentage change of the Japanese Yen (JPY) against listed major currencies today. Japanese Yen was the weakest against the US Dollar.
| USD | EUR | GBP | CAD | AUD | JPY | NZD | CHF | |
| USD | 0.04% | 0.06% | 0.12% | 0.18% | 0.13% | 0.22% | 0.06% | |
| EUR | -0.05% | 0.00% | 0.09% | 0.13% | 0.09% | 0.18% | 0.02% | |
| GBP | -0.07% | -0.01% | 0.07% | 0.10% | 0.05% | 0.16% | -0.01% | |
| CAD | -0.13% | -0.08% | -0.06% | 0.04% | -0.01% | 0.10% | -0.08% | |
| AUD | -0.18% | -0.13% | -0.11% | -0.05% | -0.06% | 0.05% | -0.12% | |
| JPY | -0.13% | -0.07% | -0.05% | 0.01% | 0.06% | 0.10% | -0.06% | |
| NZD | -0.22% | -0.18% | -0.16% | -0.10% | -0.06% | -0.11% | -0.18% | |
| CHF | -0.06% | 0.00% | 0.01% | 0.07% | 0.12% | 0.06% | 0.18% |
The heat map shows percentage changes of major currencies against each other. The base currency is picked from the left column, while the quote currency is picked from the top row. For example, if you pick the Euro from the left column and move along the horizontal line to the Japanese Yen, the percentage change displayed in the box will represent EUR (base)/JPY (quote).
Japanese Yen FAQs
The Japanese Yen (JPY) is one of the world’s most traded currencies. Its value is broadly determined by the performance of the Japanese economy, but more specifically by the Bank of Japan’s policy, the differential between Japanese and US bond yields, or risk sentiment among traders, among other factors.
One of the Bank of Japan’s mandates is currency control, so its moves are key for the Yen. The BoJ has directly intervened in currency markets sometimes, generally to lower the value of the Yen, although it refrains from doing it often due to political concerns of its main trading partners. The current BoJ ultra-loose monetary policy, based on massive stimulus to the economy, has caused the Yen to depreciate against its main currency peers. This process has exacerbated more recently due to an increasing policy divergence between the Bank of Japan and other main central banks, which have opted to increase interest rates sharply to fight decades-high levels of inflation.
The BoJ’s stance of sticking to ultra-loose monetary policy has led to a widening policy divergence with other central banks, particularly with the US Federal Reserve. This supports a widening of the differential between the 10-year US and Japanese bonds, which favors the US Dollar against the Japanese Yen.
The Japanese Yen is often seen as a safe-haven investment. This means that in times of market stress, investors are more likely to put their money in the Japanese currency due to its supposed reliability and stability. Turbulent times are likely to strengthen the Yen’s value against other currencies seen as more risky to invest in.
- Gold price attracts fresh sellers on Thursday and snaps a three-day winning streak.
- The Fed’s outlook of fewer rate cuts this year is seen weighing on the commodity.
- Traders now look to the US PPI and Initial Jobless Claims for short-term impetus.
Gold prices (XAU/USD) gained positive traction for the third successive day on Wednesday and touched a fresh weekly peak, around the $2,341-2,342 area in reaction to softer US consumer inflation figures. The momentum, however, ran out of steam in the vicinity of the 50-day Simple Moving Average (SMA) support-turned-resistance after the Federal Reserve's (Fed) hawkish surprise. In fact, policymakers now see just one rate cut in 2024 as compared to three projected in March, which, in turn, is seen exerting some follow-through pressure on the non-yielding yellow metal during the Asian session on Thursday.
Meanwhile, the shift in the Fed's projections, which led to a modest uptick in the US Treasury bond yields, assists the US Dollar (USD) to build on the overnight bounce from a multi-day low and further undermines the Gold price. That said, geopolitical tension in the Middle East and political uncertainty in Europe should lend some support to the XAU/USD. Nevertheless, the broader fundamental backdrop suggests that the path of least resistance for the XAU/USD is to the downside. Traders now look to Thursday's US economic docket – featuring the Producer Price Index (PPI) and Weekly Initial Jobless Claims data.
Daily Digest Market Movers: Gold price is pressured by Fed’s hawkish bias and modest USD strength
- The initial market reaction to the softer US consumer inflation data on Wednesday faded rather quickly after the Federal Reserve said that it sees only one rate cut this year, which, in turn, is seen undermining the non-yielding Gold price.
- The US Bureau of Labor Statistics (BLS) reported that inflation, as measured by the change in the Consumer Price Index (CPI), was unchanged in May for the first time since last June, and the yearly rate edged down to 3.3% from 3.4%.
- The annual core CPI, which excludes volatile food and energy prices, was up 0.2% during the reported month and rose 3.4% on a yearly basis as compared to the 3.6% increase in April and consensus estimates for a reading of 3.5%.
- The Fed kept interest rates unchanged at the end of a two-day policy meeting and projected the benchmark rate falling to 5.1% this year, suggesting just one rate cut in 2024 as against a prior estimate of three cuts at the March meeting.
- Adding to this, the Fed lifted its forecast on the neutral rate to 2.8% from 2.6% previously, providing a modest lift to the US Dollar and contributing to driving flows away from the USD-denominated commodity.
- French President Emmanuel Macron's decision to call snap elections later this month increased political uncertainty in the Eurozone's second-biggest economy and could lend support to the safe-haven precious metal.
- Thursday's US macro data could produce short-term trading opportunities later during the early North American session ahead of the Bank of Japan (BoJ) policy decision on Friday, which could infuse volatility in the market.
Technical Analysis: Gold price could accelerate the fall once the $2,285 horizontal support is broken
From a technical perspective, the overnight failure near the 50-day SMA support-turned-resistance and the subsequent slide favors bearish traders. Moreover, oscillators on the daily chart are holding in negative territory and support prospects for a further depreciating move for the Gold price. That said, any further decline is likely to find some support near the $2,300 mark ahead of the $2,285 horizontal zone. Some follow-through selling will be seen as a fresh trigger for bearish traders and make the XAU/USD vulnerable to accelerate the fall towards the next relevant support near the $2,254-2,253 region. The downward trajectory could extend further towards the $2,225-2,220 area en route to the $2,200 round figure.
On the flip side, any strength beyond the $2,325 hurdle might continue to attract fresh sellers and remain capped near the 50-day SMA support breakpoint, currently pegged near the $2,345 region. This is followed by the $2,360-2,362 supply zone, which, if cleared decisively, should allow the Gold price to retest last week’s swing high, around the $2,387-2,388 area and aim to reclaim the $2,400 mark. A sustained strength beyond the latter will negate any near-term negative bias and pave the way for some meaningful appreciating move in the near term.
Gold FAQs
Gold has played a key role in human’s history as it has been widely used as a store of value and medium of exchange. Currently, apart from its shine and usage for jewelry, the precious metal is widely seen as a safe-haven asset, meaning that it is considered a good investment during turbulent times. Gold is also widely seen as a hedge against inflation and against depreciating currencies as it doesn’t rely on any specific issuer or government.
Central banks are the biggest Gold holders. In their aim to support their currencies in turbulent times, central banks tend to diversify their reserves and buy Gold to improve the perceived strength of the economy and the currency. High Gold reserves can be a source of trust for a country’s solvency. Central banks added 1,136 tonnes of Gold worth around $70 billion to their reserves in 2022, according to data from the World Gold Council. This is the highest yearly purchase since records began. Central banks from emerging economies such as China, India and Turkey are quickly increasing their Gold reserves.
Gold has an inverse correlation with the US Dollar and US Treasuries, which are both major reserve and safe-haven assets. When the Dollar depreciates, Gold tends to rise, enabling investors and central banks to diversify their assets in turbulent times. Gold is also inversely correlated with risk assets. A rally in the stock market tends to weaken Gold price, while sell-offs in riskier markets tend to favor the precious metal.
The price can move due to a wide range of factors. Geopolitical instability or fears of a deep recession can quickly make Gold price escalate due to its safe-haven status. As a yield-less asset, Gold tends to rise with lower interest rates, while higher cost of money usually weighs down on the yellow metal. Still, most moves depend on how the US Dollar (USD) behaves as the asset is priced in dollars (XAU/USD). A strong Dollar tends to keep the price of Gold controlled, whereas a weaker Dollar is likely to push Gold prices up.
| Raw materials | Closed | Change, % |
|---|---|---|
| Silver | 29.72 | 1.51 |
| Gold | 2324.23 | 0.33 |
| Palladium | 904.47 | 1.62 |
- The Australian Dollar depreciates despite the higher-than-expected Employment Change.
- Australia’s Unemployment Rate dropped to 4.0%, from April’s 4.1% rate as expected.
- The US Dollar recovers losses as FOMC leaves its benchmark lending rate in a range of 5.25%–5.50% for the seventh time in a row.
The Australian Dollar (AUD) edges lower despite the employment data release on Thursday. Australia’s Employment Change showed that the number of employed people increased by 39.7K in May, exceeding the expected 30.0K increase and the previous 38.5K rise. Meanwhile, the Unemployment Rate came in at 4.0%, below April’s 4.1% rate as expected.
The US Dollar (USD) recovers its recent losses after the hawkish hold from the US Federal Reserve (Fed), undermining the AUD/USD pair. Investors await the US weekly Initial Jobless Claims and Producer Prices Index (PPI) on Thursday to gain further impetus on economic conditions in the United States (US).
The Federal Open Market Committee (FOMC) left its benchmark lending rate in a range of 5.25%–5.50% for the seventh time in a row at its June meeting on Wednesday, as widely expected.
Daily Digest Market Movers: Australian Dollar inches lower as Fed maintains a hawkish stance
- In a press conference post Fed decision, Fed Chair Jerome Powell noted that the restrictive stance on monetary policy is having the effect on inflation that the central bank had expected. Additionally, FOMC policymakers expect just one rate cut this year, down from three in March.
- US Consumer Price Index (CPI) rose 3.3% YoY in May, compared to the previous reading and the expectations of 3.4%. The core CPI, excluding volatile food and energy prices, increased 3.4% YoY in May, compared to a 3.6% rise in April and the estimation of 3.5%.
- On Wednesday, China’s CPI increased by 0.3% year-over-year in May, missing expectations for a 0.4% rise. Inflation decreased by 0.1% MoM versus April’s 0.1% increase.
- Australian Treasurer Jim Chalmers stated that the visit of China's Premier Li Qiang to Australia is an important opportunity. Chalmers noted underlying weaknesses in China's economy and expressed that he does not expect China's economy to recover immediately.
- Australia's NAB Business Confidence index dropped to -3 index points in May, marking the lowest figure in six months and turning negative for the first time since last November. Meanwhile, Business Conditions fell to 6 index points, slightly below the long-run average.
- On Tuesday, National Australia Bank (NAB) Chief Economist Alan Oster commented, “There are warning signs on the outlook for growth but at the same time reasons to be very wary about the inflation outlook, and they expect the RBA to keep rates on hold for some time yet as they navigate through these contrasting risks,” as per the official transcript.
- Last week, RBA Governor Michele Bullock indicated that the central bank is prepared to increase interest rates if the Consumer Price Index (CPI) does not return to the target range of 1%-3%, according to NCA NewsWire.
Technical Analysis: Australian Dollar hovers around 0.6650
The Australian Dollar trades around 0.6660 on Thursday. Analysis of the daily chart indicates a neutral bias for the AUD/USD pair as it consolidates within the horizontal channel pattern. The 14-day Relative Strength Index (RSI) is positioned slightly below the 50 level. A further movement may suggest a clear directional trend.
Immediate support region is identified around the 50-day Exponential Moving Average (EMA) at 0.6604, followed by the lower boundary of the horizontal channel around the level of 0.6585.
On the upside, the AUD/USD pair could explore the region around the upper threshold of the horizontal channel around the level of 0.6700, followed by May’s high of 0.6714.
AUD/USD: Daily Chart
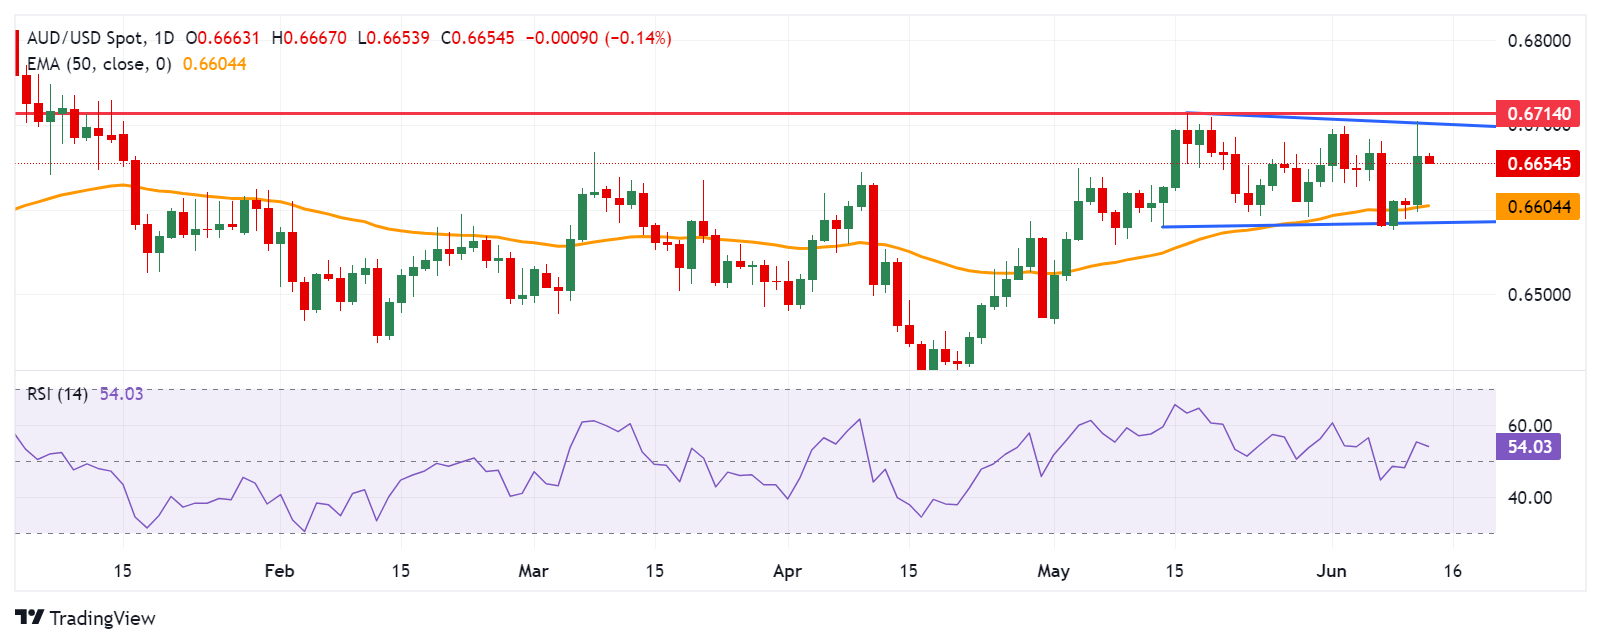
Australian Dollar price today
The table below shows the percentage change of the Australian Dollar (AUD) against listed major currencies today. The Australian Dollar was the strongest against the New Zealand Dollar.
| USD | EUR | GBP | CAD | AUD | JPY | NZD | CHF | |
| USD | 0.05% | 0.05% | 0.09% | 0.10% | 0.01% | 0.16% | 0.05% | |
| EUR | -0.05% | -0.01% | 0.05% | 0.06% | -0.04% | 0.11% | 0.01% | |
| GBP | -0.06% | 0.00% | 0.04% | 0.06% | -0.06% | 0.11% | -0.02% | |
| CAD | -0.09% | -0.04% | -0.04% | 0.02% | -0.10% | 0.07% | -0.06% | |
| AUD | -0.10% | -0.06% | -0.04% | -0.02% | -0.12% | 0.05% | -0.08% | |
| JPY | 0.00% | 0.03% | 0.06% | 0.10% | 0.07% | 0.15% | 0.05% | |
| NZD | -0.15% | -0.11% | -0.11% | -0.06% | -0.06% | -0.18% | -0.13% | |
| CHF | -0.05% | 0.02% | 0.02% | 0.06% | 0.06% | -0.04% | 0.13% |
The heat map shows percentage changes of major currencies against each other. The base currency is picked from the left column, while the quote currency is picked from the top row. For example, if you pick the Euro from the left column and move along the horizontal line to the Japanese Yen, the percentage change displayed in the box will represent EUR (base)/JPY (quote).
Australian Dollar FAQs
One of the most significant factors for the Australian Dollar (AUD) is the level of interest rates set by the Reserve Bank of Australia (RBA). Because Australia is a resource-rich country another key driver is the price of its biggest export, Iron Ore. The health of the Chinese economy, its largest trading partner, is a factor, as well as inflation in Australia, its growth rate and Trade Balance. Market sentiment – whether investors are taking on more risky assets (risk-on) or seeking safe-havens (risk-off) – is also a factor, with risk-on positive for AUD.
The Reserve Bank of Australia (RBA) influences the Australian Dollar (AUD) by setting the level of interest rates that Australian banks can lend to each other. This influences the level of interest rates in the economy as a whole. The main goal of the RBA is to maintain a stable inflation rate of 2-3% by adjusting interest rates up or down. Relatively high interest rates compared to other major central banks support the AUD, and the opposite for relatively low. The RBA can also use quantitative easing and tightening to influence credit conditions, with the former AUD-negative and the latter AUD-positive.
China is Australia’s largest trading partner so the health of the Chinese economy is a major influence on the value of the Australian Dollar (AUD). When the Chinese economy is doing well it purchases more raw materials, goods and services from Australia, lifting demand for the AUD, and pushing up its value. The opposite is the case when the Chinese economy is not growing as fast as expected. Positive or negative surprises in Chinese growth data, therefore, often have a direct impact on the Australian Dollar and its pairs.
Iron Ore is Australia’s largest export, accounting for $118 billion a year according to data from 2021, with China as its primary destination. The price of Iron Ore, therefore, can be a driver of the Australian Dollar. Generally, if the price of Iron Ore rises, AUD also goes up, as aggregate demand for the currency increases. The opposite is the case if the price of Iron Ore falls. Higher Iron Ore prices also tend to result in a greater likelihood of a positive Trade Balance for Australia, which is also positive of the AUD.
The Trade Balance, which is the difference between what a country earns from its exports versus what it pays for its imports, is another factor that can influence the value of the Australian Dollar. If Australia produces highly sought after exports, then its currency will gain in value purely from the surplus demand created from foreign buyers seeking to purchase its exports versus what it spends to purchase imports. Therefore, a positive net Trade Balance strengthens the AUD, with the opposite effect if the Trade Balance is negative.
The People’s Bank of China (PBoC) set the USD/CNY central rate for the trading session ahead on Thursday at 7.1122, as against the previous day's fix of 7.1133 and 7.2384 Reuters estimates.
- USD/CAD recovers to 1.3730 amid the firmer US Dollar in Thursday’s early Asian session.
- The FOMC held rate steady for the seventh time in a row at its June meeting on Wednesday.
- BoC’s Macklem said there is a limit to how far BoC can diverge on rates from Fed, but the’re not close to that.
The USD/CAD pair snaps the three-day losing streak near 1.3730 during the early Asian trading hours on Thursday. The renewed US Dollar (USD) demand after the hawkish hold from the US Federal Reserve (Fed) provides some support to the pair. Investors will watch the US weekly Initial Jobless Claims, Producer Prices Index (PPI), and Fed’s John Williams speech, which are due later on Thursday.
The Federal Open Market Committee (FOMC) left its benchmark lending rate in a range of 5.25%–5.50% for the seventh time in a row at its June meeting on Wednesday, as widely expected by market players. During the press conference, Fed Chair Jerome Powell noted that the restrictive stance on monetary policy is having the effect on inflation that the Fed had hoped to see, but the central bank will wait to see sufficient progress about inflation. Additionally, FOMC policymakers expect just one rate cut this year, down from three in March, according to its most recent economic predictions.
About the data, the US Consumer Price Index (CPI) rose 3.3% YoY in May, compared to the previous reading and the expectations of 3.4%. The core CPI, excluding volatile food and energy prices, increased 3.4% YoY in May, compared to a 3.6% rise in April and the estimation of 3.5%
On the Loonie front, the Bank of Canada (BoC) Governor Tiff Macklem said late Wednesday that there is a limit to how far the Canadian central bank can diverge on rates from the Federal Reserve (Fed), but they’re not close to that limit. The BoC lowered its benchmark rate by 25 basis points (bps) to 4.75% last week. The markets have priced in nearly 150 bps of additional cuts over the next couple of years. The divergence of interest rates between Canada and the US might boost the Greenback against the Canadian Dollar (USD) and support the pair in the near term.
- USD/JPY attracts some buyers on Thursday, albeit the uptick lacks follow-through.
- The Fed’s hawkish outlook overshadowed the softer US CPI and lends some support.
- Traders seem reluctant and look to the BoJ decision before placing directional bets.
The USD/JPY pair ticks higher during the Asian session on Thursday and looks to build on the overnight bounce from the 155.70 area or a multi-day low touched in reaction to softer US consumer inflation figures. Spot prices, however, lack bullish conviction and currently trade around the 156.75-156.80 region as the focus now shifts to the Bank of Japan (BoJ) policy meeting.
Heading into the key central bank event risk, the Federal Reserve's (Fed) hawkish surprise on Wednesday acts as a tailwind for the US Dollar (USD) and turns out to be a key factor lending some support to the USD/JPY pair. In fact, policymakers believed that fewer rate cuts were needed this year as inflation is expected to trend higher than previously estimated and now see just one rate cut in 2024 as compared to three projected in March.
The outlook, to a larger extent, overshadowed the softer US Consumer Price Index (CPI) print, which was unchanged in May, for the first time since last June, and edged down to 3.3% on a yearly basis from 3.4% in April. Furthermore, the US Bureau of Labor Statistics (BLS) reported that the annual core CPI, which excludes volatile food and energy prices, fell to a more than three-year low of 3.4% as compared to the 3.6% in April and 3.5% expected.
Nevertheless, the shift in the Fed's projections should underpin the USD and support prospects for a further appreciating move for the USD/JPY pair. Bulls, however, seem reluctant amid uncertainty if the BoJ will announce a reduction in the monthly government bond purchases amid a weaker economy. Hence, the focus will remain on the outcome of the highly-anticipated two-day BoJ meeting, scheduled to be announced on Friday.
In the meantime, Thursday's US economic docket – featuring the Producer Price Index (PPI) and the usual Weekly Initial Jobless Claims data – will be looked upon for short-term trading opportunities later during the early North American session. Apart from this, the broader risk sentiment, which tends to drive demand for the safe-haven Japanese Yen (JPY) might provide some impetus to the USD/JPY pair.
| Index | Change, points | Closed | Change, % |
|---|---|---|---|
| NIKKEI 225 | -258.08 | 38876.71 | -0.66 |
| Hang Seng | -238.5 | 17937.84 | -1.31 |
| KOSPI | 22.85 | 2728.17 | 0.84 |
| ASX 200 | -39.9 | 7715.5 | -0.51 |
| DAX | 135.97 | 18630.86 | 0.74 |
| CAC 40 | 75.49 | 7864.7 | 0.97 |
| Dow Jones | -35.21 | 38712.21 | -0.09 |
| S&P 500 | 45.71 | 5421.03 | 0.85 |
| NASDAQ Composite | 264.89 | 17608.44 | 1.53 |
- NZD/USD trades in positive territory for the fourth consecutive day near 0.6195 on Thursday.
- Fed held interest rates steady at its June meeting but revised its outlook to one rate cut in 2024.
- The hawkish stance of the Reserve Bank of New Zealand’s (RBNZ) continues to support the Kiwi against the USD.
The NZD/USD pair extends the rally around 0.6195 despite the weaker US Dollar (USD) on Thursday during the early Asian session. The softer-than-expected US Consumer Price Index (CPI) inflation report in May has dragged the USD Index (DXY) lower to 104.25, but the hawkish hold by the Federal Reserve (Fed) helped the DXY to regain some composure.
Inflation in the United States cooled more than expected in May, the US Bureau of Labor Statistics (BLS) showed on Wednesday. The Consumer Price Index rose 3.3% YoY in May, compared to the previous reading and expectations of 3.4%. On a monthly basis, the CPI figure held flat in May, the first time since July 2022, compared to a 0.3% gain in April.
The core CPI, which excludes volatile food and energy prices, rose 3.4% YoY in May, compared to a 3.6% rise in April and the estimation of 3.5%. On a monthly basis, the core CPI increased 0.2% MoM in May.
The softer CPI report has boosted chances for Fed cuts this year and exerted some selling pressure on the USD. Investors are now pricing in a 73% chance of a rate cut from the Fed in September, up from 53% before the CPI data was released, according to the CME FedWatch tool.
Apart from this, the Fed held interest rates steady at their current range of 5.25% to 5.5% at its June meeting on Wednesday, as widely expected by market players. Fed Chair Jerome Powell said that the restrictive stance on monetary policy is having the effect on inflation that central bankers had hoped to see, but the Fed will wait to see sufficient progress. The Greenback recovers some lost ground following the hawkish hold of the Fed.
On the other hand, China’s CPI inflation remained steady in May at 0.3% YoY, missing expectations for a 0.4% growth in the reported period. Meanwhile, China’s Producer Price Index (PPI) declined 1.4% YoY in May from the previous reading of a 2.5% drop, above the market forecast of a 1.5% decrease. However, the mixed Chinese economic data had little impact on the New Zealand Dollar (NZD), even though China is New Zealand's biggest trading partner.
The hawkish stance of the Reserve Bank of New Zealand (RBNZ) continues to underpin the Kiwi and create a tailwind for the NZD/USD pair for the time being. The New Zealand central bank is concerned about sticky domestic inflation and has an increased chance of a future hike, while the RBNZ is expected to maintain its current policy stance until at least mid-2025.
| Pare | Closed | Change, % |
|---|---|---|
| AUDUSD | 0.66629 | 0.86 |
| EURJPY | 169.279 | 0.3 |
| EURUSD | 1.08107 | 0.64 |
| GBPJPY | 200.363 | 0.1 |
| GBPUSD | 1.27986 | 0.46 |
| NZDUSD | 0.61853 | 0.68 |
| USDCAD | 1.37185 | -0.27 |
| USDCHF | 0.89422 | -0.37 |
| USDJPY | 156.585 | -0.33 |


© 2000-2026. Sva prava zaštićena.
Sajt je vlasništvo kompanije Teletrade D.J. LLC 2351 LLC 2022 (Euro House, Richmond Hill Road, Kingstown, VC0100, St. Vincent and the Grenadines).
Svi podaci koji se nalaze na sajtu ne predstavljaju osnovu za donošenje investicionih odluka, već su informativnog karaktera.
The company does not serve or provide services to customers who are residents of the US, Canada, Iran, The Democratic People's Republic of Korea, Yemen and FATF blacklisted countries.
Izvršenje trgovinskih operacija sa finansijskim instrumentima upotrebom marginalne trgovine pruža velike mogućnosti i omogućava investitorima ostvarivanje visokih prihoda. Međutim, takav vid trgovine povezan je sa potencijalno visokim nivoom rizika od gubitka sredstava. Проведение торговых операций на финанcовых рынках c маржинальными финанcовыми инcтрументами открывает широкие возможноcти, и позволяет инвеcторам, готовым пойти на риcк, получать выcокую прибыль, но при этом неcет в cебе потенциально выcокий уровень риcка получения убытков. Iz tog razloga je pre započinjanja trgovine potrebno odlučiti o izboru odgovarajuće investicione strategije, uzimajući u obzir raspoložive resurse.
Upotreba informacija: U slučaju potpunog ili delimičnog preuzimanja i daljeg korišćenja materijala koji se nalazi na sajtu, potrebno je navesti link odgovarajuće stranice na sajtu kompanije TeleTrade-a kao izvora informacija. Upotreba materijala na internetu mora biti praćena hiper linkom do web stranice teletrade.org. Automatski uvoz materijala i informacija sa stranice je zabranjen.
Ako imate bilo kakvih pitanja, obratite nam se pr@teletrade.global.
транcфери